<pubnumber>908983001</pubnumber>
<title>Environmental Management Report 1983</title>
<pages>381</pages>
<pubyear>1983</pubyear>
<provider>NEPIS</provider>
<access>online</access>
<operator>LAI</operator>
<scandate>20060514</scandate>
<origin>hardcopy</origin>
<type>single page tiff</type>
<keyword>water region viii quality colorado ground creek problems dakota river state site sites montana waste utah problem mining denver south</keyword>
<author> United States. Environmental Protection Agency. Region VIII. United States. Environmental Protection Agency. Region VIII.</author>
<publisher>U.S. Environmental Protection Agency, Region VIII,</publisher>
<subject>United States.--Environmental Protection Agency.--Region VIII; Environmental policy </subject>
<abstract></abstract>
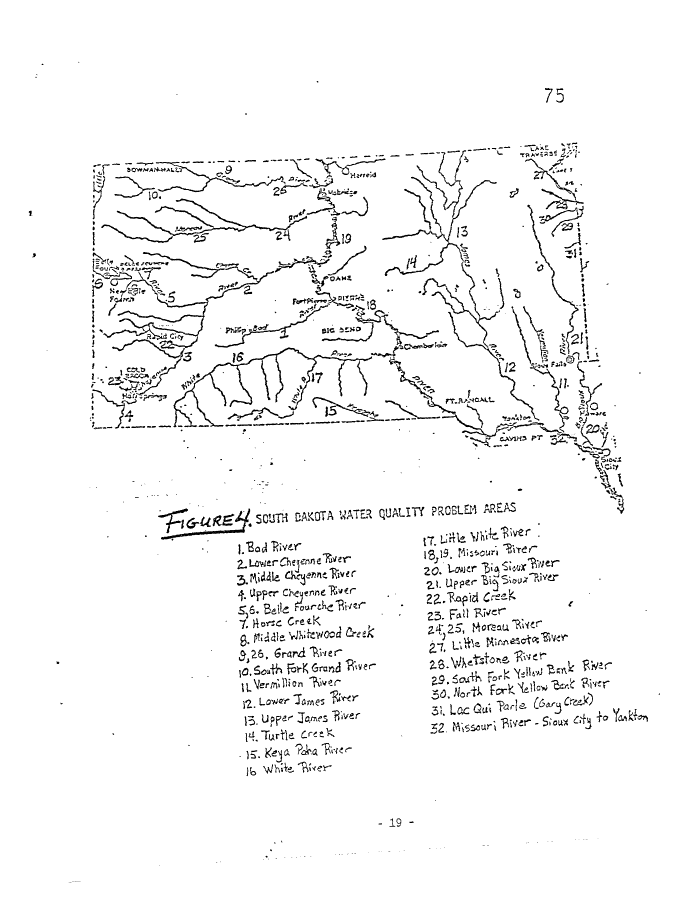
Region 8 Colorado Montana,
EPA-908/9-83-Q01 «wn IBS) Lincoln S»« Nortn Dakota, South Dakota,
' Denver, Colorado 30295 Uusn. Wyoming
Regional Administrator May, 1983 _ SPA-908; 9-83-001
ENVIRONMENTAL
1 j» *-« I * " 131 \»/ 1 ^ 1 w i 3m 1 a I J~% »»
MANAGEMENT
REPORT
1983
image:
 United Staiss
Envirtxwrwntal Protsctioo
Agancy
Region 8
I860 Lincoln Stnwi
Denvw, Cotoodo SQ295
Colorado. Montana.
Nortn Dakota. Soutn Dakota.
Utah. Wyoming
Regional Administrator
May, 1983
EPA-908/9-83-001
REPORT
1
Compiled by
Technical and Program Staff
EPA Region VIII Offices in Denver
U.S. Environmental Protection Agency
Region V, Library
230 South Dearborn Street
Chicago, HHnois 60604
U.S. Environmental Protection Agency
Region VIII
1860 Lincoln Street
Denver, CO 80295
(303) 837-2351
image:
United Staiss
Envirtxwrwntal Protsctioo
Agancy
Region 8
I860 Lincoln Stnwi
Denvw, Cotoodo SQ295
Colorado. Montana.
Nortn Dakota. Soutn Dakota.
Utah. Wyoming
Regional Administrator
May, 1983
EPA-908/9-83-001
REPORT
1
Compiled by
Technical and Program Staff
EPA Region VIII Offices in Denver
U.S. Environmental Protection Agency
Region V, Library
230 South Dearborn Street
Chicago, HHnois 60604
U.S. Environmental Protection Agency
Region VIII
1860 Lincoln Street
Denver, CO 80295
(303) 837-2351
image:
 o
I UNITED STATES ENVIRONMENTAL PROTECTION AGENCY
Aiff REGION VII!
.1860 LINCOLN STREET
^* I
DENVER, COLORADO 80295
Ref: 8PM-MSA.
MEMORANDUM
TO: Lewis S.W. Crampton, Director
Office of Management Systems Division
SUBJECT: Region VIII's Environmental Management Report
I -am pleased to enclose Region VIII's Environmental Management Report for
1983. Compiling this report was a cooperative, region-wide effort involving
many technical and progrsn staff.
A Region VIII "E?"R Workgroup" was formed of one or more staff members from
each of the eight media, and several members' of the region's data analysis
staff. To compile this report, Region VIII staff conducted an exhaustive
analysis of the available data on environmental conditions in the six Region
VIII states of Colorado, Montana, North Dakota, South Dakota, Utah, and
Wyoming. Data from nearly a score on envi rorrnental monitoring networks were
revi ewed. •
We have made an effort to assure that this report documents current
environmental conditions as a "baseline" of environmental quality i n Region .-.-
v'lll. The success of this report will be measured in the short run by how
well EPA1 s managers use the data and conclusions in this report to help'focus
abatement and prevention efforts more directly on the most significant
problems in the region. For the long term the greatest value of this report
may be that it establishes a benchmark against which future environmental
conditions can be measured.
We wish to acknowledge the considerable help and constructive suggestions
provided by technical experts.and progran staff in each of the six Region VIII
states and in the EPA Headquarters program offices. To the extent possible we
have incorporated suggested changes and corrections, and we believe that the
final Region VIII Environmental Management Report will meet the need of EPA
managers for an internal agency management tool which provides an accurate and
current status report of the region's major environmental concerns.
We also wish to acknowledge the national coordination and guidance
provided for the Environmental Management Reports by your Envri onmental
Results Branch. We especially enjoyed workijig—w4-Un Sherry Hiep^trr^and Bill
Ga^etz whose thoughtful direction produq£<T"an innovative—P££prt on
environmental conditions in each of tfte nation's te'n (fegi
of Management
"Systems and Analysis
Attachment
image:
o
I UNITED STATES ENVIRONMENTAL PROTECTION AGENCY
Aiff REGION VII!
.1860 LINCOLN STREET
^* I
DENVER, COLORADO 80295
Ref: 8PM-MSA.
MEMORANDUM
TO: Lewis S.W. Crampton, Director
Office of Management Systems Division
SUBJECT: Region VIII's Environmental Management Report
I -am pleased to enclose Region VIII's Environmental Management Report for
1983. Compiling this report was a cooperative, region-wide effort involving
many technical and progrsn staff.
A Region VIII "E?"R Workgroup" was formed of one or more staff members from
each of the eight media, and several members' of the region's data analysis
staff. To compile this report, Region VIII staff conducted an exhaustive
analysis of the available data on environmental conditions in the six Region
VIII states of Colorado, Montana, North Dakota, South Dakota, Utah, and
Wyoming. Data from nearly a score on envi rorrnental monitoring networks were
revi ewed. •
We have made an effort to assure that this report documents current
environmental conditions as a "baseline" of environmental quality i n Region .-.-
v'lll. The success of this report will be measured in the short run by how
well EPA1 s managers use the data and conclusions in this report to help'focus
abatement and prevention efforts more directly on the most significant
problems in the region. For the long term the greatest value of this report
may be that it establishes a benchmark against which future environmental
conditions can be measured.
We wish to acknowledge the considerable help and constructive suggestions
provided by technical experts.and progran staff in each of the six Region VIII
states and in the EPA Headquarters program offices. To the extent possible we
have incorporated suggested changes and corrections, and we believe that the
final Region VIII Environmental Management Report will meet the need of EPA
managers for an internal agency management tool which provides an accurate and
current status report of the region's major environmental concerns.
We also wish to acknowledge the national coordination and guidance
provided for the Environmental Management Reports by your Envri onmental
Results Branch. We especially enjoyed workijig—w4-Un Sherry Hiep^trr^and Bill
Ga^etz whose thoughtful direction produq£<T"an innovative—P££prt on
environmental conditions in each of tfte nation's te'n (fegi
of Management
"Systems and Analysis
Attachment
image:
 DISCLAIMER
This report has been reviewed by the Office of Management Systems and
Analysis, the Air and Waste Management Division, the Water Management
Division, and the Environmental Services Division at the Region VIII (Denver)
offices of the U.S. Environmental Protection Agency and approved for
publication. Mention of trade names or commercial products does not
constitute endorsement or recommendation for use.
DISTRIBUTION STATEMENT
This report may be obtained by calling or writing the Office of
Management Systems and Analysis in the EPA Region VIII office in Denver.
Telephone: (303) 837-2351. File copies of this report are also available for
public review in the Library of the Environmental Protection Agency's Region
VIII office at 1860 Lincoln Street, 1st Floor, Denver, Colorado 80295.
Telephone: (303) 837-2560.
This report is also available to the public through the National Technical
Information Service, U.S. Department of Commerce, Springfield, Virginia
22161.
INQUIRIES AND CORRECTIONS
While considerable effort has been extended to assure the accuracy of
information in this report, there may still be data or other information which
remains inaccuarate. We welcome reviews of the information presented here,
whether they be specific data points or nuances of interpretation. Comments,
questions, suggestions or corrections may be directed to Mr. Paul Riederer,
EMR Project Director, Office of Management Systems and Analysis, Environmental
Protection Agency, Region VIII Offices, 1860 Lincoln Street, Denver, Colorado
80295
image:
DISCLAIMER
This report has been reviewed by the Office of Management Systems and
Analysis, the Air and Waste Management Division, the Water Management
Division, and the Environmental Services Division at the Region VIII (Denver)
offices of the U.S. Environmental Protection Agency and approved for
publication. Mention of trade names or commercial products does not
constitute endorsement or recommendation for use.
DISTRIBUTION STATEMENT
This report may be obtained by calling or writing the Office of
Management Systems and Analysis in the EPA Region VIII office in Denver.
Telephone: (303) 837-2351. File copies of this report are also available for
public review in the Library of the Environmental Protection Agency's Region
VIII office at 1860 Lincoln Street, 1st Floor, Denver, Colorado 80295.
Telephone: (303) 837-2560.
This report is also available to the public through the National Technical
Information Service, U.S. Department of Commerce, Springfield, Virginia
22161.
INQUIRIES AND CORRECTIONS
While considerable effort has been extended to assure the accuracy of
information in this report, there may still be data or other information which
remains inaccuarate. We welcome reviews of the information presented here,
whether they be specific data points or nuances of interpretation. Comments,
questions, suggestions or corrections may be directed to Mr. Paul Riederer,
EMR Project Director, Office of Management Systems and Analysis, Environmental
Protection Agency, Region VIII Offices, 1860 Lincoln Street, Denver, Colorado
80295
image:
 PREFACE
During 1983, each of the ten Regional Offices of the U.S. Environmental
Protect! en Agency, in consultation, with State'counterparts, prepared an
Envi rormental Managanent Report based on available environmental data. This
report is one of ten reports compiled for internal EPA decision making and
management purposes. It is intended as a step toward developing a revised and
updated baseline of environmental conditions.
This report describes the general status of and trends in environmental
quality in Region VIII (Colorado, Montana, North Dakota, South Dakota, Utah
and Wyoming). The report is an intermedia assessment of the most significant
environmental problems in the region. It identifies current and emerging
problems requiring abatement or prevention. It also identifies the causes
associated with these problems, where known, and the barriers to solving the
problems. The implications of this information for regional and national
environmental protection strategies over the short and long term are
addressed. The report indicates actions the Region has completed and planned
to address the environmental problems cited. The report also describes the
assistance required by States and the Region from EPA, Headquarters and other
sources to deal effectively with these problems.
m
image:
PREFACE
During 1983, each of the ten Regional Offices of the U.S. Environmental
Protect! en Agency, in consultation, with State'counterparts, prepared an
Envi rormental Managanent Report based on available environmental data. This
report is one of ten reports compiled for internal EPA decision making and
management purposes. It is intended as a step toward developing a revised and
updated baseline of environmental conditions.
This report describes the general status of and trends in environmental
quality in Region VIII (Colorado, Montana, North Dakota, South Dakota, Utah
and Wyoming). The report is an intermedia assessment of the most significant
environmental problems in the region. It identifies current and emerging
problems requiring abatement or prevention. It also identifies the causes
associated with these problems, where known, and the barriers to solving the
problems. The implications of this information for regional and national
environmental protection strategies over the short and long term are
addressed. The report indicates actions the Region has completed and planned
to address the environmental problems cited. The report also describes the
assistance required by States and the Region from EPA, Headquarters and other
sources to deal effectively with these problems.
m
image:
 ABSTRACT
This report documents current environmental conditions as a "baseline" of
environmental quality in Region VIII. The report was compiled by Staff at the
Environmental Protection Agency's Denver office to help target abatement and
prevention efforts more directly on the most significant pollution problems in
the region, and to establish a benchmark against which future environmental
conditions can be measured.
To compile this report, Region VIII staff conducted an exhaustive analysis
of the available data on environmental conditions in the six Region VIII
states of Colorado, Montana, North Dakota, South Dakota, Utah, and Wyoming.
The staff reviewed data from nearly a score of environmental monitoring
networks.
Criteria were agreed upon nationally for defining "significant"
environmental problems in each of eight media: air, surface water, ground
water, drinking water, hazardous wastes, toxics, and pesticides.
Computer-enhanced analysis of pollutant parameters was used to break down a
vast array of data, apply the problem selection criteria, and identify the
most significant problems in a location-by-location geographical analysis.
After Region VIII staff refined and applied the criteria, reviewed
the data, and reached preliminary conclusions, they compiled a comprehensive
list of the Region's significant pollution problems, medium-by-medium,
state-by-state, and site-by-site. The causes of the region's pollution
problems were identified, where possible, and barriers to solving the problems
were listed. Program staff and media leads identified actions the regional
office or state pollution control agencies have taken or planned to address
the pollution problems cited. They also identified what assistance the States
and the Region require from EPA Headquarters offices to deal effectively with
regional pollution problems.
This report analyzes data covering a period from approximately 1977 and
prior up through 1982. It was completed in May, 1983.
image:
ABSTRACT
This report documents current environmental conditions as a "baseline" of
environmental quality in Region VIII. The report was compiled by Staff at the
Environmental Protection Agency's Denver office to help target abatement and
prevention efforts more directly on the most significant pollution problems in
the region, and to establish a benchmark against which future environmental
conditions can be measured.
To compile this report, Region VIII staff conducted an exhaustive analysis
of the available data on environmental conditions in the six Region VIII
states of Colorado, Montana, North Dakota, South Dakota, Utah, and Wyoming.
The staff reviewed data from nearly a score of environmental monitoring
networks.
Criteria were agreed upon nationally for defining "significant"
environmental problems in each of eight media: air, surface water, ground
water, drinking water, hazardous wastes, toxics, and pesticides.
Computer-enhanced analysis of pollutant parameters was used to break down a
vast array of data, apply the problem selection criteria, and identify the
most significant problems in a location-by-location geographical analysis.
After Region VIII staff refined and applied the criteria, reviewed
the data, and reached preliminary conclusions, they compiled a comprehensive
list of the Region's significant pollution problems, medium-by-medium,
state-by-state, and site-by-site. The causes of the region's pollution
problems were identified, where possible, and barriers to solving the problems
were listed. Program staff and media leads identified actions the regional
office or state pollution control agencies have taken or planned to address
the pollution problems cited. They also identified what assistance the States
and the Region require from EPA Headquarters offices to deal effectively with
regional pollution problems.
This report analyzes data covering a period from approximately 1977 and
prior up through 1982. It was completed in May, 1983.
image:
 TABLE CF CONTENTS
REGION VIII ENVIRCNIENfAL MANftGEfENT REPORT
May, 1983
P ref ace i i i
Abstr act i v
Tab! e of Contents v
Acknowledgements xix
I ntroductl on 1
Executive Summary 3
Major Sections of the Report
I Air Quality 21
II Water Quality... 57
III Drinking Water Quality 166
IV Ground Water Quality 189
V Hazardous Wastes-Inacti ve Sites 248
(Superf und)
VI Hazardous Wastes-Active Sites 282
(RCRA)
VII Rcriiaticn 302
VIII Toxics and Pesticides 335
Environmental Protection Agency
Region VIII
1850 Lincoln Street
Denver, CO 80295
(303) 837-2351
image:
TABLE CF CONTENTS
REGION VIII ENVIRCNIENfAL MANftGEfENT REPORT
May, 1983
P ref ace i i i
Abstr act i v
Tab! e of Contents v
Acknowledgements xix
I ntroductl on 1
Executive Summary 3
Major Sections of the Report
I Air Quality 21
II Water Quality... 57
III Drinking Water Quality 166
IV Ground Water Quality 189
V Hazardous Wastes-Inacti ve Sites 248
(Superf und)
VI Hazardous Wastes-Active Sites 282
(RCRA)
VII Rcriiaticn 302
VIII Toxics and Pesticides 335
Environmental Protection Agency
Region VIII
1850 Lincoln Street
Denver, CO 80295
(303) 837-2351
image:
 INTRODUCTION AND EXECUTIVE SUMffiRY
Page Nunber
Introduction 1
Executive Suircnary
I. Air quality 3
II. Surface Water Quality 6
III. Drinking Water Quality 8
IV. Ground Water Quality 11
V. Hazardous Wastes - Inactive Sites 13
VI. Hazardous Wastes - Active Sites 16
VII. Radiation 18
VIII. Toxics and Pesticides 20
image:
INTRODUCTION AND EXECUTIVE SUMffiRY
Page Nunber
Introduction 1
Executive Suircnary
I. Air quality 3
II. Surface Water Quality 6
III. Drinking Water Quality 8
IV. Ground Water Quality 11
V. Hazardous Wastes - Inactive Sites 13
VI. Hazardous Wastes - Active Sites 16
VII. Radiation 18
VIII. Toxics and Pesticides 20
image:
 I.
Air Quality Secti on
Environmental Management Report
Page Number
PART I. Overview of Status and Trends
A. Overview of Status and Trends 23
8. Colorado
C. Montana
D. North Dakota
E. South Dakota
F. Utah
G. Wyom i ng
PART II. Discussion of Significant Air Problems and
Implications for Agency Management
A. Air Quality Problgns and Management Implications
1. Carbon Monoxide 26
2. Total Suspended Parti oil ates
3. Ozone
4. Lead
5. Acid Deposition
B. Ranking of Region VIII's Air Quality Problems 29
C. List of Emerging Problems in Region VIII 30
1. Acid Deposition
2. Emissions from Diesel Vehicles
3. Organic Compound Emissions from Wood Stoves
and Fireplaces
4. Indoor Air Pollution
5. Availability of Complex Terrain and Long Range
Transport and Diffusion Models
6. Cadmium and Arsenic Levels in East Helena, Montana
7. Potential Air Quality Problems on Indian
Reservations Within Region VIII
PART III Air Quality Overview 32
A. Colorado
T. Denver 32
2. Fort Collins and Greeley
3. Colorado Springs
4. Grand Junction
5. Pueblo
6. Western Colorado
vii
image:
I.
Air Quality Secti on
Environmental Management Report
Page Number
PART I. Overview of Status and Trends
A. Overview of Status and Trends 23
8. Colorado
C. Montana
D. North Dakota
E. South Dakota
F. Utah
G. Wyom i ng
PART II. Discussion of Significant Air Problems and
Implications for Agency Management
A. Air Quality Problgns and Management Implications
1. Carbon Monoxide 26
2. Total Suspended Parti oil ates
3. Ozone
4. Lead
5. Acid Deposition
B. Ranking of Region VIII's Air Quality Problems 29
C. List of Emerging Problems in Region VIII 30
1. Acid Deposition
2. Emissions from Diesel Vehicles
3. Organic Compound Emissions from Wood Stoves
and Fireplaces
4. Indoor Air Pollution
5. Availability of Complex Terrain and Long Range
Transport and Diffusion Models
6. Cadmium and Arsenic Levels in East Helena, Montana
7. Potential Air Quality Problems on Indian
Reservations Within Region VIII
PART III Air Quality Overview 32
A. Colorado
T. Denver 32
2. Fort Collins and Greeley
3. Colorado Springs
4. Grand Junction
5. Pueblo
6. Western Colorado
vii
image:
 Air Quality Section
(continued)
PART III Air Quality Overview (continued)
B. Montana
c.
D.
E.
F.
PART IV
A.
B.
C.
0.
E.
F.
G.
H.
I.
J.
K.
L.
M.
N.
1. Billings
2. Butte
3. Col strip
4. Columbia Falls
5. East Helena
6. Great Falls
7. Laurel
8. Missoula
North Dakota
South Dakota
Utah
T. Salt Lake County
2. Davis County
3. Tooele County
4. Utah County
5. Weber County
6. Iron County
7. Uinta County
Wyoming
1. Sweetwater County
2. Riley Ridge Project
FIGURES AND TABLES
Figure 1 Number of Days that Primary Standard or Alert
Level was Exceeded in 1981 - CO, 03
Figure 2 Number of Days that Primary Standard or Alert
Level was Exceeded in 1981 - TSP, SC£
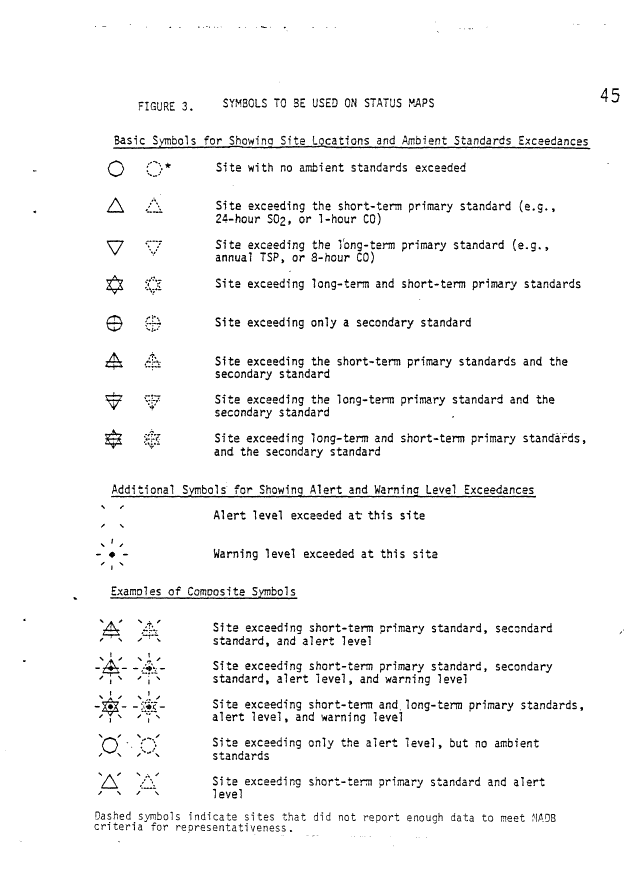
Figure 3 Symbols Used on Status Maps
Figure 4 Alerts and Standards Map for TSP - 1981
Figure 5 Alerts and Standards Map for CO - 1981
Figure 6 Alerts and Standards Map for S02 - 1981
Figure 7 Alerts and Standards Map for 03 - 1981
Figure 8 Alerts and Standards Map for N02 - 1981
Figure 9 Alerts and Standards Map for PB - 1981
Figure 10 Denver Metro Air Quality Men i tori ng Sites
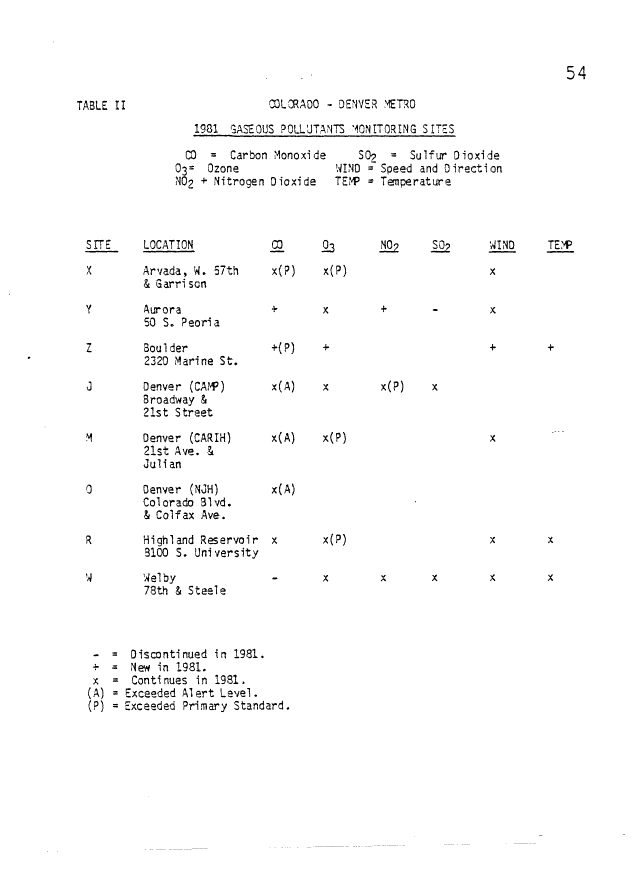
Table I Denver Metro Particulate Pollutants Monitoring
Sites
Table II Denver Metro Gaseous Pollutants Monitoring
Sites
Figure 11 Utah Air Monitoring Network -
Wasatch Front Stations
Table III Utah Wasatch Front Air Monitoring Stations
Page Nitnber
35
37
38
38
41
43
44
45
46
47
48
49
50
51
52
53
54
55
56
vi i i
image:
Air Quality Section
(continued)
PART III Air Quality Overview (continued)
B. Montana
c.
D.
E.
F.
PART IV
A.
B.
C.
0.
E.
F.
G.
H.
I.
J.
K.
L.
M.
N.
1. Billings
2. Butte
3. Col strip
4. Columbia Falls
5. East Helena
6. Great Falls
7. Laurel
8. Missoula
North Dakota
South Dakota
Utah
T. Salt Lake County
2. Davis County
3. Tooele County
4. Utah County
5. Weber County
6. Iron County
7. Uinta County
Wyoming
1. Sweetwater County
2. Riley Ridge Project
FIGURES AND TABLES
Figure 1 Number of Days that Primary Standard or Alert
Level was Exceeded in 1981 - CO, 03
Figure 2 Number of Days that Primary Standard or Alert
Level was Exceeded in 1981 - TSP, SC£
Figure 3 Symbols Used on Status Maps
Figure 4 Alerts and Standards Map for TSP - 1981
Figure 5 Alerts and Standards Map for CO - 1981
Figure 6 Alerts and Standards Map for S02 - 1981
Figure 7 Alerts and Standards Map for 03 - 1981
Figure 8 Alerts and Standards Map for N02 - 1981
Figure 9 Alerts and Standards Map for PB - 1981
Figure 10 Denver Metro Air Quality Men i tori ng Sites
Table I Denver Metro Particulate Pollutants Monitoring
Sites
Table II Denver Metro Gaseous Pollutants Monitoring
Sites
Figure 11 Utah Air Monitoring Network -
Wasatch Front Stations
Table III Utah Wasatch Front Air Monitoring Stations
Page Nitnber
35
37
38
38
41
43
44
45
46
47
48
49
50
51
52
53
54
55
56
vi i i
image:
 II.
Water Quality
Environmental Management Report
Page Number
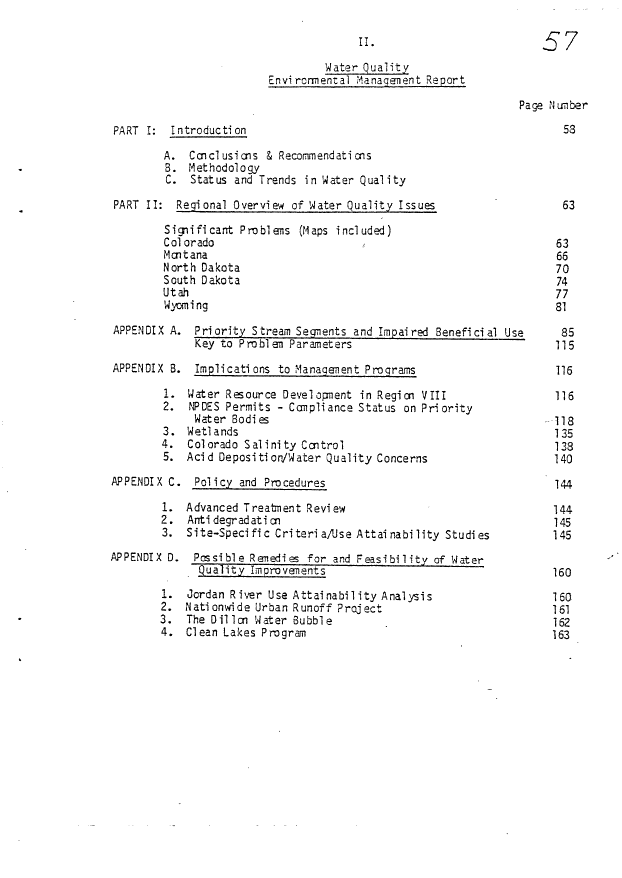
PART I: Introduction 5S
A. Conclusions & Recommendations
8. Methodology
C. Status and Trends in Water Quality
PART II: Regional Overview of Water Quality Issues 63
Significant Problens (Maps included)
Col orado 63
Montana 66
North Dakota 70
South Dakota 74
Utah 77
Wyoming 81
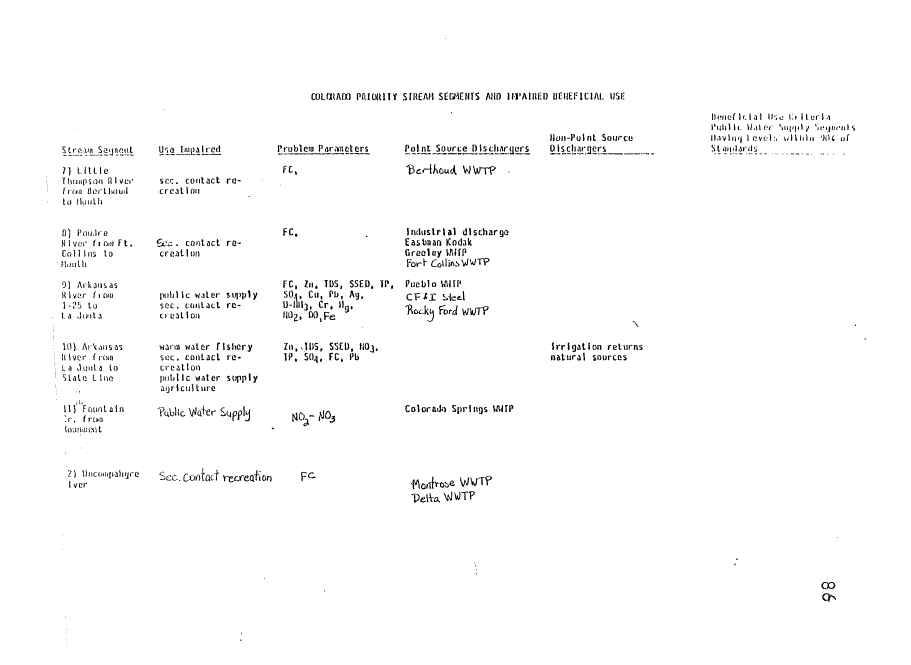
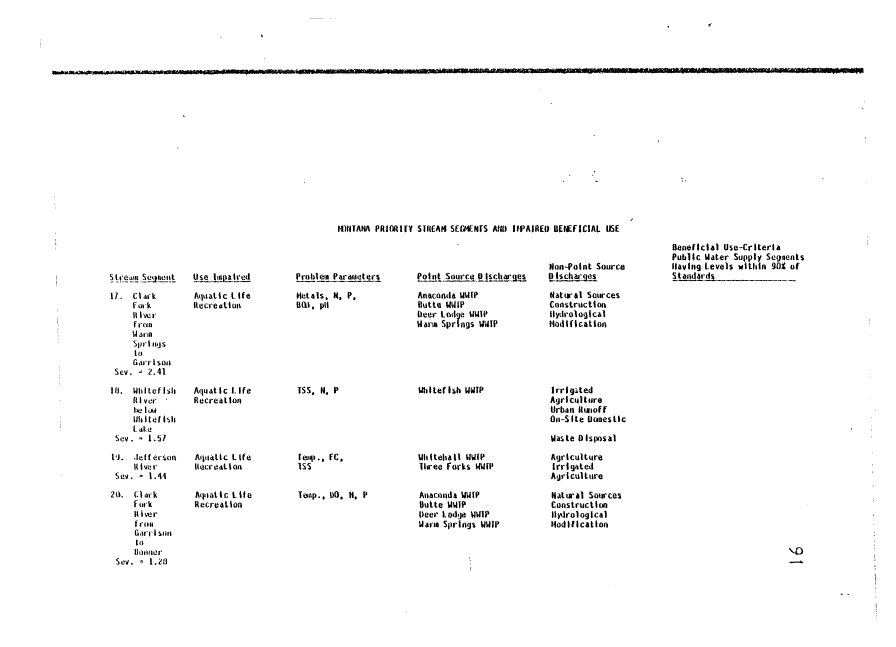
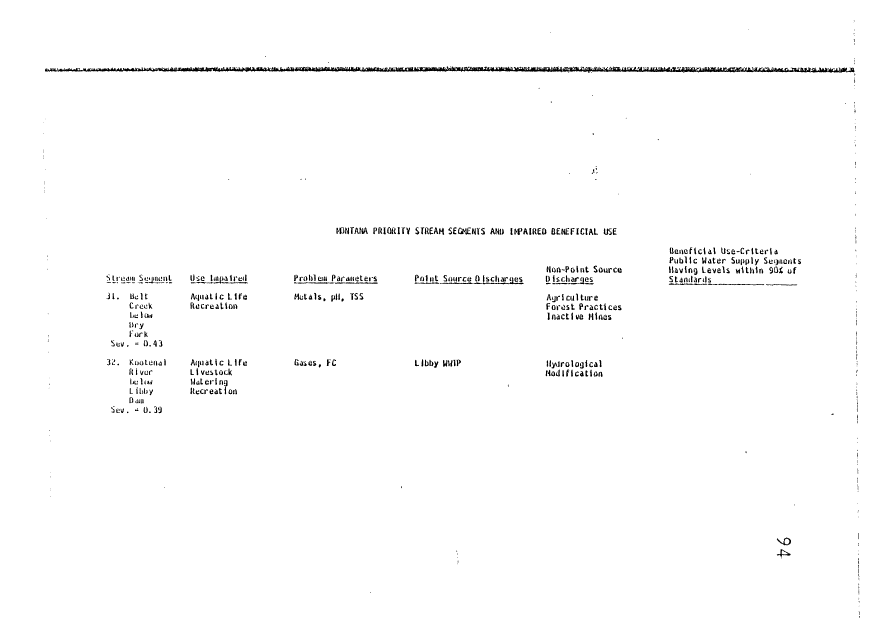
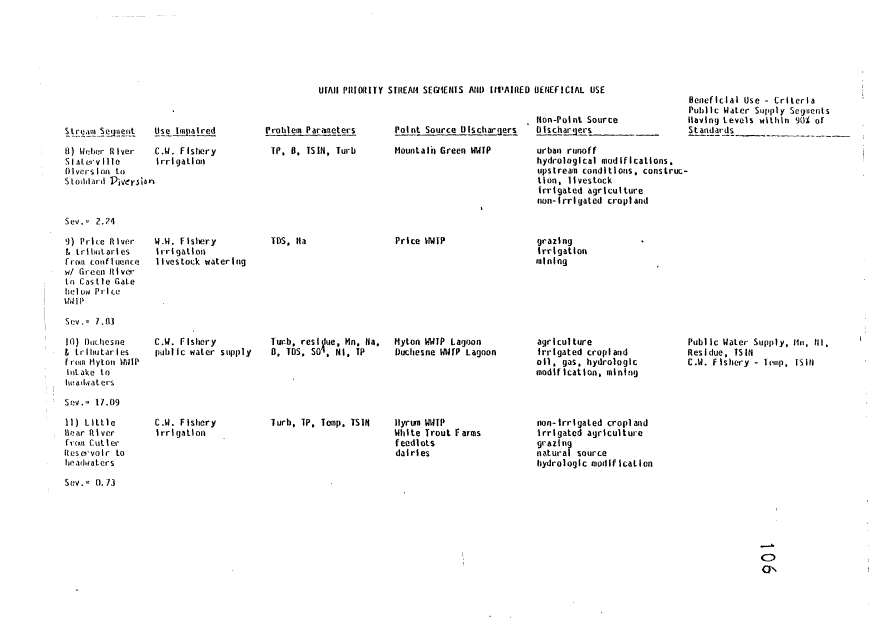
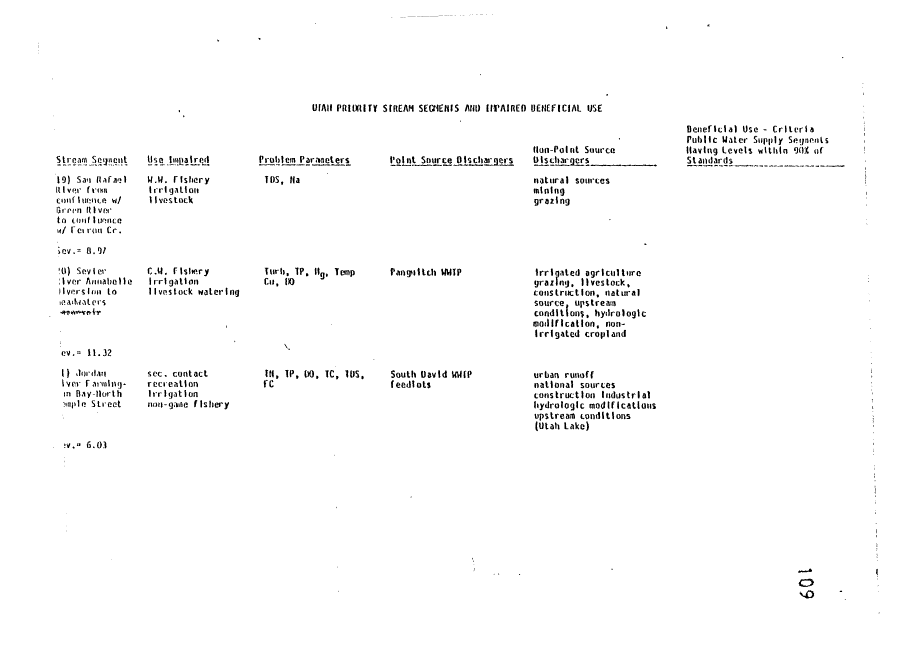
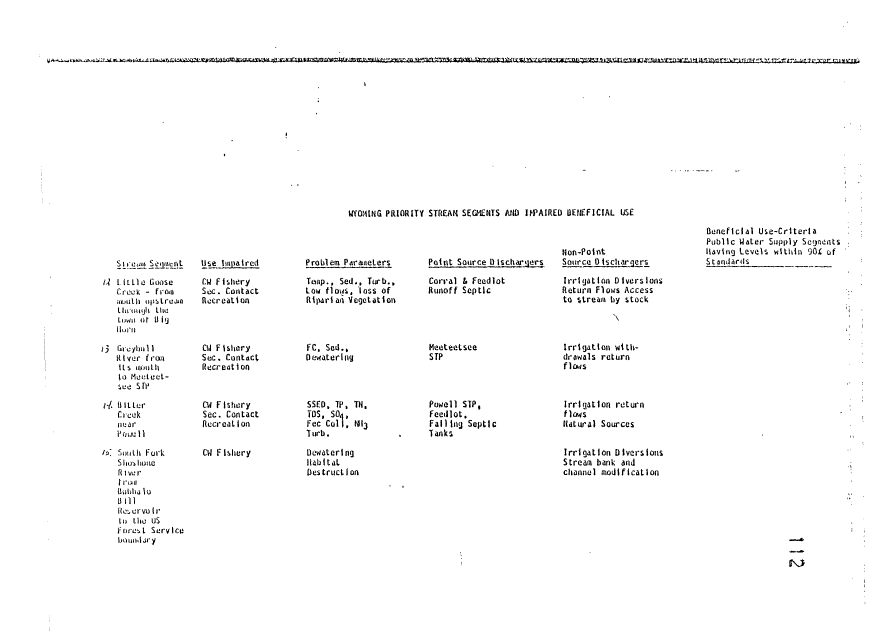
APPENDIX A. Priority Stream Segments,.and Impaired Beneficial Use 85
Key to Problem Parameters 115
APPENDIX 8. Implications to Management Programs 116
1. Water Resource Development in Region VIII 116
2. NPDES Permits - Compliance Status on Priority
Water Bodies 118
3. Wetlands 135
4. Colorado Salinity Control 138
5, Acid Deposition/Water Quality Concerns 140
APPENDIX C. Policy and Procedures 144
1. Advanced Treatnent Review 144
2. Anti degrad at i en 145
3. Site-Specific Criteria/Use Attainability Studies 145
APPENDIX D. Possible Remedies for and Feasibility of Water
'Quality Improvements 160
1. Jordan River Use Attainability Analysis 160
2. Nationwide Urban Runoff Project 161
3. The Dillon Water Bubble 162
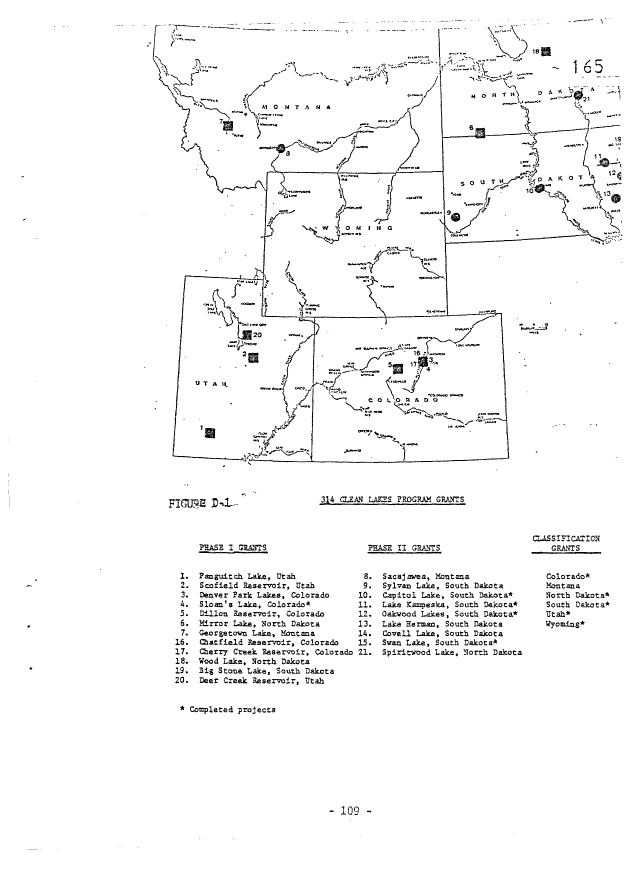
4. Clean Lakes Program 163
image:
II.
Water Quality
Environmental Management Report
Page Number
PART I: Introduction 5S
A. Conclusions & Recommendations
8. Methodology
C. Status and Trends in Water Quality
PART II: Regional Overview of Water Quality Issues 63
Significant Problens (Maps included)
Col orado 63
Montana 66
North Dakota 70
South Dakota 74
Utah 77
Wyoming 81
APPENDIX A. Priority Stream Segments,.and Impaired Beneficial Use 85
Key to Problem Parameters 115
APPENDIX 8. Implications to Management Programs 116
1. Water Resource Development in Region VIII 116
2. NPDES Permits - Compliance Status on Priority
Water Bodies 118
3. Wetlands 135
4. Colorado Salinity Control 138
5, Acid Deposition/Water Quality Concerns 140
APPENDIX C. Policy and Procedures 144
1. Advanced Treatnent Review 144
2. Anti degrad at i en 145
3. Site-Specific Criteria/Use Attainability Studies 145
APPENDIX D. Possible Remedies for and Feasibility of Water
'Quality Improvements 160
1. Jordan River Use Attainability Analysis 160
2. Nationwide Urban Runoff Project 161
3. The Dillon Water Bubble 162
4. Clean Lakes Program 163
image:
 III.
Drinking Water Quality Section
Environmental Management Report
Page Number
*• Overview of Status and Trends 167
A. Population Statistics
8. Overview of Safe Drinking Water Act
C. Compliance Rates
D. Emerging Problems
II. Discussion of Environmental Problems and Their Implications 169
for Agency [Management
A. Small Water Systems (Problems, Barriers)
8. Inorganic and Radiological Chemical MCL Violations
(Problems, Barriers, Implications)
C. Unknown Contaminants (Problems, Barriers)
0. Drinking Water Quality en Indian Lands
Problems, Barriers, Implications)
III. Attachment A 172
A. Population Statistics
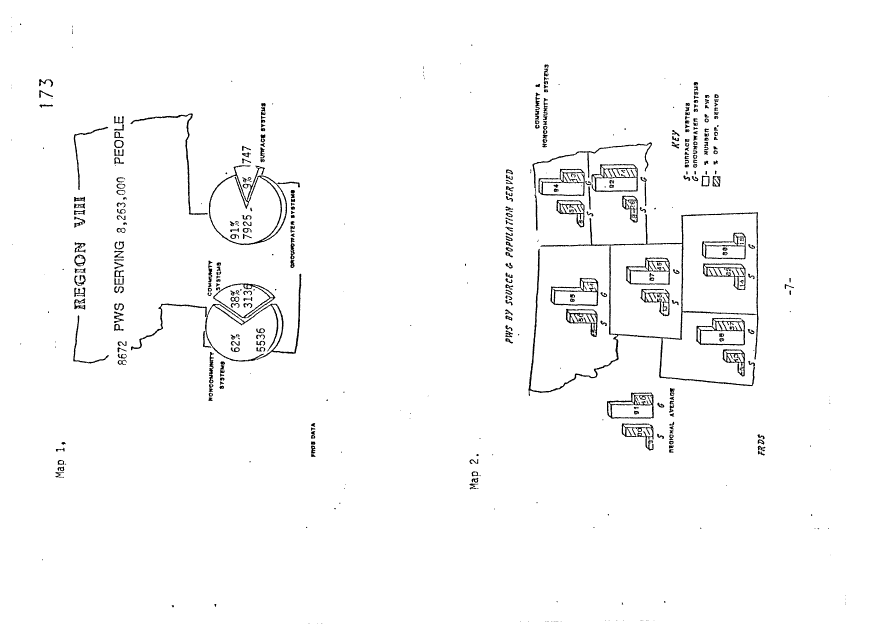
1. Map 1. Number of PWS in Region 173
2. Map 2. PWS by Source and Population Served
3. Table 1. Breakdown by States 174
4. Table 2. Popul ation Distribution 175
B. Viol ati en Statistics 176
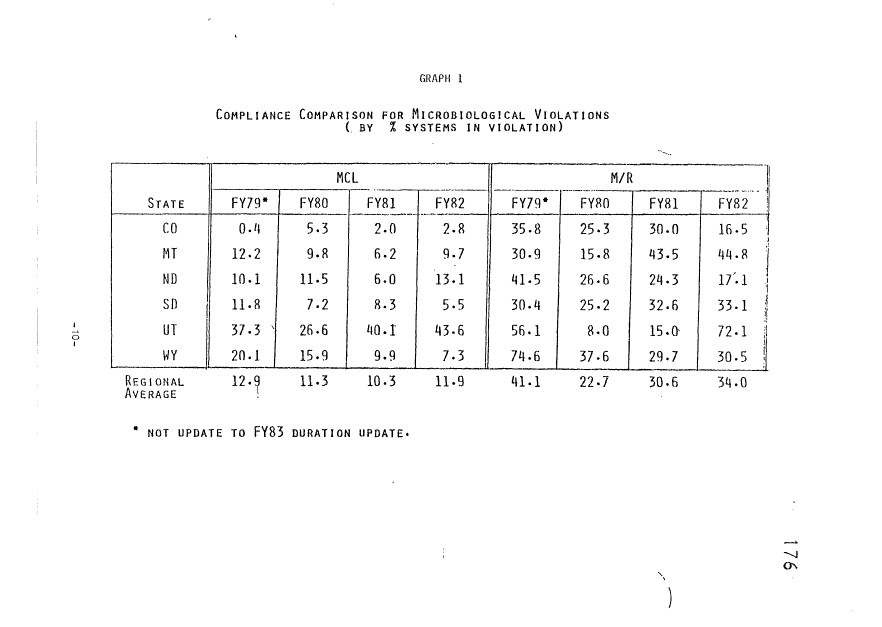
1. Coliform Bacteria Compliance 176
Graphs 1 - 4 Regional Conpliance Rates
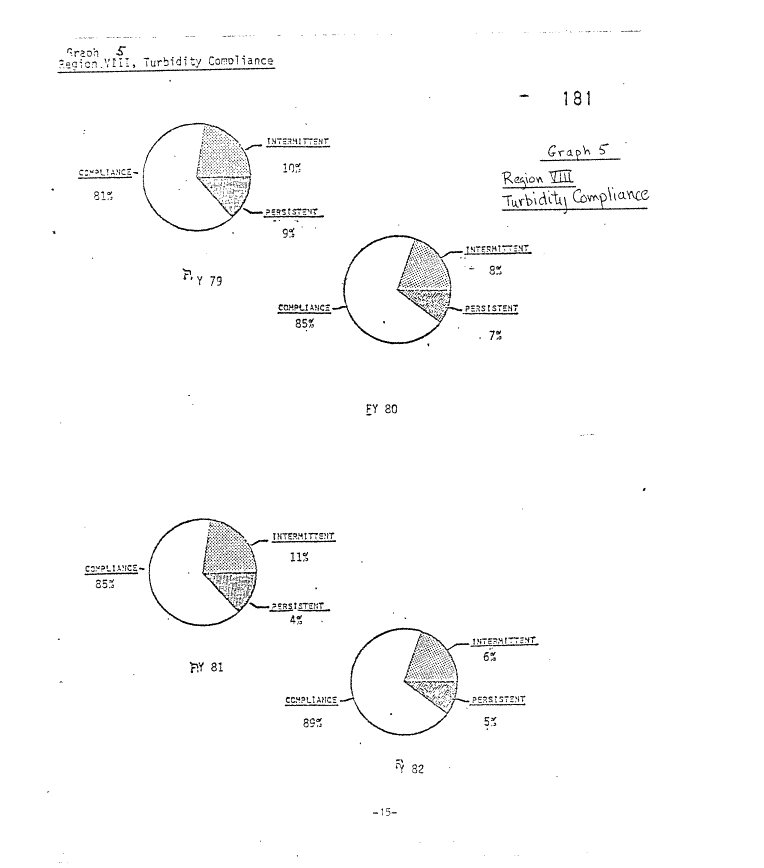
2. Turbidity Compliance 180
Graph 4 Regional Compliance Rates 181
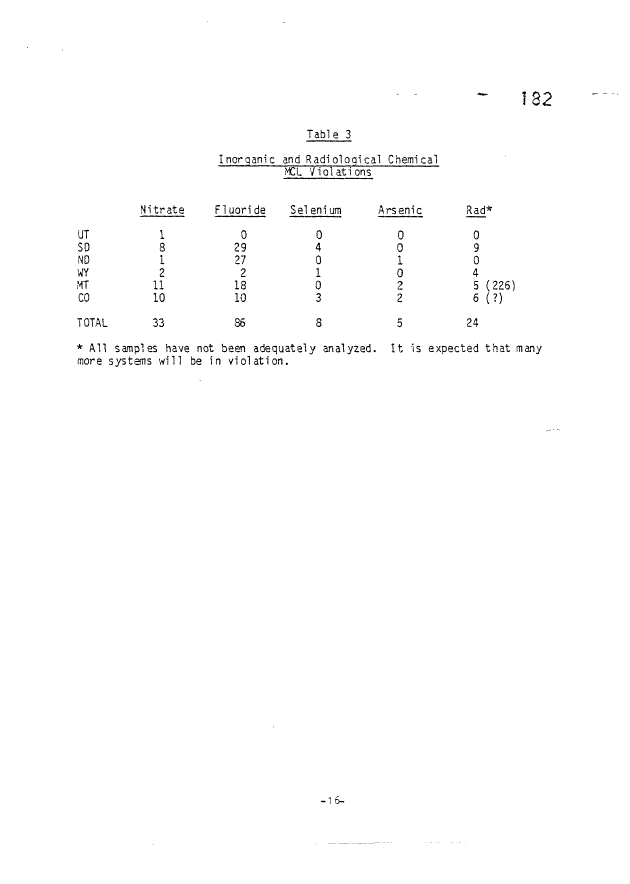
3. Inorganic and Radiological Chemical Compliance 180
Table 3 Chemical Violations 182
4. THM and Organic Chemical Compliance 180
Table 4. Vol atile Organic Chemicals Tested for in 181
Ground Water Survey 183
Table 5. Occurrence of Organics in Region VIII 184
IV. Attachment 8.
A. List of South Dakota Systems 185
8. Waterborne Transmission of Gi ardi as is 188
image:
III.
Drinking Water Quality Section
Environmental Management Report
Page Number
*• Overview of Status and Trends 167
A. Population Statistics
8. Overview of Safe Drinking Water Act
C. Compliance Rates
D. Emerging Problems
II. Discussion of Environmental Problems and Their Implications 169
for Agency [Management
A. Small Water Systems (Problems, Barriers)
8. Inorganic and Radiological Chemical MCL Violations
(Problems, Barriers, Implications)
C. Unknown Contaminants (Problems, Barriers)
0. Drinking Water Quality en Indian Lands
Problems, Barriers, Implications)
III. Attachment A 172
A. Population Statistics
1. Map 1. Number of PWS in Region 173
2. Map 2. PWS by Source and Population Served
3. Table 1. Breakdown by States 174
4. Table 2. Popul ation Distribution 175
B. Viol ati en Statistics 176
1. Coliform Bacteria Compliance 176
Graphs 1 - 4 Regional Conpliance Rates
2. Turbidity Compliance 180
Graph 4 Regional Compliance Rates 181
3. Inorganic and Radiological Chemical Compliance 180
Table 3 Chemical Violations 182
4. THM and Organic Chemical Compliance 180
Table 4. Vol atile Organic Chemicals Tested for in 181
Ground Water Survey 183
Table 5. Occurrence of Organics in Region VIII 184
IV. Attachment 8.
A. List of South Dakota Systems 185
8. Waterborne Transmission of Gi ardi as is 188
image:
 IV.
Ground Water Quality Section
Environmental Management Report
Page Number
Part I. Introduction - Overview of Status and Trends 191
A. Region 8 Ground Water Use
B. Trends in Ground Water Quality
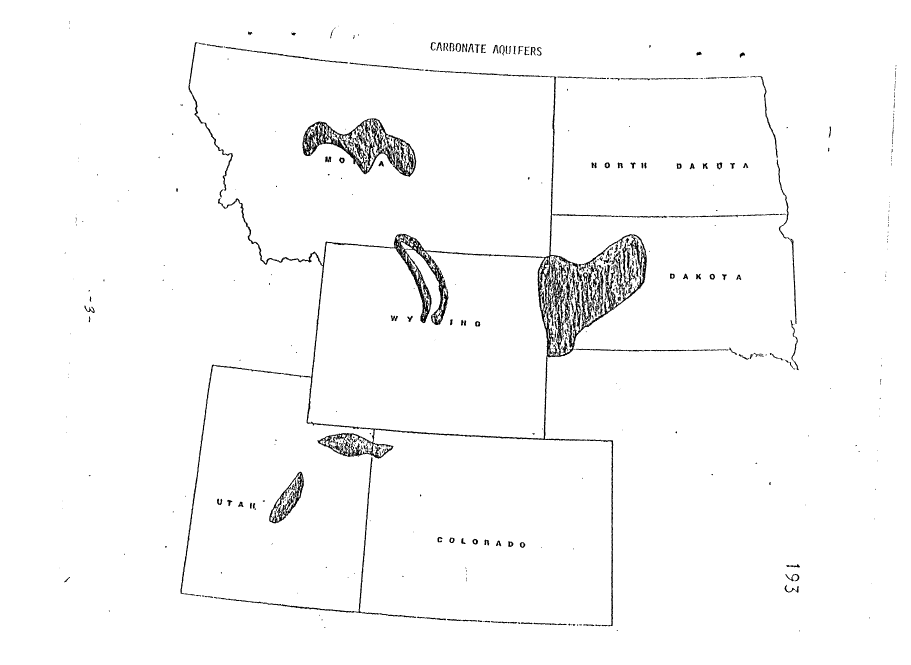
C. Aquifer Maps 193
Part II. EPA Ground Water Protection Activities 199
A. Statutory Obli gati ons
1. SOW
2. RCRA
3. TSCA
4. FIFRA
5. Superfund (CERCLA)
6. Clean Water Act
7.
B. Implications for Management • 200
1. Ground Water Use in Region VIII
2. Monitoring Needs
C. Possible Ground Water Protection Strategies 201
1. Permitting Actions: RCRA, UIC, 404 Permits,
Municipal Waste Water Permits
2. Grant Actions: Municipal Grants for Waste
Water Treatment, Superfund Cleanup, Areawide
Water Quality Plans, Nationwide Urban Runoff
Program
3. Mine Wastes Policy: Coal, Uraniun, Metal Mining,
O.il Shale
4. Survey of Pits, Ponds and Lagoons
5. County and State Land Use Planning
6. Spill Prevention and Cleanup
7. Assistance to State Oil Inspectors
3. Quality Changes Due to Ground Water Exploitation
9. Quality Changes as a Result of Oil , Gas , and
Mining Explorati on
10. Additional Monitoring and Coordination of
Federal Agency Programs
image:
IV.
Ground Water Quality Section
Environmental Management Report
Page Number
Part I. Introduction - Overview of Status and Trends 191
A. Region 8 Ground Water Use
B. Trends in Ground Water Quality
C. Aquifer Maps 193
Part II. EPA Ground Water Protection Activities 199
A. Statutory Obli gati ons
1. SOW
2. RCRA
3. TSCA
4. FIFRA
5. Superfund (CERCLA)
6. Clean Water Act
7.
B. Implications for Management • 200
1. Ground Water Use in Region VIII
2. Monitoring Needs
C. Possible Ground Water Protection Strategies 201
1. Permitting Actions: RCRA, UIC, 404 Permits,
Municipal Waste Water Permits
2. Grant Actions: Municipal Grants for Waste
Water Treatment, Superfund Cleanup, Areawide
Water Quality Plans, Nationwide Urban Runoff
Program
3. Mine Wastes Policy: Coal, Uraniun, Metal Mining,
O.il Shale
4. Survey of Pits, Ponds and Lagoons
5. County and State Land Use Planning
6. Spill Prevention and Cleanup
7. Assistance to State Oil Inspectors
3. Quality Changes Due to Ground Water Exploitation
9. Quality Changes as a Result of Oil , Gas , and
Mining Explorati on
10. Additional Monitoring and Coordination of
Federal Agency Programs
image:
 Ground Hater Quality Section (continued)
Page Number
Attachment A - Suggested Priority of Region 8 Ground Water Threats 205
1. Ran Id ng of Acti vi ti es in Approximate Order of 206
Importance to Limiting Ground Water Uses in Region 3
(Ranking of Generic Ground Water Issues)
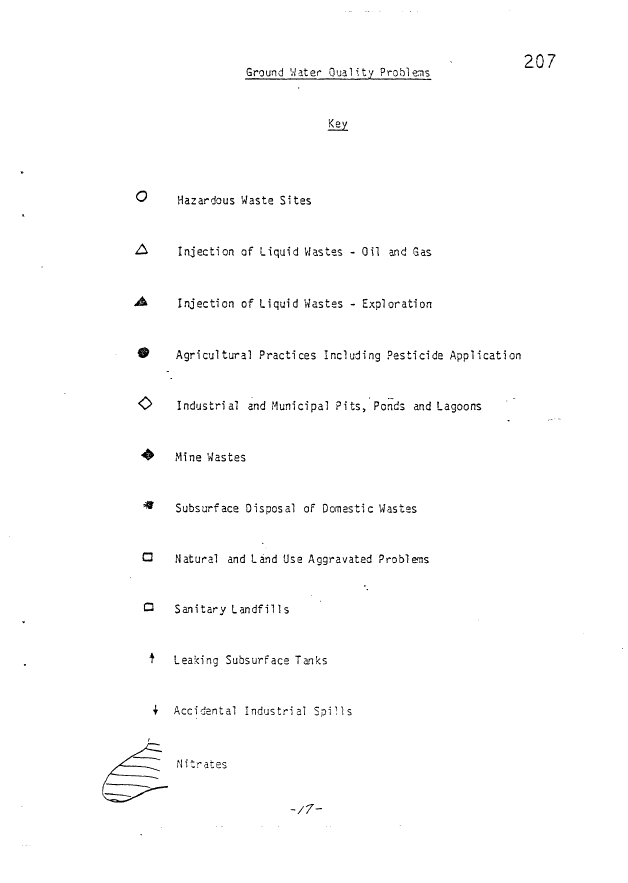
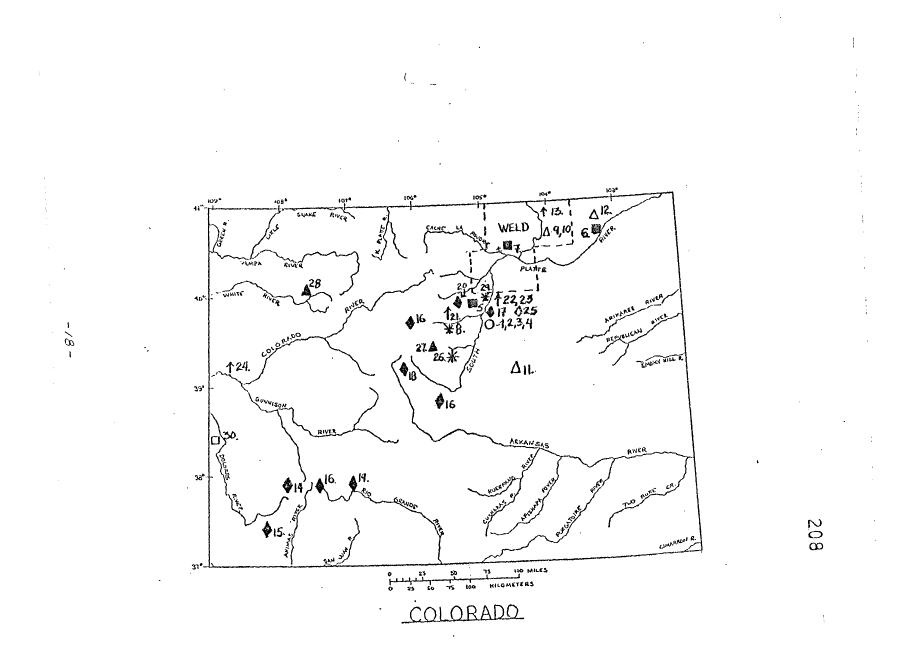
Ground Water Quality Problems - Key 207
2. .Maps of Site-Specific Problems by State 209
Colorado 208
Montana 210
North Dakota 213
South Dakota 215
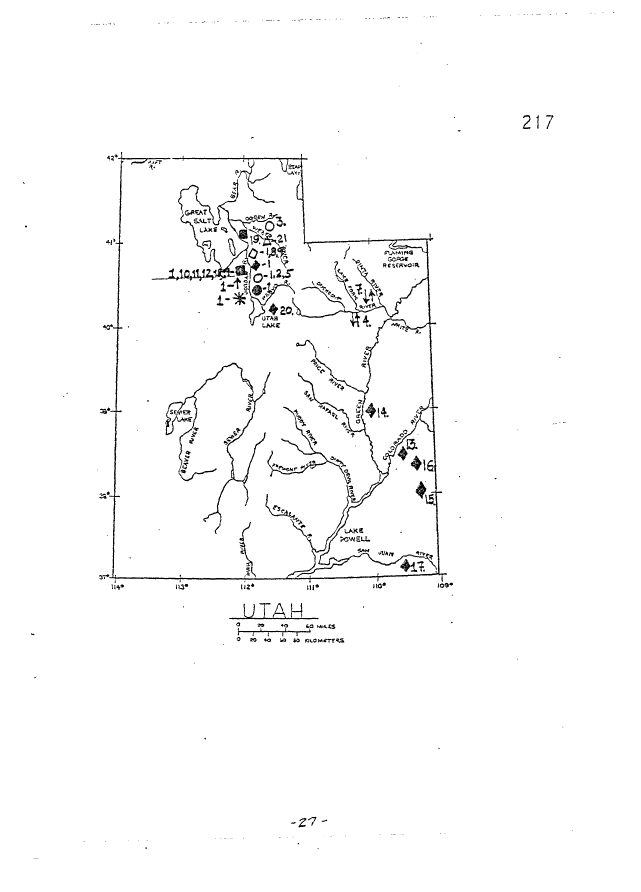
Utah 217
Wyoming 219
Attachment B - Details of the Most Significant.
Ground Water Quality Threats by State 221
Colorado 221
Montana 231
North Dakota 238
South Dakota 240
Utah 243
Wyom i ng 246
image:
Ground Hater Quality Section (continued)
Page Number
Attachment A - Suggested Priority of Region 8 Ground Water Threats 205
1. Ran Id ng of Acti vi ti es in Approximate Order of 206
Importance to Limiting Ground Water Uses in Region 3
(Ranking of Generic Ground Water Issues)
Ground Water Quality Problems - Key 207
2. .Maps of Site-Specific Problems by State 209
Colorado 208
Montana 210
North Dakota 213
South Dakota 215
Utah 217
Wyoming 219
Attachment B - Details of the Most Significant.
Ground Water Quality Threats by State 221
Colorado 221
Montana 231
North Dakota 238
South Dakota 240
Utah 243
Wyom i ng 246
image:
 V.
Superf und Section
Hazardous Wastes - Inactive Sites
Environmental Management Report
Page Nunber
PART 1 - Status. Trends, and Progress to Date 250
I. Status
A. National Priorities List (NPL)
B. High Priority Sites Not on the NPL
C. Federal Facilities
0. Assessment and Investigation
of Potential Prob!an Sites
II. Trends
III. Progress to Date
A. NPL -Listed Sites
B. High Priority Sites not on tha NPL
C. Federal Facilities
0. Assessment and Investigation of
Potential Problem Sites
PART 2 - Problem Identification, Distribution, Ranking. 256
and Implications for Agency Managenent
I. Most Significant Problans (Inactive Hazardous
Viaste Sites Listed and Ranked)
A. NPL
B. High Priority Sites not on the NPL
C. Federal Facilities
D. Assessment of Potential Sites
II. Implications for Agency Management
A. NPL
B. High Priority Sites not on the NPL
C. Federal Facilities
III. Problem Distribution 258
A. NPL
B. High Priority Sites Not on the NPL
C. Federal Facilities
D. Assessment and Investigation of Potential P rob! an Sites
xm
image:
V.
Superf und Section
Hazardous Wastes - Inactive Sites
Environmental Management Report
Page Nunber
PART 1 - Status. Trends, and Progress to Date 250
I. Status
A. National Priorities List (NPL)
B. High Priority Sites Not on the NPL
C. Federal Facilities
0. Assessment and Investigation
of Potential Prob!an Sites
II. Trends
III. Progress to Date
A. NPL -Listed Sites
B. High Priority Sites not on tha NPL
C. Federal Facilities
0. Assessment and Investigation of
Potential Problem Sites
PART 2 - Problem Identification, Distribution, Ranking. 256
and Implications for Agency Managenent
I. Most Significant Problans (Inactive Hazardous
Viaste Sites Listed and Ranked)
A. NPL
B. High Priority Sites not on the NPL
C. Federal Facilities
D. Assessment of Potential Sites
II. Implications for Agency Management
A. NPL
B. High Priority Sites not on the NPL
C. Federal Facilities
III. Problem Distribution 258
A. NPL
B. High Priority Sites Not on the NPL
C. Federal Facilities
D. Assessment and Investigation of Potential P rob! an Sites
xm
image:
 Superfund Section (continued)
Hazardous Wastes - Inactive Sites
Page Number
ATTACHMENT A - Distribution of Problem Sites Among States 259
I- P it> bl en D1 stri buti on Betw ee n States
A. National Priorities List
B. High. Priority Sites not on the NPL
C. Federal Facilities
0. Assessment of Potential Sites
ATTACHMENT B - Synopses of Problems at Inactive Hazardous 259
"ffaste Sites 'inllegion 8
I. National Priorities List (NPL)
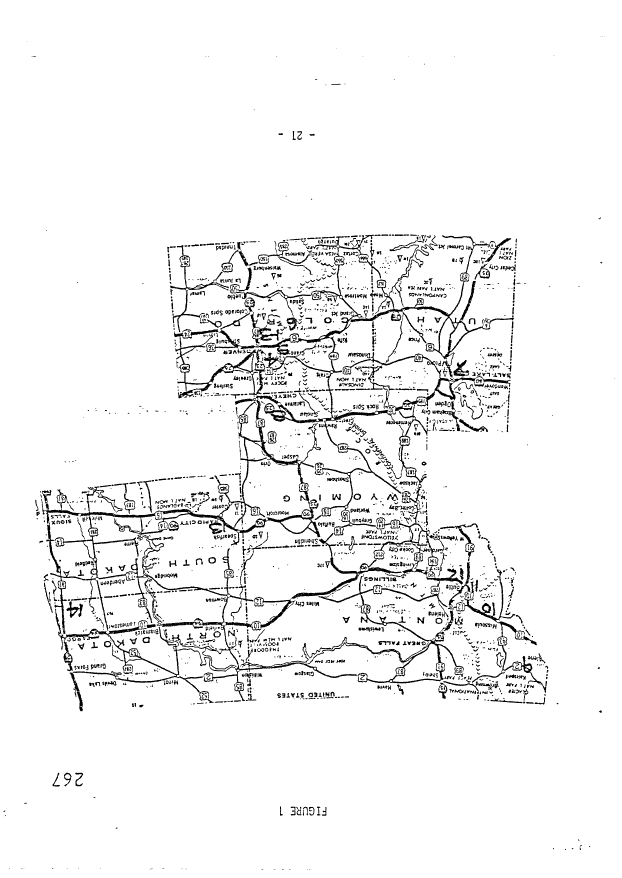
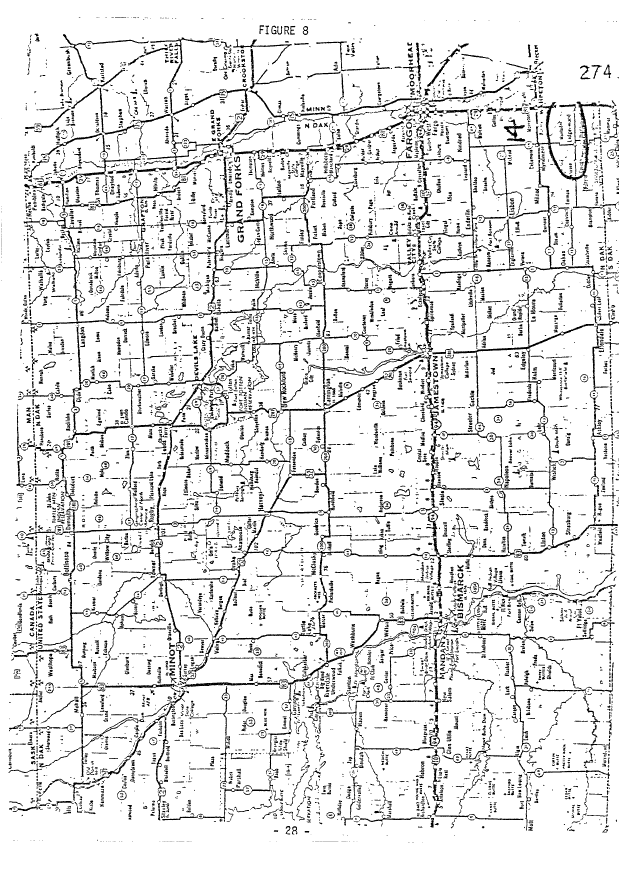
A. Denver Radiun Site, Colorado (Figure 3)
B. Woodbury Chemical Company Site, Colorado (Figure 3)
C. Central City-Idaho Spring Mining
District Site, Colorado (Figure 2)
0. Cal iforni a Gulch, Colorado (Figure 2)
E. Sand Creek Industrial Site, Colorado (Figure 3}
F. Marshall Landfill, Colorado (Figure 3)
G. Silver Bow Creek, Montana (Figure 6}
H. Milltown Reservoir, Montana (Figure 6}
I. Libby Ground Water, Montana (Figure 6)
J. Anaconda Smelter, Montana (Figure 5)
K. Arsenic Trioxide Site, North Dakota (Figure 7)
L. Whitewood Creek, South Dakota (Figure 7)
M. Rosewood Park, Utah (Figure 3)
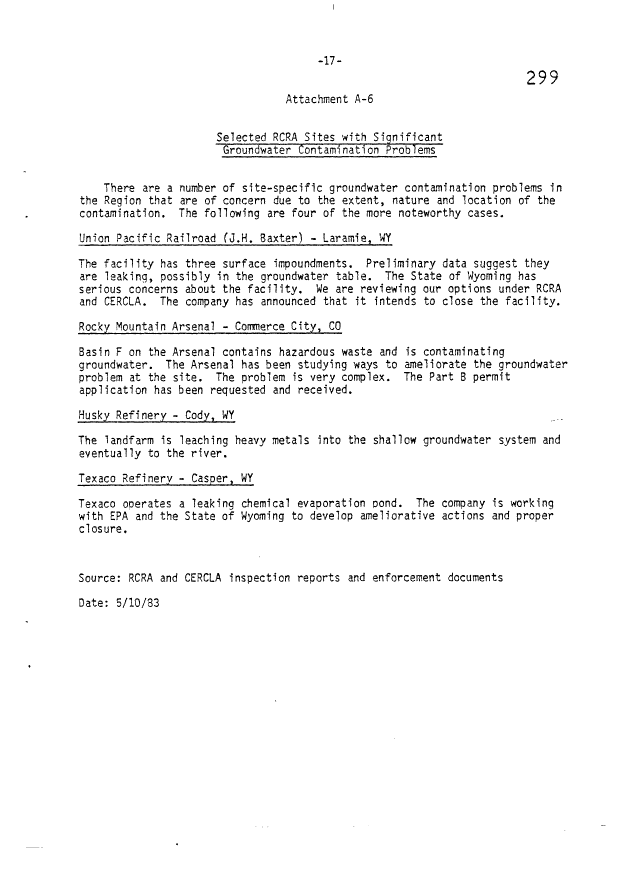
N. Union Pacific/J.H. Baxter, Wyoming (Figure 5)
II. High Priority Sites not on the NPL 264
A. Lowry Landfill, Colorado (Figure 2)
3. ASARCO Smelter, Montana (Figure 6}
III. Federal Facilities 265
A. Rocky Mountain Arsenal (Figure 3)
B. Leadvilie Drainage Tunnel (Figure 2)
FIGURES 1-8 (Maps showing Superfund sites) 267
GRAPHS AND CHARTS (Graphs and charts referred in text) 275
xiv
image:
Superfund Section (continued)
Hazardous Wastes - Inactive Sites
Page Number
ATTACHMENT A - Distribution of Problem Sites Among States 259
I- P it> bl en D1 stri buti on Betw ee n States
A. National Priorities List
B. High. Priority Sites not on the NPL
C. Federal Facilities
0. Assessment of Potential Sites
ATTACHMENT B - Synopses of Problems at Inactive Hazardous 259
"ffaste Sites 'inllegion 8
I. National Priorities List (NPL)
A. Denver Radiun Site, Colorado (Figure 3)
B. Woodbury Chemical Company Site, Colorado (Figure 3)
C. Central City-Idaho Spring Mining
District Site, Colorado (Figure 2)
0. Cal iforni a Gulch, Colorado (Figure 2)
E. Sand Creek Industrial Site, Colorado (Figure 3}
F. Marshall Landfill, Colorado (Figure 3)
G. Silver Bow Creek, Montana (Figure 6}
H. Milltown Reservoir, Montana (Figure 6}
I. Libby Ground Water, Montana (Figure 6)
J. Anaconda Smelter, Montana (Figure 5)
K. Arsenic Trioxide Site, North Dakota (Figure 7)
L. Whitewood Creek, South Dakota (Figure 7)
M. Rosewood Park, Utah (Figure 3)
N. Union Pacific/J.H. Baxter, Wyoming (Figure 5)
II. High Priority Sites not on the NPL 264
A. Lowry Landfill, Colorado (Figure 2)
3. ASARCO Smelter, Montana (Figure 6}
III. Federal Facilities 265
A. Rocky Mountain Arsenal (Figure 3)
B. Leadvilie Drainage Tunnel (Figure 2)
FIGURES 1-8 (Maps showing Superfund sites) 267
GRAPHS AND CHARTS (Graphs and charts referred in text) 275
xiv
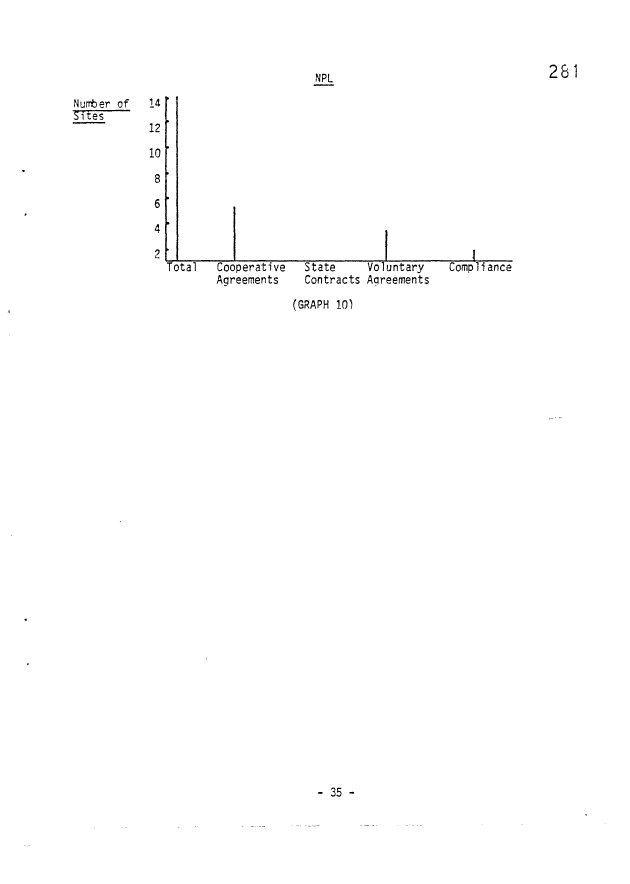
image:
 VI.
RCRA Section
Hazardous Waste - (Active Sites)
Environmental Management Report
A Page Number
PART 1 - Overview of Status & Trends 283
Introduction
Identification of Waste Handlers
Universe of Hazardous Wastes
Treatment Storage and Disposal Facilities (TSD's)
Coroner cial Disposal Facilities Identified
Commercial Recycl ing Facil iti es Identified
Hazardous Waste on Indian Reservations
Correction of Unsafe and Improper Handling Practices
Improvement of Facilities through Permitting
Trends
PART 2 - Significant Environmental problems at active
Hazardous Waste Sites ' r 287
Criteria for Defining "Significant Problems"
Ground Water Contamination,
Causes, Barrier, Implications
Oil Refineries
Causes, Barriers, Implications
R ecyclers
Causes, Barriers, Implications
Mining Wastes
Causes, Barriers, Implications
Implementation of Pretreatnent Standards
Causes , Barri ers , Imp! i cati ens
Site-Specific Problems
Denver-Arapahoe Chemical Waste Processing
Facility
Attachments
A-l Hazardous Waste Notification Figures (chart) 294
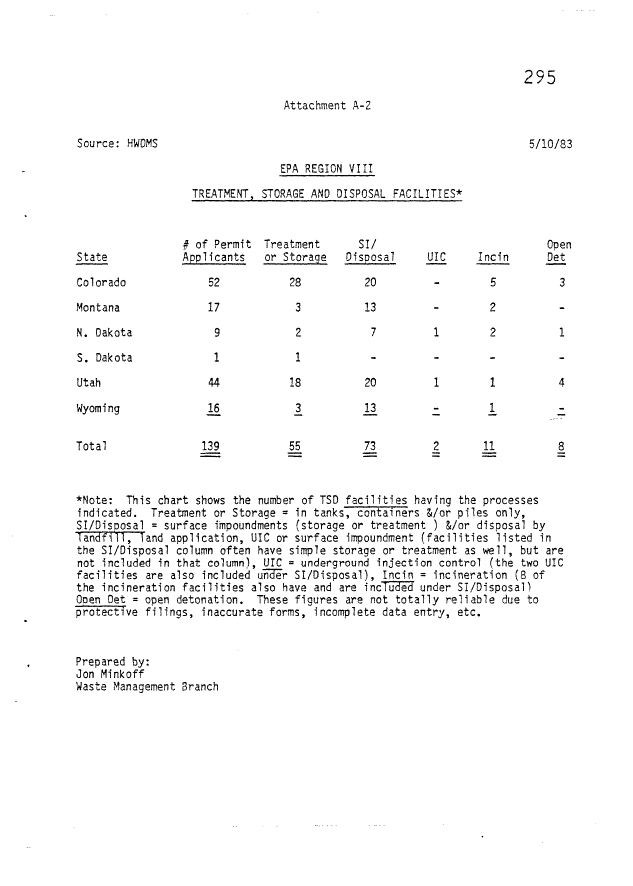
A-2 Treatment Storage and Disposal Facilities 295
by Process and by State (chart)
A-3 Number of Hazardous Waste TSD Facilities by 296
Type of Process and by State (chart)
A-4 Location of Comnercial Hazardous Waste Disposal 297
Facilities (map)
A-5 Location of Commercial Hazardous Waste Recycl ing 298
Facilities (map)
A-5 Selected RCRA Sites with Significant 299
Ground Water Contamination Problems
A-7 Oil Refineries and Associated Installation with TSD 300
Facilities (Listed by State)
A-8 Hazardous Waste Recycl ers Posing Significant Problems 301
(Selected Listing and Summaries of Three Sites)
xv
image:
VI.
RCRA Section
Hazardous Waste - (Active Sites)
Environmental Management Report
A Page Number
PART 1 - Overview of Status & Trends 283
Introduction
Identification of Waste Handlers
Universe of Hazardous Wastes
Treatment Storage and Disposal Facilities (TSD's)
Coroner cial Disposal Facilities Identified
Commercial Recycl ing Facil iti es Identified
Hazardous Waste on Indian Reservations
Correction of Unsafe and Improper Handling Practices
Improvement of Facilities through Permitting
Trends
PART 2 - Significant Environmental problems at active
Hazardous Waste Sites ' r 287
Criteria for Defining "Significant Problems"
Ground Water Contamination,
Causes, Barrier, Implications
Oil Refineries
Causes, Barriers, Implications
R ecyclers
Causes, Barriers, Implications
Mining Wastes
Causes, Barriers, Implications
Implementation of Pretreatnent Standards
Causes , Barri ers , Imp! i cati ens
Site-Specific Problems
Denver-Arapahoe Chemical Waste Processing
Facility
Attachments
A-l Hazardous Waste Notification Figures (chart) 294
A-2 Treatment Storage and Disposal Facilities 295
by Process and by State (chart)
A-3 Number of Hazardous Waste TSD Facilities by 296
Type of Process and by State (chart)
A-4 Location of Comnercial Hazardous Waste Disposal 297
Facilities (map)
A-5 Location of Commercial Hazardous Waste Recycl ing 298
Facilities (map)
A-5 Selected RCRA Sites with Significant 299
Ground Water Contamination Problems
A-7 Oil Refineries and Associated Installation with TSD 300
Facilities (Listed by State)
A-8 Hazardous Waste Recycl ers Posing Significant Problems 301
(Selected Listing and Summaries of Three Sites)
xv
image:
 VII.
Radi ati on Secti on
Envi rormental ManaganenT Report
Page Nunber
Part I Overview of Status and Trends 304
Introductory Summary Paragraph
External Exposure Issue
Internal Exposure Issues
Part II Ranking of Regional Environmental 308
Problems and Implications for Agency Managanent
Introductory Paragraph
A. Ranking of Radiological Problans 308
1. Uncontrolled Radioactive Waste Sites
2. Uranium Mill Tailings Remedial Action
3. Indoor Radon Progeny
4. Radioacti vity in Drinking Water
5. Low-Level Radioactive Waste Disposal
6. Hic^-Level Radioactive Waste Disposal
8. Implications of this Report 312-
1. CERCLA
2. UMTRAP
3. Indoor Radon Progeny
4. Radioactivity in Water
5. Low-Level Waste Disposal
6. Hic^i-Level Radioactive Waste
xvi
image:
VII.
Radi ati on Secti on
Envi rormental ManaganenT Report
Page Nunber
Part I Overview of Status and Trends 304
Introductory Summary Paragraph
External Exposure Issue
Internal Exposure Issues
Part II Ranking of Regional Environmental 308
Problems and Implications for Agency Managanent
Introductory Paragraph
A. Ranking of Radiological Problans 308
1. Uncontrolled Radioactive Waste Sites
2. Uranium Mill Tailings Remedial Action
3. Indoor Radon Progeny
4. Radioacti vity in Drinking Water
5. Low-Level Radioactive Waste Disposal
6. Hic^-Level Radioactive Waste Disposal
8. Implications of this Report 312-
1. CERCLA
2. UMTRAP
3. Indoor Radon Progeny
4. Radioactivity in Water
5. Low-Level Waste Disposal
6. Hic^i-Level Radioactive Waste
xvi
image:
 R adl atl on S ecti on (continued)
Page Nimber
Attachment A: Radiation Problems and Issues 315
I. Urani urn Industry
Inacti ve/Abandoned Dram an Mills
Actl ve Urani un Mills
Special .Concerns, 320
Uravan Mill
Edgemcnt Mil 1
Cotter Mill
Vitro Tailings Site
Uraniun Mines
II. Radioactivity in Ground Water 321
III. CERCLA Actions 323
Denver Radiun Site
Monti cello, Utah
Colorado Vanadium Sites
Uraniferous Lignite Mines
IV. Radioactive Waste Disposal 329
Low-Level Waste
High-Level Waste
V. Ncn i on 1 zi ng R ad 1 at 1 en . 330
High-Voltage Transmission lines
R ad 1 of re que n cy/ M1 cro wa ges
VI. Emergancy Res ppnse P1annlng 331
Fort St. Vrain
Rocky Flats
VH. Indoor Radon P regency Issue 333
xvn
image:
R adl atl on S ecti on (continued)
Page Nimber
Attachment A: Radiation Problems and Issues 315
I. Urani urn Industry
Inacti ve/Abandoned Dram an Mills
Actl ve Urani un Mills
Special .Concerns, 320
Uravan Mill
Edgemcnt Mil 1
Cotter Mill
Vitro Tailings Site
Uraniun Mines
II. Radioactivity in Ground Water 321
III. CERCLA Actions 323
Denver Radiun Site
Monti cello, Utah
Colorado Vanadium Sites
Uraniferous Lignite Mines
IV. Radioactive Waste Disposal 329
Low-Level Waste
High-Level Waste
V. Ncn i on 1 zi ng R ad 1 at 1 en . 330
High-Voltage Transmission lines
R ad 1 of re que n cy/ M1 cro wa ges
VI. Emergancy Res ppnse P1annlng 331
Fort St. Vrain
Rocky Flats
VH. Indoor Radon P regency Issue 333
xvn
image:
 VIII.
Pesticides and Toxics Section
Environmental Management Report
Page Number
I Overview Status and Trends 3336
II S i gn i_f 1 cant P ro bT_ems a rid I mpl 1 cat i en s: Pes t1 ci des 338
A. Pesticide Contamination of Wildlife
8. Pesticide Misuse
C. Pesticide Drift
0. Pesticide Orun Storage and Disposal
Significant Problems and Implications: Toxics 339
A. Asbestos
B. PCBs
III Emerging Issues. 340
Attachment A: Medi a Overview - Pesticides
Table A: Pesticide-Caused Fish Kil Is 341
Table B: Wyoming Pesticide Use Inspections 342
and Viol ations
Table C: Colorado Pesticide Use Inspections 342
and Violations
Table 0: Utah Pesticide Use Inspections 343
and Viol ati ons
Table E: South Dakota Pesticide Use 343
and Vi ol ati ons
Table F: Montana Pesticide Use Inspections 344
and Vi ol ations
Table G: Pest i ci de Drift: Colorado and Wyoming 346
Table H: Pesticide Drift: North Dakota, South 346
Dakota, Utah
Table I: Poisonings: Due to Pesticides 347
Attachment B: Medi a Overview -Toxics 348
A. Asbestos
B. PCB's
Table J: PCS Inspections and Violations - 348
Region 8
xv m
image:
VIII.
Pesticides and Toxics Section
Environmental Management Report
Page Number
I Overview Status and Trends 3336
II S i gn i_f 1 cant P ro bT_ems a rid I mpl 1 cat i en s: Pes t1 ci des 338
A. Pesticide Contamination of Wildlife
8. Pesticide Misuse
C. Pesticide Drift
0. Pesticide Orun Storage and Disposal
Significant Problems and Implications: Toxics 339
A. Asbestos
B. PCBs
III Emerging Issues. 340
Attachment A: Medi a Overview - Pesticides
Table A: Pesticide-Caused Fish Kil Is 341
Table B: Wyoming Pesticide Use Inspections 342
and Viol ations
Table C: Colorado Pesticide Use Inspections 342
and Violations
Table 0: Utah Pesticide Use Inspections 343
and Viol ati ons
Table E: South Dakota Pesticide Use 343
and Vi ol ati ons
Table F: Montana Pesticide Use Inspections 344
and Vi ol ations
Table G: Pest i ci de Drift: Colorado and Wyoming 346
Table H: Pesticide Drift: North Dakota, South 346
Dakota, Utah
Table I: Poisonings: Due to Pesticides 347
Attachment B: Medi a Overview -Toxics 348
A. Asbestos
B. PCB's
Table J: PCS Inspections and Violations - 348
Region 8
xv m
image:
 ACKNOWLEDGMENTS
This report was made possible because many people were willing to bring
their years of training, experience and professional judgement to bear on the
interpretation of a complex array of data compiled over nearly a decade
through local, state and federal environmental monitoring networks.
Particular credit is due to the individual technical and program staff in
Region 8 who cared enough about environmental results to make this initial
pilot project accurate and worth referencing. The fact that"this report can
be used as a benchmark against which future environmental conditions can be
measured in Region VIII is due in large part to the following individuals.
Paul Riederer (Project Director); Tom Entzminger (Data Analysis); John
Giedt and Paul Wagner (Radiation); Diane Groh (Pesticides and Toxics); David
Joseph (Air Quality); Dave Lewis (Data Analysis); Nancy McTigue (Drinking
Water Quality); Jon Minkoff (Hazardous Waste, Active Sites); John Wardell
(Hazardous Waste, Inactive Sites); Bill Tabor (Data Analysis); Tom Willingham,
Diane Wynne, Cece Forget and Denise Link (Water Quality); Wes Wilson (Ground
Water Quality); many other technical and program staff too numerous to
mention; and the clerical and secretarial staff whose patience and skills made
it possible, despite the vicissitudes of electronic-age word processing
equipment, to produce this document in a timely and orderly fashion.
We wish to acknowledge the considerable help and constructive suggestions
provided by technical experts and program staff in each of the six Region VIII
states and in the EPA Headquarters program offices. To the extent possible we
have incorporated suggested changes and corrections, and we believe that the
final Region VIII Environmental Management Report will meet the need of EPA
managers for an internal agency management tool which provides an accurate and
current status report of the region's major environmental concerns.
We also wish to acknowledge the national coordination and guidance
provided for the Environmental Management Reports by the Environmental Results
Branch of the Office of Management Systems and Evaluation in EPA headquaters
in Washington, D.C. We especially appreciate the efforts of Sherry Hiemstra
and Bill Garetz whose thoughtful direction produced an innovative report on
environmental conditions in each of the nation's ten regions.
image:
ACKNOWLEDGMENTS
This report was made possible because many people were willing to bring
their years of training, experience and professional judgement to bear on the
interpretation of a complex array of data compiled over nearly a decade
through local, state and federal environmental monitoring networks.
Particular credit is due to the individual technical and program staff in
Region 8 who cared enough about environmental results to make this initial
pilot project accurate and worth referencing. The fact that"this report can
be used as a benchmark against which future environmental conditions can be
measured in Region VIII is due in large part to the following individuals.
Paul Riederer (Project Director); Tom Entzminger (Data Analysis); John
Giedt and Paul Wagner (Radiation); Diane Groh (Pesticides and Toxics); David
Joseph (Air Quality); Dave Lewis (Data Analysis); Nancy McTigue (Drinking
Water Quality); Jon Minkoff (Hazardous Waste, Active Sites); John Wardell
(Hazardous Waste, Inactive Sites); Bill Tabor (Data Analysis); Tom Willingham,
Diane Wynne, Cece Forget and Denise Link (Water Quality); Wes Wilson (Ground
Water Quality); many other technical and program staff too numerous to
mention; and the clerical and secretarial staff whose patience and skills made
it possible, despite the vicissitudes of electronic-age word processing
equipment, to produce this document in a timely and orderly fashion.
We wish to acknowledge the considerable help and constructive suggestions
provided by technical experts and program staff in each of the six Region VIII
states and in the EPA Headquarters program offices. To the extent possible we
have incorporated suggested changes and corrections, and we believe that the
final Region VIII Environmental Management Report will meet the need of EPA
managers for an internal agency management tool which provides an accurate and
current status report of the region's major environmental concerns.
We also wish to acknowledge the national coordination and guidance
provided for the Environmental Management Reports by the Environmental Results
Branch of the Office of Management Systems and Evaluation in EPA headquaters
in Washington, D.C. We especially appreciate the efforts of Sherry Hiemstra
and Bill Garetz whose thoughtful direction produced an innovative report on
environmental conditions in each of the nation's ten regions.
image:
 image:
 INTRODUCTION
This report documents current environmental conditions as a "baseline"
of environmental quality in Region VIII. The success of this report will be
measured in the short run by how well EPA's managers use the data and
conclusions in this report to help focus abatement and prevention efforts more
directly on the most significant problems in the region. For the long term
the greatest value of this report may be that it establishes a benchmark
against which future environmental conditions can be measured.
EPA's Environmental Management Reports
In November of 1982 EPA's Assistant Adminsistrator for Policy and
Resource Management directed each regional office by May, 1983 to prepare an
intermedia assessment of the "most significant environmental problems" in the
region. The expressed purpose was to identify program and resource priorities
more clearly so that the agency could do a better job of "managing for
environmental results."
The regions were specifically asked to prepare detailed reports ranking
regional environmental problems in priority order and describing the resulting
Implications for regional and national environmental protection strategies.
The environmental management reports {EMR's) are planned as an agency
pilot project for Fiscal Year 1983. In future years the EMR's may be linked
directly to development of agency budgets, program and operating year
guidance, state/EPA agreements and grant negotiations, as well as agency goals
and performance standards.
Compiling the EMR in Region VIII
Compiling this report in Region VIII was a cooperative, region-wide
effort involving many technical and program staff. A Region VIII "EMR
Workgroup" was formed of one or more staff members from each of the eight
media, and several members of the region's data analysis staff. The primary
responsibility for direction and coordination of the EMR in the region was
with the Office of Management Systems and Analysis, with data analysis support
provided by the Environmental Services Division, and the bulk of the research
and analysis conducted by "media leads" in the Air and Waste Management
Division and the Water Management Division.
Sources: Environmental Monitoring Networks and Data Bases
In conducting research for this report, Region VIII staff made an
exhaustive analysis of the available data on environmental conditions in
Region VIII. Data from over a score of environmental monitoring networks were
reviewed. Sources included reports such as the Water Quality Reports prepared
by each state as required by Section 305b of the Clean Water Act. Sources
also included data bases such as STORET (STOrage and RETrieval of Water
Quality Data), SAROAD (Storage And Retrieval Of Aerometric Data), FRDS
(Federal Reporting Data System for the drinking water program), NEDS (National
Emissions Data System), and other data bases maintained by local, state and
federal pollution control agencies.
image:
INTRODUCTION
This report documents current environmental conditions as a "baseline"
of environmental quality in Region VIII. The success of this report will be
measured in the short run by how well EPA's managers use the data and
conclusions in this report to help focus abatement and prevention efforts more
directly on the most significant problems in the region. For the long term
the greatest value of this report may be that it establishes a benchmark
against which future environmental conditions can be measured.
EPA's Environmental Management Reports
In November of 1982 EPA's Assistant Adminsistrator for Policy and
Resource Management directed each regional office by May, 1983 to prepare an
intermedia assessment of the "most significant environmental problems" in the
region. The expressed purpose was to identify program and resource priorities
more clearly so that the agency could do a better job of "managing for
environmental results."
The regions were specifically asked to prepare detailed reports ranking
regional environmental problems in priority order and describing the resulting
Implications for regional and national environmental protection strategies.
The environmental management reports {EMR's) are planned as an agency
pilot project for Fiscal Year 1983. In future years the EMR's may be linked
directly to development of agency budgets, program and operating year
guidance, state/EPA agreements and grant negotiations, as well as agency goals
and performance standards.
Compiling the EMR in Region VIII
Compiling this report in Region VIII was a cooperative, region-wide
effort involving many technical and program staff. A Region VIII "EMR
Workgroup" was formed of one or more staff members from each of the eight
media, and several members of the region's data analysis staff. The primary
responsibility for direction and coordination of the EMR in the region was
with the Office of Management Systems and Analysis, with data analysis support
provided by the Environmental Services Division, and the bulk of the research
and analysis conducted by "media leads" in the Air and Waste Management
Division and the Water Management Division.
Sources: Environmental Monitoring Networks and Data Bases
In conducting research for this report, Region VIII staff made an
exhaustive analysis of the available data on environmental conditions in
Region VIII. Data from over a score of environmental monitoring networks were
reviewed. Sources included reports such as the Water Quality Reports prepared
by each state as required by Section 305b of the Clean Water Act. Sources
also included data bases such as STORET (STOrage and RETrieval of Water
Quality Data), SAROAD (Storage And Retrieval Of Aerometric Data), FRDS
(Federal Reporting Data System for the drinking water program), NEDS (National
Emissions Data System), and other data bases maintained by local, state and
federal pollution control agencies.
image:
 image:
 Criteria Definition and Problem Identification
Within each of the eight media, Region VIII staff identified problems
requiring abatement, potential degradation problems requiring prevention, and
emerging problems, for which little documentation exists but which will be
cause for concern in the future.
For example, specific geographic areas with air quality problems were
identified by reviewing monitoring data for criteria pollutants, non-criteria
pollutants, visibility, acid deposition, and other measures. "Significant"
abatement problems were identified in areas where the data indicate that, for
the pollutant in question, ambient standards are being violated and it is
anticipated that standards will continue to be violated past the statutory
attainment dates. Serious potential for degradation of air quality was
identified where growth in emission levels was projected to occur at a rate
that would result in either the available PSD increment being consumed or
ambient standards being violated within ten years.
As another example, "significant" water quality problems requiring
abatement were identified in those stream segments or water bodies where
pollutant concentrations were so high that one or more of the designated
beneficial uses were impaired. Serious potential for water quality
degradation was indicated where current uses were being met but there was
evidence that the current uses were liekly to be threatened in the future.
Computer-enhanced analysis of pollutant parameters was used to break down
a vast array of data, apply the problem selection criteria, and identify the"'"
most significant problems in a location-by-location geographical analysis.
Analysis and Conclusions
After Region VIII staff refined and applied the criteria, reviewed the
data, and reached preliminary conclusions, they compiled a comprehensive list
of the Region's significant pollution problems, medium-by-medium,
state-by-state, and site-by-site. The causes of the region's pollution
problems were identified, where possible, and barriers to solving the problems
were listed. Program staff and media leads identified actions the regional
office or state pollution control agencies have taken or planned to address
the pollution problems cited. They also identified what assistance the States
and the Region require from EPA Headquarters offices to deal effectively with
regional pollution problems.
The following section is an Executive Summary of the major problems and
conclusions in each program area. Following that are the eight media sections
of the report.
image:
Criteria Definition and Problem Identification
Within each of the eight media, Region VIII staff identified problems
requiring abatement, potential degradation problems requiring prevention, and
emerging problems, for which little documentation exists but which will be
cause for concern in the future.
For example, specific geographic areas with air quality problems were
identified by reviewing monitoring data for criteria pollutants, non-criteria
pollutants, visibility, acid deposition, and other measures. "Significant"
abatement problems were identified in areas where the data indicate that, for
the pollutant in question, ambient standards are being violated and it is
anticipated that standards will continue to be violated past the statutory
attainment dates. Serious potential for degradation of air quality was
identified where growth in emission levels was projected to occur at a rate
that would result in either the available PSD increment being consumed or
ambient standards being violated within ten years.
As another example, "significant" water quality problems requiring
abatement were identified in those stream segments or water bodies where
pollutant concentrations were so high that one or more of the designated
beneficial uses were impaired. Serious potential for water quality
degradation was indicated where current uses were being met but there was
evidence that the current uses were liekly to be threatened in the future.
Computer-enhanced analysis of pollutant parameters was used to break down
a vast array of data, apply the problem selection criteria, and identify the"'"
most significant problems in a location-by-location geographical analysis.
Analysis and Conclusions
After Region VIII staff refined and applied the criteria, reviewed the
data, and reached preliminary conclusions, they compiled a comprehensive list
of the Region's significant pollution problems, medium-by-medium,
state-by-state, and site-by-site. The causes of the region's pollution
problems were identified, where possible, and barriers to solving the problems
were listed. Program staff and media leads identified actions the regional
office or state pollution control agencies have taken or planned to address
the pollution problems cited. They also identified what assistance the States
and the Region require from EPA Headquarters offices to deal effectively with
regional pollution problems.
The following section is an Executive Summary of the major problems and
conclusions in each program area. Following that are the eight media sections
of the report.
image:
 image:
 EXECUTIVE SUMMARY
REGION VIII ENVIRONMENTAL MANAGEMENT REPORT
I. AIR qUALITY
Region VIII air quality problems are categorized into two classes: those
associated with the urban/industrial nonattainment areas and those associated
with the emerging development of natural resources near PSD (Prevention of
Significant Deterioration of Air Quality) Class I areas.
Major. Air Quality Problems: Participates and Carbon Monoxide
Total Suspended Parti oil ates (JSP.) was still the most widespread problem
in the Region in 1981, although carbon monoxide (J£) concentrations in the
region's populated areas continue to be the most aggravating problem affecting
the most people.
Of the 49 counties in the Region in 1981 having monitoring stations
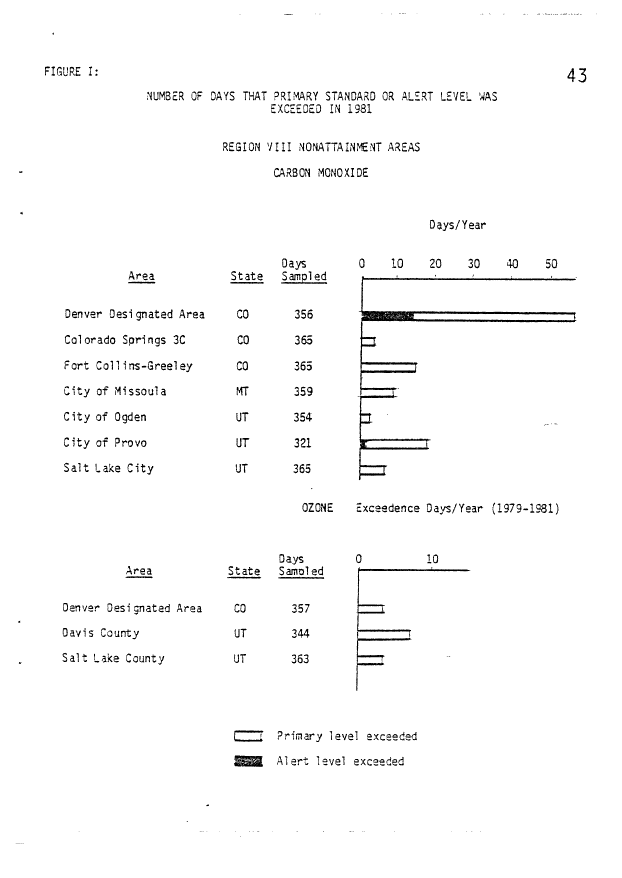
reporting pollutant levels in excess of the primary standard, 311 or 63% of
those were for TSP exceedances while 9, or 19% were for excessive^CO
concentrations; 6 were for 03 (ozone); 1 for SO? (sulfur dioxide); 1 for
NCJ2 (nitrogen dioxide); and 1 for lead.
Major Causes of Carbon Monoxide and Barriers to Attainment
The CO problems in Colorado (Metro-Denver, Fort Collins, Greeley, and
Colorado Springs), Utah (Sal t Lake City), and Montana (Missoula, Billings, and
Great Falls) are caused by mobile sources. The principal barrier to
achievement of the CO standard is the lack of enough effective and enforceable
transportation control strategies that have acceptable costs and do not entail
severe social impacts.
Major Causes of TSP and Barriers to Attainment
The TSP problems in the Region are generally caused by auto and truck
exhaust, power plants, smelters, steel plants, unpaved roads, and construction
work. The principal barriers to achievement of the TSP standard include:
(a) the difficulty and the cost of controlling the nontraditional sources,
such as fireplaces, wood stoves, street cleaning, sanding, construction work,
etc. (b) the dry, windy conditions typical in Region VIII which encourage the
reentrainment of fugitive dust, and (c) the uncertainties resulting from the
proposed change to an inhalable parti cul ate standard.
image:
EXECUTIVE SUMMARY
REGION VIII ENVIRONMENTAL MANAGEMENT REPORT
I. AIR qUALITY
Region VIII air quality problems are categorized into two classes: those
associated with the urban/industrial nonattainment areas and those associated
with the emerging development of natural resources near PSD (Prevention of
Significant Deterioration of Air Quality) Class I areas.
Major. Air Quality Problems: Participates and Carbon Monoxide
Total Suspended Parti oil ates (JSP.) was still the most widespread problem
in the Region in 1981, although carbon monoxide (J£) concentrations in the
region's populated areas continue to be the most aggravating problem affecting
the most people.
Of the 49 counties in the Region in 1981 having monitoring stations
reporting pollutant levels in excess of the primary standard, 311 or 63% of
those were for TSP exceedances while 9, or 19% were for excessive^CO
concentrations; 6 were for 03 (ozone); 1 for SO? (sulfur dioxide); 1 for
NCJ2 (nitrogen dioxide); and 1 for lead.
Major Causes of Carbon Monoxide and Barriers to Attainment
The CO problems in Colorado (Metro-Denver, Fort Collins, Greeley, and
Colorado Springs), Utah (Sal t Lake City), and Montana (Missoula, Billings, and
Great Falls) are caused by mobile sources. The principal barrier to
achievement of the CO standard is the lack of enough effective and enforceable
transportation control strategies that have acceptable costs and do not entail
severe social impacts.
Major Causes of TSP and Barriers to Attainment
The TSP problems in the Region are generally caused by auto and truck
exhaust, power plants, smelters, steel plants, unpaved roads, and construction
work. The principal barriers to achievement of the TSP standard include:
(a) the difficulty and the cost of controlling the nontraditional sources,
such as fireplaces, wood stoves, street cleaning, sanding, construction work,
etc. (b) the dry, windy conditions typical in Region VIII which encourage the
reentrainment of fugitive dust, and (c) the uncertainties resulting from the
proposed change to an inhalable parti cul ate standard.
image:
 Ozone
The metropolitan Denver and Salt Lake City areas are the only two areas in
Region VIII that are nonattairment for ozone. The ozone problem is
predominately caused by motor vehicle emissions, e.g., in Denver about 80% of
the VOC and 30£ of the NOX emissions are from mobile sources. EPA Region
VIII expects both Denver and Salt Lake City to be able to meet the ozone
standard by 1987.
Lead
Lead is emitted from point sources, fugitive smelter sources, and also
reentrained from streets and soil from areas that have been contaminated for
years. The ASARCO lead smelter in East Helena, Montana is causing violations
of the lead HAAQS. The principal barrier to achievenent of the lead standard
is the cost of cleaning up the causes of the problsn. The State of Montana
plans to submit a SIP revision for attainment of the lead standard in the
spring of 1S83. Region VIII requests assistance in several areas.
Acid Deposition and Other Air Pollution Effects on the Air Quality Related
Values of Class I Areas.
The Federal Land Managers of Class I areas have been given the affirmative
responsibility by the Clean Air Act to protect the air quality related values
of the lands they manage. Air quality related values (AQRV) include
visibility, flora, fauna, soils, and water. The PSD regulations require the
impacts of PSD sources emissions on a Class I area's AQRV to be investigated
and quantified. If a proposed PSD source will cause adverse impacts on the
AQRV of a Class I area, the PSD permit can be denied.
Presently, AQRV are of particular concern for the Colorado Flat Tops and
Mt. Zirkel Wilderness areas and the North Dakota Theodore Roosevelt National
Park. The former areas may be adversely affected by large scale development
of oil shale reserves. New power plants, synfuel plants, and oil and gas
fields are threatening the AQRV of Roosevelt National Park.
Acid deposition may already be a problem in the high altitude lakes in
Colorado. These high altitude lakes are extremely sensitive to changes caused
by acid deposition. Two limited Colorado studies suggest that several lakes
have already been affected by acid deposition caused by S02 and N0£
emissions.
Regional visibility impairment in Flat Tops Wilderness and Colorado's
western slope may also result from large scale industrial development.
The principal barriers to the adequate analysis of the effects of acid
deposition and other air pollutants on AQRV are: a) the lack of adequate
predictive modeling tools that attempt to quantify the source receptor
relationships between acid deposition and other pollutants, and AQRV, and b)
the lack of adequate data to define baseline conditions for various air
quality related values, such as the baseline conditions of high altitude lakes
in the Flat Tops Wilderness.
image:
Ozone
The metropolitan Denver and Salt Lake City areas are the only two areas in
Region VIII that are nonattairment for ozone. The ozone problem is
predominately caused by motor vehicle emissions, e.g., in Denver about 80% of
the VOC and 30£ of the NOX emissions are from mobile sources. EPA Region
VIII expects both Denver and Salt Lake City to be able to meet the ozone
standard by 1987.
Lead
Lead is emitted from point sources, fugitive smelter sources, and also
reentrained from streets and soil from areas that have been contaminated for
years. The ASARCO lead smelter in East Helena, Montana is causing violations
of the lead HAAQS. The principal barrier to achievenent of the lead standard
is the cost of cleaning up the causes of the problsn. The State of Montana
plans to submit a SIP revision for attainment of the lead standard in the
spring of 1S83. Region VIII requests assistance in several areas.
Acid Deposition and Other Air Pollution Effects on the Air Quality Related
Values of Class I Areas.
The Federal Land Managers of Class I areas have been given the affirmative
responsibility by the Clean Air Act to protect the air quality related values
of the lands they manage. Air quality related values (AQRV) include
visibility, flora, fauna, soils, and water. The PSD regulations require the
impacts of PSD sources emissions on a Class I area's AQRV to be investigated
and quantified. If a proposed PSD source will cause adverse impacts on the
AQRV of a Class I area, the PSD permit can be denied.
Presently, AQRV are of particular concern for the Colorado Flat Tops and
Mt. Zirkel Wilderness areas and the North Dakota Theodore Roosevelt National
Park. The former areas may be adversely affected by large scale development
of oil shale reserves. New power plants, synfuel plants, and oil and gas
fields are threatening the AQRV of Roosevelt National Park.
Acid deposition may already be a problem in the high altitude lakes in
Colorado. These high altitude lakes are extremely sensitive to changes caused
by acid deposition. Two limited Colorado studies suggest that several lakes
have already been affected by acid deposition caused by S02 and N0£
emissions.
Regional visibility impairment in Flat Tops Wilderness and Colorado's
western slope may also result from large scale industrial development.
The principal barriers to the adequate analysis of the effects of acid
deposition and other air pollutants on AQRV are: a) the lack of adequate
predictive modeling tools that attempt to quantify the source receptor
relationships between acid deposition and other pollutants, and AQRV, and b)
the lack of adequate data to define baseline conditions for various air
quality related values, such as the baseline conditions of high altitude lakes
in the Flat Tops Wilderness.
image:
 Distribution of Air Quality Problems Across the Region
Col orado has six urban/industri al nonattainment areas. Of the six,
metropolitan Denver is the most significant problem area in terms of affected
geographic area, frequency of alerts and violation days, and magnitude of
pollutant levels for TSP, CO and 03. In Montana, CO, TSP, and lead are the
pollutants of most concern. North Dakota has no nonattainnent areas. A very
significant air quality management problem in the State, however, has been the
predicted consimption of the PSD Management Class I S02 increment at the
Theodore Roosevelt National Parks. South Dakota's only nonattainment area is
Rapid City, where TSP is the problem. The Wasatch Front (Salt Lake, Weber,
Davis, Utah, and Tooele Counties) is the area in Utah with the most
significant air pollution problems. Utah, like Colorado has significant
natural resources which are being developed in PSD clean air areas.
Sweetwater County, Wyoming, the State's only nonattainment area (for TS?), is
believed to have achieved attainment by the end of 1982.
Potential Air Quality Problans on Indian Reservations within Region VIII.
Indian tribes in Region VIII are generally very interested in preserving
their excellent air quality. The Northern Cheyennes (MT) and Flathead Indians
(MT) have already redesignated their reservations to PSD Class I. Development
of energy resources near the reservations may create Class I or Class II PSD
increment violations on the reservations. Other reservations, such as the
Crow Indi an Reservation are interested in developing their mineral resources.
Such development can produce air quality problems on their reservation as well
as on neighboring lands. Presently, EPA grants are being used by Indian
tribes for baseline data collection, regulation., development, and PSD area
redesi gnation studies.
Emerging Air Quality Issues: Acid Rain, Indian Lands, Transport Models and
Visibility Deterioration
Looking to the future, a list of emerging air quality issues in Region 8's
Rocky Mountain and Northern PI ains states includes: (1) Acid deposition;
(2) Emissions from diesel vehicles; (3) Organic compound and particulate
emissions from wood stoves and fireplaces; (4) Indoor air pollution; (5)
Availability of complex terrain and long range transport and diffusion models;
(6) Cadmium and arsenic levels in East Helena; and (7) Potential air quality
problems on Indian Reservations within Region VIII.
image:
Distribution of Air Quality Problems Across the Region
Col orado has six urban/industri al nonattainment areas. Of the six,
metropolitan Denver is the most significant problem area in terms of affected
geographic area, frequency of alerts and violation days, and magnitude of
pollutant levels for TSP, CO and 03. In Montana, CO, TSP, and lead are the
pollutants of most concern. North Dakota has no nonattainnent areas. A very
significant air quality management problem in the State, however, has been the
predicted consimption of the PSD Management Class I S02 increment at the
Theodore Roosevelt National Parks. South Dakota's only nonattainment area is
Rapid City, where TSP is the problem. The Wasatch Front (Salt Lake, Weber,
Davis, Utah, and Tooele Counties) is the area in Utah with the most
significant air pollution problems. Utah, like Colorado has significant
natural resources which are being developed in PSD clean air areas.
Sweetwater County, Wyoming, the State's only nonattainment area (for TS?), is
believed to have achieved attainment by the end of 1982.
Potential Air Quality Problans on Indian Reservations within Region VIII.
Indian tribes in Region VIII are generally very interested in preserving
their excellent air quality. The Northern Cheyennes (MT) and Flathead Indians
(MT) have already redesignated their reservations to PSD Class I. Development
of energy resources near the reservations may create Class I or Class II PSD
increment violations on the reservations. Other reservations, such as the
Crow Indi an Reservation are interested in developing their mineral resources.
Such development can produce air quality problems on their reservation as well
as on neighboring lands. Presently, EPA grants are being used by Indian
tribes for baseline data collection, regulation., development, and PSD area
redesi gnation studies.
Emerging Air Quality Issues: Acid Rain, Indian Lands, Transport Models and
Visibility Deterioration
Looking to the future, a list of emerging air quality issues in Region 8's
Rocky Mountain and Northern PI ains states includes: (1) Acid deposition;
(2) Emissions from diesel vehicles; (3) Organic compound and particulate
emissions from wood stoves and fireplaces; (4) Indoor air pollution; (5)
Availability of complex terrain and long range transport and diffusion models;
(6) Cadmium and arsenic levels in East Helena; and (7) Potential air quality
problems on Indian Reservations within Region VIII.
image:
 II. WATER QUALITY
The Water Quality Section of our Environmental Management Report presents
for each state a narrative description of the more significant water quality
problems. It provides maps showing priority problem areas, with tables
designating the priority stream segments, and listing the water quality
problems by source category.
Region VIII enjoys generally high water quality. We are committed to
restoring water quality where it has been degraded and preserving the existing
high quality waters which are so valuable to the people of this Region.
Data Gap; More Monitoring and Biological Data is Needed
Water quality in Region VIII streams is highly correlated with seasonal
fluctuations in the natural hydrologic cycle and it is often difficult to
obtain clear indications that impaired beneficial uses are due to high
concentrations of chemical or other non-natural pollutants. Even so, a more
serious impediment to detecting provable trends of water quality is the
scarcity of regular monitoring data from potential problem segments. The most
significant data gap in Region VIII is that biological data is virtually
absent. This deficiency will greatly hinder Region VIII's ability to develop
recommendations for site-specific water quality standards and to evaluate
whether designated uses are realistic.
Some Beneficial Uses of Water Are Impaired
Aquatic life protection uses and recreational water uses are the uses most
frequently impaired by pollution in Region VIII. To a lesser extent, waters
designated for use as a public water supply and for agricultural use are also
impaired. Fecal coliform from nonpoint sources and inadequately treated
wastewater cause frequent recreational use impairments. Sediment, nutrients
and salinity are the parameters which are responsible for most of the use
impairment observed in Region VIII.
Few Uses Are Severely Impaired, Making Water Quality Very High in Region VIII
The quality of surface waters in Region VIII is quite good. Less than
half of the designated beneficial uses are moderately impaired and less than
10% of designated beneficial uses appear to be severely impaired. In fact,
one challenge we face is to maintain the high quality of waters in this region.
Municipal Wastev/ater Pollutants Have Greatest Impact of Aquatic Life
Un-ionized ammonia, low dissolved oxygen and elevated nutrients are the
parameters associated with municipal wastewater treatment facilities which
appear to be having the greatest effect on aquatic life. Cadmium, copper,
lead and zinc contamination from active, inactive or abandoned mining opera-
tions are also suspected of having severe effects on aquatic life.
image:
II. WATER QUALITY
The Water Quality Section of our Environmental Management Report presents
for each state a narrative description of the more significant water quality
problems. It provides maps showing priority problem areas, with tables
designating the priority stream segments, and listing the water quality
problems by source category.
Region VIII enjoys generally high water quality. We are committed to
restoring water quality where it has been degraded and preserving the existing
high quality waters which are so valuable to the people of this Region.
Data Gap; More Monitoring and Biological Data is Needed
Water quality in Region VIII streams is highly correlated with seasonal
fluctuations in the natural hydrologic cycle and it is often difficult to
obtain clear indications that impaired beneficial uses are due to high
concentrations of chemical or other non-natural pollutants. Even so, a more
serious impediment to detecting provable trends of water quality is the
scarcity of regular monitoring data from potential problem segments. The most
significant data gap in Region VIII is that biological data is virtually
absent. This deficiency will greatly hinder Region VIII's ability to develop
recommendations for site-specific water quality standards and to evaluate
whether designated uses are realistic.
Some Beneficial Uses of Water Are Impaired
Aquatic life protection uses and recreational water uses are the uses most
frequently impaired by pollution in Region VIII. To a lesser extent, waters
designated for use as a public water supply and for agricultural use are also
impaired. Fecal coliform from nonpoint sources and inadequately treated
wastewater cause frequent recreational use impairments. Sediment, nutrients
and salinity are the parameters which are responsible for most of the use
impairment observed in Region VIII.
Few Uses Are Severely Impaired, Making Water Quality Very High in Region VIII
The quality of surface waters in Region VIII is quite good. Less than
half of the designated beneficial uses are moderately impaired and less than
10% of designated beneficial uses appear to be severely impaired. In fact,
one challenge we face is to maintain the high quality of waters in this region.
Municipal Wastev/ater Pollutants Have Greatest Impact of Aquatic Life
Un-ionized ammonia, low dissolved oxygen and elevated nutrients are the
parameters associated with municipal wastewater treatment facilities which
appear to be having the greatest effect on aquatic life. Cadmium, copper,
lead and zinc contamination from active, inactive or abandoned mining opera-
tions are also suspected of having severe effects on aquatic life.
image:
 7
Non-Point Sources Account for 90% of the Region's Water Quality Problems
Ncnpoint source pollution constitutes the principal cause of the water
quality problems in Region VIII, with some states reporting that over 90% of
their water quality problems are due to natural and hum an-induced non point
source pollution.
The Region's Major Water Quality Problems
Several observations summarize Region VIll's water quality problems:
0 Nonpoint source loadings of nutrients, sediment and salinity
constitute the major causes of water quality standards violations in
Region VIII.
0 Municipal discharges of amionia, chlorine, organic material and
bacteria present the greatest impediment to achieving the 1983
fishable/swimmable goals of the Clean Water Act.
0 Discharges of heavy metals from inactive/abandoned mines present the
greatest nonmunicipal source of toxics which threaten the fishable
goal of the Clean Water Act.
For the Future: Protecting High Quality Waters...
Implementing pollution control regulations on high quality waters has been
difficult in Region VIII. Many of the water bodies in Region VIII are of high
quality, i.e. those with quality better than the 1983 goals, and the Region is
in the process of developing a procedure to: 1) define existing quality
through a computerized, flow-weighted analysis, and 2) define significant
change in existing quality. Because most of our (State and EPA) monitoring
efforts have been concentrated in areas where we have water quality problems,
the lack of water quality data and flow monitoring are frustrating our efforts
in high quality areas.
...and Redirecting Programs from Control Technology Based Programs
to Beneficial Uses
One major programmatic implication apparent to Region VIII managers is
that lack of sufficient funds, qualified personnel and data, especially
biological data, are the major obstacles which impede the successful
implementation of the use-oriented water quality control program articulated
in the proposed regulations. For the past ten years EPA and the states have
directed program funding, resources and data collection toward a
treatment-technology-based control program. Little attention has been
directed toward the benefici al-use-oriented control strategies envisioned in
the proposed regulations. As a result, State personnel and regional EPA staff
will have to be creative, adaptive and assertive enough to redirect existing
programs to accomodate these new strategies as they are developed and focus on
a water quality control program which is oriented to preserving and restoring
beneficial uses of the region's water resources.
image:
7
Non-Point Sources Account for 90% of the Region's Water Quality Problems
Ncnpoint source pollution constitutes the principal cause of the water
quality problems in Region VIII, with some states reporting that over 90% of
their water quality problems are due to natural and hum an-induced non point
source pollution.
The Region's Major Water Quality Problems
Several observations summarize Region VIll's water quality problems:
0 Nonpoint source loadings of nutrients, sediment and salinity
constitute the major causes of water quality standards violations in
Region VIII.
0 Municipal discharges of amionia, chlorine, organic material and
bacteria present the greatest impediment to achieving the 1983
fishable/swimmable goals of the Clean Water Act.
0 Discharges of heavy metals from inactive/abandoned mines present the
greatest nonmunicipal source of toxics which threaten the fishable
goal of the Clean Water Act.
For the Future: Protecting High Quality Waters...
Implementing pollution control regulations on high quality waters has been
difficult in Region VIII. Many of the water bodies in Region VIII are of high
quality, i.e. those with quality better than the 1983 goals, and the Region is
in the process of developing a procedure to: 1) define existing quality
through a computerized, flow-weighted analysis, and 2) define significant
change in existing quality. Because most of our (State and EPA) monitoring
efforts have been concentrated in areas where we have water quality problems,
the lack of water quality data and flow monitoring are frustrating our efforts
in high quality areas.
...and Redirecting Programs from Control Technology Based Programs
to Beneficial Uses
One major programmatic implication apparent to Region VIII managers is
that lack of sufficient funds, qualified personnel and data, especially
biological data, are the major obstacles which impede the successful
implementation of the use-oriented water quality control program articulated
in the proposed regulations. For the past ten years EPA and the states have
directed program funding, resources and data collection toward a
treatment-technology-based control program. Little attention has been
directed toward the benefici al-use-oriented control strategies envisioned in
the proposed regulations. As a result, State personnel and regional EPA staff
will have to be creative, adaptive and assertive enough to redirect existing
programs to accomodate these new strategies as they are developed and focus on
a water quality control program which is oriented to preserving and restoring
beneficial uses of the region's water resources.
image:
 III. DRINKING WATER QUALITY
In Region VIII's six states, there are 3,136 community water systems
serving 7,463,000 people and 5,536 non-community water systems serving a
non-resident population of approximately 700,000 people. Most of these
systems are small and use ground water as a source of supply.
Region VIII is characterized by its rural nature, having over 7 million
people scattered across 578,000 square miles of land; or roughly 13 people per
square mile. One third of these people live in cities greater than 100,000,
but most of Region VIII is made up of small towns. Seventy percent of the
community water systems in the region serve fewer than 1,000 people;
ninety-nine percent of these community water systems serve fewer than 100,000
people.
Small System Problems Predominate in Region VIII
State and nationwide studies have shown that small water systems (those
serving fewer than 1,000 people) are the systems which have the most problems
in consistently providing safe drinking water. Typically, these systems rely
on untreated ground water, unfiltered surface water or poorly protected springs
for their source of supply. This, in combination with low water rates that
can not support improvements or adequate operation, result in public health
dilemmas.
Coliform Bacteria Violations Have Decreased - ~
Throughout the region, coliform bacteria violations, both maximum
contaminant levels (MCL) and monitoring and reporting violations, have
decreased between October 1978 and the present. The number of monitoring
violations is substantially higher than the number of MCL violations. In
fiscal year 1981, 30% of the systems failed at some time either to monitor or
to report a violation.
During FY '79, there were 634 violations of the maximum contaminant level
(MCL) for bacteria throughout the Region. Since that time, these violations
have decreased markedly. This trend, attributable to improved treatment and
sampling techniques, is encouraging since the presence of coliform bacteria in
drinking water is an indication of the disease-causing potential of the
drinking water.
Persistent Violators of Bacteria MCL Have Decreased to 10%
What is of more concern than simply the number of violations, is the
number of systems that are considered persistent violators. These systems
violate the bacteria standard for 4 or more months in a year, or more than one
quarter in a calendar year. The percentage of persistent violators has
decreased from 19% (1979) to a 1982 level of 10%. However, this percentage
still represents a sizable portion of the systems which are consistently out
of compliance.
image:
III. DRINKING WATER QUALITY
In Region VIII's six states, there are 3,136 community water systems
serving 7,463,000 people and 5,536 non-community water systems serving a
non-resident population of approximately 700,000 people. Most of these
systems are small and use ground water as a source of supply.
Region VIII is characterized by its rural nature, having over 7 million
people scattered across 578,000 square miles of land; or roughly 13 people per
square mile. One third of these people live in cities greater than 100,000,
but most of Region VIII is made up of small towns. Seventy percent of the
community water systems in the region serve fewer than 1,000 people;
ninety-nine percent of these community water systems serve fewer than 100,000
people.
Small System Problems Predominate in Region VIII
State and nationwide studies have shown that small water systems (those
serving fewer than 1,000 people) are the systems which have the most problems
in consistently providing safe drinking water. Typically, these systems rely
on untreated ground water, unfiltered surface water or poorly protected springs
for their source of supply. This, in combination with low water rates that
can not support improvements or adequate operation, result in public health
dilemmas.
Coliform Bacteria Violations Have Decreased - ~
Throughout the region, coliform bacteria violations, both maximum
contaminant levels (MCL) and monitoring and reporting violations, have
decreased between October 1978 and the present. The number of monitoring
violations is substantially higher than the number of MCL violations. In
fiscal year 1981, 30% of the systems failed at some time either to monitor or
to report a violation.
During FY '79, there were 634 violations of the maximum contaminant level
(MCL) for bacteria throughout the Region. Since that time, these violations
have decreased markedly. This trend, attributable to improved treatment and
sampling techniques, is encouraging since the presence of coliform bacteria in
drinking water is an indication of the disease-causing potential of the
drinking water.
Persistent Violators of Bacteria MCL Have Decreased to 10%
What is of more concern than simply the number of violations, is the
number of systems that are considered persistent violators. These systems
violate the bacteria standard for 4 or more months in a year, or more than one
quarter in a calendar year. The percentage of persistent violators has
decreased from 19% (1979) to a 1982 level of 10%. However, this percentage
still represents a sizable portion of the systems which are consistently out
of compliance.
image:
 Turbidity Increases Potential of Glardiasis, Especially in Small Systems
Unfiltered water sources are a particular problem due to the occurrence
of high turbidity during run off periods which interferes with disinfection
and increases the presence of chlorine resistant Giardla lanblia cysts. In
the past 3 years, 17 outbreaks of giardiasis have occurred in the region, most
of them in small systems.
Turbidity Compliance Has Improved
In FY 1979, 81% of the surface waters in the region met all the
requirements of the turbidity regulations. Persistent violators represented
9% of all systems. Compliance has improved by 8% so that in FY 1982, 89% of
the systems were in compliance, and the percentage of persistent violators was
decreased to 5%.
Inorganl c and Radi ol ogi cal Chemi cal MCL Viol ati ons
A number of systems have been found to exceed the standards set for
inorganic chemicals. Over one hundred communities, 3% throughout the region,
have been found to be in violation of these standards.
Currently there are 86 communities in Region VIII exceeding the fluoride
MCL, 33 exceeding the nitrate MCL, 8 exceeding the selenium MCL and 5
communities exceeding the arsenic standard. These contamination incidents are
results from the presence of natural contaminants in deep aquifers, or from
poor well drilling practices which lead to nitrate contamination. All of
these contaminants are known to have public health implications.
Trihalcmethanes (THM) + Other Organic Chemicals May be a Problem in the Future
In Region VIII only 106 systems are large enough to test for trihalo-
methanes. This group of organic chemicals, suspected carcinogens, has been
found in levels higher than the MCL in only 2 systems. More systems are
expected to find this chemical as sampling is completed. A change in
treatment technique may be required for renoval.
In an attempt to determine the extent of occurrence of volatile organic
chemicals in ground water systems, the Office of Drinking Water Headquarters
conducted a study of ground water sources throughout the country in 1980 for
Region VIII systems. Over half of the samples tested contained trace amounts
of either tri halonethanes or volatile organic chemicals. Eighteen percent of
the systems contained only trace anounts of volatile organics. This is
slightly better than the national average of 24%.
Drinking Water Quality on Indian Lands
Numerous Indian tribes have traditionally made their home in the six
state region comprising Region VIII. Presently, 25 tribes reside on 23 Indian
Reservations. Inadequate treatment and little, if any, operation and
maintenance contribute to the problem of intermittent quality of drinking
water on Indi an Reservations .
image:
Turbidity Increases Potential of Glardiasis, Especially in Small Systems
Unfiltered water sources are a particular problem due to the occurrence
of high turbidity during run off periods which interferes with disinfection
and increases the presence of chlorine resistant Giardla lanblia cysts. In
the past 3 years, 17 outbreaks of giardiasis have occurred in the region, most
of them in small systems.
Turbidity Compliance Has Improved
In FY 1979, 81% of the surface waters in the region met all the
requirements of the turbidity regulations. Persistent violators represented
9% of all systems. Compliance has improved by 8% so that in FY 1982, 89% of
the systems were in compliance, and the percentage of persistent violators was
decreased to 5%.
Inorganl c and Radi ol ogi cal Chemi cal MCL Viol ati ons
A number of systems have been found to exceed the standards set for
inorganic chemicals. Over one hundred communities, 3% throughout the region,
have been found to be in violation of these standards.
Currently there are 86 communities in Region VIII exceeding the fluoride
MCL, 33 exceeding the nitrate MCL, 8 exceeding the selenium MCL and 5
communities exceeding the arsenic standard. These contamination incidents are
results from the presence of natural contaminants in deep aquifers, or from
poor well drilling practices which lead to nitrate contamination. All of
these contaminants are known to have public health implications.
Trihalcmethanes (THM) + Other Organic Chemicals May be a Problem in the Future
In Region VIII only 106 systems are large enough to test for trihalo-
methanes. This group of organic chemicals, suspected carcinogens, has been
found in levels higher than the MCL in only 2 systems. More systems are
expected to find this chemical as sampling is completed. A change in
treatment technique may be required for renoval.
In an attempt to determine the extent of occurrence of volatile organic
chemicals in ground water systems, the Office of Drinking Water Headquarters
conducted a study of ground water sources throughout the country in 1980 for
Region VIII systems. Over half of the samples tested contained trace amounts
of either tri halonethanes or volatile organic chemicals. Eighteen percent of
the systems contained only trace anounts of volatile organics. This is
slightly better than the national average of 24%.
Drinking Water Quality on Indian Lands
Numerous Indian tribes have traditionally made their home in the six
state region comprising Region VIII. Presently, 25 tribes reside on 23 Indian
Reservations. Inadequate treatment and little, if any, operation and
maintenance contribute to the problem of intermittent quality of drinking
water on Indi an Reservations .
image:
 10
Additional Contaminants
The extent of present contanination of drinking water is only beginning
to be discovered. Chemicals for which there are no MCLs, no sampling require-
ments and in some cases, difficult detection procedures, continue to be dis-
covered in aquifers and surface waters feeding Region VIII drinking water
systems.
Measures to Get Setter Water to Drink
By increased treatment, blending or changing sources, improvements in
some comnuni ties' drinking water have been made. In South Dakota, for
example, of the estimated 95 communities in violation of standards, including
those for inorganic chemicals, 22 have corrected the problem and 28 have
approved preliminary plans to correct their problems. Region wide the
improvement rate is not quite so impressive, since less than 37% of the
violating systems have improved or have developed plans to make improvements.
10
image:
10
Additional Contaminants
The extent of present contanination of drinking water is only beginning
to be discovered. Chemicals for which there are no MCLs, no sampling require-
ments and in some cases, difficult detection procedures, continue to be dis-
covered in aquifers and surface waters feeding Region VIII drinking water
systems.
Measures to Get Setter Water to Drink
By increased treatment, blending or changing sources, improvements in
some comnuni ties' drinking water have been made. In South Dakota, for
example, of the estimated 95 communities in violation of standards, including
those for inorganic chemicals, 22 have corrected the problem and 28 have
approved preliminary plans to correct their problems. Region wide the
improvement rate is not quite so impressive, since less than 37% of the
violating systems have improved or have developed plans to make improvements.
10
image:
 IV. GROUND WATER QUALITY
90% of the Region Relies on Ground Water
In the region's six states, there are 3,136 community water systems and
5,536 non-comnunity water systems, of which over 90 percent obtain all or part
of their supplies from ground water aquifers. Approximately 95 percent of the
region's population in the rural areas obtains their sole water supply from
private wells.
Few Instances of Disease or Poisonings Have Been Reported
Few instances of waterborne disease or chemical poisoning due to
contaminated ground water have been reported in the Region. This may be
attributed in part to the fact that adverse health effects, resulting from low
level exposure to organic and inorganic constituents are often not noticed
over the short term and are seldom reported. Some of the risk, (such as
nitrate exposure to pregnant women) is avoided by using bottled water.
Additionally, hazardous waste contaminations have not yet occurred in areas of
ground water use, and exposure has thus far been avoided.
Yet Surveys Show Observable Levels of Contaminants Throughout the Region
A survey conducted on a random sanple of ground water systems in the
Region in 1980 found traces of trihalcmenthanes and volatile organics in 56
percent of the community well systems.
The regional agricultural areas suffer from saline increases due to
irrigation practices notably in the Grand Valley, Uncompahgre Valley, the
Arkansas Valley of Colorado, and the northeastern plains of Colorado in the
Oga 11 al a Aquifer and the Unita Valley of Utah.
Increasing concentrations of nitrates occur in the Big Sioux Valley of
South Dakota and South Platte Valley of Colorado as a result of agriculture
practices, municipal waste discharges, and old landfills in the floodplain.
Uram'tm concentrations are naturally high in South Dakota, Wyoming and
Eastern Colorado, and are thought to be increasing due to land-use related
activities along the North and South Platte basins of Colorado and Wyoming.
High selenium, fluoride and uranium concentrations in the western portion of
South Dakota, eastern Wyoming and northeastern Colorado caused by natural
conditions, pose seme long-term health risks.
Regional mining activities are adding heavy metals and salinity to the
ground waters to the extent that several conraunity wells have been abandoned
in the Jordan River Valley of Utah as a result of salt increases suspected to
be from the adjacent copper mining activity.
Local "hot spots" due to hazardous wastes, solid waste, leaking
underground tanks, injection of oil and gas brines, acid mine drainage, and
accidental industrial spills pose health risks for small isolated areas and
for seme sections of the heavily populated cities throughout the Region.
11
image:
IV. GROUND WATER QUALITY
90% of the Region Relies on Ground Water
In the region's six states, there are 3,136 community water systems and
5,536 non-comnunity water systems, of which over 90 percent obtain all or part
of their supplies from ground water aquifers. Approximately 95 percent of the
region's population in the rural areas obtains their sole water supply from
private wells.
Few Instances of Disease or Poisonings Have Been Reported
Few instances of waterborne disease or chemical poisoning due to
contaminated ground water have been reported in the Region. This may be
attributed in part to the fact that adverse health effects, resulting from low
level exposure to organic and inorganic constituents are often not noticed
over the short term and are seldom reported. Some of the risk, (such as
nitrate exposure to pregnant women) is avoided by using bottled water.
Additionally, hazardous waste contaminations have not yet occurred in areas of
ground water use, and exposure has thus far been avoided.
Yet Surveys Show Observable Levels of Contaminants Throughout the Region
A survey conducted on a random sanple of ground water systems in the
Region in 1980 found traces of trihalcmenthanes and volatile organics in 56
percent of the community well systems.
The regional agricultural areas suffer from saline increases due to
irrigation practices notably in the Grand Valley, Uncompahgre Valley, the
Arkansas Valley of Colorado, and the northeastern plains of Colorado in the
Oga 11 al a Aquifer and the Unita Valley of Utah.
Increasing concentrations of nitrates occur in the Big Sioux Valley of
South Dakota and South Platte Valley of Colorado as a result of agriculture
practices, municipal waste discharges, and old landfills in the floodplain.
Uram'tm concentrations are naturally high in South Dakota, Wyoming and
Eastern Colorado, and are thought to be increasing due to land-use related
activities along the North and South Platte basins of Colorado and Wyoming.
High selenium, fluoride and uranium concentrations in the western portion of
South Dakota, eastern Wyoming and northeastern Colorado caused by natural
conditions, pose seme long-term health risks.
Regional mining activities are adding heavy metals and salinity to the
ground waters to the extent that several conraunity wells have been abandoned
in the Jordan River Valley of Utah as a result of salt increases suspected to
be from the adjacent copper mining activity.
Local "hot spots" due to hazardous wastes, solid waste, leaking
underground tanks, injection of oil and gas brines, acid mine drainage, and
accidental industrial spills pose health risks for small isolated areas and
for seme sections of the heavily populated cities throughout the Region.
11
image:
 12
State Laws on Ground Water Protection are Inconsistent and Incomplete
At the state level, ground water Is managed differently by each of the
region's six states. All states but Utah have a ground water reference in
their general statutes; while South Dakota and Wyoming have specific ground
water laws. Only Wyoming has specific requirements for ground water quality
and an aquifer classification system. Colorado supports the need for both
specific standards and for an aquifer use classification system. None of the
region's states have authority to limit ground water use based on
deteriorating ground water quality although twenty other states in the country
do have some such provisions.
Federal Laws and EPA Ground Water Pol ici es Have Been Fragmented and Incomplete
At the federal level, ground water is not protected by any single
legislative mandate, but is sporadically and only partially, protected by
portions of some eight or ten federal pollution control laws. Hence, the
Agency has neither a single ground water protection mandate nor a
comprehensive set of policies and procedures with which to deal with ground
water contanination problems.
Ground Water Strategy is Critically Needed in the Region and the Agency
Ground water supplies are becoming increasingly contaminated. While
aquifers are geologically spread across state boundaries, state laws with
regard to protecting ground water supplies are inconsistent and incomplete.
Meanwhile, federal laws have not filled this gap. There is clearly an urgent
need to develop a coordinated strategy for ground watar use among states and .--
between states and federal authorities.
Other Ground Water Needs: Centralize Data Base and Better Define Which
Parameters Require Monitoring ' ~
There is also a need for a centralized ground water data base to better
assess trends in ground water contamination and quality. Finally, there is
also a need to more definitively develop the list of parameters for which
monitoring should be required, so that adequate assessment of health risks can
be made.
12
image:
12
State Laws on Ground Water Protection are Inconsistent and Incomplete
At the state level, ground water Is managed differently by each of the
region's six states. All states but Utah have a ground water reference in
their general statutes; while South Dakota and Wyoming have specific ground
water laws. Only Wyoming has specific requirements for ground water quality
and an aquifer classification system. Colorado supports the need for both
specific standards and for an aquifer use classification system. None of the
region's states have authority to limit ground water use based on
deteriorating ground water quality although twenty other states in the country
do have some such provisions.
Federal Laws and EPA Ground Water Pol ici es Have Been Fragmented and Incomplete
At the federal level, ground water is not protected by any single
legislative mandate, but is sporadically and only partially, protected by
portions of some eight or ten federal pollution control laws. Hence, the
Agency has neither a single ground water protection mandate nor a
comprehensive set of policies and procedures with which to deal with ground
water contanination problems.
Ground Water Strategy is Critically Needed in the Region and the Agency
Ground water supplies are becoming increasingly contaminated. While
aquifers are geologically spread across state boundaries, state laws with
regard to protecting ground water supplies are inconsistent and incomplete.
Meanwhile, federal laws have not filled this gap. There is clearly an urgent
need to develop a coordinated strategy for ground watar use among states and .--
between states and federal authorities.
Other Ground Water Needs: Centralize Data Base and Better Define Which
Parameters Require Monitoring ' ~
There is also a need for a centralized ground water data base to better
assess trends in ground water contamination and quality. Finally, there is
also a need to more definitively develop the list of parameters for which
monitoring should be required, so that adequate assessment of health risks can
be made.
12
image:
 13
V. HAZARDOUS WSTES - INACTIVE SITES
(SUPERFUNDf
The Superfund report (Section V) analyzes the problems posed in the Region
by inactive hazardous waste sites. Our report divides the subject into four
categories - National Priorities List (iNPL) sites , high priority sites not on
the NPL, Federal facilities, and potential problem sites. The information is
sunmarized, maps are used to show locations of sites, and bar graphs are used
to show distribution between States and type of site (e.g., mining, radiation,
chemical wastes).
How "Significant" Superfund Sites were Selected for this Report
Significant problems in Region VIII were easily identified for this report
since one of the accomplishments of the Superfund program has been to assanble
the National Priority List (NPL) of inactive hazardous waste sites. Sites at
which the Region is or intends to negotiate formal agreements for clean-up
were also considered to be significant problems even if they were not on the
NPL (e.g., Lowry Landfil 1 or Rocky Mountain Arsenal).
Location and Distribution of Region VIII' s Superfund Sites
Region VIII has 14 sites on the proposed National Priorities List (NPL).
Six are located in Colorado. Four are located in Montana. Utah, Wyoming,
North Dakota, and South Dakota each have one site. The Region has mining
sites and one radiation site in addition to the more traditional inactive and- -
abandoned hazardous waste sites (i.e., landfills).
Region VIII also has sites that require attention even though they are not
on the proposed NPL. These are Lowry Landfill, Denver; Canon City (Lincoln
Park, Colorado); 2 radiation-contaminated structures i n Monticello, Utah;
Rocky Mountain Phosphate, Garrison, and the ASARCO smelter complex, East
Helena, Montana.
Seven Federal facilities are actual or potential public health and
environmental concerns to this Region. Three are located in Colorado: Rocky
Mountain Arsenal (Denver) and Pueblo Army Depot (Pueblo) owned by the Army,
and the Leadville Drainage Tunnel (Leadville) owned by the Bureau of
Reclamation . Four Department of Defense facilities in Utah are also of
concern. These are Dugway Proving Ground, Tooele Army Depot, Ogden Army
Depot, and Hill AF3. In each case, actual or potential contaninaticn of
surface and ground water exists.
13
image:
13
V. HAZARDOUS WSTES - INACTIVE SITES
(SUPERFUNDf
The Superfund report (Section V) analyzes the problems posed in the Region
by inactive hazardous waste sites. Our report divides the subject into four
categories - National Priorities List (iNPL) sites , high priority sites not on
the NPL, Federal facilities, and potential problem sites. The information is
sunmarized, maps are used to show locations of sites, and bar graphs are used
to show distribution between States and type of site (e.g., mining, radiation,
chemical wastes).
How "Significant" Superfund Sites were Selected for this Report
Significant problems in Region VIII were easily identified for this report
since one of the accomplishments of the Superfund program has been to assanble
the National Priority List (NPL) of inactive hazardous waste sites. Sites at
which the Region is or intends to negotiate formal agreements for clean-up
were also considered to be significant problems even if they were not on the
NPL (e.g., Lowry Landfil 1 or Rocky Mountain Arsenal).
Location and Distribution of Region VIII' s Superfund Sites
Region VIII has 14 sites on the proposed National Priorities List (NPL).
Six are located in Colorado. Four are located in Montana. Utah, Wyoming,
North Dakota, and South Dakota each have one site. The Region has mining
sites and one radiation site in addition to the more traditional inactive and- -
abandoned hazardous waste sites (i.e., landfills).
Region VIII also has sites that require attention even though they are not
on the proposed NPL. These are Lowry Landfill, Denver; Canon City (Lincoln
Park, Colorado); 2 radiation-contaminated structures i n Monticello, Utah;
Rocky Mountain Phosphate, Garrison, and the ASARCO smelter complex, East
Helena, Montana.
Seven Federal facilities are actual or potential public health and
environmental concerns to this Region. Three are located in Colorado: Rocky
Mountain Arsenal (Denver) and Pueblo Army Depot (Pueblo) owned by the Army,
and the Leadville Drainage Tunnel (Leadville) owned by the Bureau of
Reclamation . Four Department of Defense facilities in Utah are also of
concern. These are Dugway Proving Ground, Tooele Army Depot, Ogden Army
Depot, and Hill AF3. In each case, actual or potential contaninaticn of
surface and ground water exists.
13
image:
 14
Region 8 has Made Significant Progress to Date In Cleaning Up
Hazardous Waste Sites Thrb'ughou'f the Six-State" Region.
At Whitewood Creek in the Black Hills area of South Dakota the contractors
selected by the State, EPA, and Homestake Mining Company to complete the
ranedial investigation began field work in late March.
At the Arsenic Trioxide site in Southeastern North Dakota the State is
continuing its remedial investigation under terms of our cooperative agreanent
with that state. This effort is on schedule.
For the Denver Radium Sites in Denver, Colorado, an action memorandum
authorizing expenditure of about $220,000 of Superfund money was approved.
The money will be used to complete the feasibility study.
At the Union Pacific/J. H. Baxter site in Laramie, Wyoming the settlement
between the State and Union Pacific and Baxter to implement a remedial
investigation and remedy has been started. The Region is expecting to
initiate negotiations with the parties to undertake measures to abate
contaminants leaking from unlined ponds concurrently with their remedial
investigation. <
At Rose Park in Salt Lake City, Utah the slurry wall surrounding the
sludge pit has been constructed. The clay cap construction began in late
April. Its installation is scheduled for completion in July.
At the Libby Ground Water site in Libby, Montana a potentially responsible
party has verbally agreed to conduct a remedial investigation at this site
beginning in May.
At the Anaconda Smelter in Anaconda, Montana an agreement with Anaconda
provides for the company and EPA to perform a renedial investigation at the
site.
For the Marshall Landfill in Boulder County, Colorado, Browning-Ferris
Industries has verbally agreed to complete the remedial investigation,
feasibility study, and remedy. A legal order will be completed soon to
formalize this agreement.
14
image:
14
Region 8 has Made Significant Progress to Date In Cleaning Up
Hazardous Waste Sites Thrb'ughou'f the Six-State" Region.
At Whitewood Creek in the Black Hills area of South Dakota the contractors
selected by the State, EPA, and Homestake Mining Company to complete the
ranedial investigation began field work in late March.
At the Arsenic Trioxide site in Southeastern North Dakota the State is
continuing its remedial investigation under terms of our cooperative agreanent
with that state. This effort is on schedule.
For the Denver Radium Sites in Denver, Colorado, an action memorandum
authorizing expenditure of about $220,000 of Superfund money was approved.
The money will be used to complete the feasibility study.
At the Union Pacific/J. H. Baxter site in Laramie, Wyoming the settlement
between the State and Union Pacific and Baxter to implement a remedial
investigation and remedy has been started. The Region is expecting to
initiate negotiations with the parties to undertake measures to abate
contaminants leaking from unlined ponds concurrently with their remedial
investigation. <
At Rose Park in Salt Lake City, Utah the slurry wall surrounding the
sludge pit has been constructed. The clay cap construction began in late
April. Its installation is scheduled for completion in July.
At the Libby Ground Water site in Libby, Montana a potentially responsible
party has verbally agreed to conduct a remedial investigation at this site
beginning in May.
At the Anaconda Smelter in Anaconda, Montana an agreement with Anaconda
provides for the company and EPA to perform a renedial investigation at the
site.
For the Marshall Landfill in Boulder County, Colorado, Browning-Ferris
Industries has verbally agreed to complete the remedial investigation,
feasibility study, and remedy. A legal order will be completed soon to
formalize this agreement.
14
image:
 15
Further Investigations will Determine Additional Remedial Actions Required
The Region will visit and assess the potential contamination problem at
every know inactive or abandoned hazardous waste site in the Region during
FY-83 and FY-84. Approximately 575 sites are listed within Region VIII. Of
these sites, approximately 250 sites require seme t>pe of initial assessment.
If past experience holds true, about 125 of these sites will require a visit
to complete our evaluation.
Intermedia Impacts of Superfund Sites
Each of the 14 NPL-listed sites and Lovry Landfill, Rocky Mountain
Arsenal, and the East Helena lead smelter impact on other media. Each impacts
surface or ground watar, or air, or perhaps several media. Other sections of
this report, particularly Section IV on ground water, describe further impacts
and implications of these abandoned or inactive hazardous waste sites in
Region VIII.
15
image:
15
Further Investigations will Determine Additional Remedial Actions Required
The Region will visit and assess the potential contamination problem at
every know inactive or abandoned hazardous waste site in the Region during
FY-83 and FY-84. Approximately 575 sites are listed within Region VIII. Of
these sites, approximately 250 sites require seme t>pe of initial assessment.
If past experience holds true, about 125 of these sites will require a visit
to complete our evaluation.
Intermedia Impacts of Superfund Sites
Each of the 14 NPL-listed sites and Lovry Landfill, Rocky Mountain
Arsenal, and the East Helena lead smelter impact on other media. Each impacts
surface or ground watar, or air, or perhaps several media. Other sections of
this report, particularly Section IV on ground water, describe further impacts
and implications of these abandoned or inactive hazardous waste sites in
Region VIII.
15
image:
 VI. HAZARDOUS WASTES - ACTIVE SITES
(RCRA)
Most of the information which we have on the environmental problems posed
by active hazardous waste handlers dates from November 19, 1980, the start of
the regulatory program developed under the Resource Conservation and Recovery
Act (RCRA). Since that time, EPA has made progress toward defining, analyzing
and abating those problems.
Significant Environmental Problems at Active Hazardous Wastes Sites in
Region VIII
There are 73 hazardous waste management facilities in Region VIII which
are required to conduct ground water monitoring. Many of them have exhibited
serious ground water contamination problems as a result of inadequate disposal
practices.
Oil refineries constitute one of the major types of hazardous waste
producing industries in Region VIII and nearly all of the oil refineries have
land disposal or land treatment facilities which are impacting ground water.
Many refineries also have inactive hazardous waste (Superfund) sites resulting
from past practices.
Recyclers of industrial waste chemicals pose significant problems because
of a lingering history of unsafe hazardous waste management practices.
Unmarked drums leaking waste directly onto the ground have not been uncommon
for these types of facilities. Older recycling facilities are often located
in densely populated, high-risk areas.
Mining wastes pose a significant environmental concern in Region VIII
because of their volume and the likely possibility of surface and ground water
contaminat ion.
Region VIII Lacks Adequate Commercial Disposal Capacity
One of the major problems emerging in Region VIII is the lack of
commercial capacity for disposal of hazardous wastes. For various reasons,
including State siting laws as well as a lack of adequate facilities, the
number of commercial disposal sites within the Region is much below current
demand. The impacts of this gap include higher costs for waste shipments out
of state and out of Region, higher liklihood of "midnight dumping", and a
higher risk of accidents during long distance shipments of wastes.
A related problem is the "weeding out" of poorly operated facilities.
Some facilities, especially the older recyclers, may not be able to come into
compliance with the new standards for waste management under RCRA. The
closing down of such operations may be considered an improvment since such
poorly run facilities are no longer in operation. However, it also
exacerbates the problem by further reducing the commercial waste management
capacity within the Region.
"T
image:
VI. HAZARDOUS WASTES - ACTIVE SITES
(RCRA)
Most of the information which we have on the environmental problems posed
by active hazardous waste handlers dates from November 19, 1980, the start of
the regulatory program developed under the Resource Conservation and Recovery
Act (RCRA). Since that time, EPA has made progress toward defining, analyzing
and abating those problems.
Significant Environmental Problems at Active Hazardous Wastes Sites in
Region VIII
There are 73 hazardous waste management facilities in Region VIII which
are required to conduct ground water monitoring. Many of them have exhibited
serious ground water contamination problems as a result of inadequate disposal
practices.
Oil refineries constitute one of the major types of hazardous waste
producing industries in Region VIII and nearly all of the oil refineries have
land disposal or land treatment facilities which are impacting ground water.
Many refineries also have inactive hazardous waste (Superfund) sites resulting
from past practices.
Recyclers of industrial waste chemicals pose significant problems because
of a lingering history of unsafe hazardous waste management practices.
Unmarked drums leaking waste directly onto the ground have not been uncommon
for these types of facilities. Older recycling facilities are often located
in densely populated, high-risk areas.
Mining wastes pose a significant environmental concern in Region VIII
because of their volume and the likely possibility of surface and ground water
contaminat ion.
Region VIII Lacks Adequate Commercial Disposal Capacity
One of the major problems emerging in Region VIII is the lack of
commercial capacity for disposal of hazardous wastes. For various reasons,
including State siting laws as well as a lack of adequate facilities, the
number of commercial disposal sites within the Region is much below current
demand. The impacts of this gap include higher costs for waste shipments out
of state and out of Region, higher liklihood of "midnight dumping", and a
higher risk of accidents during long distance shipments of wastes.
A related problem is the "weeding out" of poorly operated facilities.
Some facilities, especially the older recyclers, may not be able to come into
compliance with the new standards for waste management under RCRA. The
closing down of such operations may be considered an improvment since such
poorly run facilities are no longer in operation. However, it also
exacerbates the problem by further reducing the commercial waste management
capacity within the Region.
"T
image:
 17
Identification of Hazardous Waste Handlers
Over the last two and a half .years EPA has identified the nunber and t^pes
of hazardous waste generators, transporters, and treatment, storage and
disposal (T5D) facilities in the Region. One of the salient facts emerging
frcm the notification figures is that over half of the total of 2521-notifiers
have withdrawn from the regulatory program, due to exemptions or special
requirements. There are sane 1,093 commercial enterprises handling regulated
hazardous wastes throughout Region VIII.
Correction of Unsafe and Improper Handling Practices
We have taken action to correct unsafe or improper handling practices.
EPA and the States have conducted over 1,800 RCRA compliance inspections and
57 probable cause inspections resulting from (inspections resulting from
citizen complaints, "midnight dumping" reports, and other sources). Improved
handling practices have resulted both from in-field inspector recommendations
and from formal enforcement actions. Through December of 1982 we have taken
over 230 enforcement actions, including warning letters, complaints and final
orders.
Improvement of Facilities Through Permitting
In October of 1981 Region VIII issued the first RCRA permit in the nation
to the Oil and Solvent Process Company, a recycling facility rear Denver,
Colorado. It is important to issue permits for new facilities such as this in
order to increase the'Region's capacity for proper commercial treatment,
storage and disposal of hazardous wastes. Region VIII personnel are in the
process of permitting over 30 treatment, storage and disposal facilities and
will continue to request Part B application at a rate of about three per month,
Positive Signs: Reduced Haste Volunes, Increased Recycling & Pretreatment
In the short period that EPA has regulated active hazardous waste
handlers, certain trends have begun to emerge. We can point to some positive
developments based on our contacts with the regulated cornnunity.
First, generators- are changing their production processes in ways that
reduce the anounts and volumes of wastes generated.
Secondly, there has been an increase in the recycling of hazardous
wastes,. This is not surprising, given the rising costs of proper disposal.
Finally, there is a growing trend toward the installation of pretreatment
units, which then discharge non-hazardous waste into publicly owned treatment
WDrks. Although this eliminates the need for storage and transportation of
wastes, it amplifies the need for an effective pre-treatment program.
17
image:
17
Identification of Hazardous Waste Handlers
Over the last two and a half .years EPA has identified the nunber and t^pes
of hazardous waste generators, transporters, and treatment, storage and
disposal (T5D) facilities in the Region. One of the salient facts emerging
frcm the notification figures is that over half of the total of 2521-notifiers
have withdrawn from the regulatory program, due to exemptions or special
requirements. There are sane 1,093 commercial enterprises handling regulated
hazardous wastes throughout Region VIII.
Correction of Unsafe and Improper Handling Practices
We have taken action to correct unsafe or improper handling practices.
EPA and the States have conducted over 1,800 RCRA compliance inspections and
57 probable cause inspections resulting from (inspections resulting from
citizen complaints, "midnight dumping" reports, and other sources). Improved
handling practices have resulted both from in-field inspector recommendations
and from formal enforcement actions. Through December of 1982 we have taken
over 230 enforcement actions, including warning letters, complaints and final
orders.
Improvement of Facilities Through Permitting
In October of 1981 Region VIII issued the first RCRA permit in the nation
to the Oil and Solvent Process Company, a recycling facility rear Denver,
Colorado. It is important to issue permits for new facilities such as this in
order to increase the'Region's capacity for proper commercial treatment,
storage and disposal of hazardous wastes. Region VIII personnel are in the
process of permitting over 30 treatment, storage and disposal facilities and
will continue to request Part B application at a rate of about three per month,
Positive Signs: Reduced Haste Volunes, Increased Recycling & Pretreatment
In the short period that EPA has regulated active hazardous waste
handlers, certain trends have begun to emerge. We can point to some positive
developments based on our contacts with the regulated cornnunity.
First, generators- are changing their production processes in ways that
reduce the anounts and volumes of wastes generated.
Secondly, there has been an increase in the recycling of hazardous
wastes,. This is not surprising, given the rising costs of proper disposal.
Finally, there is a growing trend toward the installation of pretreatment
units, which then discharge non-hazardous waste into publicly owned treatment
WDrks. Although this eliminates the need for storage and transportation of
wastes, it amplifies the need for an effective pre-treatment program.
17
image:
 18
VII. RADIATION
EPA's primary radiation role is to reduce unnecessary and avoidable
radiation doses from environmental sources. Although the Agency has done sane
work in the area of discretionary sources where individuals are selectively
exposed, the primary thrust has been with population exposure to ambient
levels and avoidable increases to those levels.
Radiation Occurs Naturally., but Exposure poses Have Seen Increased by
Technological Man
Most ambient radiation exposure occurs through natural events and media.
However, this natural exposure has been exacerbated through many of the
resource development and mining activities particularly prevalent in Region
VIII. The major concern in Region VIII is this technological enhancement of
naturally occurring levels of radiation and the resulting exposure to
increased levels of radiation in the anbient environment in our Region.
Exposure to Radiation is Expected to Decline Significantly...
Seme of the most significant reductions in environmental radiation dose
to the Region VIII population are expected to occur during the next 5 to 10
years. Ganma rays are the radiation of interest with respect to external
exposure to the body. The--a! ti tude of the Rocky Mountain Region as well as -'
its mineralization result in elevated exposure from natural cosmic and
terrestrial sources. As a result of improved practices which are to be
required by proposed standards and regul ati ons, the external radiation dose to
the popul ation , especi ally in the near vicinity of mines, mills and other
operational sources, is expected to decline over the next few years.
Radiation dose to the internal organs of the body, resulting from
ingested or inhaled radioactive material is of far greater concern because the
doses are usually much greater than external doses and occur over longer
periods, up to- a lifetime. As with external exposure, the primary Regi onal
role is closely involved with ensuring that these radiation doses will also
decline as a result of controls required by the standards and regulations
noted above. In addition, projects designed to remove radioactive
contaminants from drinking water will further reduce the population dose.
These internal dose reductions are expected to be far more significant than
the reduction in external dose.
Except for Uraniun in Drinking Water...
Unfortunately, we also anticipate a dramatic increase in radiation dose
to seme portions of the population. Uranium in drinking water remains a
widespread problem in Region VIII. As mentioned above, much of the uranium in
Region VIII drinking water occurs from natural causes, although amounts and
volumes of uranium leaching into surface and sub-surface waters are increased
by mining and other human activities. There are no regulations limiting
uranium in drinking water because a cost-effective removal process has not yet
been proven. Research in this area is proceeding.
13
image:
18
VII. RADIATION
EPA's primary radiation role is to reduce unnecessary and avoidable
radiation doses from environmental sources. Although the Agency has done sane
work in the area of discretionary sources where individuals are selectively
exposed, the primary thrust has been with population exposure to ambient
levels and avoidable increases to those levels.
Radiation Occurs Naturally., but Exposure poses Have Seen Increased by
Technological Man
Most ambient radiation exposure occurs through natural events and media.
However, this natural exposure has been exacerbated through many of the
resource development and mining activities particularly prevalent in Region
VIII. The major concern in Region VIII is this technological enhancement of
naturally occurring levels of radiation and the resulting exposure to
increased levels of radiation in the anbient environment in our Region.
Exposure to Radiation is Expected to Decline Significantly...
Seme of the most significant reductions in environmental radiation dose
to the Region VIII population are expected to occur during the next 5 to 10
years. Ganma rays are the radiation of interest with respect to external
exposure to the body. The--a! ti tude of the Rocky Mountain Region as well as -'
its mineralization result in elevated exposure from natural cosmic and
terrestrial sources. As a result of improved practices which are to be
required by proposed standards and regul ati ons, the external radiation dose to
the popul ation , especi ally in the near vicinity of mines, mills and other
operational sources, is expected to decline over the next few years.
Radiation dose to the internal organs of the body, resulting from
ingested or inhaled radioactive material is of far greater concern because the
doses are usually much greater than external doses and occur over longer
periods, up to- a lifetime. As with external exposure, the primary Regi onal
role is closely involved with ensuring that these radiation doses will also
decline as a result of controls required by the standards and regulations
noted above. In addition, projects designed to remove radioactive
contaminants from drinking water will further reduce the population dose.
These internal dose reductions are expected to be far more significant than
the reduction in external dose.
Except for Uraniun in Drinking Water...
Unfortunately, we also anticipate a dramatic increase in radiation dose
to seme portions of the population. Uranium in drinking water remains a
widespread problem in Region VIII. As mentioned above, much of the uranium in
Region VIII drinking water occurs from natural causes, although amounts and
volumes of uranium leaching into surface and sub-surface waters are increased
by mining and other human activities. There are no regulations limiting
uranium in drinking water because a cost-effective removal process has not yet
been proven. Research in this area is proceeding.
13
image:
 19
...and Indoor Radon Progeny
Another significant concern with respect to future radiation protection
lies with the internal dose resulting from inhaled radioactive radon decay
product concentrations in the home. A popular and inexpensive energy
conservation measure used by homeowners that can increase these concentrations
is caulking. Caulking results in a decreased ventilation rate which can lead
to elevated radon daughter levels. Since a person generally spends more time
in his or her home than elsewhere, the increased risk of lung cancer
associated with elevated radon progeny levels in the home can be significant.
Future Abatement Needs: Uncontrolled Radioactive Waste Sites and Urani mi Mill
Tailings
From an abatement perspective, our concern is with uncontrolled
radioactive waste sites (we are investigating about two dozen abandoned sites)
and with uranium mill tailings requiring remedial action (of 24 inactive
uranium milling operations in the country, 16, or 57% are in Region 8).
Preventive Measures Needed: Radioactivity in Drinking Water and Indoor Radon
Progeny
From a prevention perspective, we are most concerned with indoor radon
pro gen gy and radioactivity in drinking water. We are also concerned with
developing strategies and .sites to dispose of high level and low-level
radi oacti ve wastes.
19
image:
19
...and Indoor Radon Progeny
Another significant concern with respect to future radiation protection
lies with the internal dose resulting from inhaled radioactive radon decay
product concentrations in the home. A popular and inexpensive energy
conservation measure used by homeowners that can increase these concentrations
is caulking. Caulking results in a decreased ventilation rate which can lead
to elevated radon daughter levels. Since a person generally spends more time
in his or her home than elsewhere, the increased risk of lung cancer
associated with elevated radon progeny levels in the home can be significant.
Future Abatement Needs: Uncontrolled Radioactive Waste Sites and Urani mi Mill
Tailings
From an abatement perspective, our concern is with uncontrolled
radioactive waste sites (we are investigating about two dozen abandoned sites)
and with uranium mill tailings requiring remedial action (of 24 inactive
uranium milling operations in the country, 16, or 57% are in Region 8).
Preventive Measures Needed: Radioactivity in Drinking Water and Indoor Radon
Progeny
From a prevention perspective, we are most concerned with indoor radon
pro gen gy and radioactivity in drinking water. We are also concerned with
developing strategies and .sites to dispose of high level and low-level
radi oacti ve wastes.
19
image:
 20
VIII. TOXICS AND PESTICIDES
Long-Term Trend: Fewer Poisonings
Sane very general long-term trends have been observed regarding
pesticides and toxics issues in Region 8 to date. Generally, fewer pesticide
poisonings seem to be occurring in recent years, possibly due to child proof
pesticide containers and the fact that organophosphate pesticides are being
respected for their acute hazard potenti al . We expect the year-by-year data
in future Environmental Management Reports to reflect this trend. Definitive
trends regarding pesticide drift and disposal of pesticide containers have not
been observed.
Special Problems: Endrin Buildup, 1080 Coyote Control.
and Pesti cide Contai ner D isposa I
Certain Region VIII states are especially concerned with unique pesticide
problems. Montana is concerned with the buildup of endri n residues in the
environment and the buildup of certain pesticides in game birds. Wyoming,
Montana, Utah, Colorado and South Dakota are very interested in the use of
1080 for coyote control, and if the Administrator allows the use of this
chemical, EPA will have to work closely with the states to implement proper
programs for its use. Requirements for pesticide drim storage and disposal
will be tightened under RCRA. It is possible that these tighter requirements
could mean an increase in illegal disposal of these druns and their contents.
Asbestos Exposure: Trends are Unclear
Regarding the asbestos-in-schools program, we are aware of several
asbestos removals at schools but our data will not be compiled until our
Asbestos Technical Advisor completes the second round of school district
visits. After the mandatory rule requiring schools to keep records takes
effect, we will have better figures on the exposure of school children to
asbestos.
PCB's: Disposal Remains a Challenge
Methods of disposing of PCBs are still in the developmental stages and
disposal costs rsnain high. However, significant quantities of PGs are being
moved into disposal facilities. We are beginning to gather actual figures on
the flow of PCBs for disposal from Region VIII, and we will
have more complete information in the future.
20
image:
20
VIII. TOXICS AND PESTICIDES
Long-Term Trend: Fewer Poisonings
Sane very general long-term trends have been observed regarding
pesticides and toxics issues in Region 8 to date. Generally, fewer pesticide
poisonings seem to be occurring in recent years, possibly due to child proof
pesticide containers and the fact that organophosphate pesticides are being
respected for their acute hazard potenti al . We expect the year-by-year data
in future Environmental Management Reports to reflect this trend. Definitive
trends regarding pesticide drift and disposal of pesticide containers have not
been observed.
Special Problems: Endrin Buildup, 1080 Coyote Control.
and Pesti cide Contai ner D isposa I
Certain Region VIII states are especially concerned with unique pesticide
problems. Montana is concerned with the buildup of endri n residues in the
environment and the buildup of certain pesticides in game birds. Wyoming,
Montana, Utah, Colorado and South Dakota are very interested in the use of
1080 for coyote control, and if the Administrator allows the use of this
chemical, EPA will have to work closely with the states to implement proper
programs for its use. Requirements for pesticide drim storage and disposal
will be tightened under RCRA. It is possible that these tighter requirements
could mean an increase in illegal disposal of these druns and their contents.
Asbestos Exposure: Trends are Unclear
Regarding the asbestos-in-schools program, we are aware of several
asbestos removals at schools but our data will not be compiled until our
Asbestos Technical Advisor completes the second round of school district
visits. After the mandatory rule requiring schools to keep records takes
effect, we will have better figures on the exposure of school children to
asbestos.
PCB's: Disposal Remains a Challenge
Methods of disposing of PCBs are still in the developmental stages and
disposal costs rsnain high. However, significant quantities of PGs are being
moved into disposal facilities. We are beginning to gather actual figures on
the flow of PCBs for disposal from Region VIII, and we will
have more complete information in the future.
20
image:
 i.
Air Quality Section
Environmental Management Report
Page Number
PART I. Overview of Status and Trends
A. Overview of Status and Trands 23
8. Colorado
C." Montana
D. North Dakota
E. South Dakota
F. Utah
G. Wyom 1 ng
PART II. Discussicn of Significant Air Problgns and
Implications for Agency Management
A. Air Quality Problems and Management Implications
1. Carbon Monoxide 26
2. Total Suspended Parti oil ates
3. Ozone
4. Lead
5. Acid Deposition
B. Ranking of Region VIII 's Air Quality Problems 29
C. List of Emerging Problems in Region VIII 30
1. Acid Depositicn
2. Emissions from Diesel Vehicles
3. Organic Compound Emissions from Wood Stoves
and Fireplaces
4. Indoor Air Pollutien
5. Availability of Complex Terrain and Long Range
Transport and Diffusion Models
6. Cadmium and Arsenic Levels in East Helena, Montana
7. Potential Air Quality Problems on Indian
Reservations Within Region VIII
PART III Air Quality Overview . 32
A. Colorado
I. Denver • 32
2. Fort Collins and Greeley
3. Colorado Springs
4. Grand Junction
5. Pueblo
6. Western Colorado
image:
i.
Air Quality Section
Environmental Management Report
Page Number
PART I. Overview of Status and Trends
A. Overview of Status and Trands 23
8. Colorado
C." Montana
D. North Dakota
E. South Dakota
F. Utah
G. Wyom 1 ng
PART II. Discussicn of Significant Air Problgns and
Implications for Agency Management
A. Air Quality Problems and Management Implications
1. Carbon Monoxide 26
2. Total Suspended Parti oil ates
3. Ozone
4. Lead
5. Acid Deposition
B. Ranking of Region VIII 's Air Quality Problems 29
C. List of Emerging Problems in Region VIII 30
1. Acid Depositicn
2. Emissions from Diesel Vehicles
3. Organic Compound Emissions from Wood Stoves
and Fireplaces
4. Indoor Air Pollutien
5. Availability of Complex Terrain and Long Range
Transport and Diffusion Models
6. Cadmium and Arsenic Levels in East Helena, Montana
7. Potential Air Quality Problems on Indian
Reservations Within Region VIII
PART III Air Quality Overview . 32
A. Colorado
I. Denver • 32
2. Fort Collins and Greeley
3. Colorado Springs
4. Grand Junction
5. Pueblo
6. Western Colorado
image:
 22
Air Quality Section
("continued)
Paae Nun her
PART III Air Quality Overview (continued)
8. Montana 35
c.
D.
E.
F.
PART IV
A.
B.
1. Billings
2. Butte
3. Col strip
4. Columbia Falls
5. East Helena
6. Great Falls
7* Laurel
8. Missoula
North Dakota
South Dakota
Utah
" T. Salt Lake County
2. Davis County
3. Tooele County
4. Utah County
5. Weber County
6. Iron- County
7. Uinta County
Wyoming
1. Sweetwater County
2. Riley Ridge Project
FIGURES AND TABLES
Figure 1 Number of Days
Level was Exce
Figure 2 Number of Days
37
38
38
d in 1981 - CO, 03 43
at Primary Standard or Alert
Level was Exceeded in 1981 - TSP, S02 • 44
C. Figure 3 Symbols Used on Status Maps 45
D. Figure 4 Alerts and Standards Map for TSP - 1981 46
E. Figure 5 Alerts and Standards Map for CO - 1981 47
F. Figure 6 Alerts and Standards Map for S02 - 1981 ' 48
G, Figure 7 Alerts and Standards Map for 03 - 1981 49
H. Figure 8 Alerts and Standards Map for N02 - 1981 50
I. Figure 9 Alerts and Standards Map for PS - 1981 51
J. Figure 10 Denver Metro Air Quality Mcnitoring Sites 52
K. Table I Denver Metro Particulate Pollutants Monitoring
Sites . 53
L. Table II Denver Metro Gaseous Pollutants Monitoring
Sites 54
M. Figure 11 Utah Air Monitoring Network -
Wasatch Front Stations 55
N. Table III Utah Wasatch Front Air Monitoring Stations 55
image:
22
Air Quality Section
("continued)
Paae Nun her
PART III Air Quality Overview (continued)
8. Montana 35
c.
D.
E.
F.
PART IV
A.
B.
1. Billings
2. Butte
3. Col strip
4. Columbia Falls
5. East Helena
6. Great Falls
7* Laurel
8. Missoula
North Dakota
South Dakota
Utah
" T. Salt Lake County
2. Davis County
3. Tooele County
4. Utah County
5. Weber County
6. Iron- County
7. Uinta County
Wyoming
1. Sweetwater County
2. Riley Ridge Project
FIGURES AND TABLES
Figure 1 Number of Days
Level was Exce
Figure 2 Number of Days
37
38
38
d in 1981 - CO, 03 43
at Primary Standard or Alert
Level was Exceeded in 1981 - TSP, S02 • 44
C. Figure 3 Symbols Used on Status Maps 45
D. Figure 4 Alerts and Standards Map for TSP - 1981 46
E. Figure 5 Alerts and Standards Map for CO - 1981 47
F. Figure 6 Alerts and Standards Map for S02 - 1981 ' 48
G, Figure 7 Alerts and Standards Map for 03 - 1981 49
H. Figure 8 Alerts and Standards Map for N02 - 1981 50
I. Figure 9 Alerts and Standards Map for PS - 1981 51
J. Figure 10 Denver Metro Air Quality Mcnitoring Sites 52
K. Table I Denver Metro Particulate Pollutants Monitoring
Sites . 53
L. Table II Denver Metro Gaseous Pollutants Monitoring
Sites 54
M. Figure 11 Utah Air Monitoring Network -
Wasatch Front Stations 55
N. Table III Utah Wasatch Front Air Monitoring Stations 55
image:
 23
Air Quality Section
Environmental Management Report
Part I:
A. Overview of Environmental Status and Trends
Region VIII air quality problems are categorized into two classes:
those associated with the urban/industrial nonattainment areas and those
associated with the emerging development of natural resources near PSD
(Prevention of Significant Deterioration of Air Quality) Class I areas.
Total Suspended Particulates (TSP) was still the most widespread
problem in the Region in 1981. Of the 25 counties exceeding the alert level
for any National Ambient Air Quality Standard (NAAQS) pollutant, 24 counties
exceeded the TSP alert level. Of the 49 counties in the Region in 1981 having
monitoring stations reporting pollutant levels in excess of the primary
standard, 31 of those were for TSP exceedances; 6 for 63 (ozone); 9 for CO
(carbon monoxide); 1 for S02 (sulfur dioxide); 1 for N0£ (nitrogen
dioxide); and 1 for lead. Figures 1 and 2 illustrate the number of days that
the primary standard or alert level was exceeded in 1981 in Region VIII
nonattainment areas for CO, 03, TSP, and S0£.
Concerning the PSD clean air area problems, there is one area in the ~
Region experiencing PSD Class I S02 increment violations and at least three
others with the potential for such violations.
B. Colorado
Colorado has six urban/industrial nonattainment areas. Of the six,
metropolitan Denver is the most significant problem area in terms of affected
geographic area, frequency of alerts and violation days, and magnitude of
pollutant levels for TSP, CO, and 03. The Denver metropolitan area is
currently being redesignated as attainment for NOj, and the Denver
metropolitan TSP nonattainment area is expected to be redesignated to include
only Denver and portions of Arapahoe and Adams Counties as the nonattainment
area. This redesignation will reduce the size of the TSP nonattainment area
by two-thirds. The Denver area has received time extensions to meet the CO
and 03 standards, but EPA believes that Colorado's 1982 CO/03 SIP nas not
demonstrated attainment of the CO standard and has proposed to disapprove that
portion of the plan.
The Colorado Springs and Grand Junction TSP nonattainment areas are
expected to be able to demonstrate attainment by the required statutory
deadlines.
Remaining urban problems include the Pueblo TSP, and the Fort
Collins, Greeley, and Colorado Springs CO nonattainment areas. Although the
most recent TSP monitoring data show that Pueblo is close to meeting the TSP
standard, the major industrial emission source in the area (CF&I Steel) was
image:
23
Air Quality Section
Environmental Management Report
Part I:
A. Overview of Environmental Status and Trends
Region VIII air quality problems are categorized into two classes:
those associated with the urban/industrial nonattainment areas and those
associated with the emerging development of natural resources near PSD
(Prevention of Significant Deterioration of Air Quality) Class I areas.
Total Suspended Particulates (TSP) was still the most widespread
problem in the Region in 1981. Of the 25 counties exceeding the alert level
for any National Ambient Air Quality Standard (NAAQS) pollutant, 24 counties
exceeded the TSP alert level. Of the 49 counties in the Region in 1981 having
monitoring stations reporting pollutant levels in excess of the primary
standard, 31 of those were for TSP exceedances; 6 for 63 (ozone); 9 for CO
(carbon monoxide); 1 for S02 (sulfur dioxide); 1 for N0£ (nitrogen
dioxide); and 1 for lead. Figures 1 and 2 illustrate the number of days that
the primary standard or alert level was exceeded in 1981 in Region VIII
nonattainment areas for CO, 03, TSP, and S0£.
Concerning the PSD clean air area problems, there is one area in the ~
Region experiencing PSD Class I S02 increment violations and at least three
others with the potential for such violations.
B. Colorado
Colorado has six urban/industrial nonattainment areas. Of the six,
metropolitan Denver is the most significant problem area in terms of affected
geographic area, frequency of alerts and violation days, and magnitude of
pollutant levels for TSP, CO, and 03. The Denver metropolitan area is
currently being redesignated as attainment for NOj, and the Denver
metropolitan TSP nonattainment area is expected to be redesignated to include
only Denver and portions of Arapahoe and Adams Counties as the nonattainment
area. This redesignation will reduce the size of the TSP nonattainment area
by two-thirds. The Denver area has received time extensions to meet the CO
and 03 standards, but EPA believes that Colorado's 1982 CO/03 SIP nas not
demonstrated attainment of the CO standard and has proposed to disapprove that
portion of the plan.
The Colorado Springs and Grand Junction TSP nonattainment areas are
expected to be able to demonstrate attainment by the required statutory
deadlines.
Remaining urban problems include the Pueblo TSP, and the Fort
Collins, Greeley, and Colorado Springs CO nonattainment areas. Although the
most recent TSP monitoring data show that Pueblo is close to meeting the TSP
standard, the major industrial emission source in the area (CF&I Steel) was
image:
 24
operating at a much reduced capacity during this time. EPA is currently in
the process of analyzing available data to determine whether the recent
improvements in air quality should bs attributed to implementation of the SIP,
or to the economic slow-down at CF&I. The Fort Collins, Greeley, and Colorado
Springs CO nonattainment areas have received time extensions to meet the CO
standards and EPA has proposed to approve those portions of Colorado's 1982
CO/03 SIP which deal with these areas.
Since 1982, the recession has temporarily slowed down development of
natural resources in western Colorado, an area known for its clean air and
potential growth problems. Several oil shale firms have recently submitted
new applications for scaled down projects. Anticipated air quality and air
quality related value impacts on the Class I areas should be less under this
reduced level of development.
Several mountain communities, such as Aspen, Steamboat Springs, and
Vail, as well as many other areas in the State, have experienced violations of
the annual and 24-hour partleulate NAAQS. The problems are caused by rural
fugitive dust or by non-conventional sources such as street sanding and
fireplace/wood stove emissions. CO may also be a problem in these communities.
C. Montana
CO, TSP, and lead are the pollutants of most concern in Montana. Three
cities in Montana (Billings, Great Falls, and Missoula) have failed to submit
an adequate SIP to demonstrate compliance with the CO standard, and one TSP
nonattainment area (Missoula) will not be in compliance with the particulate
standard. Five other nonattainment areas (Great Falls (TSP), Colstrip (TSP),
Butte (TSP), East Helena (302} and Laura! ($02)} are expected to
demonstrate that attainment was reached by the end of 1982.
The East Helena area of Montana is experiencing violations of the
lead national ambient air quality standard. Submittal of an attainment plan
is expected in the Spring of 1983.
D. North Dakota
North Dakota has no nonattainment areas. A very significant air
quality management problem in the State, however, has been the predicted
consumption of the PSD Management Class I S02 increment at the Theodore
Roosevelt National Parks. Five State PSD permits have been issued, however.
Because Class I S0£ exceedances were predicted in the five cases reviewed by
the State, the companies applied to the Federal Land Manager for a certificate
of no adverse impact (pursuant to Section 165(d)(2)(C)(iii) of the Clean Air
Act). The National Park Service determined that no adverse impact on the
Park's air quality related values would result from the new sources' emissions
and issued certificates. This determination allowed the State of North Dakota
to issue permits to construct for five sources in question.
image:
24
operating at a much reduced capacity during this time. EPA is currently in
the process of analyzing available data to determine whether the recent
improvements in air quality should bs attributed to implementation of the SIP,
or to the economic slow-down at CF&I. The Fort Collins, Greeley, and Colorado
Springs CO nonattainment areas have received time extensions to meet the CO
standards and EPA has proposed to approve those portions of Colorado's 1982
CO/03 SIP which deal with these areas.
Since 1982, the recession has temporarily slowed down development of
natural resources in western Colorado, an area known for its clean air and
potential growth problems. Several oil shale firms have recently submitted
new applications for scaled down projects. Anticipated air quality and air
quality related value impacts on the Class I areas should be less under this
reduced level of development.
Several mountain communities, such as Aspen, Steamboat Springs, and
Vail, as well as many other areas in the State, have experienced violations of
the annual and 24-hour partleulate NAAQS. The problems are caused by rural
fugitive dust or by non-conventional sources such as street sanding and
fireplace/wood stove emissions. CO may also be a problem in these communities.
C. Montana
CO, TSP, and lead are the pollutants of most concern in Montana. Three
cities in Montana (Billings, Great Falls, and Missoula) have failed to submit
an adequate SIP to demonstrate compliance with the CO standard, and one TSP
nonattainment area (Missoula) will not be in compliance with the particulate
standard. Five other nonattainment areas (Great Falls (TSP), Colstrip (TSP),
Butte (TSP), East Helena (302} and Laura! ($02)} are expected to
demonstrate that attainment was reached by the end of 1982.
The East Helena area of Montana is experiencing violations of the
lead national ambient air quality standard. Submittal of an attainment plan
is expected in the Spring of 1983.
D. North Dakota
North Dakota has no nonattainment areas. A very significant air
quality management problem in the State, however, has been the predicted
consumption of the PSD Management Class I S02 increment at the Theodore
Roosevelt National Parks. Five State PSD permits have been issued, however.
Because Class I S0£ exceedances were predicted in the five cases reviewed by
the State, the companies applied to the Federal Land Manager for a certificate
of no adverse impact (pursuant to Section 165(d)(2)(C)(iii) of the Clean Air
Act). The National Park Service determined that no adverse impact on the
Park's air quality related values would result from the new sources' emissions
and issued certificates. This determination allowed the State of North Dakota
to issue permits to construct for five sources in question.
image:
 25
North Dakota, with the help of an EPA Region VIII grant, will study
the feasibility of an emissions trading program as a means of managing further
industrial growth and air quality deterioration in the vicinity of the
Theodore Roosevelt National Parks.
E. South Dakota
The only nonattainment area in South Dakota is the TSP nonattainment
area in Rapid City. The State and EPA expect to be able to document that
attainment was achieved at the end of 1982.
F. Utah
The Wasatch Front (Salt Lake, Weber, Davis, Utah, and Tooele
Counties) is the area in Utah with the most significant air pollution
problems. One or more of the counties are nonattainment for CO, 03, TSP,
and S02. Salt Lake, Davis, Weber, and Utah Counties have received time
extensions to meet the CO and/or 03 standards. However, Region VIII
believes that Utah's 1982 CO/03 SIP met all Clean Air Act requirements with
respect to the attainment of the CO standard in Salt Lake County and the 03
standard in Salt Lake and Davis Counties, and has proposed to disapprove the
SIPs. Specifically, the SIP did not contain adequate commitments to implement
the required inspection/maintenance program.
Portions of Salt Lake and Toole County near the Kennecott Copper
Smelter are nonattainment for S02. Recent data suggests that the area of
nonattainment has been narrowed to above 5600 feet in elevation and on
Kennecott property.
Region VIII expects Davis County to be able to document attainment of
the CO standard by 1982 and Salt Lake, Utah, and Weber Counties to document
attainment of the TSP standard by 1982.
Iron County has demonstrated attainment for S02 by 1982, and the
State has submitted a request for redesignation to EPA.
Utah, like Colorado has significant national resources which are
being developed in PSD clean air areas. Development of power plants, shale
oil conversion plants and synfuel facilities may create Class I area air
quality and air quality related value (i.e., visibility and acid deposition)
problems in the future.
G. Wyoming
Sweetwater County, the State's only nonattainment area (for TSP), is
believed to have achieved attainment by the end of 1982. Air quality impacts
in the mining areas of Campbell and Converse Counties and new natural gas
field development in Sublette and Lincoln Counties are of concern because of
potential violations of PSD increments and National Ambient Air Quality
Standards (NAAQS).
image:
25
North Dakota, with the help of an EPA Region VIII grant, will study
the feasibility of an emissions trading program as a means of managing further
industrial growth and air quality deterioration in the vicinity of the
Theodore Roosevelt National Parks.
E. South Dakota
The only nonattainment area in South Dakota is the TSP nonattainment
area in Rapid City. The State and EPA expect to be able to document that
attainment was achieved at the end of 1982.
F. Utah
The Wasatch Front (Salt Lake, Weber, Davis, Utah, and Tooele
Counties) is the area in Utah with the most significant air pollution
problems. One or more of the counties are nonattainment for CO, 03, TSP,
and S02. Salt Lake, Davis, Weber, and Utah Counties have received time
extensions to meet the CO and/or 03 standards. However, Region VIII
believes that Utah's 1982 CO/03 SIP met all Clean Air Act requirements with
respect to the attainment of the CO standard in Salt Lake County and the 03
standard in Salt Lake and Davis Counties, and has proposed to disapprove the
SIPs. Specifically, the SIP did not contain adequate commitments to implement
the required inspection/maintenance program.
Portions of Salt Lake and Toole County near the Kennecott Copper
Smelter are nonattainment for S02. Recent data suggests that the area of
nonattainment has been narrowed to above 5600 feet in elevation and on
Kennecott property.
Region VIII expects Davis County to be able to document attainment of
the CO standard by 1982 and Salt Lake, Utah, and Weber Counties to document
attainment of the TSP standard by 1982.
Iron County has demonstrated attainment for S02 by 1982, and the
State has submitted a request for redesignation to EPA.
Utah, like Colorado has significant national resources which are
being developed in PSD clean air areas. Development of power plants, shale
oil conversion plants and synfuel facilities may create Class I area air
quality and air quality related value (i.e., visibility and acid deposition)
problems in the future.
G. Wyoming
Sweetwater County, the State's only nonattainment area (for TSP), is
believed to have achieved attainment by the end of 1982. Air quality impacts
in the mining areas of Campbell and Converse Counties and new natural gas
field development in Sublette and Lincoln Counties are of concern because of
potential violations of PSD increments and National Ambient Air Quality
Standards (NAAQS).
image:
 26
Part II:
A. Discussion of Significant Environmental Problems and Implications for
Agency Management"
1. Carbon Monoxide
The CO problems in Colorado (Metro-Denver, Fort Collins,
Greeley, and Colorado Springs), Utah (Salt Lake City), and Montana (Missoula,
Billings, and Great Falls) are caused by mobile sources. Wood stoves in
Missoula are another significant source of CO.
The principal barrier to achievement of the CO standard is the
lack of enough effective and enforceable transportation control strategies
that have acceptable costs and do not entail severe social impacts.
Region VIII requests assistance in the following areas:
a. More data are needed in general to better characterize and
project future emissions of mobile source pollutants at
high altitude, particularly light duty diesel vehicles and
heavy duty gas and diesel vehicles.
b. A research program to investigate emissions from vehicles
using gasohol as fuel.
c. Long term support for the State of Colorado's new Denver
vehicle emissions testing laboratory which is the only
facility EPA and the State now can reliably access.
d. A research program to investigate CO emissions from wood
stoves and CO control techniques for such appliances.
Region VIII plans to disapprove the CO portions of the 1982
Denver and Salt Lake City Attainment Plans because Denver's Episodic
Share-a-ride strategy is unenforceable, not adequately documented, and
unrealistic; while Salt Lake City's Plan did not contain adequate commitments
to implement the required I/M program. The Montana CO problems are less
serious than those in Denver and Salt Lake and will be mitigated by the
imposition of traffic management strategies. CO emissions from wood stoves
will continue to be a problem. Region VIII will continue to work with these
States to develop acceptable strategies.
2. TSP
The TSP problems in the Region are generally caused by auto and
truck exhaust, power plants, smelters, steel plants, fireplaces, wood stoves,
street cleaning, winter sanding, unpaved roads, construction work, demolition
activities, unpaved alleys, and parking areas. Fugitive dust emissions from
image:
26
Part II:
A. Discussion of Significant Environmental Problems and Implications for
Agency Management"
1. Carbon Monoxide
The CO problems in Colorado (Metro-Denver, Fort Collins,
Greeley, and Colorado Springs), Utah (Salt Lake City), and Montana (Missoula,
Billings, and Great Falls) are caused by mobile sources. Wood stoves in
Missoula are another significant source of CO.
The principal barrier to achievement of the CO standard is the
lack of enough effective and enforceable transportation control strategies
that have acceptable costs and do not entail severe social impacts.
Region VIII requests assistance in the following areas:
a. More data are needed in general to better characterize and
project future emissions of mobile source pollutants at
high altitude, particularly light duty diesel vehicles and
heavy duty gas and diesel vehicles.
b. A research program to investigate emissions from vehicles
using gasohol as fuel.
c. Long term support for the State of Colorado's new Denver
vehicle emissions testing laboratory which is the only
facility EPA and the State now can reliably access.
d. A research program to investigate CO emissions from wood
stoves and CO control techniques for such appliances.
Region VIII plans to disapprove the CO portions of the 1982
Denver and Salt Lake City Attainment Plans because Denver's Episodic
Share-a-ride strategy is unenforceable, not adequately documented, and
unrealistic; while Salt Lake City's Plan did not contain adequate commitments
to implement the required I/M program. The Montana CO problems are less
serious than those in Denver and Salt Lake and will be mitigated by the
imposition of traffic management strategies. CO emissions from wood stoves
will continue to be a problem. Region VIII will continue to work with these
States to develop acceptable strategies.
2. TSP
The TSP problems in the Region are generally caused by auto and
truck exhaust, power plants, smelters, steel plants, fireplaces, wood stoves,
street cleaning, winter sanding, unpaved roads, construction work, demolition
activities, unpaved alleys, and parking areas. Fugitive dust emissions from
image:
 27
surface mines are also significant in some areas. Although not directly
related to TSP, visibility reductions due to fine particles is also a problem
in urban areas.
The principal barriers to achievement of the TSP standard are:
a. The difficulty and the cost of controlling the
nontraditional sources, such as fireplaces, wood stoves,
street cleaning, sanding, construction work, etc.
b. The dry, windy conditions typical in Region VIII which
encourage the reentrainment of fugitive dust.
c. The uncertainties resulting from the proposed change to an
inhalable particulate standard.
Region VIII requests assistance in the following areas:
a. Additional research funds directed toward the investigation
of urban haze. The expedited completion of the 1982 Denver
Winter Haze Study. A TSP characterization study for Sale
Lake City.
b. Additional research studies on emissions and control
strategies for residential combustion of wood and coal.
c. A decision on the proposed inhalable particulate standard
and quick promulgation thereafter.
d. Promulgation of exhaust emission standards for diesels.
e. Research to determine the current and future contribution
of diesels to the particulate loading and visibility
reduction problems, and the contribution of diesels to the
atmospheric loading of pollutants other than the NAAQS
pollutants.
3. Ozone
The metropolitan Denver and Salt Lake City areas are the only
two areas in Region VIII that are nonattainment for ozone. The ozone problem
is predominately caused by motor vehicle emissions, e.g., in Denver about 80%
of the VOC and 30% of the NOX emissions are from mobile sources.
EPA Region VIII expects both Denver and Salt Lake City to be
able to meet the ozone standard by 1987.
image:
27
surface mines are also significant in some areas. Although not directly
related to TSP, visibility reductions due to fine particles is also a problem
in urban areas.
The principal barriers to achievement of the TSP standard are:
a. The difficulty and the cost of controlling the
nontraditional sources, such as fireplaces, wood stoves,
street cleaning, sanding, construction work, etc.
b. The dry, windy conditions typical in Region VIII which
encourage the reentrainment of fugitive dust.
c. The uncertainties resulting from the proposed change to an
inhalable particulate standard.
Region VIII requests assistance in the following areas:
a. Additional research funds directed toward the investigation
of urban haze. The expedited completion of the 1982 Denver
Winter Haze Study. A TSP characterization study for Sale
Lake City.
b. Additional research studies on emissions and control
strategies for residential combustion of wood and coal.
c. A decision on the proposed inhalable particulate standard
and quick promulgation thereafter.
d. Promulgation of exhaust emission standards for diesels.
e. Research to determine the current and future contribution
of diesels to the particulate loading and visibility
reduction problems, and the contribution of diesels to the
atmospheric loading of pollutants other than the NAAQS
pollutants.
3. Ozone
The metropolitan Denver and Salt Lake City areas are the only
two areas in Region VIII that are nonattainment for ozone. The ozone problem
is predominately caused by motor vehicle emissions, e.g., in Denver about 80%
of the VOC and 30% of the NOX emissions are from mobile sources.
EPA Region VIII expects both Denver and Salt Lake City to be
able to meet the ozone standard by 1987.
image:
 28
4. Lead
The ASARCO lead smelter in East Helena, Montana is causing
violations of the lead NAAQS. The principal barriers to achievement of the
lead standard is the cost of cleaning up the causes of the problem. Lead is
emitted from point sources, fugitive smelter sources, and also reentrained
from streets and soil from areas that have been contaminated for years.
The State of Montana plans to submit a SIP revision for
attainment of the lead standard in the spring of 1983.
Region VIII requests assistance in the following areas:
a. Evaluation of the contributions of individual sources to
the lead pollution problem.
b. Identification of control technologies for individual
sources which contribute to the lead pollution problem.
c. Control techniques for lead smelter emissions of air toxics
such as cadmium and arsenic.
5. Acid Deposition and Other Air Pollution Effects on the Air
Quality Related Values of Class I Areas.
The Federal Land Managers of Class I areas have been given the
affirmative responsibility by the Clean Air Act to protect the air quality
related values of the lands they manage. Air quality related values (AQRV)
include visibility, flora, and fauna, soils, and water. The PSD regulations
require the impacts of PSD sources emissions on a Class I area's AQRV to be
investigated and quantified. If a proposed PSD source will cause adverse
impacts on the AQRV of a Class I area, the PSD permit can be denied.
Presently, AQRV are of particular concern for the Colorado Flat
Tops and Mt. Zirkel Wilderness areas and the North Dakota Theodore Roosevelt
National Park. The former area may be adversely affected by large scale
development of oil shale reserves. New power plants, synfuel plants, and oil
and gas fields are threatening the AQRV of the latter park. Acid deposition
may already be a problem in the high altitude lakes in Colorado. These high
altitude lakes are extremely sensitive to changes caused by acid deposition.
Two limited Colorado studies suggest that several lakes have already been
affected by acid deposition caused by S0£ and NO? emissions. Regional
visibility impairment in Flat Tops Wilderness and Colorado's western slope may
also result from large scale industrial development.
The principal barrier to the adequate analysis of the effects of
acid deposition and other air pollutants on AQRV are:
image:
28
4. Lead
The ASARCO lead smelter in East Helena, Montana is causing
violations of the lead NAAQS. The principal barriers to achievement of the
lead standard is the cost of cleaning up the causes of the problem. Lead is
emitted from point sources, fugitive smelter sources, and also reentrained
from streets and soil from areas that have been contaminated for years.
The State of Montana plans to submit a SIP revision for
attainment of the lead standard in the spring of 1983.
Region VIII requests assistance in the following areas:
a. Evaluation of the contributions of individual sources to
the lead pollution problem.
b. Identification of control technologies for individual
sources which contribute to the lead pollution problem.
c. Control techniques for lead smelter emissions of air toxics
such as cadmium and arsenic.
5. Acid Deposition and Other Air Pollution Effects on the Air
Quality Related Values of Class I Areas.
The Federal Land Managers of Class I areas have been given the
affirmative responsibility by the Clean Air Act to protect the air quality
related values of the lands they manage. Air quality related values (AQRV)
include visibility, flora, and fauna, soils, and water. The PSD regulations
require the impacts of PSD sources emissions on a Class I area's AQRV to be
investigated and quantified. If a proposed PSD source will cause adverse
impacts on the AQRV of a Class I area, the PSD permit can be denied.
Presently, AQRV are of particular concern for the Colorado Flat
Tops and Mt. Zirkel Wilderness areas and the North Dakota Theodore Roosevelt
National Park. The former area may be adversely affected by large scale
development of oil shale reserves. New power plants, synfuel plants, and oil
and gas fields are threatening the AQRV of the latter park. Acid deposition
may already be a problem in the high altitude lakes in Colorado. These high
altitude lakes are extremely sensitive to changes caused by acid deposition.
Two limited Colorado studies suggest that several lakes have already been
affected by acid deposition caused by S0£ and NO? emissions. Regional
visibility impairment in Flat Tops Wilderness and Colorado's western slope may
also result from large scale industrial development.
The principal barrier to the adequate analysis of the effects of
acid deposition and other air pollutants on AQRV are:
image:
 29
a. The lack of adequate predictive modeling tools that attempt
to quantify the source receptor relationships between acid
deposition and other pollutants, and AQRV.
b. The lack of adequate data to define baseline conditions for
various air quality related values, such as the baseline
conditions of high altitude lakes in the Flat Tops
Wilderness.
Region VIII requests assistance in the following areas:
a. Research funds directed toward meeting the goal of
developing a predictive model to estimate acid deposition
effects and other significant air pollution effects on AQRV
of selected Class I areas in Region VIII.
b. Research funds to provide for the collection of data that
define baseline conditions for significant AQRV in selected
Class I areas in Region VIII.
B. Ranking of Region VIII's Air Quality Problems
Region VIII has ranked the air quality problems into first and second
level priority groups.
The air quality problems assigned to the first level or highest
priority group are the Region's CO, TSP, and lead problems. These problems
were placed on the first level because all three pollutants adversely affect
human health in those geographic areas where the ambient concentrations exceed
the National Ambient Air Quality Standards. The CO and TSP problem areas may
continue to be problem areas well beyond the statutory deadlines for attaining
the pollutant standards. The East Helena lead problem may also continue to be
a problem for some time because of the various barriers discussed above in
Part II.A.
The second level priority group includes the ozone and acid
deposition problems. Ozone concentrations are in excess of the NAAQS in
Denver and Salt Lake and thus pose a threat to human health. However,
indications are that by 1987, ozone will cease to be a major air pollution
problem in Region VIII and for this reason ozone was placed in the second
category. Acid deposition and other effects on air quality related values of
Class I areas will become increasingly more important in the mid to
long-term. In the short-term, in the absence of significant adverse impacts,
it is necessary to define current baseline conditions, develop predictive
models that quantify the cause/effect relationships between increased
industrial emissions and impacts on AQRVs, and develop reference methods for
monitoring air quality related values, such as acid deposition and visibility.
image:
29
a. The lack of adequate predictive modeling tools that attempt
to quantify the source receptor relationships between acid
deposition and other pollutants, and AQRV.
b. The lack of adequate data to define baseline conditions for
various air quality related values, such as the baseline
conditions of high altitude lakes in the Flat Tops
Wilderness.
Region VIII requests assistance in the following areas:
a. Research funds directed toward meeting the goal of
developing a predictive model to estimate acid deposition
effects and other significant air pollution effects on AQRV
of selected Class I areas in Region VIII.
b. Research funds to provide for the collection of data that
define baseline conditions for significant AQRV in selected
Class I areas in Region VIII.
B. Ranking of Region VIII's Air Quality Problems
Region VIII has ranked the air quality problems into first and second
level priority groups.
The air quality problems assigned to the first level or highest
priority group are the Region's CO, TSP, and lead problems. These problems
were placed on the first level because all three pollutants adversely affect
human health in those geographic areas where the ambient concentrations exceed
the National Ambient Air Quality Standards. The CO and TSP problem areas may
continue to be problem areas well beyond the statutory deadlines for attaining
the pollutant standards. The East Helena lead problem may also continue to be
a problem for some time because of the various barriers discussed above in
Part II.A.
The second level priority group includes the ozone and acid
deposition problems. Ozone concentrations are in excess of the NAAQS in
Denver and Salt Lake and thus pose a threat to human health. However,
indications are that by 1987, ozone will cease to be a major air pollution
problem in Region VIII and for this reason ozone was placed in the second
category. Acid deposition and other effects on air quality related values of
Class I areas will become increasingly more important in the mid to
long-term. In the short-term, in the absence of significant adverse impacts,
it is necessary to define current baseline conditions, develop predictive
models that quantify the cause/effect relationships between increased
industrial emissions and impacts on AQRVs, and develop reference methods for
monitoring air quality related values, such as acid deposition and visibility.
image:
 30
C. List of Emerging Problems In Region VIII
1. Acid Deposition
This is discussed in Part II.A.5.
2. Emissions from Diesel Vehicles
Preliminary results from a study conducted by the Colorado
Department of Health indicate that the projected increase in numbers of diesel
cars and light duty trucks by the year 2000 would have serious impacts on
Colorado's air quality and possible implications for public health. Diesel
particulates and some hydrocarbons in diesel emissions contain carcinogenic
materials, and may affect lung clearance mechanisms, damage lung tissue, and
adversely affect pulmonary defense mechanisms. Although the Colorado Health
Department has indicated the most interest in this issue so far, the impacts
of diesel emissions would be felt in the larger metropolitan areas across the
Region and the nation. More research needs to be done on these potential
health impacts.
3. Organic Compound Emissions from Wood Stoves and Fireplaces
Woodburning appliances may produce potentially hazardous
emissions of pollutants other than those for which a National Ambient Air
Quality Standard exists. More research is needed to characterize the wood
stove emissions and to document the effect of exposure to these emissions.
4. Indoor Air Pollution.
To combat rising heating costs, homeowners are turning to
superinsulation, space heaters, and other alternative heating technologies.
As a result, there is growing concern about the public health effects of
indoor air pollutants such as carbon monoxide and formaldehyde. More
information is needed on the chronic effects of exposures to these pollutants.
5. Availability of Complex Terrain and Long Range Transport and
Diffusion Models.'
Research must continue on the development and validation of
models that predict air quality concentrations in the vicinity of complex
terrain and also at receptors much greater than 50 km from an emissions
source. Such models would be used routinely in PSD permit modeling analyzes
in Colorado, Montana, North Dakota, and Utah.
6. Cadmium and Arsenic Levels in East Helena.
This emerging problem is referred above in Part II.A.4.
image:
30
C. List of Emerging Problems In Region VIII
1. Acid Deposition
This is discussed in Part II.A.5.
2. Emissions from Diesel Vehicles
Preliminary results from a study conducted by the Colorado
Department of Health indicate that the projected increase in numbers of diesel
cars and light duty trucks by the year 2000 would have serious impacts on
Colorado's air quality and possible implications for public health. Diesel
particulates and some hydrocarbons in diesel emissions contain carcinogenic
materials, and may affect lung clearance mechanisms, damage lung tissue, and
adversely affect pulmonary defense mechanisms. Although the Colorado Health
Department has indicated the most interest in this issue so far, the impacts
of diesel emissions would be felt in the larger metropolitan areas across the
Region and the nation. More research needs to be done on these potential
health impacts.
3. Organic Compound Emissions from Wood Stoves and Fireplaces
Woodburning appliances may produce potentially hazardous
emissions of pollutants other than those for which a National Ambient Air
Quality Standard exists. More research is needed to characterize the wood
stove emissions and to document the effect of exposure to these emissions.
4. Indoor Air Pollution.
To combat rising heating costs, homeowners are turning to
superinsulation, space heaters, and other alternative heating technologies.
As a result, there is growing concern about the public health effects of
indoor air pollutants such as carbon monoxide and formaldehyde. More
information is needed on the chronic effects of exposures to these pollutants.
5. Availability of Complex Terrain and Long Range Transport and
Diffusion Models.'
Research must continue on the development and validation of
models that predict air quality concentrations in the vicinity of complex
terrain and also at receptors much greater than 50 km from an emissions
source. Such models would be used routinely in PSD permit modeling analyzes
in Colorado, Montana, North Dakota, and Utah.
6. Cadmium and Arsenic Levels in East Helena.
This emerging problem is referred above in Part II.A.4.
image:
 31
7. Potential Air Quality Problems on Indian Reservations within
Region VIII.
Indian tribes in Region VIII are generally very interested in
preserving their excellent air quality. The Northern Cheyennes (MT) and
Flathead Indians (MT) have already redesignated their reservations to PSD
Class I. Development of energy resources near the reservations may create
Class I or Class II PSD increment violations on the reservations. Other
reservations, such as the Crow Indian Reservation are interested in developing
their mineral resources. Such development can produce air quality problems on
their reservation as well as on neighboring lands. Presently, EPA grants are
being used by Indian tribes for baseline data collection, regulation,
development, and PSD area redesignation studies.
image:
31
7. Potential Air Quality Problems on Indian Reservations within
Region VIII.
Indian tribes in Region VIII are generally very interested in
preserving their excellent air quality. The Northern Cheyennes (MT) and
Flathead Indians (MT) have already redesignated their reservations to PSD
Class I. Development of energy resources near the reservations may create
Class I or Class II PSD increment violations on the reservations. Other
reservations, such as the Crow Indian Reservation are interested in developing
their mineral resources. Such development can produce air quality problems on
their reservation as well as on neighboring lands. Presently, EPA grants are
being used by Indian tribes for baseline data collection, regulation,
development, and PSD area redesignation studies.
image:
 32
ATTACHMENT A
III. AIR QUALITY OVERVIEW
Region VIII air quality problems can be categorized Into two
classes: those associated with the urban/industrial nonattainment areas and
those associated with the emerging development of natural resources In clean
air PSD areas. This air quality section will address the significant air
quality problems within specific geographic areas In each of the Region VIII
states. Figures 3 through 9 present Region VIII maps illustrating those 1981
sites where monitoring data was collected and those sites which experienced
exceedances of alert levels and ambient standards for the pollutants TSP, CO,
03, SO?, N02, and lead. The maps also locate those existing and
potential PSD problem areas.
A. Colorado
Colorado has six nonattainment areas in urban/industrial areas:
Metropolitan Denver, Fort Collins, Greeley, Colorado Springs, Pueblo, and
Grand Junction. Of this six, the Denver metropolitan area is the most
significant problem area in terms of affected geographic area, frequency of
alerts, and violation days, and magnitude of pollutant levels for TSP, CO,
03, and N02.
1. Denver
Figure 10 and Tables 1 and 2 illustrate the metro Denver
monitoring sites and locations where the exceedances of NAAQS pollutant
standards and alert levels were observed.
NO? levels in Denver have been declining over the past five
years (1977-1981). The State of Colorado has submitted a request to
redesignate the metro-Denver area from nonattainment to attainment for N02.
On February 15, 1933, EPA proposed to approve the redesignation to attainment.
The 1981 average of the annual TSP geometric means for all TSP
stations in Denver was the lowest average in five years. The year 1981 had
the fewest number of TSP alert days (11) and TSP primary standard violation
days (39) in the past three years (1981-1979 data). The number of TSP alert
days and primary violation days for Denver in 1979 was 27 and 51
respectively. Current data suggests that the Boulder, Douglas, and Jefferson
Counties portion of the metro-Denver TSP nonattainment area will be able to
document compliance with TSP standards. This effectively reduces the size of
the metropolitan Denver TSP nonattainment area by two-thirds. (Denver and
portions of Adams and Arapahoe counties would then constitute the TSP
nonattainment area.) The Denver TSP emissions come from power plants,
fireplaces, mobile sources, street cleaning and sanding, demolition and
construction activities, and parking areas.
image:
32
ATTACHMENT A
III. AIR QUALITY OVERVIEW
Region VIII air quality problems can be categorized Into two
classes: those associated with the urban/industrial nonattainment areas and
those associated with the emerging development of natural resources In clean
air PSD areas. This air quality section will address the significant air
quality problems within specific geographic areas In each of the Region VIII
states. Figures 3 through 9 present Region VIII maps illustrating those 1981
sites where monitoring data was collected and those sites which experienced
exceedances of alert levels and ambient standards for the pollutants TSP, CO,
03, SO?, N02, and lead. The maps also locate those existing and
potential PSD problem areas.
A. Colorado
Colorado has six nonattainment areas in urban/industrial areas:
Metropolitan Denver, Fort Collins, Greeley, Colorado Springs, Pueblo, and
Grand Junction. Of this six, the Denver metropolitan area is the most
significant problem area in terms of affected geographic area, frequency of
alerts, and violation days, and magnitude of pollutant levels for TSP, CO,
03, and N02.
1. Denver
Figure 10 and Tables 1 and 2 illustrate the metro Denver
monitoring sites and locations where the exceedances of NAAQS pollutant
standards and alert levels were observed.
NO? levels in Denver have been declining over the past five
years (1977-1981). The State of Colorado has submitted a request to
redesignate the metro-Denver area from nonattainment to attainment for N02.
On February 15, 1933, EPA proposed to approve the redesignation to attainment.
The 1981 average of the annual TSP geometric means for all TSP
stations in Denver was the lowest average in five years. The year 1981 had
the fewest number of TSP alert days (11) and TSP primary standard violation
days (39) in the past three years (1981-1979 data). The number of TSP alert
days and primary violation days for Denver in 1979 was 27 and 51
respectively. Current data suggests that the Boulder, Douglas, and Jefferson
Counties portion of the metro-Denver TSP nonattainment area will be able to
document compliance with TSP standards. This effectively reduces the size of
the metropolitan Denver TSP nonattainment area by two-thirds. (Denver and
portions of Adams and Arapahoe counties would then constitute the TSP
nonattainment area.) The Denver TSP emissions come from power plants,
fireplaces, mobile sources, street cleaning and sanding, demolition and
construction activities, and parking areas.
image:
 33
The number of days in violation of the ozone standard in both
1981 and 1980 in Denver was three. The corresponding numbers for 1979, 1978,
and 1977 were 12, 5, and 15. There was only one instance of the ozone alert
level being reached in the years 1977-1981. This occurred in 1978. The
highest second maximum values occurred at different stations each year.
However, the data do indicate improvement. The worst case of ozone violations
in 1978 were 43% over the standard, compared to 7% and 142 in 1980 and 1981
respectively. VOC and NOg emissions from mobile and stationary sources
produce the high ozone levels. Federal exhaust emission standards, the State
I/M program, and VOC regulations for stationary sources provide the necessary
reductions to reasonably predict attainment by 1987. Denver has received an
ozone attainment deadline extension until 1987. Region VIII has proposed to
approve the 1982 Denver ozone SIP because attainment is expected by 1987.
CO is and will continue to be a serious air pollution problem in
Denver for some time to come. Highest second maximum 1981 CO levels in Denver
were as great or greater than the 1980 levels for both the 1 and 8 hour CO
averages at nearly every one of the Denver CO stations. The number of days
during which the 1 and 8 hour CO standards were exceeded in 1981 were greater
than the number of days in 1980. However, the number of violation days in
1981 was approximately one-half the number of violation days in either 1978 or
1979. In 1981, the second highest 1-hour CO concentration was 57% over the CQ.
standard, while the second highest 8-hour CO concentration was 209% over the
CO standard. The comparable figures for 1980 were 18% and 137%; and for 1979,
29% and 173% respectively. Mobile sources are the major source of CO
emissions in Denver. In 1978, CO emissions from mobile sources accounted for
94% of the total Denver CO emissions.
Region VIII has proposed to disapprove the Denver CO SIP because
it failed to demonstrate attainment of the CO standard by 1987. The CO plan
relied on a voluntary episodic share-a-ride strategy that was unenforceable
and, in conjunction with other strategies, would not provide the necessary CO
emission reductions to achieve compliance by 1987. The State of Colorado
faces the difficult task of finding other economically viable, socially
acceptable, enforceable strategies that will produce the needed CO emission
reductions. Without additional strategies, CO attainment may not be achieved
until the early 1990's. The State of Colorado's position is that the episodic
share-a-ride strategy is a viable strategy, that, if followed, would show
attainment of the CO standard by 1987.
2. Fort Collins and Sreeley
The Fort Collins and Greeley areas are nonattainment for CO.
Region VIII has proposed to approve their CO SIP's because they acceptably
demonstrate attainment by 1987. The CO problems in both cities are localized
and infrequent and generally associated with meteorological inversion
conditions in the winter. The major source of CO emissions are mobile
sources. No violations of the 1-hour standard have been recorded. In the
years 1979-1981, Fort Collins has experienced 9-19 violation of the 8-hour
standard per year; while Sreeley has experienced 8-10 violations per year.
image:
33
The number of days in violation of the ozone standard in both
1981 and 1980 in Denver was three. The corresponding numbers for 1979, 1978,
and 1977 were 12, 5, and 15. There was only one instance of the ozone alert
level being reached in the years 1977-1981. This occurred in 1978. The
highest second maximum values occurred at different stations each year.
However, the data do indicate improvement. The worst case of ozone violations
in 1978 were 43% over the standard, compared to 7% and 142 in 1980 and 1981
respectively. VOC and NOg emissions from mobile and stationary sources
produce the high ozone levels. Federal exhaust emission standards, the State
I/M program, and VOC regulations for stationary sources provide the necessary
reductions to reasonably predict attainment by 1987. Denver has received an
ozone attainment deadline extension until 1987. Region VIII has proposed to
approve the 1982 Denver ozone SIP because attainment is expected by 1987.
CO is and will continue to be a serious air pollution problem in
Denver for some time to come. Highest second maximum 1981 CO levels in Denver
were as great or greater than the 1980 levels for both the 1 and 8 hour CO
averages at nearly every one of the Denver CO stations. The number of days
during which the 1 and 8 hour CO standards were exceeded in 1981 were greater
than the number of days in 1980. However, the number of violation days in
1981 was approximately one-half the number of violation days in either 1978 or
1979. In 1981, the second highest 1-hour CO concentration was 57% over the CQ.
standard, while the second highest 8-hour CO concentration was 209% over the
CO standard. The comparable figures for 1980 were 18% and 137%; and for 1979,
29% and 173% respectively. Mobile sources are the major source of CO
emissions in Denver. In 1978, CO emissions from mobile sources accounted for
94% of the total Denver CO emissions.
Region VIII has proposed to disapprove the Denver CO SIP because
it failed to demonstrate attainment of the CO standard by 1987. The CO plan
relied on a voluntary episodic share-a-ride strategy that was unenforceable
and, in conjunction with other strategies, would not provide the necessary CO
emission reductions to achieve compliance by 1987. The State of Colorado
faces the difficult task of finding other economically viable, socially
acceptable, enforceable strategies that will produce the needed CO emission
reductions. Without additional strategies, CO attainment may not be achieved
until the early 1990's. The State of Colorado's position is that the episodic
share-a-ride strategy is a viable strategy, that, if followed, would show
attainment of the CO standard by 1987.
2. Fort Collins and Sreeley
The Fort Collins and Greeley areas are nonattainment for CO.
Region VIII has proposed to approve their CO SIP's because they acceptably
demonstrate attainment by 1987. The CO problems in both cities are localized
and infrequent and generally associated with meteorological inversion
conditions in the winter. The major source of CO emissions are mobile
sources. No violations of the 1-hour standard have been recorded. In the
years 1979-1981, Fort Collins has experienced 9-19 violation of the 8-hour
standard per year; while Sreeley has experienced 8-10 violations per year.
image:
 34
Both cities had 1981 second maximum 8-hour CO concentrations in excess of the
standards by about 30%, The 1987 attainment of the CO standard will be
achieved by the Federal Motor Vehicle Control Program, traffic flow
improvements, and in the case of Fort Collins, an I/M program.
3. Colorado Springs
The Colorado Springs area is nonattainment for CO and TSP.
Region VIII has proposed to approve the CO SIP because attainment is
demonstrated by 1987 with the Federal Motor Vehicle Control Program, an I/M
program, traffic flow improvements and improved mass transit. The 1-hour CO
standard has only been violated once in the Springs since 1979. The number of
violations of the 8-hour CO standard have been declining since 1979. The year
1981 produced the fewest CO violations (4) in the past three years.
The Colorado Springs TSP data indicate no violations of the TS?
primary standards in 1981. The violations observed in the years 1977-1980
have been of the annual TSP standard. There have been no violations of the
24-hour TSP primary standard since 1977. This area is expected to be able to
document attainment of the TSP standard by 1982 once the 1982 air quality data
are analyzed.
4. Grand Junction
The Grand Junction area, a TSP nonattainment area, is expected
to be able to document attainment of the TSP standards by 1982, once the 1982
data is analyzed. The 1981 annual TSP levels were about 5% above the
75 ug/m3 TSP standard.
5. Pueblo
The Pueblo TSP nonattainment area's major industrial TSP source
is an integrated iron and steel plant. The violations of the TSP standards
are primarily those of the annual standard rather than the 24-hour standard.
The 1981 and January to June 1982 TSP data indicate significantly lower TSP
levels than those recorded in the preceeding four years 1977-1980. EPA is
currently reviewing data to assess whether or not the ambient improvement
should be attributed to the fact that the steel plant operated at a much
reduced capacity during this time period. Region VIII conditionally approved
the 1979 Pueblo TSP SIP requiring an attainment demonstration of the annual
and 24-hour standards and Reasonably Available Control Technology (RACT)
controls. In December 1982, EPA Region VIII received a complete revision to
the RACT portion of the SIP which require controls to be applied beginning in
1984. We are presently reviewing this SIP revision. Promulgation of an
inhalable particulate (IP) standard may change the area's status to attainment
and negate the need for further RACT controls.
image:
34
Both cities had 1981 second maximum 8-hour CO concentrations in excess of the
standards by about 30%, The 1987 attainment of the CO standard will be
achieved by the Federal Motor Vehicle Control Program, traffic flow
improvements, and in the case of Fort Collins, an I/M program.
3. Colorado Springs
The Colorado Springs area is nonattainment for CO and TSP.
Region VIII has proposed to approve the CO SIP because attainment is
demonstrated by 1987 with the Federal Motor Vehicle Control Program, an I/M
program, traffic flow improvements and improved mass transit. The 1-hour CO
standard has only been violated once in the Springs since 1979. The number of
violations of the 8-hour CO standard have been declining since 1979. The year
1981 produced the fewest CO violations (4) in the past three years.
The Colorado Springs TSP data indicate no violations of the TS?
primary standards in 1981. The violations observed in the years 1977-1980
have been of the annual TSP standard. There have been no violations of the
24-hour TSP primary standard since 1977. This area is expected to be able to
document attainment of the TSP standard by 1982 once the 1982 air quality data
are analyzed.
4. Grand Junction
The Grand Junction area, a TSP nonattainment area, is expected
to be able to document attainment of the TSP standards by 1982, once the 1982
data is analyzed. The 1981 annual TSP levels were about 5% above the
75 ug/m3 TSP standard.
5. Pueblo
The Pueblo TSP nonattainment area's major industrial TSP source
is an integrated iron and steel plant. The violations of the TSP standards
are primarily those of the annual standard rather than the 24-hour standard.
The 1981 and January to June 1982 TSP data indicate significantly lower TSP
levels than those recorded in the preceeding four years 1977-1980. EPA is
currently reviewing data to assess whether or not the ambient improvement
should be attributed to the fact that the steel plant operated at a much
reduced capacity during this time period. Region VIII conditionally approved
the 1979 Pueblo TSP SIP requiring an attainment demonstration of the annual
and 24-hour standards and Reasonably Available Control Technology (RACT)
controls. In December 1982, EPA Region VIII received a complete revision to
the RACT portion of the SIP which require controls to be applied beginning in
1984. We are presently reviewing this SIP revision. Promulgation of an
inhalable particulate (IP) standard may change the area's status to attainment
and negate the need for further RACT controls.
image:
 35
6. Western Colorado
A potential long term emerging problem may be the large scale
development of oil shale resources in Garfield and Rio Blanco Counties in
western Colorado. EPA Region VIII has permitted five oil shale projects with
a combined production of 63,000 barrels per day of shale oil. Presently,
Region VIII has three additional projects under PSD review that, if permitted,
will provide an additional 192,000 barrels per day of shale oil. Projects in
the proposal stage could ultimately boost shale oil production in these two
Colorado counties to 750,000 barrels per day. The major air quality issues
are the consumption of the Class I S02 increment in Flat Tops Wilderness
(Class I area), acid deposition and other air quality related values impacts
on Flat Tops, and the air quality impact associated with large scale
industrial growth and population influx in a predominately rural area.
The recession has slowed down plans for oil shale development in 1982.
However, interest in oil shale development in the west has always been
cyclical, and there is some indication that energy companies are once again
willing to proceed with oil shale development albeit at a reduced level.
Several mountain communities, such as Aspen, Steamboat Springs, and...
Vail, as well as many other areas in the State have experienced violations of
the annual and 24-hour particulate NAAQS. The problems are caused by rural
fugitive dust or by non-conventional sources such as street sanding and
fireplace/wood stove emissions. CO may also be a problem in these communities.
B. Montana
Montana has eight nonattainment areas for TSP, S02, CO, and lead:
Billings (SO? and CO); Butte (TSP); Colstrip (TSP); Columbia Falls (TSP);
East Helena 7S02 and lead); Great Falls (CO); Laurel (SO?), and Missoula
(TSP, and CO).
Billings CO emissions stem mainly from mobile sources and wood-fired
home heating devices. The CO problem in Billings is very localized. The
Federal Motor Vehicle Control Program and reconstruction of a roadway
intersection to improve traffic flow were the strategies used to show
attainment of the CO standard by 1982. However, the roadway reconstruction
was delayed and statutory requirements prevented EPA from granting Billings a
CO extension until 1983 because the time for application for the CO/03
extension had passed. EPA Region VIII will approve the reconstruction as a
control measure, but must disapprove the schedule showing compliance after
1982. In 1981, there were no violations of the 1 or 8-hour CO standard in
Billings.
Based on S02 data the State is currently gathering in Billings, it
is anticipated that there will be violations of the S02 NAAQS in that
community. If this persists, the State may have to designate Billings as a
nonattainment area for SO?.
image:
35
6. Western Colorado
A potential long term emerging problem may be the large scale
development of oil shale resources in Garfield and Rio Blanco Counties in
western Colorado. EPA Region VIII has permitted five oil shale projects with
a combined production of 63,000 barrels per day of shale oil. Presently,
Region VIII has three additional projects under PSD review that, if permitted,
will provide an additional 192,000 barrels per day of shale oil. Projects in
the proposal stage could ultimately boost shale oil production in these two
Colorado counties to 750,000 barrels per day. The major air quality issues
are the consumption of the Class I S02 increment in Flat Tops Wilderness
(Class I area), acid deposition and other air quality related values impacts
on Flat Tops, and the air quality impact associated with large scale
industrial growth and population influx in a predominately rural area.
The recession has slowed down plans for oil shale development in 1982.
However, interest in oil shale development in the west has always been
cyclical, and there is some indication that energy companies are once again
willing to proceed with oil shale development albeit at a reduced level.
Several mountain communities, such as Aspen, Steamboat Springs, and...
Vail, as well as many other areas in the State have experienced violations of
the annual and 24-hour particulate NAAQS. The problems are caused by rural
fugitive dust or by non-conventional sources such as street sanding and
fireplace/wood stove emissions. CO may also be a problem in these communities.
B. Montana
Montana has eight nonattainment areas for TSP, S02, CO, and lead:
Billings (SO? and CO); Butte (TSP); Colstrip (TSP); Columbia Falls (TSP);
East Helena 7S02 and lead); Great Falls (CO); Laurel (SO?), and Missoula
(TSP, and CO).
Billings CO emissions stem mainly from mobile sources and wood-fired
home heating devices. The CO problem in Billings is very localized. The
Federal Motor Vehicle Control Program and reconstruction of a roadway
intersection to improve traffic flow were the strategies used to show
attainment of the CO standard by 1982. However, the roadway reconstruction
was delayed and statutory requirements prevented EPA from granting Billings a
CO extension until 1983 because the time for application for the CO/03
extension had passed. EPA Region VIII will approve the reconstruction as a
control measure, but must disapprove the schedule showing compliance after
1982. In 1981, there were no violations of the 1 or 8-hour CO standard in
Billings.
Based on S02 data the State is currently gathering in Billings, it
is anticipated that there will be violations of the S02 NAAQS in that
community. If this persists, the State may have to designate Billings as a
nonattainment area for SO?.
image:
 The State of Montana will redesignate the Butte TSP nonattainment
area to attainment. The major cause of the TSP problem, an open pit copper
mine, has been shut down and Its State air permit rescinded.
The Col strip TSP nonattainment area is expected to be able to
demonstrate attainment once the 1982 data is analyzed. This area has numerous
large surface coal mines. The State of Montana has been permitting surface
mines and requiring strict fugitive dust controls.
The Columbia Falls TSP area is expected to be able to demonstrate
attainment once the 1982 data is analyzed. The TSP problem is caused
primarily by fugitive dust. The State is expected to redesignate this area to
attainment.
The East Helena nonattainment area's S02 and lead problems are
caused by a lead smelter. The S02 area will be redesignated to attainment
because the double contact acid plant control technology the smelter has
employed has drastically reduced S02 emissions. However, this area is not
meeting the lead national.ambient air quality standard. Lead is emitted from
point sources, fugitive sources and also reentrained from streets and soils
that have been contaminated for years. The State of Montana has analyzed the
problem and plans to submit in the spring of 1983 a plan to show attainment,of
the lead standard. The annual concentrations of cadmium and arsenic are the
highest in the State of Montana.
The CO problem in Great Falls is generally localized and caused by
motor vehicle emissions, wood stove emissions, and unique meteorological
conditions. However, there is no approved CO SIP for Great Falls. The State
plans to submit a CO SIP for Great Falls in the spring of 1983.
Laurel S02 emissions come primarily from an oil refinery.
Stationary source controls on the refinery has reduced S02 emissions and it
is believed that attainment may have been achieved. This will be verified
with the 1982 and 1983 data.
The Missoula area is not expected to demonstrate that attainment of
the CO and TSP standard was achieved at the end of 1982. The Missoula TS?
problem is probably the most significant TSP problem in the State. The
topography, meteorology, Kraft paper mill emissions, and the large number of
wood burning stoves and fireplaces produce this problem. EPA Region VIII had
approved the TSP SIP but attainment has not been achieved and will not be for
several years to come. Organic compound emissions from stoves and fireplaces
may well pose a new health hazard to Missoula residents. Missoula appears to
have an area wide CO problem as a result of the rapid proliferation of wood
stoves. The city was originally designated nonattainment of CO on the basis
of CO data collected near a problem intersection. That problem is being
image:
The State of Montana will redesignate the Butte TSP nonattainment
area to attainment. The major cause of the TSP problem, an open pit copper
mine, has been shut down and Its State air permit rescinded.
The Col strip TSP nonattainment area is expected to be able to
demonstrate attainment once the 1982 data is analyzed. This area has numerous
large surface coal mines. The State of Montana has been permitting surface
mines and requiring strict fugitive dust controls.
The Columbia Falls TSP area is expected to be able to demonstrate
attainment once the 1982 data is analyzed. The TSP problem is caused
primarily by fugitive dust. The State is expected to redesignate this area to
attainment.
The East Helena nonattainment area's S02 and lead problems are
caused by a lead smelter. The S02 area will be redesignated to attainment
because the double contact acid plant control technology the smelter has
employed has drastically reduced S02 emissions. However, this area is not
meeting the lead national.ambient air quality standard. Lead is emitted from
point sources, fugitive sources and also reentrained from streets and soils
that have been contaminated for years. The State of Montana has analyzed the
problem and plans to submit in the spring of 1983 a plan to show attainment,of
the lead standard. The annual concentrations of cadmium and arsenic are the
highest in the State of Montana.
The CO problem in Great Falls is generally localized and caused by
motor vehicle emissions, wood stove emissions, and unique meteorological
conditions. However, there is no approved CO SIP for Great Falls. The State
plans to submit a CO SIP for Great Falls in the spring of 1983.
Laurel S02 emissions come primarily from an oil refinery.
Stationary source controls on the refinery has reduced S02 emissions and it
is believed that attainment may have been achieved. This will be verified
with the 1982 and 1983 data.
The Missoula area is not expected to demonstrate that attainment of
the CO and TSP standard was achieved at the end of 1982. The Missoula TS?
problem is probably the most significant TSP problem in the State. The
topography, meteorology, Kraft paper mill emissions, and the large number of
wood burning stoves and fireplaces produce this problem. EPA Region VIII had
approved the TSP SIP but attainment has not been achieved and will not be for
several years to come. Organic compound emissions from stoves and fireplaces
may well pose a new health hazard to Missoula residents. Missoula appears to
have an area wide CO problem as a result of the rapid proliferation of wood
stoves. The city was originally designated nonattainment of CO on the basis
of CO data collected near a problem intersection. That problem is being
image:
 37
addressed through the redesign and reconstruction of the intersection.
However, the construction phase of the project will not be completed until
1985. EPA was forced to deny Missoula's request for a CO deadline extension
beyond 1982 because the extension application was submitted too late.
C. North Dakota
North Dakota is in attainment of the primary TSP, S02, N02, 03,
and lead national ambient air quality standards.3 There are no
nonattainment areas in the State.
The State of North Dakota has operated the Prevention of Significant
Deterioration (PSD) air program since May of 1977. North Dakota has large
reserves of coal, oil, and natural gas located in the west central part of the
State, commonly referred to as the Williston Basin. Located near the areas of
existing and potential resource development are the Theodore Roosevelt
National Park (TRNP) and the Lostwood National Wilderness Area (LWNA), both of
which are classified as Class I areas under the Clean Air Act. Several
facilities have been constructed in western North Dakota which were not
subject to PSD requirements at the time. These existing facilities generally
did not employ best technology for reducing emissions of sulfur dioxide.
Between the time that the North Dakota PSD program was initiated and early
1980, a total of ten PSD increment consuming facilities were permitted in
western North Dakota and in extreme eastern Montana. These facilities, which
includes the nation's first coal gasification plant at Beulah, North Dakota,
were predicted to consume the entire sulfur dioxide 24-hour Class I increment
at the TRNP based on the use of the approved EPA atmospheric dispersion models.
Since early 1980, six additional western North Dakota potential
sources, including two power plants, one coal gasification plant, and three
natural gas desulfurization plants have applied for PSD permits. The
investment for these planned facilities totals approximately 5.6 billion
dollars. Five of these facilities have since received PSD permits.
More sophisticated and appropriate atmospheric dispersion models than
those previously used were proposed for regulatory approval and use by the
North Dakota State Department of Health and several of the six new PSD permit
applicants. After much research and public comment, the Department of Health
chose and modified a mesoscale atmospheric dispersion model to predict air
quality impacts within 250 km of an air pollution source.
The State model showed that the Class I S02 short-term increments
would be exceeded at TRNP with operation of only the ten PSD sources permitted
prior to early 1980. The model showed that the number and magnitude of
exceedances of the Class I S02 short-term increments would be increased if
five of the six proposed facilities were built. A sixth facility was shown
not to contribute significantly to any exceedancas of the Class 1 increment,
and it thus received a PSD permit. The other five facilities have applied for
and received a certification of "no adverse impact" on air quality related
values at TRNP and LNWA from the Department of the Interior (DOI). The State
image:
37
addressed through the redesign and reconstruction of the intersection.
However, the construction phase of the project will not be completed until
1985. EPA was forced to deny Missoula's request for a CO deadline extension
beyond 1982 because the extension application was submitted too late.
C. North Dakota
North Dakota is in attainment of the primary TSP, S02, N02, 03,
and lead national ambient air quality standards.3 There are no
nonattainment areas in the State.
The State of North Dakota has operated the Prevention of Significant
Deterioration (PSD) air program since May of 1977. North Dakota has large
reserves of coal, oil, and natural gas located in the west central part of the
State, commonly referred to as the Williston Basin. Located near the areas of
existing and potential resource development are the Theodore Roosevelt
National Park (TRNP) and the Lostwood National Wilderness Area (LWNA), both of
which are classified as Class I areas under the Clean Air Act. Several
facilities have been constructed in western North Dakota which were not
subject to PSD requirements at the time. These existing facilities generally
did not employ best technology for reducing emissions of sulfur dioxide.
Between the time that the North Dakota PSD program was initiated and early
1980, a total of ten PSD increment consuming facilities were permitted in
western North Dakota and in extreme eastern Montana. These facilities, which
includes the nation's first coal gasification plant at Beulah, North Dakota,
were predicted to consume the entire sulfur dioxide 24-hour Class I increment
at the TRNP based on the use of the approved EPA atmospheric dispersion models.
Since early 1980, six additional western North Dakota potential
sources, including two power plants, one coal gasification plant, and three
natural gas desulfurization plants have applied for PSD permits. The
investment for these planned facilities totals approximately 5.6 billion
dollars. Five of these facilities have since received PSD permits.
More sophisticated and appropriate atmospheric dispersion models than
those previously used were proposed for regulatory approval and use by the
North Dakota State Department of Health and several of the six new PSD permit
applicants. After much research and public comment, the Department of Health
chose and modified a mesoscale atmospheric dispersion model to predict air
quality impacts within 250 km of an air pollution source.
The State model showed that the Class I S02 short-term increments
would be exceeded at TRNP with operation of only the ten PSD sources permitted
prior to early 1980. The model showed that the number and magnitude of
exceedances of the Class I S02 short-term increments would be increased if
five of the six proposed facilities were built. A sixth facility was shown
not to contribute significantly to any exceedancas of the Class 1 increment,
and it thus received a PSD permit. The other five facilities have applied for
and received a certification of "no adverse impact" on air quality related
values at TRNP and LNWA from the Department of the Interior (DOI). The State
image:
 38
has subsequently issued PSD permits for four of these five facilities. The
remaining facility is still undergoing State review for concerns other than
Class I impact. EPA Region VIII has approved the State of North Dakota's use
of nonguideline model fMesopuff) on a case-by-case basis in these recent PSD
new source reviews.
In March of 1983, EPA Region VIII awarded a grant to the North Dakota
State Department of Health for the purpose of studying the feasibility of
establishing an emissions trading program in the western half of the State.
While present projected ambient levels of air pollutants in North Dakota are
not anticipated to have an adverse impact on the air quality related values of
the Class I areas (and western North Dakota in general), it is believed that
the existing air resource is finite and the atmospheric loading of
particulates and S02 can reach adverse levels in the future. Several older
coal-fired and other facilities are operating without modern control equipment
for S02 and particulates. These facilities were constructed and began
operating prior to the present regulatory emission limitations and control
device effeciencies. It appears that retrofitting these sources with modern
control equipment can reduce atmospheric loading and may provide offsets and
room for growth for new facilities. The State expects to have an operational
program by 1985.
D. South Dakota
Rapid City is a TSP nonattainment area and is the only nonattainment'
area in South Dakota. EPA Region VIII has recently funded two studies for
this area to better understand the problem. The first effort was an emission
inventory for all TSP sources. The draft report shows that only 35% of the
emissions are from point sources with the other 65% from area sources and
fugitive emissions. As of December 31, 1982, only one main point source is
considered to be out of compliance - the State Cement Plant. The State Cement
Plant has a plan to bring their facility into compliance by April 1983 and is
the subject of EPA enforcement action to prevent the plant from operating the
violating sources until controls are installed. The second task was to
compile all the meteorological and TSP data collected and perform statistical
tests to help estimate the ambient impact of the traditional versus
nontraditional sources. The Rapid City area currently has an approved TSP SIP
which demonstrates attainment by the end of 1982.
EPA Region VIII now believes that Rapid City is close to attaining
the TS? standard and will have to wait for a couple of quarters of 1983 data
before concluding that the area has or has not attained. The State is in the
process of determining if all of the SIP requirements for attainment have been
completed.
E. Utah
Utah has six areas designated as nonattainment for one or more
pollutants: Salt Lake City and County (CO, Ch, SO?, TSP); Ogden (CO and
TSP); Cedar City (SO?); and Toole County (S02J. Violations of the lead
image:
38
has subsequently issued PSD permits for four of these five facilities. The
remaining facility is still undergoing State review for concerns other than
Class I impact. EPA Region VIII has approved the State of North Dakota's use
of nonguideline model fMesopuff) on a case-by-case basis in these recent PSD
new source reviews.
In March of 1983, EPA Region VIII awarded a grant to the North Dakota
State Department of Health for the purpose of studying the feasibility of
establishing an emissions trading program in the western half of the State.
While present projected ambient levels of air pollutants in North Dakota are
not anticipated to have an adverse impact on the air quality related values of
the Class I areas (and western North Dakota in general), it is believed that
the existing air resource is finite and the atmospheric loading of
particulates and S02 can reach adverse levels in the future. Several older
coal-fired and other facilities are operating without modern control equipment
for S02 and particulates. These facilities were constructed and began
operating prior to the present regulatory emission limitations and control
device effeciencies. It appears that retrofitting these sources with modern
control equipment can reduce atmospheric loading and may provide offsets and
room for growth for new facilities. The State expects to have an operational
program by 1985.
D. South Dakota
Rapid City is a TSP nonattainment area and is the only nonattainment'
area in South Dakota. EPA Region VIII has recently funded two studies for
this area to better understand the problem. The first effort was an emission
inventory for all TSP sources. The draft report shows that only 35% of the
emissions are from point sources with the other 65% from area sources and
fugitive emissions. As of December 31, 1982, only one main point source is
considered to be out of compliance - the State Cement Plant. The State Cement
Plant has a plan to bring their facility into compliance by April 1983 and is
the subject of EPA enforcement action to prevent the plant from operating the
violating sources until controls are installed. The second task was to
compile all the meteorological and TSP data collected and perform statistical
tests to help estimate the ambient impact of the traditional versus
nontraditional sources. The Rapid City area currently has an approved TSP SIP
which demonstrates attainment by the end of 1982.
EPA Region VIII now believes that Rapid City is close to attaining
the TS? standard and will have to wait for a couple of quarters of 1983 data
before concluding that the area has or has not attained. The State is in the
process of determining if all of the SIP requirements for attainment have been
completed.
E. Utah
Utah has six areas designated as nonattainment for one or more
pollutants: Salt Lake City and County (CO, Ch, SO?, TSP); Ogden (CO and
TSP); Cedar City (SO?); and Toole County (S02J. Violations of the lead
image:
 39
standard have also been recorded in Salt Lake County. Figure 11 and Table 3
illustrate the location of monitoring stations in the Wasatch Front and those
sites reporting exceedances of pollutant standards and alert levels.
Salt Lake City and County is designated nonattainment for CO, (h,
S02, and TSP. There wera no violations of the 1-hour CO standard in Salt
Lake; however, there were 12, 10, and 4 violations of the 8-hour CO standard
in 1979, 1980, and 1981 respectively. The second high 8-hour CO
concentrations for the years 1979, 1980, and 1981 were 16, 15, and 10 ppm
respectively. The CO problem in Salt Lake is caused by emissions of mobile
sources. Ninety percent of annual CO emissions in Salt Lake County come from
vehicles. The State has proposed three strategies to show attainment by
1987: The Federal Motor Vehicle Control Program, an I/M program for Salt Lake
and Davis Counties, and selected traffic control measures, the Salt Lake CO
SIP demonstrates attainment by May 1984 with I/M, and August 1985 without
I/M. EPA Region VIII has proposed to disapprove the CO SIP because the I/M
program requirements of the Clean Air Act were not met with regard to
documenting specific proceedures for effective enforcement of the I/M program,
along with rules, ordinances, or other documentation illustrating a commitment
to enforce. This disapproval is controversial because Utah can easily
demonstrate attainment of the CO (and ozone) standards before 1987 without an
I/M program in place. If the State Air Quality projections are accurate and
Utah was to move ahead with the I/M program, it is possible that the program
would become mandatory at approximately the same time the standards are
projected to be achieved.
During 1981, the National Ambient Air Quality Standard for ozone was
exceeded on thirteen separate days in Salt Lake and Davis Counties. In 1980
and 1979 the number of violation days were 12 and 11. The peak 1-hour ozone
values observed in Salt Lake and Davis Counties in 1981, 1980, and 1979 were
0.163, 0.182, and 0.190 ppm, respectively. The causes of the ozone problem
are the mobile and stationary source emissions of VOC and NOX. In 1980,
mobile sources contributed 56% of the VOC and 61% of the NOX emissions in
Salt Lake and Davis Counties. Stationary sources contributed about 40% of the
VOC and 30% of the NOX emissions in the same area.
Four strategies were adopted in the Salt Lake and Davis County ozone
SIP: The Federal Motor Vehicle Control Program, an I/M program,
transportation control measures and RACT emission controls on all major VOC
Stationary Sources in the area. The State has demonstrated attainment of the
ozone Standard in Salt Lake and Davic Counties by December 1, 1983.Attainment
has also been demonstrated by July 1, 1984, without an I/M program. EPA
Region VIII has proposed to disapprove the Salt Lake-Davis County ozone SIP
because the I/M program requirements of the Clean Air Act were not met with
respect to documenting specific procedures for enforcement of the I/M program,
along with rules, ordinances, or other documentation illustrating a commitment
to enforce. As with the CO attainment demonstration, it is possible that the
03 standard may be achieved at the time a mandatory I/M program would become
operational.
image:
39
standard have also been recorded in Salt Lake County. Figure 11 and Table 3
illustrate the location of monitoring stations in the Wasatch Front and those
sites reporting exceedances of pollutant standards and alert levels.
Salt Lake City and County is designated nonattainment for CO, (h,
S02, and TSP. There wera no violations of the 1-hour CO standard in Salt
Lake; however, there were 12, 10, and 4 violations of the 8-hour CO standard
in 1979, 1980, and 1981 respectively. The second high 8-hour CO
concentrations for the years 1979, 1980, and 1981 were 16, 15, and 10 ppm
respectively. The CO problem in Salt Lake is caused by emissions of mobile
sources. Ninety percent of annual CO emissions in Salt Lake County come from
vehicles. The State has proposed three strategies to show attainment by
1987: The Federal Motor Vehicle Control Program, an I/M program for Salt Lake
and Davis Counties, and selected traffic control measures, the Salt Lake CO
SIP demonstrates attainment by May 1984 with I/M, and August 1985 without
I/M. EPA Region VIII has proposed to disapprove the CO SIP because the I/M
program requirements of the Clean Air Act were not met with regard to
documenting specific proceedures for effective enforcement of the I/M program,
along with rules, ordinances, or other documentation illustrating a commitment
to enforce. This disapproval is controversial because Utah can easily
demonstrate attainment of the CO (and ozone) standards before 1987 without an
I/M program in place. If the State Air Quality projections are accurate and
Utah was to move ahead with the I/M program, it is possible that the program
would become mandatory at approximately the same time the standards are
projected to be achieved.
During 1981, the National Ambient Air Quality Standard for ozone was
exceeded on thirteen separate days in Salt Lake and Davis Counties. In 1980
and 1979 the number of violation days were 12 and 11. The peak 1-hour ozone
values observed in Salt Lake and Davis Counties in 1981, 1980, and 1979 were
0.163, 0.182, and 0.190 ppm, respectively. The causes of the ozone problem
are the mobile and stationary source emissions of VOC and NOX. In 1980,
mobile sources contributed 56% of the VOC and 61% of the NOX emissions in
Salt Lake and Davis Counties. Stationary sources contributed about 40% of the
VOC and 30% of the NOX emissions in the same area.
Four strategies were adopted in the Salt Lake and Davis County ozone
SIP: The Federal Motor Vehicle Control Program, an I/M program,
transportation control measures and RACT emission controls on all major VOC
Stationary Sources in the area. The State has demonstrated attainment of the
ozone Standard in Salt Lake and Davic Counties by December 1, 1983.Attainment
has also been demonstrated by July 1, 1984, without an I/M program. EPA
Region VIII has proposed to disapprove the Salt Lake-Davis County ozone SIP
because the I/M program requirements of the Clean Air Act were not met with
respect to documenting specific procedures for enforcement of the I/M program,
along with rules, ordinances, or other documentation illustrating a commitment
to enforce. As with the CO attainment demonstration, it is possible that the
03 standard may be achieved at the time a mandatory I/M program would become
operational.
image:
 40
With respect to S02, the State has requested in March 1983 to
redesignate Salt Lake County to attainment status. EPA is reviewing the Utah
SIP which was developed for the areas around the Kennecott Copper Smelter.
The State's plan includes control requirements for the low level sources as
well as a multipoint limit for the main stack. The emission sources
controlled by the plan are the power plant boilers, the molybdenite heat
treaters, the refinery, fugitive emissions, and the main stack. The boilers,
treaters, and refinery are required to meet constant emission limitations.
Fugitive emissions are controlled by "best engineering techniques." The main
stack, which accounts for 88% of the total emissions, is controlled by a
variable emission limitation developed using the multipoint rollback approach
and represents about an 89% control of SOj emissions. The plan appears to
be adequate to attain the standards in the lower elevations (below 5600 ft),
but will not attain the standards for a large area above 5600 feet that is
owned by Kennecott. The Region has proposed approval based upon the
determination that the air above company property is not "ambient air." That
decision is being scrutinized in Headquarters.
Salt Lake County does not presently have an approved TSP SIP. The
Kennecott Copper Smelter does not presently have an enforceable TSP RACT
regulation because of the lack of an in-stack test method that is equivalent
to Reference Method 5. -EPA Region VIII expects that the enforceability issues
will be resolved during 1983 and would thus correct the SIP deficiency for TSP
in portions of Salt Lake County. The State requested redesignation of Salt
Lake County to attainment for TSP in March 1983.
Davis County is nonattainment for CO and 03, Davis County is
expected to be able to demonstrate compliance with the CO standard after the
1982 year data is analyzed. On October 28, 1982, the State requested Davis
County be redesignated as attainment for CO. There were no CO primary
standard violations in Davis County in 1981. The Davis County 03 problem
was discussed with the Salt Lake County 03 problem above.
Provo and Utah County are nonattainment areas for CO and TSP. In
1980, 14 8-hour periods were in excess of the CO standard. Five 8-hour
periods were recorded in excess of CO standard in 1981. The second highest
8-hour CO concentrations in 1980 and 1981 were 14 and 12 ppm respectively.
There were no violations of the 1-hour CO standard in those years.
Seventy-one percent of CO emissions in Utah County come from mobile sources.
In Provo, alone, 83 percent of CO emissions come from mobile sources. Provo
is expected to attain the CO standard by February 1, 1986, with the
FederalMotor Vehicle Control Program and transportation control measures. I/M
is not required because of EPA's policy not to require the program in areas
with less 'than 200,000 population. EPA Region VIII has proposed to approve
the Provo CO SIP.
EPA Region VIII believes that Utah County will probably be able to
demonstrate compliance with the TSP primary standards once the most recent
data are analyzed. The major source of the TSP problem in the County has been
the U.S. Steel Geneva Works Plant in Orem, Utah. A 1981 Consent Decree
image:
40
With respect to S02, the State has requested in March 1983 to
redesignate Salt Lake County to attainment status. EPA is reviewing the Utah
SIP which was developed for the areas around the Kennecott Copper Smelter.
The State's plan includes control requirements for the low level sources as
well as a multipoint limit for the main stack. The emission sources
controlled by the plan are the power plant boilers, the molybdenite heat
treaters, the refinery, fugitive emissions, and the main stack. The boilers,
treaters, and refinery are required to meet constant emission limitations.
Fugitive emissions are controlled by "best engineering techniques." The main
stack, which accounts for 88% of the total emissions, is controlled by a
variable emission limitation developed using the multipoint rollback approach
and represents about an 89% control of SOj emissions. The plan appears to
be adequate to attain the standards in the lower elevations (below 5600 ft),
but will not attain the standards for a large area above 5600 feet that is
owned by Kennecott. The Region has proposed approval based upon the
determination that the air above company property is not "ambient air." That
decision is being scrutinized in Headquarters.
Salt Lake County does not presently have an approved TSP SIP. The
Kennecott Copper Smelter does not presently have an enforceable TSP RACT
regulation because of the lack of an in-stack test method that is equivalent
to Reference Method 5. -EPA Region VIII expects that the enforceability issues
will be resolved during 1983 and would thus correct the SIP deficiency for TSP
in portions of Salt Lake County. The State requested redesignation of Salt
Lake County to attainment for TSP in March 1983.
Davis County is nonattainment for CO and 03, Davis County is
expected to be able to demonstrate compliance with the CO standard after the
1982 year data is analyzed. On October 28, 1982, the State requested Davis
County be redesignated as attainment for CO. There were no CO primary
standard violations in Davis County in 1981. The Davis County 03 problem
was discussed with the Salt Lake County 03 problem above.
Provo and Utah County are nonattainment areas for CO and TSP. In
1980, 14 8-hour periods were in excess of the CO standard. Five 8-hour
periods were recorded in excess of CO standard in 1981. The second highest
8-hour CO concentrations in 1980 and 1981 were 14 and 12 ppm respectively.
There were no violations of the 1-hour CO standard in those years.
Seventy-one percent of CO emissions in Utah County come from mobile sources.
In Provo, alone, 83 percent of CO emissions come from mobile sources. Provo
is expected to attain the CO standard by February 1, 1986, with the
FederalMotor Vehicle Control Program and transportation control measures. I/M
is not required because of EPA's policy not to require the program in areas
with less 'than 200,000 population. EPA Region VIII has proposed to approve
the Provo CO SIP.
EPA Region VIII believes that Utah County will probably be able to
demonstrate compliance with the TSP primary standards once the most recent
data are analyzed. The major source of the TSP problem in the County has been
the U.S. Steel Geneva Works Plant in Orem, Utah. A 1981 Consent Decree
image:
 41
between EPA, the State of Utah,, and U.S. Steel prescribed emission
limitations, air pollution control devices and operating and maintenance
procedures. In 1982, the Decree was formally amended to permit U.S. Steel to
use alternative emission controls is at the blast furnace casthouses and for
open hearth tapping. This new non-capture suppression technology
significantly reduces operating costs and capital. Violations of the open
hearth shop low emission practices were documented in September 1982. These
violations were resolved through a January 1983 stipulation requiring U.S.
Steel to pay a $50,000 penalty and to follow the necessary procedures in the
future.
Ogden and Weber County are nonattainment for CO and TSP. The number
of 8-hour CO concentrations in excess of the standard in 1979, 1980, and 1981
were 13, 5, and 1, respectively. The second highest 8-hour concentrations in
those years were 13, 12, and 10 ppm. Eighty-six percent of CO emissions in
Ogden are from mobile sources. The State has proposed the Federal Motor
Vehicle Control Program and transportation control measures as strategies to
achieve compliance with the CO standard by July 1, 1982. I/M is not a
required strategy because Ogden1s population is less than 200,000.
The TSP Standard was expected to have been achieved at the end of
1982. The 1981 TSP data from Weber County indicated no annual primary
standard violations and only one violation of the 24-hour primary standard. -.-
EPA Region VIII has approved Weber County's TSP SIP. The State of Utah
requested an attainment designation for Ogden for TSP in March 1983.
The State of Utah has requested that the Cedar City/Iron County S02
nonattainment area be redesignated to attainment status. There were no S0£
violations in the area in 1979 and 1980.
Plans are being made to produce synthetic fuels from oil shale and
tar sands deposition in Uinta County, Utah. Presently 148,100 barrels per day
of shale oil production have already been permitted in the Uinta Basin with
another 140,300 barrels per day of production presently undergoing PSD
review. The air quality impacts on Class I and II areas, and potential
adverse impacts on air quality related values of these Class I areas are of
special concern and may prove to be significant issues in the mid to late
1980's. Air pollution impacts associated with population growth caused by
this major industrial growth is also of concern.
F. Wyomi ng
The Trona (sodium carbonate) industrial area in Sweetwater County is
the State's only nonattainment area (for TSP). The State conducted an
extensive evaluation of the problem to determine the control measures needed
to meet the TSP standards. A plan was developed containing schedules for
installation of particulate control technology for the area's three Trona
image:
41
between EPA, the State of Utah,, and U.S. Steel prescribed emission
limitations, air pollution control devices and operating and maintenance
procedures. In 1982, the Decree was formally amended to permit U.S. Steel to
use alternative emission controls is at the blast furnace casthouses and for
open hearth tapping. This new non-capture suppression technology
significantly reduces operating costs and capital. Violations of the open
hearth shop low emission practices were documented in September 1982. These
violations were resolved through a January 1983 stipulation requiring U.S.
Steel to pay a $50,000 penalty and to follow the necessary procedures in the
future.
Ogden and Weber County are nonattainment for CO and TSP. The number
of 8-hour CO concentrations in excess of the standard in 1979, 1980, and 1981
were 13, 5, and 1, respectively. The second highest 8-hour concentrations in
those years were 13, 12, and 10 ppm. Eighty-six percent of CO emissions in
Ogden are from mobile sources. The State has proposed the Federal Motor
Vehicle Control Program and transportation control measures as strategies to
achieve compliance with the CO standard by July 1, 1982. I/M is not a
required strategy because Ogden1s population is less than 200,000.
The TSP Standard was expected to have been achieved at the end of
1982. The 1981 TSP data from Weber County indicated no annual primary
standard violations and only one violation of the 24-hour primary standard. -.-
EPA Region VIII has approved Weber County's TSP SIP. The State of Utah
requested an attainment designation for Ogden for TSP in March 1983.
The State of Utah has requested that the Cedar City/Iron County S02
nonattainment area be redesignated to attainment status. There were no S0£
violations in the area in 1979 and 1980.
Plans are being made to produce synthetic fuels from oil shale and
tar sands deposition in Uinta County, Utah. Presently 148,100 barrels per day
of shale oil production have already been permitted in the Uinta Basin with
another 140,300 barrels per day of production presently undergoing PSD
review. The air quality impacts on Class I and II areas, and potential
adverse impacts on air quality related values of these Class I areas are of
special concern and may prove to be significant issues in the mid to late
1980's. Air pollution impacts associated with population growth caused by
this major industrial growth is also of concern.
F. Wyomi ng
The Trona (sodium carbonate) industrial area in Sweetwater County is
the State's only nonattainment area (for TSP). The State conducted an
extensive evaluation of the problem to determine the control measures needed
to meet the TSP standards. A plan was developed containing schedules for
installation of particulate control technology for the area's three Trona
image:
 42
plants. The last piece of required control technology was installed in late
1982. No violations of the primary TSP standards were observed in the years
1977-1981. The State of Wyoming has requested the area be redesignated to
attainment.
A potential emerging problem is the development of sour gas fields in
Sublette and Lincoln Counties. The Riley Ridge Project envisions the
sweetening of nearly three billion cubic feet per day of sour gas. Potential
impacts include Class I and Class II PSD increment violations, significant
short term concentrations of ^S and COS (carbonyl sulfide). Acid
deposition and other adverse impacts on the air quality related values of
nearby Wyoming Class I wilderness areas are possible.
image:
42
plants. The last piece of required control technology was installed in late
1982. No violations of the primary TSP standards were observed in the years
1977-1981. The State of Wyoming has requested the area be redesignated to
attainment.
A potential emerging problem is the development of sour gas fields in
Sublette and Lincoln Counties. The Riley Ridge Project envisions the
sweetening of nearly three billion cubic feet per day of sour gas. Potential
impacts include Class I and Class II PSD increment violations, significant
short term concentrations of ^S and COS (carbonyl sulfide). Acid
deposition and other adverse impacts on the air quality related values of
nearby Wyoming Class I wilderness areas are possible.
image:
 FIGURE I:
43
NUMBER OF DAYS THAT PRIMARY STANDARD OR ALERT LEVEL WAS
EXCEEDED W 1931
REGION VIII NONATTAINMENT AREAS
CARBON MONOXIDE
Area
Denver Designated Area
Colorado Springs 3C
Fort Collins-Greeley
City of Missoula
City of Ogden
City of Provo
Salt Lake City
Area
Denver Desi gnated Area
Davis County
Salt Lake County
Days
Days/Year
0 10 20 30 40 50
CO
CO
CO
MT
UT
UT
UT
State
CO
UT
UT
356
365
365
359
354
321
365
B^SHpjSsaJssIi i
=
,.—]
I"
3
u „..]
zzr
OZONE Exceedence Days/ Year (1979-1981)
Days C
Samoled
357
344
363
10
HH
!
L . 4 Primary level exceeded
Alert level exceeded
image:
FIGURE I:
43
NUMBER OF DAYS THAT PRIMARY STANDARD OR ALERT LEVEL WAS
EXCEEDED W 1931
REGION VIII NONATTAINMENT AREAS
CARBON MONOXIDE
Area
Denver Designated Area
Colorado Springs 3C
Fort Collins-Greeley
City of Missoula
City of Ogden
City of Provo
Salt Lake City
Area
Denver Desi gnated Area
Davis County
Salt Lake County
Days
Days/Year
0 10 20 30 40 50
CO
CO
CO
MT
UT
UT
UT
State
CO
UT
UT
356
365
365
359
354
321
365
B^SHpjSsaJssIi i
=
,.—]
I"
3
u „..]
zzr
OZONE Exceedence Days/ Year (1979-1981)
Days C
Samoled
357
344
363
10
HH
!
L . 4 Primary level exceeded
Alert level exceeded
image:
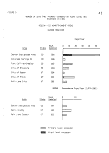 FIGURE 2:
NUMBER OF DAYS THAT PRIMARY STANDARD OR ALERT LEVEL WAS
EXCEEDED IN 1981
TOTAL SUSPENDED PARTICULATES
44
Area
Denver Designated Area
Fort Collins-Greeley
Col strip Area
City of Columbia Falls
Great Falls Area
Rapid City Area
Salt Lake County
Utah County
Days
State Sampled
Days/Year
10 20 30 40
CO
CO
MT
1*1 1
MT
MT
SO
UT
UT
194
91
1 94.
iC'T-
41
41
61
WsaoiiSiil . ._. . _ _. i
3
n
3
Z3
365 t
364 I
Area
Salt Lake County
UT
SULFUR DIOXIDE
Days
State Samoled
365
Days/Year
10
i i . Primary level exceeded
Alert level exceeded
image:
FIGURE 2:
NUMBER OF DAYS THAT PRIMARY STANDARD OR ALERT LEVEL WAS
EXCEEDED IN 1981
TOTAL SUSPENDED PARTICULATES
44
Area
Denver Designated Area
Fort Collins-Greeley
Col strip Area
City of Columbia Falls
Great Falls Area
Rapid City Area
Salt Lake County
Utah County
Days
State Sampled
Days/Year
10 20 30 40
CO
CO
MT
1*1 1
MT
MT
SO
UT
UT
194
91
1 94.
iC'T-
41
41
61
WsaoiiSiil . ._. . _ _. i
3
n
3
Z3
365 t
364 I
Area
Salt Lake County
UT
SULFUR DIOXIDE
Days
State Samoled
365
Days/Year
10
i i . Primary level exceeded
Alert level exceeded
image:
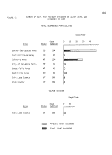 FIGURE 3. SYMBOLS TO BE USED ON STATUS MAPS
Basic Symbols for Showing Site_Lojca_ti_ons and Ambient Standards Exceedances
"* Site with no ambient standards excaeded
/\ ,£\ Site exceeding the short-term primary standard (e.g.,
24-hour S02, or 1-hour CO)
V7 \7 Site exceeding the long-term primary standard (e.g.,
annual TSP, or 8-hour CO)
%^X £jf Site exceeding long-term and short-term primary standards
^ :ȣ Site exceeding only a secondary standard
Site exceeding the short-term primary standards and the
secondary standard
Site exceeding the long-term primary standard and the
secondary standard
%r? gfg Site exceeding long-term and short-term primary standards,
" and the secondary standard
Additional Symbols for Showing Alert and Warning Level Exceedancgs
\ /•
Alert level exceeded at this site
/ s
x I f
- • - Warning level exceeded at this sita
* v
Examples of Composite Symbols
Site exceeding short-term primary standard, secondard
standard, and alert level
A -it:r- Site exceeding short-term primary standard, secondary
'T~N standard, alert level, and warning level
. i
Site exceeding short-term and,long-term primary standards,
alert level, and warning level
Site exceeding only the alert level, but no ambient
standards
/\ ,A Site exceeding short-term primary standard and alert
' s '"~^ level
Dashed symbols indicate sites that did not report enough data to meet NADB
criteria for representativeness.
image:
FIGURE 3. SYMBOLS TO BE USED ON STATUS MAPS
Basic Symbols for Showing Site_Lojca_ti_ons and Ambient Standards Exceedances
"* Site with no ambient standards excaeded
/\ ,£\ Site exceeding the short-term primary standard (e.g.,
24-hour S02, or 1-hour CO)
V7 \7 Site exceeding the long-term primary standard (e.g.,
annual TSP, or 8-hour CO)
%^X £jf Site exceeding long-term and short-term primary standards
^ :ȣ Site exceeding only a secondary standard
Site exceeding the short-term primary standards and the
secondary standard
Site exceeding the long-term primary standard and the
secondary standard
%r? gfg Site exceeding long-term and short-term primary standards,
" and the secondary standard
Additional Symbols for Showing Alert and Warning Level Exceedancgs
\ /•
Alert level exceeded at this site
/ s
x I f
- • - Warning level exceeded at this sita
* v
Examples of Composite Symbols
Site exceeding short-term primary standard, secondard
standard, and alert level
A -it:r- Site exceeding short-term primary standard, secondary
'T~N standard, alert level, and warning level
. i
Site exceeding short-term and,long-term primary standards,
alert level, and warning level
Site exceeding only the alert level, but no ambient
standards
/\ ,A Site exceeding short-term primary standard and alert
' s '"~^ level
Dashed symbols indicate sites that did not report enough data to meet NADB
criteria for representativeness.
image:
 EPA REGION 8
SCALE 1:9.000,000
kiloaeters
0 100 200 300
I ' i i i | 1 ]
1 I i i i
100
• i les
J_
200
46
FIGURE 4.
Alerts and Standards Map for TSP -- 1981
image:
EPA REGION 8
SCALE 1:9.000,000
kiloaeters
0 100 200 300
I ' i i i | 1 ]
1 I i i i
100
• i les
J_
200
46
FIGURE 4.
Alerts and Standards Map for TSP -- 1981
image:
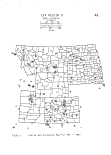 EPA REGION 8
SCALE 1:9.000,000
kiloaeters
0 100 200 300
I
100
Biles
200
47
FIGURE 5.
Alsrts and Standards Map for CO -- 1981
image:
EPA REGION 8
SCALE 1:9.000,000
kiloaeters
0 100 200 300
I
100
Biles
200
47
FIGURE 5.
Alsrts and Standards Map for CO -- 1981
image:
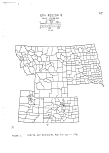 EPA REGION 8
SCALE 1:9,000,000
fciloaeters
0 100 200 300
100
ni les
200
48
Denotes PSD area
of interest
FIGURE
6 Alerts and Standards Map for S02 — 1981
image:
EPA REGION 8
SCALE 1:9,000,000
fciloaeters
0 100 200 300
100
ni les
200
48
Denotes PSD area
of interest
FIGURE
6 Alerts and Standards Map for S02 — 1981
image:
 EPA REGION 8
SCALE 1:9,000,000
kiloaeters
0 100 200 300
I i i i i I I j r
I i i i .. i I I
100
200
i les
FIGURE 7
Alerts and Standards Map for 03 — 1981
image:
EPA REGION 8
SCALE 1:9,000,000
kiloaeters
0 100 200 300
I i i i i I I j r
I i i i .. i I I
100
200
i les
FIGURE 7
Alerts and Standards Map for 03 — 1981
image:
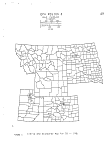 EPA REGION 8
SCALE 1:9,000,000
kiloneters
0 100 200 300
1 I ' ' ' I I I
I i i I i I L_
0 100 200
19 les
50
FIGURE 8 Alerts and Standards Map for N02 — 1981
image:
EPA REGION 8
SCALE 1:9,000,000
kiloneters
0 100 200 300
1 I ' ' ' I I I
I i i I i I L_
0 100 200
19 les
50
FIGURE 8 Alerts and Standards Map for N02 — 1981
image:
 EPA REGION 8
SCALE 1:9,000,000
titoasters
0 100 200 300
I i
I I ! i I
100
• i les
200
51
FIGURE 9. Alerts and Standards Hap for PB — 1981
image:
EPA REGION 8
SCALE 1:9,000,000
titoasters
0 100 200 300
I i
I I ! i I
100
• i les
200
51
FIGURE 9. Alerts and Standards Hap for PB — 1981
image:
 IDLUKW - DhNVhK lv!t!KU
AIR QUALITY MONITORING SITES
FIGURE 10:
image:
IDLUKW - DhNVhK lv!t!KU
AIR QUALITY MONITORING SITES
FIGURE 10:
image:
 TABLE I: COLORADO - DENVER METRO
1981 °ARTICULATE POLLUTANTS MONITORING SITES
TSP = Total Suspended Parti dilates
Pb = Lead
SITE LOCATION TS? Pb
A Adams city, 4301 E. 72nd Avenue x(A)
8 Arvada, 3101 Ralston Road x(P)
C Aurora, 1533 Florence x
D Boulder, 13th & Spruce x
•E Brighton, 15 S. Main St. x
G Castle Rock, 208 3rd St. x
I Denver, 414 14th Street x(P) x
Denver, 414 14th St. (colocated) x(P)
J Denver (CAMP) Braadway & 21st x{A) x
K Denver, 1050 S. Broadway x(P) x
L Denver, 4210 E. llth Avenue x
M Denver (CARIH) 21st Ave & Julian St. x x
N Denver, E. 51st and Marion x(A) x
P Englewood, 4857 S. Broadway x(P)
Q Golden, 911 10th Avenue x
R Highland Reservoir, 8100 S. University x
S Lakewood. 260 S. Kipling x
T Longmont, 4th and Kimbart St. x
U Rocky Flats, Plant Entrance x
V Westminster, 70th and Utica x
- = Discontinued in 1981.
+ = New in 1981.
x = Continues in 1981.
(A) = Exceeded Alert Level
(P) = Exceeded Primary Standard
image:
TABLE I: COLORADO - DENVER METRO
1981 °ARTICULATE POLLUTANTS MONITORING SITES
TSP = Total Suspended Parti dilates
Pb = Lead
SITE LOCATION TS? Pb
A Adams city, 4301 E. 72nd Avenue x(A)
8 Arvada, 3101 Ralston Road x(P)
C Aurora, 1533 Florence x
D Boulder, 13th & Spruce x
•E Brighton, 15 S. Main St. x
G Castle Rock, 208 3rd St. x
I Denver, 414 14th Street x(P) x
Denver, 414 14th St. (colocated) x(P)
J Denver (CAMP) Braadway & 21st x{A) x
K Denver, 1050 S. Broadway x(P) x
L Denver, 4210 E. llth Avenue x
M Denver (CARIH) 21st Ave & Julian St. x x
N Denver, E. 51st and Marion x(A) x
P Englewood, 4857 S. Broadway x(P)
Q Golden, 911 10th Avenue x
R Highland Reservoir, 8100 S. University x
S Lakewood. 260 S. Kipling x
T Longmont, 4th and Kimbart St. x
U Rocky Flats, Plant Entrance x
V Westminster, 70th and Utica x
- = Discontinued in 1981.
+ = New in 1981.
x = Continues in 1981.
(A) = Exceeded Alert Level
(P) = Exceeded Primary Standard
image:
 54
TABLE II COLORADO - DENVER METRO
1981 GASEOUS POLLUTANTS MONITORING SITES
CO = Carbon Monoxide SC^ = Sulfur Dioxide
03- Ozone WIND = Speed and Direction
N02 + Nitrogen Dioxide TENP 3 Temperature
SITE LOCATION J2. £3 _Np_2 JS02 WIND T£>P
X Arvada, W. 57th x(P) x(P) x
& Garrison
Y Aurora > x +• - x
50 S. Peoria
Z Boulder +{?) + -f- +
2320 Marine St.
J Denver (CAM3) x(A) x x(P) x
Broadway &
21st Street
M Denver (CARIH) x(A) x(P) x
21st Ave. &
Julian
0 Denver (NuH) x(A)
Colorado 31vd.
& Colfax Ave.
R Highland Reservoir x x(P) x x
3100 S. University
W Wei by x x x x x
78th & Steele
- = Discontinued in 1981.
+ » New in 1981.
x = Continues in 1981,
(A) = Exceeded Alert Level.
(P) = Exceeded Primary Standard.
image:
54
TABLE II COLORADO - DENVER METRO
1981 GASEOUS POLLUTANTS MONITORING SITES
CO = Carbon Monoxide SC^ = Sulfur Dioxide
03- Ozone WIND = Speed and Direction
N02 + Nitrogen Dioxide TENP 3 Temperature
SITE LOCATION J2. £3 _Np_2 JS02 WIND T£>P
X Arvada, W. 57th x(P) x(P) x
& Garrison
Y Aurora > x +• - x
50 S. Peoria
Z Boulder +{?) + -f- +
2320 Marine St.
J Denver (CAM3) x(A) x x(P) x
Broadway &
21st Street
M Denver (CARIH) x(A) x(P) x
21st Ave. &
Julian
0 Denver (NuH) x(A)
Colorado 31vd.
& Colfax Ave.
R Highland Reservoir x x(P) x x
3100 S. University
W Wei by x x x x x
78th & Steele
- = Discontinued in 1981.
+ » New in 1981.
x = Continues in 1981,
(A) = Exceeded Alert Level.
(P) = Exceeded Primary Standard.
image:
 •-= 55
~ -* -J
i\ J v - ~<*~^fy —, *
«*-^ \.:J&/P X
<t z. -<•*>-Jg^ „
w*»fc «AKkh.' •"*» I- (
AIR MONITORING
NETWORK
WASATCH FRONT
STATIONS
image:
•-= 55
~ -* -J
i\ J v - ~<*~^fy —, *
«*-^ \.:J&/P X
<t z. -<•*>-Jg^ „
w*»fc «AKkh.' •"*» I- (
AIR MONITORING
NETWORK
WASATCH FRONT
STATIONS
image:
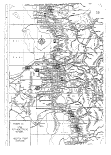 TABLE III
UTAH
1981 WASATCH FRONT AIR MONITORING STATIONS
56
Map
Number
1
2
3
4
5
s
7
a
9
10
(
11
12
! 13
14 '
15
15
17
, 13
Station Name and Address
Air Monitor! no Can car
251 West 500 South, Salt Lake City
Salt Lake City 46Q92QOOU01
510 South 200 East, Salt Lake City
Stats Street 460920008F01
219 South State St., Salt Lake City
Cottonwood 4609000Q3FQ1?
5715 South 1400 East, Holladay
Jordan River 460920009F02
1420 South 1100 West, Salt Lake City
iNorth Salt Lake ?
1795 North 1000 West, Salt Lake City
Bountiful 460060001F01
65 West 3CQ North, Bountiful
Farmington 460220002F05
1325 West Glovers Ln., Farmington
%20 South 2100 «Mt W001'1'11
Ogden 460680001F01
2570 Grant Avenue, Ogden
Washington Boulevard 46Q6SQGQ5FQ1
2954 Washinaton Blvd., Ogden
Magna 46Q520001F02
2935 South 8560 West, Magna
Beach d605209Q2PQ2?
12600 West 1-80, Magna
Copoerton 4oi030001F02
3536 West State Highway 48 /Copoerton
Pleasant Grove 460760001F01
700 East 200 South, Pleasant Grove
Lindon 461220001F01
50 East Main, Lindon
North Provo 4t>uauuuuzhUi
1355 North 200 West, Provo
University Avenue wjeuuuuit-ujLf
25 North University Ave.T Provo
TSP
*
X
°3
X j X*
X
X
S02
•x
X
1
•x
X
p *
X [X
X
X
A
X
Mx
Ax-
X
3
X
*
X
X
X
*
X
*
X
X
X
CO
p '
X
p "*
X
fe
X
*
X
*
X
>
X
•*
X
-*r
X
D *
X
N02
X
X
i
X
wo/ws
X
X
X
X
X
X
X
X
X
X
X
X
X
v
X
'Air Pollution Index Parameters Reported
A
P
Exceeded alert level
Exceeded oripary standard
image:
TABLE III
UTAH
1981 WASATCH FRONT AIR MONITORING STATIONS
56
Map
Number
1
2
3
4
5
s
7
a
9
10
(
11
12
! 13
14 '
15
15
17
, 13
Station Name and Address
Air Monitor! no Can car
251 West 500 South, Salt Lake City
Salt Lake City 46Q92QOOU01
510 South 200 East, Salt Lake City
Stats Street 460920008F01
219 South State St., Salt Lake City
Cottonwood 4609000Q3FQ1?
5715 South 1400 East, Holladay
Jordan River 460920009F02
1420 South 1100 West, Salt Lake City
iNorth Salt Lake ?
1795 North 1000 West, Salt Lake City
Bountiful 460060001F01
65 West 3CQ North, Bountiful
Farmington 460220002F05
1325 West Glovers Ln., Farmington
%20 South 2100 «Mt W001'1'11
Ogden 460680001F01
2570 Grant Avenue, Ogden
Washington Boulevard 46Q6SQGQ5FQ1
2954 Washinaton Blvd., Ogden
Magna 46Q520001F02
2935 South 8560 West, Magna
Beach d605209Q2PQ2?
12600 West 1-80, Magna
Copoerton 4oi030001F02
3536 West State Highway 48 /Copoerton
Pleasant Grove 460760001F01
700 East 200 South, Pleasant Grove
Lindon 461220001F01
50 East Main, Lindon
North Provo 4t>uauuuuzhUi
1355 North 200 West, Provo
University Avenue wjeuuuuit-ujLf
25 North University Ave.T Provo
TSP
*
X
°3
X j X*
X
X
S02
•x
X
1
•x
X
p *
X [X
X
X
A
X
Mx
Ax-
X
3
X
*
X
X
X
*
X
*
X
X
X
CO
p '
X
p "*
X
fe
X
*
X
*
X
>
X
•*
X
-*r
X
D *
X
N02
X
X
i
X
wo/ws
X
X
X
X
X
X
X
X
X
X
X
X
X
v
X
'Air Pollution Index Parameters Reported
A
P
Exceeded alert level
Exceeded oripary standard
image:
 57
Water Quality
Envi rcnmental Management Report
Page Number
PART I: Introduction 53
A. Conclusions & Recommend at i ens
8. Methodology
C. Status and Trends in Water Quality
PART II: Regional Overview of Water Quality Issues ' 63
Significant Prob!ens (Maps included)
Colorado „• 63
Montana 66
North Dakota 70
South Dakota 74
Utah 77
Wyoming 81
APPENDIX A. Priority Stream Segnents and Impaired Beneficial Use 85
Key to Problem Parameters 115
APPENDIX B. Implications to Managerent Programs 116
1. Water Resource Development in Region VIII 116
2. NPDES Permits - Compliance Status on Priority
Water Bodies -118
3. Wetlands 135
4. Colorado Salinity Control 138
5. Acid Deposition/Water Quality Concerns 140
APPENDIX C. Policy and Procedures ' 144
1. Advanced Treatment Review 144
2. Anti degr ad at i en 145
3. Site-Specific Criteria/Use Attainability Studies 145
APPENDIX D. Possible Remedies for and Feasibility of Water
Quality Improvements' 160
1. Jordan River Use Attainability Analysis 160
2. Nationwide Urban Runoff Project 161
3. The Dillon Water Bubble 162
4. Clean Lakes Program 163
image:
57
Water Quality
Envi rcnmental Management Report
Page Number
PART I: Introduction 53
A. Conclusions & Recommend at i ens
8. Methodology
C. Status and Trends in Water Quality
PART II: Regional Overview of Water Quality Issues ' 63
Significant Prob!ens (Maps included)
Colorado „• 63
Montana 66
North Dakota 70
South Dakota 74
Utah 77
Wyoming 81
APPENDIX A. Priority Stream Segnents and Impaired Beneficial Use 85
Key to Problem Parameters 115
APPENDIX B. Implications to Managerent Programs 116
1. Water Resource Development in Region VIII 116
2. NPDES Permits - Compliance Status on Priority
Water Bodies -118
3. Wetlands 135
4. Colorado Salinity Control 138
5. Acid Deposition/Water Quality Concerns 140
APPENDIX C. Policy and Procedures ' 144
1. Advanced Treatment Review 144
2. Anti degr ad at i en 145
3. Site-Specific Criteria/Use Attainability Studies 145
APPENDIX D. Possible Remedies for and Feasibility of Water
Quality Improvements' 160
1. Jordan River Use Attainability Analysis 160
2. Nationwide Urban Runoff Project 161
3. The Dillon Water Bubble 162
4. Clean Lakes Program 163
image:
 •" 58
RESIGN VIII ENVIRONMENTAL MANAGEMENT REPQR"
WATER QUALITY MEDIUM'
PART I: INTRODUCTION
Region VIII enjoys generally high quality water, and although we are
committed to restoring the quality of the surface waters in Region VIII, we
are intent on preserving the characteristics of the existing high quality
waters which are so valuable to the people cf this Region.
The Water Quality Medium Environmental Management Report presents for
each state, a narrative descriotion of the more significant water quality
problems. It provides maps showing priority problem areas, with tables
designating the stream segment analyses, and listing the water quality
problems by source category. All of the water quality problems in each state
are not included in this document. This regional summary identifies primarily
the priority areas agreed on by EPA and state senior management. The
subsequent recommendations may formulate a focus for future distribution of
resources. They reflect various activities associated with problem areas
defined for Region VIII.
A. COND.USIONS AND RECOMMENDATIONS
0 Nonpoint source loadings of nutrients, sediment and salinity
constitute the major causes of water quality standards violations in
Region VIII.
0 Municipal discharges of ammonia, chlorine, organic material and
bacteria present the greatest impediment to achieving the 1983
fishable/swimmable goals of the Clean Water Act.
0 Discharges of heavy metals from inactive/abandoned mines present the
greatest nonmunicipal source of toxics which threaten the fishable
goal of the Clean Water Act.
0 Priority lists for construction grant activities do not clearly
define or identify their relationship to state water quality
standards.
0 A large number of regulations and guidelines in these programs have
never been finalized and are behind schedule. This continues to
hamper regional and state workload planning. The status of all HQ
activity in this area should be summarized and discussed at the
mid-year review. (Water Quality Standards, TMDl's, WLA, CPP and
NFS).
- 2 -
image:
•" 58
RESIGN VIII ENVIRONMENTAL MANAGEMENT REPQR"
WATER QUALITY MEDIUM'
PART I: INTRODUCTION
Region VIII enjoys generally high quality water, and although we are
committed to restoring the quality of the surface waters in Region VIII, we
are intent on preserving the characteristics of the existing high quality
waters which are so valuable to the people cf this Region.
The Water Quality Medium Environmental Management Report presents for
each state, a narrative descriotion of the more significant water quality
problems. It provides maps showing priority problem areas, with tables
designating the stream segment analyses, and listing the water quality
problems by source category. All of the water quality problems in each state
are not included in this document. This regional summary identifies primarily
the priority areas agreed on by EPA and state senior management. The
subsequent recommendations may formulate a focus for future distribution of
resources. They reflect various activities associated with problem areas
defined for Region VIII.
A. COND.USIONS AND RECOMMENDATIONS
0 Nonpoint source loadings of nutrients, sediment and salinity
constitute the major causes of water quality standards violations in
Region VIII.
0 Municipal discharges of ammonia, chlorine, organic material and
bacteria present the greatest impediment to achieving the 1983
fishable/swimmable goals of the Clean Water Act.
0 Discharges of heavy metals from inactive/abandoned mines present the
greatest nonmunicipal source of toxics which threaten the fishable
goal of the Clean Water Act.
0 Priority lists for construction grant activities do not clearly
define or identify their relationship to state water quality
standards.
0 A large number of regulations and guidelines in these programs have
never been finalized and are behind schedule. This continues to
hamper regional and state workload planning. The status of all HQ
activity in this area should be summarized and discussed at the
mid-year review. (Water Quality Standards, TMDl's, WLA, CPP and
NFS).
- 2 -
image:
 59
Implementing control regulations on high quality waters, i.e. those
with quality better than the 1983 goals, has been difficult in
Region VIII. Many of the water bodies in Region VIII are of high
quality and the Region is in the process .of developing a procedure
to: 1) define existing quality through a computerized,
flow-weighted analysis, and 2) define significant change in existing
quality. Because most of our (State and EPA) monitoring efforts
have been concentrated in areas where we have water quality
problems, the lack of water quality data and flow monitoring are
frustrating our efforts in high quality areas.
lack of sufficient funds, qualified personnel and data, especially
biological, are the major obstacles which could, and presently do,
impair the successful implementation of the proposed use-oriented
water quality based control program articulated in the proposed
regulations on a large scale. EPA and the states in Region VIII
have, for the past ten years, oriented funding program, resources
and data collection to a treatment technology based control
program. Little attention has been directed toward the control
strategies envisioned in the proposed regulations. As a result, the
States and Region VIII will be forced to redirect already
underfunded and understaffed programs to accommodate these new
strategies.
There are major salinity problems in Region VIII outside the
Colorado River Basin. Although the only significant effort to
address salinity problems is within the Colorado River Basin. EPA
should at least discuss with the states in Region VIII some of the
problems, particularly in the Arkansas River Basin.
Depletion of stream flows by increasing amounts of consumptive use
continues to threaten the nonconsumptive uses of Region VIII
streams. In order to protect the fishery, recreation and other
uses, states like Montana and South Dakota have established programs
to design strategies and methodologies to protect instreams flows.
These strategies will be implemented in the near future.
Pesticide monitoring in Region VIII waters has been very limited.
The limited monitoring has not shown any problems in this area,
although an expanded monitoring program is needed because of the
large volumes of pesticides used in Region VIII.
image:
59
Implementing control regulations on high quality waters, i.e. those
with quality better than the 1983 goals, has been difficult in
Region VIII. Many of the water bodies in Region VIII are of high
quality and the Region is in the process .of developing a procedure
to: 1) define existing quality through a computerized,
flow-weighted analysis, and 2) define significant change in existing
quality. Because most of our (State and EPA) monitoring efforts
have been concentrated in areas where we have water quality
problems, the lack of water quality data and flow monitoring are
frustrating our efforts in high quality areas.
lack of sufficient funds, qualified personnel and data, especially
biological, are the major obstacles which could, and presently do,
impair the successful implementation of the proposed use-oriented
water quality based control program articulated in the proposed
regulations on a large scale. EPA and the states in Region VIII
have, for the past ten years, oriented funding program, resources
and data collection to a treatment technology based control
program. Little attention has been directed toward the control
strategies envisioned in the proposed regulations. As a result, the
States and Region VIII will be forced to redirect already
underfunded and understaffed programs to accommodate these new
strategies.
There are major salinity problems in Region VIII outside the
Colorado River Basin. Although the only significant effort to
address salinity problems is within the Colorado River Basin. EPA
should at least discuss with the states in Region VIII some of the
problems, particularly in the Arkansas River Basin.
Depletion of stream flows by increasing amounts of consumptive use
continues to threaten the nonconsumptive uses of Region VIII
streams. In order to protect the fishery, recreation and other
uses, states like Montana and South Dakota have established programs
to design strategies and methodologies to protect instreams flows.
These strategies will be implemented in the near future.
Pesticide monitoring in Region VIII waters has been very limited.
The limited monitoring has not shown any problems in this area,
although an expanded monitoring program is needed because of the
large volumes of pesticides used in Region VIII.
image:
 60
3. METHODOLOGY
The 1981 watar quality data on fifty water quality parameters for 258
monitoring stations along 11,200 miles of the principal surface water bodies
in Region VIII were analyzed by Region VIII1s Use Impairment Program.
Parametric coverage included those parameters which when in excess of selected
criteria, could impair any of the seven major designated beneficial stream
uses identified in Region VIII. These data were processed by computer along
with the beneficial use criteria which were originally developed as part of
each states water quality standards.
Of the water quality data analyzed in Region VIII, about ten percent of
the stations yielded results of no beneficial use impairment. These results
should, however, be viewed with cautious optimism as only a limited number of
water quality parameters were sampled and the result may' not be
representative. The results for 87 stations (32% of the total) indicated that
the observed water quality parameters exceeded the recommended criteria only
occasionally and at minimal levels. Potential use impairment levels were
observed at 127 stations (47% of the total) and the remaining 25 stations (10*
of the total) produced very high use impaired values.
It is important to note that elevated use impairment values are not
absolute indicators of impaired uses. The use impairment values are used as a
screening tool; the higher the use impairment value the higher the probability
that a use is being impaired. Confirmation of an impaired use can only be
accomplished through discussion with state personnel and on-site
investigation. This report concentrates on those water bodies for which we
have such confirmation and which were identified in the State 305(b) report as
the oriority water bodies.
C. STATUS AND TRENDS IN WATER QUALITY
Aside from STORET, there is no central source of stream water quality
information in Region VIII. For many apparent problem segments basic
information is not available, and when it is, it is frequently old and
obsolete. For those segments with recent data, coverage is sporadic and
inconsistent, making stream-by-stream comparisons tenuous at best. There is a
great deal of variation in parameter and station coverage, information
reliability, timing and frequency of sampling from one segment to another.
Hence, the results of any ranking must be used with caution, and only as a
first approximation.
-. 4 -.
image:
60
3. METHODOLOGY
The 1981 watar quality data on fifty water quality parameters for 258
monitoring stations along 11,200 miles of the principal surface water bodies
in Region VIII were analyzed by Region VIII1s Use Impairment Program.
Parametric coverage included those parameters which when in excess of selected
criteria, could impair any of the seven major designated beneficial stream
uses identified in Region VIII. These data were processed by computer along
with the beneficial use criteria which were originally developed as part of
each states water quality standards.
Of the water quality data analyzed in Region VIII, about ten percent of
the stations yielded results of no beneficial use impairment. These results
should, however, be viewed with cautious optimism as only a limited number of
water quality parameters were sampled and the result may' not be
representative. The results for 87 stations (32% of the total) indicated that
the observed water quality parameters exceeded the recommended criteria only
occasionally and at minimal levels. Potential use impairment levels were
observed at 127 stations (47% of the total) and the remaining 25 stations (10*
of the total) produced very high use impaired values.
It is important to note that elevated use impairment values are not
absolute indicators of impaired uses. The use impairment values are used as a
screening tool; the higher the use impairment value the higher the probability
that a use is being impaired. Confirmation of an impaired use can only be
accomplished through discussion with state personnel and on-site
investigation. This report concentrates on those water bodies for which we
have such confirmation and which were identified in the State 305(b) report as
the oriority water bodies.
C. STATUS AND TRENDS IN WATER QUALITY
Aside from STORET, there is no central source of stream water quality
information in Region VIII. For many apparent problem segments basic
information is not available, and when it is, it is frequently old and
obsolete. For those segments with recent data, coverage is sporadic and
inconsistent, making stream-by-stream comparisons tenuous at best. There is a
great deal of variation in parameter and station coverage, information
reliability, timing and frequency of sampling from one segment to another.
Hence, the results of any ranking must be used with caution, and only as a
first approximation.
-. 4 -.
image:
 61
Trend analyses per se, have not been attempted for these same reasons.
Water quality in Region VIII streams is highly correlated with seasonal
fluctuations in the natural hydrologic cycle. High streamflows are associated
with naturally large concentrations of sediment and high turbidity; low
streamflows are associated with larger concentrations of dissolved materials
and lower turbidity. If year-to-year water quality samples are not taken
during comparable times in the hydrologic cycle - which is often the case -
then the apparent water quality trend will be an artifact of sample timing,
and the true trend will remain unknown. Even if year-to-year samples are
taken from comparable points on the hydrologic cycle, there will be
differences in streamflow, which must be factored into the quality analysis.
In may cases, streamflow information is not available to statistically weight
streamflows to arrive at a true and reliable assessment of water quality
trends. Region VIII is, however, developing a procedure to flow-weight water
quality data.
Of these problems, the most serious impediment to severity and trend
analysis is the scarcity of regular monitoring data from apparent and
ootential problems segments. Because of the great expense involved in
monitoring, only the Federal government can afford to do the bulk of the water
quality monitoring in Region VIII. The Federal monitoring network has been
geared largely to energy imoact areas and to national trend monitoring.
Hence, the stations tend to be project specific or on the larger rivers where
oollutants are more readily diluted and where pollution sources are obscure -
and problematic. The most significant data gap in Region VIII is biological;
biological data is virtually absent. This deficiency will greatly hinder
Region VIII's ability to develop site-specific water quality standards
recommendations.
Aquatic life protection uses and recreational water uses are the uses
most frequently impaired by pollution in Region VIII. To a lesser extent,
water classified for public water supply protection and for agricultural use
are also impaired.
Un-ionized atrmonia, low dissolved oxygen and elevated nutrients are the
parameters associated with municipal wastewater treatment facilities which
apoear to be having the greatest effect on aquatic life. Cadmium, copper,
lead and zinc contamination from active, inactive or abandoned mining
operations are suspected of having severe effects on aquatic life.
Monpoint source pollution constitutes, by in large, the principal cause
of the water quality problems in Region VIII, with some states reporting that
over 90% of their water quality Drool ems are due to natural and human-induced
nonooint source pollution. Sediment, nutrients and salinity are the
parameters which are responsible for most of the use impairment observed in
Region VIII. Fecal coliform from nonpoint sources and inadequately treated
wastewater cause frequent recreational use impairments.
- 5 -
image:
61
Trend analyses per se, have not been attempted for these same reasons.
Water quality in Region VIII streams is highly correlated with seasonal
fluctuations in the natural hydrologic cycle. High streamflows are associated
with naturally large concentrations of sediment and high turbidity; low
streamflows are associated with larger concentrations of dissolved materials
and lower turbidity. If year-to-year water quality samples are not taken
during comparable times in the hydrologic cycle - which is often the case -
then the apparent water quality trend will be an artifact of sample timing,
and the true trend will remain unknown. Even if year-to-year samples are
taken from comparable points on the hydrologic cycle, there will be
differences in streamflow, which must be factored into the quality analysis.
In may cases, streamflow information is not available to statistically weight
streamflows to arrive at a true and reliable assessment of water quality
trends. Region VIII is, however, developing a procedure to flow-weight water
quality data.
Of these problems, the most serious impediment to severity and trend
analysis is the scarcity of regular monitoring data from apparent and
ootential problems segments. Because of the great expense involved in
monitoring, only the Federal government can afford to do the bulk of the water
quality monitoring in Region VIII. The Federal monitoring network has been
geared largely to energy imoact areas and to national trend monitoring.
Hence, the stations tend to be project specific or on the larger rivers where
oollutants are more readily diluted and where pollution sources are obscure -
and problematic. The most significant data gap in Region VIII is biological;
biological data is virtually absent. This deficiency will greatly hinder
Region VIII's ability to develop site-specific water quality standards
recommendations.
Aquatic life protection uses and recreational water uses are the uses
most frequently impaired by pollution in Region VIII. To a lesser extent,
water classified for public water supply protection and for agricultural use
are also impaired.
Un-ionized atrmonia, low dissolved oxygen and elevated nutrients are the
parameters associated with municipal wastewater treatment facilities which
apoear to be having the greatest effect on aquatic life. Cadmium, copper,
lead and zinc contamination from active, inactive or abandoned mining
operations are suspected of having severe effects on aquatic life.
Monpoint source pollution constitutes, by in large, the principal cause
of the water quality problems in Region VIII, with some states reporting that
over 90% of their water quality Drool ems are due to natural and human-induced
nonooint source pollution. Sediment, nutrients and salinity are the
parameters which are responsible for most of the use impairment observed in
Region VIII. Fecal coliform from nonpoint sources and inadequately treated
wastewater cause frequent recreational use impairments.
- 5 -
image:
 62
Some of the more signigicant water quality problems in Region VIII remain
unresolved. These problems are being addressed through programs such as:
0 Uooer Colorado River Basin Salinity Control Program
0 Water Quality Standards (use attainability $ site-specific criteria)
0 NPOES Discharge aermits
0 Wetlands and 404 Permits
0 Clean lakes Programs
0 Nationwide Urban Runoff Program
0 Construction Grants Program
0 Continuing Planning Process
0 Agricultural Conservation Program (Dept. of Agriculture)
- 6 -
image:
62
Some of the more signigicant water quality problems in Region VIII remain
unresolved. These problems are being addressed through programs such as:
0 Uooer Colorado River Basin Salinity Control Program
0 Water Quality Standards (use attainability $ site-specific criteria)
0 NPOES Discharge aermits
0 Wetlands and 404 Permits
0 Clean lakes Programs
0 Nationwide Urban Runoff Program
0 Construction Grants Program
0 Continuing Planning Process
0 Agricultural Conservation Program (Dept. of Agriculture)
- 6 -
image:
 63
PART ii: REGIONAL OVERVIEW OF WATER QUALITY ISSUES - SIGNIFICANT WATER
QUALITY PROBLEMS
COLORADO
The thrust of the Federal Clean Water Act is to restore and maintain the
quality of the nation's waters. Thus, impaired stream segments in Colorado
reflect those areas where stream segments have not yet achieved the use or
quality deemed advisable and desirable by the State and EPA. (See Figure #1
Colorado Map; Table 1.)
The most significant water quality impairments in Colorado are due to
fecal colifoms and/or ammonia. Discharges from municipal wastewater
facilities are the primary cause of the impairments. Both recreational uses
and aquatic life are affected.
Segment 10 of.Boulder Creek is the only Class II recreational water body
in Colorado not consistently meeting its adopted standard for fecal coliform.
The data indicates that Boulder Creek would also frequently have a problem
meeting the criterion for a Class II recreational stream. The station
evaluated on Boulder Creek is downstream from the City of Boulder and from the
confluence with Coal Creek. There is one municipal discharge to Boulder Creek
and three discharges to Coal Creek. Earlier studies by the Division have
indicated that Coal Creek is a major source of degradation to water quality" in
Boulder Creek. Only the town of Erie was significantly out of compliance with
their discharge permit limits for fecal coliforms during the evaluation period.
All of the stream segments impaired because of fecal coliforms are in
areas of intensive agricultural land use and are downstream of major municipal
point source discharges. Many of the municipal dischargers to impaired
segments commonly have had a problem in meeting their permit limits for fecal
coliforms during the evaluation period.
Concentrations of un-ionized ammonia impaired both Class I and Class II
aquatic life streams. With the exception of the Dolores River below the
confluence with the San Miguel River, the primary source of ammonia is
municioal wastewater. Water quality standards allow higher concentrations of
ammonia in the San Miguel River below Uravan than are allowed in the Dolores;
however, the amnonia load from the San Miguel causes the Dolores to exceed its
adopted standard.
image:
63
PART ii: REGIONAL OVERVIEW OF WATER QUALITY ISSUES - SIGNIFICANT WATER
QUALITY PROBLEMS
COLORADO
The thrust of the Federal Clean Water Act is to restore and maintain the
quality of the nation's waters. Thus, impaired stream segments in Colorado
reflect those areas where stream segments have not yet achieved the use or
quality deemed advisable and desirable by the State and EPA. (See Figure #1
Colorado Map; Table 1.)
The most significant water quality impairments in Colorado are due to
fecal colifoms and/or ammonia. Discharges from municipal wastewater
facilities are the primary cause of the impairments. Both recreational uses
and aquatic life are affected.
Segment 10 of.Boulder Creek is the only Class II recreational water body
in Colorado not consistently meeting its adopted standard for fecal coliform.
The data indicates that Boulder Creek would also frequently have a problem
meeting the criterion for a Class II recreational stream. The station
evaluated on Boulder Creek is downstream from the City of Boulder and from the
confluence with Coal Creek. There is one municipal discharge to Boulder Creek
and three discharges to Coal Creek. Earlier studies by the Division have
indicated that Coal Creek is a major source of degradation to water quality" in
Boulder Creek. Only the town of Erie was significantly out of compliance with
their discharge permit limits for fecal coliforms during the evaluation period.
All of the stream segments impaired because of fecal coliforms are in
areas of intensive agricultural land use and are downstream of major municipal
point source discharges. Many of the municipal dischargers to impaired
segments commonly have had a problem in meeting their permit limits for fecal
coliforms during the evaluation period.
Concentrations of un-ionized ammonia impaired both Class I and Class II
aquatic life streams. With the exception of the Dolores River below the
confluence with the San Miguel River, the primary source of ammonia is
municioal wastewater. Water quality standards allow higher concentrations of
ammonia in the San Miguel River below Uravan than are allowed in the Dolores;
however, the amnonia load from the San Miguel causes the Dolores to exceed its
adopted standard.
image:
 FIGURE ,'. COLORADO WATER OIALITY FRCSLBi
1 - South Platts River (Hanpdsn to Henderson)
2 - "Boulder Crv&. (pxd Creole -i-o S4.ViraJ>v Crsek:')
3 - Cl&w OetlC. (Yourio^elcl •¥» WvOW.^
4 - Cherry Crask f^aseir/oir
5 - Clear Creek (Idaho Springs to Ycungflald)
6 - North Fork Clear Crssk
7 - St. Vrain Cresk (Longnant to mouth)
8 - Big Thompson River (Laveland to mouth)
9 - Little Thompson River (Serthcud to mouth)
10 - Foudrs River (Ft. Collins to mouth)
11 - Arkansas River (1-25 to La Junta)
12 - Arkansas River (La Junta to Stataiins)
13 - Fountain Crssk (Manunent Crsek to mouth)
14 - Unccmpangrs River
15 -Dolores 'River (So/i Miguel liver -h>
image:
FIGURE ,'. COLORADO WATER OIALITY FRCSLBi
1 - South Platts River (Hanpdsn to Henderson)
2 - "Boulder Crv&. (pxd Creole -i-o S4.ViraJ>v Crsek:')
3 - Cl&w OetlC. (Yourio^elcl •¥» WvOW.^
4 - Cherry Crask f^aseir/oir
5 - Clear Creek (Idaho Springs to Ycungflald)
6 - North Fork Clear Crssk
7 - St. Vrain Cresk (Longnant to mouth)
8 - Big Thompson River (Laveland to mouth)
9 - Little Thompson River (Serthcud to mouth)
10 - Foudrs River (Ft. Collins to mouth)
11 - Arkansas River (1-25 to La Junta)
12 - Arkansas River (La Junta to Stataiins)
13 - Fountain Crssk (Manunent Crsek to mouth)
14 - Unccmpangrs River
15 -Dolores 'River (So/i Miguel liver -h>
image:
 65
Gore Creek, the Crystal River, and the North Fork of the Gunnison have
Class I aquatic life designations and have experienced ammonia problems during
the evaluation oeriod. Since there are no municioal point source discharges
to the Crystal River the source of ammonia is unknown. Ammonia exceedance on
Gore Creek occurred downstream of a major municipal discharger that was
experiencing operational problems during the time of peak winter recreational
use in the evaluation period. A fish hatchery, a dairy, and several small
municipalities discharge to the North Fork. Any or all of these sources could
have contributed to the problem on the North Fork.
The major un-ionized ammonia concerns in Colorado occur on the South
Platte River from near Bowles Avenue in the Metro Denver area to approximately
Platteville, Clear Creek below Youngfield Street, the St. Vrain River below
Longmont, and Boulder Creek below Boulder. All four stream segments violate
their un-ionized ammonia standard on a low to moderate frequency rate. The
watersheds of all four of these streams are expected to encounter major
pooulation increases during the next twenty years. Therefore, without proper
measures, both the frequency and the magnitude of the violations may increase
in the future.
Many of the remaining stream impairments in Colorado are due to several
heavy metals (lead, cadmium, cooper, zinc,) which exceed the standards
established for cold water aquatic life. With the exception of Ten Mile Creek
in Summit County, reductions in concentrations of these metals may be
contingent upon the control of drainage from inactive or abandoned mine tails
or tunnels. The Molybdenum mine!at Climax is the major point source discharge
to Ten Mile Creek. Seasonal standards for metals have set for Ten Mile Creek
which will protect the established aquatic life between Copper Mountain and
Dillon Reservoir. Metals which are associated with present or past mining
activities or natural geologic conditions, have impaired only aquatic life
with the single exception of the:Eagle River. The utility of the Eagle River
for municipal purposes has been significantly diminished because of the
concentration of manganese which iexceeds the adopted standards for water
suoply.
A study published in 1974 by the U.S. Geological Survey identified 450
stream miles in Colorado that had been impacted by metal mine drainage. Water
quality imoairment was attributed to ongoing, as well as past mining
ooerations and natural mineral se|eps. Damage to the aquatic environment was
caused by a number of factors including flow from drainage tunnels, milling
ooerations, and tailings piles. [Restoration of several segments owing to the
control of point source discharge;s at active locations or to the clean up of
inactive mine areas has been accomplished. Feasibility studies are under way
at several other locations in order to take advantage of reclamation funds
that may become available in the future.
_ Q _
image:
65
Gore Creek, the Crystal River, and the North Fork of the Gunnison have
Class I aquatic life designations and have experienced ammonia problems during
the evaluation oeriod. Since there are no municioal point source discharges
to the Crystal River the source of ammonia is unknown. Ammonia exceedance on
Gore Creek occurred downstream of a major municipal discharger that was
experiencing operational problems during the time of peak winter recreational
use in the evaluation period. A fish hatchery, a dairy, and several small
municipalities discharge to the North Fork. Any or all of these sources could
have contributed to the problem on the North Fork.
The major un-ionized ammonia concerns in Colorado occur on the South
Platte River from near Bowles Avenue in the Metro Denver area to approximately
Platteville, Clear Creek below Youngfield Street, the St. Vrain River below
Longmont, and Boulder Creek below Boulder. All four stream segments violate
their un-ionized ammonia standard on a low to moderate frequency rate. The
watersheds of all four of these streams are expected to encounter major
pooulation increases during the next twenty years. Therefore, without proper
measures, both the frequency and the magnitude of the violations may increase
in the future.
Many of the remaining stream impairments in Colorado are due to several
heavy metals (lead, cadmium, cooper, zinc,) which exceed the standards
established for cold water aquatic life. With the exception of Ten Mile Creek
in Summit County, reductions in concentrations of these metals may be
contingent upon the control of drainage from inactive or abandoned mine tails
or tunnels. The Molybdenum mine!at Climax is the major point source discharge
to Ten Mile Creek. Seasonal standards for metals have set for Ten Mile Creek
which will protect the established aquatic life between Copper Mountain and
Dillon Reservoir. Metals which are associated with present or past mining
activities or natural geologic conditions, have impaired only aquatic life
with the single exception of the:Eagle River. The utility of the Eagle River
for municipal purposes has been significantly diminished because of the
concentration of manganese which iexceeds the adopted standards for water
suoply.
A study published in 1974 by the U.S. Geological Survey identified 450
stream miles in Colorado that had been impacted by metal mine drainage. Water
quality imoairment was attributed to ongoing, as well as past mining
ooerations and natural mineral se|eps. Damage to the aquatic environment was
caused by a number of factors including flow from drainage tunnels, milling
ooerations, and tailings piles. [Restoration of several segments owing to the
control of point source discharge;s at active locations or to the clean up of
inactive mine areas has been accomplished. Feasibility studies are under way
at several other locations in order to take advantage of reclamation funds
that may become available in the future.
_ Q _
image:
 66
MONTANA
The most significant water quality problems in Montana are sediment,
salinity and problems arising from water depletion. A recent effort was made
to identify and prioritize Montana problem stream segments. A total of 216
stream segments were identified as problem segments (See Appendix A, Table
2). Sufficient recent data was only available, however, to develoo pollution
severity indices for 99 of these segments. Thirty-two of these problem
segments were judged to be largely man caused and improvable under existing
regulatory authority and pollution control programs. These 32 segments form
Montana's priority waterbodies list upon which regulatory and planning efforts
are focused.
During the past two years Montana's surface water quality standards have
been revised. Policies for establishing permit levels for ammonia, chlorine
residuals, and oil and grease have been modified. This includes eliminating
the need to chlorinate many wastewater treatment plant effluents during winter
months. New rules to implement the State's nondegradation law have been
orepared. Developments are routinely reviewed and monitored for potential
impacts to water quality. These include lakeshore subdivisions, new and
modified hydroelectric and other energy projects, new and modified mining
develooments and new discharges.
It is estimated that over $50 million worth of work needs to be done to -
uoqrade Montana's wastewater treatment facilities. Montana's major wastewater
treatment funding needs should be met, however, if all construction grant
funds currently authorized through FY 1985 are appropriated by Congress.
During the last two years, more than $38 million has been provided to local
governments for the construction of wastewater treatment facilities to improve
water quality and protect public health. Studies are continuing to identify
water quality problems attributable to wastawater treatment discharges. It is
estimated that eight municipal treatment plans are causing some degree of
ammonia toxicity to aquatic life in streams receiving the discharges. Mining
and milling activities and petroleum refining activities provide the more
significant industrial point source discharges in the State.
Most of Montana's water quality problems result from nonpoint sources of
oollution. Agricultural, mining, and forestry related activities are the
principal land use oractices which imoact Montana water quality. This
includes; acid mine drainage and toxic metal contamination from mining
activities; accelerated erosion and stream sedimentation from hydrologic
modifications and improper land management; and excess sediment, nutrients,
pesticides and other contaminants from runoff. Planning, technical
assistance, and educational efforts which define and disseminate information
on the relation of land use to water quality have been the chief mechanism
used to address these nonpoint pollution problems. Sharing in these efforts
are the Water Quality Bureau, one of the four original areawide planning
organizations, several Indian tribes, and a host of local, State and Federal
governmental agencies.
- 10 -
image:
66
MONTANA
The most significant water quality problems in Montana are sediment,
salinity and problems arising from water depletion. A recent effort was made
to identify and prioritize Montana problem stream segments. A total of 216
stream segments were identified as problem segments (See Appendix A, Table
2). Sufficient recent data was only available, however, to develoo pollution
severity indices for 99 of these segments. Thirty-two of these problem
segments were judged to be largely man caused and improvable under existing
regulatory authority and pollution control programs. These 32 segments form
Montana's priority waterbodies list upon which regulatory and planning efforts
are focused.
During the past two years Montana's surface water quality standards have
been revised. Policies for establishing permit levels for ammonia, chlorine
residuals, and oil and grease have been modified. This includes eliminating
the need to chlorinate many wastewater treatment plant effluents during winter
months. New rules to implement the State's nondegradation law have been
orepared. Developments are routinely reviewed and monitored for potential
impacts to water quality. These include lakeshore subdivisions, new and
modified hydroelectric and other energy projects, new and modified mining
develooments and new discharges.
It is estimated that over $50 million worth of work needs to be done to -
uoqrade Montana's wastewater treatment facilities. Montana's major wastewater
treatment funding needs should be met, however, if all construction grant
funds currently authorized through FY 1985 are appropriated by Congress.
During the last two years, more than $38 million has been provided to local
governments for the construction of wastewater treatment facilities to improve
water quality and protect public health. Studies are continuing to identify
water quality problems attributable to wastawater treatment discharges. It is
estimated that eight municipal treatment plans are causing some degree of
ammonia toxicity to aquatic life in streams receiving the discharges. Mining
and milling activities and petroleum refining activities provide the more
significant industrial point source discharges in the State.
Most of Montana's water quality problems result from nonpoint sources of
oollution. Agricultural, mining, and forestry related activities are the
principal land use oractices which imoact Montana water quality. This
includes; acid mine drainage and toxic metal contamination from mining
activities; accelerated erosion and stream sedimentation from hydrologic
modifications and improper land management; and excess sediment, nutrients,
pesticides and other contaminants from runoff. Planning, technical
assistance, and educational efforts which define and disseminate information
on the relation of land use to water quality have been the chief mechanism
used to address these nonpoint pollution problems. Sharing in these efforts
are the Water Quality Bureau, one of the four original areawide planning
organizations, several Indian tribes, and a host of local, State and Federal
governmental agencies.
- 10 -
image:
 t-4
M
I
image:
t-4
M
I
image:
 68
Success in correcting nonooint source problems is limited by difficulties
in implementing changes to long standing and accepted land use practices, and
lac'< of funds for implementation. Important funding sources to implement
better land management practices include the Department of Agriculture's
Agricultural Conservation Program and Small Watershed Program, and the State
of Montana's Renewable Resource Development and Water Development Program,
EDA's Superfund Program and the Department of Interior Office of Surface
Mining's Abandoned Mine Land Reclamation Program offer some hope for
correcting water quality problems resulting from abandoned mining operations.
Dewataring of streams in Montana contributes to water quality
degradation. Dewatering reduces a stream's dilution capacity and decreases
biotic habitat. Qewatering is primarily caused by irrigation withdrawals.
This is most noticeable on the Beaverhead, Bitterroot, West Gallatin, Big Hole
and Jefferson Rivers, although it occurs on many other stream segments.
The Deoartment of Health and Environmental Sciences has been awarded an
instream flow reservation on the Yellowstone River for the purpose of
orotecting oublic water supplies. Water development projects on the
Yellowstone are monitored to ensure compatibility with the instream
reservation. Efforts to develop a similar instream flow reservation on the
Clark Fork River have been halted since a downstream hydroelectric water right
serves to orotect instream flows.
Montana's severest groundwater problem results from saline seep. This
ohenomenon is caused by the dryland farming practice of summer fallowing.
Excess soil moisture accumulates when vegetation is removed, and the moisture
leaches salts from the soil and salinizes groundwater. Surface waters also
become salinized by this ohenomenon when the salinized groundwater feeds them.
There are areas in Montana that have very high environmental value. One
of these areas is the Flathead River Basin in northwest Montana which includes
Glacier National Park, Flathead lake (the largest lake west of the
Mississippi), several designated Wild and Scenic Rivers, the Flathead Valley,
and the 3ob Marshall Wilderness area {the largest in the west). Proposed
major Canadian coal development, oil and gas development and other general
develooment activities threaten to degrade these nationally significant
resources. Accelerated nutrient contributions to Flathead lake from changed
land use and wastewater discharges are a specific concern.
A five year Congressionally authorized $2.6 million Flathead Basin
Environmental Impact Study has recently been completed. This study has
defined baseline conditions in the Basin and served to focus increased
attention and resources on maintaining the air, water quality, fisheries,
groundwater, wildlife and general high environmental values of the area. The
Montana legislature is expected to create a Flathead Basin commission to
orotect this resource.
- 12 -
image:
68
Success in correcting nonooint source problems is limited by difficulties
in implementing changes to long standing and accepted land use practices, and
lac'< of funds for implementation. Important funding sources to implement
better land management practices include the Department of Agriculture's
Agricultural Conservation Program and Small Watershed Program, and the State
of Montana's Renewable Resource Development and Water Development Program,
EDA's Superfund Program and the Department of Interior Office of Surface
Mining's Abandoned Mine Land Reclamation Program offer some hope for
correcting water quality problems resulting from abandoned mining operations.
Dewataring of streams in Montana contributes to water quality
degradation. Dewatering reduces a stream's dilution capacity and decreases
biotic habitat. Qewatering is primarily caused by irrigation withdrawals.
This is most noticeable on the Beaverhead, Bitterroot, West Gallatin, Big Hole
and Jefferson Rivers, although it occurs on many other stream segments.
The Deoartment of Health and Environmental Sciences has been awarded an
instream flow reservation on the Yellowstone River for the purpose of
orotecting oublic water supplies. Water development projects on the
Yellowstone are monitored to ensure compatibility with the instream
reservation. Efforts to develop a similar instream flow reservation on the
Clark Fork River have been halted since a downstream hydroelectric water right
serves to orotect instream flows.
Montana's severest groundwater problem results from saline seep. This
ohenomenon is caused by the dryland farming practice of summer fallowing.
Excess soil moisture accumulates when vegetation is removed, and the moisture
leaches salts from the soil and salinizes groundwater. Surface waters also
become salinized by this ohenomenon when the salinized groundwater feeds them.
There are areas in Montana that have very high environmental value. One
of these areas is the Flathead River Basin in northwest Montana which includes
Glacier National Park, Flathead lake (the largest lake west of the
Mississippi), several designated Wild and Scenic Rivers, the Flathead Valley,
and the 3ob Marshall Wilderness area {the largest in the west). Proposed
major Canadian coal development, oil and gas development and other general
develooment activities threaten to degrade these nationally significant
resources. Accelerated nutrient contributions to Flathead lake from changed
land use and wastewater discharges are a specific concern.
A five year Congressionally authorized $2.6 million Flathead Basin
Environmental Impact Study has recently been completed. This study has
defined baseline conditions in the Basin and served to focus increased
attention and resources on maintaining the air, water quality, fisheries,
groundwater, wildlife and general high environmental values of the area. The
Montana legislature is expected to create a Flathead Basin commission to
orotect this resource.
- 12 -
image:
 The Clean Water Act goal of "fishable and swimmable water" by 1983 will
not be met for more than 200 stream segments in Montana. Without an infusion
of imolementation funds for correcting existing nonpoint source pollution
oroblems, Montana's list of problems segments won't be much shorter in 1984.
However, with adequate funding for the pollution control programs described in
Montana's 305(b) report, the list should not be longer.
image:
The Clean Water Act goal of "fishable and swimmable water" by 1983 will
not be met for more than 200 stream segments in Montana. Without an infusion
of imolementation funds for correcting existing nonpoint source pollution
oroblems, Montana's list of problems segments won't be much shorter in 1984.
However, with adequate funding for the pollution control programs described in
Montana's 305(b) report, the list should not be longer.
image:
 70
NORTH DAKOTA
North Dakota anticipates that the quality of its surface waters will
gradually improve. At the oresent time, the Missouri River is the only stream
which consistently meets the swimmable5 fishable standards. An additional 31
streams are presently meeting or should meet these goals by 1983. This
reoresents approximately 80 percent of the streams in North Dakota. (See
Figure ?3; Aopendix A, Table 3).
Presently there are no municioal facilities in North Dakota discharging
completely untreated wastes into the waters of the State. Some however,
provide less than the desired level of treatment for several reasons, such as
a lack of storage capability or a lack of resources to provide upgraded
treatment. North Dakota projects that a number of municipalities will need
additions, modifications, or completely new facilities in order to comply with
permit requirements.
There does not appear to be any significant stream degradation problems
from major industrial dischargers. Major industrial sources include power
plants, sugar beet processing plants, and oil refineries. Minor industrial
sources include potato washing plants, gravel operations, water treatment
plants, and coal mines. Most industrial point source discharges are
non-continuous or intermittent discharging stablization ponds or lagoon
systems.
There are a few combined sewer systems located in the older cities in the
State. The major oroblem with combined sewers is the overflow discharge of
diluted, untreated wastewater to a stream or other receiving body as a result
of intermittent heavy flows due to rainstorms or snowmelt. There is no hard
data on the quality of combined sewer system overflows or the amount of
degradation on secondary streams. Most of the affected cities are presently
involved in combined sewer separation projects.
All the major cities and several of the minor cities in the State have
existing storm sewer systems. Because of an increase in urban population in
the oast years, there has been an increase in urban areas contributing to
storm sewer discharges. Urban runoff characteristics are highly variable
depending upon the density and duration of the storm, the management of street
sanitation, and the contributions from adjacent runoff areas.
Nonooint pollution sources are responsible for most of the surface water
degradation in the State. The Department's Surface Water Quality Monitoring
Program has indicated that the quality of surface waters has not been enhanced
comparatively with the rapid advances that have been accomplished during the
past years by rnunicioalities, industries, and other point sources in providing
adequate treatment of their wastes. Violations of certain oarameters of the
State's Water Quality Standards have been noted at times when records reveal
there have been no discharges into the stream from any point sources.
- 14 -
image:
70
NORTH DAKOTA
North Dakota anticipates that the quality of its surface waters will
gradually improve. At the oresent time, the Missouri River is the only stream
which consistently meets the swimmable5 fishable standards. An additional 31
streams are presently meeting or should meet these goals by 1983. This
reoresents approximately 80 percent of the streams in North Dakota. (See
Figure ?3; Aopendix A, Table 3).
Presently there are no municioal facilities in North Dakota discharging
completely untreated wastes into the waters of the State. Some however,
provide less than the desired level of treatment for several reasons, such as
a lack of storage capability or a lack of resources to provide upgraded
treatment. North Dakota projects that a number of municipalities will need
additions, modifications, or completely new facilities in order to comply with
permit requirements.
There does not appear to be any significant stream degradation problems
from major industrial dischargers. Major industrial sources include power
plants, sugar beet processing plants, and oil refineries. Minor industrial
sources include potato washing plants, gravel operations, water treatment
plants, and coal mines. Most industrial point source discharges are
non-continuous or intermittent discharging stablization ponds or lagoon
systems.
There are a few combined sewer systems located in the older cities in the
State. The major oroblem with combined sewers is the overflow discharge of
diluted, untreated wastewater to a stream or other receiving body as a result
of intermittent heavy flows due to rainstorms or snowmelt. There is no hard
data on the quality of combined sewer system overflows or the amount of
degradation on secondary streams. Most of the affected cities are presently
involved in combined sewer separation projects.
All the major cities and several of the minor cities in the State have
existing storm sewer systems. Because of an increase in urban population in
the oast years, there has been an increase in urban areas contributing to
storm sewer discharges. Urban runoff characteristics are highly variable
depending upon the density and duration of the storm, the management of street
sanitation, and the contributions from adjacent runoff areas.
Nonooint pollution sources are responsible for most of the surface water
degradation in the State. The Department's Surface Water Quality Monitoring
Program has indicated that the quality of surface waters has not been enhanced
comparatively with the rapid advances that have been accomplished during the
past years by rnunicioalities, industries, and other point sources in providing
adequate treatment of their wastes. Violations of certain oarameters of the
State's Water Quality Standards have been noted at times when records reveal
there have been no discharges into the stream from any point sources.
- 14 -
image:
 71
:ORTH DAKOTA WATER QUALITY PROBLEM AREAS
i. Souris "River- Des L*cs 'fiver to D«s«
2. Scans Ti«r • Pecp^ver -fo Canadian
3. "ReJ Bjver - Turtle "HSver fe Sh^«n«e.
^. 'Bed •Bwer - Shee^i, "Biver- fo
S, Heart
- 15 -
image:
71
:ORTH DAKOTA WATER QUALITY PROBLEM AREAS
i. Souris "River- Des L*cs 'fiver to D«s«
2. Scans Ti«r • Pecp^ver -fo Canadian
3. "ReJ Bjver - Turtle "HSver fe Sh^«n«e.
^. 'Bed •Bwer - Shee^i, "Biver- fo
S, Heart
- 15 -
image:
 72
Nonooint oollutants include sediment and nutrients, wastes from stock
raising activities, runoff from croplands, rangelands, pastures, farmsteads,
and urban areas containing fertilizers, oesticides, and other pollutants. The
Nonpoint Task Force of the Statewide 208 planning effort estimates that there
are approximately 2.3 million acres within the State that are primary
ootential sources of pollution, and 3.6 million acres that are secondary
sources. Some 2.5 million acres undergo slight soil erosion, 380,000 acres
undergo moderate soil erosion and 81,000 acres have severe erosion problems.
The Task Force identified 265,000 acres with high treatment priority needs and
2,7 million acres with secondary priority needs. These acreage figures do not
include the ten-county lewis and Clark Planning area.
The North Dakota nonpoint source control program to control pollution
from agricultural activities is a voluntary program with emphasis in two
areas: Watershed controls that are an integral part of lake restoration
oro.jects and demonstration projects which serve education, research purposes.
The program has achieved significant success in select areas during the past
two years.
The orogram has relied heavily on funding sources from ACP, Section 314
program, Section 106 program, Section 205(j) and 203 program, Stata Game &
Fish, Soil Conservation Service and local funds. The initial Statewide 208
olan identified 10 target lakes that are known to experience water quality
problems. These lakes were identified so that greater emphasis would be
placed on assessing and controlling nonpoint sources of pollution, especially
nutrient and sediment loadings. These lakes were selected on the basis of the
Game & Fish Department's study en classification of lakes and the results of
the National Eutrophication Survey conducted by EPA. The Game & Fish
Department classification involved dissolved oxygen, fish kills and impairment
of use.
The National Eutrophication Survey took into account nitrogen,
phosphorous, chlorophyll and dissolved oxygen levels in the lakes. Existing
and ootential recreational value and usage in the lakes was another
consideration in the selection of these target lakes. The 10 target lakes are
as follow: 1) lake Ashtabula, Barnes Co., 2) Brewer lake, Cass Co., 3) Red
Willow lake, Griggs Co., 4) Brush lake, Mclean Co., 5) Sweet Briar lake,
Morton and Oliver Co., 5) Hhitman Oam, Nelson Co., 7) Devils lake, Ramsey
Co., 3) Patterson lake, Stark Co., 9) Spiritwood lake, Stutsman Co., 10)
Matejcek lake, Walsh Co.
- 16 -
image:
72
Nonooint oollutants include sediment and nutrients, wastes from stock
raising activities, runoff from croplands, rangelands, pastures, farmsteads,
and urban areas containing fertilizers, oesticides, and other pollutants. The
Nonpoint Task Force of the Statewide 208 planning effort estimates that there
are approximately 2.3 million acres within the State that are primary
ootential sources of pollution, and 3.6 million acres that are secondary
sources. Some 2.5 million acres undergo slight soil erosion, 380,000 acres
undergo moderate soil erosion and 81,000 acres have severe erosion problems.
The Task Force identified 265,000 acres with high treatment priority needs and
2,7 million acres with secondary priority needs. These acreage figures do not
include the ten-county lewis and Clark Planning area.
The North Dakota nonpoint source control program to control pollution
from agricultural activities is a voluntary program with emphasis in two
areas: Watershed controls that are an integral part of lake restoration
oro.jects and demonstration projects which serve education, research purposes.
The program has achieved significant success in select areas during the past
two years.
The orogram has relied heavily on funding sources from ACP, Section 314
program, Section 106 program, Section 205(j) and 203 program, Stata Game &
Fish, Soil Conservation Service and local funds. The initial Statewide 208
olan identified 10 target lakes that are known to experience water quality
problems. These lakes were identified so that greater emphasis would be
placed on assessing and controlling nonpoint sources of pollution, especially
nutrient and sediment loadings. These lakes were selected on the basis of the
Game & Fish Department's study en classification of lakes and the results of
the National Eutrophication Survey conducted by EPA. The Game & Fish
Department classification involved dissolved oxygen, fish kills and impairment
of use.
The National Eutrophication Survey took into account nitrogen,
phosphorous, chlorophyll and dissolved oxygen levels in the lakes. Existing
and ootential recreational value and usage in the lakes was another
consideration in the selection of these target lakes. The 10 target lakes are
as follow: 1) lake Ashtabula, Barnes Co., 2) Brewer lake, Cass Co., 3) Red
Willow lake, Griggs Co., 4) Brush lake, Mclean Co., 5) Sweet Briar lake,
Morton and Oliver Co., 5) Hhitman Oam, Nelson Co., 7) Devils lake, Ramsey
Co., 3) Patterson lake, Stark Co., 9) Spiritwood lake, Stutsman Co., 10)
Matejcek lake, Walsh Co.
- 16 -
image:
 73
Brewer lake, Devils take, Spiritwood Lake and Sweet Briar Lake watershed
projects were initiated in the 1st phase of the nonpoint source control
program. Spiritwood Lake was selected as a Phase II 314 project. To date the
Spiritwood Lake watershed project has received a great amount of attention.
Examples of 3MP's installed includes 22,000'ft. of grass waterways, 9,860 ft.
of terraces, 217,340 ft. of tree planting, 293 ft. of wildlife habitat
seeding, 5 stock ponds, 19 ft. of critical area seeding, 544 ft. of no-till
crop production. Planned practices for 1983 are one animal waste system, one
no-till and tillage meeting, additional waterways, one pheasant waste storage
and crop residue management.
A 5-counties (Ransom, Benson, McLean, Williams, Bottineau) no-till
project was started in the fall of 1980 to demonstrate no-till production
within this target area. Water quality problems stem from excessive sediment
loadings into the lakes and streams from wind and water erosion and runoff
from agricultural cropland. Fifty farmers signed up within this 5-county area.
Dissolved oxygen values were low in the Souris River at certain times of
the year due to low, sluggish flows during the warm summer months and to low
flows during the cold winter months when ice and snow cover prevented
reaeration and sunlight penetration. Fecal coliform values were relatively
high in the Red River of the North and Knife River Basins. The former is due
to the dense population of that area and the latter to feedlots and municipal
sources in the Basin. Phosphate values were highest in the eastern portion,.of
the State, a trend perhaps explained by the denser vegetative cover and more
intense agricultural practices. Chloride limits were not violated except in
the northern Red River Basin. This raay be attributable to flaws from several
highly saline lakes. Dissolved solids were high west of the Missouri River,
which is not unusual considering the geological character of that area.
- 17 -
image:
73
Brewer lake, Devils take, Spiritwood Lake and Sweet Briar Lake watershed
projects were initiated in the 1st phase of the nonpoint source control
program. Spiritwood Lake was selected as a Phase II 314 project. To date the
Spiritwood Lake watershed project has received a great amount of attention.
Examples of 3MP's installed includes 22,000'ft. of grass waterways, 9,860 ft.
of terraces, 217,340 ft. of tree planting, 293 ft. of wildlife habitat
seeding, 5 stock ponds, 19 ft. of critical area seeding, 544 ft. of no-till
crop production. Planned practices for 1983 are one animal waste system, one
no-till and tillage meeting, additional waterways, one pheasant waste storage
and crop residue management.
A 5-counties (Ransom, Benson, McLean, Williams, Bottineau) no-till
project was started in the fall of 1980 to demonstrate no-till production
within this target area. Water quality problems stem from excessive sediment
loadings into the lakes and streams from wind and water erosion and runoff
from agricultural cropland. Fifty farmers signed up within this 5-county area.
Dissolved oxygen values were low in the Souris River at certain times of
the year due to low, sluggish flows during the warm summer months and to low
flows during the cold winter months when ice and snow cover prevented
reaeration and sunlight penetration. Fecal coliform values were relatively
high in the Red River of the North and Knife River Basins. The former is due
to the dense population of that area and the latter to feedlots and municipal
sources in the Basin. Phosphate values were highest in the eastern portion,.of
the State, a trend perhaps explained by the denser vegetative cover and more
intense agricultural practices. Chloride limits were not violated except in
the northern Red River Basin. This raay be attributable to flaws from several
highly saline lakes. Dissolved solids were high west of the Missouri River,
which is not unusual considering the geological character of that area.
- 17 -
image:
 74
SOUTH DAKOTA
The imDairment of beneficial uses of streams and rivers due to water
oollution, ranges from none to severe In South Dakota (See Figure 14; Appendix
A, Table 4). The most severe impairment is occurring in the Whitewood
Creek/Belle Fourche River/Cheyenne River drainage. The sources of the
pollution are mine tailings from more than 100 years of mining activities,
current mine discharges, nutrients from municipal wastewater discharges, urban
runoff, agricultural runoff, livestock, and wood preservation plants. Severe
imoairment is also occurring in the lower reaches of the White River, in the
Bad River, and in Rapid Creek from Rapid City to the Cheyenne River. The
problems in the White River are related orimarily to erosion of the Badlands
and livestock watering, lack of flow, livestock watering, and soil erosion
are the orimary causes of water quality degradation in the Bad River. Lower
Raoid Creek is degraded by urban runoff and effluent from the municipal
wastewater treatment plant, landowners along this reach report that livestock
and wildlife will not drink the water and that the water causes skin
irritation. These problems have not been documented or a possible source
determined.
In 1981, the South Dakota Department of Water and Natural Resources
(DWNR) examined lake water quality and produced a priority ranking for lake
restoration in South Dakota. One hundred lakes were ranked so that
restoration monies would be spent on the projects which would produce the most
lake imorovement and benefit the most people. The top ten priority lakes are
Wall (Minnehaha County), Cochrane (Deuel County), Minnewasta (Day County),
Brandt (lake County), South Buffalo (Marshall County), Pelican (Codington
County), South Red Iron (Marshall County), North Waubay (Day County),
Hendricks (Srookings County) and East Oakwood (Brookir.gs County). Most South
Dakota lakes are severely impacted by runoff which carries silt and nutrients
into them, lake Madison is impaired by wastewater from the City of Madison,
and Stockade lake is impaired by wastewater from Custer.
Oeoletion of stream flows by increasing amounts of consumptive use
continues to threaten the nonconsumotive uses of South Dakota streams. In
order to orotect the fishery, recreation and other uses, South Dakota has
established a orogram to design strategies and methodologies to protect
instreams flows. These strategies will be implemented in the near future.
Pesticide monitoring in South Dakota waters has been very limited. The
limited monitoring has not shown any problems in this area, although an
exnanded monitoring program is needed because of the large volumes of
oesticides used in South Dakota.
- 18 -
image:
74
SOUTH DAKOTA
The imDairment of beneficial uses of streams and rivers due to water
oollution, ranges from none to severe In South Dakota (See Figure 14; Appendix
A, Table 4). The most severe impairment is occurring in the Whitewood
Creek/Belle Fourche River/Cheyenne River drainage. The sources of the
pollution are mine tailings from more than 100 years of mining activities,
current mine discharges, nutrients from municipal wastewater discharges, urban
runoff, agricultural runoff, livestock, and wood preservation plants. Severe
imoairment is also occurring in the lower reaches of the White River, in the
Bad River, and in Rapid Creek from Rapid City to the Cheyenne River. The
problems in the White River are related orimarily to erosion of the Badlands
and livestock watering, lack of flow, livestock watering, and soil erosion
are the orimary causes of water quality degradation in the Bad River. Lower
Raoid Creek is degraded by urban runoff and effluent from the municipal
wastewater treatment plant, landowners along this reach report that livestock
and wildlife will not drink the water and that the water causes skin
irritation. These problems have not been documented or a possible source
determined.
In 1981, the South Dakota Department of Water and Natural Resources
(DWNR) examined lake water quality and produced a priority ranking for lake
restoration in South Dakota. One hundred lakes were ranked so that
restoration monies would be spent on the projects which would produce the most
lake imorovement and benefit the most people. The top ten priority lakes are
Wall (Minnehaha County), Cochrane (Deuel County), Minnewasta (Day County),
Brandt (lake County), South Buffalo (Marshall County), Pelican (Codington
County), South Red Iron (Marshall County), North Waubay (Day County),
Hendricks (Srookings County) and East Oakwood (Brookir.gs County). Most South
Dakota lakes are severely impacted by runoff which carries silt and nutrients
into them, lake Madison is impaired by wastewater from the City of Madison,
and Stockade lake is impaired by wastewater from Custer.
Oeoletion of stream flows by increasing amounts of consumptive use
continues to threaten the nonconsumotive uses of South Dakota streams. In
order to orotect the fishery, recreation and other uses, South Dakota has
established a orogram to design strategies and methodologies to protect
instreams flows. These strategies will be implemented in the near future.
Pesticide monitoring in South Dakota waters has been very limited. The
limited monitoring has not shown any problems in this area, although an
exnanded monitoring program is needed because of the large volumes of
oesticides used in South Dakota.
- 18 -
image:
 75
!ax-^ Y2^
Pr 32^fy-v
^to>i%'
( SOUTH DAKOTA WATER QUALITY PROBLEH AR£^5
IS !3, r^'fi
'
ijUld d\cj<?«nt 'River
. Upper
g. f1ia4!e Vfti
23.
Z4'2o, Horsau
. Turtle
32.
V^ / :
^=OT
. ^|5k-i
•tj
^
- 19 -
image:
75
!ax-^ Y2^
Pr 32^fy-v
^to>i%'
( SOUTH DAKOTA WATER QUALITY PROBLEH AR£^5
IS !3, r^'fi
'
ijUld d\cj<?«nt 'River
. Upper
g. f1ia4!e Vfti
23.
Z4'2o, Horsau
. Turtle
32.
V^ / :
^=OT
. ^|5k-i
•tj
^
- 19 -
image:
 76
Five lakes have been selected for the SPA Clean lakes Program, and the
lake Herman project was one of seven Model Implementation Programs in the
country. Implementation activities have been initiated in twelve watersheds.
The OWNR is involved in the Slack Hills local Council of Governments urban
runoff orogram, which is a three year program to determine the impact of Rapid
City's urban runoff on Raoid Creek. The DWNR is also working with the
protection of instream flows, management strategies for on-site sewage
disoosal and coooerative management strategies with the U.S. Forest Service
and South Dakota Indian tribes.
The Construction Grants Program is responsible for the control of point
sources of water pollution and the administration of Federal grants for the
construction of municipal wastewater treatment facilities. This section has
administered 36.9 million dollars in grants since 1972 which has resulted in
the completion of 47 projects with 11 more currently under construction. A
recent survey of 25 of those projects showed that pollutants were reduced by
72.4 to 30.2 percent. Surveys now in progress are designed to document actual
improvements in stream water quality and aquatic communities. Tremendous
imorovements have already been seen in the James River and Whitewood Creek
because of projects at Mitchell and lead-Oeadwood.
- 20 -
image:
76
Five lakes have been selected for the SPA Clean lakes Program, and the
lake Herman project was one of seven Model Implementation Programs in the
country. Implementation activities have been initiated in twelve watersheds.
The OWNR is involved in the Slack Hills local Council of Governments urban
runoff orogram, which is a three year program to determine the impact of Rapid
City's urban runoff on Raoid Creek. The DWNR is also working with the
protection of instream flows, management strategies for on-site sewage
disoosal and coooerative management strategies with the U.S. Forest Service
and South Dakota Indian tribes.
The Construction Grants Program is responsible for the control of point
sources of water pollution and the administration of Federal grants for the
construction of municipal wastewater treatment facilities. This section has
administered 36.9 million dollars in grants since 1972 which has resulted in
the completion of 47 projects with 11 more currently under construction. A
recent survey of 25 of those projects showed that pollutants were reduced by
72.4 to 30.2 percent. Surveys now in progress are designed to document actual
improvements in stream water quality and aquatic communities. Tremendous
imorovements have already been seen in the James River and Whitewood Creek
because of projects at Mitchell and lead-Oeadwood.
- 20 -
image:
 77
UTAH
The Utah Water Pollution Control Committee (UWPCC) has grouped the waters
of the State into classes to protect the beneficial uses and has established
numerical standards for water quality parameters for each of these uses. In
order to monitor for attainment of these standards, the Bureau of Water
Pollution Control has established over 500 active and semi-active stream
sampling stations. Of these, 170 have been selected for trend analysis to
determine water quality degradation or improvement.
Point sources oresent a geographically limited oroblem to water quality
and are obviously more significant in the highly populated areas. Wastewater
treatment facilities concentrated in certain drainages seriously impact the
receiving streams because of the population loads. The important example is
the Jordan River which flows from south to north through the Salt Lake
Valley. There are currently eight municipal treatment facilities in operation
which treat wastewater from a oopulation equivalent of 700,000 and which
discharge into the Jordan River.
Most remaining water quality problems in Utah result from nonpoint source
rather than ooint source discharges. Nonpoint sources of pollutants include
discharges from natural geologic formations, agriculture, urban runoff,
hydrologic modification, mining, recreation, construction and silviculture.
Natural sandstone formations in eastern and southern Utah contribute
significant amounts of sediments through erosion. Natural deposits of salts,
ohosohates, fluorides, nitrates and arsenic also contribute to decreasing
water quality in certain areas of the State.
The majority of the total water used in Utah is for agriculture. As a
result, this is one of the primary sources of human induced nonpoint
pollution. Diversion of waters for irrigation tends to concentrate salts and
solids in original stream channels. Also, return flow discharges add salts,
nutrients and sediments from croplands into stream channels. Overland runoff
contributes salts and sediments from non-irrigated croplands and coliform
bacteria from pasture land.
Utah and EPA have previously designated 23 stream segments in Utah as
critical water quality problem areas in fiscal year 1981. Improved data
analysis has allowed an updating of that Priority list (See Figure 15;
Appendix A, Table 5). Utah's recent 305(b) report represents a continuing
update of the priority stream segments. The Weber River and its tributaries
from the Stoddard diversion to its headwaters is the most impaired stream for
its designated uses. Recreational developments, agriculture and energy
exploration in the headwaters of this stream segment are the primary reasons
why it is the most impaired. Other segments that remain high on list are
those which are most affected by high peculation (Provo River, Jordan River,
Spanish Pork River). Nonooint agricultural sources and salinity problems are
the reasons why the other stream segments are on the priority list.
- 21 -
image:
77
UTAH
The Utah Water Pollution Control Committee (UWPCC) has grouped the waters
of the State into classes to protect the beneficial uses and has established
numerical standards for water quality parameters for each of these uses. In
order to monitor for attainment of these standards, the Bureau of Water
Pollution Control has established over 500 active and semi-active stream
sampling stations. Of these, 170 have been selected for trend analysis to
determine water quality degradation or improvement.
Point sources oresent a geographically limited oroblem to water quality
and are obviously more significant in the highly populated areas. Wastewater
treatment facilities concentrated in certain drainages seriously impact the
receiving streams because of the population loads. The important example is
the Jordan River which flows from south to north through the Salt Lake
Valley. There are currently eight municipal treatment facilities in operation
which treat wastewater from a oopulation equivalent of 700,000 and which
discharge into the Jordan River.
Most remaining water quality problems in Utah result from nonpoint source
rather than ooint source discharges. Nonpoint sources of pollutants include
discharges from natural geologic formations, agriculture, urban runoff,
hydrologic modification, mining, recreation, construction and silviculture.
Natural sandstone formations in eastern and southern Utah contribute
significant amounts of sediments through erosion. Natural deposits of salts,
ohosohates, fluorides, nitrates and arsenic also contribute to decreasing
water quality in certain areas of the State.
The majority of the total water used in Utah is for agriculture. As a
result, this is one of the primary sources of human induced nonpoint
pollution. Diversion of waters for irrigation tends to concentrate salts and
solids in original stream channels. Also, return flow discharges add salts,
nutrients and sediments from croplands into stream channels. Overland runoff
contributes salts and sediments from non-irrigated croplands and coliform
bacteria from pasture land.
Utah and EPA have previously designated 23 stream segments in Utah as
critical water quality problem areas in fiscal year 1981. Improved data
analysis has allowed an updating of that Priority list (See Figure 15;
Appendix A, Table 5). Utah's recent 305(b) report represents a continuing
update of the priority stream segments. The Weber River and its tributaries
from the Stoddard diversion to its headwaters is the most impaired stream for
its designated uses. Recreational developments, agriculture and energy
exploration in the headwaters of this stream segment are the primary reasons
why it is the most impaired. Other segments that remain high on list are
those which are most affected by high peculation (Provo River, Jordan River,
Spanish Pork River). Nonooint agricultural sources and salinity problems are
the reasons why the other stream segments are on the priority list.
- 21 -
image:
 312> / ^ •
^ 2 2 gates' /{
^g ^ \V A
m^^l^5^ H
2, 3 - Jordan River
4 - Provo River
5 - Snake Creek
6 - East Canyon Creek
7 - Price River
8 - Pleasant Valley Creek
9 - Big Cottonv/ccd Creek
10 - Little Cottonwood Creek
11 - Mill Creek
12 - Sear River
13 - Weber River
14 - Spanish Fork River
15 - Sanjarnin Slough
27,
IS - Easr Creek
17 - Sevier River
18 - Little Bear River
19 - Ashley Creek
20 - Weber River
21 - San Pitch River
22 - Bear River
23 - Duchesne River
24 - Clarks ton Creek
25 - Sevier River
2£. - Fort Creek
28 - Sevier River
29 - Kanab Creek
78
- 22 -
image:
312> / ^ •
^ 2 2 gates' /{
^g ^ \V A
m^^l^5^ H
2, 3 - Jordan River
4 - Provo River
5 - Snake Creek
6 - East Canyon Creek
7 - Price River
8 - Pleasant Valley Creek
9 - Big Cottonv/ccd Creek
10 - Little Cottonwood Creek
11 - Mill Creek
12 - Sear River
13 - Weber River
14 - Spanish Fork River
15 - Sanjarnin Slough
27,
IS - Easr Creek
17 - Sevier River
18 - Little Bear River
19 - Ashley Creek
20 - Weber River
21 - San Pitch River
22 - Bear River
23 - Duchesne River
24 - Clarks ton Creek
25 - Sevier River
2£. - Fort Creek
28 - Sevier River
29 - Kanab Creek
78
- 22 -
image:
 79
In its ongoing effort to identify and correct sources of pollution, Utah
has implemented several water quality orograms. For example, there are six
water quality management clans that have been certified. These olans interact
with Federal, State and local governments in planning, coordinating and
monitoring water quality projects. Federal construction grant funds have been
utilized for most of the planning, design, and construction of needed
municioal wastewater treatment facilities and various phases of sewer projects
in Utah. The goals of the construction grants projects municipal wastewater
treatment facilities are various ohases of sewer projects in Utah. The goals
of the construction grants orojects are to improve or maintain the water
quality of receiving streams and to assure adequate protection of public
health.
Industrial wastewater systems have been constructed as a result of the
Utah Water Pollution Control Committee regulations and the Federal Clean Water
Act. Various municipal, industrial and agriculture facilities have active
federal discharge permits (NPOES permits issued by EPA) which are reviewed
regularly under the five-year renewal system. Continued sampling of the
discharge from these facilities will help enforce the requirements of the
NPOES program.
Presently, Salt lake County is conducting a Nationwide Urban Runoff
Program (NURP). Also, the Mountainland Association of Governments is
monitoring water quality to determine the effectiveness of implemented Best
Management Practices (BMP's) in the Snake Creek Rural Clean Water Project irr~
Wasatch County.
Six counties (Salt lake, Davis, Weber, Cache, Ouchesne and Uintah) are
currently involved in wetland programs. These projects include the mapping of
wetland areas and the determination of those which are of the greatest value
in flood control, urban runoff, wildlife habitat and recreational aesthetics.
Salinity will remain a problem in Utah because of contributions of
dissolved solids from natural runoff and agriculture. The State will continue
to pursue salinity control activities with the resources available in the
Colorado River and Sevier River basins.
The Clean Lakes Inventory and Classification has been completed, covering
127 impoundments in Utah. Three reservoirs, Panguitch, Scofield and Deer
Creek, are being studied under current 314 Clean Lakes Grants. Each grant
consists of two parts, a diagnostic study and a restoration feasibility study.
image:
79
In its ongoing effort to identify and correct sources of pollution, Utah
has implemented several water quality orograms. For example, there are six
water quality management clans that have been certified. These olans interact
with Federal, State and local governments in planning, coordinating and
monitoring water quality projects. Federal construction grant funds have been
utilized for most of the planning, design, and construction of needed
municioal wastewater treatment facilities and various phases of sewer projects
in Utah. The goals of the construction grants projects municipal wastewater
treatment facilities are various ohases of sewer projects in Utah. The goals
of the construction grants orojects are to improve or maintain the water
quality of receiving streams and to assure adequate protection of public
health.
Industrial wastewater systems have been constructed as a result of the
Utah Water Pollution Control Committee regulations and the Federal Clean Water
Act. Various municipal, industrial and agriculture facilities have active
federal discharge permits (NPOES permits issued by EPA) which are reviewed
regularly under the five-year renewal system. Continued sampling of the
discharge from these facilities will help enforce the requirements of the
NPOES program.
Presently, Salt lake County is conducting a Nationwide Urban Runoff
Program (NURP). Also, the Mountainland Association of Governments is
monitoring water quality to determine the effectiveness of implemented Best
Management Practices (BMP's) in the Snake Creek Rural Clean Water Project irr~
Wasatch County.
Six counties (Salt lake, Davis, Weber, Cache, Ouchesne and Uintah) are
currently involved in wetland programs. These projects include the mapping of
wetland areas and the determination of those which are of the greatest value
in flood control, urban runoff, wildlife habitat and recreational aesthetics.
Salinity will remain a problem in Utah because of contributions of
dissolved solids from natural runoff and agriculture. The State will continue
to pursue salinity control activities with the resources available in the
Colorado River and Sevier River basins.
The Clean Lakes Inventory and Classification has been completed, covering
127 impoundments in Utah. Three reservoirs, Panguitch, Scofield and Deer
Creek, are being studied under current 314 Clean Lakes Grants. Each grant
consists of two parts, a diagnostic study and a restoration feasibility study.
image:
 80
SUMMARY OF UTAH'S NONPOINT SOURCE ISSUES
In addressing Utah's NPS issues, careful consideration and distinction of
both natural and human caused sources is necessary. Some of the more
imoortant natural sources include: sandstone formations in eastern and
southern parts of the state; desposits of salts, phosphates, fluorides,
nitrates, and arsenic, saline springs, and limestone in shale formations.
Resulting water quality imoacts include high levels of turbidity, phosphorus,
and dissolved and susoended solids. Natural sources are suspected of causing
the high mercury levels seen in recent monitoring in
phenol concentrations found in some streams (such as
and Pleasant Valley Creeks) are attributed to either
causes. The common high intensity, short duration storms help to increase the
contribution of natural sources.
the Scofield area. High
Cottonwood, Huntington,
mining or natural
The araawide planning agencies have addressed
of natural gully and streambank erosion. However,
limited this effort.
to some extent the control
high control costs have
The primary emphasis on NPS control in Utah reflects to sources from
several primary types of land uses. Some of the most important include:
feed lots (particularly on the middle and lower Bear River and on the Provo
River system; oil, gas, and mining activities, livestock grazing, range!and---
erosion, irrigation return flows, non-irrigated cropland runoff and erosion,
construction, urban runoff particularly along the Wasatch Front,
recreation/urban development (such as on the Weber River system), improper
functioning of seotic systems resulting from poor design and/or location, and
silvicultural activities. Water quality impacts from these sources include
fecal coliforms, suspended and dissovled solids, possibly phenols from mining,
turbidity, salinity, nutrients, and sodium in the Jordan River area, among
other parameters.
NPS control is a major component of the State and araawide planning
orograms. This planning is characterized by extensive reliance on the
existing local institutional framework. Some of the primary components of
this framework include the soil conservation district, Soil Conservation
Service, Agricultural Stabilization and Conservation Service, local Health
Deoartnent, and local land use planning programs. However, Utah's latest
305(b) Water Quality Report states that there is a "major challenge in
developing technologies and institutions to effectively deal with these
sources." Efforts continue to assess problems, determine priority areas and
solutions, and to refine implementation planning/agreements with management
agencies. A major salinity control effort is ongoing. It involves the U.S.
Bureau of Reclamation and U.S. Soil Conservation Service among other agencies.
Very limited funding for these local land planning agencies is affected
by the level of implementation. In addition, local programs as well as by
priorities other than water quality.
- 24 -
image:
80
SUMMARY OF UTAH'S NONPOINT SOURCE ISSUES
In addressing Utah's NPS issues, careful consideration and distinction of
both natural and human caused sources is necessary. Some of the more
imoortant natural sources include: sandstone formations in eastern and
southern parts of the state; desposits of salts, phosphates, fluorides,
nitrates, and arsenic, saline springs, and limestone in shale formations.
Resulting water quality imoacts include high levels of turbidity, phosphorus,
and dissolved and susoended solids. Natural sources are suspected of causing
the high mercury levels seen in recent monitoring in
phenol concentrations found in some streams (such as
and Pleasant Valley Creeks) are attributed to either
causes. The common high intensity, short duration storms help to increase the
contribution of natural sources.
the Scofield area. High
Cottonwood, Huntington,
mining or natural
The araawide planning agencies have addressed
of natural gully and streambank erosion. However,
limited this effort.
to some extent the control
high control costs have
The primary emphasis on NPS control in Utah reflects to sources from
several primary types of land uses. Some of the most important include:
feed lots (particularly on the middle and lower Bear River and on the Provo
River system; oil, gas, and mining activities, livestock grazing, range!and---
erosion, irrigation return flows, non-irrigated cropland runoff and erosion,
construction, urban runoff particularly along the Wasatch Front,
recreation/urban development (such as on the Weber River system), improper
functioning of seotic systems resulting from poor design and/or location, and
silvicultural activities. Water quality impacts from these sources include
fecal coliforms, suspended and dissovled solids, possibly phenols from mining,
turbidity, salinity, nutrients, and sodium in the Jordan River area, among
other parameters.
NPS control is a major component of the State and araawide planning
orograms. This planning is characterized by extensive reliance on the
existing local institutional framework. Some of the primary components of
this framework include the soil conservation district, Soil Conservation
Service, Agricultural Stabilization and Conservation Service, local Health
Deoartnent, and local land use planning programs. However, Utah's latest
305(b) Water Quality Report states that there is a "major challenge in
developing technologies and institutions to effectively deal with these
sources." Efforts continue to assess problems, determine priority areas and
solutions, and to refine implementation planning/agreements with management
agencies. A major salinity control effort is ongoing. It involves the U.S.
Bureau of Reclamation and U.S. Soil Conservation Service among other agencies.
Very limited funding for these local land planning agencies is affected
by the level of implementation. In addition, local programs as well as by
priorities other than water quality.
- 24 -
image:
 81
WYOMING
Water quality data and inventories for Wyoming are indicative of
generally high water quality. For years the State has enjoyed a low density
oooulation couoled with little industrial development. However, in recent
years, a raoidly growing population associated with energy and mineral
development has necessitated intensified efforts to protect valuable water
resources.
Of the forty priority water bodies (See Figure 16; Appendix A, Table 6)
identified in Wyoming's 305(b) report, only a few can be associated with point
source discharge activities. The recreation and aquatic life uses of Goose
Creek from the mouth upstream to the Sheridan Sewage Treatment Plant are
severely impaired by bacteria and un-ionized ammonia. Data for Clear Creek
near Buffalo, Bitter Creek near Powell, Baldwin Creek near lander and the
Belle Fourche River near Hewlett indicate potential aquatic life use
impairment from point source discharges of ammonia. Those problems are being
addressed primarily through construction grants and NPOES permits.
A majority of the water quality problems in lakes and stream segments are
the result of diffuse nonpoint source, or combinations of point and nonpoint
sources. Any number of Federal agencies may be involved in management of
lands in a particular drainage. In order to address these types of problems,
Wyoming cooperates with other State and Federal agencies, and utilizes
available resources from a variety of programs to develop comprehensive watar
quality management plans.
A prime example is Sitter Creek where problems are being addressed
through the Construction Grants, Water Quality Management Planning, and NPOES
programs. State agencies involved in addition to the Department of
Environmental Quality are the Department of Agriculture and the University of
Wyoming. Similar cooperative efforts are being utilized in the Fifteen Mile
Creek drainage where a number of State and Federal agencies are pooling
resources to improve riparian habitat in the drainage. It is anticipated that
this same type of cooperative effort will be prerequisite to the solution of
eutroohication problems in Flaming Gorge Reservoir, Wyoming's number one
priority water body (See Figure 6).
The Flaming Gorge Reservoir, in southwestern Wyoming and northeastern
Utah, is considered a priority by EPA and the State of Wyoming because of its
importance as a recreational facility, and due to interstate implications with
Utah. The southwest Wyoming Water Quality Management Plan, certified by
Governor Herschler on March 30, 1980, and conditionally approved by EPA on
October 9, 1980 identified Flaming Gorge as a major water quality problem in
the State of Wyoming. This finding is supported by the Clean Lakes Inventory.
- 25 -
image:
81
WYOMING
Water quality data and inventories for Wyoming are indicative of
generally high water quality. For years the State has enjoyed a low density
oooulation couoled with little industrial development. However, in recent
years, a raoidly growing population associated with energy and mineral
development has necessitated intensified efforts to protect valuable water
resources.
Of the forty priority water bodies (See Figure 16; Appendix A, Table 6)
identified in Wyoming's 305(b) report, only a few can be associated with point
source discharge activities. The recreation and aquatic life uses of Goose
Creek from the mouth upstream to the Sheridan Sewage Treatment Plant are
severely impaired by bacteria and un-ionized ammonia. Data for Clear Creek
near Buffalo, Bitter Creek near Powell, Baldwin Creek near lander and the
Belle Fourche River near Hewlett indicate potential aquatic life use
impairment from point source discharges of ammonia. Those problems are being
addressed primarily through construction grants and NPOES permits.
A majority of the water quality problems in lakes and stream segments are
the result of diffuse nonpoint source, or combinations of point and nonpoint
sources. Any number of Federal agencies may be involved in management of
lands in a particular drainage. In order to address these types of problems,
Wyoming cooperates with other State and Federal agencies, and utilizes
available resources from a variety of programs to develop comprehensive watar
quality management plans.
A prime example is Sitter Creek where problems are being addressed
through the Construction Grants, Water Quality Management Planning, and NPOES
programs. State agencies involved in addition to the Department of
Environmental Quality are the Department of Agriculture and the University of
Wyoming. Similar cooperative efforts are being utilized in the Fifteen Mile
Creek drainage where a number of State and Federal agencies are pooling
resources to improve riparian habitat in the drainage. It is anticipated that
this same type of cooperative effort will be prerequisite to the solution of
eutroohication problems in Flaming Gorge Reservoir, Wyoming's number one
priority water body (See Figure 6).
The Flaming Gorge Reservoir, in southwestern Wyoming and northeastern
Utah, is considered a priority by EPA and the State of Wyoming because of its
importance as a recreational facility, and due to interstate implications with
Utah. The southwest Wyoming Water Quality Management Plan, certified by
Governor Herschler on March 30, 1980, and conditionally approved by EPA on
October 9, 1980 identified Flaming Gorge as a major water quality problem in
the State of Wyoming. This finding is supported by the Clean Lakes Inventory.
- 25 -
image:
 .Q K' w* o*1^ A v
rri,* \ /v^- -.x - • '•' v ^ A
^ VT .o^r^- «A A"
/vv;>^>^-
-** nx t &* ^
\
image:
.Q K' w* o*1^ A v
rri,* \ /v^- -.x - • '•' v ^ A
^ VT .o^r^- «A A"
/vv;>^>^-
-** nx t &* ^
\
image:
 83
The reservoir Is experiencing accelerated eutrophication which is
impairing the cold water fishery, primary and secondary recreation. Natural
runoff, mining, grazing, irrigation return flows, urban runoff, construction,
and municipal discharges have been identified as possible pollution sources.
The Drincioal tributary to this reservoir is the Green River in Wyoming, a
drainage under intensive hydrological study for coal and oil-shale extraction
and an area undergoing rapid development.
Several Federal agencies (Forest Service, Bureau of Reclamation, 8LM) are
involved in reservoir operations and adjacent land management activities.
Because of the imoortance of Flaming Gorge as a recreational facility, and
interstate implications with Utah, the reservoir is considered a priority by
EPA and Wyoming. Western Wyoming College (WWC) Water Quality Laboratory has
submitted a project proposal to the Wyoming Water Development Commission. If
the project is funded, Wyoming and EPA will cooperate with WWC and will
provide technical assistance, as resources allow. EPA will play a key-role in
securing cooperation and commitments from Fedeal agencies (8UREC, 3LM, USFS,
SCS, USFWS) and in resolving interstate issues. If funding is not received
for the proposal, this priority issue will be dropped until the necessary
resources are obtained.
The Wyoming Department of Environmental Quality, Wyoming Conservation
Commission, Bureau of Land Management and University of Wyoming Range
Management Division are working together on a five year cooperative watershed^
study on Fifteen Mile Creek, located near Worland, Wyoming. Fifteen Mile
Creek has been identified as a major factor in the deterioration of the water
quality of the Big Horn River. This drainage contributes a relatively large
oortion of the sediment load to the Big Horn River. The cooperative study
will be accomplished through agreements and contracts with the above agencies
and will include a detailed analysis of the effects of livestock management on
rioarian zones supported by ephemeral flow along Fifteen Mile Creek. The
study will test the effect of such management practices as livestock
exclusion, mechanical bank manipulation, seeding, season of grazing use,
sediment catchment basins and water spreaders, and stocking rate. Best
Management Practices will be developed in relation to grazing riparian zones
along ephemeral streams for reducing sediment flow. The study will document a
sound basis for management through the programs of 3LM, Conservation District,
and extension services.
The Urban Storm Water Management Program for Wyoming is centered around
the development of storm water quality control plan for highly populated areas
within Wyoming. Cheyenne, Casper and Jackson, Wyoming were identified as the
target areas. An urban storm water management analysis has been developed for
Cheyenne and Casper.
- 27 -.
image:
83
The reservoir Is experiencing accelerated eutrophication which is
impairing the cold water fishery, primary and secondary recreation. Natural
runoff, mining, grazing, irrigation return flows, urban runoff, construction,
and municipal discharges have been identified as possible pollution sources.
The Drincioal tributary to this reservoir is the Green River in Wyoming, a
drainage under intensive hydrological study for coal and oil-shale extraction
and an area undergoing rapid development.
Several Federal agencies (Forest Service, Bureau of Reclamation, 8LM) are
involved in reservoir operations and adjacent land management activities.
Because of the imoortance of Flaming Gorge as a recreational facility, and
interstate implications with Utah, the reservoir is considered a priority by
EPA and Wyoming. Western Wyoming College (WWC) Water Quality Laboratory has
submitted a project proposal to the Wyoming Water Development Commission. If
the project is funded, Wyoming and EPA will cooperate with WWC and will
provide technical assistance, as resources allow. EPA will play a key-role in
securing cooperation and commitments from Fedeal agencies (8UREC, 3LM, USFS,
SCS, USFWS) and in resolving interstate issues. If funding is not received
for the proposal, this priority issue will be dropped until the necessary
resources are obtained.
The Wyoming Department of Environmental Quality, Wyoming Conservation
Commission, Bureau of Land Management and University of Wyoming Range
Management Division are working together on a five year cooperative watershed^
study on Fifteen Mile Creek, located near Worland, Wyoming. Fifteen Mile
Creek has been identified as a major factor in the deterioration of the water
quality of the Big Horn River. This drainage contributes a relatively large
oortion of the sediment load to the Big Horn River. The cooperative study
will be accomplished through agreements and contracts with the above agencies
and will include a detailed analysis of the effects of livestock management on
rioarian zones supported by ephemeral flow along Fifteen Mile Creek. The
study will test the effect of such management practices as livestock
exclusion, mechanical bank manipulation, seeding, season of grazing use,
sediment catchment basins and water spreaders, and stocking rate. Best
Management Practices will be developed in relation to grazing riparian zones
along ephemeral streams for reducing sediment flow. The study will document a
sound basis for management through the programs of 3LM, Conservation District,
and extension services.
The Urban Storm Water Management Program for Wyoming is centered around
the development of storm water quality control plan for highly populated areas
within Wyoming. Cheyenne, Casper and Jackson, Wyoming were identified as the
target areas. An urban storm water management analysis has been developed for
Cheyenne and Casper.
- 27 -.
image:
 84
Preliminary work performed as a Dart of the Teton County Water Quality
Program indicated a significant impact upon water quality in Flat Creek due to
stormwater runoff from the Town of Jackson. Test samples taken from major
storm drain discharges showed high concentrations of total dissolved solids,
lead and coliform bacteria, impair the recreational and aesthetic quality of
Flat Creek and do harm to aquatic life. At the same time, urban development
has continued during the past four years in the Town and County which have
contributed an increase in the quantity of stormwater runoff. Consequently,
the Teton County Water Quality Plan recommended in 1979 the development of a
stormwater master plan to manage stormwater within the Town and County Urban
Expansion Area.
The Jackson project was started in 1980. The study focused on four major
outouts:
1. The identification of existing water quality problems caused by
stormwater runoff within the Town of Jackson and proposed expansion
areas.
2. The identification of specific control measures for the Jackson
environment to limit the impact of stormwater on water quality and
private property.
3. The development of an overall drainage plan with emphasis upon
undevelooed areas of the Town and county zoned for urban densities.
4. The development of the necessary legal, institutional and financial
mechanisms to implement the proposed stormwater master plan and
control measures.
Pour sampling stations were set up within the Jackson area. Water
quality data was collected for 2 years. DEQ assisted this effort with
laboratory analysis. A preliminary draft of the stormwater master plan came
out in December 1982. This document is in the final review process. The
overall goal of this stornwater master plan is to improve water quality in
Plat Creek and its tributaries in conjunction with the increasing land
development occurring within the Town and areas immediately adjacent to Town.
-, 28 -.
image:
84
Preliminary work performed as a Dart of the Teton County Water Quality
Program indicated a significant impact upon water quality in Flat Creek due to
stormwater runoff from the Town of Jackson. Test samples taken from major
storm drain discharges showed high concentrations of total dissolved solids,
lead and coliform bacteria, impair the recreational and aesthetic quality of
Flat Creek and do harm to aquatic life. At the same time, urban development
has continued during the past four years in the Town and County which have
contributed an increase in the quantity of stormwater runoff. Consequently,
the Teton County Water Quality Plan recommended in 1979 the development of a
stormwater master plan to manage stormwater within the Town and County Urban
Expansion Area.
The Jackson project was started in 1980. The study focused on four major
outouts:
1. The identification of existing water quality problems caused by
stormwater runoff within the Town of Jackson and proposed expansion
areas.
2. The identification of specific control measures for the Jackson
environment to limit the impact of stormwater on water quality and
private property.
3. The development of an overall drainage plan with emphasis upon
undevelooed areas of the Town and county zoned for urban densities.
4. The development of the necessary legal, institutional and financial
mechanisms to implement the proposed stormwater master plan and
control measures.
Pour sampling stations were set up within the Jackson area. Water
quality data was collected for 2 years. DEQ assisted this effort with
laboratory analysis. A preliminary draft of the stormwater master plan came
out in December 1982. This document is in the final review process. The
overall goal of this stornwater master plan is to improve water quality in
Plat Creek and its tributaries in conjunction with the increasing land
development occurring within the Town and areas immediately adjacent to Town.
-, 28 -.
image:
 -A
COLIRAOO piuonirv STIIEAM SEGJ-IEHTS A»m IMI^AIIIEO BEMF.FICIAL USE
1) South
Platto ft Ivor
n to
2) boulder
3) Clear
1) Clp.ir Cr.
froni Idaho
SI.T Inys to
' YoiiMfjf lelrl
5} St. Vrfti
Cr. fran
L to
Huuli
G) niij
1 hanpson
lllvf.'r fron
Lovoland to
Month
llse
warm water f Islvjry
SRC. contact re-
creation
publIc water supply
wnrm water f islwry
sec. contact re-
creation
wctfer
Sc<-
cold w-iter Tlsliery
public water supply
warm water fishery
sec. contact re-
creation
warm water f Uttcry
soc. contact re-
croalIon
public water supply
Prob]em Parietcrs
/j it ^ ( p-C
Cu, Zn, Ca
FC, HOo-N
TP, SSEU
, IDS,
Non-Point Source
Pojnt Source p Is char gers M-L£!!iLr flet$
Uttlelon/Englewoocj WUTP urban runoff
nencftcUl
Public Water Siijiply Si-yu^nl
liavlnij Levels wILhin VOX of
Standards
Ootllder
Louis-ville
Inactive mining
Lorujiiont UWTP
LnvclaniJ WWfP
CO
en
image:
-A
COLIRAOO piuonirv STIIEAM SEGJ-IEHTS A»m IMI^AIIIEO BEMF.FICIAL USE
1) South
Platto ft Ivor
n to
2) boulder
3) Clear
1) Clp.ir Cr.
froni Idaho
SI.T Inys to
' YoiiMfjf lelrl
5} St. Vrfti
Cr. fran
L to
Huuli
G) niij
1 hanpson
lllvf.'r fron
Lovoland to
Month
llse
warm water f Islvjry
SRC. contact re-
creation
publIc water supply
wnrm water f islwry
sec. contact re-
creation
wctfer
Sc<-
cold w-iter Tlsliery
public water supply
warm water fishery
sec. contact re-
creation
warm water f Uttcry
soc. contact re-
croalIon
public water supply
Prob]em Parietcrs
/j it ^ ( p-C
Cu, Zn, Ca
FC, HOo-N
TP, SSEU
, IDS,
Non-Point Source
Pojnt Source p Is char gers M-L£!!iLr flet$
Uttlelon/Englewoocj WUTP urban runoff
nencftcUl
Public Water Siijiply Si-yu^nl
liavlnij Levels wILhin VOX of
Standards
Ootllder
Louis-ville
Inactive mining
Lorujiiont UWTP
LnvclaniJ WWfP
CO
en
image:
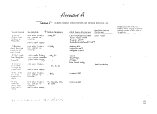 piuuum STREAM SEGHEHIS AHO WAIUEO UEHEFICIAI. use
7) Little
TUnupson fi I vei-
n-fun O
tu HuiiLh
sec. contact rc-
crcatIon
Hon-PoInt Sourco
Problem
l)»;iicf l«. 1.11 Ilio Ct Itcrl.i
I'tihlli. VJ,iU;r Sii|i|il^ 'ii.'i|iiciil
n.ivln.'i I eviv):. ullliln 'Jilt <it
St iiii'lanls
0) Pou.lra
H Ivor f i Dm Ft.
Collins to
•Mouth
9) Arkansas
ft Ivor from
1-25 to
I. a Junta
. contact re-
creation
pu!>1 ic water supply
$cc. contact re-
cfcatIon
FC.
Industrial dlschargo
Eastman Kodak
Oreoley
rc, Zn. IDS, SSED, IP, Pueblo
S0.i. Cu, fl), Ag, CF^X
U-Hlh, Cr, lln, 'O
\
10). Ai'
II Ivor front
L a Junta to
State L ino
115 Fountain
"r. frc»»
warm water fishery
sou. contact rc-
creation
pub!Ic water supply
agriculture
'Publi
Supply
Zn.vTOS, SSED, HOj,
IP, S04, FC, Pb
wo _
irrigation returns
natural sources
Colorado Springs VAJIP
2} l)ncoiii(ia)i(jrc
I vcr
Sec. Cx)nfQct
cx>
image:
piuuum STREAM SEGHEHIS AHO WAIUEO UEHEFICIAI. use
7) Little
TUnupson fi I vei-
n-fun O
tu HuiiLh
sec. contact rc-
crcatIon
Hon-PoInt Sourco
Problem
l)»;iicf l«. 1.11 Ilio Ct Itcrl.i
I'tihlli. VJ,iU;r Sii|i|il^ 'ii.'i|iiciil
n.ivln.'i I eviv):. ullliln 'Jilt <it
St iiii'lanls
0) Pou.lra
H Ivor f i Dm Ft.
Collins to
•Mouth
9) Arkansas
ft Ivor from
1-25 to
I. a Junta
. contact re-
creation
pu!>1 ic water supply
$cc. contact re-
cfcatIon
FC.
Industrial dlschargo
Eastman Kodak
Oreoley
rc, Zn. IDS, SSED, IP, Pueblo
S0.i. Cu, fl), Ag, CF^X
U-Hlh, Cr, lln, 'O
\
10). Ai'
II Ivor front
L a Junta to
State L ino
115 Fountain
"r. frc»»
warm water fishery
sou. contact rc-
creation
pub!Ic water supply
agriculture
'Publi
Supply
Zn.vTOS, SSED, HOj,
IP, S04, FC, Pb
wo _
irrigation returns
natural sources
Colorado Springs VAJIP
2} l)ncoiii(ia)i(jrc
I vcr
Sec. Cx)nfQct
cx>
image:
 y.i?._L'!lfii'jl£il
COLORADO PfUOrtlTY STREAM SEGHENFS AflO IMPAIRED BENEFICIAL USE
I'rotil cm Parameters
Non-Point Source
"Dolort-s niv«r warm water fishery U-HII3, 2n. IDS, IN,
FC, N02-H03
5) North Fork cold water fishery TP, Cu, Zn, Cd
I tMi' Cr .
Union Carbide
;'l) Cherry Cr. sec. contact re-
creation
urban runoff
Inactive mining
Itlal Use - Crltor In
PutiUc Mrtlor Sii|i|>ly NiMfimil
llavlmj Levels wll.hiu W.I of
OO
image:
y.i?._L'!lfii'jl£il
COLORADO PfUOrtlTY STREAM SEGHENFS AflO IMPAIRED BENEFICIAL USE
I'rotil cm Parameters
Non-Point Source
"Dolort-s niv«r warm water fishery U-HII3, 2n. IDS, IN,
FC, N02-H03
5) North Fork cold water fishery TP, Cu, Zn, Cd
I tMi' Cr .
Union Carbide
;'l) Cherry Cr. sec. contact re-
creation
urban runoff
Inactive mining
Itlal Use - Crltor In
PutiUc Mrtlor Sii|i|>ly NiMfimil
llavlmj Levels wll.hiu W.I of
OO
image:
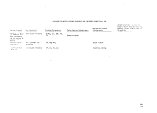 «2«* MONTANA piuoiury STREAM SEGMENTS AMD IMPAIRED BENEFICIAL USE
Impaired
Problem Parameters
Polrit Source Uiscliy^ers
1
2
J
<•
_a
4
5
Hu.Uy
tre^k
Si:,/. * 111 .24
. High
Ore (.'reek
Scv. - 3IJ.UI
Silver
Dun Creek
f... ~f
£V ~c*i, t*J&
. Prukly
Pear Creuk
- U; I u(
L. iloluiu
Scv. - 20.00
. Spring
Cruek
iuv. - 111.2?
A>iiiatic Life TSS, H
Irrigation
Public Water
llecreat lun
V
A>|uallc Life MetaU, 1SS, pll
AiiualicLife S04, TUS, Metals.
Irrigation N, P. pll, UOD
1 ivestock
Uatering
necreatiun
Ai|iiallc Life Metals, 11(3, FC
Irrigation 1SS. M, P
Livestock
Watering
Public Water
Sec. Contact
Rei.reallon
Auuatlc Life Metals, TSS, pll,
Irrigation IDS
1 ivestui:k
ItuLei'lug
Itecreatlon
liutte UUTP
Mining
Industrial
Discharge
Helena WWTP
E. Helena VlUfl1
Industrial
UU charge
Mining
'
H on -Point
Source piscjur'jers
Irrigated Agri-
culture
Natural Sources
llytlroloQJcat Hutll-
fI cat ton
Inactive Mining
Mining (Inactive)
Urban ttunoff
Inactive Mining
Urban ttunoff
Irrigated Agriculture
Grazing
Hydrologlc Modification
Deneficlal Use-Criteria
Public Water Supply Sequenti
Slaving Levels within W% uf
Standards
CX>
CD
image:
«2«* MONTANA piuoiury STREAM SEGMENTS AMD IMPAIRED BENEFICIAL USE
Impaired
Problem Parameters
Polrit Source Uiscliy^ers
1
2
J
<•
_a
4
5
Hu.Uy
tre^k
Si:,/. * 111 .24
. High
Ore (.'reek
Scv. - 3IJ.UI
Silver
Dun Creek
f... ~f
£V ~c*i, t*J&
. Prukly
Pear Creuk
- U; I u(
L. iloluiu
Scv. - 20.00
. Spring
Cruek
iuv. - 111.2?
A>iiiatic Life TSS, H
Irrigation
Public Water
llecreat lun
V
A>|uallc Life MetaU, 1SS, pll
AiiualicLife S04, TUS, Metals.
Irrigation N, P. pll, UOD
1 ivestock
Uatering
necreatiun
Ai|iiallc Life Metals, 11(3, FC
Irrigation 1SS. M, P
Livestock
Watering
Public Water
Sec. Contact
Rei.reallon
Auuatlc Life Metals, TSS, pll,
Irrigation IDS
1 ivestui:k
ItuLei'lug
Itecreatlon
liutte UUTP
Mining
Industrial
Discharge
Helena WWTP
E. Helena VlUfl1
Industrial
UU charge
Mining
'
H on -Point
Source piscjur'jers
Irrigated Agri-
culture
Natural Sources
llytlroloQJcat Hutll-
fI cat ton
Inactive Mining
Mining (Inactive)
Urban ttunoff
Inactive Mining
Urban ttunoff
Irrigated Agriculture
Grazing
Hydrologlc Modification
Deneficlal Use-Criteria
Public Water Supply Sequenti
Slaving Levels within W% uf
Standards
CX>
CD
image:
 frnt«i(J<ttUtmuas^^
IIWANA PRIORITY sine AH SECT-HINTS AND WAIIIEU QEUEFICIAL
Problem Parameters
Point Source
Hon-PoJnt
Source 0 tschargers
Beneficial Use-Criteria
Public Mater Supply
Having Levels Mttttin 90X of
Standards
6. iol.m
Illvur -
Uil.M
Prlobt
Unite
Suv. U.'1'j
/, Ash toy
Si;v. * 5.90
H. ttuavur
C.ruuk -
l)ui/l)>'ll>
Si:v. » 5.5!>
9. dnl
full, .Hi)
Iliver
10. Crow
ClL'L'k
11. C aiu|i
St-v. =• 5,20
Aquatic t Ife
Irritjatlnri
Aitual Ic t. Ife
Aquatic life
Irrigation
llccr cat luti
Aquatic Life
Aquatic Life
Irrigation
Aquati c L Ife
Irrigation
RucroDt Ion
Tl)S, Taniierature,
155
FC, H. P, Ka)lli|»H HWFP
TOS
ttti, 00, Fee
Coil, TSS, H, P
TSS, FC, H, Ronan WHIP
p, no, mi3
FC, TSS
•Inactive Mining
llytlrological
Modification
"V
Ayr 1 culture
tin-site Waste
Disposal
llydrological
Modification
Natural Sources
Irrigated
Agriculture
Natural Sources
Agriculture
Construction
CX)
image:
frnt«i(J<ttUtmuas^^
IIWANA PRIORITY sine AH SECT-HINTS AND WAIIIEU QEUEFICIAL
Problem Parameters
Point Source
Hon-PoJnt
Source 0 tschargers
Beneficial Use-Criteria
Public Mater Supply
Having Levels Mttttin 90X of
Standards
6. iol.m
Illvur -
Uil.M
Prlobt
Unite
Suv. U.'1'j
/, Ash toy
Si;v. * 5.90
H. ttuavur
C.ruuk -
l)ui/l)>'ll>
Si:v. » 5.5!>
9. dnl
full, .Hi)
Iliver
10. Crow
ClL'L'k
11. C aiu|i
St-v. =• 5,20
Aquatic t Ife
Irritjatlnri
Aitual Ic t. Ife
Aquatic life
Irrigation
llccr cat luti
Aquatic Life
Aquatic Life
Irrigation
Aquati c L Ife
Irrigation
RucroDt Ion
Tl)S, Taniierature,
155
FC, H. P, Ka)lli|»H HWFP
TOS
ttti, 00, Fee
Coil, TSS, H, P
TSS, FC, H, Ronan WHIP
p, no, mi3
FC, TSS
•Inactive Mining
llytlrological
Modification
"V
Ayr 1 culture
tin-site Waste
Disposal
llydrological
Modification
Natural Sources
Irrigated
Agriculture
Natural Sources
Agriculture
Construction
CX)
image:
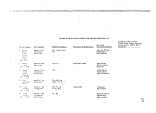 MONTANA PIUOR1TY STREAM SEGMENTS AMQ IMPAIRED BENEFICIAL USE
SV.!"'14'.!! lciJ!!!£!!t Use Imptjred Problem Parameters
12.
SeV
1J.
iUtf
14.
Sev
15.
bov
)(,.
Sov
Hliiloil
Lruck
. - 5.H
Spriiiij
Coiiltii;
. - J.71
SrlcjO
Creek
. - "1.5(1
I'.lSt
Creek
. 1.11
lilMiS-
l>i|j|jur'
Creek
bo 1 CM
Uaiuiafk
. - 2.92
Ai|ttatlc L ife
Irrlyallon
Recfeat.lon
Aquatic Life
Irrigation
Aquatic Life
I IT i yah Ion
Livestock
UaLortn'j
ItecruaLioM
A(|iiutlc Life
In iyation
Recreation
AijujLIc L Ife
Itecreallon
TSS, FC,
H. P
Phenols,
V
TSS, IDS
TSS, FC,
P
Metals.
TUS
N,
TSS
Point Source p Iscliaraes
Petroleum (ol 1
and gas)
exploration
or production
Hon-Polnt Source
Discharges
Irrigated
Ayr!culture
Beneficial Use-Criteria
Public Water Supply Scijments
Having Level* wtthtii 90* of
Standards
Dryland
Agriculture
Irrigated
Ayr!culture
Inactive Mines
Grazing
O
image:
MONTANA PIUOR1TY STREAM SEGMENTS AMQ IMPAIRED BENEFICIAL USE
SV.!"'14'.!! lciJ!!!£!!t Use Imptjred Problem Parameters
12.
SeV
1J.
iUtf
14.
Sev
15.
bov
)(,.
Sov
Hliiloil
Lruck
. - 5.H
Spriiiij
Coiiltii;
. - J.71
SrlcjO
Creek
. - "1.5(1
I'.lSt
Creek
. 1.11
lilMiS-
l>i|j|jur'
Creek
bo 1 CM
Uaiuiafk
. - 2.92
Ai|ttatlc L ife
Irrlyallon
Recfeat.lon
Aquatic Life
Irrigation
Aquatic Life
I IT i yah Ion
Livestock
UaLortn'j
ItecruaLioM
A(|iiutlc Life
In iyation
Recreation
AijujLIc L Ife
Itecreallon
TSS, FC,
H. P
Phenols,
V
TSS, IDS
TSS, FC,
P
Metals.
TUS
N,
TSS
Point Source p Iscliaraes
Petroleum (ol 1
and gas)
exploration
or production
Hon-Polnt Source
Discharges
Irrigated
Ayr!culture
Beneficial Use-Criteria
Public Water Supply Scijments
Having Level* wtthtii 90* of
Standards
Dryland
Agriculture
Irrigated
Ayr!culture
Inactive Mines
Grazing
O
image:
 HMTANA PRIORITY STREAM SECMENfS AMI) UPAIftEO BENEFICIAL USE
w
i!!S
Clark
Fork
Illvisr
from
U drin
Sprlmjs
to
Garrison
Sev. - 2.41
II). Whltefish
ft Ivor '
Uliitofhli
Sev. = 1.57
I'J. .lefferson
River
Suv. - 1.44
20. Clark
fork
Hiver
from
Garrison
to
Homier
So'*. = 1.2U
Use
Aquatic Life
Recreation
Aquatic life
Recreation
Aquatic Life
It ucr eat I on
Aquatic Life
Recreation
Prob\ci» Parameters
Metals, M, P.
BQi. pll
ISS, H, P
-, FC,
1SS
Tottp., DO. H. P
Discharges
Anacorula WHfP
Butte WHIP
Deer Lodge WW1P
Warm Springs WW1P
Wl.ltef lib WHIP
Whitehall MWfP
Three Forks HWfl'
Anaconda WUIP
Outte WHIP
Deer Lod.ja MUIP
Warm Springs WUIP
Non-Point Source
Discharges
Natural Sources
Construction
llyilrological
Modification
Irrigated
Agriculture
Urban Kunoff
On-Slte Domestic
Waste Disposal
AijrlcuUure
Irrigated
A tjri culture
Haturtl Sources
Construction
Hydrological
Hodiflcation
Baneflclal Use-Criteria
Public Mater Supply Segments
Having Levels within 904 of
Standards
image:
HMTANA PRIORITY STREAM SECMENfS AMI) UPAIftEO BENEFICIAL USE
w
i!!S
Clark
Fork
Illvisr
from
U drin
Sprlmjs
to
Garrison
Sev. - 2.41
II). Whltefish
ft Ivor '
Uliitofhli
Sev. = 1.57
I'J. .lefferson
River
Suv. - 1.44
20. Clark
fork
Hiver
from
Garrison
to
Homier
So'*. = 1.2U
Use
Aquatic Life
Recreation
Aquatic life
Recreation
Aquatic Life
It ucr eat I on
Aquatic Life
Recreation
Prob\ci» Parameters
Metals, M, P.
BQi. pll
ISS, H, P
-, FC,
1SS
Tottp., DO. H. P
Discharges
Anacorula WHfP
Butte WHIP
Deer Lodge WW1P
Warm Springs WW1P
Wl.ltef lib WHIP
Whitehall MWfP
Three Forks HWfl'
Anaconda WUIP
Outte WHIP
Deer Lod.ja MUIP
Warm Springs WUIP
Non-Point Source
Discharges
Natural Sources
Construction
llyilrological
Modification
Irrigated
Agriculture
Urban Kunoff
On-Slte Domestic
Waste Disposal
AijrlcuUure
Irrigated
A tjri culture
Haturtl Sources
Construction
Hydrological
Hodiflcation
Baneflclal Use-Criteria
Public Mater Supply Segments
Having Levels within 904 of
Standards
image:
 MONTANA P1UOIWY SfHEAM SEGMENTS AND IM'AIREU BENEFICIAL IJSt
Ij^e Impaired
Problem Parameters Point Source 0 jscliar<ies
Non-Point Source
Discharges
IlibailX
Suv. - 1.06
?.'. in HUM
Creek
V:v. - 1.04
It 1 v<: r
Laurel
In
Cus ler
Sev. - O.'JU
<M. UtMiijlas
Cr.:i:k
Sev. - 0.91
2b. lluj
Spr linj
Creek
Sev. il.U'J
Av)uatlc Life
Irrhjatlon
Itecreut ion
Ai|uatic L ife
Recreation
Aquatic Life
Public Water
Supply
Recreation
Atjiiatlc Life
Recreation
Aquatic Life
Recreation
FC, NH3.
N. P
N, P, Nlj
Phenols, Temp.,
FC. N.
P, MI3, BIX),
1SS
TSS
M, P. Hlj
Wibaux UWTP
Brown Ina WW1P
Laurel WWfP
U 111 Ings UUIP
Yegen Drain
Industrial
Mining
(exploration or
product i on )
l.ewlstown UIJIP
Qn-Site 00nestic
Uasle Disposal
IrrigateU
Agriculture
Urban Runoff
On-Site Domestic
Vlaste Disposal
Construction
Grazing
Beneficial Use-Criteria
Public Water Supply Seoments
Having Levels wltMn 90* of
Standards
image:
MONTANA P1UOIWY SfHEAM SEGMENTS AND IM'AIREU BENEFICIAL IJSt
Ij^e Impaired
Problem Parameters Point Source 0 jscliar<ies
Non-Point Source
Discharges
IlibailX
Suv. - 1.06
?.'. in HUM
Creek
V:v. - 1.04
It 1 v<: r
Laurel
In
Cus ler
Sev. - O.'JU
<M. UtMiijlas
Cr.:i:k
Sev. - 0.91
2b. lluj
Spr linj
Creek
Sev. il.U'J
Av)uatlc Life
Irrhjatlon
Itecreut ion
Ai|uatic L ife
Recreation
Aquatic Life
Public Water
Supply
Recreation
Atjiiatlc Life
Recreation
Aquatic Life
Recreation
FC, NH3.
N. P
N, P, Nlj
Phenols, Temp.,
FC. N.
P, MI3, BIX),
1SS
TSS
M, P. Hlj
Wibaux UWTP
Brown Ina WW1P
Laurel WWfP
U 111 Ings UUIP
Yegen Drain
Industrial
Mining
(exploration or
product i on )
l.ewlstown UIJIP
Qn-Site 00nestic
Uasle Disposal
IrrigateU
Agriculture
Urban Runoff
On-Site Domestic
Vlaste Disposal
Construction
Grazing
Beneficial Use-Criteria
Public Water Supply Seoments
Having Levels wltMn 90* of
Standards
image:
 MINTANA PRIOnifV SI REAM SEGMEHfS AHU IM'AIRtO BENEFICIAL USE
?.(>. little
Peoples
Creek
Sev. * 0.1)6
<!/. llea'Joiliii
R I vtsr
lie low
union
Sev. - 0.66
2U. Boulder
ft I vur
lh> ItM
lljslu
Sev. - O.b/
0.57
Jll. lihmwaler
Crock
Sev. * O.b&
Use Impaired
Aquatic Life
Livestock
Watering
Recreation
Aquatic Life
Lifo
Recreation
Aquatic Life
Recreation
Ar)iiatic Life
lrrl<>itlon
Kecreatlaii
Problem Parjuneters
TSS. MeUls. (ill
.. fC
Ton})., Fee Coll.
HeUls. TSS. IDS.
N, P
Tenn>.. As, F.
ISS, M. P
Poliit Source 0 Is charges
Mining (exploratlmt
or production)
Oillon MMIP
Bouldtar UUIP
Ennls WUTP
Non-Point Source
0 (sciiarqes
Grazing
Irrigated
AgrlcuUura
inactive Mines
llydroloijlcal
Ho4ific*tlon
Irrigated
AgricuUtre
liydrologlcal
Modification
Natural
Sources (VHP)
Irrigated
Agriculture
lly.lrologfcal
Modification
Natural
Sources
Beneficial Use-CrlterU
Public Mater Supply Sefjnents
Having Levels within 9QX of
image:
MINTANA PRIOnifV SI REAM SEGMEHfS AHU IM'AIRtO BENEFICIAL USE
?.(>. little
Peoples
Creek
Sev. * 0.1)6
<!/. llea'Joiliii
R I vtsr
lie low
union
Sev. - 0.66
2U. Boulder
ft I vur
lh> ItM
lljslu
Sev. - O.b/
0.57
Jll. lihmwaler
Crock
Sev. * O.b&
Use Impaired
Aquatic Life
Livestock
Watering
Recreation
Aquatic Life
Lifo
Recreation
Aquatic Life
Recreation
Ar)iiatic Life
lrrl<>itlon
Kecreatlaii
Problem Parjuneters
TSS. MeUls. (ill
.. fC
Ton})., Fee Coll.
HeUls. TSS. IDS.
N, P
Tenn>.. As, F.
ISS, M. P
Poliit Source 0 Is charges
Mining (exploratlmt
or production)
Oillon MMIP
Bouldtar UUIP
Ennls WUTP
Non-Point Source
0 (sciiarqes
Grazing
Irrigated
AgrlcuUura
inactive Mines
llydroloijlcal
Ho4ific*tlon
Irrigated
AgricuUtre
liydrologlcal
Modification
Natural
Sources (VHP)
Irrigated
Agriculture
lly.lrologfcal
Modification
Natural
Sources
Beneficial Use-CrlterU
Public Mater Supply Sefjnents
Having Levels within 9QX of
image:
 i
I-OHTANA PIUQKITV STREAK SEGMENTS AND II-PAIRED BENEFICIAL USE
jitiijinuitt IJje Impaired
tklt
Creek
Dry
Tork
. - 0.43
Aquatic Life
Recreation
Problem Parameters
McUls. pll, TSS
Pot ill Source 0 Ischaraes
Non-Point Source
Discharges
Ayr i culture
Forest Practices
Inactive Mines
BeneftcUl Use-CriterU
Public Water Supply
Having Levels wUttln 90i uf
31'.
ft i vcr
LiiiUy
O.iiii
. - 0.30
A(|uatic Life
Livestock
Water inn
Hecreatlon
uas, FC
L Ibby WWII'
Modification
image:
i
I-OHTANA PIUQKITV STREAK SEGMENTS AND II-PAIRED BENEFICIAL USE
jitiijinuitt IJje Impaired
tklt
Creek
Dry
Tork
. - 0.43
Aquatic Life
Recreation
Problem Parameters
McUls. pll, TSS
Pot ill Source 0 Ischaraes
Non-Point Source
Discharges
Ayr i culture
Forest Practices
Inactive Mines
BeneftcUl Use-CriterU
Public Water Supply
Having Levels wUttln 90i uf
31'.
ft i vcr
LiiiUy
O.iiii
. - 0.30
A(|uatic Life
Livestock
Water inn
Hecreatlon
uas, FC
L Ibby WWII'
Modification
image:
 MoiiKSWTOiraw^^
floiui1 DAKOTA PRIORITY STREAM SEGMENTS AM» IMPAIRED BENEFICIAL USE
1. Sour is
- Illver
- from con-
fluence wllh
lies Lacs Rivur
to confluence
with Oncp River
(Sov. • 0.12)
2. Sour Is
Ulvcr - from
confluence
wllli I) cop
Hlver to
Canadian
Border
3. Red Ulvcr -
from con-
fluence
wl Hi Sheycnrie
to cnnflut'iice
with Tirlle
ftlv/er
Use: Impaired
Mann Mater
Fishery
Recreation
l/ann Water
Fishery
Recreation
Mann Water
Fishery
Recreation
Irrigation
Public Water
Supply
StockvtaXcrlmj
Probl cm Parameters.
00, IP, LCM Flow
Point Source IHscliarijgrs
Velva UUFP
T owner HMFP
Mlnot HUH'
UO, IP, Low Flow
IP, FC, lllj»
Hll/), Otss Sol..
M'j, Mn. 1SIH,
SSEO, Fe, Cn,
l«3. Cl, S04.
Ha, Turb.
Non-Point
Sjoitfce U Iscliargers
Hattral Sources
Hon-Irrl gated
Agriculture
tfllcllife Refuges
Hoti-lrrl gated
Agriculture
Waterfowl
Concentrations
Kon-lrrlgated
Agriculture
Beneficial Use-Criteria
Public Mater Supply
Having Levels within 90X of
Standards
Irrigation-corn!.,
FC
Fe
cn
image:
MoiiKSWTOiraw^^
floiui1 DAKOTA PRIORITY STREAM SEGMENTS AM» IMPAIRED BENEFICIAL USE
1. Sour is
- Illver
- from con-
fluence wllh
lies Lacs Rivur
to confluence
with Oncp River
(Sov. • 0.12)
2. Sour Is
Ulvcr - from
confluence
wllli I) cop
Hlver to
Canadian
Border
3. Red Ulvcr -
from con-
fluence
wl Hi Sheycnrie
to cnnflut'iice
with Tirlle
ftlv/er
Use: Impaired
Mann Mater
Fishery
Recreation
l/ann Water
Fishery
Recreation
Mann Water
Fishery
Recreation
Irrigation
Public Water
Supply
StockvtaXcrlmj
Probl cm Parameters.
00, IP, LCM Flow
Point Source IHscliarijgrs
Velva UUFP
T owner HMFP
Mlnot HUH'
UO, IP, Low Flow
IP, FC, lllj»
Hll/), Otss Sol..
M'j, Mn. 1SIH,
SSEO, Fe, Cn,
l«3. Cl, S04.
Ha, Turb.
Non-Point
Sjoitfce U Iscliargers
Hattral Sources
Hon-Irrl gated
Agriculture
tfllcllife Refuges
Hoti-lrrl gated
Agriculture
Waterfowl
Concentrations
Kon-lrrlgated
Agriculture
Beneficial Use-Criteria
Public Mater Supply
Having Levels within 90X of
Standards
Irrigation-corn!.,
FC
Fe
cn
image:
 JttKiHi^^
M01UII DAKOTA Pftinum StREAH SEGMEMfS AHll !H»AIRCD OtJCFlCIAt USE
Strfiaffl Scgneitt Use Impaired
1. Red fllver -
fron confluence
with Wild Rice
ftlver to
csinf liiftitcc
wl tli Slmycnno
Hlvcr
5. llnart River
- from
In
fi refill
Rlvor
Mann Water
F Islicry
Rccrcaton
Public Mater
Supply
Irrigation
Warm Mater
f Islicry
Pulilie Mater
Supply
Recreation
Irrigation
Slock Watering
P rp bl em P aramete rs
TJ'. FC, 1)0,
M»i»l»l4-»
U-Nlli. Ulss Sol.,
Tl\ SSEO, F6, Cu,
Pb, In, Cd, ResldiKi,
[)!ss Sot., Cr, Miu
Ht. tla, Sn,i, Dhs Ha,
Oii, (la Absorption Ratio
Point Source
HuorliiMci MM 1 1'
Ulcklnsan WlP
flcUlcld WUTP
lion-Point
Hon-lrrlgated
Agriculture
Hhmcsota Sources
Nott-Irrigated
Ayrlcu\turo
Maturtt Soirees
Low Flows
Bnneflclal Use-Criteria
Public U.itcr Supply
Having tcveU within 9I1K of
S tjyiil an| s
Irrigation - Hj
PHS-SO*
Stock Watering - Pit
MD
image:
JttKiHi^^
M01UII DAKOTA Pftinum StREAH SEGMEMfS AHll !H»AIRCD OtJCFlCIAt USE
Strfiaffl Scgneitt Use Impaired
1. Red fllver -
fron confluence
with Wild Rice
ftlver to
csinf liiftitcc
wl tli Slmycnno
Hlvcr
5. llnart River
- from
In
fi refill
Rlvor
Mann Water
F Islicry
Rccrcaton
Public Mater
Supply
Irrigation
Warm Mater
f Islicry
Pulilie Mater
Supply
Recreation
Irrigation
Slock Watering
P rp bl em P aramete rs
TJ'. FC, 1)0,
M»i»l»l4-»
U-Nlli. Ulss Sol.,
Tl\ SSEO, F6, Cu,
Pb, In, Cd, ResldiKi,
[)!ss Sot., Cr, Miu
Ht. tla, Sn,i, Dhs Ha,
Oii, (la Absorption Ratio
Point Source
HuorliiMci MM 1 1'
Ulcklnsan WlP
flcUlcld WUTP
lion-Point
Hon-lrrlgated
Agriculture
Hhmcsota Sources
Nott-Irrigated
Ayrlcu\turo
Maturtt Soirees
Low Flows
Bnneflclal Use-Criteria
Public U.itcr Supply
Having tcveU within 9I1K of
S tjyiil an| s
Irrigation - Hj
PHS-SO*
Stock Watering - Pit
MD
image:
 */;
sourtt
PIUOIUTY STREAK SEGMENTS AUQ UPAIRED OENEFICIAL USE
Non-Point
4
£
3
4
SlriMiu Sogiiierit
lldil Illver
llcdilw£t ers to
Missouri
It 1 ver
Sov. •-= 4-1.56
1 (Mfcr Clu.'yUUllG
111 ver
llul le Fiiurcliu
fllvur to
Orthe D.VII
Sc;v. /I. CO
Hl.i.Ue Chuyenue
It 1 vuc
AiKj.istura
llosurvolr l»
U«l Ic Four elm
11 1 vor
S,;/. » 3.61
ll|i|ier f.heyenna
H 1 viir-Uyihuliig
lli»rili:r to
Use Impaired
Mil Fishery
SlttY
I) tier eat ion
Irrigation
WM F Isltcry
Prl S. SOOY
Recreation
Irrigation
l)U Flslmry
Prl & S(«Y
Itecrcallon
Irrigation
Livestock
Watering
WU F Ishery
StillY Recreation
Irri y-itloi)
Problem Parameters
IP, COHf), FC, SSEl),
Tenp • »
N03, Cr, llg, Cu,
00, TP, COfli. FC,
SSEU, TOS
SS, Ta»p., FC, COHU.
IP, FC. [)0. TOS,
COiU, isED
Point Source Dischargers
llanestake-HlUP
St. Regis Paper
Ufiitewoad Post |>
Pole
Strawberry Hill
Mining Co.
Edgmnont-WWTP
Mewcastla, WYO., WWYP
Source Dischargers
Grazing
Low Flan
\
Agriculture
Feedlots
Grazing
Low Flow
Natural Erosion
Agriculture
Livestock
Natural Erosion
Irrigation
Low flow
Grazing
Low Flow
Uyoinlng Sources
Sev. •>, 2.0!)
Mining
Naturally occurring
conditions
Ueneficlal Use-Criteria
Public Mater Supply Setjnunts
Having Levels within 901 of
Standards
image:
*/;
sourtt
PIUOIUTY STREAK SEGMENTS AUQ UPAIRED OENEFICIAL USE
Non-Point
4
£
3
4
SlriMiu Sogiiierit
lldil Illver
llcdilw£t ers to
Missouri
It 1 ver
Sov. •-= 4-1.56
1 (Mfcr Clu.'yUUllG
111 ver
llul le Fiiurcliu
fllvur to
Orthe D.VII
Sc;v. /I. CO
Hl.i.Ue Chuyenue
It 1 vuc
AiKj.istura
llosurvolr l»
U«l Ic Four elm
11 1 vor
S,;/. » 3.61
ll|i|ier f.heyenna
H 1 viir-Uyihuliig
lli»rili:r to
Use Impaired
Mil Fishery
SlttY
I) tier eat ion
Irrigation
WM F Isltcry
Prl S. SOOY
Recreation
Irrigation
l)U Flslmry
Prl & S(«Y
Itecrcallon
Irrigation
Livestock
Watering
WU F Ishery
StillY Recreation
Irri y-itloi)
Problem Parameters
IP, COHf), FC, SSEl),
Tenp • »
N03, Cr, llg, Cu,
00, TP, COfli. FC,
SSEU, TOS
SS, Ta»p., FC, COHU.
IP, FC. [)0. TOS,
COiU, isED
Point Source Dischargers
llanestake-HlUP
St. Regis Paper
Ufiitewoad Post |>
Pole
Strawberry Hill
Mining Co.
Edgmnont-WWTP
Mewcastla, WYO., WWYP
Source Dischargers
Grazing
Low Flan
\
Agriculture
Feedlots
Grazing
Low Flow
Natural Erosion
Agriculture
Livestock
Natural Erosion
Irrigation
Low flow
Grazing
Low Flow
Uyoinlng Sources
Sev. •>, 2.0!)
Mining
Naturally occurring
conditions
Ueneficlal Use-Criteria
Public Mater Supply Setjnunts
Having Levels within 901 of
Standards
image:
 wmwiriminn^
i«»wra«isa!a»rwffl^
SttlTII t»AK(UA riUOniTV SWAM SE&CHTS AHO IM'AIREU UEJEFICIAL USE
.57 ltd lu Faurchi!
Illvcr from
llhll i.-unml
Creek lu
tmif IIKMU u
Illvfir
SUM. » O.flfi
6 Hello Fourclie
ft I ver fron
IWO. Oortlur
In Mil I!t-Jwoi)il
Creuk
Scv. * 1,50
7ll.irsu Criiek
f rum lli.'ail-
w.il ers lo
t nil I an Cr <;i;k
Sow. « 1.33
lllllll'VWOll
Cl t!l!k
I edit to »i:!le
Foiirclic ttlwr
Serf. • 113.75
WU Fishery
Prl & SMtY
llecreatlon
Llvustutk
vni
Prl Recreation
Lives luck
UU S. CM Ft slier y
Prl t SUIY
llucreflllon
Public Ualcr
Irrigation
I Ivftslock
Prolilcij Paraineteri
SSED. FC, TUS
CM
SS, FC, HI3
TUS
llg, CH. fC, U-HII3,
SSeiJ, As. Cu. Cr.
Residua
Polgt Soiirco li|scliar«iers
Honestako Mining Co.
UMlewooil WUIP
St. fteijli Paper
Uhltewood Post fc pole
llmnostftke Mining Co.
Kirk Pownr Plant
Strawlwrry Hill
Mining Cu.
lion-Point
Agrlciiltire
livestock
Ltt< Flow
IrrltjileJ
Agriculture
UnldentUlcd MYO.
Sources
irrigated
Ayrlculture
Acid Klnc
Oil-Site Direct
0 1 sell or ge
Mine tailing
Duil Degradation
Livestock
Storm runoff
Beneficial Use-Criteria
Public Mater Supply Scgnuntj
Having Levels within 90* of
Standards
CD
image:
wmwiriminn^
i«»wra«isa!a»rwffl^
SttlTII t»AK(UA riUOniTV SWAM SE&CHTS AHO IM'AIREU UEJEFICIAL USE
.57 ltd lu Faurchi!
Illvcr from
llhll i.-unml
Creek lu
tmif IIKMU u
Illvfir
SUM. » O.flfi
6 Hello Fourclie
ft I ver fron
IWO. Oortlur
In Mil I!t-Jwoi)il
Creuk
Scv. * 1,50
7ll.irsu Criiek
f rum lli.'ail-
w.il ers lo
t nil I an Cr <;i;k
Sow. « 1.33
lllllll'VWOll
Cl t!l!k
I edit to »i:!le
Foiirclic ttlwr
Serf. • 113.75
WU Fishery
Prl & SMtY
llecreatlon
Llvustutk
vni
Prl Recreation
Lives luck
UU S. CM Ft slier y
Prl t SUIY
llucreflllon
Public Ualcr
Irrigation
I Ivftslock
Prolilcij Paraineteri
SSED. FC, TUS
CM
SS, FC, HI3
TUS
llg, CH. fC, U-HII3,
SSeiJ, As. Cu. Cr.
Residua
Polgt Soiirco li|scliar«iers
Honestako Mining Co.
UMlewooil WUIP
St. fteijli Paper
Uhltewood Post fc pole
llmnostftke Mining Co.
Kirk Pownr Plant
Strawlwrry Hill
Mining Cu.
lion-Point
Agrlciiltire
livestock
Ltt< Flow
IrrltjileJ
Agriculture
UnldentUlcd MYO.
Sources
irrigated
Ayrlculture
Acid Klnc
Oil-Site Direct
0 1 sell or ge
Mine tailing
Duil Degradation
Livestock
Storm runoff
Beneficial Use-Criteria
Public Mater Supply Scgnuntj
Having Levels within 90* of
Standards
CD
image:
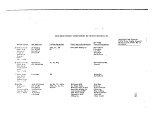 ^
SOUTH DAKOTA PRIORITY STREAM SEGMEHTS AHU W'AIREO BENEFICIAL USE
ILl'.'li1!! l£'J!!l!yit Use Impaired
0 Gr.iii.1 Itlvvr
SluiloliUI
Reservoir to
West Corson
Count/ L Ine
Scv. - 1.17
/OSinilh Fork
(jraii'l 111vur
Sev. - 3.2G
a Venn 111 Ion
III ver
tu Missouri
lUvt-r
Sev. - J.U5
J.uneu
River
Hit l
U» HayfleM
Sav. » 0.23
CW FIshery
SHU Recreation
UU FIshcry
SU(Y Recreation
WU Fishery
Ri! creation
Sec. Contact
UU FIshery
Sec. Contact
Recreation
Problem Parameters
SSEO, Tonp.
TP, COW), FC. SSEO
IP, FC. SSEU, U-HII3
00, IV, SSEO
Pol at Source 0 jscliargers
Ccntervllle-WlUP
Verrallllon-WllTP
ClianceHor-VIWTP
lloward-UUlP
Scotl aml-W«lP
Menno-UUlP
Wolf Creek-WUFP
HaxweU Colouy-UUfP
Non-faint
Source 0 tschartiers
Livestock
Agriculture
Natural Erosion
\
Possible Agriculture
Grazimj
Low F low
Grazing
Fcedlots
Agriculture
Low Flow
Feedlots
Runoff
At>pl teal I on of Uhuy
Beneficial Use-CrllerU
Public Mater Supply Segments
Having Levels within QOX of
Stamlanls
image:
^
SOUTH DAKOTA PRIORITY STREAM SEGMEHTS AHU W'AIREO BENEFICIAL USE
ILl'.'li1!! l£'J!!l!yit Use Impaired
0 Gr.iii.1 Itlvvr
SluiloliUI
Reservoir to
West Corson
Count/ L Ine
Scv. - 1.17
/OSinilh Fork
(jraii'l 111vur
Sev. - 3.2G
a Venn 111 Ion
III ver
tu Missouri
lUvt-r
Sev. - J.U5
J.uneu
River
Hit l
U» HayfleM
Sav. » 0.23
CW FIshery
SHU Recreation
UU FIshcry
SU(Y Recreation
WU Fishery
Ri! creation
Sec. Contact
UU FIshery
Sec. Contact
Recreation
Problem Parameters
SSEO, Tonp.
TP, COW), FC. SSEO
IP, FC. SSEU, U-HII3
00, IV, SSEO
Pol at Source 0 jscliargers
Ccntervllle-WlUP
Verrallllon-WllTP
ClianceHor-VIWTP
lloward-UUlP
Scotl aml-W«lP
Menno-UUlP
Wolf Creek-WUFP
HaxweU Colouy-UUfP
Non-faint
Source 0 tschartiers
Livestock
Agriculture
Natural Erosion
\
Possible Agriculture
Grazimj
Low F low
Grazing
Fcedlots
Agriculture
Low Flow
Feedlots
Runoff
At>pl teal I on of Uhuy
Beneficial Use-CrllerU
Public Mater Supply Segments
Having Levels within QOX of
Stamlanls
image:
 SOUTH DAKorA pftionirv s rue AM SEGMENTS AND WAIRED ecrEFiciAL USE
U|i|M!f J.vui'.s
ttlver H.t).
Dm ilcr tu
Iliinm
Sev. « U.61
lirl.le Creek
Sew. • 7..10
y,i Patia
tl I!. Border
to Missouri
Hlvur
Suv. • 20.0
n 1 vcr
Hi.MiKv liters
to HliHi:
SOY. •= 2.59
USB
UW Fishery
Public Mater
Supply
Prl Contact
Recreation
MM Fishery
Six. Contact
Recreation
Problem Parametcrs_
00, IP. TUS, C<l.
SSEO, Residue,
1W Fishery
Sue. Contact
Hoereit Ion
Public Mater
Supply
\M f Isliery
Public Water
Supply
Prl i simy
Rucreatinn
Iirlijitlun
Livestock Water IIKJ
VM Fishery
Sec. Contact
Recreation
Irrlijdtiun
Livestock
1)0. FC, HI3
cuo
1)0. FC, IP, SSEt)
DO. IP. FC, SSEI).
IIOj, Cr, Ag,
lit), Cn, Pb, In,
Ctt, 11«I due. Ha,
Ar, Oa
FC. TP, SSCO
point Sourcfl Dischargers
RefleM-WWIP
Stratford-MWIP
Aberi!eun-HVJtl>
Ilinon-UUIP
Ashtou-VMl!'
llastport-Hilll'
toh.nhU-WUlP
Reafleld-HMIF
flnfr
•nM
Hartln-VAUP
flosobud-HMfP
Wh I to RIvor-HHTP
Non-Point
Source
ft <jr ten Hire
FeedloU
Crazing
Sand Lake Refuge
GrounJwaler (n t)
Fccdlots
Agriculture
Preservation stream
Livestock
Ayr I cti I tiro
Grating
BaJl awls (Natural Sources)
Grazlno
Agriculture
Natural Erosion
Beneficial Use-Crllcrta
Public Water 5ii[>ply Scijnunls
Having levels within 90£ of
Standards
image:
SOUTH DAKorA pftionirv s rue AM SEGMENTS AND WAIRED ecrEFiciAL USE
U|i|M!f J.vui'.s
ttlver H.t).
Dm ilcr tu
Iliinm
Sev. « U.61
lirl.le Creek
Sew. • 7..10
y,i Patia
tl I!. Border
to Missouri
Hlvur
Suv. • 20.0
n 1 vcr
Hi.MiKv liters
to HliHi:
SOY. •= 2.59
USB
UW Fishery
Public Mater
Supply
Prl Contact
Recreation
MM Fishery
Six. Contact
Recreation
Problem Parametcrs_
00, IP. TUS, C<l.
SSEO, Residue,
1W Fishery
Sue. Contact
Hoereit Ion
Public Mater
Supply
\M f Isliery
Public Water
Supply
Prl i simy
Rucreatinn
Iirlijitlun
Livestock Water IIKJ
VM Fishery
Sec. Contact
Recreation
Irrlijdtiun
Livestock
1)0. FC, HI3
cuo
1)0. FC, IP, SSEt)
DO. IP. FC, SSEI).
IIOj, Cr, Ag,
lit), Cn, Pb, In,
Ctt, 11«I due. Ha,
Ar, Oa
FC. TP, SSCO
point Sourcfl Dischargers
RefleM-WWIP
Stratford-MWIP
Aberi!eun-HVJtl>
Ilinon-UUIP
Ashtou-VMl!'
llastport-Hilll'
toh.nhU-WUlP
Reafleld-HMIF
flnfr
•nM
Hartln-VAUP
flosobud-HMfP
Wh I to RIvor-HHTP
Non-Point
Source
ft <jr ten Hire
FeedloU
Crazing
Sand Lake Refuge
GrounJwaler (n t)
Fccdlots
Agriculture
Preservation stream
Livestock
Ayr I cti I tiro
Grating
BaJl awls (Natural Sources)
Grazlno
Agriculture
Natural Erosion
Beneficial Use-Crllcrta
Public Water 5ii[>ply Scijnunls
Having levels within 90£ of
Standards
image:
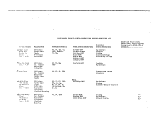 SOUTH DAKorA pnioftiTY STREAM SEGMENTS ANO IMPAIRED BENEFICIAL USE
•LlrM1!! Seijmjnl Use Impaired
Problem Parameters
PoUvt Sourcti
Hon-Potnt
0 jscharaors
$, Missouri R Iver
111.) Head Dam
to P Icrre
Sev. » 0.60
/J Missouri River
Pierre to III)
Sev. = 3.02
IK: I mi Oalic
Dam
2ft \ iMtir »l<j Sioux
It Iver - Sioux
Falls to
Missouri
Rlvur
Suv. » 7. ft)
2.1 llppor lil.j
S Unix it Ivur
UaU'rlnwii to
S iuiix fat 1$
Sov. * 1.71
2t£ltd|>|i| Crinik
tl iii K t^anyon
lo Clicyenim
Illvcr
Sov. » 30, 9H
Prl Contact
Recreation
CM Atiuatlc
Prl Contact
Uecreatlon
Uarm Ualcr
Prl & Sue.
Contact
Recreation
.
ll.iiiii Vhiler
F Islicry
Pulillc Ualor
Supply
CM I UU
Fishery
Prl fc SDftY
nocredtlon
lirhjallun
11 vustuck
PA
SS, Tunu.
m)3. IP. FC.
DO, CM, U-Kllj,
SSEO, COIIO
I«l3, SSEO. Temp.,
FC, DO. IDS, ll-Nllj
t«)3, U-HII3, TP,
FC, SSEO, Toiip.
Pierre WWTP
Ft. Pierre HWTP
Sioux Falls WUIP
John Morrel) H,HP
Brandon WV/fP
Akestur UVJTP
Eros Canton
Livestock Sales
Sioux Falls
Stocky*riis
UeH (taplds-UUIP
Watertown-WMTP
Castlewood-UUIP
Estclllnu-WWfl1
Rapid City-MWTP
\
Unknown Sources
•^
Bed Degradation
Backwater areas
Unknown sources
Agriculture
Grazing
Urban runoff
Construction
Feedlots
Grazing
Urban runoff
Agriculture
Lack of Flow
Irrigation
Fecdlots
Grazing
On-Slte
Disposal
Urban runoff
(lenuflclal Use-Criteria
Public Water Supply Segments
Having loveU witliin 90X of
Standarijs
UU Fishery - SSEO
image:
SOUTH DAKorA pnioftiTY STREAM SEGMENTS ANO IMPAIRED BENEFICIAL USE
•LlrM1!! Seijmjnl Use Impaired
Problem Parameters
PoUvt Sourcti
Hon-Potnt
0 jscharaors
$, Missouri R Iver
111.) Head Dam
to P Icrre
Sev. » 0.60
/J Missouri River
Pierre to III)
Sev. = 3.02
IK: I mi Oalic
Dam
2ft \ iMtir »l<j Sioux
It Iver - Sioux
Falls to
Missouri
Rlvur
Suv. » 7. ft)
2.1 llppor lil.j
S Unix it Ivur
UaU'rlnwii to
S iuiix fat 1$
Sov. * 1.71
2t£ltd|>|i| Crinik
tl iii K t^anyon
lo Clicyenim
Illvcr
Sov. » 30, 9H
Prl Contact
Recreation
CM Atiuatlc
Prl Contact
Uecreatlon
Uarm Ualcr
Prl & Sue.
Contact
Recreation
.
ll.iiiii Vhiler
F Islicry
Pulillc Ualor
Supply
CM I UU
Fishery
Prl fc SDftY
nocredtlon
lirhjallun
11 vustuck
PA
SS, Tunu.
m)3. IP. FC.
DO, CM, U-Kllj,
SSEO, COIIO
I«l3, SSEO. Temp.,
FC, DO. IDS, ll-Nllj
t«)3, U-HII3, TP,
FC, SSEO, Toiip.
Pierre WWTP
Ft. Pierre HWTP
Sioux Falls WUIP
John Morrel) H,HP
Brandon WV/fP
Akestur UVJTP
Eros Canton
Livestock Sales
Sioux Falls
Stocky*riis
UeH (taplds-UUIP
Watertown-WMTP
Castlewood-UUIP
Estclllnu-WWfl1
Rapid City-MWTP
\
Unknown Sources
•^
Bed Degradation
Backwater areas
Unknown sources
Agriculture
Grazing
Urban runoff
Construction
Feedlots
Grazing
Urban runoff
Agriculture
Lack of Flow
Irrigation
Fecdlots
Grazing
On-Slte
Disposal
Urban runoff
(lenuflclal Use-Criteria
Public Water Supply Segments
Having loveU witliin 90X of
Standarijs
UU Fishery - SSEO
image:
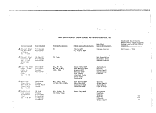 SOUril DAKOTA PRIORITY STREftH SEGMENTS ANU IMPAIREO BENEf ICiAL USE
fall ttlvcr
lllM.lw.iUM S
ID Cl
Hlver
Hlver
Me si Uewcy
("uintly L Inti
ID Uhsmii 1
n Ivur
Scv. • 11.15
2$ Iliirijdii Hlver
lle,)iln,il ers la
Uos t llouay
rnunly {. Ini!
Suv. * fi. 62
2£> tifitml lUver
Me'jl Corson
Cwmly t. lua
In Missouri
lUvur
Su-i/. - 2.H
Use
CM t WU
Fishery
S1)«Y Rccrcftltuu
HM ftshery
SlflY Recreation
{rrhjat lull
Livestock
Ull Fishery
SI«Y necreatlon
Irrlijitloii
Wl Fishery
Ii i lyalloii
Problem Paranetera
Fe, MQ3, TP, TUS,
r ij
00, Aumonta, SSEU,
5AH, DISS, SOLIDS
SSEO, Tanp,, COHO
5SEI), SA«
Non-Point
Point Source UIschargeri Source Bitchgrners
Mot
Warm Mater Springs
Low Flow
Llvcslock
Natural Erosion
Irrigated AyrlcuUuro
Livestock
Natural Erosion
lou Flow
Livestock
Hatural Erosion
Oenoflclal Usc-CrlterU
Public Hater Supply Segments
Having Levels wltlitn 90< of
Standards
O
ro
image:
SOUril DAKOTA PRIORITY STREftH SEGMENTS ANU IMPAIREO BENEf ICiAL USE
fall ttlvcr
lllM.lw.iUM S
ID Cl
Hlver
Hlver
Me si Uewcy
("uintly L Inti
ID Uhsmii 1
n Ivur
Scv. • 11.15
2$ Iliirijdii Hlver
lle,)iln,il ers la
Uos t llouay
rnunly {. Ini!
Suv. * fi. 62
2£> tifitml lUver
Me'jl Corson
Cwmly t. lua
In Missouri
lUvur
Su-i/. - 2.H
Use
CM t WU
Fishery
S1)«Y Rccrcftltuu
HM ftshery
SlflY Recreation
{rrhjat lull
Livestock
Ull Fishery
SI«Y necreatlon
Irrlijitloii
Wl Fishery
Ii i lyalloii
Problem Paranetera
Fe, MQ3, TP, TUS,
r ij
00, Aumonta, SSEU,
5AH, DISS, SOLIDS
SSEO, Tanp,, COHO
5SEI), SA«
Non-Point
Point Source UIschargeri Source Bitchgrners
Mot
Warm Mater Springs
Low Flow
Llvcslock
Natural Erosion
Irrigated AyrlcuUuro
Livestock
Natural Erosion
lou Flow
Livestock
Hatural Erosion
Oenoflclal Usc-CrlterU
Public Hater Supply Segments
Having Levels wltlitn 90< of
Standards
O
ro
image:
 souru oAKorA PRIORITY STREAM SEGMENTS AND WAIIIEU BENEFICIAL USE
2? I title
MilllieSllla
Illvur
Sev. * 2.21
il 1 vcr
se«. = 1.1. o;
•ZSj Sinilli fork
Yellow H,mk
Illvur
Sev. « (l.ii'j
30 tlorlli Fork
Yullmv Uank
Hlvur
Sw. - U.W)
3/ t,ic Ijul I'arle
(lijry Hreuk)
Suv . = 0. 65
32-Missourl River
- from SI mix
Cll y tu Y.uiklnn
Sev. " 'J. Of.
Use
Warm Water
Flsliery
Recreation
Si:c. Contact
Warm Waler
SlUlY ftecreatlon
f.W Ftshery
ttucrodltun
Sec. Contact
Water
flsliery
SORV Recreation
CW Flsliery
SI«Y Recreation
Warm Water Flsliery
Public Water
Prl Recreation
Sec. Contact
Problem Parameters
00, SS. FC, MI3
U-Nllj, TKH, FC, UO
CIKK)
UO, SS, Temp.
00, Town.
SS, FC
SS, FC
Po|nt Source I)iscliargers
Slssuton UWTP
Mllbank UUTP
Unknown Source
In Sioux City
Sioux Industry
Fcedlots
Non-Point
Source Dischargers
Low Flow
Livestock
\
Low Flow
Livestock
Agrlculutre
Livestock
AgrlcuUure
Livestock
Low Flow under Ice
Livestock
Dcd Degradation
I),ink Erosion
Agriculture
Deneflclat Use-Criteria
Public Hater Supply Segments
Having Levels within 9CU of
Standards
O
image:
souru oAKorA PRIORITY STREAM SEGMENTS AND WAIIIEU BENEFICIAL USE
2? I title
MilllieSllla
Illvur
Sev. * 2.21
il 1 vcr
se«. = 1.1. o;
•ZSj Sinilli fork
Yellow H,mk
Illvur
Sev. « (l.ii'j
30 tlorlli Fork
Yullmv Uank
Hlvur
Sw. - U.W)
3/ t,ic Ijul I'arle
(lijry Hreuk)
Suv . = 0. 65
32-Missourl River
- from SI mix
Cll y tu Y.uiklnn
Sev. " 'J. Of.
Use
Warm Water
Flsliery
Recreation
Si:c. Contact
Warm Waler
SlUlY ftecreatlon
f.W Ftshery
ttucrodltun
Sec. Contact
Water
flsliery
SORV Recreation
CW Flsliery
SI«Y Recreation
Warm Water Flsliery
Public Water
Prl Recreation
Sec. Contact
Problem Parameters
00, SS. FC, MI3
U-Nllj, TKH, FC, UO
CIKK)
UO, SS, Temp.
00, Town.
SS, FC
SS, FC
Po|nt Source I)iscliargers
Slssuton UWTP
Mllbank UUTP
Unknown Source
In Sioux City
Sioux Industry
Fcedlots
Non-Point
Source Dischargers
Low Flow
Livestock
\
Low Flow
Livestock
Agrlculutre
Livestock
AgrlcuUure
Livestock
Low Flow under Ice
Livestock
Dcd Degradation
I),ink Erosion
Agriculture
Deneflclat Use-Criteria
Public Hater Supply Segments
Having Levels within 9CU of
Standards
O
image:
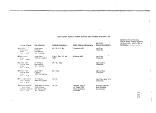 : UfAII PRIORITY STREAM SEGMENTS AMD UPAIRED BENEFICIAL USE
1) Weber River
trlbtilar ins
(mm Stoddard
Diversion to
headu iiters
Scrv.= .12.65
2) Provo ft Ivor
and tributa-
ries fntm
Hurilock Diver-
sion t(> llfirtil-
w.iters
Sev.=6.02
Use Jmpalred
C.W. Fishery
irrigation
livestock wat«rlng
!' r'o bl em P arag_et ers
TH. tin, Cu, SSEO,
IX), B, CM, Hlh-N,
Turb, TS!N, TC
C.W. Flsliery
f'uljlic Water Supply
sec. contact re-
creation
livestock watering
Irrigation
Mn, TC. HI, FC, TSUI,
Turb
Point Source Dischargers
(Park City) Recreation
Development, Ideal
Cement, Komas Ft&U
Hatchery, Oakley
Lagoons, Komas, Lagoons,
Sandcrvllle WUTP
CoalvIlle WU(P
Morgan Lagoons
lienefer Lagoons
Central Heber WWIP
llcbcr Valley WWIP
Midway
feedlots
tlon-PoInt Source
Ulschargcr'S ^
Beneficial Use - Criteria
Public Waters Supply Setjnunts
Having levels within 'JOX of
Standards
upstream conditions
hydroioglc modification,
livestock grazing, urban
runoff, irrigated
agriculture, raining,
energy exploration
agriculture Irrigated
cropl and
nonlrrigated cropland
fish hatcheries
PWS - Mn
C.H. Fishery - IP
sec. contact recreation - H'
3) Jordan River
North Touple St
Lo confluence
w/ Little Cotton-
wood Cr .
Sev.= 2. 9fi
sec. contact re-
creation
W.W. Fishery
irrigation
IN, DO, FC, S04, llg
Hurray HWTP
Cottonwood VIVHP
Granger-Hunter WWfP
SLC suburban 1IUFP II
So. SLC WWfP
Central Valley WHIP
feedlots
urban runoff
natural source
upstream conditions
(Utah Lake)
Irrigated agriculture
construction
Industrial
ttydrologlc modification
O
image:
: UfAII PRIORITY STREAM SEGMENTS AMD UPAIRED BENEFICIAL USE
1) Weber River
trlbtilar ins
(mm Stoddard
Diversion to
headu iiters
Scrv.= .12.65
2) Provo ft Ivor
and tributa-
ries fntm
Hurilock Diver-
sion t(> llfirtil-
w.iters
Sev.=6.02
Use Jmpalred
C.W. Fishery
irrigation
livestock wat«rlng
!' r'o bl em P arag_et ers
TH. tin, Cu, SSEO,
IX), B, CM, Hlh-N,
Turb, TS!N, TC
C.W. Flsliery
f'uljlic Water Supply
sec. contact re-
creation
livestock watering
Irrigation
Mn, TC. HI, FC, TSUI,
Turb
Point Source Dischargers
(Park City) Recreation
Development, Ideal
Cement, Komas Ft&U
Hatchery, Oakley
Lagoons, Komas, Lagoons,
Sandcrvllle WUTP
CoalvIlle WU(P
Morgan Lagoons
lienefer Lagoons
Central Heber WWIP
llcbcr Valley WWIP
Midway
feedlots
tlon-PoInt Source
Ulschargcr'S ^
Beneficial Use - Criteria
Public Waters Supply Setjnunts
Having levels within 'JOX of
Standards
upstream conditions
hydroioglc modification,
livestock grazing, urban
runoff, irrigated
agriculture, raining,
energy exploration
agriculture Irrigated
cropl and
nonlrrigated cropland
fish hatcheries
PWS - Mn
C.H. Fishery - IP
sec. contact recreation - H'
3) Jordan River
North Touple St
Lo confluence
w/ Little Cotton-
wood Cr .
Sev.= 2. 9fi
sec. contact re-
creation
W.W. Fishery
irrigation
IN, DO, FC, S04, llg
Hurray HWTP
Cottonwood VIVHP
Granger-Hunter WWfP
SLC suburban 1IUFP II
So. SLC WWfP
Central Valley WHIP
feedlots
urban runoff
natural source
upstream conditions
(Utah Lake)
Irrigated agriculture
construction
Industrial
ttydrologlc modification
O
image:
 UTAH I'lUOfUTt SintAH SEWtWS Witt IMPAIRED BENEFICIAL USE
1) vliirdnn River
fruit c iiuf lui-iii c
w/ LUMo
Col Imiwuod Cr.
to Narrows
I) Ivci si on
Sev.« 9.16
5) Boar Ulvcr
(f.achn CQ.)
Sov.«- 6.90
ft) Prlc.o fllvor
OliiG Cul. Di-
ver si oil lo
I'lnnsvil Cr. l
lu'ai^ntei s
SPV.^ -12.56
7) Provo H Ivci'
trlbut ai I os
fr«»« IMixli
Lalcf! lo Mtirditc
Illvcrs Ion
Sc;v.= 2.21
sr-c. tortlatt
recreation
•C.M. fishery
Irrltj-itlon
W.H. Flslwry
Irrigation
Prghlcm Paranctgrs
IP, TC, FC, ODD, 00.
»ij, Temp, IBS, HI
TP, OQU, IDS
Pot n t So ur cfl D Is cti y_ per s
ffictlloti
South Valley HUTP
HdlvalR VIVIIP
Sandy HVHP
Smtthfteld
pub)Ic water supply
Irrlg.illon
TDS, TP. PC, Hg.
Ken IIworth
Price HWtP
C.M. Fishery
sec. contact re-
1 Ivestock watering
IrrI gall on
TP
(Ion-Pol nt Source
Ocncriclal Use - Criteria
Public Walcr Supply Scyncnts
llavlmj levels within SUX of
Standards
urban runoff I.
natural source
upstream condltltm^
(Utah Lake)
Irrigated agriculture
construction
hydrologlcal modification
Irrigated agriculture
dairies
fcedlots
natural source
Idaho upstream
-contributions
hydrologlcal modifications
natural source
on- si to disposal
construction
mining
grazing
livestock
Irrigated Agriculture
urban runoff
agriculture
grazing
Irrigated cropland
septic tanks
O
U1
image:
UTAH I'lUOfUTt SintAH SEWtWS Witt IMPAIRED BENEFICIAL USE
1) vliirdnn River
fruit c iiuf lui-iii c
w/ LUMo
Col Imiwuod Cr.
to Narrows
I) Ivci si on
Sev.« 9.16
5) Boar Ulvcr
(f.achn CQ.)
Sov.«- 6.90
ft) Prlc.o fllvor
OliiG Cul. Di-
ver si oil lo
I'lnnsvil Cr. l
lu'ai^ntei s
SPV.^ -12.56
7) Provo H Ivci'
trlbut ai I os
fr«»« IMixli
Lalcf! lo Mtirditc
Illvcrs Ion
Sc;v.= 2.21
sr-c. tortlatt
recreation
•C.M. fishery
Irrltj-itlon
W.H. Flslwry
Irrigation
Prghlcm Paranctgrs
IP, TC, FC, ODD, 00.
»ij, Temp, IBS, HI
TP, OQU, IDS
Pot n t So ur cfl D Is cti y_ per s
ffictlloti
South Valley HUTP
HdlvalR VIVIIP
Sandy HVHP
Smtthfteld
pub)Ic water supply
Irrlg.illon
TDS, TP. PC, Hg.
Ken IIworth
Price HWtP
C.M. Fishery
sec. contact re-
1 Ivestock watering
IrrI gall on
TP
(Ion-Pol nt Source
Ocncriclal Use - Criteria
Public Walcr Supply Scyncnts
llavlmj levels within SUX of
Standards
urban runoff I.
natural source
upstream condltltm^
(Utah Lake)
Irrigated agriculture
construction
hydrologlcal modification
Irrigated agriculture
dairies
fcedlots
natural source
Idaho upstream
-contributions
hydrologlcal modifications
natural source
on- si to disposal
construction
mining
grazing
livestock
Irrigated Agriculture
urban runoff
agriculture
grazing
Irrigated cropland
septic tanks
O
U1
image:
 urAii piuonirr STREAM SEGMENIS AND IMPAIRED uENEficiAt USE
Strgiiiu Scyiieot Use Impaired
8) Hd.er River
Slatei-vlllc
Diversion to
Sloildard
1J) Price (Uver
I tr Hint arles
from confluence
w/ Green Itlvcr
tn Castle Gate
lie low Price
WWII1
Scv.= 7.QJ
10) Duc.hcsne
& tributaries
from Hyton MWIP
Intake to
C.W. Fishery
Irrigation
W.H. Fishery
trrlgatloi)
livestock watering
C.W. Fishery
fiubl ic water supply
Problem Parameters
TP, B. TSIN, Turb
IDS. Ma
Point Source Dischargers
Mountain Green UWTP
Price WHIP
Tur-b, residue, Mn, Ha, Myton WWIP Lagoon
D. TDS, SO*, HI, TP Duchesne HWfP Lagoon
lion-Point Source
Oljc;hartjer&
urban runoff
hyilrologlcal modifications.
upstream conditions, construc-
tion, livestock
Irrigated agriculture
nun-Irrigated cropland
grazing
Irrigation
mining
Beneficial Use - Criteria
Public Water Supply Scgiienls
Having Levels within <JO* of
Standards
agriculture
irrigated cropland
oil, gas, hydrologtc
modification, mining
Public Water Supply, I1n, til,
Residue, TSIN
C.W. Fishery - Temp, TSUI
Scv.= 17.09
11) Little
Bear ft! ver
frtxn Cutler
lleso'volr to
headwaters
Sev.= 0.7J
C.W. Fishery
Irrigation
Turb, TP, Temp, TSIN
llyrura WMTP
Mhlte Trout Farms
fecdlots
dairies
non-Irrigated cropland
irrigated agriculture
grazing
natural source
hydro logic mollification
O
ON
image:
urAii piuonirr STREAM SEGMENIS AND IMPAIRED uENEficiAt USE
Strgiiiu Scyiieot Use Impaired
8) Hd.er River
Slatei-vlllc
Diversion to
Sloildard
1J) Price (Uver
I tr Hint arles
from confluence
w/ Green Itlvcr
tn Castle Gate
lie low Price
WWII1
Scv.= 7.QJ
10) Duc.hcsne
& tributaries
from Hyton MWIP
Intake to
C.W. Fishery
Irrigation
W.H. Fishery
trrlgatloi)
livestock watering
C.W. Fishery
fiubl ic water supply
Problem Parameters
TP, B. TSIN, Turb
IDS. Ma
Point Source Dischargers
Mountain Green UWTP
Price WHIP
Tur-b, residue, Mn, Ha, Myton WWIP Lagoon
D. TDS, SO*, HI, TP Duchesne HWfP Lagoon
lion-Point Source
Oljc;hartjer&
urban runoff
hyilrologlcal modifications.
upstream conditions, construc-
tion, livestock
Irrigated agriculture
nun-Irrigated cropland
grazing
Irrigation
mining
Beneficial Use - Criteria
Public Water Supply Scgiienls
Having Levels within <JO* of
Standards
agriculture
irrigated cropland
oil, gas, hydrologtc
modification, mining
Public Water Supply, I1n, til,
Residue, TSIN
C.W. Fishery - Temp, TSUI
Scv.= 17.09
11) Little
Bear ft! ver
frtxn Cutler
lleso'volr to
headwaters
Sev.= 0.7J
C.W. Fishery
Irrigation
Turb, TP, Temp, TSIN
llyrura WMTP
Mhlte Trout Farms
fecdlots
dairies
non-Irrigated cropland
irrigated agriculture
grazing
natural source
hydro logic mollification
O
ON
image:
 UfAtl PIUQfUH S flit AH SEGHEMS AfiD UPAIREO BENEFICIAL USE
StriMin
12} Snvler
tUver from
Ginmlson
fleml Keservolr
1/1 rtrjfce//A Piv
Scv.» 12. GO
11) ni<j Cotton-
wo'id Cr. >
! Ill lie Col Ion-
wood Cr.JIIll
Cr. '
S(.-v.= 53.11
14)
Hlver Ifirtl
Capitol Reef
ft al tonal Monu-
ment to hoatl-
wat et '»
Scv.= 1.34
15) Boar niver
and tributaries
(Rh.li Co.)
icv.» 7. in
M.M. Ftslmry
Irrigation
sec. contact re-
C.H. FHlKiry
Irrigation
W.H. Flsliery
Irrigation
I Ivestock
C.H. Fislicry
publ Ic water
prl. & sec. rDcrea-
llon, trrltjattuii
) Ivcstock
Problem Partmclcrs
lurb HOj, IP, Cu,
IDS. RIM, Ffe
IP, 000, 1C, COP
IDS. Na
Po j nt Source j) Is tUy_ gcrs
Sal ina WHIP
feedlots
Salt Lake CO./Cotton-
wood HH1I»»
Central Valley WMIP
{potential discharge to
Hill Cr.J
J.P. Egan FIsh Hatchery
tOA fish lUtchery
TSUI, IP, lurb, TC, Hn, Evans ton, MV WM1P
HI, temp, NOj-H, tK),
HOj, Fc, Ma
flan Point Sourco
tHschargers
Beneficial Use - Criteria
Public Hater Supply Segncnts
Having Levels within 9Ut of
Stand arils
Urinated agriculture
grazing
natural source
hydrologlcal modification
urban runoff
hydrologlcal modification
construction
Irrigated agriculture
upstream conditions
mining
natural sources
irrigated agriculture
natural sources
agriculture, non-
Irrigated cropland
grating, energy
exploration and
development of
overtlirust belt
o
image:
UfAtl PIUQfUH S flit AH SEGHEMS AfiD UPAIREO BENEFICIAL USE
StriMin
12} Snvler
tUver from
Ginmlson
fleml Keservolr
1/1 rtrjfce//A Piv
Scv.» 12. GO
11) ni<j Cotton-
wo'id Cr. >
! Ill lie Col Ion-
wood Cr.JIIll
Cr. '
S(.-v.= 53.11
14)
Hlver Ifirtl
Capitol Reef
ft al tonal Monu-
ment to hoatl-
wat et '»
Scv.= 1.34
15) Boar niver
and tributaries
(Rh.li Co.)
icv.» 7. in
M.M. Ftslmry
Irrigation
sec. contact re-
C.H. FHlKiry
Irrigation
W.H. Flsliery
Irrigation
I Ivestock
C.H. Fislicry
publ Ic water
prl. & sec. rDcrea-
llon, trrltjattuii
) Ivcstock
Problem Partmclcrs
lurb HOj, IP, Cu,
IDS. RIM, Ffe
IP, 000, 1C, COP
IDS. Na
Po j nt Source j) Is tUy_ gcrs
Sal ina WHIP
feedlots
Salt Lake CO./Cotton-
wood HH1I»»
Central Valley WMIP
{potential discharge to
Hill Cr.J
J.P. Egan FIsh Hatchery
tOA fish lUtchery
TSUI, IP, lurb, TC, Hn, Evans ton, MV WM1P
HI, temp, NOj-H, tK),
HOj, Fc, Ma
flan Point Sourco
tHschargers
Beneficial Use - Criteria
Public Hater Supply Segncnts
Having Levels within 9Ut of
Stand arils
Urinated agriculture
grazing
natural source
hydrologlcal modification
urban runoff
hydrologlcal modification
construction
Irrigated agriculture
upstream conditions
mining
natural sources
irrigated agriculture
natural sources
agriculture, non-
Irrigated cropland
grating, energy
exploration and
development of
overtlirust belt
o
image:
 UTAH PRIORITY STItEAH SEGMENTS AND IMPAIRED BENEFICIAL USE
16) Vlnjln
River ami tri-
butaries fnxn
Ul-AZ Stale
L Inc to head-
waters
Scv.* 6.36
17) Cub River
ami tributaries
from confluence
with Hear IUvor
to III-ID Slate
LI ne
Sov.= l.flO
in) Spanish
Fork ftlver ami
Irlhutarles
from Utah Lake
to divers Ion at
Mo ark Jtt.
I IK: hut Ing Ben-
jflinln Slouijli
; and Ro.er Cr.
Snv." 0.90
H.H. Flsliery
Itrhjatlon
1 Ivt-stock
W.M. Fishery
Irrigation
1Ivestock
Pt obi em .Parangters
TDS, Na. B
PolInt. S_QUrce I)Iscliar<)crs
St. George UUTP
Washington & Hurricane
Laijoons
IX), N03, TP
Western Ualrjwen
feedlots
H.W. Flsliery
Irrigation
livestock waterklnj
waterfowl
MV 000, u-NII3, IDS
TSIH, Turb
Payson WMTP
Salem UMTP
Non-Point Source
UI scliar gers
natural sources
Irrigated agriculture
grazing, recreational
development
Irrigated agriculture
non-Irrigated cropland
upstream Idaho
contributions
Irrigated agriculture
grazing
natural source
on-site disposal
livestock
septic tanks
hydrologic modification
non-irrigated cropland
feedlots
Beneficial Use - Criteria
Public Water Supply Scijncnts
Having Levels wllliln 9DX of
Standards
O
CO
image:
UTAH PRIORITY STItEAH SEGMENTS AND IMPAIRED BENEFICIAL USE
16) Vlnjln
River ami tri-
butaries fnxn
Ul-AZ Stale
L Inc to head-
waters
Scv.* 6.36
17) Cub River
ami tributaries
from confluence
with Hear IUvor
to III-ID Slate
LI ne
Sov.= l.flO
in) Spanish
Fork ftlver ami
Irlhutarles
from Utah Lake
to divers Ion at
Mo ark Jtt.
I IK: hut Ing Ben-
jflinln Slouijli
; and Ro.er Cr.
Snv." 0.90
H.H. Flsliery
Itrhjatlon
1 Ivt-stock
W.M. Fishery
Irrigation
1Ivestock
Pt obi em .Parangters
TDS, Na. B
PolInt. S_QUrce I)Iscliar<)crs
St. George UUTP
Washington & Hurricane
Laijoons
IX), N03, TP
Western Ualrjwen
feedlots
H.W. Flsliery
Irrigation
livestock waterklnj
waterfowl
MV 000, u-NII3, IDS
TSIH, Turb
Payson WMTP
Salem UMTP
Non-Point Source
UI scliar gers
natural sources
Irrigated agriculture
grazing, recreational
development
Irrigated agriculture
non-Irrigated cropland
upstream Idaho
contributions
Irrigated agriculture
grazing
natural source
on-site disposal
livestock
septic tanks
hydrologic modification
non-irrigated cropland
feedlots
Beneficial Use - Criteria
Public Water Supply Scijncnts
Having Levels wllliln 9DX of
Standards
O
CO
image:
 WAII PBIURirv Sf«EAM SEGMENfS AMI) IMPAIRED UENEFICIAL USE
19) Sa-i Rafael
III VIM' f»'(KB
conflimntfi w/
Grrcn River
to confluence
w/ Fci rtui Cr.
iev.= Q.07
10) Soviet-
liver AiinaboHo
11 version lo
ifl abater*
W.M. Fishery
Irrigation
\Ivostock
f_!15i!ijcm Parallel.ers
TOS, Ha
I'olnt Source Dischargers
C.W. Tlslmry
Irrigation
IIvnstock watering
Turh. TP, II-, Temp
Cu, DO
PangtiUch VMTP
cv.= 11.32
I) .lord.in
Ivt<)- rafi
m Bay-North
fi Street
sec. cuntact
recreation
Irrigation
non-game fishery
rc
, TP, 1)0, TC, IDS.
South Oavld WVlll>
feedlots
Ilan-Polnt Sourco
IMschargcrs
Oenefltlal Use - Criteria
Public UtUcr Supply Seijnonls
(laving Levels within 00% of
Standards
natural sources
mining
grazing
Irrigated agriculture
grazlmj, livestock,
construction, natural
source, upstream
condition?, hydrologic
modification, non-
Irrigated cropland
urban runoff
national sources
construction Industrial
hydrologic modifications
upstream conditions
(Utah Lake)
!W.« 6.03
O
image:
WAII PBIURirv Sf«EAM SEGMENfS AMI) IMPAIRED UENEFICIAL USE
19) Sa-i Rafael
III VIM' f»'(KB
conflimntfi w/
Grrcn River
to confluence
w/ Fci rtui Cr.
iev.= Q.07
10) Soviet-
liver AiinaboHo
11 version lo
ifl abater*
W.M. Fishery
Irrigation
\Ivostock
f_!15i!ijcm Parallel.ers
TOS, Ha
I'olnt Source Dischargers
C.W. Tlslmry
Irrigation
IIvnstock watering
Turh. TP, II-, Temp
Cu, DO
PangtiUch VMTP
cv.= 11.32
I) .lord.in
Ivt<)- rafi
m Bay-North
fi Street
sec. cuntact
recreation
Irrigation
non-game fishery
rc
, TP, 1)0, TC, IDS.
South Oavld WVlll>
feedlots
Ilan-Polnt Sourco
IMschargcrs
Oenefltlal Use - Criteria
Public UtUcr Supply Seijnonls
(laving Levels within 00% of
Standards
natural sources
mining
grazing
Irrigated agriculture
grazlmj, livestock,
construction, natural
source, upstream
condition?, hydrologic
modification, non-
Irrigated cropland
urban runoff
national sources
construction Industrial
hydrologic modifications
upstream conditions
(Utah Lake)
!W.« 6.03
O
image:
 ^«"«^.w^
WYOMING PRIORITY STREAM SEGMENTS AN!) WAIRED BENEFICIAL USE
(Urn-Point
/
T
i-
*
*/,
Stream jiegjiienl
River
/run) Big
Horn
til Huff jlo
Dili 1) diu
Fifteen
Mile Creek
- entire
length
Uiiut K Ivuf
- Uiilioi'i to
US I'ui'usl
Servltu
lljl.l/Jfl Creek
Use Impaired
CM Fishery
Public Wator
Supply
Sec. Contact
Recreation
CU F Isliery
CM Fishery
Sec. Contact
Recreation
,"-{N Problem Parameters
S04, TOS, SSEH
SSEl), Fee Coll, P
TN. TOS
Stream Chaoiml
Alteration
00, 11113, Fee Coll
Point Source Dischargers Source Dischargers
Mill WOOL! Dam Natural Runoff
Oil iretder dt'sckartics.
^ Irrlrjatea %
return
flows
Grazing
Natural Erosion
N/A
Lander STP
Beneficial Use-Criteria
Public Water Supply Segments
Having Levels within 90X of
Starularils
v/'
-
"RCver Ukrrp
WTp
Ut-ban
O
image:
^«"«^.w^
WYOMING PRIORITY STREAM SEGMENTS AN!) WAIRED BENEFICIAL USE
(Urn-Point
/
T
i-
*
*/,
Stream jiegjiienl
River
/run) Big
Horn
til Huff jlo
Dili 1) diu
Fifteen
Mile Creek
- entire
length
Uiiut K Ivuf
- Uiilioi'i to
US I'ui'usl
Servltu
lljl.l/Jfl Creek
Use Impaired
CM Fishery
Public Wator
Supply
Sec. Contact
Recreation
CU F Isliery
CM Fishery
Sec. Contact
Recreation
,"-{N Problem Parameters
S04, TOS, SSEH
SSEl), Fee Coll, P
TN. TOS
Stream Chaoiml
Alteration
00, 11113, Fee Coll
Point Source Dischargers Source Dischargers
Mill WOOL! Dam Natural Runoff
Oil iretder dt'sckartics.
^ Irrlrjatea %
return
flows
Grazing
Natural Erosion
N/A
Lander STP
Beneficial Use-Criteria
Public Water Supply Segments
Having Levels within 90X of
Starularils
v/'
-
"RCver Ukrrp
WTp
Ut-ban
O
image:
 WYOMING PRIORITY STREAM SEGMENTS AND UPAIHEO BENEFICIAL USE
£. Green K
- from
Hjlill'calll tti
US Foriii>t
Service
boundary
"7. Powder
- entire
length in
Salt Creek
Use Impaired
P rob) em P aranct crs
Cold Water Fishery Stream Channel
Alteration
Warm Water Fishery Sed, 70S, Turb.
Irrigation
CU Fishery
Irrigation
(fr«n the Powiler
fttvur)
TUS
Hon-Polnt
Point Soiit'ce Otschargars Source QUcharyers
N/A
oil T>«G(i«Srdi
oi
9 Clear Creek
- fruu its
nuu III
U|> bt.ru dill
to Hie
Buffalo SfP
A>. GUIVJU Creek
- fruu mouth
upstream lu
Slier I dan SIP
CW Fishery
See Recreation
cy Fishery
Prl . Contact
Recreation
DO, FC, Nil}.
III13, Cyanide,
Iron, Fee Coli,
T urb .
Buffalo WWTP
Various Satell
faciUtlcs
Sheridan STP -
111(3 t Fee Co] I
Erosion, grazing,
Runoff from saline
soils
Runoff from salina
soils
Irrigation Diversions
causing low flows and
increuseii temperatures
Natural Qackgrotinci
fe t Cyanide
Beneficial Use-Criteria
Public Water Supply Seynents
Having Levels within 90% of
Standards
CW Fishury - Tuuporatura
fc
image:
WYOMING PRIORITY STREAM SEGMENTS AND UPAIHEO BENEFICIAL USE
£. Green K
- from
Hjlill'calll tti
US Foriii>t
Service
boundary
"7. Powder
- entire
length in
Salt Creek
Use Impaired
P rob) em P aranct crs
Cold Water Fishery Stream Channel
Alteration
Warm Water Fishery Sed, 70S, Turb.
Irrigation
CU Fishery
Irrigation
(fr«n the Powiler
fttvur)
TUS
Hon-Polnt
Point Soiit'ce Otschargars Source QUcharyers
N/A
oil T>«G(i«Srdi
oi
9 Clear Creek
- fruu its
nuu III
U|> bt.ru dill
to Hie
Buffalo SfP
A>. GUIVJU Creek
- fruu mouth
upstream lu
Slier I dan SIP
CW Fishery
See Recreation
cy Fishery
Prl . Contact
Recreation
DO, FC, Nil}.
III13, Cyanide,
Iron, Fee Coli,
T urb .
Buffalo WWTP
Various Satell
faciUtlcs
Sheridan STP -
111(3 t Fee Co] I
Erosion, grazing,
Runoff from saline
soils
Runoff from salina
soils
Irrigation Diversions
causing low flows and
increuseii temperatures
Natural Qackgrotinci
fe t Cyanide
Beneficial Use-Criteria
Public Water Supply Seynents
Having Levels within 90% of
Standards
CW Fishury - Tuuporatura
fc
image:
 -«^
Use Impaired
WYOMING PRIORITY STREAM SEGMENTS AMD ^PAIRED BENEFICIAL USE
Problem Parameters
Point Source Dischargers
/^ 1.1 1 lie Goose
Creek - fro.«
uiuijlli upstream
Uu'imyU I lie
Ilium Of Ul<j
Hum
>j Grcyhull
ttlver from
11$ llHJIlUl
la MeeL«et-
iue SFP
t-l I! liter
Creek
near
rrnwll
/i" Soulh Fork
Shoshonc
R i ve r
t run
u'lii**
li^ervolr
lo tho US
Forest Service
CW Fishery
Sec. Contact
Recreation
CM Fishery
Sec. Contact
Recreation
CW Fishery
Sec. Contact
Recreation
CW Fishery
Temp., Sed., Turb.,
Low fioui. loss of
Riparian Vegetation
FC, Sed.,
D (Mater Ing
SSEO, TH, TN.
TDS, SO,,
Fee Coll, Mh
turb.
Dewaterlng
Habitat
Destruction
,
Corral & Feed lot
Runoff Septic
Heeteetsce
STP
Powell STP,
feed lot.
Failing Septic
Tanks
Hon-Point
Source Dischargers
Irrigation Diversions
Return Flows Access
to stream by stock
Irrigation with-
drawals return
flows
Irrigation return
flows
Natural Sources
Irrigation Diversions
Stream bank and
channel modification
Beneficial Uie-CrlterU !
Public Water Supply Seynants .
Having Levels within 90i of
Standards
image:
-«^
Use Impaired
WYOMING PRIORITY STREAM SEGMENTS AMD ^PAIRED BENEFICIAL USE
Problem Parameters
Point Source Dischargers
/^ 1.1 1 lie Goose
Creek - fro.«
uiuijlli upstream
Uu'imyU I lie
Ilium Of Ul<j
Hum
>j Grcyhull
ttlver from
11$ llHJIlUl
la MeeL«et-
iue SFP
t-l I! liter
Creek
near
rrnwll
/i" Soulh Fork
Shoshonc
R i ve r
t run
u'lii**
li^ervolr
lo tho US
Forest Service
CW Fishery
Sec. Contact
Recreation
CM Fishery
Sec. Contact
Recreation
CW Fishery
Sec. Contact
Recreation
CW Fishery
Temp., Sed., Turb.,
Low fioui. loss of
Riparian Vegetation
FC, Sed.,
D (Mater Ing
SSEO, TH, TN.
TDS, SO,,
Fee Coll, Mh
turb.
Dewaterlng
Habitat
Destruction
,
Corral & Feed lot
Runoff Septic
Heeteetsce
STP
Powell STP,
feed lot.
Failing Septic
Tanks
Hon-Point
Source Dischargers
Irrigation Diversions
Return Flows Access
to stream by stock
Irrigation with-
drawals return
flows
Irrigation return
flows
Natural Sources
Irrigation Diversions
Stream bank and
channel modification
Beneficial Uie-CrlterU !
Public Water Supply Seynants .
Having Levels within 90i of
Standards
image:
 ue**nuuaev»i»ttxmi*&V^^
WYOHINQ PRIORI Pf STHEAH SEGMENTS AMO UPAlflED QEIIEFICIAL USE
WuUtwy
fin I di -
frim Guernsey
la Olenilo SIP
tlnrlh I'laltu
Uivur fi'wa
si.lit: line
Ham
It lUu.k Crt'tik
- frun
lUHllll lu
Sec. Contact
Itiicreatlon
Pi-l. Contact
Recreation
Guernsey
Ctl Fishery
CW Fishery
Problem Parameters
Fee Co) i
SSEI)
Oewatcrlng
I. DO
Mon-Polnt
Point Source Olschaggers Source ptscliarners
Glcmio SIP
Deliberate fluslilntj
of silt from
Guernsey Reservoir
STP
Beneficial Usc-CrllcrU
Public Mater Supply Sc<)iieuts
Having Levels wlttiln 90i of
Standards
<;.»•. |«r frcok Sue. Contact
lltfcrballon
tlaliss Creuk
Suijar Creuk
a; Fishery
Sue, Contact
Itucreatlon
Fee Coll
Scd.
Fee Coll
Hills STP
Sinclair ST!«
Natural Erosion
image:
ue**nuuaev»i»ttxmi*&V^^
WYOHINQ PRIORI Pf STHEAH SEGMENTS AMO UPAlflED QEIIEFICIAL USE
WuUtwy
fin I di -
frim Guernsey
la Olenilo SIP
tlnrlh I'laltu
Uivur fi'wa
si.lit: line
Ham
It lUu.k Crt'tik
- frun
lUHllll lu
Sec. Contact
Itiicreatlon
Pi-l. Contact
Recreation
Guernsey
Ctl Fishery
CW Fishery
Problem Parameters
Fee Co) i
SSEI)
Oewatcrlng
I. DO
Mon-Polnt
Point Source Olschaggers Source ptscliarners
Glcmio SIP
Deliberate fluslilntj
of silt from
Guernsey Reservoir
STP
Beneficial Usc-CrllcrU
Public Mater Supply Sc<)iieuts
Having Levels wlttiln 90i of
Standards
<;.»•. |«r frcok Sue. Contact
lltfcrballon
tlaliss Creuk
Suijar Creuk
a; Fishery
Sue, Contact
Itucreatlon
Fee Coll
Scd.
Fee Coll
Hills STP
Sinclair ST!«
Natural Erosion
image:
 I
! i p-1'f'ii"
WYOMING PRIORITY STREAM SEGMENTS AHQ IMPAIRED BENEFICIAL USE
.'JQii"1 -§£il!!!i:lti Use |inpa jrcd
Problem Parameters
JO.liagJ,"lvCrcek
•23- Hitler Creek
311 11 iij Sdii.ly
as ik ik'
I'uurclui
f rum
inuijlh of
Stiurdimijh
(.reek lo
Iliilull Sll'
^S Donkey Crock
2?. Stoiiciiik-
CrejiK
Cold Hater
Fishery
Sec. Contract
Recreation
Public Water
Irrigation
liann Water
Fishery
See Contact
Recreation
Uiirm Vlater
Fishery
Sec. Contact
Recreation
Sec. Contact
Recreation
Cu
Fee Coli
TUS, S04
1)0. Fe, NH3.
Turb., Fee Coll
Fe, FC, 00
FC
Point Source Dischargers
Abandoned copper
mine - Dos Lunas
Rock Springs STP
Olg Sandy Reservoir
see page
llulett STP
Gillette STP
Various satellite
facilities In
Gillette area
GilleUii STP
Non-Point
Source Dischargers
Irrigation return
flow
Natural Background
Fe
Natural Background
Fe
Beneficial Use-Criteria
Public Water Supply Seijiiunts
Having Levels within 90X of
Standards i
28.
J
image:
I
! i p-1'f'ii"
WYOMING PRIORITY STREAM SEGMENTS AHQ IMPAIRED BENEFICIAL USE
.'JQii"1 -§£il!!!i:lti Use |inpa jrcd
Problem Parameters
JO.liagJ,"lvCrcek
•23- Hitler Creek
311 11 iij Sdii.ly
as ik ik'
I'uurclui
f rum
inuijlh of
Stiurdimijh
(.reek lo
Iliilull Sll'
^S Donkey Crock
2?. Stoiiciiik-
CrejiK
Cold Hater
Fishery
Sec. Contract
Recreation
Public Water
Irrigation
liann Water
Fishery
See Contact
Recreation
Uiirm Vlater
Fishery
Sec. Contact
Recreation
Sec. Contact
Recreation
Cu
Fee Coli
TUS, S04
1)0. Fe, NH3.
Turb., Fee Coll
Fe, FC, 00
FC
Point Source Dischargers
Abandoned copper
mine - Dos Lunas
Rock Springs STP
Olg Sandy Reservoir
see page
llulett STP
Gillette STP
Various satellite
facilities In
Gillette area
GilleUii STP
Non-Point
Source Dischargers
Irrigation return
flow
Natural Background
Fe
Natural Background
Fe
Beneficial Use-Criteria
Public Water Supply Seijiiunts
Having Levels within 90X of
Standards i
28.
J
image:
 !<£Y TO PROBLEM PARAMETERS
i 15
Ag - Silver As -
3e - 3erjj//u/»i Cd -
Cr - Chrcnrium Cu -
00 - Dissolved Oxygen Fe -
FC - Fecal Col if era Mn -
•S - Nitrogen Ha -
NH- - Un-icnizad Nl-U-
Ammoni a
Pb - Lead SO.
SScD - Suspended TC -
Sediment
13 IN - Total Soluble TSS
Inorganic
U-NH, - Un-icnizad
Ammoni a
- Arsenic
Cadmium
Copper
• Iron
Manganese
Sodium
NH4* - Total
Anracni a
- Sulfate
Total Coliform TOS - Total Dissolved
Solids
- Total Suspended Turb - Turbidity
Solids
3 - Soron
Cl - Chlorine
Oiss Sol - Dissolved
Solids
Fl - Fluorine
Mg - Magnesium
N1 - iMic!<el
P « Phosphorus
- 59 -
image:
!<£Y TO PROBLEM PARAMETERS
i 15
Ag - Silver As -
3e - 3erjj//u/»i Cd -
Cr - Chrcnrium Cu -
00 - Dissolved Oxygen Fe -
FC - Fecal Col if era Mn -
•S - Nitrogen Ha -
NH- - Un-icnizad Nl-U-
Ammoni a
Pb - Lead SO.
SScD - Suspended TC -
Sediment
13 IN - Total Soluble TSS
Inorganic
U-NH, - Un-icnizad
Ammoni a
- Arsenic
Cadmium
Copper
• Iron
Manganese
Sodium
NH4* - Total
Anracni a
- Sulfate
Total Coliform TOS - Total Dissolved
Solids
- Total Suspended Turb - Turbidity
Solids
3 - Soron
Cl - Chlorine
Oiss Sol - Dissolved
Solids
Fl - Fluorine
Mg - Magnesium
N1 - iMic!<el
P « Phosphorus
- 59 -
image:
 116
The Statewide Water Quality Management Plan and the areawide plans
identified a need to develop a Statewide program for the management and
control of on-site wastewater systems. The water quality plan identified a
number of watar quality problems as well as financial and institutional
deficiencies with the present program. The present program was evaluated in
detail in a study entitled "Managing On-site Wastewater Systems In Wyoming,
Financial and Institutional Needs and Recommendations." This report
identified a number of major issues and alternative institutional arrangements
for dealing with the issues. The major conclusion of the report is that
resoonsibility for this program should be delegated to local governments with
the State role one of technical and financial support and assistance.
The 1982 Wyoming Legisl ature revised the Wyoming Environmental Quality
Act to allow for delegation to locate entities certain programs, including
on-site system review and approval. The Division has developed rules and
regulations to implement delegation of the program. They are currently in the
review process.
APPENDIX B.
5-1: IMPLICATIONS TO WATER QU&ITY MANAGEMENT PROBLEMS
WATER RESOURCES DEVELOPMENT IN REGION VIII
Water scarcity in the western United States results in competing uses for
available water. Increased demand from agriculture, municipal and energy
interest have created substantial uncertainty over how supplies will be used.
Water conservation and reuse are alternatives to developing new supplies or
extending existing supplies to meet increasing demands.
Past approaches to water resources planning and development and water
allocation systems have favored out-of-stream uses such as irrigation, over
the values associated with instream uses such as aesthetics and recreation.
Flow depletions, resulting from out-of-stream uses, can severely affect water
quality, fish and wildlife resources, recreation, aesthetics, water supply,
hydrooower production and navigation. A number of States in Region VIII have
identified flow depletions as a major water quality problem.
In recent years there has been increasing recognition by state
legislatures of the many benefits associated with the protection and
maintenance of instream flows. The Environmental Protection Agency's concerns
regarding instream flow issues stem from the objectives of the Clean Water Act
i.e. attaining the Act's "fishable and swimmable" goal by 1983. For example,
there are sizeable public and private investments in wastewater treatment
facilities that are designed for given flow conditions. Further depletions of
flow will result in substantial added oublic and private costs and adverse
environmental impacts.
- 60 -
image:
116
The Statewide Water Quality Management Plan and the areawide plans
identified a need to develop a Statewide program for the management and
control of on-site wastewater systems. The water quality plan identified a
number of watar quality problems as well as financial and institutional
deficiencies with the present program. The present program was evaluated in
detail in a study entitled "Managing On-site Wastewater Systems In Wyoming,
Financial and Institutional Needs and Recommendations." This report
identified a number of major issues and alternative institutional arrangements
for dealing with the issues. The major conclusion of the report is that
resoonsibility for this program should be delegated to local governments with
the State role one of technical and financial support and assistance.
The 1982 Wyoming Legisl ature revised the Wyoming Environmental Quality
Act to allow for delegation to locate entities certain programs, including
on-site system review and approval. The Division has developed rules and
regulations to implement delegation of the program. They are currently in the
review process.
APPENDIX B.
5-1: IMPLICATIONS TO WATER QU&ITY MANAGEMENT PROBLEMS
WATER RESOURCES DEVELOPMENT IN REGION VIII
Water scarcity in the western United States results in competing uses for
available water. Increased demand from agriculture, municipal and energy
interest have created substantial uncertainty over how supplies will be used.
Water conservation and reuse are alternatives to developing new supplies or
extending existing supplies to meet increasing demands.
Past approaches to water resources planning and development and water
allocation systems have favored out-of-stream uses such as irrigation, over
the values associated with instream uses such as aesthetics and recreation.
Flow depletions, resulting from out-of-stream uses, can severely affect water
quality, fish and wildlife resources, recreation, aesthetics, water supply,
hydrooower production and navigation. A number of States in Region VIII have
identified flow depletions as a major water quality problem.
In recent years there has been increasing recognition by state
legislatures of the many benefits associated with the protection and
maintenance of instream flows. The Environmental Protection Agency's concerns
regarding instream flow issues stem from the objectives of the Clean Water Act
i.e. attaining the Act's "fishable and swimmable" goal by 1983. For example,
there are sizeable public and private investments in wastewater treatment
facilities that are designed for given flow conditions. Further depletions of
flow will result in substantial added oublic and private costs and adverse
environmental impacts.
- 60 -
image:
 117
Region VIII will be the focal point for energy resource development for
the Nation in the 1980's and beyond. Coal, oil shale, unconventional gas, tar
sands, synthetic fuels, and uranium are predominantly located in the western
states.
Depending on the technologies and sites chosen, western energy resources
development may create local and possible regional water shortages. On a
basin-wide level, the most severe problems are likely to occur in the Upper
Colorado River Basin. Where energy requirements for water are added to
non-energy requirements for the year 2000, the total may exceed the amount of
available water by as much as one million acre-feet per year. Each
incremental use threatens to worsen the overall salinity problems now facing
the Colorado River Basin streams.
Most or all of the water resources of the western states are close to
being fully appropriated. The West is also experiencing very rapid population
growth that must compete for scarce water resources. Agriculture is still
expanding in areas of the West. What can and will result then, is that these
three water uses — agriculture, municipal, and energy-industrial — will
comoete for what unused resources still remain. Agriculture, the biggest user
and consumer, of water, is bound to be adversely affected.
The proliferation of on-stream reservoirs to meet water demands will
significantly modify the chemical, physical, geological and biological
features of the freshwater river systems of the West. The impacts of these
alterations are often felt well beyond the project site. Substantial
downstream changes in water quality frequently accompany reservoir
construction and operation. Biological responses to these modifications are
variable and frequently site specific. Slight to moderate or substantial
shifts in aquatic community structures and functions may occur. In some cases
entire copulations of fish and the aquatic organisms have been eliminated.
The type and degree of downstream modification are influenced by factors such
as the water quality characteristics of the water flowing into the reservoir;
the biological, hydrological and geochemical features of the reservoir; and
the local climate and geographical characteristics. The manner in which the
reservoir and the surrounding and upstream lands are managed is critical to
in-reservoir and downstream water quality.
- 6
i _
image:
117
Region VIII will be the focal point for energy resource development for
the Nation in the 1980's and beyond. Coal, oil shale, unconventional gas, tar
sands, synthetic fuels, and uranium are predominantly located in the western
states.
Depending on the technologies and sites chosen, western energy resources
development may create local and possible regional water shortages. On a
basin-wide level, the most severe problems are likely to occur in the Upper
Colorado River Basin. Where energy requirements for water are added to
non-energy requirements for the year 2000, the total may exceed the amount of
available water by as much as one million acre-feet per year. Each
incremental use threatens to worsen the overall salinity problems now facing
the Colorado River Basin streams.
Most or all of the water resources of the western states are close to
being fully appropriated. The West is also experiencing very rapid population
growth that must compete for scarce water resources. Agriculture is still
expanding in areas of the West. What can and will result then, is that these
three water uses — agriculture, municipal, and energy-industrial — will
comoete for what unused resources still remain. Agriculture, the biggest user
and consumer, of water, is bound to be adversely affected.
The proliferation of on-stream reservoirs to meet water demands will
significantly modify the chemical, physical, geological and biological
features of the freshwater river systems of the West. The impacts of these
alterations are often felt well beyond the project site. Substantial
downstream changes in water quality frequently accompany reservoir
construction and operation. Biological responses to these modifications are
variable and frequently site specific. Slight to moderate or substantial
shifts in aquatic community structures and functions may occur. In some cases
entire copulations of fish and the aquatic organisms have been eliminated.
The type and degree of downstream modification are influenced by factors such
as the water quality characteristics of the water flowing into the reservoir;
the biological, hydrological and geochemical features of the reservoir; and
the local climate and geographical characteristics. The manner in which the
reservoir and the surrounding and upstream lands are managed is critical to
in-reservoir and downstream water quality.
- 6
i _
image:
 Point Source Dischargers to Priority Stream Segments
1 18
UTAH
Stream Segment with
Impaired Use
Point Source
Discharger
NPDES
Compliance
Status
1. Weber River and
tributaries from
Stoddard D
to Headwaters
-:. Provo River and
\t\b-jtaries from Murdock
5 i version to headwaters
>, Jordan River from
»-» ' r3
Park City Recreation
EFaveTopment
Ideal Cement
Karaas Fish Hatchery
Oakley Lagoons
Kamas Lagoons
SmjokrviHe WMTP
Coalville WV/T?
Morgan Lagoons
Serr-efer Lagoons"
Central Lagoons
Murray W'.-fTP
Coctonwood W.-.TP
.
C I VJJlar.
image:
Point Source Dischargers to Priority Stream Segments
1 18
UTAH
Stream Segment with
Impaired Use
Point Source
Discharger
NPDES
Compliance
Status
1. Weber River and
tributaries from
Stoddard D
to Headwaters
-:. Provo River and
\t\b-jtaries from Murdock
5 i version to headwaters
>, Jordan River from
»-» ' r3
Park City Recreation
EFaveTopment
Ideal Cement
Karaas Fish Hatchery
Oakley Lagoons
Kamas Lagoons
SmjokrviHe WMTP
Coalville WV/T?
Morgan Lagoons
Serr-efer Lagoons"
Central Lagoons
Murray W'.-fTP
Coctonwood W.-.TP
.
C I VJJlar.
image:
 Point Source Dischargers to Priority Stream Segments
119
UTAH
Stream Segment with
Impaired Use
Point Source
Discharger
NPDES
Compli ance
Status
Sranger-Hunter WWTP
South SLC MWTP
C
C
4. Gordan River from
confluence with Little
Cottonv/ood Creek to
Harrows Diversion
5. Price River from Blue Cut"
Diversion to headwaters,
and Pleasant Creek to headwtars
5. '.'leber River from Slaterville
D'.'ersion to Stoddard Diversion
?. Price River and tributaries
"r"jT concl jence with Green River
•.•) Castle 3i~2 below Price WT?
Midvale WWTP
Sandy WWTP
Price WI-/TP
Price WWTP
NC (TC)
NC (TSS)
NC (TC, FC)
fIC (TC, FC)
- 65 -
image:
Point Source Dischargers to Priority Stream Segments
119
UTAH
Stream Segment with
Impaired Use
Point Source
Discharger
NPDES
Compli ance
Status
Sranger-Hunter WWTP
South SLC MWTP
C
C
4. Gordan River from
confluence with Little
Cottonv/ood Creek to
Harrows Diversion
5. Price River from Blue Cut"
Diversion to headwaters,
and Pleasant Creek to headwtars
5. '.'leber River from Slaterville
D'.'ersion to Stoddard Diversion
?. Price River and tributaries
"r"jT concl jence with Green River
•.•) Castle 3i~2 below Price WT?
Midvale WWTP
Sandy WWTP
Price WI-/TP
Price WWTP
NC (TC)
NC (TSS)
NC (TC, FC)
fIC (TC, FC)
- 65 -
image:
 •Point Source Dischargers to Priority Stream Sagmsnts
120
UTAH
Stream Segment with
Impaired Usa
Point Source
Discharger
NPDES
Compliance
Status
3. Duchesne River and. tributaries
from My ton tfTP in take "to
headwaters
9. Little Bear River from
Cuiler Reservoir to headwaters
10, Sevier River from
8unnison Bend Reservoir
to Annabel!a Diversion
11. Big Cottonwood Creek,
Little Cottonwood Creek,
Mill Creek
12. Fr3~ont River thro'jtn
>.T 'tal 3-?er .National
Mytqn WWTP Lagoon
"Duchesne'l-MP Lagoon
White Trout Farms
Richfield WWTP
Salina '.-A-/TP
Salt Lake Co/Cottonwood
Central Valley HI-/TP
•3. P. Eg an Fish
Hatchery LGA cish
Hatciiery
NC (TC, FC)
C
violation of
permit but in
compliance
with Order
image:
•Point Source Dischargers to Priority Stream Sagmsnts
120
UTAH
Stream Segment with
Impaired Usa
Point Source
Discharger
NPDES
Compliance
Status
3. Duchesne River and. tributaries
from My ton tfTP in take "to
headwaters
9. Little Bear River from
Cuiler Reservoir to headwaters
10, Sevier River from
8unnison Bend Reservoir
to Annabel!a Diversion
11. Big Cottonwood Creek,
Little Cottonwood Creek,
Mill Creek
12. Fr3~ont River thro'jtn
>.T 'tal 3-?er .National
Mytqn WWTP Lagoon
"Duchesne'l-MP Lagoon
White Trout Farms
Richfield WWTP
Salina '.-A-/TP
Salt Lake Co/Cottonwood
Central Valley HI-/TP
•3. P. Eg an Fish
Hatchery LGA cish
Hatciiery
NC (TC, FC)
C
violation of
permit but in
compliance
with Order
image:
 Point Source Dischargers to Priority Strea-n Segments
121
Stream Segment with
Imaairsd Use
13. Bear River and""
-M butanes -from VWrufP tksa->o\«-
14. Virgin River and
tributaries from UT-AZ
State line. tp. headwaters
15. Cub River and tributaries
from confluence with Bear
River to UT-IO State Line
15. Spanish Fork River and
tributaries from Utah Lake
to diversion at Moark Jet.,
including Senja-nin Slough
Creek
I7, Sevier River from
A -.-vibe lie Oi version to
UTAH
Point Sourc
Discharger
Evanston, V
St. George
Washington
Lagoons
Western Dai
-MWTP
MTP
Hurricane
ymen
Pay son VWTP •
Salem Wlfl?
Panguitch l-.'WT?
NPDES
Compliance
Status
C
C
- 6S -
image:
Point Source Dischargers to Priority Strea-n Segments
121
Stream Segment with
Imaairsd Use
13. Bear River and""
-M butanes -from VWrufP tksa->o\«-
14. Virgin River and
tributaries from UT-AZ
State line. tp. headwaters
15. Cub River and tributaries
from confluence with Bear
River to UT-IO State Line
15. Spanish Fork River and
tributaries from Utah Lake
to diversion at Moark Jet.,
including Senja-nin Slough
Creek
I7, Sevier River from
A -.-vibe lie Oi version to
UTAH
Point Sourc
Discharger
Evanston, V
St. George
Washington
Lagoons
Western Dai
-MWTP
MTP
Hurricane
ymen
Pay son VWTP •
Salem Wlfl?
Panguitch l-.'WT?
NPDES
Compliance
Status
C
C
- 6S -
image:
 Point Source Dischargers to Priority Stream Segments
122
UTAH
Stream Segment with
Impaired Use
Point Source
Discharger
NPDES
Compliance
Status
13. Jordan River from
Farming ton Bay to North
Taniple Street, SIC
IB. East Canyon Creek
20. Ashley Creek from
mouth to Vernal
21. San Pitch River
front mouth to Ut Hwy 132
22. .. Bear .River (Box-
Elder Co.)
South Dav-is WWTP
WWTP
Vernal WWTP
Ephraicn
Srigham City-WWT?.
Corinne Lagoons
NC
.MC-.
- 66 -
image:
Point Source Dischargers to Priority Stream Segments
122
UTAH
Stream Segment with
Impaired Use
Point Source
Discharger
NPDES
Compliance
Status
13. Jordan River from
Farming ton Bay to North
Taniple Street, SIC
IB. East Canyon Creek
20. Ashley Creek from
mouth to Vernal
21. San Pitch River
front mouth to Ut Hwy 132
22. .. Bear .River (Box-
Elder Co.)
South Dav-is WWTP
WWTP
Vernal WWTP
Ephraicn
Srigham City-WWT?.
Corinne Lagoons
NC
.MC-.
- 66 -
image:
 Point Source Dischargers to Priority Stream Segments
WYOMING
123
Stream Segment with
Impaired Use
Point Source
Discharger
NPDES
Compliance
Status
1. Shcshone River from Big
Horn Reservoir to Buffalo
Will Wood Darn
2. Baldwin Creek
3. Clear Creek - from mouth
upstream to the Buffalo STP
4. Goose Creek from mouth
upstream to Sheridan STP
5. Bear River from Woodruff
Narrows Reservoir to cvanston
5. Greybull River from mouth
to Meeteetsee STP
7. Bitter Creek near Powell
8. Whiskey Gulch from Guernsey
Reservoir to Glend STP
9. North Platte River from
sWe \\t\e. -to
Lander STP
Buffalo WWTP
Sheridan WWTP
Evanston WWTP
Meeteetsee STP
Powell WWTP
Glendo STP
Guernsey Reservoir
NC (BOD5,
TSS)
o
- 67 -
image:
Point Source Dischargers to Priority Stream Segments
WYOMING
123
Stream Segment with
Impaired Use
Point Source
Discharger
NPDES
Compliance
Status
1. Shcshone River from Big
Horn Reservoir to Buffalo
Will Wood Darn
2. Baldwin Creek
3. Clear Creek - from mouth
upstream to the Buffalo STP
4. Goose Creek from mouth
upstream to Sheridan STP
5. Bear River from Woodruff
Narrows Reservoir to cvanston
5. Greybull River from mouth
to Meeteetsee STP
7. Bitter Creek near Powell
8. Whiskey Gulch from Guernsey
Reservoir to Glend STP
9. North Platte River from
sWe \\t\e. -to
Lander STP
Buffalo WWTP
Sheridan WWTP
Evanston WWTP
Meeteetsee STP
Powell WWTP
Glendo STP
Guernsey Reservoir
NC (BOD5,
TSS)
o
- 67 -
image:
 Point Source Dischargers to Priority Stream Segments
124
WYOMING
Stream Segment with
Impaired Use
Point Source
Discharger
NPDES
Compliance
Status
10. Rock Creek from mouth
to Wheat!and
Wheatland WWTP
12. Sugar Creek
13. Bitter Creek
14. . Big Sandy_River
15. Belle Fourche River
from mouth of Sourdough
Creek to Hulett VTvfT?
15. Donkey Creek
17. Stonepile Creek
Sinclair WWTP
Rock Springs l'/WTP
.3ig Sandy Reservoir
Hulett WWTP
Gillette WWTP
Gillette WWTP
HC (C12)
(marginal)
NC (8005,
TSS)
NC (BOD5,
TSS)
- 68 -
image:
Point Source Dischargers to Priority Stream Segments
124
WYOMING
Stream Segment with
Impaired Use
Point Source
Discharger
NPDES
Compliance
Status
10. Rock Creek from mouth
to Wheat!and
Wheatland WWTP
12. Sugar Creek
13. Bitter Creek
14. . Big Sandy_River
15. Belle Fourche River
from mouth of Sourdough
Creek to Hulett VTvfT?
15. Donkey Creek
17. Stonepile Creek
Sinclair WWTP
Rock Springs l'/WTP
.3ig Sandy Reservoir
Hulett WWTP
Gillette WWTP
Gillette WWTP
HC (C12)
(marginal)
NC (8005,
TSS)
NC (BOD5,
TSS)
- 68 -
image:
 61
Trend analyses per se, have not been attempted for these same reasons.
Water quality In Region VIII streams is highly correlated with seasonal
fluctuations in the natural hydro!ogic cycle. High streamflows are associated
with naturally large concentrations of sediment and high turbidity; low
streamflows are associated with larger concentrations of dissolved materials
and lower turbidity. If year-to-year water quality samples are not taken
during comparable times in the hydrologic cycle - which is often the case -
then the apparent water quality trend will be an artifact of sample timing,
and the true trend will remain unknown. Even if year-to-year samples are
taken from comparable points on the hydrologic cycle, there will be
differences in streamflow, which must be factored into the quality analysis.
In may cases, streamflow information is not available to statistically weight
streamflows to arrive at a true and reliable assessment of water quality
trends. Region VIII is, however, developing a procedure to flow-weight water
quality data.
Of these problems, the most serious impediment to severity and trend
analysis is the scarcity of regular monitoring data from apparent and
potential problems segments. Because of the great expense involved in
monitoring, only the Federal government can afford to do the bulk of the water
quality monitoring in Region VIII. The Federal monitoring network has been
geared largely to energy impact areas and to national trend monitoring.
Hence, the stations tend to be project specific or on the larger rivers where
pollutants are more readily diluted and where pollution sources are obscure.-
and problematic. The most significant data gap in Region VIII is biological;
biological data is virtually absent. This deficiency will greatly hinder
Region VIII's ability to develop site-specific water quality standards
recommendations.
Aquatic life protection uses and recreational water uses are the uses
most frequently impaired by pollution in Region VIII. To a lesser extent,
water classified for public water supply protection and for agricultural use
are also impaired.
Un-ionized ammonia, low dissolved oxygen and elevated nutrients are the
parameters associated with municipal wastewater treatment facilities which
appear to be having the greatest effect on aquatic life. Cadmium, copper,
lead and zinc contamination from active, inactive or abandoned mining
operations are suspected of having severe effects on aquatic life.
Nonpoint source pollution constitutes, by in large, the principal cause
of the water quality problems in Region VIII, with some states reporting that
over 90* of their water quality problems are due to natural and human-induced
nonooint source pollution. Sediment, nutrients and salinity are the
parameters which are responsible for most of the use impairment observed in
Region VIII. Fecal coliform from nonpoint sources and inadequately treated
wastewater cause frequent recreational use impairments.
- 5 -
image:
61
Trend analyses per se, have not been attempted for these same reasons.
Water quality In Region VIII streams is highly correlated with seasonal
fluctuations in the natural hydro!ogic cycle. High streamflows are associated
with naturally large concentrations of sediment and high turbidity; low
streamflows are associated with larger concentrations of dissolved materials
and lower turbidity. If year-to-year water quality samples are not taken
during comparable times in the hydrologic cycle - which is often the case -
then the apparent water quality trend will be an artifact of sample timing,
and the true trend will remain unknown. Even if year-to-year samples are
taken from comparable points on the hydrologic cycle, there will be
differences in streamflow, which must be factored into the quality analysis.
In may cases, streamflow information is not available to statistically weight
streamflows to arrive at a true and reliable assessment of water quality
trends. Region VIII is, however, developing a procedure to flow-weight water
quality data.
Of these problems, the most serious impediment to severity and trend
analysis is the scarcity of regular monitoring data from apparent and
potential problems segments. Because of the great expense involved in
monitoring, only the Federal government can afford to do the bulk of the water
quality monitoring in Region VIII. The Federal monitoring network has been
geared largely to energy impact areas and to national trend monitoring.
Hence, the stations tend to be project specific or on the larger rivers where
pollutants are more readily diluted and where pollution sources are obscure.-
and problematic. The most significant data gap in Region VIII is biological;
biological data is virtually absent. This deficiency will greatly hinder
Region VIII's ability to develop site-specific water quality standards
recommendations.
Aquatic life protection uses and recreational water uses are the uses
most frequently impaired by pollution in Region VIII. To a lesser extent,
water classified for public water supply protection and for agricultural use
are also impaired.
Un-ionized ammonia, low dissolved oxygen and elevated nutrients are the
parameters associated with municipal wastewater treatment facilities which
appear to be having the greatest effect on aquatic life. Cadmium, copper,
lead and zinc contamination from active, inactive or abandoned mining
operations are suspected of having severe effects on aquatic life.
Nonpoint source pollution constitutes, by in large, the principal cause
of the water quality problems in Region VIII, with some states reporting that
over 90* of their water quality problems are due to natural and human-induced
nonooint source pollution. Sediment, nutrients and salinity are the
parameters which are responsible for most of the use impairment observed in
Region VIII. Fecal coliform from nonpoint sources and inadequately treated
wastewater cause frequent recreational use impairments.
- 5 -
image:
 62
Some of the more signigicant water quality problems in Region VIII remain
unresolved. These problems are being addressed through programs such as:
0 Uooer Colorado River Basin Salinity Control Program
0 Water Quality Standards (use attainability ?i site-specific criteria)
0 NPOES Discharge Permits
0 Wetlands and 404 Permits
0 Clean lakes Programs
0 Nationwide Urban Runoff Program
0 Construction Grants Program
0 Continuing Planning Process
0 Agricultural Conservation Program (Dept. of Agriculture)
- 6 -
image:
62
Some of the more signigicant water quality problems in Region VIII remain
unresolved. These problems are being addressed through programs such as:
0 Uooer Colorado River Basin Salinity Control Program
0 Water Quality Standards (use attainability ?i site-specific criteria)
0 NPOES Discharge Permits
0 Wetlands and 404 Permits
0 Clean lakes Programs
0 Nationwide Urban Runoff Program
0 Construction Grants Program
0 Continuing Planning Process
0 Agricultural Conservation Program (Dept. of Agriculture)
- 6 -
image:
 63
PART II: REGIONAL OVERVIEW OF WATER QUALITY ISSUES - SIGNIFICANT WATER
QUALITY PROBLEMS
COLORADO
The thrust of the Federal Clean Water Act is to restore and maintain the
quality of the nation's waters. Thus, impaired stream segments in Colorado
reflect those areas where stream segments have not yet achieved the use or
quality deemed advisable and desirable by the State and EPA. (See Figure II
Colorado Map; Table 1.)
The most significant water quality impairments in Colorado are due to
fecal coliforms and/or ammonia. Discharges from municipal wastewater
facilities are the primary cause of the impairments. Both recreational uses
and aquatic life are affected.
Segment 10 of.Boulder Creek is the only Class II recreational water body
in Colorado not consistently meeting its adopted standard for fecal coliform.
The data indicates that Boulder Creek would also frequently have a problem
meeting the criterion for a Class II recreational stream. The station
evaluated on Boulder Creek is downstream from the City of Boulder and from the
confluence with Coal Creek. There is one municipal discharge to Boulder Creek
and three discharges to Coal Creek. Earlier studies by the Division have
indicated that Coal Creek is a major source of degradation to water quality' in
Boulder Creek. Only the town of Erie was significantly out of compliance with
their discharge permit limits for fecal coliforms during the evaluation period.
All of the stream segments impaired because of feeal coliforms are in
areas of intensive agricultural land use and are downstream of major municipal
point source discharges. Many of the municipal dischargers to impaired
segments commonly have had a problem in meeting their permit limits for fecal
coliforms during the evaluation period.
Concentrations of un-ionized ammonia impaired both Class I and Class II
aquatic life streams. With the exception of the Dolores River below the
confluence with the San Miguel River, the primary source of ammonia is
municioal wastewater. Water quality standards allow higher concentrations of
ammonia in the San Miguel River below Uravan than are allowed in the Dolores;
however, the ammonia load from the San Miguel causes the Dolores to exceed its
adooted standard.
image:
63
PART II: REGIONAL OVERVIEW OF WATER QUALITY ISSUES - SIGNIFICANT WATER
QUALITY PROBLEMS
COLORADO
The thrust of the Federal Clean Water Act is to restore and maintain the
quality of the nation's waters. Thus, impaired stream segments in Colorado
reflect those areas where stream segments have not yet achieved the use or
quality deemed advisable and desirable by the State and EPA. (See Figure II
Colorado Map; Table 1.)
The most significant water quality impairments in Colorado are due to
fecal coliforms and/or ammonia. Discharges from municipal wastewater
facilities are the primary cause of the impairments. Both recreational uses
and aquatic life are affected.
Segment 10 of.Boulder Creek is the only Class II recreational water body
in Colorado not consistently meeting its adopted standard for fecal coliform.
The data indicates that Boulder Creek would also frequently have a problem
meeting the criterion for a Class II recreational stream. The station
evaluated on Boulder Creek is downstream from the City of Boulder and from the
confluence with Coal Creek. There is one municipal discharge to Boulder Creek
and three discharges to Coal Creek. Earlier studies by the Division have
indicated that Coal Creek is a major source of degradation to water quality' in
Boulder Creek. Only the town of Erie was significantly out of compliance with
their discharge permit limits for fecal coliforms during the evaluation period.
All of the stream segments impaired because of feeal coliforms are in
areas of intensive agricultural land use and are downstream of major municipal
point source discharges. Many of the municipal dischargers to impaired
segments commonly have had a problem in meeting their permit limits for fecal
coliforms during the evaluation period.
Concentrations of un-ionized ammonia impaired both Class I and Class II
aquatic life streams. With the exception of the Dolores River below the
confluence with the San Miguel River, the primary source of ammonia is
municioal wastewater. Water quality standards allow higher concentrations of
ammonia in the San Miguel River below Uravan than are allowed in the Dolores;
however, the ammonia load from the San Miguel causes the Dolores to exceed its
adooted standard.
image:
 FIGURE ). COLORADO WATER QUALITY FRCSLEM AREAS
1 - South Platte River (Hampdsn to Anderson)
2 - "
3 -
4 - Cherry Creek Reservoir
5 - Clear Creek (Idaho Springs to Ycungfield)
6 - torth Fork Clear Creak
7 - St. Vrain Cresk (Longtront to mouth)
8 - Big Thompson River (Loveland to mouth)
9 - Little Thompson River (Serthcud to mouth)
10 - Foudra River (Ft. Collins to mouth)
11 - Arkansas River (1-25 to La Junta)
12 - Arkansas River (La Junta to Statelina)
13 - Fountain Cresk (Nfcnunent Creek to rncuth)
14 - Uncompahgra River
15 -Dolores"River- (So/i Mi*«e| Uter -h>
image:
FIGURE ). COLORADO WATER QUALITY FRCSLEM AREAS
1 - South Platte River (Hampdsn to Anderson)
2 - "
3 -
4 - Cherry Creek Reservoir
5 - Clear Creek (Idaho Springs to Ycungfield)
6 - torth Fork Clear Creak
7 - St. Vrain Cresk (Longtront to mouth)
8 - Big Thompson River (Loveland to mouth)
9 - Little Thompson River (Serthcud to mouth)
10 - Foudra River (Ft. Collins to mouth)
11 - Arkansas River (1-25 to La Junta)
12 - Arkansas River (La Junta to Statelina)
13 - Fountain Cresk (Nfcnunent Creek to rncuth)
14 - Uncompahgra River
15 -Dolores"River- (So/i Mi*«e| Uter -h>
image:
 65
Gore Creek, the Crystal River, and the North Fork of the Gunm'son have
Class I aquatic life designations and have experienced ammonia problems during
the evaluation oeriod. Since there are no municioal point source discharges
to the Crystal River the source of ammonia is unknown. Ammonia exceedance on
Gore Creek occurred downstream of a major municipal discharger that was
exoeriencing operational problems during the time of peak winter recreational
use in the evaluation period. A fish hatchery, a dairy, and several small
municipalities discharge to the North Fork. Any or all of these sources could
have contributed to the problem on the North Fork.
The major un-ionized ammonia concerns in Colorado occur on the South
Platte River from near Bowles Avenue in the Metro Denver area to approximately
Platteville, Clear Creek below Youngfield Street, the St. Vrain River below
longmont, and Boulder Creek below Boulder. All four stream segments violate
their un-ionized anmonia standard on a low to moderate frequency rate. The
watersheds of all four of these streams are expected to encounter major
peculation increases during the next twenty years. Therefore, without proper
measures, both the frequency and the magnitude of the violations may increase
in the future.
Many of the remaining stream impairments in Colorado are due to several
heavy metals (lead, cadmium, copoer, zinc,) which exceed the standards
established for cold water aquatic life. With the exception of Ten Mile Creek
in Summit County, reductions in concentrations of these metals may be
contingent upon the control of drainage from inactive or abandoned mine tails
or tunnels. The Molybdenum mine at Climax is the major point source discharge
to Ten Mile Creek. Seasonal standards for metals have sat for Tan Mile Creek
which will protect the established aquatic life between Copper Mountain and
Dillon Reservoir. Metals which are associated with present or past mining
activities or natural geologic conditions, have impaired only aquatic life
with the single exception of the Eagle River. The utility of the Eagle River
for municioal purposes has been significantly diminished because of the
concentration of manganese which exceeds the adopted standards for water
suoply.
A study published in 1974 by the U.S. Geological Survey identified 4-50
stream miles in Colorado that had been impacted by metal mine drainage. Water
quality imoairment was attributed to ongoing, as well as past mining
ooerations and natural mineral seeps. Damage to the aquatic environment was
caused by a number of factors including flow from drainage tunnels, milling
ooerations, and tailings piles. Restoration of several segments owing to the
control of point source discharges at active locations or to the clean up of
inactive mine areas has been accomplished. Feasibility studies are under way
at several other locations in order to take advantage of reclamation funds
that may become available in the future.
- 9 -
image:
65
Gore Creek, the Crystal River, and the North Fork of the Gunm'son have
Class I aquatic life designations and have experienced ammonia problems during
the evaluation oeriod. Since there are no municioal point source discharges
to the Crystal River the source of ammonia is unknown. Ammonia exceedance on
Gore Creek occurred downstream of a major municipal discharger that was
exoeriencing operational problems during the time of peak winter recreational
use in the evaluation period. A fish hatchery, a dairy, and several small
municipalities discharge to the North Fork. Any or all of these sources could
have contributed to the problem on the North Fork.
The major un-ionized ammonia concerns in Colorado occur on the South
Platte River from near Bowles Avenue in the Metro Denver area to approximately
Platteville, Clear Creek below Youngfield Street, the St. Vrain River below
longmont, and Boulder Creek below Boulder. All four stream segments violate
their un-ionized anmonia standard on a low to moderate frequency rate. The
watersheds of all four of these streams are expected to encounter major
peculation increases during the next twenty years. Therefore, without proper
measures, both the frequency and the magnitude of the violations may increase
in the future.
Many of the remaining stream impairments in Colorado are due to several
heavy metals (lead, cadmium, copoer, zinc,) which exceed the standards
established for cold water aquatic life. With the exception of Ten Mile Creek
in Summit County, reductions in concentrations of these metals may be
contingent upon the control of drainage from inactive or abandoned mine tails
or tunnels. The Molybdenum mine at Climax is the major point source discharge
to Ten Mile Creek. Seasonal standards for metals have sat for Tan Mile Creek
which will protect the established aquatic life between Copper Mountain and
Dillon Reservoir. Metals which are associated with present or past mining
activities or natural geologic conditions, have impaired only aquatic life
with the single exception of the Eagle River. The utility of the Eagle River
for municioal purposes has been significantly diminished because of the
concentration of manganese which exceeds the adopted standards for water
suoply.
A study published in 1974 by the U.S. Geological Survey identified 4-50
stream miles in Colorado that had been impacted by metal mine drainage. Water
quality imoairment was attributed to ongoing, as well as past mining
ooerations and natural mineral seeps. Damage to the aquatic environment was
caused by a number of factors including flow from drainage tunnels, milling
ooerations, and tailings piles. Restoration of several segments owing to the
control of point source discharges at active locations or to the clean up of
inactive mine areas has been accomplished. Feasibility studies are under way
at several other locations in order to take advantage of reclamation funds
that may become available in the future.
- 9 -
image:
 66
MONTANA
The most significant water quality problems in Montana are sediment,
salinity and problems arising from water depletion. A recent effort was made
to identify and prioritize Montana problem stream segments. A total of 216
stream segments were identified as problem segments (See Appendix A, Table
2). Sufficient recent data was only available, however, to develop pollution
severity indices for 99 of these segments. Thirty-two of these problem
segments were judged to be largely man caused and improvable under existing
regulatory authority and pollution control programs. These 32 segments form
Montana's priority waterbodies list upon which regulatory and planning efforts
are focused.
During the past two years Montana's surface water quality standards have
been revised. Policies for establishing permit levels for ammonia, chlorine
residuals, and oil and grease have been modified. This includes eliminating
the need to chlorinate many wastewater treatment plant effluents during winter
months. New rules to implement the State's nondegradation law have been
orepared. Developments are routinely reviewed and monitored for potential
impacts to water quality. These include lakeshore subdivisions, new and
modified hydroelectric and other energy projects, new and modified mining
develooraents and new discharges.
It is estimated that over $50 million worth of work needs to be done to -
uoqrade Montana's wastewater treatment facilities. Montana's major wastewater
treatment funding needs should be met, however, if all construction grant
funds currently authorized through FY 1985 are appropriated by Congress.
During the last two years, more than $38 million has been provided to local
governments for the construction of wastewater treatment facilities to improve
water quality and protect public health. Studies are continuing to identify
water quality problems attributable to wastewater treatment discharges. It is
estimated that eight municipal treatment plans are causing some degree of
ammonia toxicity to aquatic life in streams receiving the discharges. Mining
and milling activities and petroleum refining activities provide the more
significant industrial point source discharges in the State.
Most of Montana's water quality problems result from nonpoint sources of
oollution. Agricultural, mining, and forestry related activities are the
principal land use oractices which impact Montana water quality. This
includes; acid mine drainage and toxic metal contamination from mining
activities; accelerated erosion and stream sedimentation from hydrologic
modifications and improper land management; and excess sediment, nutrients,
pesticides and other contaminants from runoff. Planning, technical
assistance, and educational efforts which define and disseminate information
on the relation of land .use to water quality have been the chief mechanism
used to address these nonpoint pollution problems. Sharing in thesa efforts
are the Water Quality Bureau, one of the four original areawide planning
organizations, several Indian tribes, and a host of local, State and Federal
governmental agencies.
- 10 -
image:
66
MONTANA
The most significant water quality problems in Montana are sediment,
salinity and problems arising from water depletion. A recent effort was made
to identify and prioritize Montana problem stream segments. A total of 216
stream segments were identified as problem segments (See Appendix A, Table
2). Sufficient recent data was only available, however, to develop pollution
severity indices for 99 of these segments. Thirty-two of these problem
segments were judged to be largely man caused and improvable under existing
regulatory authority and pollution control programs. These 32 segments form
Montana's priority waterbodies list upon which regulatory and planning efforts
are focused.
During the past two years Montana's surface water quality standards have
been revised. Policies for establishing permit levels for ammonia, chlorine
residuals, and oil and grease have been modified. This includes eliminating
the need to chlorinate many wastewater treatment plant effluents during winter
months. New rules to implement the State's nondegradation law have been
orepared. Developments are routinely reviewed and monitored for potential
impacts to water quality. These include lakeshore subdivisions, new and
modified hydroelectric and other energy projects, new and modified mining
develooraents and new discharges.
It is estimated that over $50 million worth of work needs to be done to -
uoqrade Montana's wastewater treatment facilities. Montana's major wastewater
treatment funding needs should be met, however, if all construction grant
funds currently authorized through FY 1985 are appropriated by Congress.
During the last two years, more than $38 million has been provided to local
governments for the construction of wastewater treatment facilities to improve
water quality and protect public health. Studies are continuing to identify
water quality problems attributable to wastewater treatment discharges. It is
estimated that eight municipal treatment plans are causing some degree of
ammonia toxicity to aquatic life in streams receiving the discharges. Mining
and milling activities and petroleum refining activities provide the more
significant industrial point source discharges in the State.
Most of Montana's water quality problems result from nonpoint sources of
oollution. Agricultural, mining, and forestry related activities are the
principal land use oractices which impact Montana water quality. This
includes; acid mine drainage and toxic metal contamination from mining
activities; accelerated erosion and stream sedimentation from hydrologic
modifications and improper land management; and excess sediment, nutrients,
pesticides and other contaminants from runoff. Planning, technical
assistance, and educational efforts which define and disseminate information
on the relation of land .use to water quality have been the chief mechanism
used to address these nonpoint pollution problems. Sharing in thesa efforts
are the Water Quality Bureau, one of the four original areawide planning
organizations, several Indian tribes, and a host of local, State and Federal
governmental agencies.
- 10 -
image:
 - 11 -
image:
- 11 -
image:
 68
Success in correcting nonpoint source problems is limited by difficulties
in implementing changes to long standing and accepted land use practices, and
lack of funds for implementation. Important funding sources to implement
better land management practices include the Department of Agriculture's
Agricultural Conservation Program and Small Watershed Program, and the State
of Montana's Renewable Resource Development and Water Development Program.
EPA's Superfund Program and the Department of Interior Office of Surface
Mining's Abandoned Mine'.and Reclamation Program offer some hope for
correcting water quality problems resulting from abandoned mining operations.
Oewatering of streams in Montana contributes to water quality
degradation. Oe*atering reduces a stream's dilution capacity and decreases
biotic habitat. Dewatering is primarily caused by irrigation withdrawals.
This is most noticeable on the Beaverhead, Bitterroot, West Gallatin, Big Hole
and Jefferson Rivers, although it occurs on many other stream segments.
The Deoartment of Health and Environmental Sciences has been awarded an
instream flow reservation on the Yellowstone River for the purpose of
orotecting oublic water supplies. Water development projects on the
Yellowstone are monitored to ensure compatibility with the instream
reservation. Efforts to develop a similar instream flow reservation on the
Clark Fork River have been halted since a downstream hydroelectric water right
serves to orotect instream flows.
Montana's severest groundwater problem results from saline seep. This
ohenomenon is caused by the dryland fanning practice of summer fallowing.
Excess soil moisture accumulates when vegetation is removed, and the moisture
leaches salts from the .soil and salinizes groundwater. Surface waters also
become salinized by this ohenomenon when the salinized groundwater feeds them.
Thera are areas in Montana that have very high environmental value. One
of these areas is the Flathead River Basin in northwest Montana which includes
Glacier National Park, Flathead lake (the largest lake west of the
Mississippi), several designated Wild and Scenic Rivers, the Flathead Valley,
and the Bob Marshall Wilderness area (the largest in the west). Proposed
major Canadian coal development, oil and gas development and other general
development activities threaten to degrade these nationally significant
resources. Accelerated nutrient contributions to Flathead lake from changed
land use and wastewater discharges are a specific concern.
A five year Congressionally authorized $2.6 million Flathead Basin
Environmental Impact Study has recently been completed. This study has
defined baseline conditions in the Basin and served to focus increased
attention and resources on maintaining the air, water quality, fisheries,
groundwater, wildlife and general high environmental values of the area. The
Montana legislature is expected to create a Flathead Basin commission to
protect this resource.
- 12 -
image:
68
Success in correcting nonpoint source problems is limited by difficulties
in implementing changes to long standing and accepted land use practices, and
lack of funds for implementation. Important funding sources to implement
better land management practices include the Department of Agriculture's
Agricultural Conservation Program and Small Watershed Program, and the State
of Montana's Renewable Resource Development and Water Development Program.
EPA's Superfund Program and the Department of Interior Office of Surface
Mining's Abandoned Mine'.and Reclamation Program offer some hope for
correcting water quality problems resulting from abandoned mining operations.
Oewatering of streams in Montana contributes to water quality
degradation. Oe*atering reduces a stream's dilution capacity and decreases
biotic habitat. Dewatering is primarily caused by irrigation withdrawals.
This is most noticeable on the Beaverhead, Bitterroot, West Gallatin, Big Hole
and Jefferson Rivers, although it occurs on many other stream segments.
The Deoartment of Health and Environmental Sciences has been awarded an
instream flow reservation on the Yellowstone River for the purpose of
orotecting oublic water supplies. Water development projects on the
Yellowstone are monitored to ensure compatibility with the instream
reservation. Efforts to develop a similar instream flow reservation on the
Clark Fork River have been halted since a downstream hydroelectric water right
serves to orotect instream flows.
Montana's severest groundwater problem results from saline seep. This
ohenomenon is caused by the dryland fanning practice of summer fallowing.
Excess soil moisture accumulates when vegetation is removed, and the moisture
leaches salts from the .soil and salinizes groundwater. Surface waters also
become salinized by this ohenomenon when the salinized groundwater feeds them.
Thera are areas in Montana that have very high environmental value. One
of these areas is the Flathead River Basin in northwest Montana which includes
Glacier National Park, Flathead lake (the largest lake west of the
Mississippi), several designated Wild and Scenic Rivers, the Flathead Valley,
and the Bob Marshall Wilderness area (the largest in the west). Proposed
major Canadian coal development, oil and gas development and other general
development activities threaten to degrade these nationally significant
resources. Accelerated nutrient contributions to Flathead lake from changed
land use and wastewater discharges are a specific concern.
A five year Congressionally authorized $2.6 million Flathead Basin
Environmental Impact Study has recently been completed. This study has
defined baseline conditions in the Basin and served to focus increased
attention and resources on maintaining the air, water quality, fisheries,
groundwater, wildlife and general high environmental values of the area. The
Montana legislature is expected to create a Flathead Basin commission to
protect this resource.
- 12 -
image:
 Point Source Dischargers to Priority Stream Segments -
125
COLORADO
Stream Segment with
Impaired Use
Point Source
Discharger
NPOES
Compliance
Status
1. South P1 atta River
from Hampden to Henderson
2. South Platte River
from Henderson to Kersey
3. Clear Creek front Idaho
Springs to Youngfield
4. St. Vrain Creek from
Longmont to mouth
5. Big Thompson River
from Love!and to mouth
5. Cache La Poudre River
from Ft. Collins to mouth
7. Arkansas River from
1-25 to La Junta
3. Fountain Creek from
Monument to mouth
Littleton/Englevvood
Boulder WWTP
Idaho Springs WWT?
Longmont WWTP
Love land WWTP
Eastman Kodak
Greeley WWTP
Pueblo WWTP
Colorado Springs
WWTP
C
NC
C
- 69 -
image:
Point Source Dischargers to Priority Stream Segments -
125
COLORADO
Stream Segment with
Impaired Use
Point Source
Discharger
NPOES
Compliance
Status
1. South P1 atta River
from Hampden to Henderson
2. South Platte River
from Henderson to Kersey
3. Clear Creek front Idaho
Springs to Youngfield
4. St. Vrain Creek from
Longmont to mouth
5. Big Thompson River
from Love!and to mouth
5. Cache La Poudre River
from Ft. Collins to mouth
7. Arkansas River from
1-25 to La Junta
3. Fountain Creek from
Monument to mouth
Littleton/Englevvood
Boulder WWTP
Idaho Springs WWT?
Longmont WWTP
Love land WWTP
Eastman Kodak
Greeley WWTP
Pueblo WWTP
Colorado Springs
WWTP
C
NC
C
- 69 -
image:
 126
9. San Miguel River from Union Carbida Corp. C
Norwood Canyon to mouth
- 70 -
image:
126
9. San Miguel River from Union Carbida Corp. C
Norwood Canyon to mouth
- 70 -
image:
 127
Point Source Dischargers to Priority Stream Segments
MONTANA
Stream Segment with
Impaired Use
Point Source
Discharger
NPOES
Compli ance
Status
1* Silver Bow Creek
2... &ridc]z-J^a
be!CM E. Helena
3, Ashley Creek
4. Crow Creek
5. Clark Fork River
from Warm Springs
to Garrison
5. Whitefish River
below Whitefish Lake
7. Jefferson River
8. Clark Fork River
fro-n Garrison to
Banner
Butte WWTP
c
-c-:.
E. Helena WWTP
Kali is pell WWTP
Ronan WWTP
Anaconda WWTP
' Butte WWTP
Oeer Lodge WWTP
Warm Spring WWTP
Whitefish WWTP
Whitehall WWTP
Threa Forks IMP
Anaconda WWT?
Butte VfifTP
Deer Lodge Wl-fTP
Warm Spring WWTP
image:
127
Point Source Dischargers to Priority Stream Segments
MONTANA
Stream Segment with
Impaired Use
Point Source
Discharger
NPOES
Compli ance
Status
1* Silver Bow Creek
2... &ridc]z-J^a
be!CM E. Helena
3, Ashley Creek
4. Crow Creek
5. Clark Fork River
from Warm Springs
to Garrison
5. Whitefish River
below Whitefish Lake
7. Jefferson River
8. Clark Fork River
fro-n Garrison to
Banner
Butte WWTP
c
-c-:.
E. Helena WWTP
Kali is pell WWTP
Ronan WWTP
Anaconda WWTP
' Butte WWTP
Oeer Lodge WWTP
Warm Spring WWTP
Whitefish WWTP
Whitehall WWTP
Threa Forks IMP
Anaconda WWT?
Butte VfifTP
Deer Lodge Wl-fTP
Warm Spring WWTP
image:
 Point Source Dischargers to Priority Stream Segments
128
MONTANA
Stream Segment with
Impaired Use
Point Source
Discharger
NPDES
Compliance
Status
9. Beaver Creek below
Wibaux. -
10. Willow Creek
11. Yellowstone River from
Laurel to Custer
12. Big Spring Creek
13. Seaverhead River below
Dillon '
14-. Boulder River below
Basin - - .-
15. Madison River
16. Kootenai River below
Libby Oam
Wibaux WWTP
Browning WWTP
Laurel WWTP
Billings WWTP
Lewistown WWTP
Dillon WWTP
Boulder WWTP
Ennis WWTP
Libby WWTP
N<
image:
Point Source Dischargers to Priority Stream Segments
128
MONTANA
Stream Segment with
Impaired Use
Point Source
Discharger
NPDES
Compliance
Status
9. Beaver Creek below
Wibaux. -
10. Willow Creek
11. Yellowstone River from
Laurel to Custer
12. Big Spring Creek
13. Seaverhead River below
Dillon '
14-. Boulder River below
Basin - - .-
15. Madison River
16. Kootenai River below
Libby Oam
Wibaux WWTP
Browning WWTP
Laurel WWTP
Billings WWTP
Lewistown WWTP
Dillon WWTP
Boulder WWTP
Ennis WWTP
Libby WWTP
N<
image:
 Point Source Dischargers to Priority Stream Segments
129
NORTH DAKOTA
Stream Segment with
Impaired Use
Point Source
Discharger
NPDES
Compliance
Status 2.
1. Souris River from
.confluence_with. Des-lacs- :. -.;>:
River to confluence with
Deep River
2. Red River from confluence
with Wild Rice River to
confluence with Sheyenne
River
3. Heart River from
headwaters to confluence
with' Green River
Velva HWTP
-lov/ner: -WWTP_:~:
Mi not WVfTP
Moorhead WWTP
Dickinson NWTP
Bel field
1. These include only major permittees
2. "C" - In compliance with NPDES Permit
"MC" - Hon-Complianca with 'iPOES Permit
- 73 -
image:
Point Source Dischargers to Priority Stream Segments
129
NORTH DAKOTA
Stream Segment with
Impaired Use
Point Source
Discharger
NPDES
Compliance
Status 2.
1. Souris River from
.confluence_with. Des-lacs- :. -.;>:
River to confluence with
Deep River
2. Red River from confluence
with Wild Rice River to
confluence with Sheyenne
River
3. Heart River from
headwaters to confluence
with' Green River
Velva HWTP
-lov/ner: -WWTP_:~:
Mi not WVfTP
Moorhead WWTP
Dickinson NWTP
Bel field
1. These include only major permittees
2. "C" - In compliance with NPDES Permit
"MC" - Hon-Complianca with 'iPOES Permit
- 73 -
image:
 130
Point Source Dischargers to-Priority Stream Segments
SOUTH DAKOTA
Stream Segment with
Impaired Use
Point Source
Discharger
NPDES
Compliance
Status
1. Lower Cheyenne River
from confluence, with
Belle Fourche River to
Oahe Dam
2. Upper Cheyenne River
from Wyoming border to
Angostora Reservoir
3. Sell a Fourche River
from Whitewood Creek
to confluence with the
Cheyenne River
4. Middle Whitewood
Creak from Lead to
Bella Fourche River
ccn'luencG
Homestake WWTP
St. Regis Paper Co.
Whitewood Post & Pole
Strawberry Hill Mining
Co.
Edgemont VIWTP
Newcastle, Wyoming, WWTP
Homes take Mining, Co.
Whitewood WWTP
St. Regis Paper
Co. Whitewood Post
& Pole Homes take
NC
image:
130
Point Source Dischargers to-Priority Stream Segments
SOUTH DAKOTA
Stream Segment with
Impaired Use
Point Source
Discharger
NPDES
Compliance
Status
1. Lower Cheyenne River
from confluence, with
Belle Fourche River to
Oahe Dam
2. Upper Cheyenne River
from Wyoming border to
Angostora Reservoir
3. Sell a Fourche River
from Whitewood Creek
to confluence with the
Cheyenne River
4. Middle Whitewood
Creak from Lead to
Bella Fourche River
ccn'luencG
Homestake WWTP
St. Regis Paper Co.
Whitewood Post & Pole
Strawberry Hill Mining
Co.
Edgemont VIWTP
Newcastle, Wyoming, WWTP
Homes take Mining, Co.
Whitewood WWTP
St. Regis Paper
Co. Whitewood Post
& Pole Homes take
NC
image:
 - 131
Mining Co. Lead
-Deadwood WWT? c
Kirk Power Plant NC (TSS)
Strawberry Hill
Mining Co.
- 75 -
image:
- 131
Mining Co. Lead
-Deadwood WWT? c
Kirk Power Plant NC (TSS)
Strawberry Hill
Mining Co.
- 75 -
image:
 Point Source Dischargers to Priority Stream Segments
132.
SOUTH DAKOTA
Stream Segment with
Impaired Use
Point Source
Discharger
NPOES
Compliance
Status
5. Vermin ion River
Headwaters to confluence
with the Missouri River
6. Lower James River
frail Mi 11 town to
Mayfield
7. Upper James River
fro-n N.O. border to
Huron
Centerville WWTP
Vermillion WWTP
Chancellor WWTP
Howard WWTP
Salem WWTP
Scotland WWTP
Menno WWTP
Wolf Craek WWTP .
Maxwell Colony WWTP
Parkston WWTP
Redfield WWTP
Stratford WWTP
Aberdeen WWTP
Huron WWTP
Ashton WWT?
Westport WWTP
c
c
c
c
- 76 -
image:
Point Source Dischargers to Priority Stream Segments
132.
SOUTH DAKOTA
Stream Segment with
Impaired Use
Point Source
Discharger
NPOES
Compliance
Status
5. Vermin ion River
Headwaters to confluence
with the Missouri River
6. Lower James River
frail Mi 11 town to
Mayfield
7. Upper James River
fro-n N.O. border to
Huron
Centerville WWTP
Vermillion WWTP
Chancellor WWTP
Howard WWTP
Salem WWTP
Scotland WWTP
Menno WWTP
Wolf Craek WWTP .
Maxwell Colony WWTP
Parkston WWTP
Redfield WWTP
Stratford WWTP
Aberdeen WWTP
Huron WWTP
Ashton WWT?
Westport WWTP
c
c
c
c
- 76 -
image:
 133
Point Source Dischargers to Priority Stream Segments
SOUTH DAKOTA
Stream Segment with
Impaired Use
Point Source
Discharger
NPDES
Compliance
Status
8. Turtle Creek
9. White River from NEB
border to the Missouri
River
10. Little White River from
headwaters to White
River confluence
11. Missouri River from
Big Send Dam to Pierre
1"2. Lower Big Sioux
River from Sioux Falls
to Missouri River
Redfield WWTP
Fine Ridge WWTP
ftertfn WWTP
Rosebud WWTP
White River WWTP
Pierre WWTP
Ft. Pierre WWTP
Sioux Falls WWTP
John Morrell WWTP
Brandon WWTP
Alcestor WWT?
Eros Canton Livestock
Sales
Sioux Falls Stockyards
NC (BOD),
C (TSS)
C
NC
- 77 -
image:
133
Point Source Dischargers to Priority Stream Segments
SOUTH DAKOTA
Stream Segment with
Impaired Use
Point Source
Discharger
NPDES
Compliance
Status
8. Turtle Creek
9. White River from NEB
border to the Missouri
River
10. Little White River from
headwaters to White
River confluence
11. Missouri River from
Big Send Dam to Pierre
1"2. Lower Big Sioux
River from Sioux Falls
to Missouri River
Redfield WWTP
Fine Ridge WWTP
ftertfn WWTP
Rosebud WWTP
White River WWTP
Pierre WWTP
Ft. Pierre WWTP
Sioux Falls WWTP
John Morrell WWTP
Brandon WWTP
Alcestor WWT?
Eros Canton Livestock
Sales
Sioux Falls Stockyards
NC (BOD),
C (TSS)
C
NC
- 77 -
image:
 134
13. Upper Big Sioux Ball Rapids VWTP C
River from Watertown Watertov/n WWTP C
to Sioux Falls Castlewood WWTP
Estelline WWTP
14. Rapid Creek from Rapid City WWTP C
Dark Canyon to Cheyenne
River confluence
- 78 -
image:
134
13. Upper Big Sioux Ball Rapids VWTP C
River from Watertown Watertov/n WWTP C
to Sioux Falls Castlewood WWTP
Estelline WWTP
14. Rapid Creek from Rapid City WWTP C
Dark Canyon to Cheyenne
River confluence
- 78 -
image:
 135
B-3: WETLANDS
Wetlands in general vary greatly and a recently developed classification
system attempts to make distinctions between the various wetland types.1
In EPA Region VIII there are numerous wetland types with various functions,
recognized as beneficial to the public. Broad general descriptions of Region
VIII wetlands include:
Prairie Potholes - This system of open marshes is in the
Northcentral United States and Southcentral Canada. These
"potholes" range in size from a few square yards to hundreds of
acres, and have been called the "duck factory", as their most
obvious function is providing breeding, nesting, feeding, and
resting habitat for millions of waterfowl. Less obvious functions
include floodwater retention, groundwater recharge, entrapment of
sediment, stock watering, and habitat for numerous life forms, both
aquatic and upland species.
Riparian Wetlands - Practically every stream in Region VIII has
wetlands associated with it. Such wetlands provide a filter for
surface runoff, preventing entry of many pollutants into streams and
thereby helping to maintain instream water quality. They may also
exhibit many or all of the functions generally ascribed to wetlands.
Montane Wetlands - Located in the high country, these wetlands are
often the principal contributors to the headwaters of major
streams. They provide habitat for many species of mountain dwelling
wildlife.
Lacustrine Wetlands - These wetlands border the lakes of our region,
providing a gradual transition between open water and upland. In
addition to the numerous functions already mentioned, they protect
lake shores against erosion resulting from waves created by wind or
boat wakes.
The size of a wetland is not necessarily a factor in determining its
value. Far more important are the condition and location of the wetland.
Wetlands may easily be altered by persons to improve their overall functional
values (enhancement) or changed to perform a desired function more
efficiently, often at the expense of other functions. Wetlands are dynamic
systems, and respond rapidly to external changes, both natural and human
induced. What may appear to be a minor external change can have significant
and far reaching effects on a wet!and1 s functional value.
1 Cowardin, Lewis M. et al., Classification of Wetlands and Deepwater
Habitats of the United States, FWS/08S-79/31.
- 79 -
image:
135
B-3: WETLANDS
Wetlands in general vary greatly and a recently developed classification
system attempts to make distinctions between the various wetland types.1
In EPA Region VIII there are numerous wetland types with various functions,
recognized as beneficial to the public. Broad general descriptions of Region
VIII wetlands include:
Prairie Potholes - This system of open marshes is in the
Northcentral United States and Southcentral Canada. These
"potholes" range in size from a few square yards to hundreds of
acres, and have been called the "duck factory", as their most
obvious function is providing breeding, nesting, feeding, and
resting habitat for millions of waterfowl. Less obvious functions
include floodwater retention, groundwater recharge, entrapment of
sediment, stock watering, and habitat for numerous life forms, both
aquatic and upland species.
Riparian Wetlands - Practically every stream in Region VIII has
wetlands associated with it. Such wetlands provide a filter for
surface runoff, preventing entry of many pollutants into streams and
thereby helping to maintain instream water quality. They may also
exhibit many or all of the functions generally ascribed to wetlands.
Montane Wetlands - Located in the high country, these wetlands are
often the principal contributors to the headwaters of major
streams. They provide habitat for many species of mountain dwelling
wildlife.
Lacustrine Wetlands - These wetlands border the lakes of our region,
providing a gradual transition between open water and upland. In
addition to the numerous functions already mentioned, they protect
lake shores against erosion resulting from waves created by wind or
boat wakes.
The size of a wetland is not necessarily a factor in determining its
value. Far more important are the condition and location of the wetland.
Wetlands may easily be altered by persons to improve their overall functional
values (enhancement) or changed to perform a desired function more
efficiently, often at the expense of other functions. Wetlands are dynamic
systems, and respond rapidly to external changes, both natural and human
induced. What may appear to be a minor external change can have significant
and far reaching effects on a wet!and1 s functional value.
1 Cowardin, Lewis M. et al., Classification of Wetlands and Deepwater
Habitats of the United States, FWS/08S-79/31.
- 79 -
image:
 136
EPA has substantial responsibilities under the Section 404 program.
These include:
1. Working with the Corps of Engineers (COE) in developing 4Q4(b)(l)
Guidelines.
2. Reviewing proposed projects for compliance with the Section
4Q4(b)(l) Guidelines and submitting comments to the Corps,
3. Under Section 404(c), EPA has ultimate authority to veto permits
based on certain environmental criteria (one case).
4. In conjunction with the state and Corps, EPA can designate
geographic areas where permit decisions will normally be known in
advance, therefore reducing delays.
5. EPA is to assist in development of state regulations for the
assumption of the Section 404 permit program to afford the same
level of environmental protection while reducing federal involvement.
5. EPA has the authority to halt unauthorized discharges.
7. EPA can identify the boundary line of navigable waters.
Modification,, degradation, and destruction of wetlands- in Region VIII
stems mainly from increasing and expanding agricultural development,
industrial and residential development, recreational development, and dam
construction. Prairie potholes are most seriously affected by agricultural
development through filling and/or draining of these-wetlands. Industrial and
residential development has been responsbile for varying degrees of impact on
wetlands in the more populous areas of Colorado and Utah. Wetlands bordering
large lakes and riparian wetlands in mountain areas have mainly been affected
by recreational development. Large dams for generation of electricity, flood
control, and municipal and industrial water storage results in the filling and
inundation of many acres of riparian wetlands.
In recent years the increased interest in wetlands as a valuable natural
resource has led to an increased and intensified amount of research and
scientific study of these land forms. The knowledge gained from these studies
should provide the backbone for the proper and necessary policies and
legislation to administer the programs which affect wetlands.
- 80 -
image:
136
EPA has substantial responsibilities under the Section 404 program.
These include:
1. Working with the Corps of Engineers (COE) in developing 4Q4(b)(l)
Guidelines.
2. Reviewing proposed projects for compliance with the Section
4Q4(b)(l) Guidelines and submitting comments to the Corps,
3. Under Section 404(c), EPA has ultimate authority to veto permits
based on certain environmental criteria (one case).
4. In conjunction with the state and Corps, EPA can designate
geographic areas where permit decisions will normally be known in
advance, therefore reducing delays.
5. EPA is to assist in development of state regulations for the
assumption of the Section 404 permit program to afford the same
level of environmental protection while reducing federal involvement.
5. EPA has the authority to halt unauthorized discharges.
7. EPA can identify the boundary line of navigable waters.
Modification,, degradation, and destruction of wetlands- in Region VIII
stems mainly from increasing and expanding agricultural development,
industrial and residential development, recreational development, and dam
construction. Prairie potholes are most seriously affected by agricultural
development through filling and/or draining of these-wetlands. Industrial and
residential development has been responsbile for varying degrees of impact on
wetlands in the more populous areas of Colorado and Utah. Wetlands bordering
large lakes and riparian wetlands in mountain areas have mainly been affected
by recreational development. Large dams for generation of electricity, flood
control, and municipal and industrial water storage results in the filling and
inundation of many acres of riparian wetlands.
In recent years the increased interest in wetlands as a valuable natural
resource has led to an increased and intensified amount of research and
scientific study of these land forms. The knowledge gained from these studies
should provide the backbone for the proper and necessary policies and
legislation to administer the programs which affect wetlands.
- 80 -
image:
 137
Future needs for wetland protection are:
1. Additional scientific knowledge about wetland functions and
physiography,
2. Improved administrative measures to reduce any burden on the
regulated public'wMle assuring a high level of protection for
wetlands,
3. Increasing the education of the public about wetland values, and
4. Providing the public with practical means of reducing impacts on
wetlands.
Wetland protection must come from the joint efforts of an informed
public, the diligence of governmental agencies, and the foresight and
consciousness of legislators and policy makers.
GENERAL COMMENTS _ON .THE SECTION 404 PROGRAM
In a recent study, the loss of both inland and coastal wetlands has been
shown to be a serious trend nationally with 400 thousand acres of coastal
marshes, 6 million acres of forested wetlands, 400 thousand acres of shrub
wetlands, and 4.7 million acres of inland marshes being lost between the mid
1950s and the mid 1970s. One of the areas of the most severe loses of inland
wetlands in the nation-was the prairie pothole region of North and South
Dakota. Both of these states are within Region VIII 's area.
The prairie potholes provide critical habitat for waterfowl breeding and
are believed to contribute to the groundwater supplies. Wetland areas
adjacent to waterways which are above the headwaters occur in all states.
These wetland areas perform valuable functions including habitat for waterfowl
and other animal species, breeding areas for fish species, water quality
benefits, areas for the attenuation of flood water peaks, and in some cases,
recharge areas for aquifers.
Since the data for this study was collected, the Corps of Engineers has
promulgated new regulations (33 CFR Parts 320-330, July 22, 1982) which allow
dredge and fill activities in closed basins and areas above the headwaters of
the watercourse under a Nationwide permit. The conditions and best management
practicies specified in the Nationwide permit have not proven to be effective
in protecting these areas and the valuable functions that they perform.
- 81 -
image:
137
Future needs for wetland protection are:
1. Additional scientific knowledge about wetland functions and
physiography,
2. Improved administrative measures to reduce any burden on the
regulated public'wMle assuring a high level of protection for
wetlands,
3. Increasing the education of the public about wetland values, and
4. Providing the public with practical means of reducing impacts on
wetlands.
Wetland protection must come from the joint efforts of an informed
public, the diligence of governmental agencies, and the foresight and
consciousness of legislators and policy makers.
GENERAL COMMENTS _ON .THE SECTION 404 PROGRAM
In a recent study, the loss of both inland and coastal wetlands has been
shown to be a serious trend nationally with 400 thousand acres of coastal
marshes, 6 million acres of forested wetlands, 400 thousand acres of shrub
wetlands, and 4.7 million acres of inland marshes being lost between the mid
1950s and the mid 1970s. One of the areas of the most severe loses of inland
wetlands in the nation-was the prairie pothole region of North and South
Dakota. Both of these states are within Region VIII 's area.
The prairie potholes provide critical habitat for waterfowl breeding and
are believed to contribute to the groundwater supplies. Wetland areas
adjacent to waterways which are above the headwaters occur in all states.
These wetland areas perform valuable functions including habitat for waterfowl
and other animal species, breeding areas for fish species, water quality
benefits, areas for the attenuation of flood water peaks, and in some cases,
recharge areas for aquifers.
Since the data for this study was collected, the Corps of Engineers has
promulgated new regulations (33 CFR Parts 320-330, July 22, 1982) which allow
dredge and fill activities in closed basins and areas above the headwaters of
the watercourse under a Nationwide permit. The conditions and best management
practicies specified in the Nationwide permit have not proven to be effective
in protecting these areas and the valuable functions that they perform.
- 81 -
image:
 138
Previous Section 404 regulations provided only limited protection to
these areas, particularly the Prairie Pothole region, since they did not
control wetland drainage. The current regulations do not afford even that
limited protection since they do not provide for review to determine if there
is compliance with the Nationwide Permit conditions. The continued
application of the Nationwide Permits and the associated conditions on such
wide scale areas as closed basins and all wetlands adjacent to waterways above
the headwaters provides for neither the maintenance nor the restoration of the
chemical, physical, and biological integrity of the Nation's waters. Until
these areas are provided some degree of protection, the goals of the Clean
tfater Act will not be met.
B-4: COLORADO RIVER SALINITY
Salinity (total dissolved solids) is recognized as the major basinwide
water quality problem in the Colorado River system. The salinity issues are
of concern to the seven basin states (Wyoming, Utah, Colorado, New Mexico,
Nevada, Arizona, and California), three EPA Regions (VI, VIII, IX), and the
Departments of Interior and Agriculture. In addition, several Presidents of
Mexico have expressed concern about the salinity of the water being delivered
to Mexico. The United States has treaty obligations, limiting the salinity of
the waters delivered to Mexico.
Salinity in the- Colorado River is the result of both natural processes" "
and the human activities. Salinity concentrations are affected through salt
loading (such as irrigation return flows and land use disturbances) and
through salt concentration (such as diversions of high quality water and
reservoir evaporation). Virtually any water and/or land use activity can
potentially impact salinity.
Salinity control is charged with controversy. Following seven
enforcement conferences which began in the early 1960's and promulgation of
salinity standards by EPA, the seven basin states acting through the Salinity
Control Forum developed and adopted salinity standards in 1975. These
standards included three numeric criteria and a plan for implementation. The
numeric criteria are all on the lower main stem of the River (723 mg/1 below
Hoover Dam, 747 mg/1 below Parker Dam, and 879 mg/1 at Imperial Dam). The
implementation plan calls for construction of Federal Salinity Control
projects, placing effluent limitations on industrial and municipal discharges,
inclusion of 208 Water Quality Management Plans and various state actions.
- 82 -
image:
138
Previous Section 404 regulations provided only limited protection to
these areas, particularly the Prairie Pothole region, since they did not
control wetland drainage. The current regulations do not afford even that
limited protection since they do not provide for review to determine if there
is compliance with the Nationwide Permit conditions. The continued
application of the Nationwide Permits and the associated conditions on such
wide scale areas as closed basins and all wetlands adjacent to waterways above
the headwaters provides for neither the maintenance nor the restoration of the
chemical, physical, and biological integrity of the Nation's waters. Until
these areas are provided some degree of protection, the goals of the Clean
tfater Act will not be met.
B-4: COLORADO RIVER SALINITY
Salinity (total dissolved solids) is recognized as the major basinwide
water quality problem in the Colorado River system. The salinity issues are
of concern to the seven basin states (Wyoming, Utah, Colorado, New Mexico,
Nevada, Arizona, and California), three EPA Regions (VI, VIII, IX), and the
Departments of Interior and Agriculture. In addition, several Presidents of
Mexico have expressed concern about the salinity of the water being delivered
to Mexico. The United States has treaty obligations, limiting the salinity of
the waters delivered to Mexico.
Salinity in the- Colorado River is the result of both natural processes" "
and the human activities. Salinity concentrations are affected through salt
loading (such as irrigation return flows and land use disturbances) and
through salt concentration (such as diversions of high quality water and
reservoir evaporation). Virtually any water and/or land use activity can
potentially impact salinity.
Salinity control is charged with controversy. Following seven
enforcement conferences which began in the early 1960's and promulgation of
salinity standards by EPA, the seven basin states acting through the Salinity
Control Forum developed and adopted salinity standards in 1975. These
standards included three numeric criteria and a plan for implementation. The
numeric criteria are all on the lower main stem of the River (723 mg/1 below
Hoover Dam, 747 mg/1 below Parker Dam, and 879 mg/1 at Imperial Dam). The
implementation plan calls for construction of Federal Salinity Control
projects, placing effluent limitations on industrial and municipal discharges,
inclusion of 208 Water Quality Management Plans and various state actions.
- 82 -
image:
 139
In the Colorado RiverJ3asi n Sali nity Control Act (PL 93-320), Congress
authorized construction" of" ~a desalting complex to Improve the quality of water
delivered to Mexico as well as projects and programs for implementing salinity
control throughout the basin. Despite the Congressional mandate, only limited
imolementation has actually occurred under PL 93-320. The escalating cost of
the projects, as formulated by the Department of Interior, have been a serious
impediment to construction of the control projects. Salinity control is
further complicated by the fact that the Clean Water Act provides little
regulatory authority for controlling the major causes of salinity. Progress
is being made through the U.S. Department of Agriculture on-farm salinity
control orograms which are among the most cost-effective approaches for
controlling salinity.
Current salinity damages in the Lower Sasin are approximately $113
million per year and are estimated by the Department of Interior to rise to
$267 million per year by the year 2010 if adequate salinity control projects
are not implemented.
The principal EPA programs, under authority of the Clean Water Act,
dealing with salinity control are: (1) Water Quality Management Planning, (2)
Water Quality standards, and (3) the National Pollutant Discharge Elimination
System (NPDES) Permits. Primary implementation of these programs is largely
delegated to the States; however, EPA retains oversight and approval
resoonsibilities. Because salinity is an inter-State and inter-National
issue, EPA's oversight responsibilities are especially critical.
Additional EPA activities include providing program support and guidance
for State and Forum salinity control activities. Examples of these activities
include allocating 208 funds to help establish the Salinity Control Forum's
Executive Director position, presenting testimony before Congress in support
of the cooperative, basin-wide salinity control efforts, and working with
individual states to assist in implementation of state salinity control
activities.
Through EPA's responsibilities under the National Environmental Policy
Act (NEPA), Environmental Impact Statements are reviewed for numerous impacts
including salinity. EPA encourages alternatives which minimize and mitigate
adverse salinity impacts through various approaches including water
conservation and industrial use of saline water.
EPA has worked closely with the Bureau of Reclamation on the deep-well
injection alternative for brine disposal in the Paradox Valley Salinity
Control Project. EPA's involvement has occurred primarily as a result of
EPA's responsibilities under NEPA and the Safe Drinking Water Act. Deep well
injection appears feasible and may save from $50 to $60 million over the plan
originally proposed by the Bureau of Reclamation.
- 83 -
image:
139
In the Colorado RiverJ3asi n Sali nity Control Act (PL 93-320), Congress
authorized construction" of" ~a desalting complex to Improve the quality of water
delivered to Mexico as well as projects and programs for implementing salinity
control throughout the basin. Despite the Congressional mandate, only limited
imolementation has actually occurred under PL 93-320. The escalating cost of
the projects, as formulated by the Department of Interior, have been a serious
impediment to construction of the control projects. Salinity control is
further complicated by the fact that the Clean Water Act provides little
regulatory authority for controlling the major causes of salinity. Progress
is being made through the U.S. Department of Agriculture on-farm salinity
control orograms which are among the most cost-effective approaches for
controlling salinity.
Current salinity damages in the Lower Sasin are approximately $113
million per year and are estimated by the Department of Interior to rise to
$267 million per year by the year 2010 if adequate salinity control projects
are not implemented.
The principal EPA programs, under authority of the Clean Water Act,
dealing with salinity control are: (1) Water Quality Management Planning, (2)
Water Quality standards, and (3) the National Pollutant Discharge Elimination
System (NPDES) Permits. Primary implementation of these programs is largely
delegated to the States; however, EPA retains oversight and approval
resoonsibilities. Because salinity is an inter-State and inter-National
issue, EPA's oversight responsibilities are especially critical.
Additional EPA activities include providing program support and guidance
for State and Forum salinity control activities. Examples of these activities
include allocating 208 funds to help establish the Salinity Control Forum's
Executive Director position, presenting testimony before Congress in support
of the cooperative, basin-wide salinity control efforts, and working with
individual states to assist in implementation of state salinity control
activities.
Through EPA's responsibilities under the National Environmental Policy
Act (NEPA), Environmental Impact Statements are reviewed for numerous impacts
including salinity. EPA encourages alternatives which minimize and mitigate
adverse salinity impacts through various approaches including water
conservation and industrial use of saline water.
EPA has worked closely with the Bureau of Reclamation on the deep-well
injection alternative for brine disposal in the Paradox Valley Salinity
Control Project. EPA's involvement has occurred primarily as a result of
EPA's responsibilities under NEPA and the Safe Drinking Water Act. Deep well
injection appears feasible and may save from $50 to $60 million over the plan
originally proposed by the Bureau of Reclamation.
- 83 -
image:
 140
Section 201 of the Colorado River Salinity Control Act (PL 93-320)
requires the EPA, the Department of the Interior, and the Department of
Agriculture, "...cooperate and coordinate their activities effectively to
carry out the objective of this title." The Sasin States and several federal
agencies (Bureau of Reclamation and Soil Conservation Services) have suggested
that to eomoly with their requirements EPA should be more involved in the
olanning and development of Federal Salinity control projects.
EPA Region VIII has been designated the lead to coordinate the activities
of Regions VI, VII, IX, and Headquarters and to represent EPA in the
activities of the Colorado River Sasin Salinity Control Forum and the
Interagency Salinity Control Coordinating Committee.
3-5: ACID DEPOSITION/WATER QUALITY CONCERNS
The potential water quality impacts of acid deposition in Region VIII are
of concern because of the increasing evidence of acid precipitation and the
limited natural buffering capacities of many lakes in the region. The
critical importance of high altitude watersheds as sources of municipal water
supplies and the significance of these watersheds and high altitude lakes as
recreational resources (critical to tourism-based economics) makes a better
understanding of ongoing and ootential water quality impacts of acid
deposition a significant environmental concern.
APPENDIX C. POLICY AND PROCEDURES
C-l: ADVANCED TREATMENT REVIEW
Under Congressional directives for the use of the annual construction
grants program appropriations (FY 1979, 80, 81, 82, 83), grant funds may be
used to construct new advanced treatment (AT) facilities with incremental AT
costs of greater than S3 million, only if the Administrator personally
determines that advanced treatment is required and will result in significant
water quality and public health improvement.
EPA interpreted this directive in the form of a Program Requirement
Memorandum issued on March 9, 1979 (PRM-79-7). On June 20, 1980, the Agency
published proposed revisions to the PRM in the Federal Register; however, the
revisions were not officially implemented.
- 84 -
image:
140
Section 201 of the Colorado River Salinity Control Act (PL 93-320)
requires the EPA, the Department of the Interior, and the Department of
Agriculture, "...cooperate and coordinate their activities effectively to
carry out the objective of this title." The Sasin States and several federal
agencies (Bureau of Reclamation and Soil Conservation Services) have suggested
that to eomoly with their requirements EPA should be more involved in the
olanning and development of Federal Salinity control projects.
EPA Region VIII has been designated the lead to coordinate the activities
of Regions VI, VII, IX, and Headquarters and to represent EPA in the
activities of the Colorado River Sasin Salinity Control Forum and the
Interagency Salinity Control Coordinating Committee.
3-5: ACID DEPOSITION/WATER QUALITY CONCERNS
The potential water quality impacts of acid deposition in Region VIII are
of concern because of the increasing evidence of acid precipitation and the
limited natural buffering capacities of many lakes in the region. The
critical importance of high altitude watersheds as sources of municipal water
supplies and the significance of these watersheds and high altitude lakes as
recreational resources (critical to tourism-based economics) makes a better
understanding of ongoing and ootential water quality impacts of acid
deposition a significant environmental concern.
APPENDIX C. POLICY AND PROCEDURES
C-l: ADVANCED TREATMENT REVIEW
Under Congressional directives for the use of the annual construction
grants program appropriations (FY 1979, 80, 81, 82, 83), grant funds may be
used to construct new advanced treatment (AT) facilities with incremental AT
costs of greater than S3 million, only if the Administrator personally
determines that advanced treatment is required and will result in significant
water quality and public health improvement.
EPA interpreted this directive in the form of a Program Requirement
Memorandum issued on March 9, 1979 (PRM-79-7). On June 20, 1980, the Agency
published proposed revisions to the PRM in the Federal Register; however, the
revisions were not officially implemented.
- 84 -
image:
 141
EPA is revising its policy relative to advanced treatment funding. The
final draft of a new policy statement was released for Regional review on
December 17, 1982. Publication of the final policy in the Federal Register is
exoected soon. Some significant issues addressed in the December 17, 1982
draft AT policy, which will affect Region VIII relate to the following
criteria:
1. Scientific data, information, and analyses must document an existing
impairment of a designated use or a use impairment that would result
without the project.
2. A reasonable relationship has been scientifically established
between the impairment of a designated use and pollutant loadings.
3. The additional reduction of pollutant loadings resulting from
construction and proper operation of the AT facility will make a
substantial contribution toward the restoration of the designated
use or will prevent impairment of a designated use by the proposed
project.
4. All other point source discharges that contribute pollutants
resulting in the use impairment of the affected waterbody are
regulated under the National Pollutant Discharge Elimination System
(NPDES).
5. Provisions have been made to implement those nonpoint source
pollution controls considered necessary for restoring a designated
use, and such orovisions are included in a certified and approved
water quality management plan.
For the purpose of AT reviews, the December 17, 1982 draft policy defines
secondary treatment as a treatment level meeting effluent limitations for five
day biochemical oxygen demand (8005) and suspended solids (SS) of 30/30 mg/1
on a maximum monthly average basis or as 85 percent removal of these
parameters, whichever is more stringent (40 CFR Part 133). A proposed project
designed to meet other definitions of secondary treatment (e.g. 25/25 mg/1
30D/SS) are not subject to reviews, if the more stringent level of effluent
quality is required by state regulation, and secondary treatment technologies
are proposed to achieve these levels. Projects that provide treatment more
stringent than secondary treatment or provide treatment for removal of ammonia
or phosphorus are referred to as advanced treatment (AT) projects. For the
purposes of this policy, an AT project shall be defined as any project that:
(a) is required in order to meet effluent limitations for 800 or S3 less than
30 mg/1 (30-day average), or (b) is required in order to meet effluent
limitations for the removal of ammonia or phosphorus.
- 85 -
image:
141
EPA is revising its policy relative to advanced treatment funding. The
final draft of a new policy statement was released for Regional review on
December 17, 1982. Publication of the final policy in the Federal Register is
exoected soon. Some significant issues addressed in the December 17, 1982
draft AT policy, which will affect Region VIII relate to the following
criteria:
1. Scientific data, information, and analyses must document an existing
impairment of a designated use or a use impairment that would result
without the project.
2. A reasonable relationship has been scientifically established
between the impairment of a designated use and pollutant loadings.
3. The additional reduction of pollutant loadings resulting from
construction and proper operation of the AT facility will make a
substantial contribution toward the restoration of the designated
use or will prevent impairment of a designated use by the proposed
project.
4. All other point source discharges that contribute pollutants
resulting in the use impairment of the affected waterbody are
regulated under the National Pollutant Discharge Elimination System
(NPDES).
5. Provisions have been made to implement those nonpoint source
pollution controls considered necessary for restoring a designated
use, and such orovisions are included in a certified and approved
water quality management plan.
For the purpose of AT reviews, the December 17, 1982 draft policy defines
secondary treatment as a treatment level meeting effluent limitations for five
day biochemical oxygen demand (8005) and suspended solids (SS) of 30/30 mg/1
on a maximum monthly average basis or as 85 percent removal of these
parameters, whichever is more stringent (40 CFR Part 133). A proposed project
designed to meet other definitions of secondary treatment (e.g. 25/25 mg/1
30D/SS) are not subject to reviews, if the more stringent level of effluent
quality is required by state regulation, and secondary treatment technologies
are proposed to achieve these levels. Projects that provide treatment more
stringent than secondary treatment or provide treatment for removal of ammonia
or phosphorus are referred to as advanced treatment (AT) projects. For the
purposes of this policy, an AT project shall be defined as any project that:
(a) is required in order to meet effluent limitations for 800 or S3 less than
30 mg/1 (30-day average), or (b) is required in order to meet effluent
limitations for the removal of ammonia or phosphorus.
- 85 -
image:
 142
All AT projects with an Incremental capital cost for AT in excess of $3
million and not otherwise exempted, must be approved by the EPA Administrator
in order to receive a Step 3 grant.
All AT projects with an incremental capital cost for AT of $3 million or
less must be approved by the Regional Administrator (RA) in order to receive a
Step 3 grant. The RA may delegate the AT project review responsibility to
States with 205(g) delegation for the review of facilities plans.
The final draft AT review policy emphasizes the need for a rigorous
justification of the water quality and oublic health improvements derived from
AT projects. This change reflects both the likelihood that the availability
of construction grant funds will be limited and the need to use limited funds
on the attainment of significant water quality or public health improvements.
The significance of improvements resulting from an AT project will be assessed
in terms of contributions to restoring designated uses or preventing their
impairment. The AT project review criteria will require a demonstration that
there is an existing impairment of a designated use or that a use impairment
would result without the proposed AT processes, the establishment of a
reasonable scientific relationship between the impairment and pollutant
loadings, and a demonstration that each AT process will make a substantial
contribution to the restoration- of a designated use or prevent the impairment
of a designated use by the project. The policy statement thus reflects
program initiatives that require demonstration of a substantial contribution
towards the restoration of designated uses. Showing only improvements in
chemical water quality parameters may not suffice because other factors such
as man-made physical or hydro!ogic modifications of a stream or intermittent
flows may restrict or prevent use attainment. For each project, funding
decisions will be based upon the best available scientific information and the
best orofessional judgment of the responsible official, regarding the extent
to which the project meets the review criteria. Specific factors for
conducting AT reviews, for example, averaging periods, critical flows, and
mixing zones used in wasteload allocation studies, are described in guidance
documents which are being developed.
The draft AT oolicy is unclear in its effect on state water quality
standards, the basic regulatory mechanism for determining the beneficial uses
to be protected and the water quality levels necessary to protect them for
each body of water. The standards include designated uses and criteria
established to orotect each use. AT project reviews are not anticipated to
substitute for EPA's required review of water quality standards, because the
AT reviews are eradicated on a different objective, are project-specific, and
result in an EPA funding decision. Although the reviews may raise questions
about the impact of a State standard on discharges in a segment, a separate
State-initiated action is necessary to review and revise the standards.
- 86 -
image:
142
All AT projects with an Incremental capital cost for AT in excess of $3
million and not otherwise exempted, must be approved by the EPA Administrator
in order to receive a Step 3 grant.
All AT projects with an incremental capital cost for AT of $3 million or
less must be approved by the Regional Administrator (RA) in order to receive a
Step 3 grant. The RA may delegate the AT project review responsibility to
States with 205(g) delegation for the review of facilities plans.
The final draft AT review policy emphasizes the need for a rigorous
justification of the water quality and oublic health improvements derived from
AT projects. This change reflects both the likelihood that the availability
of construction grant funds will be limited and the need to use limited funds
on the attainment of significant water quality or public health improvements.
The significance of improvements resulting from an AT project will be assessed
in terms of contributions to restoring designated uses or preventing their
impairment. The AT project review criteria will require a demonstration that
there is an existing impairment of a designated use or that a use impairment
would result without the proposed AT processes, the establishment of a
reasonable scientific relationship between the impairment and pollutant
loadings, and a demonstration that each AT process will make a substantial
contribution to the restoration- of a designated use or prevent the impairment
of a designated use by the project. The policy statement thus reflects
program initiatives that require demonstration of a substantial contribution
towards the restoration of designated uses. Showing only improvements in
chemical water quality parameters may not suffice because other factors such
as man-made physical or hydro!ogic modifications of a stream or intermittent
flows may restrict or prevent use attainment. For each project, funding
decisions will be based upon the best available scientific information and the
best orofessional judgment of the responsible official, regarding the extent
to which the project meets the review criteria. Specific factors for
conducting AT reviews, for example, averaging periods, critical flows, and
mixing zones used in wasteload allocation studies, are described in guidance
documents which are being developed.
The draft AT oolicy is unclear in its effect on state water quality
standards, the basic regulatory mechanism for determining the beneficial uses
to be protected and the water quality levels necessary to protect them for
each body of water. The standards include designated uses and criteria
established to orotect each use. AT project reviews are not anticipated to
substitute for EPA's required review of water quality standards, because the
AT reviews are eradicated on a different objective, are project-specific, and
result in an EPA funding decision. Although the reviews may raise questions
about the impact of a State standard on discharges in a segment, a separate
State-initiated action is necessary to review and revise the standards.
- 86 -
image:
 143
EPA's proposed water quality standards regulation, among other things,
will allow States to perform analyses to determine whether designated uses are
attainable and if the standards reflect site-specific conditions. In
determining whether a proposed AT project meets the criterion of making a
substantial contribution toward restoration of a designated use or prevention
of a use impairment that would occur without the project, the AT project
review will take into account use attainability analyses. The Clean Water
Act, as amended, requires that the applicable water quality standards for all
construction grant related water bodies be thoroughly reviewed by December 29,
1984. Federal funding will not otherwise be allowed for the facilities.
The most controvert!al water quality parameter being scrutinized in the
AT reviews is ammonia. Due to the significant uncertainties concerning the
acute and chronic effects of ammonia on freshwater aquatic life, AT facilities
proposed solely for the purpose of preventing ammonia toxicity will be
approved only if the following has been demonstrated:
1. Site specific biological data show that designated uses cannot be
restored (or impairment prevented) without reducing ammonia
toxicity; or,
2. bioassay data (e».g*» either laboratory or from a similar site) for
resident species show that existing or future ammonia toxicity
levels will impair beneficial use attainment.
(Aopendix C, Table 1) identifies those projects in Region VIII which may
require AT reviews this year. A majority of them are associated with ammonia
control. The states and Region VIII will have to devote a considerable amount
of time and resources to these project reviews in order to justify their
funding. Unfortunately, much of the required data (chemical, flow,
biological, etc.) is not presently available to facilitate an expeditious, yet
credible AT review. It is strongly recommended that Region VIII support the
research needs outlined below to assist the states in AT reviews for ammonia
control.
- 87 -
image:
143
EPA's proposed water quality standards regulation, among other things,
will allow States to perform analyses to determine whether designated uses are
attainable and if the standards reflect site-specific conditions. In
determining whether a proposed AT project meets the criterion of making a
substantial contribution toward restoration of a designated use or prevention
of a use impairment that would occur without the project, the AT project
review will take into account use attainability analyses. The Clean Water
Act, as amended, requires that the applicable water quality standards for all
construction grant related water bodies be thoroughly reviewed by December 29,
1984. Federal funding will not otherwise be allowed for the facilities.
The most controvert!al water quality parameter being scrutinized in the
AT reviews is ammonia. Due to the significant uncertainties concerning the
acute and chronic effects of ammonia on freshwater aquatic life, AT facilities
proposed solely for the purpose of preventing ammonia toxicity will be
approved only if the following has been demonstrated:
1. Site specific biological data show that designated uses cannot be
restored (or impairment prevented) without reducing ammonia
toxicity; or,
2. bioassay data (e».g*» either laboratory or from a similar site) for
resident species show that existing or future ammonia toxicity
levels will impair beneficial use attainment.
(Aopendix C, Table 1) identifies those projects in Region VIII which may
require AT reviews this year. A majority of them are associated with ammonia
control. The states and Region VIII will have to devote a considerable amount
of time and resources to these project reviews in order to justify their
funding. Unfortunately, much of the required data (chemical, flow,
biological, etc.) is not presently available to facilitate an expeditious, yet
credible AT review. It is strongly recommended that Region VIII support the
research needs outlined below to assist the states in AT reviews for ammonia
control.
- 87 -
image:
 144
Table C-l. Potential Advance Treatment Projects in Region VIII
Receiving
Water
Problem
Parameter
Population
Served (Design)
Montana
Missoula
Kalispell
South Dakota
Centerville
Custer
Huron
Mil bank
Rapid City
Vermin ion
Watertown
Wyomi ng
Casper
Saggs
Utah
Central Valley
Orem
Bear Lake
Coalville
Oak Fork
Ashley Creek
to Flathead
Lake
Vemn'llion River
French Creek
James River
Whetstone River
Rapid Creek
Vermillion River
Big Sioux River
N. Platte
Little Snake
River
Jordan River
Powell's Slough
Bear Lake
Weber River
NH3
nutrients
NH3
NH3
NH3
NH3
NH3
NH3
NH3
NH3
NH3, DO
NH3, DO
NH3
Nutrients
Nutrients
NH3
46,800
32,500
940
20,000
15,000
5,050
72,600
15,700
23,300
125,000
412
394,000
77,654
11,389
1,294
- 38 -
image:
144
Table C-l. Potential Advance Treatment Projects in Region VIII
Receiving
Water
Problem
Parameter
Population
Served (Design)
Montana
Missoula
Kalispell
South Dakota
Centerville
Custer
Huron
Mil bank
Rapid City
Vermin ion
Watertown
Wyomi ng
Casper
Saggs
Utah
Central Valley
Orem
Bear Lake
Coalville
Oak Fork
Ashley Creek
to Flathead
Lake
Vemn'llion River
French Creek
James River
Whetstone River
Rapid Creek
Vermillion River
Big Sioux River
N. Platte
Little Snake
River
Jordan River
Powell's Slough
Bear Lake
Weber River
NH3
nutrients
NH3
NH3
NH3
NH3
NH3
NH3
NH3
NH3
NH3, DO
NH3, DO
NH3
Nutrients
Nutrients
NH3
46,800
32,500
940
20,000
15,000
5,050
72,600
15,700
23,300
125,000
412
394,000
77,654
11,389
1,294
- 38 -
image:
 145
C-2: ANTIDEGRADATION
All six states in Region VIII have antidegradation policies very similar
to that described in 40 CFR 35.1550. Two states (Montana and South Dakota)
prescribe antidegradation rules by statute. The remaining state's
antidegradation policies are contained in regulations. Colorado, Montana,
Utah and Wyoming have special policies related to nondegradation, a policy
very similar to that of EPA's related Outstanding National Resources Water.
Such water bodies are specifically classified by the states as unique and
identified as such within their water quality standards. iNo change is allowed
in existing quality.
Imolementing control regulations on high quality waters, i.e. those with
quality better than the 1983 goals, has been difficult in Region VIII. Many
of the water bodies in Region VIII are of high quality and the Region is in
the process of developing a procedure to: 1) define existing quality through
a comouterized, flow-weighted analysis, and 2) define significant change in
existing quality. Because most of our (State, USGS and EPA) monitoring
efforts have been concentrated in areas where we have water quality problems,
the lack of water quality data and flow monitoring are frustrating our efforts
in high quality areas.
Table 2. show the existing high quality waters in Region VIII. Because
of their unique characteristics and the impending natural resources
development anticioated within -the respective watersheds, the states in Region
VIII consider these water as priority water bodies. Region VIII supports the
state's oosition.
C-3: SITE-SPECIFIC CRITERIA/USE ATTAINABP.ITY STUDIES
States will no longer be required to review all of their standards
statewide every three years. Rather, States are encouraged to focus their
resources on analyzing their standards for priority water bodies where one or
more stringent controls are needed to attain designated uses.
Priority water bodies are identified in accordance with the revised
regulation for water quality management planning (40 CFR Part 130), guidance
for state preparation of Section 305(b) reports, and the State's Continuing
Planning Process (CPP). In addition to the water quality standards review,
priority water quality areas will be selected for establishing total maximum
daily loads and waste load allocations, special reviews for major permits,
developing construction grant priority lists and focusing monitoring,
enforcement and reporting efforts. Priority areas may include those areas
where advanced treatment (AT) and combined sewer overflow (CSO) funding
decisions are pending, new or reissuances of major water quality permits are
scheduled, or toxics have been identified or are suspected of precluding a use
or may be posing an unreasonable risk to human health.
- 89 -
image:
145
C-2: ANTIDEGRADATION
All six states in Region VIII have antidegradation policies very similar
to that described in 40 CFR 35.1550. Two states (Montana and South Dakota)
prescribe antidegradation rules by statute. The remaining state's
antidegradation policies are contained in regulations. Colorado, Montana,
Utah and Wyoming have special policies related to nondegradation, a policy
very similar to that of EPA's related Outstanding National Resources Water.
Such water bodies are specifically classified by the states as unique and
identified as such within their water quality standards. iNo change is allowed
in existing quality.
Imolementing control regulations on high quality waters, i.e. those with
quality better than the 1983 goals, has been difficult in Region VIII. Many
of the water bodies in Region VIII are of high quality and the Region is in
the process of developing a procedure to: 1) define existing quality through
a comouterized, flow-weighted analysis, and 2) define significant change in
existing quality. Because most of our (State, USGS and EPA) monitoring
efforts have been concentrated in areas where we have water quality problems,
the lack of water quality data and flow monitoring are frustrating our efforts
in high quality areas.
Table 2. show the existing high quality waters in Region VIII. Because
of their unique characteristics and the impending natural resources
development anticioated within -the respective watersheds, the states in Region
VIII consider these water as priority water bodies. Region VIII supports the
state's oosition.
C-3: SITE-SPECIFIC CRITERIA/USE ATTAINABP.ITY STUDIES
States will no longer be required to review all of their standards
statewide every three years. Rather, States are encouraged to focus their
resources on analyzing their standards for priority water bodies where one or
more stringent controls are needed to attain designated uses.
Priority water bodies are identified in accordance with the revised
regulation for water quality management planning (40 CFR Part 130), guidance
for state preparation of Section 305(b) reports, and the State's Continuing
Planning Process (CPP). In addition to the water quality standards review,
priority water quality areas will be selected for establishing total maximum
daily loads and waste load allocations, special reviews for major permits,
developing construction grant priority lists and focusing monitoring,
enforcement and reporting efforts. Priority areas may include those areas
where advanced treatment (AT) and combined sewer overflow (CSO) funding
decisions are pending, new or reissuances of major water quality permits are
scheduled, or toxics have been identified or are suspected of precluding a use
or may be posing an unreasonable risk to human health.
- 89 -
image:
 .- .-.,^.....,—..,,-..-.. - -, . -- -. —. - — — ""~J4£
//}B>LE C,~x " Cofawdo 'Aniidegradav** Se^wex',
/T. South Plate c Basin
/ Bear Creek above Perry Park Reservoir
e2. All waters in-Rocky Mountain National Park (sons exceptions)
3 All waters in Indian Peaks Wilderness
7- All waters in Mount Zirkel Wilderness
•^ All waters in Rawah Wilderness
*C% Arkansas Basin
/ Ricardo Creek. '
£. South Huerfano .Creek above Cascade Craek
<^. Mo Grande Basin • ^
/ All waters in Weminuche Wilderness
,2. All waters in La Garita Wilderness
& Conejos Rivar, source to outlet Platoro Reservoir including
mainsteo. of the South Fork
f( Los Pir.os
>5"- Cascade Creek
6. Osier Creek
>? Colorado River Basin
/ All waters in Gore-Eagles Nest Wilderness
2., All waters in Rocky 1-fountain National Park
\5. All waters in Indian Peaks Wilderness
'A All waters in Snowraass-Maroon Balls Wilderness
i5f All waters in Hunter— Fryingpan Wilderness
£, Yampa and White River Basins
/ All waters in Mount Zirkel Wilderness
3. Elk River above Glen Eden • '
3. Little Snake River on National Forest land in Routt County
% Trapper Creek
& Korthwater Creek
£ Trapper lake and Tributaries thereto
r. San Juan and Dolores Basin
/All waters in-Weninuche Wilderness
3- Piedra River above Indian Creek
J5 All waters in the Lizard Head Wilderness
or Gunnison Basin
/ Gunnison River froo Crystal Reservoir to one axle below
Smith Fork
^. All waters in La Garita Wilderness
3- All waters in Big Blue Wilderness
y. All waters in Mount Sneffels Wilderness
v57All waters in W-jst Elk, Collegiate Peaks, I-'aroon Bolls,
Ragged and Oh-Be-Joyful Wildernesses
- 90 -
image:
.- .-.,^.....,—..,,-..-.. - -, . -- -. —. - — — ""~J4£
//}B>LE C,~x " Cofawdo 'Aniidegradav** Se^wex',
/T. South Plate c Basin
/ Bear Creek above Perry Park Reservoir
e2. All waters in-Rocky Mountain National Park (sons exceptions)
3 All waters in Indian Peaks Wilderness
7- All waters in Mount Zirkel Wilderness
•^ All waters in Rawah Wilderness
*C% Arkansas Basin
/ Ricardo Creek. '
£. South Huerfano .Creek above Cascade Craek
<^. Mo Grande Basin • ^
/ All waters in Weminuche Wilderness
,2. All waters in La Garita Wilderness
& Conejos Rivar, source to outlet Platoro Reservoir including
mainsteo. of the South Fork
f( Los Pir.os
>5"- Cascade Creek
6. Osier Creek
>? Colorado River Basin
/ All waters in Gore-Eagles Nest Wilderness
2., All waters in Rocky 1-fountain National Park
\5. All waters in Indian Peaks Wilderness
'A All waters in Snowraass-Maroon Balls Wilderness
i5f All waters in Hunter— Fryingpan Wilderness
£, Yampa and White River Basins
/ All waters in Mount Zirkel Wilderness
3. Elk River above Glen Eden • '
3. Little Snake River on National Forest land in Routt County
% Trapper Creek
& Korthwater Creek
£ Trapper lake and Tributaries thereto
r. San Juan and Dolores Basin
/All waters in-Weninuche Wilderness
3- Piedra River above Indian Creek
J5 All waters in the Lizard Head Wilderness
or Gunnison Basin
/ Gunnison River froo Crystal Reservoir to one axle below
Smith Fork
^. All waters in La Garita Wilderness
3- All waters in Big Blue Wilderness
y. All waters in Mount Sneffels Wilderness
v57All waters in W-jst Elk, Collegiate Peaks, I-'aroon Bolls,
Ragged and Oh-Be-Joyful Wildernesses
- 90 -
image:
 image:
 . Montana "Nondegradation" Stream Segments*
148
1. Headwater tributaries of Marias, Teton, and Sun Rivers in Bob
Marshall/Great Bear Wilderness Areas
2. Post Creek
- all water in Montana National Bison Range
3. Middle Fork F lathe ad River - left bank tributaries in Glacier National
Park
4. South Fork Flathead River - in Bob Marshall Wilderness area
5. Flathead River
right bank tributaries in Glacier National
Park
6. Bitteroot River
right bank tributaries in Selwood
Bitteroot
Wilderness area as follows: Carleton
Creek, One Horse Creek, Sweeney
Creek, Bass Creek, Kootenai Creek,
Big Creek, Sweathouse Creek, Bear
Creek, Fred Burr/Sheafman/Mill Creeks,
- 92 -
image:
. Montana "Nondegradation" Stream Segments*
148
1. Headwater tributaries of Marias, Teton, and Sun Rivers in Bob
Marshall/Great Bear Wilderness Areas
2. Post Creek
- all water in Montana National Bison Range
3. Middle Fork F lathe ad River - left bank tributaries in Glacier National
Park
4. South Fork Flathead River - in Bob Marshall Wilderness area
5. Flathead River
right bank tributaries in Glacier National
Park
6. Bitteroot River
right bank tributaries in Selwood
Bitteroot
Wilderness area as follows: Carleton
Creek, One Horse Creek, Sweeney
Creek, Bass Creek, Kootenai Creek,
Big Creek, Sweathouse Creek, Bear
Creek, Fred Burr/Sheafman/Mill Creeks,
- 92 -
image:
 7. Saint Mary River
149
Blodgsll Creek, Canyon Creek
Sawtooth Creek, and Roaring Lion Creek;
also all waters in Ravalli
National Wildlife Refuge
in Glacier National Park
8. Belly River
- in Glacier National Park
9. Lamesteer Creek
- in Lamesteer National Wildlife Refuge
10. Yellowstone River
- in Yellowstone National Park
11. Midvale Creek
- in Glacier Nationa Park
12. Two Medicine River
- in Glacier National Park
13. Cut Bank Creek
- in Glacier National Park
14. Gallatin River
- Yellowstone National Park to headwaters
15. Madison River (Head of Missouri River) - in Yellowstone National Park
16. Headwaters Boulder River - in Beartooth Absaroka Wilderness Area
17. Headwaters Still water River - in Beartooth Absaroka Wilderness Area
13. Gardiner River - in Yellowstone National Park Wilderness Area
- 93 -
image:
7. Saint Mary River
149
Blodgsll Creek, Canyon Creek
Sawtooth Creek, and Roaring Lion Creek;
also all waters in Ravalli
National Wildlife Refuge
in Glacier National Park
8. Belly River
- in Glacier National Park
9. Lamesteer Creek
- in Lamesteer National Wildlife Refuge
10. Yellowstone River
- in Yellowstone National Park
11. Midvale Creek
- in Glacier Nationa Park
12. Two Medicine River
- in Glacier National Park
13. Cut Bank Creek
- in Glacier National Park
14. Gallatin River
- Yellowstone National Park to headwaters
15. Madison River (Head of Missouri River) - in Yellowstone National Park
16. Headwaters Boulder River - in Beartooth Absaroka Wilderness Area
17. Headwaters Still water River - in Beartooth Absaroka Wilderness Area
13. Gardiner River - in Yellowstone National Park Wilderness Area
- 93 -
image:
 150
19. Dearborn River - in Lincoln Scapegoat Wilderness Area
*Nondegradation applies to all waters in the state except that Board of Health
can allow degradation if it determines it is required by necessary economic
and social development. Board cannot allow degradation of waters in National
Parks and Wilderness areas.
- 94 -
image:
150
19. Dearborn River - in Lincoln Scapegoat Wilderness Area
*Nondegradation applies to all waters in the state except that Board of Health
can allow degradation if it determines it is required by necessary economic
and social development. Board cannot allow degradation of waters in National
Parks and Wilderness areas.
- 94 -
image:
 LO
to
C7)
image:
LO
to
C7)
image:
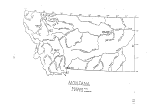 3.
Utah "Antidegradation" Streams
152'
1. Deer Creek
2. Calf Creek
3. Sand Creek
4. Manrie Creek
5. Sox Elder Creek
5. Deep Creek
7. Middle Fork Kays Creek
8, South Fork Kays Creek
9. Kays Creek
10. Holmes Creek
11. Sheoard Creek
12. F amington Creek
13. Steed Creek
14. Stone Creek
15. Barton; Creek
15. Mill Creek
17. North Canyon Creek
13. City Creek
19. Red Butte Creek
20. Emigration Creek
21. Parley's Creek
22. Big Cottonwood Creek -
- entire mains tern and tributaries
- entire mainstem and tributaries
- entire mains tan and tributaries
- entire mainstem and tributaries
- entrance of Cache National Forest to headwaters
(mainstem}
- all water on public lands in the Deep Creek
Mountai ns
- mainstem and drainage
- mainstem and drainage
- mainstem and drainage within Wasatch National
Forest
- from U.S. Highway 89 to headwaters
- entire length, mainstem and drainage
- from Haight Bench Canal Diversion to
headwaters, mainstem and drainage
- entrance of Wasatch National Forest to
headwaters, mainstem and drainage
• entrance of Wasatch National Forest to
headwaters, mainstem and drainage
• entire mainstem and drainage
• entrance into Wasatch National Forest to head-
waters, mainstem and drainage
• entire mainstem and drainage
• WWTP to headwaters, mainstem
• Foothill Blvd., SLC, to headwaters, mainstem and
drainage
• from Hogle Zoological Gardens to headwaters,
mainstem and drainage
• from 1300 East St. (0.2 miles from mouth) to
headwaters, mainstem and drainage
from Wasatch Blvd., to headwaters, mainstem and
drainage
- 96 -
image:
3.
Utah "Antidegradation" Streams
152'
1. Deer Creek
2. Calf Creek
3. Sand Creek
4. Manrie Creek
5. Sox Elder Creek
5. Deep Creek
7. Middle Fork Kays Creek
8, South Fork Kays Creek
9. Kays Creek
10. Holmes Creek
11. Sheoard Creek
12. F amington Creek
13. Steed Creek
14. Stone Creek
15. Barton; Creek
15. Mill Creek
17. North Canyon Creek
13. City Creek
19. Red Butte Creek
20. Emigration Creek
21. Parley's Creek
22. Big Cottonwood Creek -
- entire mains tern and tributaries
- entire mainstem and tributaries
- entire mains tan and tributaries
- entire mainstem and tributaries
- entrance of Cache National Forest to headwaters
(mainstem}
- all water on public lands in the Deep Creek
Mountai ns
- mainstem and drainage
- mainstem and drainage
- mainstem and drainage within Wasatch National
Forest
- from U.S. Highway 89 to headwaters
- entire length, mainstem and drainage
- from Haight Bench Canal Diversion to
headwaters, mainstem and drainage
- entrance of Wasatch National Forest to
headwaters, mainstem and drainage
• entrance of Wasatch National Forest to
headwaters, mainstem and drainage
• entire mainstem and drainage
• entrance into Wasatch National Forest to head-
waters, mainstem and drainage
• entire mainstem and drainage
• WWTP to headwaters, mainstem
• Foothill Blvd., SLC, to headwaters, mainstem and
drainage
• from Hogle Zoological Gardens to headwaters,
mainstem and drainage
• from 1300 East St. (0.2 miles from mouth) to
headwaters, mainstem and drainage
from Wasatch Blvd., to headwaters, mainstem and
drainage
- 96 -
image:
 23. Little Cottonwood Creek -
24. Bells Canyon Creek
25. South Fork Dry Creek
26. Little Willow Creek
27. Dry Creek
23. Rock Canyon Creek
29. Bridal Veil Falls
30. Lost Creek
31. Upper Falls
32. Sutrmit Creek
33, Twelvemile Creek
34. Mantl Creek
35. Eonraim Creak
35. Oak Creek
37-. Fountain Green Creek
38. East Fork Sevier
39. George Craek
40. Clear Creek
41. Strongs Canyon Creek
from VITP (Metro Lower Division) to head-
waters, mains tern and drainage
entire mainstem and drainage
mainstan and drainage
from entrance into Wasatch National Forest to
headwaters, mainstem and drainage
from entrance into Uinta National Forest to
headwaters, mainstem and drainage
from entrance into Uinta National Forest to
headwaters, mainstem and drainage
above Provo Diversion, mainstem and drainage
above Provo Diversion, mainstem and drainage
above Provo Diversion,, mainstem and drainage
mainstem and drainage in Uinta National Forest
mainstem and drainage in Manti-La Sal
National Forest
mainstem and drainage in Manti-La Sal Nationa;
Forest
mainstent and drainage in Manti-La Sal National
Forest
mainstem and drainage in Manti-La Sal National
Forest
mainstem and drainage in Uinta National Forest
from Tropic Diversion to headwaters, mainstem
and drainage
mainstem and drainage in Sawtooth National
Forest (12.5 miles from mouth)
Idaho-Utah State Line to headwaters, mainstem
and drainage
from entrance into Cache National Forest to
headwaters, mainstem and drainage
153
- 97 -
image:
23. Little Cottonwood Creek -
24. Bells Canyon Creek
25. South Fork Dry Creek
26. Little Willow Creek
27. Dry Creek
23. Rock Canyon Creek
29. Bridal Veil Falls
30. Lost Creek
31. Upper Falls
32. Sutrmit Creek
33, Twelvemile Creek
34. Mantl Creek
35. Eonraim Creak
35. Oak Creek
37-. Fountain Green Creek
38. East Fork Sevier
39. George Craek
40. Clear Creek
41. Strongs Canyon Creek
from VITP (Metro Lower Division) to head-
waters, mains tern and drainage
entire mainstem and drainage
mainstan and drainage
from entrance into Wasatch National Forest to
headwaters, mainstem and drainage
from entrance into Uinta National Forest to
headwaters, mainstem and drainage
from entrance into Uinta National Forest to
headwaters, mainstem and drainage
above Provo Diversion, mainstem and drainage
above Provo Diversion, mainstem and drainage
above Provo Diversion,, mainstem and drainage
mainstem and drainage in Uinta National Forest
mainstem and drainage in Manti-La Sal
National Forest
mainstem and drainage in Manti-La Sal Nationa;
Forest
mainstent and drainage in Manti-La Sal National
Forest
mainstem and drainage in Manti-La Sal National
Forest
mainstem and drainage in Uinta National Forest
from Tropic Diversion to headwaters, mainstem
and drainage
mainstem and drainage in Sawtooth National
Forest (12.5 miles from mouth)
Idaho-Utah State Line to headwaters, mainstem
and drainage
from entrance into Cache National Forest to
headwaters, mainstem and drainage
153
- 97 -
image:
 154
42. _3u_rchi Creek - from Harrison Blvd., (3.4 miles from mouth) to
headwatars, mains tarn and drainage
43. Sorinq Creek - from entrance into Cache National Forest to head
waters, mains tern and drainage
- 98 -
image:
154
42. _3u_rchi Creek - from Harrison Blvd., (3.4 miles from mouth) to
headwatars, mains tarn and drainage
43. Sorinq Creek - from entrance into Cache National Forest to head
waters, mains tern and drainage
- 98 -
image:
 IT)
in
r^S^P
I IN.,, .„., 1: -s-A~/-^j~* t
SI t
<
h-
'ZD
5
°~1
«-
R.
o-
X
a
./
-s
-3
-?
-8
-o
CTl .
CT) I
image:
IT)
in
r^S^P
I IN.,, .„., 1: -s-A~/-^j~* t
SI t
<
h-
'ZD
5
°~1
«-
R.
o-
X
a
./
-s
-3
-?
-8
-o
CTl .
CT) I
image:
 156
Wyoming "Antidegradation" Streams
(1) All surface watsrs located within the boundaries of National Parks;.
(2) All surface waters located within the boundaries of Congressional!./
designated Wilderness Areas.
(3) The main stem of the Snake River through its entire length above the
U.S. Highway 22 bridge (Wilson Bridge).
(4) The main stem of the Green River including the Green River Lakes
from the mount of the New Fork River upstream to the wilderness boundary.
(5) The main stem of the Wind River from the boundary of the Wind River
Indian Reservation upstream to Boysen Dam.
(6) The main stem of the North Platte River from the mouth of the Sage
Creek (approximately 15 stream miles below Saratoga, Wyoming) upstream to the
Colorado state line.
(7) The main stem of the North Platte River from the headwaters of
Pathfinder Reservoir upstream to Kortes Dam.
(8) The main stem of Sand Creek from the U.S. Highway 14 bridge upstream
to the lowermost boundary of the U.S. Fish and Wildlife Service Fish Genetics
Laboratory.
(9) The main stem of the Middle Fork of the Power River through its
entire length above the mouth of Buffalo Creek.
(10) The main stem of the Tongue River, the main tern of the North fork of
the Tongue River and the main stem of the South Fork of the Tongue River above
the U.S Forest Service boundary.
(11) The main stem of the Sweetwater River above the Alkali Creek.
(12) The main stem of the Encampment River from the U.S. Forest Service
boundary upstream to the Colorado state line.
(13) The main stem of the Clarks Fork River from the U.S. Forest Service
boundary upstream to the Montana state line.
(14) All waters within the Fish Creek (near Wilson, Wyoming) drainage.
(15) The main stem of Granite Creek (tributary of the Hoback River)
through its entire length.
(15) Fremont Lake.
- 100 -
image:
156
Wyoming "Antidegradation" Streams
(1) All surface watsrs located within the boundaries of National Parks;.
(2) All surface waters located within the boundaries of Congressional!./
designated Wilderness Areas.
(3) The main stem of the Snake River through its entire length above the
U.S. Highway 22 bridge (Wilson Bridge).
(4) The main stem of the Green River including the Green River Lakes
from the mount of the New Fork River upstream to the wilderness boundary.
(5) The main stem of the Wind River from the boundary of the Wind River
Indian Reservation upstream to Boysen Dam.
(6) The main stem of the North Platte River from the mouth of the Sage
Creek (approximately 15 stream miles below Saratoga, Wyoming) upstream to the
Colorado state line.
(7) The main stem of the North Platte River from the headwaters of
Pathfinder Reservoir upstream to Kortes Dam.
(8) The main stem of Sand Creek from the U.S. Highway 14 bridge upstream
to the lowermost boundary of the U.S. Fish and Wildlife Service Fish Genetics
Laboratory.
(9) The main stem of the Middle Fork of the Power River through its
entire length above the mouth of Buffalo Creek.
(10) The main stem of the Tongue River, the main tern of the North fork of
the Tongue River and the main stem of the South Fork of the Tongue River above
the U.S Forest Service boundary.
(11) The main stem of the Sweetwater River above the Alkali Creek.
(12) The main stem of the Encampment River from the U.S. Forest Service
boundary upstream to the Colorado state line.
(13) The main stem of the Clarks Fork River from the U.S. Forest Service
boundary upstream to the Montana state line.
(14) All waters within the Fish Creek (near Wilson, Wyoming) drainage.
(15) The main stem of Granite Creek (tributary of the Hoback River)
through its entire length.
(15) Fremont Lake.
- 100 -
image:
 ohh
image:
ohh
image:
 158
In selecting priority areas, states should also take into account the
"Municipal Wastewater Treatment Construction Grant Amendments of 1981" (P.I.
97-117, December 29, 1981). EPA interprets Section 24 of the Amendments as
requiring States to assure that water quality standards influencing
construction grant decisions have been reviewed in accordance with Section
303(c) of the Clean Water Act. It prohibits the issuance of a grant after
December 1984, unless the State has completed its review of the water quality
standard for any segments affected by the project grant (see Interim final
Rule 40 CFR 35.2111, 47 CFR 20450, May 12, 1982).
To comply with Section 24 on effluent limited segments no further water
quality standards review will be needed beyond the determination that the
segment is effluent limited. A more comprehensive review will be required for
water quality limited segments for which AT project application are
anticipated. The level of reivew is dependent on particular site-specific
conditions. This guidance describes analyses which states may find
appropriate in reviewing their water quality standard in detail.
A water body survey and assessment examines the physical, chemical, and
biological characteristics of the water body to identify and define the
existing uses of that water body. It is also used to determine whether the
designated uses in State water quality standards are impaired and to identify
the reasons why the uses are impaired. In addition, the water body survey and
assessment assists States in projecting what use the water body could support
in the absence of pollution and at various levels of pollution control for
point and nonpoint sources.
The data and information from the chemical sampling and analyses and
biological surveys collected as part of the water body survey and assessment
are used to develop site-specific criteria. In developing site-specific
criteria, the characteristics of the local water body are taken into account.
EPA's laboratory-derived criteria may not accurately reflect the toxicity of a
pollutant in a water body because of differences in temperature, p^, etc.
Similarly, adaptive processes may enable a viable, balanced community to exist
with levels of certain pollutants that exceed their national criteria. Region
VIII intends on conducting such an analysis on the Jordan River.
Total maximum daily loads and wasteload allocations are developed as part
of the evaluation of the attainability of various uses and control options.
Guidance on waste load allocations is not included here but is available in
draft from EPA.
- 102 -
image:
158
In selecting priority areas, states should also take into account the
"Municipal Wastewater Treatment Construction Grant Amendments of 1981" (P.I.
97-117, December 29, 1981). EPA interprets Section 24 of the Amendments as
requiring States to assure that water quality standards influencing
construction grant decisions have been reviewed in accordance with Section
303(c) of the Clean Water Act. It prohibits the issuance of a grant after
December 1984, unless the State has completed its review of the water quality
standard for any segments affected by the project grant (see Interim final
Rule 40 CFR 35.2111, 47 CFR 20450, May 12, 1982).
To comply with Section 24 on effluent limited segments no further water
quality standards review will be needed beyond the determination that the
segment is effluent limited. A more comprehensive review will be required for
water quality limited segments for which AT project application are
anticipated. The level of reivew is dependent on particular site-specific
conditions. This guidance describes analyses which states may find
appropriate in reviewing their water quality standard in detail.
A water body survey and assessment examines the physical, chemical, and
biological characteristics of the water body to identify and define the
existing uses of that water body. It is also used to determine whether the
designated uses in State water quality standards are impaired and to identify
the reasons why the uses are impaired. In addition, the water body survey and
assessment assists States in projecting what use the water body could support
in the absence of pollution and at various levels of pollution control for
point and nonpoint sources.
The data and information from the chemical sampling and analyses and
biological surveys collected as part of the water body survey and assessment
are used to develop site-specific criteria. In developing site-specific
criteria, the characteristics of the local water body are taken into account.
EPA's laboratory-derived criteria may not accurately reflect the toxicity of a
pollutant in a water body because of differences in temperature, p^, etc.
Similarly, adaptive processes may enable a viable, balanced community to exist
with levels of certain pollutants that exceed their national criteria. Region
VIII intends on conducting such an analysis on the Jordan River.
Total maximum daily loads and wasteload allocations are developed as part
of the evaluation of the attainability of various uses and control options.
Guidance on waste load allocations is not included here but is available in
draft from EPA.
- 102 -
image:
 159
In analyzing the attainability of uses, watar body survey and
assessments, site-specific criteria, waste load allocations and benefit-cost
assessments provide the basis for setting site-specific water quality
standards. NOT EVERY WATER QUALITY STANDARDS DECISION WILL REQUIRE THAT ALL
OF THE ANALYSES BE CONDUCTED. States may change or modify their water quality
standards if:
o criterion for particular pollutants ara more stringent than
necessary or are not stringent enough to protect a use;
o naturally occurring pollutant concentrations prevent the
attainment of the use;
o natural, ephemeral, intermittent or low flow conditions or
water levels prevent the propagation or survival of fish and
other aquatic life. However, these natural conditions may be
compensated for by the discharge of sufficient volume of
effluent to enable uses to be met;
o human diversions or other types of hydro!ogic modifications
interfere with the attainment of the use, and it is not
feasible to restore the water body to its original condition or
to operate such modification in a way that will maintain the use;
o physical conditions unrelated to water quality preclude
attainment of the use; or
In determining the level of detail necessary for a review of the. water
quality standards, it is useful to analyze and display those attributes of a
review which increase the complexity of the analyses. There may be issues
involving the scientific and technical or economic and social or institutional
and legal aspects of the review which increase the complexity of the review.
By way of example, the matrix in Figure i lists a number of attributes of a
water quality standards review which could increase its complexity. Hatch
marks or a description in the appropriate cells of the matrix may assist in
determining the overall approach or in highlighting a particular area of the
review that may require more detailed analysis.
- 103 -
image:
159
In analyzing the attainability of uses, watar body survey and
assessments, site-specific criteria, waste load allocations and benefit-cost
assessments provide the basis for setting site-specific water quality
standards. NOT EVERY WATER QUALITY STANDARDS DECISION WILL REQUIRE THAT ALL
OF THE ANALYSES BE CONDUCTED. States may change or modify their water quality
standards if:
o criterion for particular pollutants ara more stringent than
necessary or are not stringent enough to protect a use;
o naturally occurring pollutant concentrations prevent the
attainment of the use;
o natural, ephemeral, intermittent or low flow conditions or
water levels prevent the propagation or survival of fish and
other aquatic life. However, these natural conditions may be
compensated for by the discharge of sufficient volume of
effluent to enable uses to be met;
o human diversions or other types of hydro!ogic modifications
interfere with the attainment of the use, and it is not
feasible to restore the water body to its original condition or
to operate such modification in a way that will maintain the use;
o physical conditions unrelated to water quality preclude
attainment of the use; or
In determining the level of detail necessary for a review of the. water
quality standards, it is useful to analyze and display those attributes of a
review which increase the complexity of the analyses. There may be issues
involving the scientific and technical or economic and social or institutional
and legal aspects of the review which increase the complexity of the review.
By way of example, the matrix in Figure i lists a number of attributes of a
water quality standards review which could increase its complexity. Hatch
marks or a description in the appropriate cells of the matrix may assist in
determining the overall approach or in highlighting a particular area of the
review that may require more detailed analysis.
- 103 -
image:
 160
APPENDIX D. POSSIBLE REMEDIES FOR AND FEASIBILITY OF WATER QUALITY IMPROVEMENT
0-1: JORDAN RIVER USE ATTAINABILITY ANALYSIS
A major regionalization of sewage treatment facilities is underway In the
Jordan River Valley. Within Salt Lake County, 7 separate sewage treatment
facilities will be consolidated into two regional plants. These regional
plants (Central Valley and South Valley) will need to go beyond polished
secondary-based effluent limitations in order to meet Utah water quality
standards for the Jordan River. The South Valley Plant will discharge to a
segment of the Jordan River (Harrows Diversion-Little Cottonwood Creek) which
is classified for coldwater aquatic life, secondary contact recreation, and
agricultural use. The Central Valley Plant will discharge to a segment of the
Jordan River (Little Cottonwood Creek to North Temple Street) which is
classified for warmwater aquatic life, secondary contact recreation, and
agricultural use.
The pollutants of principal concern in both cases are total residual
chlorine, ammonia and the control of oxygen demanding substances (BOD, COD) in
order to meet dissolved oxygen criteria. Both treatment facilities have
identical NPDES permit limitations. Much of the work to establish these
limitations was completed during the early and mid-7Qs. Since that time,
substantial new information has been developed nationally on the effects of
ammonia, chlorine and dissolved oxygen upon warmwater species of aquatic life
and locally in Salt Lake County on the contribution of urban runoff to water
quality problems in the Jordan River. Additionally, the activities of the
Provo-Jordan River State Parkway has created an increased public interest in
the Jordan River.
The relative scarcity of sewage treatment plant construction funds
requires that the water quality benefits of each waste treatment dollar be
maximized. The study effort should be designed to determine the potential
use(s) for which the Jordan River could be managed given the anticipated
improvement in water quality associated with the new treatment facilities. To
identify those potential uses, it will be necessary to define the point at
which, flow and habitat vs. water quality limit the uses. In order to fulfill
this requirement, it is necessary that existing data pertaining to the Jordan
be evaluated, data gaps identified, any necessary additional data be collected
and appropriate water quality management decisions made. The first phase in
use attainability analysis is the review of existing data, the identification
of data gaps, and the development of recommendations for the collection of any
necessary additional data, with the estimated cost of collecting such data.
Subsequently, Region VIII intends to provide technical support in the
development of site-specific water quality criteria recommendations for the
Jordan River.
- 104 -
image:
160
APPENDIX D. POSSIBLE REMEDIES FOR AND FEASIBILITY OF WATER QUALITY IMPROVEMENT
0-1: JORDAN RIVER USE ATTAINABILITY ANALYSIS
A major regionalization of sewage treatment facilities is underway In the
Jordan River Valley. Within Salt Lake County, 7 separate sewage treatment
facilities will be consolidated into two regional plants. These regional
plants (Central Valley and South Valley) will need to go beyond polished
secondary-based effluent limitations in order to meet Utah water quality
standards for the Jordan River. The South Valley Plant will discharge to a
segment of the Jordan River (Harrows Diversion-Little Cottonwood Creek) which
is classified for coldwater aquatic life, secondary contact recreation, and
agricultural use. The Central Valley Plant will discharge to a segment of the
Jordan River (Little Cottonwood Creek to North Temple Street) which is
classified for warmwater aquatic life, secondary contact recreation, and
agricultural use.
The pollutants of principal concern in both cases are total residual
chlorine, ammonia and the control of oxygen demanding substances (BOD, COD) in
order to meet dissolved oxygen criteria. Both treatment facilities have
identical NPDES permit limitations. Much of the work to establish these
limitations was completed during the early and mid-7Qs. Since that time,
substantial new information has been developed nationally on the effects of
ammonia, chlorine and dissolved oxygen upon warmwater species of aquatic life
and locally in Salt Lake County on the contribution of urban runoff to water
quality problems in the Jordan River. Additionally, the activities of the
Provo-Jordan River State Parkway has created an increased public interest in
the Jordan River.
The relative scarcity of sewage treatment plant construction funds
requires that the water quality benefits of each waste treatment dollar be
maximized. The study effort should be designed to determine the potential
use(s) for which the Jordan River could be managed given the anticipated
improvement in water quality associated with the new treatment facilities. To
identify those potential uses, it will be necessary to define the point at
which, flow and habitat vs. water quality limit the uses. In order to fulfill
this requirement, it is necessary that existing data pertaining to the Jordan
be evaluated, data gaps identified, any necessary additional data be collected
and appropriate water quality management decisions made. The first phase in
use attainability analysis is the review of existing data, the identification
of data gaps, and the development of recommendations for the collection of any
necessary additional data, with the estimated cost of collecting such data.
Subsequently, Region VIII intends to provide technical support in the
development of site-specific water quality criteria recommendations for the
Jordan River.
- 104 -
image:
 161
Region VIII is in the orocess of identifying similiar study needs in South
Dakota, Wyoming and Colorado. With present resource limitations however, it
is highly unlikely that Region VIII will be able to actively participate in
more than the Jordan River study.
0-2: (NATIONWIDE URBAN RUNOFF PROJECT
The possible deleterious water quality effects of nonpoint sources in
general, and urban runoff in particular, were recognized by the Water
Pollution Control Act Amendments of 1972. Because of uncertainties about the
true significance of urban runoff as a contributor to receiving water quality
problems, Congress made treatment of separate stormwater discharges ineligible
for Federal funding when it enacted the Clean Water Act in 1977. To obtain
information that would help resolve these uncertainties, the Agency
established the Nationwide Urban Runoff Program in 1978. This five-year
program is intended to answer questions such as:
0 To what extent is urban runoff a contributor to water quality
problems across the nation?
0 What is the effectiveness of controls short of treatment in
reducing water quality problems where they exist?
0 Are best management practices for control of urban runoff cost
effective in comparison to alternative options?
Region VIII has three ongoing NURP projects: Rapid City, Salt lake City
and Denver. Significant results are already beginning to emerge from these
efforts.
Preliminary Findings/indicate the following: •
P.CE.UJT ANT .L.QADINS
The end product of the NURP program will provide quantitative expressions
of urban runoff quality as related to regional factors, seasonal factors, and
land use factors. Total suspended solids concentrations in urban runoff
appear to be lower than suggested by pre-NURP studies. About one-half of the
substances on EPA's oriority pollutant list occur in urban runoff. Heavy
metals, {especially lead, zinc, and copper) are much more prevalent than
organic priority pollutants. Some of the metals are present often enough and
in high enough concentrations to be considered threats to "beneficial uses".
- 105 -
image:
161
Region VIII is in the orocess of identifying similiar study needs in South
Dakota, Wyoming and Colorado. With present resource limitations however, it
is highly unlikely that Region VIII will be able to actively participate in
more than the Jordan River study.
0-2: (NATIONWIDE URBAN RUNOFF PROJECT
The possible deleterious water quality effects of nonpoint sources in
general, and urban runoff in particular, were recognized by the Water
Pollution Control Act Amendments of 1972. Because of uncertainties about the
true significance of urban runoff as a contributor to receiving water quality
problems, Congress made treatment of separate stormwater discharges ineligible
for Federal funding when it enacted the Clean Water Act in 1977. To obtain
information that would help resolve these uncertainties, the Agency
established the Nationwide Urban Runoff Program in 1978. This five-year
program is intended to answer questions such as:
0 To what extent is urban runoff a contributor to water quality
problems across the nation?
0 What is the effectiveness of controls short of treatment in
reducing water quality problems where they exist?
0 Are best management practices for control of urban runoff cost
effective in comparison to alternative options?
Region VIII has three ongoing NURP projects: Rapid City, Salt lake City
and Denver. Significant results are already beginning to emerge from these
efforts.
Preliminary Findings/indicate the following: •
P.CE.UJT ANT .L.QADINS
The end product of the NURP program will provide quantitative expressions
of urban runoff quality as related to regional factors, seasonal factors, and
land use factors. Total suspended solids concentrations in urban runoff
appear to be lower than suggested by pre-NURP studies. About one-half of the
substances on EPA's oriority pollutant list occur in urban runoff. Heavy
metals, {especially lead, zinc, and copper) are much more prevalent than
organic priority pollutants. Some of the metals are present often enough and
in high enough concentrations to be considered threats to "beneficial uses".
- 105 -
image:
 162
WATER .QWl.ITY .EFFECTS
Heavy metals aooear to be the urban runoff contaminants that have the
greatest potential for impacts on the aquatic life "beneficial use1*, little
is known, however, about the actual impacts because little research has been
done on influences of short tarm exposure of pollutants to aquatic life. The
available documentation indicates that suspended solids have an even greater
negative influence on aquatic life habitat than to metals. Priority organic
pollutants do not appear to pose a general threat to freshwater aquatic life,
but do pose a danger in the cases where drinking water intakes are directly
downstream from urban runoff channels.
CONTROL ..EFFECTIVENESS.
Recharge basins appear to be effective and economical in the treatment of
urban runoff, whereas street sweeping is an overall ineffective means of
treatment. Depending on the design, detention basins can be very effective in
removing suspended solids, heavy metals (especially copper), phosphorus, and
COD to some degree.
0-3: THE DILLON WATER BUBBLE
An innovative project exploring the opportunity for achieving water
quality standards while saving costs at wastewater treatment facilities has
begun in'Summit County, Colorado. The project is a unique proposal from the
Northwest Colorado Council of Governments (NWCOG) which would involve a
oollution trade-off between point sources and nonpoint sources. Both
contribute phosphorus into Dillon Reservoir, a main source for the Denver area
drinking water supply. Historically, the responsiblity for phosphorus control
rested solely on the shoulders of the point source dischargers into the
reservoir, even though nonpoint source contribution of total phosphorus is
more than 10 times the contribution from point sources. The proposed concept
would allow a discharger to gain "credit" in their NPDES permit if they can
document removal of phosphorus by a-nonpoint source control device owned and
operated by the discharger. The advantage to the local wastewater entity is
that they can avoid the need to invest in expensive and sophisticated
additions to their treatment facilities that are already treating to advanced
levels. At the same time, water quality standards are being achieved and
nonpoint source controls become institutionalized with a built-in incentive
for maintenance.
- 106 -
image:
162
WATER .QWl.ITY .EFFECTS
Heavy metals aooear to be the urban runoff contaminants that have the
greatest potential for impacts on the aquatic life "beneficial use1*, little
is known, however, about the actual impacts because little research has been
done on influences of short tarm exposure of pollutants to aquatic life. The
available documentation indicates that suspended solids have an even greater
negative influence on aquatic life habitat than to metals. Priority organic
pollutants do not appear to pose a general threat to freshwater aquatic life,
but do pose a danger in the cases where drinking water intakes are directly
downstream from urban runoff channels.
CONTROL ..EFFECTIVENESS.
Recharge basins appear to be effective and economical in the treatment of
urban runoff, whereas street sweeping is an overall ineffective means of
treatment. Depending on the design, detention basins can be very effective in
removing suspended solids, heavy metals (especially copper), phosphorus, and
COD to some degree.
0-3: THE DILLON WATER BUBBLE
An innovative project exploring the opportunity for achieving water
quality standards while saving costs at wastewater treatment facilities has
begun in'Summit County, Colorado. The project is a unique proposal from the
Northwest Colorado Council of Governments (NWCOG) which would involve a
oollution trade-off between point sources and nonpoint sources. Both
contribute phosphorus into Dillon Reservoir, a main source for the Denver area
drinking water supply. Historically, the responsiblity for phosphorus control
rested solely on the shoulders of the point source dischargers into the
reservoir, even though nonpoint source contribution of total phosphorus is
more than 10 times the contribution from point sources. The proposed concept
would allow a discharger to gain "credit" in their NPDES permit if they can
document removal of phosphorus by a-nonpoint source control device owned and
operated by the discharger. The advantage to the local wastewater entity is
that they can avoid the need to invest in expensive and sophisticated
additions to their treatment facilities that are already treating to advanced
levels. At the same time, water quality standards are being achieved and
nonpoint source controls become institutionalized with a built-in incentive
for maintenance.
- 106 -
image:
 163
NWCOG and the local sanitation district will be actually constructing and
operating nonpoint source control devices at two demonstration sites and
monitoring their effectiveness for two years. NWCOG will also sensor
negotiations between the local districts and the State to explore ways of
incorporating trade-offs in discharge permits.
This project has gotten high visibility in EPA Headquarters, in that it is
the only place in the nation where such a trade-off or "bubble" approach to
water pollution control is being explored. Essentially, no policy exists for
the implementation of point source/nonpoint source trade-offs although it
appears the Clean Water Act and regulations do not preclude such an
arrangement. It is anticipated that national policy will be developed once
the effectiveness of the Dillon Bubble can be demonstrated.
D-4: CLEAN LAKES PROGRAM
Region VIII has participated in the Clean Lakes Program since 1976. To
date we have funded twelve Phase I projects, nine Phase II projects and five
state classification survey projects. A Phase I project is a
diagnostic-feasibility study which determines the problems, evaluates possible
solutions and recommends the most feasible program to protect or restore the
lake/reservoir's quality. Phase I projects implement the recommendations into
operation. The state lake classification study classified, by trophic
conditions all the state's public-owned freshwater lake/reservoirs needing
restoration and protection. Appendix Q, Figure 1. lists and locates the
Region's projects.
Since 198Q, the clean lakes program has not received consistent funding.
Table 1 list the 1983 the clean lakes needs for the !(mi-ted funding available
for 1983, only four projects have passed headquarters initial review. These
projects are Sloan's Lake, Colorado, Mirror Lake, North Dakota, Lake
Herman, South Dakota, .and Scofield Reservoir, Utaft.
- 107 -
image:
163
NWCOG and the local sanitation district will be actually constructing and
operating nonpoint source control devices at two demonstration sites and
monitoring their effectiveness for two years. NWCOG will also sensor
negotiations between the local districts and the State to explore ways of
incorporating trade-offs in discharge permits.
This project has gotten high visibility in EPA Headquarters, in that it is
the only place in the nation where such a trade-off or "bubble" approach to
water pollution control is being explored. Essentially, no policy exists for
the implementation of point source/nonpoint source trade-offs although it
appears the Clean Water Act and regulations do not preclude such an
arrangement. It is anticipated that national policy will be developed once
the effectiveness of the Dillon Bubble can be demonstrated.
D-4: CLEAN LAKES PROGRAM
Region VIII has participated in the Clean Lakes Program since 1976. To
date we have funded twelve Phase I projects, nine Phase II projects and five
state classification survey projects. A Phase I project is a
diagnostic-feasibility study which determines the problems, evaluates possible
solutions and recommends the most feasible program to protect or restore the
lake/reservoir's quality. Phase I projects implement the recommendations into
operation. The state lake classification study classified, by trophic
conditions all the state's public-owned freshwater lake/reservoirs needing
restoration and protection. Appendix Q, Figure 1. lists and locates the
Region's projects.
Since 198Q, the clean lakes program has not received consistent funding.
Table 1 list the 1983 the clean lakes needs for the !(mi-ted funding available
for 1983, only four projects have passed headquarters initial review. These
projects are Sloan's Lake, Colorado, Mirror Lake, North Dakota, Lake
Herman, South Dakota, .and Scofield Reservoir, Utaft.
- 107 -
image:
 TABLE 0-1. REGION VIII 314 D.EAN LAKES PROGRAM
Proposed New Starts
FY 1933
164
State
Phase
Total Cost
Cherry Creek Reservoir
Sloans Lake
Dillon Reservoir
Denver Park Lakes
Chatfield Reservoir
Mirror Lake
Wood Lake
Metigoshe Lake
Big Stone Lake
Pelican Lake
Panguitch Lake
Scofield Reservoir
Deer Craek Reservoir
Wall Lake
Pineview Lake
East Canyon Lake
Echo Lake
Rockport Lake
Flaming Gorge Reservoir
• 1 • • «lll»ll
CO
CO
CO
CO
CO
NO
NO
NO
SO
SO
UT
UT
UT
SO
UT
UT
UT
UT
WY
II
II
II
II
II
II
II
I
II
I
II
II
II
I
I
I
I
I
II
51,000,000
100,000
200,000
100,000
500,000
220,000
100,000
100,000
500,000
50,000
100,000
100,000
300,000
50,000
100,000
50,000
50,000
50,000
200,000
- 108 -
image:
TABLE 0-1. REGION VIII 314 D.EAN LAKES PROGRAM
Proposed New Starts
FY 1933
164
State
Phase
Total Cost
Cherry Creek Reservoir
Sloans Lake
Dillon Reservoir
Denver Park Lakes
Chatfield Reservoir
Mirror Lake
Wood Lake
Metigoshe Lake
Big Stone Lake
Pelican Lake
Panguitch Lake
Scofield Reservoir
Deer Craek Reservoir
Wall Lake
Pineview Lake
East Canyon Lake
Echo Lake
Rockport Lake
Flaming Gorge Reservoir
• 1 • • «lll»ll
CO
CO
CO
CO
CO
NO
NO
NO
SO
SO
UT
UT
UT
SO
UT
UT
UT
UT
WY
II
II
II
II
II
II
II
I
II
I
II
II
II
I
I
I
I
I
II
51,000,000
100,000
200,000
100,000
500,000
220,000
100,000
100,000
500,000
50,000
100,000
100,000
300,000
50,000
100,000
50,000
50,000
50,000
200,000
- 108 -
image:
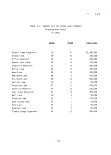 314 CL2AN L&KZS PROGRAM GRANTS
PHASE I
PHASE II GSASTS
CLASSISTCATICH
GRANTS
i. Panguitch Lake, Utah 8.
2. Scofield Seservoir, Utah 9.
3. Denver Park Lakes, Colorado 10.
4. Sloaa's Lake, Colorado* 11.
5. Dillon Saservoir, Colorado 12.
6. Hirror Lake, Horth Dakota 13.
7. Georgetown Lake, Montana 14.
16. Chatfield Reservoir, Colorado 15.
17. Cherry Creek Saservoir, Colorado 21.
18. Wood Lake, Sorth Dakota
19. Big Stone Lake, South Dakota
20. Deer Creek Reservoir, Utah
Sacajawea, Montana Colorado*
Sylvan Lake, South Dakota Montana
Capitol Lake, South Dakota* North Dakota*
Lake Kaapeska, South Dakota* South Dakota*
Oakwood Lakes, South Dakota* Utah*
Lake Herman, South Dakota Wyoming*
Covell Lake, South Dakota
Swan Lake, South Dakota*
Spiritvood Lake, Sorth Dakota
* Completed projects
- 109 -
image:
314 CL2AN L&KZS PROGRAM GRANTS
PHASE I
PHASE II GSASTS
CLASSISTCATICH
GRANTS
i. Panguitch Lake, Utah 8.
2. Scofield Seservoir, Utah 9.
3. Denver Park Lakes, Colorado 10.
4. Sloaa's Lake, Colorado* 11.
5. Dillon Saservoir, Colorado 12.
6. Hirror Lake, Horth Dakota 13.
7. Georgetown Lake, Montana 14.
16. Chatfield Reservoir, Colorado 15.
17. Cherry Creek Saservoir, Colorado 21.
18. Wood Lake, Sorth Dakota
19. Big Stone Lake, South Dakota
20. Deer Creek Reservoir, Utah
Sacajawea, Montana Colorado*
Sylvan Lake, South Dakota Montana
Capitol Lake, South Dakota* North Dakota*
Lake Kaapeska, South Dakota* South Dakota*
Oakwood Lakes, South Dakota* Utah*
Lake Herman, South Dakota Wyoming*
Covell Lake, South Dakota
Swan Lake, South Dakota*
Spiritvood Lake, Sorth Dakota
* Completed projects
- 109 -
image:
 III. 1-kfc
Drinking Water Quality Section
I.
II.
Ill
IV.
Environmental Management Report
Overview of Status and Trends
A. Population Statistics
8. Overview of Safe Drinking Water Act
C. Compliance Rates
D. Emerging Problems
Discussion of Environmental Problems and Their Implications
for Agency Management
A. Small Water Systems (Problems, Barriers)
B. Inorganic and Radiological Chemical MCL Violations
( Pro bl ems , Barri ers , Imp! i cati ens )
C. Unknown Contami nants (Problems, Barriers)
D. Drinking Water Quality on Indian Lands
Problems, Barriers, Implications)
. Attachment A
A. Popul ati on Statistics
1. Map 1 . Nunber .of PWS in Region
2. Map 2. PWS by Source and Population Served
3. Table 1. Breakdown by States
4, Table 2. Population Distribution
B. Violation Statistics
1. Coliform Bacteri a Compliance
Graphs 1 - 4 Regional Compliance Rates
2. Turbidity Compliance
Graph 4 Regional Compliance Rates
3. Inorganic and Radiological Chemical Compliance
Table 3 Chemical Violations
4. THM and Organic Chemical Compliance
Table 4. Volatile Organic Chemicals Tested for in
Ground Water Survey
Table 5. Occurrence of Organics in Region VIII
Attachment 3.
A. List of South Dakota Systems
B. Waterborne Transmission of Giardiasis
Page Nunber
167
169
172
173
174- -
175
176
175
180
181
180
182
180
181
183
184
185
188
image:
III. 1-kfc
Drinking Water Quality Section
I.
II.
Ill
IV.
Environmental Management Report
Overview of Status and Trends
A. Population Statistics
8. Overview of Safe Drinking Water Act
C. Compliance Rates
D. Emerging Problems
Discussion of Environmental Problems and Their Implications
for Agency Management
A. Small Water Systems (Problems, Barriers)
B. Inorganic and Radiological Chemical MCL Violations
( Pro bl ems , Barri ers , Imp! i cati ens )
C. Unknown Contami nants (Problems, Barriers)
D. Drinking Water Quality on Indian Lands
Problems, Barriers, Implications)
. Attachment A
A. Popul ati on Statistics
1. Map 1 . Nunber .of PWS in Region
2. Map 2. PWS by Source and Population Served
3. Table 1. Breakdown by States
4, Table 2. Population Distribution
B. Violation Statistics
1. Coliform Bacteri a Compliance
Graphs 1 - 4 Regional Compliance Rates
2. Turbidity Compliance
Graph 4 Regional Compliance Rates
3. Inorganic and Radiological Chemical Compliance
Table 3 Chemical Violations
4. THM and Organic Chemical Compliance
Table 4. Volatile Organic Chemicals Tested for in
Ground Water Survey
Table 5. Occurrence of Organics in Region VIII
Attachment 3.
A. List of South Dakota Systems
B. Waterborne Transmission of Giardiasis
Page Nunber
167
169
172
173
174- -
175
176
175
180
181
180
182
180
181
183
184
185
188
image:
 in. -• 167
DRINKING WATER
Part I. Overview of Status and Trends
In Region VIII1s six states, there are 3,136 community water systems
serving 7,463,000 people and 5,535 non-community water systems serving a
non-resident population of approximately 700,000 people. Most of these
systems are small and use ground water as a source of supply.
One of the major provisions of the Safe Drinking Water Act of 1974 was to
require the establishment and enforcement of national drinking water regula-
tions. The National Interim Primary Drinking Water Regulations established
maximum contaminant levels (MCLs) in drinking water supplies for coliform
bacteria and some inorganic, organic and radioactive chemicals. Regular moni-
toring for these contaminants is required of each public water system. In
addition, systems serving more than 10,000 people must sample for and control
the amount of total trihalomethanes (TTHMs) in their supplies. Any systems
using surface water must monitor daily for turbidity.
Active enforcement of these regulations was begun in 1978. Although it
was the intent of Congress that each state take primary responsibility
(primacy) for the enforcement of the Safe Drinking Water Act, two states in
Region VIII have chosen not to do so. The Drinking Water Branch of Region
VIII, EPA therefore has primacy for the Safe Drinking Water Act in South
Dakota and Wyoming.
During FY '79, thers were 634 violations of the maximum contaminant level
(MCL) for bacteria throughout the Region. Since that time, these violations
have decreased markedly. This trend, due to improved treatment as well as
sampling techniques is encouraging as the presence of coliform bacteria in
drinking water is an indication of the disease-causing potential of the
drinking water. Waterborne outbreaks caused by Gi.ardi_a_ organisms in systems
not exceeding the bacteria MCI suggest that compliance with this regulation
does not guarantee safe drinking water.
A number of systems have been found to exceed the standards set for
inorganic chemicals. Over one hundred communities, 3% throughout the region,
have been found to be in violation of these standards. Fluoride, for example,
has been found in excessive amounts in 76 communities. High levels of nitrate,
arsenic, mercury and selenium have also been detected in a few water systems.
By increased treatment, blending or changing sources, improvements in some
communities' drinking water have been made.
In South Dakota, for example, of the estimated 95 communities in violation
of standards, including those for inorganic chemicals, 22 have corrected the
problem and 23 have approved preliminary plans to correct their problems.
Regionwide the improvement rate is not quite as impressive, as less than 37%
of the violating systems have improved.
-1-
image:
in. -• 167
DRINKING WATER
Part I. Overview of Status and Trends
In Region VIII1s six states, there are 3,136 community water systems
serving 7,463,000 people and 5,535 non-community water systems serving a
non-resident population of approximately 700,000 people. Most of these
systems are small and use ground water as a source of supply.
One of the major provisions of the Safe Drinking Water Act of 1974 was to
require the establishment and enforcement of national drinking water regula-
tions. The National Interim Primary Drinking Water Regulations established
maximum contaminant levels (MCLs) in drinking water supplies for coliform
bacteria and some inorganic, organic and radioactive chemicals. Regular moni-
toring for these contaminants is required of each public water system. In
addition, systems serving more than 10,000 people must sample for and control
the amount of total trihalomethanes (TTHMs) in their supplies. Any systems
using surface water must monitor daily for turbidity.
Active enforcement of these regulations was begun in 1978. Although it
was the intent of Congress that each state take primary responsibility
(primacy) for the enforcement of the Safe Drinking Water Act, two states in
Region VIII have chosen not to do so. The Drinking Water Branch of Region
VIII, EPA therefore has primacy for the Safe Drinking Water Act in South
Dakota and Wyoming.
During FY '79, thers were 634 violations of the maximum contaminant level
(MCL) for bacteria throughout the Region. Since that time, these violations
have decreased markedly. This trend, due to improved treatment as well as
sampling techniques is encouraging as the presence of coliform bacteria in
drinking water is an indication of the disease-causing potential of the
drinking water. Waterborne outbreaks caused by Gi.ardi_a_ organisms in systems
not exceeding the bacteria MCI suggest that compliance with this regulation
does not guarantee safe drinking water.
A number of systems have been found to exceed the standards set for
inorganic chemicals. Over one hundred communities, 3% throughout the region,
have been found to be in violation of these standards. Fluoride, for example,
has been found in excessive amounts in 76 communities. High levels of nitrate,
arsenic, mercury and selenium have also been detected in a few water systems.
By increased treatment, blending or changing sources, improvements in some
communities' drinking water have been made.
In South Dakota, for example, of the estimated 95 communities in violation
of standards, including those for inorganic chemicals, 22 have corrected the
problem and 23 have approved preliminary plans to correct their problems.
Regionwide the improvement rate is not quite as impressive, as less than 37%
of the violating systems have improved.
-1-
image:
 168
In Region VIII only 106 systems are large enough to test for trihalo-
methanes. This group of organic chemicals, suspected carcinogens, have been
found in levels higher than the MCL in only 2 systems. More systems are
expected to find this chemical as sampling is completed. Removal may
necessitate a change in treatment technique.
A random survey performed by EPA's Office of Drinking Water in 1980 on
ground water systems found trace levels of trihalomethanes and volatile
organics in 55% of communities sampled in Region VIII. This indication of
aquifer contamination may have serious implications for Region VIII, as fully
of the communities rely on aquifers for their source of water.
-2-
image:
168
In Region VIII only 106 systems are large enough to test for trihalo-
methanes. This group of organic chemicals, suspected carcinogens, have been
found in levels higher than the MCL in only 2 systems. More systems are
expected to find this chemical as sampling is completed. Removal may
necessitate a change in treatment technique.
A random survey performed by EPA's Office of Drinking Water in 1980 on
ground water systems found trace levels of trihalomethanes and volatile
organics in 55% of communities sampled in Region VIII. This indication of
aquifer contamination may have serious implications for Region VIII, as fully
of the communities rely on aquifers for their source of water.
-2-
image:
 Part II. Discussion of Environmental Problems and their Implications for
Agency Management
A. Public Health Problems Associated with Small Water Systems
1- The .Problem
Region VIII is characterized by its rural nature, having over 7 million
people scattered across 578,000 square miles of land; or roughly 13 people per
square mile. One third of these people live in cities greater than 100,000,
but most of Region VIII is made up of small towns. Seventy percent of the
community water systems in the region serve less than 1,000 people;
ninety-nine percent of these community water systems serve less than 100,000
people.
State and nationwide studies have shown that small water systems (those
serving less than 1,000 people) are the systems which have the most problems
in consistently providing safe drinking water. Typically, these systems rely
on untreated ground water, unfiltered surface water or poorly protected springs
for their source of supply. This, in combination with low water rates that
can not support improvements or adequate operation, result in public health
dilemmas.
Of all the bacteria violations in rY 82, 35% occurred in systems serving
1,000 or less. As this water served only 4% of the population, this level of
violations is disproportionately high.
Unfiltered water sources are a particular problem due to the occurrence
of high turbidity during run off periods which interferes with disinfection"""
and increases the presence of chlorine resistant Siardja lamblia cysts. In
the past 3 years, 17 outbreaks of giardiasis have occurred in the region, most
of them in small systems.
2. Barriers, to _So lying .Problems
The lack of practical treatment technology, alternate sources and avail-
able funding make it very difficult for a small water system (even if they
wanted) to improve their drinking water. The lack of funds also makes it
extremely difficult to hire and retain qualified operating personnel.
3. Inorganic and Radiological Chemical MCI Violations
1. The _P_ro.b1 em
Currently there are 86 communities in Region VIII exceeding the fluoride
MCL, 33 exceeding the nitrate MCI, 8 exceeding the selenium MCL and 5
communities exceeding the arsenic standard.
These contamination incidents are a result of the presence of natural
contaminants in deep aquifers or poor well drilling practices which lead to
nitrate contamination.
-3-
image:
Part II. Discussion of Environmental Problems and their Implications for
Agency Management
A. Public Health Problems Associated with Small Water Systems
1- The .Problem
Region VIII is characterized by its rural nature, having over 7 million
people scattered across 578,000 square miles of land; or roughly 13 people per
square mile. One third of these people live in cities greater than 100,000,
but most of Region VIII is made up of small towns. Seventy percent of the
community water systems in the region serve less than 1,000 people;
ninety-nine percent of these community water systems serve less than 100,000
people.
State and nationwide studies have shown that small water systems (those
serving less than 1,000 people) are the systems which have the most problems
in consistently providing safe drinking water. Typically, these systems rely
on untreated ground water, unfiltered surface water or poorly protected springs
for their source of supply. This, in combination with low water rates that
can not support improvements or adequate operation, result in public health
dilemmas.
Of all the bacteria violations in rY 82, 35% occurred in systems serving
1,000 or less. As this water served only 4% of the population, this level of
violations is disproportionately high.
Unfiltered water sources are a particular problem due to the occurrence
of high turbidity during run off periods which interferes with disinfection"""
and increases the presence of chlorine resistant Siardja lamblia cysts. In
the past 3 years, 17 outbreaks of giardiasis have occurred in the region, most
of them in small systems.
2. Barriers, to _So lying .Problems
The lack of practical treatment technology, alternate sources and avail-
able funding make it very difficult for a small water system (even if they
wanted) to improve their drinking water. The lack of funds also makes it
extremely difficult to hire and retain qualified operating personnel.
3. Inorganic and Radiological Chemical MCI Violations
1. The _P_ro.b1 em
Currently there are 86 communities in Region VIII exceeding the fluoride
MCL, 33 exceeding the nitrate MCI, 8 exceeding the selenium MCL and 5
communities exceeding the arsenic standard.
These contamination incidents are a result of the presence of natural
contaminants in deep aquifers or poor well drilling practices which lead to
nitrate contamination.
-3-
image:
 170
All of these contaminants are known to have public health implications
for the populations consuming them in their drinking water.
2» Barriers to Solving Problems
All of these contaminants can be removed with additional treatment.
However, many towns are financially unable or unwilling to finance expensive
new treatment methods. The resistance is particularly true in the towns with
fluoride violations, as many people do not consider the health effects of
fluoride serious enough to warrant new expenditures.
3. Implications for EPA Management
The completion of the revised regulations is necessary. This is
particularly true for fluoride, -which may be completely removed from the
primary regulations.
EPA regional staff should work with the state and other federal agencies
to focus existing funding on those systems which have definite public health
problems.
C. Unknown Contaminants
1. The P_robl em
The extent of present contamination of drinking water is only beginning
to be discovered. Chemicals for which there are no MCLs, no sampling require-
ments and in some cases, difficult detection procedures, continue to be dis-
covered in aquifers and surface waters feeding Region VIII drinking water
systems. The Office of Drinking Water, in an attempt to determine the
occurrence of certain types of chemicals known as Volatile Organic Chemicals
(VOCs), performed a survey in 1980 of ground water systems throughout the
country. Of the 40 systems sampled in Region VIII, 22 communities were found
to contain at least trace amounts of trihalomethanes and VOCs. All but four
of these communities had populations of lass than 10,000 people. Trihalo-
methanes and VOCs are thought to be adverse to human health and some are
suspected carcinogens.
2. B arr i ers_ _to So 1 v i nq _P_r_qb Jems
As noted, no regulations exist for these contaminants and detection
procedures are quite difficult. Sampling is quite expensive and towns are
reluctant to pay for tests that are not required by law. Further, a disbelief
by Region VIII consumers that their pristine water supplies could be contam-
inated makes solving this problem difficult.
0. Drinking Water Quality on Indian Lands
1. The Problem
Numerous Indian tribes have traditionally made their home in the six
state region comprising Region VIII. Presently 25 tribes reside on 23 Indian
Reservations. Inadequate treatment and little, if any operation and main-
tenance contribute to the problem of intermittent quality of drinking water on
-4-
image:
170
All of these contaminants are known to have public health implications
for the populations consuming them in their drinking water.
2» Barriers to Solving Problems
All of these contaminants can be removed with additional treatment.
However, many towns are financially unable or unwilling to finance expensive
new treatment methods. The resistance is particularly true in the towns with
fluoride violations, as many people do not consider the health effects of
fluoride serious enough to warrant new expenditures.
3. Implications for EPA Management
The completion of the revised regulations is necessary. This is
particularly true for fluoride, -which may be completely removed from the
primary regulations.
EPA regional staff should work with the state and other federal agencies
to focus existing funding on those systems which have definite public health
problems.
C. Unknown Contaminants
1. The P_robl em
The extent of present contamination of drinking water is only beginning
to be discovered. Chemicals for which there are no MCLs, no sampling require-
ments and in some cases, difficult detection procedures, continue to be dis-
covered in aquifers and surface waters feeding Region VIII drinking water
systems. The Office of Drinking Water, in an attempt to determine the
occurrence of certain types of chemicals known as Volatile Organic Chemicals
(VOCs), performed a survey in 1980 of ground water systems throughout the
country. Of the 40 systems sampled in Region VIII, 22 communities were found
to contain at least trace amounts of trihalomethanes and VOCs. All but four
of these communities had populations of lass than 10,000 people. Trihalo-
methanes and VOCs are thought to be adverse to human health and some are
suspected carcinogens.
2. B arr i ers_ _to So 1 v i nq _P_r_qb Jems
As noted, no regulations exist for these contaminants and detection
procedures are quite difficult. Sampling is quite expensive and towns are
reluctant to pay for tests that are not required by law. Further, a disbelief
by Region VIII consumers that their pristine water supplies could be contam-
inated makes solving this problem difficult.
0. Drinking Water Quality on Indian Lands
1. The Problem
Numerous Indian tribes have traditionally made their home in the six
state region comprising Region VIII. Presently 25 tribes reside on 23 Indian
Reservations. Inadequate treatment and little, if any operation and main-
tenance contribute to the problem of intermittent quality of drinking water on
-4-
image:
 171
the reservation. Although the number of bacteria MCL violations on the
reservations have been low, many operation and treatment deficiencies have
been noted during sanitary surveys. Public health problems may result from
contaminated drinking water.
2. Barriers to Solving the Problem
Dedicated trained operators are difficult to find on the reservations.
Also, the responsibility for public health maintenance on Indian lands is
scattered through a number of federal agencies, making it difficult to enforce
the Safe Drinking Water Act.
3. Implications for_EPA Management
EPA Region VIII must develop a coherent strategy which coordinates all
federal agencies involved with Indian lands so that it can enforce a policy
that will ensure the delivery of safe drinking water.
-5-
image:
171
the reservation. Although the number of bacteria MCL violations on the
reservations have been low, many operation and treatment deficiencies have
been noted during sanitary surveys. Public health problems may result from
contaminated drinking water.
2. Barriers to Solving the Problem
Dedicated trained operators are difficult to find on the reservations.
Also, the responsibility for public health maintenance on Indian lands is
scattered through a number of federal agencies, making it difficult to enforce
the Safe Drinking Water Act.
3. Implications for_EPA Management
EPA Region VIII must develop a coherent strategy which coordinates all
federal agencies involved with Indian lands so that it can enforce a policy
that will ensure the delivery of safe drinking water.
-5-
image:
 Attachment A . « — ^
I. Population Statistics
Region VIII has an estimated 8,672 public water supplies serving
8,253,000 people throughout the six states of Colorado, Utah, Wyoming, Montana,
North and South Dakota (Map 1). This includes 3,136 systems serving commun-
ities such as towns and trailer parks. There are also an estimated 5,536
non-community systems serving non-resident populations. These systems include
rest stops, motels, restaurants and airports which have their own water
systems.
Table 1 shows a breakdown by state of community systems. Over 80% of
these systems use ground water as their major source of supply. Further, most
of the 5,536 non-community systems use groundwater, bringing the total to well
over 90% of the systems. Map 2 shows this breakdown by state. It also gives
an indication of the small town nature of Region VIII. Although 90% of the
systems use ground water as a source, only 40% of the population are served by
these systems. This indicates that most of the ground water systems are very
small.
Table 2 shows the population distribution of community systems. Seventy
percent of the systems in the region serve less than 5% of the population in
towns with less than 500 people. Only 0.2% of the systems serve more than
100,000 people and yet that represents one-third of Region VIII's population.
II. Violation Statistics
A. Coliform Bacteria (Microbiological)
Throughout the region, coliform bacteria violations, both MCL and
monitoring and reporting violations, have decreased between October 1978 and
the present. Graph I shows this trend for community water systems from
October 1978 through the end of the 1982 fiscal year. The graph also indicates
that the number of monitoring violations is quite a bit higher than the number
of MCL violations. In fiscal year 1981, 30% of the systems failed at some
time to either monitor or report a violation.
What is of more concern than simply the number of violations, is the
number of systems that are considered persistent violators. These systems
violate the bacteria standard for 4 or more months in a year or more than one
quarter in a calendar year.
Graph 2 shows the compliance of community systems with the coliform
bacteria regulations from FY 1979 through FY 1982, indicating the percentage
of these systems which are persistent violators. As is shown, the compliance
rate has increased from 54% in 1979 to 68% in 1982. The percentage of persis-
tent violators has similarly decreased from 19% to a 1982 level of 10%.
However this still represents a sizable portion of the systems which are
consistently out of compliance.
Graph 3 breaks the microbiological violations down into MCL and monitor-
ing and reporting violations. Again, there has been a trend since 1979 toward
compliance, but a substantial percentage of systems are persistent violators.
- o-
image:
Attachment A . « — ^
I. Population Statistics
Region VIII has an estimated 8,672 public water supplies serving
8,253,000 people throughout the six states of Colorado, Utah, Wyoming, Montana,
North and South Dakota (Map 1). This includes 3,136 systems serving commun-
ities such as towns and trailer parks. There are also an estimated 5,536
non-community systems serving non-resident populations. These systems include
rest stops, motels, restaurants and airports which have their own water
systems.
Table 1 shows a breakdown by state of community systems. Over 80% of
these systems use ground water as their major source of supply. Further, most
of the 5,536 non-community systems use groundwater, bringing the total to well
over 90% of the systems. Map 2 shows this breakdown by state. It also gives
an indication of the small town nature of Region VIII. Although 90% of the
systems use ground water as a source, only 40% of the population are served by
these systems. This indicates that most of the ground water systems are very
small.
Table 2 shows the population distribution of community systems. Seventy
percent of the systems in the region serve less than 5% of the population in
towns with less than 500 people. Only 0.2% of the systems serve more than
100,000 people and yet that represents one-third of Region VIII's population.
II. Violation Statistics
A. Coliform Bacteria (Microbiological)
Throughout the region, coliform bacteria violations, both MCL and
monitoring and reporting violations, have decreased between October 1978 and
the present. Graph I shows this trend for community water systems from
October 1978 through the end of the 1982 fiscal year. The graph also indicates
that the number of monitoring violations is quite a bit higher than the number
of MCL violations. In fiscal year 1981, 30% of the systems failed at some
time to either monitor or report a violation.
What is of more concern than simply the number of violations, is the
number of systems that are considered persistent violators. These systems
violate the bacteria standard for 4 or more months in a year or more than one
quarter in a calendar year.
Graph 2 shows the compliance of community systems with the coliform
bacteria regulations from FY 1979 through FY 1982, indicating the percentage
of these systems which are persistent violators. As is shown, the compliance
rate has increased from 54% in 1979 to 68% in 1982. The percentage of persis-
tent violators has similarly decreased from 19% to a 1982 level of 10%.
However this still represents a sizable portion of the systems which are
consistently out of compliance.
Graph 3 breaks the microbiological violations down into MCL and monitor-
ing and reporting violations. Again, there has been a trend since 1979 toward
compliance, but a substantial percentage of systems are persistent violators.
- o-
image:
 Q.
rt)
s:
CM
O.
fd
z:
image:
Q.
rt)
s:
CM
O.
fd
z:
image:
 COMMUNITY WATER SUPPLIES IN STATES
FY 1982
1
CO
1
STATE
CO
MT
ND
SD
LIT
WY
REG VIII
7. IN REG
SIZE CATEGORY
V-S S M L V-L
585 192 51 33 4
511 82 17 8 0
220 1O7 15 10 0
300 111 19 8 0
218 127 35 31 4
243 48 17 7 0
/5 i" '
2O77 667 154 97 Q
69.16 22.21 5.13 3.23 0.27
TOTAL
865
610
352
438
415
315
3003
SOURCE TYPE
SURFACE
228
72
36
42v
87
64
529
17.62
GROUND
637
546
316
396
320
251
2474
82.38
—I
3>
CO
r~
rn
-o
p
c:
i—
Ja
—\
t—*
O
CO
rn
<§
O
-n
o
p
IS
-<
CO
___ 1
rn
•3.
image:
COMMUNITY WATER SUPPLIES IN STATES
FY 1982
1
CO
1
STATE
CO
MT
ND
SD
LIT
WY
REG VIII
7. IN REG
SIZE CATEGORY
V-S S M L V-L
585 192 51 33 4
511 82 17 8 0
220 1O7 15 10 0
300 111 19 8 0
218 127 35 31 4
243 48 17 7 0
/5 i" '
2O77 667 154 97 Q
69.16 22.21 5.13 3.23 0.27
TOTAL
865
610
352
438
415
315
3003
SOURCE TYPE
SURFACE
228
72
36
42v
87
64
529
17.62
GROUND
637
546
316
396
320
251
2474
82.38
—I
3>
CO
r~
rn
-o
p
c:
i—
Ja
—\
t—*
O
CO
rn
<§
O
-n
o
p
IS
-<
CO
___ 1
rn
•3.
image:
 175
TABLE 2. SIZE DISTRIBUTION OF CWS's IN REGION VIII
70
60
50
40
30
20
10
(Size Category)
# of CWS's
o
M
H
CQ
i— i
£->
CO
Q
70
3-8.4
21.5
11.4
4.6
12.6
5.2
3-0
33-1
VERY SMALL SMALL
2199 673
HI # of CWS
[ } Population Served
MEDIUM
161
LARGE
95
0.4
VERY LARGE
Tit"
SYSTEM SIZE CATEGORIES
SIZE
VERY SMALL
SMALL
MEDIUM
LARGE
VERY LARGE
POPULATION SERVED
25 - 500
501 - 3.300
3.301 - 10.000
10.000 - 100,000
GREATER THAN 100.000
-9-
image:
175
TABLE 2. SIZE DISTRIBUTION OF CWS's IN REGION VIII
70
60
50
40
30
20
10
(Size Category)
# of CWS's
o
M
H
CQ
i— i
£->
CO
Q
70
3-8.4
21.5
11.4
4.6
12.6
5.2
3-0
33-1
VERY SMALL SMALL
2199 673
HI # of CWS
[ } Population Served
MEDIUM
161
LARGE
95
0.4
VERY LARGE
Tit"
SYSTEM SIZE CATEGORIES
SIZE
VERY SMALL
SMALL
MEDIUM
LARGE
VERY LARGE
POPULATION SERVED
25 - 500
501 - 3.300
3.301 - 10.000
10.000 - 100,000
GREATER THAN 100.000
-9-
image:
 GRAPH 1
COMPLIANCE COMPARISON FOR MICROBIOLOGICAL VIOLATIONS
(. BY % SYSTEMS IN VIOLATION)
o
i
STATE
CO
MT
ND
sn
UT
WY
MCL
FY79*
0.4
12.2
10.1
11.8
37.3 v
20.1
FY80
5.3
9.8
11.5
7.2
26.6
15.9
FY81
2.0
6.2
6.0
8.3
40. 1
9.9
FY82
2.8
9.7
13.1
5.5
43.6
7.3
M/R
FY79*
35.8
30.9
41.5
30.4
56.1
74.6
FY80
25.3
15.8
26.6
25.2
8.0
37.6
FY81
30.0
43.5
24.3
32.6
15. a
29.7
FY82 |
16.5 '
44.8 j
•j
33.1 |
72.1 1
30.5 i
REGIONAL
AVERAGE
12-
11.3
10.3
11.9
41.1
22-7
30.6
34.0
NOT UPDATE TO FY83 DURATION UPDATE.
ON
image:
GRAPH 1
COMPLIANCE COMPARISON FOR MICROBIOLOGICAL VIOLATIONS
(. BY % SYSTEMS IN VIOLATION)
o
i
STATE
CO
MT
ND
sn
UT
WY
MCL
FY79*
0.4
12.2
10.1
11.8
37.3 v
20.1
FY80
5.3
9.8
11.5
7.2
26.6
15.9
FY81
2.0
6.2
6.0
8.3
40. 1
9.9
FY82
2.8
9.7
13.1
5.5
43.6
7.3
M/R
FY79*
35.8
30.9
41.5
30.4
56.1
74.6
FY80
25.3
15.8
26.6
25.2
8.0
37.6
FY81
30.0
43.5
24.3
32.6
15. a
29.7
FY82 |
16.5 '
44.8 j
•j
33.1 |
72.1 1
30.5 i
REGIONAL
AVERAGE
12-
11.3
10.3
11.9
41.1
22-7
30.6
34.0
NOT UPDATE TO FY83 DURATION UPDATE.
ON
image:
 GRAPH 2. REGION VIII MICROBIOLOGICAL COMPLIANCE
FY 79
COMPLIANCE
I
100-,
80-
60-
HO.
20-
INTERMITTENT
I
27%
PERSISTENT
FY 80
FY 81
FY
COMPLIANCE
— o —
FY 79
80
FY 81
—X INTERMITTENT
-o PERSISTENT
"" ""!' ' ' ' -•
FY 82
image:
GRAPH 2. REGION VIII MICROBIOLOGICAL COMPLIANCE
FY 79
COMPLIANCE
I
100-,
80-
60-
HO.
20-
INTERMITTENT
I
27%
PERSISTENT
FY 80
FY 81
FY
COMPLIANCE
— o —
FY 79
80
FY 81
—X INTERMITTENT
-o PERSISTENT
"" ""!' ' ' ' -•
FY 82
image:
 GRAPH 3, REGION VIII MICROBIOLOGICAL MCL COMPLIANCE
FY 79 •
INTERMITTENT
PERSISTENT
1.3%
90 -
85
*>
10 -
5 4
o-
FY 79 "
FY 80
FY 81
0.3%
FY 82
0. 6%
COMPLIANCE
•X- .
—-X x INTERMITTENT
FY 80
FY 81
._o PERSISTENT
FY 82
--J
00
image:
GRAPH 3, REGION VIII MICROBIOLOGICAL MCL COMPLIANCE
FY 79 •
INTERMITTENT
PERSISTENT
1.3%
90 -
85
*>
10 -
5 4
o-
FY 79 "
FY 80
FY 81
0.3%
FY 82
0. 6%
COMPLIANCE
•X- .
—-X x INTERMITTENT
FY 80
FY 81
._o PERSISTENT
FY 82
--J
00
image:
 GRAPH 4. REGION VIII MICROBIOLOGICAL MONITORING AND REPORTING C6MPLIANCE
FY 79
FY 81
COMPLIANCE
INTERMITTENT
19%
PERSISTENT
FY 80
FY 82
100 •
80 *
60-
10 -
20-
%/ .
FY 79
COMPLIANCE
•»*» M«M *•! >t J^"*
FY 80
— o —
FY 81
—x INTERMITTENT
~o PERSISTENT
FY 82
image:
GRAPH 4. REGION VIII MICROBIOLOGICAL MONITORING AND REPORTING C6MPLIANCE
FY 79
FY 81
COMPLIANCE
INTERMITTENT
19%
PERSISTENT
FY 80
FY 82
100 •
80 *
60-
10 -
20-
%/ .
FY 79
COMPLIANCE
•»*» M«M *•! >t J^"*
FY 80
— o —
FY 81
—x INTERMITTENT
~o PERSISTENT
FY 82
image:
 180
Over all, in FY 1982, 88% of the systems wera in compliance with the MCI
portion of the bacteria standard. Eleven percent were intermittent violators
and 0.6% were persistent violators. Since 1979, compliance has improved.
This improvement included an encouraging trend in the reduction of persis-
tent violators. During FY 82, less than 1% of all systems were persistent
violators of the bacteria MCI regulation.
The bacteria monitoring and reporting data has also shown improvement
between the years 1979 and 1982. Compliance has improved by 2%, but perhaps
more significantly, persistent violators have been reduced by 9%. However, in
1982, 34% of all systems were still in violation of the bacteria monitoring
and reporting data, indicating that there is still much room for improvement.
8. Turbidity Compliance
Graph 4 shows a breakdown of regional turbidity compliance. In FY 1979,
81% of the surface waters in the region met all the requirements of the
turbidity regulations. Persistent violators represented 9% of all systems.
Compliance has improved. In FY 1982, 89% of the systems were in
compliance, and the percentage of persistent violators was decreased to 5%.
C. Inorganic and Radiological Chemical Compliance
Table 2 shows the number of communities in the Region in violation of the
inorganic chemical fCLs. A total of 132 systems do not meet the standards set
for inorganic chemicals including nitrate, fluoride, selenium and arsenic.
Table 2 also shows 24 violations of the rad standard. However, sampling
in some states has not been completed and the actual number of systems in
violation will probably be much higher.
0. THM and Organic Chemicals Compliance
As noted earlier, only 2 systems in the region have found levels of THMs
in excess of the MC!_. However, sampling is not yet complete for systems
serving 10,000 - 100,000 people, and more violations are expected to be
discovered.
In an attempt to determine the extent of occurrence of volatile organic
chemicals in ground water systems, the Office of Drinking Water conducted a
study of ground water sources throughout the country in 1980. A list of the
volatile organic chemicals tested for and the levels detected in public water
systems is included on Table 4. A further breakdown of the occurrence of
these organics as well as tribalomethanes in systems tested in Region VIII is
included in Table 5.
Although the number of systems tested for in this region is too low (39),
to make substantive conclusions from this data, the results may be an
indication of widespread contamination of some of the Region VIII aquifers.
Table 5 shows the breakdown of results from Region VIII systems. Over
half of the samples tested contained trace amounts of either trihalomethanes
or volatile organic chemicals. Eighteen percent of the systems contained only
trace amounts of volatile organics. This is slightly better than the national
average of 24%.
-14-
image:
180
Over all, in FY 1982, 88% of the systems wera in compliance with the MCI
portion of the bacteria standard. Eleven percent were intermittent violators
and 0.6% were persistent violators. Since 1979, compliance has improved.
This improvement included an encouraging trend in the reduction of persis-
tent violators. During FY 82, less than 1% of all systems were persistent
violators of the bacteria MCI regulation.
The bacteria monitoring and reporting data has also shown improvement
between the years 1979 and 1982. Compliance has improved by 2%, but perhaps
more significantly, persistent violators have been reduced by 9%. However, in
1982, 34% of all systems were still in violation of the bacteria monitoring
and reporting data, indicating that there is still much room for improvement.
8. Turbidity Compliance
Graph 4 shows a breakdown of regional turbidity compliance. In FY 1979,
81% of the surface waters in the region met all the requirements of the
turbidity regulations. Persistent violators represented 9% of all systems.
Compliance has improved. In FY 1982, 89% of the systems were in
compliance, and the percentage of persistent violators was decreased to 5%.
C. Inorganic and Radiological Chemical Compliance
Table 2 shows the number of communities in the Region in violation of the
inorganic chemical fCLs. A total of 132 systems do not meet the standards set
for inorganic chemicals including nitrate, fluoride, selenium and arsenic.
Table 2 also shows 24 violations of the rad standard. However, sampling
in some states has not been completed and the actual number of systems in
violation will probably be much higher.
0. THM and Organic Chemicals Compliance
As noted earlier, only 2 systems in the region have found levels of THMs
in excess of the MC!_. However, sampling is not yet complete for systems
serving 10,000 - 100,000 people, and more violations are expected to be
discovered.
In an attempt to determine the extent of occurrence of volatile organic
chemicals in ground water systems, the Office of Drinking Water conducted a
study of ground water sources throughout the country in 1980. A list of the
volatile organic chemicals tested for and the levels detected in public water
systems is included on Table 4. A further breakdown of the occurrence of
these organics as well as tribalomethanes in systems tested in Region VIII is
included in Table 5.
Although the number of systems tested for in this region is too low (39),
to make substantive conclusions from this data, the results may be an
indication of widespread contamination of some of the Region VIII aquifers.
Table 5 shows the breakdown of results from Region VIII systems. Over
half of the samples tested contained trace amounts of either trihalomethanes
or volatile organic chemicals. Eighteen percent of the systems contained only
trace amounts of volatile organics. This is slightly better than the national
average of 24%.
-14-
image:
 image:
 Table 3
Inorganic and Radiological Chemli
MCL Violations
~ 132
UT
SO
NO
WY
MT
CO
TOTAL
Nitrate
1
8
1
2
11
10
33
Fluoride Selenium
0
29
27
2
18
10
86
0
4
0
1
0
3
8
Arsenic
0
0
1
0
2
2
Rad*
0
9
0
4
5
6
(226)
* All samples have not been adequately analyzed.
more systems will be in violation.
5 24
It is expected that many
-16-
image:
Table 3
Inorganic and Radiological Chemli
MCL Violations
~ 132
UT
SO
NO
WY
MT
CO
TOTAL
Nitrate
1
8
1
2
11
10
33
Fluoride Selenium
0
29
27
2
18
10
86
0
4
0
1
0
3
8
Arsenic
0
0
1
0
2
2
Rad*
0
9
0
4
5
6
(226)
* All samples have not been adequately analyzed.
more systems will be in violation.
5 24
It is expected that many
-16-
image:
 183
Srcund *at2r Sucsly Survey
r 1S3G - Osc^sser 1551
Su=sary of Volatile Organic C.v.£3icsl Ocrurrwcs i^ata fr
455 ruilic Hatsr Systss S-alactad at
Randcs in tist USA
IcaatSans data hMS
i tarl en Valua
Ucn't uc/1 Oc=urrsnc3s Cetacta
vinyl c.*!«n'd8 1.0 * 1 1.1
l.l-dicjiorca^yTefls 0.2 9 5.2
l,l-41cJi1crcst*!ana 0,2 13 3.2
els and/or tr^ns-
If2-41dilor5»tivlene 0.2 15 2.0^
lll,l-cricitl«r5»ttar.« 0.2 27 -18
carters tsfrichlcHda . 0.2 15 15
l.Z-di'chlarcprrpans - 0.2 5 21
tricolor: its? Una 0.2 3C 73
bsniirt'e' '•*""'"" 0;s ^ - 15
toluane 0.5 6 2.3
0.5 3 1.1
0.5 4 5.3
0.2 8 1.5
0.2 S .91
p-4?cMorsban:a.Te 0.5 -5 1.3
LLI-tricMsrsacJiane 0.5 0
i.l,i,2-tatrac.Mor3«tiJana 0.2 0
l,!,2,2-t;tr2c^]orcat.i;a.na 0.5 0
0.5 0
5.0 1 5.5
0.5 0
0.5 0
0.5 -0
a-dichlcrsbanzsne 0.5 0
0.5 0 - .
0.5 0
0,5 0 .
The samples were also analyzed for trihalomethanes, chloroform, bromoiodomethanes,
brornodichloromethane, di bromochloromethane and bromoform, but the results of these
analyses were not included in the final study.
-17-
image:
183
Srcund *at2r Sucsly Survey
r 1S3G - Osc^sser 1551
Su=sary of Volatile Organic C.v.£3icsl Ocrurrwcs i^ata fr
455 ruilic Hatsr Systss S-alactad at
Randcs in tist USA
IcaatSans data hMS
i tarl en Valua
Ucn't uc/1 Oc=urrsnc3s Cetacta
vinyl c.*!«n'd8 1.0 * 1 1.1
l.l-dicjiorca^yTefls 0.2 9 5.2
l,l-41cJi1crcst*!ana 0,2 13 3.2
els and/or tr^ns-
If2-41dilor5»tivlene 0.2 15 2.0^
lll,l-cricitl«r5»ttar.« 0.2 27 -18
carters tsfrichlcHda . 0.2 15 15
l.Z-di'chlarcprrpans - 0.2 5 21
tricolor: its? Una 0.2 3C 73
bsniirt'e' '•*""'"" 0;s ^ - 15
toluane 0.5 6 2.3
0.5 3 1.1
0.5 4 5.3
0.2 8 1.5
0.2 S .91
p-4?cMorsban:a.Te 0.5 -5 1.3
LLI-tricMsrsacJiane 0.5 0
i.l,i,2-tatrac.Mor3«tiJana 0.2 0
l,!,2,2-t;tr2c^]orcat.i;a.na 0.5 0
0.5 0
5.0 1 5.5
0.5 0
0.5 0
0.5 -0
a-dichlcrsbanzsne 0.5 0
0.5 0 - .
0.5 0
0,5 0 .
The samples were also analyzed for trihalomethanes, chloroform, bromoiodomethanes,
brornodichloromethane, di bromochloromethane and bromoform, but the results of these
analyses were not included in the final study.
-17-
image:
 184
Table 5
Occurrence of Volatile Organic Chemicals and
Trihalomethanes in Random and Selected Samples
From 39 Public Water Systems in Region VIII
% of Systems With % of Systems With VOC's
Random Samples VOC's Detected and THM's Detected
Populations 10,000 23* 39%
Populations 10,000 5055 75%
Selected Samoles
58*
67*
Pop.
Pop.
10,000
10,000
11*
0*
Totals
Systems with THM's or VOC's ... 54*
Systems with VOC's Detected ... 18*
-18-
image:
184
Table 5
Occurrence of Volatile Organic Chemicals and
Trihalomethanes in Random and Selected Samples
From 39 Public Water Systems in Region VIII
% of Systems With % of Systems With VOC's
Random Samples VOC's Detected and THM's Detected
Populations 10,000 23* 39%
Populations 10,000 5055 75%
Selected Samoles
58*
67*
Pop.
Pop.
10,000
10,000
11*
0*
Totals
Systems with THM's or VOC's ... 54*
Systems with VOC's Detected ... 18*
-18-
image:
 ATTACHMENT B
1. List of South Dakota Systems
185.
SOUTH DAKOTA
Water System Improvements
1978 throuah 1982
TOWN
Baltic
Bryant
Dupree
Eagle Butte
»
Egan
Fairfax
Faith
Gann Valley
Huron , \
Kimball . "
Lesteryllle-
Midland
Mission Hill
Gettysburg
Oaccxsa
Platte
Pukwana
Utlca
Volln
White Lake
Kitten ,
Roscoe
POPULATION
679
380
562
435
248
225
575
75
13,000 .
752 :
156 -
277
197
1,623
289
1,334
234
100
156
414
154
370
LEVEL/TYPE
' CONTAMIFWNT
11.6 mg/1 N03"
4,1 mg/1 F-
3.5 mg/1 F~
>2.4 mg/1 F-
29.0 mg/1 N03~
22.0 ug/1 Se
Turbidity
2.5 mg/1 F-
TTHMs ?
2.S mg/1 F- --
88.0 ug/1. Arsenic.
15.0 pCi/1 Radium •
>2.4 mg/1 F~
->2.4 mg/1 F'
2.5 rag/1 F-
>2.4 mg/1 F-
2.8 rag/1 F"
2.7 mg/1 F-
>2.4 mg/1 F-
>2.4 rag/1 F-
>2.4 mg/1 F-
2.7 mg/1 F"
SdUTION
Hlnnehaha Rural Water
Sioux Rural Water
Tri-County Rural Water
Tri-County Rural Water
New Wei 1
East Gregory Rural Water
Tri-County Rural Water
Aurora-Brule Rural Water
Change In treatment ;--.
Aurora-Srule Rural,. Water
B-Y Phase II Rural Water
New Bad 2 treatment plant
8-Y Phase I Rural Water
New treatment plant
New treatment plant
Randall III Rural Water
Aurora-Brule Rural Water
B-Y Phase I Rural Water
B-Y Phase I Rural Water
Aurora-Brule Rural Water
Trlpp Rural Water
New source
TOTAL POPULATION 22,246
AFFECTED
-19-
image:
ATTACHMENT B
1. List of South Dakota Systems
185.
SOUTH DAKOTA
Water System Improvements
1978 throuah 1982
TOWN
Baltic
Bryant
Dupree
Eagle Butte
»
Egan
Fairfax
Faith
Gann Valley
Huron , \
Kimball . "
Lesteryllle-
Midland
Mission Hill
Gettysburg
Oaccxsa
Platte
Pukwana
Utlca
Volln
White Lake
Kitten ,
Roscoe
POPULATION
679
380
562
435
248
225
575
75
13,000 .
752 :
156 -
277
197
1,623
289
1,334
234
100
156
414
154
370
LEVEL/TYPE
' CONTAMIFWNT
11.6 mg/1 N03"
4,1 mg/1 F-
3.5 mg/1 F~
>2.4 mg/1 F-
29.0 mg/1 N03~
22.0 ug/1 Se
Turbidity
2.5 mg/1 F-
TTHMs ?
2.S mg/1 F- --
88.0 ug/1. Arsenic.
15.0 pCi/1 Radium •
>2.4 mg/1 F~
->2.4 mg/1 F'
2.5 rag/1 F-
>2.4 mg/1 F-
2.8 rag/1 F"
2.7 mg/1 F-
>2.4 mg/1 F-
>2.4 rag/1 F-
>2.4 mg/1 F-
2.7 mg/1 F"
SdUTION
Hlnnehaha Rural Water
Sioux Rural Water
Tri-County Rural Water
Tri-County Rural Water
New Wei 1
East Gregory Rural Water
Tri-County Rural Water
Aurora-Brule Rural Water
Change In treatment ;--.
Aurora-Srule Rural,. Water
B-Y Phase II Rural Water
New Bad 2 treatment plant
8-Y Phase I Rural Water
New treatment plant
New treatment plant
Randall III Rural Water
Aurora-Brule Rural Water
B-Y Phase I Rural Water
B-Y Phase I Rural Water
Aurora-Brule Rural Water
Trlpp Rural Water
New source
TOTAL POPULATION 22,246
AFFECTED
-19-
image:
 SOUTH DAKOTA
Water System Improvements
Planned Projects
- 186
TOWN
Mound City
Do! and
Redfield
Rockham
Ori ent
Northville
Mellette
Brentford
Conde
Ferney
Amherst
Ipswich
Bath Trailer
Zell
Reliance
Cl arenont
Langford
Dallas
Fairview
Elk ton
Philip
POPULATION
111
331
3,027
52
87
138
192
92 -.
259 -
51
75
1,153
100
69
190
180
307
199
90
532
1,083
LEVEL/TYPE
CONTAMI NANT
3.1 mg/1 F-
3.0 mg/1 F-
2.5 mg/1 F-
3.1 mg/1 F-
2.8 mg/1 F-
3.4 rag/1 F~
2.8 mg/1 F"
2.5 mg/1 F~
17.0 ug/1 Se •
3.8 mg/1 F- :-
3.3 mg/1 ?" '
6.9 mg/1 F"
3.0 mg/1 F-
3.5 mg/1 F-
>2.4 mg/1 F~
2.6 mg/1 F"
4.3 mg/1 F~
6.7 mg/1 F-
29.6 mg/1 N03-
22.8 mg/1 NQ3~
25.0 mg/1 N03'
10.0 pCi/1 Radium
SOLUTION
KEff Rural Water
« « "
H • •
H * *
H * m
•
m H »
mm *
m * m
mm' •
M « •
« » *
• * •
Connect to Oacoma
BOM Rural Water
BDH Rural Water
Tripp Rural Water
N'ew well (HUD funds)
New well
Modify plant
f » M M*. *» 9 _ \
PROPOSED
DATE
• January 1985
(estimate)
*
"
m
*
a
*
"
„ I
"
"-
*
*
Summer 1933
Spring 1983
»
-20-
image:
SOUTH DAKOTA
Water System Improvements
Planned Projects
- 186
TOWN
Mound City
Do! and
Redfield
Rockham
Ori ent
Northville
Mellette
Brentford
Conde
Ferney
Amherst
Ipswich
Bath Trailer
Zell
Reliance
Cl arenont
Langford
Dallas
Fairview
Elk ton
Philip
POPULATION
111
331
3,027
52
87
138
192
92 -.
259 -
51
75
1,153
100
69
190
180
307
199
90
532
1,083
LEVEL/TYPE
CONTAMI NANT
3.1 mg/1 F-
3.0 mg/1 F-
2.5 mg/1 F-
3.1 mg/1 F-
2.8 mg/1 F-
3.4 rag/1 F~
2.8 mg/1 F"
2.5 mg/1 F~
17.0 ug/1 Se •
3.8 mg/1 F- :-
3.3 mg/1 ?" '
6.9 mg/1 F"
3.0 mg/1 F-
3.5 mg/1 F-
>2.4 mg/1 F~
2.6 mg/1 F"
4.3 mg/1 F~
6.7 mg/1 F-
29.6 mg/1 N03-
22.8 mg/1 NQ3~
25.0 mg/1 N03'
10.0 pCi/1 Radium
SOLUTION
KEff Rural Water
« « "
H • •
H * *
H * m
•
m H »
mm *
m * m
mm' •
M « •
« » *
• * •
Connect to Oacoma
BOM Rural Water
BDH Rural Water
Tripp Rural Water
N'ew well (HUD funds)
New well
Modify plant
f » M M*. *» 9 _ \
PROPOSED
DATE
• January 1985
(estimate)
*
"
m
*
a
*
"
„ I
"
"-
*
*
Summer 1933
Spring 1983
»
-20-
image:
 187
Henno
Humboldt
Raymond
Draper
Wolsey
Quinn
Gregory
793
487
105
138
437
80
1,503
7.0 pCi/l'-Radium
5.4 pCi/1 Radium
5.4 mg/1 F"
3.0 mg/1 F-
>2.4 rag/1 f
3.2 rag/1 F-
16.5 mg/1 N03~
B-Y Rural Water
Minnehaha Rural Water
Clark Rural Water
West River Aqueduct
or lyman-Oones Rural
Water
North Beadle-Southern
Spink Rural Water
Lyr.an-Jones Rural
Water
New source Fall 1983
TOTAL POPULATION 12,017
AFFECTED
-21-
image:
187
Henno
Humboldt
Raymond
Draper
Wolsey
Quinn
Gregory
793
487
105
138
437
80
1,503
7.0 pCi/l'-Radium
5.4 pCi/1 Radium
5.4 mg/1 F"
3.0 mg/1 F-
>2.4 rag/1 f
3.2 rag/1 F-
16.5 mg/1 N03~
B-Y Rural Water
Minnehaha Rural Water
Clark Rural Water
West River Aqueduct
or lyman-Oones Rural
Water
North Beadle-Southern
Spink Rural Water
Lyr.an-Jones Rural
Water
New source Fall 1983
TOTAL POPULATION 12,017
AFFECTED
-21-
image:
 \_
B; 2. Waterborne Transmission,of Giardiasis '
for a number of reasons, the Rocky Mountain area Is particularly suscep-
tible to outbreaks of giardiasis, caused by the pathogen Glardia larnblja.
Heavy use of Colorado watersheds, ready access to surface watar supplies and
little or no treatment of these surface water supplies have all contributed to
the high number of outbreaks. In most of the communities that have experienced
outbreaks, surface water has been used with no treatment or with inadequate
filtration.
Outbreaks of the disease have occurred in Colorado, Utah, Montana and
Wyoming. The number of outbreaks reported in Colorado has been particularly
high, due in part to the increased surveillance for this disease. Eleven
outbreaks have been documented in Colorado. Seven of these occurred during
the period between spring of 1980 and spring of 1932 when an EPA/Center for
Disease Control-sponsored waterborne disease surveillance program was carried
out by the Colorado Department of Health.
Giardiasis is characterized by diarrhea, weakness, weight loss and fever.
It has never caused a fatality, but it is still considered a significant
problem.
-22-
image:
\_
B; 2. Waterborne Transmission,of Giardiasis '
for a number of reasons, the Rocky Mountain area Is particularly suscep-
tible to outbreaks of giardiasis, caused by the pathogen Glardia larnblja.
Heavy use of Colorado watersheds, ready access to surface watar supplies and
little or no treatment of these surface water supplies have all contributed to
the high number of outbreaks. In most of the communities that have experienced
outbreaks, surface water has been used with no treatment or with inadequate
filtration.
Outbreaks of the disease have occurred in Colorado, Utah, Montana and
Wyoming. The number of outbreaks reported in Colorado has been particularly
high, due in part to the increased surveillance for this disease. Eleven
outbreaks have been documented in Colorado. Seven of these occurred during
the period between spring of 1980 and spring of 1932 when an EPA/Center for
Disease Control-sponsored waterborne disease surveillance program was carried
out by the Colorado Department of Health.
Giardiasis is characterized by diarrhea, weakness, weight loss and fever.
It has never caused a fatality, but it is still considered a significant
problem.
-22-
image:
 IV.
Ground Water Quality Section
Environmental Management Report
Page Ntmber
Part I. Introduction - Overview of Status and Trends 191
A. Region 8 Ground Water Use
3. Trends in Ground Water Quality
C. Aquifer Maps 193
Part II. EPA Ground Hater Protection Activities 199
A. Statutory Obli gat! ons
1. SOi-A
2. RCRA
3. TSCA
4. FIFRA
5. Superfund (CERCLA)
6. Clean Water Act
7. NEPA
B- Imp! icati ens for Management 200
1. Ground Water Use in Region VIII
2. Monitoring Needs
C. Possible Ground Water Protection Strategies 201
1. Permitting Actions: RCRA, UIC, 404 Permits,
Municipal Waste Water Permits
2. Grant Actions: Municipal Grants for Waste
Water Treatment, Superfund Cleanup, Areawi de
Water Quality Plans, Nationwide Urban Runoff
Program
3. Mine Wastes Policy: Coal, Uranium, Metal Mining,
Oil Shale
4. Survey of Pits, Ponds and Lagoons
5. County and State Land Use Planning
6. Spill Prevention and Cleanup
7. Assistance to State Oil Inspectors
8. Quality Changes Due to Ground Water Exploitation
9. Quality Changes as a Result of Oil, Gas, and
Mining Exploration
10. Additional Monitoring and Coordination of
Federal Agency Programs
image:
IV.
Ground Water Quality Section
Environmental Management Report
Page Ntmber
Part I. Introduction - Overview of Status and Trends 191
A. Region 8 Ground Water Use
3. Trends in Ground Water Quality
C. Aquifer Maps 193
Part II. EPA Ground Hater Protection Activities 199
A. Statutory Obli gat! ons
1. SOi-A
2. RCRA
3. TSCA
4. FIFRA
5. Superfund (CERCLA)
6. Clean Water Act
7. NEPA
B- Imp! icati ens for Management 200
1. Ground Water Use in Region VIII
2. Monitoring Needs
C. Possible Ground Water Protection Strategies 201
1. Permitting Actions: RCRA, UIC, 404 Permits,
Municipal Waste Water Permits
2. Grant Actions: Municipal Grants for Waste
Water Treatment, Superfund Cleanup, Areawi de
Water Quality Plans, Nationwide Urban Runoff
Program
3. Mine Wastes Policy: Coal, Uranium, Metal Mining,
Oil Shale
4. Survey of Pits, Ponds and Lagoons
5. County and State Land Use Planning
6. Spill Prevention and Cleanup
7. Assistance to State Oil Inspectors
8. Quality Changes Due to Ground Water Exploitation
9. Quality Changes as a Result of Oil, Gas, and
Mining Exploration
10. Additional Monitoring and Coordination of
Federal Agency Programs
image:
 Ground Water Qual-ity Section (continued)
Attachment A - Suggested Priority of Region 8 Ground Water Threats
1. Rankl ng of Acti vlti es in Approximate Order of
Importance to Limiting Ground Water Uses in Region 3
(Ranking of Generic Ground Water Issues)
Ground Water Quality Problems - Key
2. Maps of Site-Specific Problems by State
Colorado
Montana
North Dakota
South Dakota •
Utah
Wyoming
Attachment B - Details j)f_ the Most Si gni Fie ant
Ground Water Quality Threats by State
Colorado
Montana
North Dakota
South Dakota
Utah
VTyom i ng *
"j C)Q
Page Munber
205
205
207
209
208
210
213
215
217
219
221
221
231
238
240
243
246
image:
Ground Water Qual-ity Section (continued)
Attachment A - Suggested Priority of Region 8 Ground Water Threats
1. Rankl ng of Acti vlti es in Approximate Order of
Importance to Limiting Ground Water Uses in Region 3
(Ranking of Generic Ground Water Issues)
Ground Water Quality Problems - Key
2. Maps of Site-Specific Problems by State
Colorado
Montana
North Dakota
South Dakota •
Utah
Wyoming
Attachment B - Details j)f_ the Most Si gni Fie ant
Ground Water Quality Threats by State
Colorado
Montana
North Dakota
South Dakota
Utah
VTyom i ng *
"j C)Q
Page Munber
205
205
207
209
208
210
213
215
217
219
221
221
231
238
240
243
246
image:
 REGION VIII EMR
GROUND WATER PROTECTION MEDIUM
Part I. Introduction - Overview of Status and Trends
A. Region VIII Ground Water Use
In the region's six states, there are 3,136 community water systems and
5,536 non-corrmunity water systems of which over 90 oercent obtain all or part
of their suoolies from ground water aquifers. Approximately 95 percent of the
region's oooulation in the rural areas obtain their sole water supply from
orivate wells.
The region's aquifers include: 1) the Central and Great Basin carbonate
formations 2) the sandstone aquifers 3) the alluvial aquifers adjacent to
stream valleys 4) the semi-consolidated sands and siltstones ,5) the
fractured granitic, metamorohic and volcanic rock aquifers of the Central
Rockies and 6) glacial drift aquifers.
The Central and Great'Basin carbonate formations (limestones and
dolomites) usually have "hard waters" containing naturally high inorganic
concentrations, some of which are of health concern, such as fluoride,
selenium, uranium and arsenic. The sandstone aquifers, including the massive
Dakota Sandstone and the comolex folded and faulted sandstone deposits on
either side of the Rocky Mountains, often contain waters of high quality,
esoecially near their mountain recharge zones. The alluvial aquifers, stream
erosional features, are tied to the stream flow and thus reflect the stream
quality which varies from high mountain oristine conditions to alluvial waters
degraded by municipal, industrial, agricultural and mining operations. It is
these shallow, highly developed areas where most of the region's 31 hazardous
waste and 38 solid waste sites susoected of ground water pollution are
located. (Abandoned solid waste sites are not readily locatable and have not
been inventoried.) The fractured granitic metamorphic and volcanic rock
aquifers of the Central Rockies which, although limited in quantity, supply
the only source for many of the region's mountain villages. Due to their
limited dilutional caoacity and thin overlying soils, these aquifers are
readily contaminated from seotic wastes or hazardous waste spills. The
glacial drift aquifers in the eastern half of the Dakota plains often contain
such high concentrations of inorganic solids they are little used, though they
orovide locally important agriculture and mining supplies.
8. Trends in Ground Water Quality
A 'survey conducted on a random sample of ground water systems in the
Region in 1980 found traces of trihalomethanes and volatile organics in 56
oercent of the conmunity well systems. The regional agricultural areas suffer
from saline increases due to irrigation oractices notably in the Grand Valley,
Uncomoahgre Valley, the Arkansas Valley of Colorado, and the northeastern
olains of Colorado in the Ogallala Aquifer and the Uinta Valley of Utah.
Increasing concentrations of nitrates occur in the Big Sioux Valley of South
Dakota and the South Platte Valley of Colorado as a result of agriculture
oractices, municioal waste discharges, and old landfills in the floodplain.
image:
REGION VIII EMR
GROUND WATER PROTECTION MEDIUM
Part I. Introduction - Overview of Status and Trends
A. Region VIII Ground Water Use
In the region's six states, there are 3,136 community water systems and
5,536 non-corrmunity water systems of which over 90 oercent obtain all or part
of their suoolies from ground water aquifers. Approximately 95 percent of the
region's oooulation in the rural areas obtain their sole water supply from
orivate wells.
The region's aquifers include: 1) the Central and Great Basin carbonate
formations 2) the sandstone aquifers 3) the alluvial aquifers adjacent to
stream valleys 4) the semi-consolidated sands and siltstones ,5) the
fractured granitic, metamorohic and volcanic rock aquifers of the Central
Rockies and 6) glacial drift aquifers.
The Central and Great'Basin carbonate formations (limestones and
dolomites) usually have "hard waters" containing naturally high inorganic
concentrations, some of which are of health concern, such as fluoride,
selenium, uranium and arsenic. The sandstone aquifers, including the massive
Dakota Sandstone and the comolex folded and faulted sandstone deposits on
either side of the Rocky Mountains, often contain waters of high quality,
esoecially near their mountain recharge zones. The alluvial aquifers, stream
erosional features, are tied to the stream flow and thus reflect the stream
quality which varies from high mountain oristine conditions to alluvial waters
degraded by municipal, industrial, agricultural and mining operations. It is
these shallow, highly developed areas where most of the region's 31 hazardous
waste and 38 solid waste sites susoected of ground water pollution are
located. (Abandoned solid waste sites are not readily locatable and have not
been inventoried.) The fractured granitic metamorphic and volcanic rock
aquifers of the Central Rockies which, although limited in quantity, supply
the only source for many of the region's mountain villages. Due to their
limited dilutional caoacity and thin overlying soils, these aquifers are
readily contaminated from seotic wastes or hazardous waste spills. The
glacial drift aquifers in the eastern half of the Dakota plains often contain
such high concentrations of inorganic solids they are little used, though they
orovide locally important agriculture and mining supplies.
8. Trends in Ground Water Quality
A 'survey conducted on a random sample of ground water systems in the
Region in 1980 found traces of trihalomethanes and volatile organics in 56
oercent of the conmunity well systems. The regional agricultural areas suffer
from saline increases due to irrigation oractices notably in the Grand Valley,
Uncomoahgre Valley, the Arkansas Valley of Colorado, and the northeastern
olains of Colorado in the Ogallala Aquifer and the Uinta Valley of Utah.
Increasing concentrations of nitrates occur in the Big Sioux Valley of South
Dakota and the South Platte Valley of Colorado as a result of agriculture
oractices, municioal waste discharges, and old landfills in the floodplain.
image:
 192
Uranium concentrations are naturally high and thought to be increasing due to
land use related activities along the North and South Platte basins of
Colorado and Wyoming. Regional mining activities are adding heavy metals and
salinity to the ground waters to the extent that several community wells have
been abandoned in the Jordan River Valley of Utah as a result of salt
increases susoected to be from the adjacent cooper mining activity. High
selenium, fluoride and uranium concentrations in the western portion of South
Dakota, eastern Wyoming and northeastern Colorado caused by natural conditions
oose some long term health risks, local "hot soots" due to hazardous wastes,
solid waste, leaking underground tanks, injection of oil and gas brines, acid
mine drainage, and accidental industrial spills all pose health risks for
small isolated areas in the Region.
Oesoite these problems, few instances of waterborne disease or chemical
ooisoninq due to contaminated ground water have been reported in the Region.,
This is due to the fact that any reduced health effects as a result of low
level exoosure to organic and inorganic constituents are not reported, (and
such exoosure takes several decades to develop in the exposed population).
Some of the risk, (such as nitrate exposure by pregnant women) is avoided by
using bottled water and the hazardous waste contamination usually does not
occur in areas of ground water use and is thus avoided. The latter is due
either to isolation of such disoosal sites from the population, the generally
deeo aquifers in the Region not readily susceptible to contamination or the
location of these facilities, which may release contaminated leachates to
shallow alluvial aquifers but which then flow directly to streams.
The following maos of the regional aquifer locations are for the purposes
of identifying these ground water resources in a very general manner. They
should not be utilized for specific reference due their scale and the
approximate location of boundaries. The complex folded and faulted geology
along the Rocky Mountain uplift, the Central Basin and the Basin and Range
Province and the Overthrust Belt in Utah, Wyoming and Montana are too detailed
to understand on a map of this scale. As an example, the State of Wyoming
reports that since many aquifers are not contiguous across valleys, the number
of currently used aquifers in that state is close to one thousand different
strata.
Consult with the State Geological Survey, State Engineer's Office and the
environmental health organization in each state for detailed aquifer locations.
-z-
image:
192
Uranium concentrations are naturally high and thought to be increasing due to
land use related activities along the North and South Platte basins of
Colorado and Wyoming. Regional mining activities are adding heavy metals and
salinity to the ground waters to the extent that several community wells have
been abandoned in the Jordan River Valley of Utah as a result of salt
increases susoected to be from the adjacent cooper mining activity. High
selenium, fluoride and uranium concentrations in the western portion of South
Dakota, eastern Wyoming and northeastern Colorado caused by natural conditions
oose some long term health risks, local "hot soots" due to hazardous wastes,
solid waste, leaking underground tanks, injection of oil and gas brines, acid
mine drainage, and accidental industrial spills all pose health risks for
small isolated areas in the Region.
Oesoite these problems, few instances of waterborne disease or chemical
ooisoninq due to contaminated ground water have been reported in the Region.,
This is due to the fact that any reduced health effects as a result of low
level exoosure to organic and inorganic constituents are not reported, (and
such exoosure takes several decades to develop in the exposed population).
Some of the risk, (such as nitrate exposure by pregnant women) is avoided by
using bottled water and the hazardous waste contamination usually does not
occur in areas of ground water use and is thus avoided. The latter is due
either to isolation of such disoosal sites from the population, the generally
deeo aquifers in the Region not readily susceptible to contamination or the
location of these facilities, which may release contaminated leachates to
shallow alluvial aquifers but which then flow directly to streams.
The following maos of the regional aquifer locations are for the purposes
of identifying these ground water resources in a very general manner. They
should not be utilized for specific reference due their scale and the
approximate location of boundaries. The complex folded and faulted geology
along the Rocky Mountain uplift, the Central Basin and the Basin and Range
Province and the Overthrust Belt in Utah, Wyoming and Montana are too detailed
to understand on a map of this scale. As an example, the State of Wyoming
reports that since many aquifers are not contiguous across valleys, the number
of currently used aquifers in that state is close to one thousand different
strata.
Consult with the State Geological Survey, State Engineer's Office and the
environmental health organization in each state for detailed aquifer locations.
-z-
image:
 CARBONATE AQUIFERS
image:
CARBONATE AQUIFERS
image:
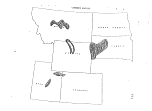 SANDblUNt AlJUlhLKS
Kff^^y^^&^^^f^^Sr^
image:
SANDblUNt AlJUlhLKS
Kff^^y^^&^^^f^^Sr^
image:
 KiNhUUS, MLIAMIMI'IIIC AND VOLCANIC AQUIFERS
U1
image:
KiNhUUS, MLIAMIMI'IIIC AND VOLCANIC AQUIFERS
U1
image:
 SEMI-CONSOLIDATED SANDSTONE AND SILTSTONE .
SMwifl^^^t
MHsv*$w^**$
*J|s • #*vn ra? *&$«•
t^&XVbali^iUdil^&.Al&i
ON
image:
SEMI-CONSOLIDATED SANDSTONE AND SILTSTONE .
SMwifl^^^t
MHsv*$w^**$
*J|s • #*vn ra? *&$«•
t^&XVbali^iUdil^&.Al&i
ON
image:
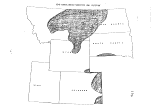 N
i
Nl
image:
N
i
Nl
image:
 GLACIAL DRIFT AQUIFERS
J
Cfa
NS$?^»W^f w-1
&^^Sm^^^\
i^^^^ff^^w^tJtJ^A. •
vo
QQ
image:
GLACIAL DRIFT AQUIFERS
J
Cfa
NS$?^»W^f w-1
&^^Sm^^^\
i^^^^ff^^w^tJtJ^A. •
vo
QQ
image:
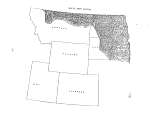 199
Part II. Regional Overview of Ground Water Protection Activities
Region VIII activities to protect ground water resources for beneficial
use, primarily drinking water, include activities under seven separate
legislative requirements. These include:
1. The Safe Drinking Water Act — Under the SDWA the regional office
oversees and assists the public water system orogram for four states and
directly imolements the orogram for the states of South Dakota and Wyoming.
Key issues under this asoect of the SDWA program include monitoring and
reoorting for inorganic pollutants, investigation of potential contamination
and orotection of the aquifers. The region also administers the Sole Source
Aquifer Program under Section 1424 of the SDWA. To date no sole source
aquifers have been designated in the region. A study of the Big Sioux Aquifer
in South Dakota is underway to determine if the state should request that EPA
designate it as a sole source. An emerging program soon to begin in four
states is the oermitting requirements of the Underground Injection Control
orogram. Utah and Wyoming have been delegated by the region to administer the
UIC orogram; North and South Dakota will receive delegation shortly. EPA
Region VIII intends to administer the UIC program in Colorado and Montana.
The key issue in the region is to protect underground sources of drinking
water from contamination due to the activities associated with oil and gas
recovery operations.
2. The Resource Conservation and Recovery Act — Under the RCRA
administered oermitting activities for hazardous waste disposal, one of the
orimary objectives is to orotect the ground water from possible contamination.^
So*cial containment structures, including double liners and extensive ground
water monitoring orovisions of the RCRA regulations are designed to eliminate
subsurface contamination. In severe cases such as the Iowry Landfill near the
Denver Metrooolitan area, RCRA enforcement was utilized to seek to impose
fines on its ooerators because leaks were susoected from this operation.
Under the solid waste orovisions of the Act, Region VIII assists local
governments and Indian Nations in developing better landfill ooerations that
will be orooerly located and designed to orotect the ground waters.
3. The Toxic Substances Control Act — Under TOSCA the region has been
active in containing oolychlorinated biphenyl (PCS) spills and improperly
located transformers containing PCS. In western Colorado several underground
coal mining ooerations were found to have old transformers containing PCS's.
These transformers were below the ground water table and were thought to pose
a ground water contamination risk especially if the mines closed as planned.
With the comoany's helo, the regional staff aided the removal of these items
to oermitted hazardous waste sites.
4. The Federal Insecticide, Fungicide and Rodenticide Act — Under FIFRA
the orocedures of registering the insecticides and licensing the operators,
the ootential for ground water problems due to improperly applied pesticides
is reduced. The region has investigated approximately 800 allegations of
imorooer oesticide use and only a very few are suspected of possible ground
water contamination. Perhaos if these procedures had been in place in the
1950's the high arsenic concentrations in North Dakota, thought to be a result
of indiscriminate aoolication of arsenicals for grasshopper control, would not
have occurred.
image:
199
Part II. Regional Overview of Ground Water Protection Activities
Region VIII activities to protect ground water resources for beneficial
use, primarily drinking water, include activities under seven separate
legislative requirements. These include:
1. The Safe Drinking Water Act — Under the SDWA the regional office
oversees and assists the public water system orogram for four states and
directly imolements the orogram for the states of South Dakota and Wyoming.
Key issues under this asoect of the SDWA program include monitoring and
reoorting for inorganic pollutants, investigation of potential contamination
and orotection of the aquifers. The region also administers the Sole Source
Aquifer Program under Section 1424 of the SDWA. To date no sole source
aquifers have been designated in the region. A study of the Big Sioux Aquifer
in South Dakota is underway to determine if the state should request that EPA
designate it as a sole source. An emerging program soon to begin in four
states is the oermitting requirements of the Underground Injection Control
orogram. Utah and Wyoming have been delegated by the region to administer the
UIC orogram; North and South Dakota will receive delegation shortly. EPA
Region VIII intends to administer the UIC program in Colorado and Montana.
The key issue in the region is to protect underground sources of drinking
water from contamination due to the activities associated with oil and gas
recovery operations.
2. The Resource Conservation and Recovery Act — Under the RCRA
administered oermitting activities for hazardous waste disposal, one of the
orimary objectives is to orotect the ground water from possible contamination.^
So*cial containment structures, including double liners and extensive ground
water monitoring orovisions of the RCRA regulations are designed to eliminate
subsurface contamination. In severe cases such as the Iowry Landfill near the
Denver Metrooolitan area, RCRA enforcement was utilized to seek to impose
fines on its ooerators because leaks were susoected from this operation.
Under the solid waste orovisions of the Act, Region VIII assists local
governments and Indian Nations in developing better landfill ooerations that
will be orooerly located and designed to orotect the ground waters.
3. The Toxic Substances Control Act — Under TOSCA the region has been
active in containing oolychlorinated biphenyl (PCS) spills and improperly
located transformers containing PCS. In western Colorado several underground
coal mining ooerations were found to have old transformers containing PCS's.
These transformers were below the ground water table and were thought to pose
a ground water contamination risk especially if the mines closed as planned.
With the comoany's helo, the regional staff aided the removal of these items
to oermitted hazardous waste sites.
4. The Federal Insecticide, Fungicide and Rodenticide Act — Under FIFRA
the orocedures of registering the insecticides and licensing the operators,
the ootential for ground water problems due to improperly applied pesticides
is reduced. The region has investigated approximately 800 allegations of
imorooer oesticide use and only a very few are suspected of possible ground
water contamination. Perhaos if these procedures had been in place in the
1950's the high arsenic concentrations in North Dakota, thought to be a result
of indiscriminate aoolication of arsenicals for grasshopper control, would not
have occurred.
image:
 200
5. Comorehensive Environmental Resoonse and liability Act — Under the
"Suoerfund" legislation, the regional office has identified 555 sites, of
which aooroximately 99 oercent were thought to pose some risk to the local
ground and surface waters. Of the five currently funded sites under
investigation for "Suoerfund" clean uo, four of them include known
contamination for the subsurface waters.
5. Clean Water Act -- Under the CWA, which does not include ground water
activities directly, the region has requested the states to report annually on
ground water oroblems. In addition, the 208 areawide planning efforts contain
some funding, on occasion, to study ground water as well as surface water
oollution issues. The highlight of this kind of activity is the Jordan River
Aquifer study in Salt Lake County, Utah. Under the CWA acts municipal grant
orogram communities are studied for ground water nitrate contamination from
seotic tanks, a tyoical problem in the region where thin and tight clay soils
occur. Areas around Salt lake City, Denver's mountain suburbs and the
foothills of the Black Hills of South Dakota need centralized sewage
facilities because of these seotic tank limitations. At 61 municipal and
industrial sites in the region, the land disposal of effluent occurs under
conditions designed to orotect the shallow ground water from nitrate and viral
contamination.
i
7. National Environmental Policy Act — Under NEPA the region reviews
over 120 Environmental Imoact Statements annually of which approximately 20 to
30 oercent include a significant ground water issue. Chief among these are
the Salinity Control Projects where natural or land use aggravated salt build
uo is to be controlled. In one examole, after reviewing the Paradox Valley
orooosal, the regional staff convinced the Bureau of Reclamation to dispose'of
the salt brines by deeo underground injection rather than surface ponds, which
oosed a risk to the local aquifer.
3. Imolicationsfor Management
1. Ground Water Use and Management in Region VIII
As can be seen by the information oresented in the introduction, the
regional rural oooulation is aporoximately 95 percent dependent upon ground
water suoolies. Presently no community water system in the region enjoys the
orotection of being designated as a sole-source aquifer. Ground water is
managed differently by the region's six states, All states but Utah have a
ground water reference in their general statutes; while South Dakota and
Wvoming have soecific ground water laws. Only Wyoming has specific
requirements for ground water quality and an aquifer classification system.
Colorado suooorts the need for both specific standards and for an aquifer use
classification system. None of the region's states have authority to limit
ground water use based on deteriorating ground water quality although twenty
states in the country have some such orovision.
2. Monitoring Needs
One of the needs in order to monitor these trends in regional ground
water quality is a coordinated monitoring effort both by states and the
federal establishment. Currently the region requires all communities to
image:
200
5. Comorehensive Environmental Resoonse and liability Act — Under the
"Suoerfund" legislation, the regional office has identified 555 sites, of
which aooroximately 99 oercent were thought to pose some risk to the local
ground and surface waters. Of the five currently funded sites under
investigation for "Suoerfund" clean uo, four of them include known
contamination for the subsurface waters.
5. Clean Water Act -- Under the CWA, which does not include ground water
activities directly, the region has requested the states to report annually on
ground water oroblems. In addition, the 208 areawide planning efforts contain
some funding, on occasion, to study ground water as well as surface water
oollution issues. The highlight of this kind of activity is the Jordan River
Aquifer study in Salt Lake County, Utah. Under the CWA acts municipal grant
orogram communities are studied for ground water nitrate contamination from
seotic tanks, a tyoical problem in the region where thin and tight clay soils
occur. Areas around Salt lake City, Denver's mountain suburbs and the
foothills of the Black Hills of South Dakota need centralized sewage
facilities because of these seotic tank limitations. At 61 municipal and
industrial sites in the region, the land disposal of effluent occurs under
conditions designed to orotect the shallow ground water from nitrate and viral
contamination.
i
7. National Environmental Policy Act — Under NEPA the region reviews
over 120 Environmental Imoact Statements annually of which approximately 20 to
30 oercent include a significant ground water issue. Chief among these are
the Salinity Control Projects where natural or land use aggravated salt build
uo is to be controlled. In one examole, after reviewing the Paradox Valley
orooosal, the regional staff convinced the Bureau of Reclamation to dispose'of
the salt brines by deeo underground injection rather than surface ponds, which
oosed a risk to the local aquifer.
3. Imolicationsfor Management
1. Ground Water Use and Management in Region VIII
As can be seen by the information oresented in the introduction, the
regional rural oooulation is aporoximately 95 percent dependent upon ground
water suoolies. Presently no community water system in the region enjoys the
orotection of being designated as a sole-source aquifer. Ground water is
managed differently by the region's six states, All states but Utah have a
ground water reference in their general statutes; while South Dakota and
Wvoming have soecific ground water laws. Only Wyoming has specific
requirements for ground water quality and an aquifer classification system.
Colorado suooorts the need for both specific standards and for an aquifer use
classification system. None of the region's states have authority to limit
ground water use based on deteriorating ground water quality although twenty
states in the country have some such orovision.
2. Monitoring Needs
One of the needs in order to monitor these trends in regional ground
water quality is a coordinated monitoring effort both by states and the
federal establishment. Currently the region requires all communities to
image:
 201
reoort evsry third year on inorganic testing of their drinking water. This
does not include the exoensive tests for organic pollutants such as pesticides
or other hazardous substances. This data is widely scattered in the states
and the other Federal agencies without a centralized data base such as the
STQRET data base for surface water. Each state engineer's office and the
state health departments maintain some ground water data as does the state
agency resoonsible for oil, gas and mining activities. In the federal
establishment, the U.S. Geological Survey, the Bureau of Reclamation, the
Coros of Engineers, the Bureau of Land Management, the Forest Service, the
Bureau of Indian Affairs, the Department of Defense, the Bureau of Mines, the
cish and Wildlife Service and the Nuclear Regulatory Commission all maintain
seoarate ground water data bases.
There is a need for both a centralized ground water data base in order to
assess trends in quality and an exoanded list of required monitoring
oarameters to determine ootential health risks.
C. Possible Ground Water Protection Strategies
1. Permitting Actions: RCRA, UIC and 404 Permits
All RCRA oermitting actions follow rigorous requirements for the
orotection of the local subsurface waters. Key provisions include the double
liner requirements and the ground water monitoring provisions for both up and
down gradient flow. .Consideration should be given to the installation of
monitoring de/iees directly under the surface disposal sites to provide early
leak detection. In addition, the identification and notification of all
domestic and community wells within that area should be provided in the permit
notice.
Under the UIC program, the regulations require stringent protection of
underground sources of drinking water. (USDW's include all aquifers of less
than 10,000 oom TOS.) Since this program has only recently been delegated to
several states, it is too early to give an indication of its ability to
protect ground water. In Region VIII over 95 percent of the injection
activity involves brine disposal or water injection for secondary recovery of
oil and gas.
EPA's program to regulate Class II wells has been delegated to Utah and
Wyoming. North Dakota, South Dakota and Colorado are working toward assuming
the oroqram. Region VIII is presently working on an implementation program
for Montana. The UIC program for all other classes of wells has been
delegated to Utah and is expected to be delegated to North Dakota, Wyoming and
South Dakota shortly. The region expects to implement its program for Classes
I, III, IV, and V for Montana and Colorado. EPA's UIC program requires the
regulation of injection on all federal and Indian lands. This has created a
permitting overlap with the Minerals Division of BIM. EPA is working with BLM
to develop a policy to improve coordination on these permitting actions. It
will be important that regulatory means be developed for some of the region's
Indian Nations so that no "regulatory holes" exist where unregulated injection
activity could occur. Region VIII Indian Nations with significant injection
activity include the Fort Berthold, Fort Peck, Blackfeet, Crow, Wind River,
Uintah-Ouray, Southern Ute and Navajo Reservations.
image:
201
reoort evsry third year on inorganic testing of their drinking water. This
does not include the exoensive tests for organic pollutants such as pesticides
or other hazardous substances. This data is widely scattered in the states
and the other Federal agencies without a centralized data base such as the
STQRET data base for surface water. Each state engineer's office and the
state health departments maintain some ground water data as does the state
agency resoonsible for oil, gas and mining activities. In the federal
establishment, the U.S. Geological Survey, the Bureau of Reclamation, the
Coros of Engineers, the Bureau of Land Management, the Forest Service, the
Bureau of Indian Affairs, the Department of Defense, the Bureau of Mines, the
cish and Wildlife Service and the Nuclear Regulatory Commission all maintain
seoarate ground water data bases.
There is a need for both a centralized ground water data base in order to
assess trends in quality and an exoanded list of required monitoring
oarameters to determine ootential health risks.
C. Possible Ground Water Protection Strategies
1. Permitting Actions: RCRA, UIC and 404 Permits
All RCRA oermitting actions follow rigorous requirements for the
orotection of the local subsurface waters. Key provisions include the double
liner requirements and the ground water monitoring provisions for both up and
down gradient flow. .Consideration should be given to the installation of
monitoring de/iees directly under the surface disposal sites to provide early
leak detection. In addition, the identification and notification of all
domestic and community wells within that area should be provided in the permit
notice.
Under the UIC program, the regulations require stringent protection of
underground sources of drinking water. (USDW's include all aquifers of less
than 10,000 oom TOS.) Since this program has only recently been delegated to
several states, it is too early to give an indication of its ability to
protect ground water. In Region VIII over 95 percent of the injection
activity involves brine disposal or water injection for secondary recovery of
oil and gas.
EPA's program to regulate Class II wells has been delegated to Utah and
Wyoming. North Dakota, South Dakota and Colorado are working toward assuming
the oroqram. Region VIII is presently working on an implementation program
for Montana. The UIC program for all other classes of wells has been
delegated to Utah and is expected to be delegated to North Dakota, Wyoming and
South Dakota shortly. The region expects to implement its program for Classes
I, III, IV, and V for Montana and Colorado. EPA's UIC program requires the
regulation of injection on all federal and Indian lands. This has created a
permitting overlap with the Minerals Division of BIM. EPA is working with BLM
to develop a policy to improve coordination on these permitting actions. It
will be important that regulatory means be developed for some of the region's
Indian Nations so that no "regulatory holes" exist where unregulated injection
activity could occur. Region VIII Indian Nations with significant injection
activity include the Fort Berthold, Fort Peck, Blackfeet, Crow, Wind River,
Uintah-Ouray, Southern Ute and Navajo Reservations.
image:
 202
The 404 oermit oroqram for dredge and fill activity occasionally is
involved with recharge zones and sensitive alluvial aquifers. Coordination
with the reqion's ground water staff will be required to identify these few
situations.
2. Grant Actions: Superfund Cleanup, Municipal Grants for Waste Water
Treatment, Areawide Water Quality Plans and the Nationwide Urban
Runoff Program
These EPA program grants include ground water monitoring and protection
in a variety of ways. Four of the region's five funded Superfund Cleanup
Sites were selected primarily for the ground water contamination problems they
are creating. Assurance is made that during the environmental assessment of
these sites that all domestic and community wells in the immediate area ara
identified and if necessary protected. Coordination with the state public
water supply system program to provide indication of aquifer cleanup in these
areas should be encouraged.
The remaining grant efforts in the municipal waste water treatment
presently encourage the land application of municipal effluent and the states
should provide additional coordination with their ground water staffs when
these plans are considered.
Areawide water quality plans generally ignored the contribution that
contaminated alluvial waters affected their adjacent streams. In the Salt
lake County 208 plan this aspect of surface water problems was identified and
a unique study is underway to identify the effects of hazardous wastes, solid
wastes, mining leachates, seotic tanks, irrigation, leaking subsurface tanks ""
and urban runoff have on the local surface and subsurface water quality. More
could have been done under the 208 program to identify these
interconnections. There are no longer any 208 program funds available to the
states for such areawide functions.
The nationwide urban runoff program is limited in scope and should
include efforts to identify the role dry wells or drainage control wells play
in ground water contamination in the region's cities. (Primacy states are to
provide a state-wide assessment of these wells and other Class V wells but the
NURP Program could identify their significance in a local area.)
3.
-ji ail> uuu I u I ucii ^ i i j u. I c 11 i i yii i i i uanuc i u a i uv. a i ai cu. ;
Mine Waste Policy: Coal, Uranium, Metal Mining and Oil Shale Mining
The regional office is attempting to take an active role in addressing
through its recently formed Mining Waste Team to provide technical assistance
and a consistent regional approach to mining waste problems. Under Subtitle C
of RCRA the Agency is to report to Congress this spring on this aspect of
hazardous waste. .As identified in the Attachment B, at least 39 mining sites
in the region are known to include significant ground water pollution.
Additional coordination is necessary between the Radiation Section and the
NRC. An oversight role is needed to cover the Office of Surface Mining
provisions, although generally acid mine drainage as a result of coal mining
is not a problem in the region's alkaline soils. Cooper and molybdenum mining
have contaminated water supplies in Salt Lake County, the Animas River, the
uooer Arkansas River, the Ten Mile Creek drainage of the Slue River, the
'.eadville-California Gulch drainage and the Homestake drainage in the Black
image:
202
The 404 oermit oroqram for dredge and fill activity occasionally is
involved with recharge zones and sensitive alluvial aquifers. Coordination
with the reqion's ground water staff will be required to identify these few
situations.
2. Grant Actions: Superfund Cleanup, Municipal Grants for Waste Water
Treatment, Areawide Water Quality Plans and the Nationwide Urban
Runoff Program
These EPA program grants include ground water monitoring and protection
in a variety of ways. Four of the region's five funded Superfund Cleanup
Sites were selected primarily for the ground water contamination problems they
are creating. Assurance is made that during the environmental assessment of
these sites that all domestic and community wells in the immediate area ara
identified and if necessary protected. Coordination with the state public
water supply system program to provide indication of aquifer cleanup in these
areas should be encouraged.
The remaining grant efforts in the municipal waste water treatment
presently encourage the land application of municipal effluent and the states
should provide additional coordination with their ground water staffs when
these plans are considered.
Areawide water quality plans generally ignored the contribution that
contaminated alluvial waters affected their adjacent streams. In the Salt
lake County 208 plan this aspect of surface water problems was identified and
a unique study is underway to identify the effects of hazardous wastes, solid
wastes, mining leachates, seotic tanks, irrigation, leaking subsurface tanks ""
and urban runoff have on the local surface and subsurface water quality. More
could have been done under the 208 program to identify these
interconnections. There are no longer any 208 program funds available to the
states for such areawide functions.
The nationwide urban runoff program is limited in scope and should
include efforts to identify the role dry wells or drainage control wells play
in ground water contamination in the region's cities. (Primacy states are to
provide a state-wide assessment of these wells and other Class V wells but the
NURP Program could identify their significance in a local area.)
3.
-ji ail> uuu I u I ucii ^ i i j u. I c 11 i i yii i i i uanuc i u a i uv. a i ai cu. ;
Mine Waste Policy: Coal, Uranium, Metal Mining and Oil Shale Mining
The regional office is attempting to take an active role in addressing
through its recently formed Mining Waste Team to provide technical assistance
and a consistent regional approach to mining waste problems. Under Subtitle C
of RCRA the Agency is to report to Congress this spring on this aspect of
hazardous waste. .As identified in the Attachment B, at least 39 mining sites
in the region are known to include significant ground water pollution.
Additional coordination is necessary between the Radiation Section and the
NRC. An oversight role is needed to cover the Office of Surface Mining
provisions, although generally acid mine drainage as a result of coal mining
is not a problem in the region's alkaline soils. Cooper and molybdenum mining
have contaminated water supplies in Salt Lake County, the Animas River, the
uooer Arkansas River, the Ten Mile Creek drainage of the Slue River, the
'.eadville-California Gulch drainage and the Homestake drainage in the Black
image:
 203
Hills of South Dakota. The significance of these pollution sources is now
being studied by the reosective States with little or no coordinating or
assistance provided by EPA. Depending upon economic conditions, oil shale
mining may yet develoo on a large scale in Colorado and Utah. The potential
for contamination due to unusual hydrocarbons such as polynuclear aromatic
hydrocarbons is there, and little is known about the monitoring, movement, or
health risk oathways of this tyoe of oollutant. The recent loss of key staff
without replacement in the EIS review function will reduce the Region's
ability to provide early identification of potential mine-related groundwater
issues. Continued research by the Agency's Cincinnati Lab is essential and
the recent policy of not providing semi-annual reports of these research
contracts should be reversed to assure coordination between lab and regional
activities.
4. Survey of Pits, Ponds and lagoons
There has been a draft national report on industrial pits, ponds and
lagoons. The report indicates that generally the states lack sufficient
regulations or guidance to control leaking surface impoundments. The report
reconmends a technical assistance role and provides funds to assist the states
in implementation of an inspection program.
5. land Use Planning: Domestic Wastes, Non-Point Sources, Avoiding
Development on Recharge Zones
The role the states and counties play in identifying these areas for
protecting ground water varies. None of the region's states have specific
regulatory authority to assure that these factors are considered when land use
planning and development occur. Some of the region's counties have passed
land use measures that include these concerns for changes in land use. This
is a local and state program and the region's efforts include technical
assistance and minor work efforts in the NURP, 404, EIS review and RCRA
programs.
5. Spill Prevention and Clean Up
On some occasions spills of hazardous materials or gasoline spills have
contaminated local shallow aquifers. Since the emphasis in this program is to
clean UP the soil! regardless of whether land, surface or subsurface waters
are threatened, no special emphasis is necessary for ground water clean up.
However, followup after the event could be considered in some cases where it
is not currently to assure that hidden subsurface contamination has not
occurred. Consideration should be given to adding the independent Indian
Nations to the list of notified agencies in the event of spills on the
reservation to assure coordination at that level.
7, Assistance to State Oil Inspectors
When there is an underground storage tank leak of petroleum products, the
states often lack certain technical ability to identify the cause and effect
of these events. Assistance could be provided at the national level to define
the "signature" of these liquids in order to identify the manufacturer and at
the regional level for assistance in locating the rate and direction of the
olume migration. The Region's assistance on the Northglenn gasoline tank leak
is an example of this tyoe of assistance.
image:
203
Hills of South Dakota. The significance of these pollution sources is now
being studied by the reosective States with little or no coordinating or
assistance provided by EPA. Depending upon economic conditions, oil shale
mining may yet develoo on a large scale in Colorado and Utah. The potential
for contamination due to unusual hydrocarbons such as polynuclear aromatic
hydrocarbons is there, and little is known about the monitoring, movement, or
health risk oathways of this tyoe of oollutant. The recent loss of key staff
without replacement in the EIS review function will reduce the Region's
ability to provide early identification of potential mine-related groundwater
issues. Continued research by the Agency's Cincinnati Lab is essential and
the recent policy of not providing semi-annual reports of these research
contracts should be reversed to assure coordination between lab and regional
activities.
4. Survey of Pits, Ponds and lagoons
There has been a draft national report on industrial pits, ponds and
lagoons. The report indicates that generally the states lack sufficient
regulations or guidance to control leaking surface impoundments. The report
reconmends a technical assistance role and provides funds to assist the states
in implementation of an inspection program.
5. land Use Planning: Domestic Wastes, Non-Point Sources, Avoiding
Development on Recharge Zones
The role the states and counties play in identifying these areas for
protecting ground water varies. None of the region's states have specific
regulatory authority to assure that these factors are considered when land use
planning and development occur. Some of the region's counties have passed
land use measures that include these concerns for changes in land use. This
is a local and state program and the region's efforts include technical
assistance and minor work efforts in the NURP, 404, EIS review and RCRA
programs.
5. Spill Prevention and Clean Up
On some occasions spills of hazardous materials or gasoline spills have
contaminated local shallow aquifers. Since the emphasis in this program is to
clean UP the soil! regardless of whether land, surface or subsurface waters
are threatened, no special emphasis is necessary for ground water clean up.
However, followup after the event could be considered in some cases where it
is not currently to assure that hidden subsurface contamination has not
occurred. Consideration should be given to adding the independent Indian
Nations to the list of notified agencies in the event of spills on the
reservation to assure coordination at that level.
7, Assistance to State Oil Inspectors
When there is an underground storage tank leak of petroleum products, the
states often lack certain technical ability to identify the cause and effect
of these events. Assistance could be provided at the national level to define
the "signature" of these liquids in order to identify the manufacturer and at
the regional level for assistance in locating the rate and direction of the
olume migration. The Region's assistance on the Northglenn gasoline tank leak
is an example of this tyoe of assistance.
image:
 204
3. Quality Changes as a Result of Ground Water Exploitation
As qround water is deoleted the lower portions of that same aquifer can
contain increased concentrations of inorganic contaminants. The states in
Region VIII usually allow ground water develooment as an associated property
right not subject to state control. In some cases such as Colorado's South
Dlatte River Basin, there are limitations on the rate of withdrawal from
shallow alluvial aquifers since such sources are subject to the prior
aoorooriation system of senior uses. These limits on withdrawal can influence
quality though they are not intended for that purpose. In Wyoming, the
state's aquifer classification system (six classes with drinking as the
highest and an unusable class as the least protected) can be considered for
quality orotection purposes through their coordination of efforts between the
Oeoartment of Environmental Quality and the State Engineer's Office. The
agency should assure that any EPA funded research on these areas, such as that
done in the Ada, Oklahoma lab, is provided to the states for their
consideration.
9. Quality Changes as a Result of Oil, Gas and Mining Exploration
For the States of Colorado, Montana, North Dakota, South Dakota, and
Wyoming these activities reoresent some of the most serious threats to ground
water quality. In South Dakota, where large areas of the state are underlain
by artesian aquifers, unplugged exoloration wells allow migration of poor
quality waters uowards into better quality aquifers. In Wyoming, such
unolugged wells in the Big Sandy area have allowed salty brine to be released
to the surface and thereby contribute to salt increases in surface as well as
subsurface systems. Under EPA1s role on the Colorado Salinity Control Forum,
states should be encouraged to require proper plugging of abandoned
exoloration wells. As EPA is currently imolementing the SDWA for South
Dakota, this issue should be addressed under that program.
10. Additional Monitoring and Coordination of Federal Agency Programs
One of the imnortant Regional and National needs in order to monitor
trends in regional ground water quality is a coordinated monitoring effort
both by the states and the federal establishment that would be readily
avialable to concerned oarties. Currently, the Region.requires all
communities to reoort every third year on inorganic testing of their drinking
water. This does not include expensive tests for organic pollutants such as
oesticides or other hazardous substances. This data is widely scattered in
the states and other federal agencies without a centralized data base such as
the STORET data base for surface water. Each state engineer's office and the
state health deoartments maintain some ground water data as does the state
agency resoonsible for oil, gas and mining activities. In the federal
establishment, the U.S. Geological Survey, the Bureau of Reclamation, the
Coros of Engineers, the Bureau of Land Management, the Forest Service, Bureau
of Indian Affairs, Oeoartment of Defense, Bureau of Mines, Fish and Wildlife
Service and NRC all maintain separate ground water data bases.
image:
204
3. Quality Changes as a Result of Ground Water Exploitation
As qround water is deoleted the lower portions of that same aquifer can
contain increased concentrations of inorganic contaminants. The states in
Region VIII usually allow ground water develooment as an associated property
right not subject to state control. In some cases such as Colorado's South
Dlatte River Basin, there are limitations on the rate of withdrawal from
shallow alluvial aquifers since such sources are subject to the prior
aoorooriation system of senior uses. These limits on withdrawal can influence
quality though they are not intended for that purpose. In Wyoming, the
state's aquifer classification system (six classes with drinking as the
highest and an unusable class as the least protected) can be considered for
quality orotection purposes through their coordination of efforts between the
Oeoartment of Environmental Quality and the State Engineer's Office. The
agency should assure that any EPA funded research on these areas, such as that
done in the Ada, Oklahoma lab, is provided to the states for their
consideration.
9. Quality Changes as a Result of Oil, Gas and Mining Exploration
For the States of Colorado, Montana, North Dakota, South Dakota, and
Wyoming these activities reoresent some of the most serious threats to ground
water quality. In South Dakota, where large areas of the state are underlain
by artesian aquifers, unplugged exoloration wells allow migration of poor
quality waters uowards into better quality aquifers. In Wyoming, such
unolugged wells in the Big Sandy area have allowed salty brine to be released
to the surface and thereby contribute to salt increases in surface as well as
subsurface systems. Under EPA1s role on the Colorado Salinity Control Forum,
states should be encouraged to require proper plugging of abandoned
exoloration wells. As EPA is currently imolementing the SDWA for South
Dakota, this issue should be addressed under that program.
10. Additional Monitoring and Coordination of Federal Agency Programs
One of the imnortant Regional and National needs in order to monitor
trends in regional ground water quality is a coordinated monitoring effort
both by the states and the federal establishment that would be readily
avialable to concerned oarties. Currently, the Region.requires all
communities to reoort every third year on inorganic testing of their drinking
water. This does not include expensive tests for organic pollutants such as
oesticides or other hazardous substances. This data is widely scattered in
the states and other federal agencies without a centralized data base such as
the STORET data base for surface water. Each state engineer's office and the
state health deoartments maintain some ground water data as does the state
agency resoonsible for oil, gas and mining activities. In the federal
establishment, the U.S. Geological Survey, the Bureau of Reclamation, the
Coros of Engineers, the Bureau of Land Management, the Forest Service, Bureau
of Indian Affairs, Oeoartment of Defense, Bureau of Mines, Fish and Wildlife
Service and NRC all maintain separate ground water data bases.
image:
 205
Attachment A
PRIORITY RANKING OF THE REGION'S GROUND WATER THREATS
In considering the aooroximate ranking on the public health and adverse
economic and social costs of threats to ground water in the region, critical
data and analysis of information is lacking. While some 115 sites and broad
areas of aquifers in the region are identified as having some changes in
ground water quality, little data is available to trans late these changes into
environmental risks. Under the Water Quality Criteria Documents and the
Interim Primary Drinking Water Regulations, health'risks have been identified
for many but not all of the ground water contaminants identified in the
region's subsurface waters. However the extent that these contaminated
aquifers serve the oooulation in the region has not been identified in any
orogram with the oossible exception of the Rocky Mountain Arsenal. The
migration of pesticide waste from the Arsenal to the '-veil location in the
Brighton area has a thirty year history of relatively vigorous study and thus
differs from the recent attemots at identifying these risks.
Few instances of waterborne disease or chemical poisoning due to
contaminated ground water have been reported in the region. This is due to
the fact that any reduced health effects as a result of low level exposure to
organic and inorganic constituents are not reported, (and such exposure takes
several decades to develop in the exposed population), some of the population
at risk, (such as nitrate exposure by pregnant women) are avoided by using
bottled water, and the hazardous waste contamination usually does not occur in
areas of ground water use and are thus avoided. The latter is due either"to
isolation of such disposal sites from the population, the generally deep
aquifers in the region not readily susceptible to contamination or the
location of these facilities, although they may release contaminated
leachates, on shallow alluvial aquifers which flow directly to streams.
Despite this lack of data, the approximate priority of concern for health
risks and the other environmental and social costs of ground water threats in
the region can be defined into a priority ranking of concern. The following
listing should be used for discussion purposes only.
image:
205
Attachment A
PRIORITY RANKING OF THE REGION'S GROUND WATER THREATS
In considering the aooroximate ranking on the public health and adverse
economic and social costs of threats to ground water in the region, critical
data and analysis of information is lacking. While some 115 sites and broad
areas of aquifers in the region are identified as having some changes in
ground water quality, little data is available to trans late these changes into
environmental risks. Under the Water Quality Criteria Documents and the
Interim Primary Drinking Water Regulations, health'risks have been identified
for many but not all of the ground water contaminants identified in the
region's subsurface waters. However the extent that these contaminated
aquifers serve the oooulation in the region has not been identified in any
orogram with the oossible exception of the Rocky Mountain Arsenal. The
migration of pesticide waste from the Arsenal to the '-veil location in the
Brighton area has a thirty year history of relatively vigorous study and thus
differs from the recent attemots at identifying these risks.
Few instances of waterborne disease or chemical poisoning due to
contaminated ground water have been reported in the region. This is due to
the fact that any reduced health effects as a result of low level exposure to
organic and inorganic constituents are not reported, (and such exposure takes
several decades to develop in the exposed population), some of the population
at risk, (such as nitrate exposure by pregnant women) are avoided by using
bottled water, and the hazardous waste contamination usually does not occur in
areas of ground water use and are thus avoided. The latter is due either"to
isolation of such disposal sites from the population, the generally deep
aquifers in the region not readily susceptible to contamination or the
location of these facilities, although they may release contaminated
leachates, on shallow alluvial aquifers which flow directly to streams.
Despite this lack of data, the approximate priority of concern for health
risks and the other environmental and social costs of ground water threats in
the region can be defined into a priority ranking of concern. The following
listing should be used for discussion purposes only.
image:
 206
Table 1
Ranking of Activities in Aooroximate Order of Importance
To Limiting Ground Water Uses in Region VIII
1. Hazardous Waste Oisoosal Sites
?. Unolugged, Abandoned and Improperly Completed Exploration Wells
3. Industrial Pits, Ponds and Lagoons
4. Mining Wastes (Tailings Piles)
A. Uranium Tailings and Leaching Operations
8. Mining Wastes
1) Coooer Leaching and Waste Disposal
2) Oil Shale Mining (ootential)
3) Gold, Silver and other Metal Mining
4) Molybdenum Mining
5) Coal Mining
5. Sanitary Landfills
8. Injection of Liquid Wastes
A. Injection on Hazardous Wastes (no activity at present)
8. Injection of Mining Wastes and Mining Recovery
C. Injection of Brine and Waste Water in Oil and Gas Operations
7. Agricultural Practice
A. Improoer Pesticide Apclication
8. Irrigation and Fertilization (nitrate increases)
C. Irrigation Return Flow (salinity increases)
8. Natural and Land Use Aggravated Problems
A. Uranium Increases Due to Agriculture Soil Disturbance - -
8. Naturally high concentrations of arsenic, fluoride, selenium,
uranium and salt which increase due to ground water depletion
C. Development on Recharge Zones and Sensitive Areas
0. Dry Wells and Drainage Control Wells
9. Subsurface Oisoosal of Domestic Wastes
10. Leaking Subsurface Tanks
A. Chemical Storage Tanks
B. Gasoline and Petroleum Product Storage Tanks
11. Accidental Industrial Soills
image:
206
Table 1
Ranking of Activities in Aooroximate Order of Importance
To Limiting Ground Water Uses in Region VIII
1. Hazardous Waste Oisoosal Sites
?. Unolugged, Abandoned and Improperly Completed Exploration Wells
3. Industrial Pits, Ponds and Lagoons
4. Mining Wastes (Tailings Piles)
A. Uranium Tailings and Leaching Operations
8. Mining Wastes
1) Coooer Leaching and Waste Disposal
2) Oil Shale Mining (ootential)
3) Gold, Silver and other Metal Mining
4) Molybdenum Mining
5) Coal Mining
5. Sanitary Landfills
8. Injection of Liquid Wastes
A. Injection on Hazardous Wastes (no activity at present)
8. Injection of Mining Wastes and Mining Recovery
C. Injection of Brine and Waste Water in Oil and Gas Operations
7. Agricultural Practice
A. Improoer Pesticide Apclication
8. Irrigation and Fertilization (nitrate increases)
C. Irrigation Return Flow (salinity increases)
8. Natural and Land Use Aggravated Problems
A. Uranium Increases Due to Agriculture Soil Disturbance - -
8. Naturally high concentrations of arsenic, fluoride, selenium,
uranium and salt which increase due to ground water depletion
C. Development on Recharge Zones and Sensitive Areas
0. Dry Wells and Drainage Control Wells
9. Subsurface Oisoosal of Domestic Wastes
10. Leaking Subsurface Tanks
A. Chemical Storage Tanks
B. Gasoline and Petroleum Product Storage Tanks
11. Accidental Industrial Soills
image:
 207
Ground Water Quality Problems
Key
^ Hazardous Waste Sites
A Injection of Liquid Wastes - Oil and Gas
-A Injection of Liquid Wastes - Exploration
® Agricultural Practices Including Pesticide Application
O Industrial and Municipal Pits, Ponds and Lagoons
^ Mine Wastes
* Subsurface Disposal of Domestic Wastes
O Natural and Land Use Aggravated Problems
Q Sanitary Landfills
t Leaking Subsurface Tanks
^ Accidental Industrial Spills
litrates
image:
207
Ground Water Quality Problems
Key
^ Hazardous Waste Sites
A Injection of Liquid Wastes - Oil and Gas
-A Injection of Liquid Wastes - Exploration
® Agricultural Practices Including Pesticide Application
O Industrial and Municipal Pits, Ponds and Lagoons
^ Mine Wastes
* Subsurface Disposal of Domestic Wastes
O Natural and Land Use Aggravated Problems
Q Sanitary Landfills
t Leaking Subsurface Tanks
^ Accidental Industrial Spills
litrates
image:
 CD
QO
image:
CD
QO
image:
 209
Colorado
Hazardous Waste Disposal
1. Rocky Mountain Arsenal
2. Old Lowry Landfill
3. L-C Corooration
4. Woodbury Chemical Company
S a n i t a r y L a nd f i \ Is
5. Marshall Landfill
6. Sterling Landfill
7. Weld County Landfill
8. Clear Cree'< Gravel Pits
Oil Field Related Problems
9. Weld County Section 31 Water Disposal
10. Commoache Creek Oil Field
11. Elm Grove Field
12. Weld County Leaking Gas Wells
lining Wastes
13. Idorado Mining Company
14. Union Carbide Uranium Mill
15. Uranium Mining at Canon City
16. Cadmium Smelting
17. New Jersey Zinc
18. Leadville Mining District
19. Homestake Mine
20. Louisville Coal Fields
Industrial Wastes
21. IBM Plant, Niwot
22. Gas Station in Northglenn
23. Continental Oil and Asamera
24. Asamera Oil
25. Gary Western Refinery
Aqricu11ural Wastes
25. Monier's Mile Hi Feedlot
27. Alluvium of South Platte (nitrates)
L.and Use_.Related Problems
28. Alluvium of South Park (uranium)
29. Septic System Percolation
30. French Drains
Natural Sources
31. Paradox Valley Salinity
32. Meeker Dome
image:
209
Colorado
Hazardous Waste Disposal
1. Rocky Mountain Arsenal
2. Old Lowry Landfill
3. L-C Corooration
4. Woodbury Chemical Company
S a n i t a r y L a nd f i \ Is
5. Marshall Landfill
6. Sterling Landfill
7. Weld County Landfill
8. Clear Cree'< Gravel Pits
Oil Field Related Problems
9. Weld County Section 31 Water Disposal
10. Commoache Creek Oil Field
11. Elm Grove Field
12. Weld County Leaking Gas Wells
lining Wastes
13. Idorado Mining Company
14. Union Carbide Uranium Mill
15. Uranium Mining at Canon City
16. Cadmium Smelting
17. New Jersey Zinc
18. Leadville Mining District
19. Homestake Mine
20. Louisville Coal Fields
Industrial Wastes
21. IBM Plant, Niwot
22. Gas Station in Northglenn
23. Continental Oil and Asamera
24. Asamera Oil
25. Gary Western Refinery
Aqricu11ural Wastes
25. Monier's Mile Hi Feedlot
27. Alluvium of South Platte (nitrates)
L.and Use_.Related Problems
28. Alluvium of South Park (uranium)
29. Septic System Percolation
30. French Drains
Natural Sources
31. Paradox Valley Salinity
32. Meeker Dome
image:
 210
-20 -
image:
210
-20 -
image:
 Montana . 911
Mining — Abandoned and Active
1. Anaconda
2. Belt-Stockett-Sand Coulee
3. Basin Mining Area
4. Cooke City
5. Colstrio
5. Columbus
7. Decker
3. Huqhesville
9. Helena Mining Area
10. Great Falls
11. Jardine
12. Philiosburq
13. Silver Bow Creek
Solid Waste Disposal landfills
14. Old livinqston landfill
15. West Yellowstone landfill
15. Alder Oumosite
17. Stanford Oumosite
13. Sheridan Oumosite
19. Sand Coulee Oumosite
20. Cascade landfill
21. Helena landfill
22. Scratchqravel landfill
23. Judith Gao Oumosite
24. Anaconda landfill
25. Plains landfill
25. Butte landfill
27. Big Timber landfill
28. Cut Bank landfill
Oil and Gas Exoloration S Development: Activity
29. Fort Peck Indian Reservation
30. Champion Pulo Mill
Acei.denta_l_ ,So_iJAs ..& Ieak age
31. Billings-
32. Bonner
33. Bozeman
34. Broadus
35. Conrad
36. Oeerlodge
37. East Helena
38. Gl endive
39. Great Falls
image:
Montana . 911
Mining — Abandoned and Active
1. Anaconda
2. Belt-Stockett-Sand Coulee
3. Basin Mining Area
4. Cooke City
5. Colstrio
5. Columbus
7. Decker
3. Huqhesville
9. Helena Mining Area
10. Great Falls
11. Jardine
12. Philiosburq
13. Silver Bow Creek
Solid Waste Disposal landfills
14. Old livinqston landfill
15. West Yellowstone landfill
15. Alder Oumosite
17. Stanford Oumosite
13. Sheridan Oumosite
19. Sand Coulee Oumosite
20. Cascade landfill
21. Helena landfill
22. Scratchqravel landfill
23. Judith Gao Oumosite
24. Anaconda landfill
25. Plains landfill
25. Butte landfill
27. Big Timber landfill
28. Cut Bank landfill
Oil and Gas Exoloration S Development: Activity
29. Fort Peck Indian Reservation
30. Champion Pulo Mill
Acei.denta_l_ ,So_iJAs ..& Ieak age
31. Billings-
32. Bonner
33. Bozeman
34. Broadus
35. Conrad
36. Oeerlodge
37. East Helena
38. Gl endive
39. Great Falls
image:
 40. Helena
41. Kalisoell
42. laurel
43. lewistown
44. libby
45. livingston
46. Miles City
47. Missoula
image:
40. Helena
41. Kalisoell
42. laurel
43. lewistown
44. libby
45. livingston
46. Miles City
47. Missoula
image:
 ! I
image:
! I
image:
 214
North Dakota
I. Southeastern North Dakota Arsenic Issue
2. Husky Industries, Inc.
3. Landfill near Grand Forks
4. Sodium Chromate, Western North Dakota
5. Valley City landfill
6. Amoco Refinery Sludga Duma, Mandan
7. North Ashing Site, Six miles northwest of Belfield
3. South Ashing Site, Southeast end of Belfield
9. Bowman Lignite Ashing Site
-24-
image:
214
North Dakota
I. Southeastern North Dakota Arsenic Issue
2. Husky Industries, Inc.
3. Landfill near Grand Forks
4. Sodium Chromate, Western North Dakota
5. Valley City landfill
6. Amoco Refinery Sludga Duma, Mandan
7. North Ashing Site, Six miles northwest of Belfield
3. South Ashing Site, Southeast end of Belfield
9. Bowman Lignite Ashing Site
-24-
image:
 •H". -
•»»*-
SOUTH DAKOTA
0 B> <*
image:
•H". -
•»»*-
SOUTH DAKOTA
0 B> <*
image:
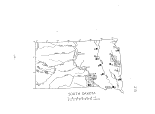 South Dakota 2 ]
Non-Point Source Pollution
1. Municioal wells in Gregory County
2. 3ig Sioux Basin (Hamlin and Srookings Counties)
landfills
3. Brookings
4. Redfield
5. Mitchell
6. Vermillion
7. Aberdeen
8. Canton
9. Gregory
10. Mil bank
11. OeSmet
12. Huron
Private We1.1.s_
13. Aurora and Brule Counties
Hazardous _Waste_SItes
14. Slack Hills Ordinance Depot
15. Brook inqs landfill
15. Edgemont
17. Highland Electric Company, Madison
18. landfill near St. Onge, Lawrence County
19. Raoid City landfill
20. Redfield Iron and Metal
21. Water-town City landfill
22. Whitewood Creek, near lead
image:
South Dakota 2 ]
Non-Point Source Pollution
1. Municioal wells in Gregory County
2. 3ig Sioux Basin (Hamlin and Srookings Counties)
landfills
3. Brookings
4. Redfield
5. Mitchell
6. Vermillion
7. Aberdeen
8. Canton
9. Gregory
10. Mil bank
11. OeSmet
12. Huron
Private We1.1.s_
13. Aurora and Brule Counties
Hazardous _Waste_SItes
14. Slack Hills Ordinance Depot
15. Brook inqs landfill
15. Edgemont
17. Highland Electric Company, Madison
18. landfill near St. Onge, Lawrence County
19. Raoid City landfill
20. Redfield Iron and Metal
21. Water-town City landfill
22. Whitewood Creek, near lead
image:
 217
37*.
11V
UTAH
f I I I 1
o 20 <o io ao
image:
217
37*.
11V
UTAH
f I I I 1
o 20 <o io ao
image:
 218
I. Salt lake County
2. 500 West North Temole, Salt lake City
3. Defense Qeoot, Ogden
4. Duchesne
5. Fenced Barrel Site, Southeast of main railroad yard of Union Pacific, SIC
6. Old Cobalt Tailings Pond, Magna
7. Roosevelt, east of Neola Highway, 1 mile north of Roosevelt
8. Rose Park Canals, Salt lake City
9. Rose Park Oil Sludge Duma, Salt lake City
10. Valley landfill, Salt lake City
11. County landfill, Salt lake City
12. West Valley landfill, West Valley
13. Atlas Mineral Corporation. Mill Site, Moab
14. Green River Uranium Mill Tailings
15. Inactive Mill Site and Town, Monti cello
16. Uranium Mill Tailings, Thompson
17. Vitro Uranium Mill Tailings near Mexican Hat
18. Bay Area Refuse Disposal, West Bountiful
19. North Davis County landfill, layton City
20. Tro.ian Division (Gomex), Spanish Forks
21. Woods Cross Refinery, West Bountiful
image:
218
I. Salt lake County
2. 500 West North Temole, Salt lake City
3. Defense Qeoot, Ogden
4. Duchesne
5. Fenced Barrel Site, Southeast of main railroad yard of Union Pacific, SIC
6. Old Cobalt Tailings Pond, Magna
7. Roosevelt, east of Neola Highway, 1 mile north of Roosevelt
8. Rose Park Canals, Salt lake City
9. Rose Park Oil Sludge Duma, Salt lake City
10. Valley landfill, Salt lake City
11. County landfill, Salt lake City
12. West Valley landfill, West Valley
13. Atlas Mineral Corporation. Mill Site, Moab
14. Green River Uranium Mill Tailings
15. Inactive Mill Site and Town, Monti cello
16. Uranium Mill Tailings, Thompson
17. Vitro Uranium Mill Tailings near Mexican Hat
18. Bay Area Refuse Disposal, West Bountiful
19. North Davis County landfill, layton City
20. Tro.ian Division (Gomex), Spanish Forks
21. Woods Cross Refinery, West Bountiful
image:
 O\
eg
image:
O\
eg
image:
 Wyoming
Hazardous Waste Sites 220
1. Amoco Refinery Oumo, Casoer
2. Horse Creek near Laramie
3. Old Refinery, Newcastle
4. Porcuoine Creek Mine, Sig Horn Mountains near love11
5. Riverton Sulfuric Acid Plant, Southwest of Riverton
5. Southwestern Refinery Company, laSarge
7. Union Pacific Railroad, laramie (Creosote Plant)
8. Riverton Uranium Mill Tailings
9. Sol it Rock Uranium Mill Town, Jeffrey City
10. Soook Site, Converse County
11. Casoer City Oumo "
12. leefe Plant
-30-
image:
Wyoming
Hazardous Waste Sites 220
1. Amoco Refinery Oumo, Casoer
2. Horse Creek near Laramie
3. Old Refinery, Newcastle
4. Porcuoine Creek Mine, Sig Horn Mountains near love11
5. Riverton Sulfuric Acid Plant, Southwest of Riverton
5. Southwestern Refinery Company, laSarge
7. Union Pacific Railroad, laramie (Creosote Plant)
8. Riverton Uranium Mill Tailings
9. Sol it Rock Uranium Mill Town, Jeffrey City
10. Soook Site, Converse County
11. Casoer City Oumo "
12. leefe Plant
-30-
image:
 221
ATTACHMENT 3 - DETAILS OF THE MOST SIGNIFICANT
GROUND WATER QUALITY THREATS-
COLORADO
Conclusion: Present occurrences of ground water contamination are
qeoqraohically widesoread in Colorado. In some cases the contamination has
already imoacted existing or projected beneficial uses of ground water,
including public drinking supplies and agriculture. As Colorado's population
exoands and new sources of water are required to meet demands, ground water
contamination problems and conflicts with beneficial uses can be expected to
increase.
A. Hazardous Waste Oisoosal:
1. ROCKY 'MOUNTAIN ARSENAL: Disoosal of chemical warfare agents and
insecticides in unlined and lined ponds and by spills of chemicals and
oesticides in various storage areas at the Shell chemical plant has*caused
local ground water contamination. Problem was first noticed in the 1950's
when chloride salts began moving off-site to the north. Organic contaminants
including many carcinogens have moved off the site.
PisDosal Methods
a. Basins A, B, C and D were unlined. Basin A received all wastes from
1947-53, Basin 8, C and 0 were used until 1957.
b. Basin F has an asphalt liner (of questionable integrity) which was
constructed in 1957.
c. OisDOsal by iniection wells from March 1962 to February 1966.
Present Status
a. The RMA has instituted a contaminant program and has constructed a
mile long slurry barrier across the northern boundary. This boundary
goes through the alluvium into the bedrock to keep contaminants in the
alluvial aquifer from moving off-site. Contaminated water is pumped to
the surface and treated with activated carbon and reinjected down
gradient from the barrier.
b. A barrier system comorised of two lines of pumping wells and two
lines of clean water injection wells has been constructed on the
northwest boundary to interceot and treat a contaminant plume moving off
site from Shell's rail yard.
c. A similar barrier system is planned for a second plume slightly north
of the rail yard olume. This will intercept a plume moving out of
Basin F.
d. Closure and removal of the remaining waste in Basin F is under way.
e. The 12,000 foot deep disoosal '/veil is unplugged and closure plans
have not been develooed.
f. A Memorandum of Agreement between EPA, Colorado Department of Health,
Shell Chemical Comoany and the Army has been developed concerning cleanup
and contaminant containment on the arsenal.
Present Ground Water Use
In 1980,1 08CP fdibVo'moc'hloropropane), a pesticide manufactured at the
Arsenal was detected in the Town of Irondale's drinking water supply. Because
image:
221
ATTACHMENT 3 - DETAILS OF THE MOST SIGNIFICANT
GROUND WATER QUALITY THREATS-
COLORADO
Conclusion: Present occurrences of ground water contamination are
qeoqraohically widesoread in Colorado. In some cases the contamination has
already imoacted existing or projected beneficial uses of ground water,
including public drinking supplies and agriculture. As Colorado's population
exoands and new sources of water are required to meet demands, ground water
contamination problems and conflicts with beneficial uses can be expected to
increase.
A. Hazardous Waste Oisoosal:
1. ROCKY 'MOUNTAIN ARSENAL: Disoosal of chemical warfare agents and
insecticides in unlined and lined ponds and by spills of chemicals and
oesticides in various storage areas at the Shell chemical plant has*caused
local ground water contamination. Problem was first noticed in the 1950's
when chloride salts began moving off-site to the north. Organic contaminants
including many carcinogens have moved off the site.
PisDosal Methods
a. Basins A, B, C and D were unlined. Basin A received all wastes from
1947-53, Basin 8, C and 0 were used until 1957.
b. Basin F has an asphalt liner (of questionable integrity) which was
constructed in 1957.
c. OisDOsal by iniection wells from March 1962 to February 1966.
Present Status
a. The RMA has instituted a contaminant program and has constructed a
mile long slurry barrier across the northern boundary. This boundary
goes through the alluvium into the bedrock to keep contaminants in the
alluvial aquifer from moving off-site. Contaminated water is pumped to
the surface and treated with activated carbon and reinjected down
gradient from the barrier.
b. A barrier system comorised of two lines of pumping wells and two
lines of clean water injection wells has been constructed on the
northwest boundary to interceot and treat a contaminant plume moving off
site from Shell's rail yard.
c. A similar barrier system is planned for a second plume slightly north
of the rail yard olume. This will intercept a plume moving out of
Basin F.
d. Closure and removal of the remaining waste in Basin F is under way.
e. The 12,000 foot deep disoosal '/veil is unplugged and closure plans
have not been develooed.
f. A Memorandum of Agreement between EPA, Colorado Department of Health,
Shell Chemical Comoany and the Army has been developed concerning cleanup
and contaminant containment on the arsenal.
Present Ground Water Use
In 1980,1 08CP fdibVo'moc'hloropropane), a pesticide manufactured at the
Arsenal was detected in the Town of Irondale's drinking water supply. Because
image:
 222
of D8CP concentrations, a municipal well for Irondale is still not being
used. The OBCP has also been detected in orivate water wells in the Irondale
area. Croos in the area that have been irrigated with contaminated well water
have also been damaged.
Wells immediately north of RMA are orimarily for stock watering.
Domestic suoolies are obtained from wells farther to the north near Brighton.
Domestic suoolies are being obtained via private wells in the Ironton
area along the northwest boundary.
A oublic water supoly well which contains TCE is being used by South
Adams Water Ccmoany. The -well lies on the northwest boundary on the south
edge of the South Adams Water and Sanitation District and Irondale.
References
— Colorado Surface Impoundment Assessment
— Memorandum of Agreement between RMA, EPA, Colorado Department of
Health and Shell Chemical
2. OLD '_OWRY IANOFIU.: Ooerated by the City and County of Denver near
several southeastern suburbs of Denver. The site was originally intended to
be a sanitary landfill but began receiving industrial wastes, including
organic solvents soon after opening. The site was closed in 1980 when Waste
Management, Inc. began ooerating a new hazardous waste site to the north.
0 i SJ30S a 1 Methods
a. Most liquid wastes were disposed of in pits excavated in bedrock
which is interbedded with claystones and sandstones.
b. Some of the liquid waste was disposed in pits excavated in previously
filled garbage. This was especially true of waste oil.
c. Low level radioactive hospital waste was disoosed in trenches
excavated in the claystone.
d. A large oart of the now closed area was used to land farm sludge from
the Denver Metro treatment plant. Because of high waste loads, the
nitrogen levels were in excess of the soil's ability to handle.
Present _Status
The City and County of Denver are developing a plan to deal with the
contamination in Section 6. The ground water on the site has been found
to be contaminated and is moving to the north in the alluvial aquifer.
No off-site contamination has been detected to the west in any of the
four monitoring wells which are just off -site. The State is not
satisfied with Denver's progress to date to develop a plan to deal with
contamination in Section 6.
The City is developing a olan to build a containment system on the
north side of the site to keep contamination from moving off-site. Water
traooed by the system will be Dumped to a lined evaporation pond on site.
Ground Water Use
There are no domestic water wells near the site. It is possible
that shallow aquifers could carry pollutants off-site to nearby
residential areas. The Cherry Hills Water District operates a community
well system two miles to the north.
image:
222
of D8CP concentrations, a municipal well for Irondale is still not being
used. The OBCP has also been detected in orivate water wells in the Irondale
area. Croos in the area that have been irrigated with contaminated well water
have also been damaged.
Wells immediately north of RMA are orimarily for stock watering.
Domestic suoolies are obtained from wells farther to the north near Brighton.
Domestic suoolies are being obtained via private wells in the Ironton
area along the northwest boundary.
A oublic water supoly well which contains TCE is being used by South
Adams Water Ccmoany. The -well lies on the northwest boundary on the south
edge of the South Adams Water and Sanitation District and Irondale.
References
— Colorado Surface Impoundment Assessment
— Memorandum of Agreement between RMA, EPA, Colorado Department of
Health and Shell Chemical
2. OLD '_OWRY IANOFIU.: Ooerated by the City and County of Denver near
several southeastern suburbs of Denver. The site was originally intended to
be a sanitary landfill but began receiving industrial wastes, including
organic solvents soon after opening. The site was closed in 1980 when Waste
Management, Inc. began ooerating a new hazardous waste site to the north.
0 i SJ30S a 1 Methods
a. Most liquid wastes were disposed of in pits excavated in bedrock
which is interbedded with claystones and sandstones.
b. Some of the liquid waste was disposed in pits excavated in previously
filled garbage. This was especially true of waste oil.
c. Low level radioactive hospital waste was disoosed in trenches
excavated in the claystone.
d. A large oart of the now closed area was used to land farm sludge from
the Denver Metro treatment plant. Because of high waste loads, the
nitrogen levels were in excess of the soil's ability to handle.
Present _Status
The City and County of Denver are developing a plan to deal with the
contamination in Section 6. The ground water on the site has been found
to be contaminated and is moving to the north in the alluvial aquifer.
No off-site contamination has been detected to the west in any of the
four monitoring wells which are just off -site. The State is not
satisfied with Denver's progress to date to develop a plan to deal with
contamination in Section 6.
The City is developing a olan to build a containment system on the
north side of the site to keep contamination from moving off-site. Water
traooed by the system will be Dumped to a lined evaporation pond on site.
Ground Water Use
There are no domestic water wells near the site. It is possible
that shallow aquifers could carry pollutants off-site to nearby
residential areas. The Cherry Hills Water District operates a community
well system two miles to the north.
image:
 223
Deferences
— Ground Water Quality Near A Sewage Sludge Site And A landfill Near
Denver, Colorado. May, 1977. USGS Ooen cile Report.
— Proposal: Hydroqeologic and Geotechnical Study Waste Containment
Structures, Oenver-Araoahoe Oisoosal Site by Golder Associates.
3. l-C CORPORATION: Oisoosal site for acid waste by-products near Sand Creek
between Dahlia Street and Vasquez Boulevard in Denver. Site was active from
1968 to 1970. Waste was found to contain chromium, p-chlorophenyemethysulfide,
etc. The shallow ground water was contaminated and is discharging into Sand
Creek.
Dispo.sal Methods
Used 3 to 4 oits lined with plastic.
Present Status
State has required implementation of a neutralization program and a
monitoring program. Both are on-going. The principal means of cleaning
was installing trenches filled with limestone down gradient from the pits.
Hate_r Use
Unknown.
4. WQOOBURY CHEMICAL COMPANY: located at 5400 Jackson Street in Commerce
City, this is a former pesticides olant which burned in 1965 leaving high
oesticide residuals in the soil. Ground water on site is contaminated.
Present Status
Studies are underway to determine the extent of problem and the
remedial actions needed.
Ground Water JJse
Unknown.
5. 8ROOERICK WOOD TREATING COMPANY: located at Huron and 58th Street in
North Denver (Section 9, T3S, Range R58W).
Company pressure-treated wood ties and used three on-site pits to dispose
of wastes. No information is presently available about the volumes or types
of wastes although it is susoected that pentachlorophenol may have been
disoosed.
Seepage from this site is apparently beginning to show up on the edge of
the nearby Te.jon landfill. The State is investigating the need for clean-up
at this site and is considering enforcement action.
8. S.anlta_ry landfills
1. MARSHAL! 1ANDFIII: located adjacent to South 66th Street, one mile south
of Colorado Hwy. 170 next to community ditch from Marshall lake. This ditch
orovides raw water to louisville. The landfill lies on the north end of the
active Marshall landfill operated by Browning Ferris Industries.
-33 -
image:
223
Deferences
— Ground Water Quality Near A Sewage Sludge Site And A landfill Near
Denver, Colorado. May, 1977. USGS Ooen cile Report.
— Proposal: Hydroqeologic and Geotechnical Study Waste Containment
Structures, Oenver-Araoahoe Oisoosal Site by Golder Associates.
3. l-C CORPORATION: Oisoosal site for acid waste by-products near Sand Creek
between Dahlia Street and Vasquez Boulevard in Denver. Site was active from
1968 to 1970. Waste was found to contain chromium, p-chlorophenyemethysulfide,
etc. The shallow ground water was contaminated and is discharging into Sand
Creek.
Dispo.sal Methods
Used 3 to 4 oits lined with plastic.
Present Status
State has required implementation of a neutralization program and a
monitoring program. Both are on-going. The principal means of cleaning
was installing trenches filled with limestone down gradient from the pits.
Hate_r Use
Unknown.
4. WQOOBURY CHEMICAL COMPANY: located at 5400 Jackson Street in Commerce
City, this is a former pesticides olant which burned in 1965 leaving high
oesticide residuals in the soil. Ground water on site is contaminated.
Present Status
Studies are underway to determine the extent of problem and the
remedial actions needed.
Ground Water JJse
Unknown.
5. 8ROOERICK WOOD TREATING COMPANY: located at Huron and 58th Street in
North Denver (Section 9, T3S, Range R58W).
Company pressure-treated wood ties and used three on-site pits to dispose
of wastes. No information is presently available about the volumes or types
of wastes although it is susoected that pentachlorophenol may have been
disoosed.
Seepage from this site is apparently beginning to show up on the edge of
the nearby Te.jon landfill. The State is investigating the need for clean-up
at this site and is considering enforcement action.
8. S.anlta_ry landfills
1. MARSHAL! 1ANDFIII: located adjacent to South 66th Street, one mile south
of Colorado Hwy. 170 next to community ditch from Marshall lake. This ditch
orovides raw water to louisville. The landfill lies on the north end of the
active Marshall landfill operated by Browning Ferris Industries.
-33 -
image:
 224
Disposal Methods
Landfill received sanitary wastes which were placed in area which
was mined for gravel. Former operator claims that fill was buried above
the ground water. Fill was covered after burial.
Present Status
This is a funded Superfund site. Monitoring wells have been drilled
around the site to determine the extent of ground water contamination.
Contaminated leachate is flowing from the toe of the slope into the
ditch. Under the consent agreement reached by EPA, the State and the
County, a contract has been let to the COH to do complete site studies
and develoo a remedial olan. Browning Ferris Industries is taking the
lead in develooing remedial action.
Ground Water Use
Contamination from the inactive portion of Marshall landfill is
known to be affecting ground water adjacent to a ditch carrying the City
of Louisville's water supoly. This contamination, which consists of both
organics and inorganics, may already be impacting Louisville's water
suoolv, though there is available a large dilutional capacity to minimize
such effects.
2. STERLING LANDFILL: Located near Sterling, this lanBfill received oil and
meat packing house wastes and is believed to have potential for ground water
contamination.
3. WELD COUNTY LANDFILL: Located near Greeley, this landfill receives
domestic solid waste and some photochemical wastes from Kodak Company. There
is concern about ground water problems.
4. CLEAR CREEK GRAVEL PITS: There are numerous old gravel pits along Clear
Creek which were filled in with solid waste and fly ash from the Cherokee
Power Plant. Some have clay liners, but the waste is in ground water. No
firm data is available on the number of such sites.
Present Status
There have been oroposals to conduct a study including ground water
monitoring. State geologist's office feels that such sites are related
to the water quality oroblems in the alluvium.
Ground Water ,
Alluvium is used for irrigation and for domestic purposes.
C. Oil Field Disposal Problems
f. Weld County Disoosal — Located East of Fort Lupton,this pit is used for
disoosal of brine and waste oil from nearby oil and gas fields. This
operation received a cease and desist order from the Colorad Water Quality
Control Division in 1979.
Disposal Method
Site originally used 3 oonds which were 12 feet deep and overlie a
outcroo of the Laramie formation. The pits were reported to have liners
of 3 inch bentonite. A significant amount of seepage was occurring as
the inflow was exceeding estimated evaporation by 4,000 cubic feet per
day.
-54-
image:
224
Disposal Methods
Landfill received sanitary wastes which were placed in area which
was mined for gravel. Former operator claims that fill was buried above
the ground water. Fill was covered after burial.
Present Status
This is a funded Superfund site. Monitoring wells have been drilled
around the site to determine the extent of ground water contamination.
Contaminated leachate is flowing from the toe of the slope into the
ditch. Under the consent agreement reached by EPA, the State and the
County, a contract has been let to the COH to do complete site studies
and develoo a remedial olan. Browning Ferris Industries is taking the
lead in develooing remedial action.
Ground Water Use
Contamination from the inactive portion of Marshall landfill is
known to be affecting ground water adjacent to a ditch carrying the City
of Louisville's water supoly. This contamination, which consists of both
organics and inorganics, may already be impacting Louisville's water
suoolv, though there is available a large dilutional capacity to minimize
such effects.
2. STERLING LANDFILL: Located near Sterling, this lanBfill received oil and
meat packing house wastes and is believed to have potential for ground water
contamination.
3. WELD COUNTY LANDFILL: Located near Greeley, this landfill receives
domestic solid waste and some photochemical wastes from Kodak Company. There
is concern about ground water problems.
4. CLEAR CREEK GRAVEL PITS: There are numerous old gravel pits along Clear
Creek which were filled in with solid waste and fly ash from the Cherokee
Power Plant. Some have clay liners, but the waste is in ground water. No
firm data is available on the number of such sites.
Present Status
There have been oroposals to conduct a study including ground water
monitoring. State geologist's office feels that such sites are related
to the water quality oroblems in the alluvium.
Ground Water ,
Alluvium is used for irrigation and for domestic purposes.
C. Oil Field Disposal Problems
f. Weld County Disoosal — Located East of Fort Lupton,this pit is used for
disoosal of brine and waste oil from nearby oil and gas fields. This
operation received a cease and desist order from the Colorad Water Quality
Control Division in 1979.
Disposal Method
Site originally used 3 oonds which were 12 feet deep and overlie a
outcroo of the Laramie formation. The pits were reported to have liners
of 3 inch bentonite. A significant amount of seepage was occurring as
the inflow was exceeding estimated evaporation by 4,000 cubic feet per
day.
-54-
image:
 225
Present Status
The first oond which is used for ore separation has been concrete
lined and the second pond has had a thicker clay liner installed. The
site is being investigated by CDH and Weld County.
Ground Water Use
These oonds overlie a major drinking water aquifer in the area which
is also used as an irrigation suooly.
References
Colorado Surface Imooundment Assessment
2. Weld County Section 31 Water Disposal — This is an oil field brine
disoosal site located in Weld County. The facility applied for a permit in
1977 but concern was raised because brine which was slated to be disposed of
had a TOS ranging from 8,000 to 20,000 mg/liter. The operator began operating
without a oermit in 1978.
Disposal Method
Brine was dumoed into a pit where it could be pumped to oil
seoarator tanks. Clean brine was then sent to a leach field. Brine was
aooarently recharging the laramie Formation. The operation was disposing
of a main volume of 40,000 gallons per day. This site is located on a
recharge area of the Laramie Formation which is used extensively in the
area for domestic and agricultural water supply.
Present Status.
Operator was olanning expanded ©Derations with clay lined pond.
Need follow un data.
Reference
Colorado Surface Impoundment Assessment
3. Commoache Creek Oil Field — located in Elbert County. The field was
discovered in 1970. Ponds are used for disposal of produced water. The
Surface Imooundment Assessment study rated this as having a very high ground
water oollution potential."
Disposal Method
At the time of the SIA, there were four oonds in use without
liners.
Present Status
No RCRA inspections have been made. Probably still in use.
Ground Water Use
No information.
Reference
Colorado Surface Impoundment Assessment
4. Elm Grove Field — located in logan County. Field discovered in 1957.
Ponds used for oroduced water disoosal. SIA ranked this as having a high
ground water oollution ootential.
-35- -
image:
225
Present Status
The first oond which is used for ore separation has been concrete
lined and the second pond has had a thicker clay liner installed. The
site is being investigated by CDH and Weld County.
Ground Water Use
These oonds overlie a major drinking water aquifer in the area which
is also used as an irrigation suooly.
References
Colorado Surface Imooundment Assessment
2. Weld County Section 31 Water Disposal — This is an oil field brine
disoosal site located in Weld County. The facility applied for a permit in
1977 but concern was raised because brine which was slated to be disposed of
had a TOS ranging from 8,000 to 20,000 mg/liter. The operator began operating
without a oermit in 1978.
Disposal Method
Brine was dumoed into a pit where it could be pumped to oil
seoarator tanks. Clean brine was then sent to a leach field. Brine was
aooarently recharging the laramie Formation. The operation was disposing
of a main volume of 40,000 gallons per day. This site is located on a
recharge area of the Laramie Formation which is used extensively in the
area for domestic and agricultural water supply.
Present Status.
Operator was olanning expanded ©Derations with clay lined pond.
Need follow un data.
Reference
Colorado Surface Impoundment Assessment
3. Commoache Creek Oil Field — located in Elbert County. The field was
discovered in 1970. Ponds are used for disposal of produced water. The
Surface Imooundment Assessment study rated this as having a very high ground
water oollution potential."
Disposal Method
At the time of the SIA, there were four oonds in use without
liners.
Present Status
No RCRA inspections have been made. Probably still in use.
Ground Water Use
No information.
Reference
Colorado Surface Impoundment Assessment
4. Elm Grove Field — located in logan County. Field discovered in 1957.
Ponds used for oroduced water disoosal. SIA ranked this as having a high
ground water oollution ootential.
-35- -
image:
 226
Disposal Methods ' t~c-u
Used two oonds without liner.
P res en t S_t at us
Not insoectad.
Ground _Wa_ter JJse
No i nf'ormat i on.
References
Surface Imooundment Assessment
5. Weld County leaking Gas Wells — methane has entered drinking water aquifer
in Weld County and affected 3 water wells. The methane is coming from
imorooerly comnleted qas production wells.
Present Status
No information.
Reference
Memo from Bill Ounn - CDH
0. Mining Wastes
1. Tdorado Mining Comoany, Telluride — Copper and other heavy metal mining
has resulted in metal contamination including toxic hexavalent chromium into
the local alluvial aquifer. This aquifer supplied part of Telluride's water,..^
suooly at one time, but had to be abandoned.
Disposal Method,
Surface disoosal of tailings without liner.
Present Status
Active Mining.
Ground Water Use
Alluvial source intended to supply Telluride's new development.
2. Union Carbide Uranium Mill — The Club Ranch tailing oonds have been shown
to contaminate subsurface waters. High levels of ammonia, sulfate, sodium and
other inorganics may be seeping into the ground water alluvial area of the San
Miguel 3iver. The contaminated ground water ultimately discharges into the
river thereby aggravating an existing salinity problem.
Disposal Method
Surface disoosal of aqueous mill tailings.
Ground Water Use
No information.
-36-
image:
226
Disposal Methods ' t~c-u
Used two oonds without liner.
P res en t S_t at us
Not insoectad.
Ground _Wa_ter JJse
No i nf'ormat i on.
References
Surface Imooundment Assessment
5. Weld County leaking Gas Wells — methane has entered drinking water aquifer
in Weld County and affected 3 water wells. The methane is coming from
imorooerly comnleted qas production wells.
Present Status
No information.
Reference
Memo from Bill Ounn - CDH
0. Mining Wastes
1. Tdorado Mining Comoany, Telluride — Copper and other heavy metal mining
has resulted in metal contamination including toxic hexavalent chromium into
the local alluvial aquifer. This aquifer supplied part of Telluride's water,..^
suooly at one time, but had to be abandoned.
Disposal Method,
Surface disoosal of tailings without liner.
Present Status
Active Mining.
Ground Water Use
Alluvial source intended to supply Telluride's new development.
2. Union Carbide Uranium Mill — The Club Ranch tailing oonds have been shown
to contaminate subsurface waters. High levels of ammonia, sulfate, sodium and
other inorganics may be seeping into the ground water alluvial area of the San
Miguel 3iver. The contaminated ground water ultimately discharges into the
river thereby aggravating an existing salinity problem.
Disposal Method
Surface disoosal of aqueous mill tailings.
Ground Water Use
No information.
-36-
image:
 227
Reference
A Review of Ground Water Problems in Colorado, Colorado Department
of Health, 1982.
3. Cotter Uranium Mill -- The mill is located near Canon City and has
processed uranium ore since the 1950's. Disposal from the original mill was
into unlined ponds. Radioactive wastes are known to have entered the
underlying abandoned coal mine and a local reservoir. A plume of contaminants
has also moved off-site to the north resulting in high molybdenum levels in
wells in the Lincoln Park area. Studies to define the nature of the problem
are ongoing.
4. ASARCO Cadmium Processing -- Water and soil samples taken from a drainage
ditch near the ASARCO cadmium processing tailings pile in north Denver,
contain high levels of cadmium, arsenic and lead. Of immediate concern are
the implications of soil and surface water contamination in the ditch, which
is an open and unrestricted area next to a low income housing project where
several hundred people live. Recent investigations indicate that ground water
impacts are unknown. The Colorado Department of Health is proceeding with an
agreement with ASARCO to minimize the problems at this site.
5. Leadville Mining District -- This is a large mining district on the edge
of the Arkansas Valley. The presence of ground water moving through the
mineralized limestones has resulted in a very severe acid mine problem. This
problem has been aggravated by two drainage tunnels which drain some of the
mines.
a. The Leadville Tunnel is owned by the U.S. Bureau of Reclamation and
discharges water containing high levels of zinc, iron, manganese, etc. into
the Arkansas River.
b. The Yak Tunnel drains mines owned by Asarco and discharges low pH,
high metal content water into California gulch. This problem is aggravated by
the presence of a large quantity of old mill tailings on the bottom of the
gulch which provides additional metal loading prior to the waters reaching the
Arkansas. Ground water from the mineralized limestone also discharges into
the gulch.
Under the Superfund program EPA is presently studying the feasibility of
removing the tailing from the gulch to reduce some of the source of metals.
6. Homestake Mine — This mine is located at Creede, Colorado. The disposal
of mill wastes into unlined tailings areas has resulted in cyanide contamin-
ation of the ground water. The plume is moving slightly but has not moved
off-site.
-37-
image:
227
Reference
A Review of Ground Water Problems in Colorado, Colorado Department
of Health, 1982.
3. Cotter Uranium Mill -- The mill is located near Canon City and has
processed uranium ore since the 1950's. Disposal from the original mill was
into unlined ponds. Radioactive wastes are known to have entered the
underlying abandoned coal mine and a local reservoir. A plume of contaminants
has also moved off-site to the north resulting in high molybdenum levels in
wells in the Lincoln Park area. Studies to define the nature of the problem
are ongoing.
4. ASARCO Cadmium Processing -- Water and soil samples taken from a drainage
ditch near the ASARCO cadmium processing tailings pile in north Denver,
contain high levels of cadmium, arsenic and lead. Of immediate concern are
the implications of soil and surface water contamination in the ditch, which
is an open and unrestricted area next to a low income housing project where
several hundred people live. Recent investigations indicate that ground water
impacts are unknown. The Colorado Department of Health is proceeding with an
agreement with ASARCO to minimize the problems at this site.
5. Leadville Mining District -- This is a large mining district on the edge
of the Arkansas Valley. The presence of ground water moving through the
mineralized limestones has resulted in a very severe acid mine problem. This
problem has been aggravated by two drainage tunnels which drain some of the
mines.
a. The Leadville Tunnel is owned by the U.S. Bureau of Reclamation and
discharges water containing high levels of zinc, iron, manganese, etc. into
the Arkansas River.
b. The Yak Tunnel drains mines owned by Asarco and discharges low pH,
high metal content water into California gulch. This problem is aggravated by
the presence of a large quantity of old mill tailings on the bottom of the
gulch which provides additional metal loading prior to the waters reaching the
Arkansas. Ground water from the mineralized limestone also discharges into
the gulch.
Under the Superfund program EPA is presently studying the feasibility of
removing the tailing from the gulch to reduce some of the source of metals.
6. Homestake Mine — This mine is located at Creede, Colorado. The disposal
of mill wastes into unlined tailings areas has resulted in cyanide contamin-
ation of the ground water. The plume is moving slightly but has not moved
off-site.
-37-
image:
 228
7. Louisville Coal cie!ds — This is a large area running north from
Suoerior, Colorado to Louisville, Colorado. The mines are in the laramie
formation which suoolied good quality drinking water throughout the Denver
basin. The mines have been abandoned and water allowed to return to the mined
out areas. The introduction of large open areas and oxygen to the coal beds
has resultedjn extremely ooor quality water high in sulfates, iron, organics,
etc. There is concern that oumoing in the adjoining non-mined areas of the
laramie will induce movement of contaminants in the mines into the good
quality oortion of the aquifer.
3. New Jersey Zinc — The tailings oiles at the New Jersey Zinc Mine south of
Minturn, Colorado, have caused seeoage into ground water and Cross Creek.
Heavy metal contamination has seriously effected the water quality of the
stream and is believed to have adversely effected the potential uses of the
local aquifer.
E. Chemical Storage Areas
1. IBM Plant -- There has been leakage of various organics from storage tanks
at the IBM olant near Newal. The ground water in the laramie Formation has
been contaminated by toluene and other organics. A barrier wall has been
installed to allow recovery and treatment of contaminated waters.
P. Feedlots
Ground water contamination from feedlots has been documented in Colorado,
levels of total dissolved solids, ammonia, nitrates and other constituents in
aquifers near feedlots often exceed recommended concentrations.
Monier's Mile-Hi Feedlot, located two miles north of Brighton in Weld
County, is of narticular concern. An unlined surface impoundment is in place
to catch drainage from sheep Dens. Contamination of water wells in the area
is susoected to be oresent in at least 34 similar sites in Colorado.
G. Refineries, Pipelines, Gasoline Stations and Oil Separation- Ponds
Petroleum and oetroleum by-products have seeped into subsurface formations
because of soills or storage tank and oond leaks. Toxicity is usually not a
oroblem, since the water is already undrinkable due to taste and odor before
the concentrations reach toxic levels. Recently in Northglenn a gasoline leak
from a service station was resoonsible for contaminating shallow ground water,
which eventually seeoed into the basements of homes in the area. Three
refineries—Continental Oil and Asamera in Commerce City and Gary Western in
Fruita— are susoected to be resoonsible for ground water contamination
discovered near their facilities.
H. Illegal Oumoing
Although the extent of illegal dumoing is not known in Colorado, most
documented cases involve brine disoosal associated with oil and gas
oroduction. Dumping of chemical wastes is also suspected of being fairly
common. Often these chemicals contain acid and other wastes which can be very
toxic to humans. The dumoing of agricultural wastes, including animal waste
and excess herbicides and oesticides, posas a threat to ground water.
Unoermitted landfills and dumps may also threaten ground water. At
unoermitted landfills, attention is seldom paid to the nature of the material
dioosed and liners and ground water monitoring wells are usually nonexistent.
image:
228
7. Louisville Coal cie!ds — This is a large area running north from
Suoerior, Colorado to Louisville, Colorado. The mines are in the laramie
formation which suoolied good quality drinking water throughout the Denver
basin. The mines have been abandoned and water allowed to return to the mined
out areas. The introduction of large open areas and oxygen to the coal beds
has resultedjn extremely ooor quality water high in sulfates, iron, organics,
etc. There is concern that oumoing in the adjoining non-mined areas of the
laramie will induce movement of contaminants in the mines into the good
quality oortion of the aquifer.
3. New Jersey Zinc — The tailings oiles at the New Jersey Zinc Mine south of
Minturn, Colorado, have caused seeoage into ground water and Cross Creek.
Heavy metal contamination has seriously effected the water quality of the
stream and is believed to have adversely effected the potential uses of the
local aquifer.
E. Chemical Storage Areas
1. IBM Plant -- There has been leakage of various organics from storage tanks
at the IBM olant near Newal. The ground water in the laramie Formation has
been contaminated by toluene and other organics. A barrier wall has been
installed to allow recovery and treatment of contaminated waters.
P. Feedlots
Ground water contamination from feedlots has been documented in Colorado,
levels of total dissolved solids, ammonia, nitrates and other constituents in
aquifers near feedlots often exceed recommended concentrations.
Monier's Mile-Hi Feedlot, located two miles north of Brighton in Weld
County, is of narticular concern. An unlined surface impoundment is in place
to catch drainage from sheep Dens. Contamination of water wells in the area
is susoected to be oresent in at least 34 similar sites in Colorado.
G. Refineries, Pipelines, Gasoline Stations and Oil Separation- Ponds
Petroleum and oetroleum by-products have seeped into subsurface formations
because of soills or storage tank and oond leaks. Toxicity is usually not a
oroblem, since the water is already undrinkable due to taste and odor before
the concentrations reach toxic levels. Recently in Northglenn a gasoline leak
from a service station was resoonsible for contaminating shallow ground water,
which eventually seeoed into the basements of homes in the area. Three
refineries—Continental Oil and Asamera in Commerce City and Gary Western in
Fruita— are susoected to be resoonsible for ground water contamination
discovered near their facilities.
H. Illegal Oumoing
Although the extent of illegal dumoing is not known in Colorado, most
documented cases involve brine disoosal associated with oil and gas
oroduction. Dumping of chemical wastes is also suspected of being fairly
common. Often these chemicals contain acid and other wastes which can be very
toxic to humans. The dumoing of agricultural wastes, including animal waste
and excess herbicides and oesticides, posas a threat to ground water.
Unoermitted landfills and dumps may also threaten ground water. At
unoermitted landfills, attention is seldom paid to the nature of the material
dioosed and liners and ground water monitoring wells are usually nonexistent.
image:
 229
As with other qround water quality oroblems, the likelihood of contamination
affecting oublic health deoends on the oroximity and depth of ground water,
the existence of subsurface barriers and the location of irrigation and
drinking water wells.
I. Seotic System Percolation
Seotic tanks sometimes lead to significant ground water contamination
problems. Seotic tank oroblems usually occur when they are placed in soils
that are inadequate to oerform the necessary digestion or when they are
located near water wells.
Nitrates in excess of drinking water standards have been found in the
mountainous areas of Jefferson and Park counties. It is believed that the
contamination is due to a combination of inadequate rocky soils, proximity of
seotic tank fields to water wells and the low volume of fault zone ground
waters. Colorado is currently updating it's individual sewage disposal system
regulations.
J. Unolugged Exoloration Holes
This is believed to have the potential for being a very severe problem.
This activity often results in establishing hydrologic communication between
aquifers of widely varying quality. Depending on the relative leads in the
aquifers, ooor quality water may enter the good quality aquifer.
1. South Park Alluvial Basin — This basin was the site of extensive
drilling for uranium during the late 1970's with thousands of test holes being
drilled (some as deeo as 3,000 feet). The ground water in this discharges
into the South "latte River. There have been no studies to determine if
shallow ground waters have been impacted by the drilling.
2. Meeker Dome ~ This is located near Meeker and is the site of two
imorooerly olugged oil exploration wells. Brine from a deep aquifer was
moving uo the ooen hole and moving around the improperly set plug via
fractures in the formation surrounding the plug. This brine ultimately
discharged to the White River. The U.S. Bureau of Reclamation has reentered
the susoected oroblem wells and drilled out the old plugs. New cement plugs
were olaced at the too of the formation which is the brine source. It is
believed that this has reduced the flow of brine which was entering the
shallow aquifers and the river.
K. "rench Drains
crench drains are used to collect storm runoff from highways, parking
lots and fields. The runoff is then disposed in shallow wells, usually less
than twenty feet deeo. Many contaminants such as phenols can be introduced to
ground water through french drains, since rain water can pick up virtually any
substance which is found in the air or on the, land surface. This type of well
is often found at industrial sites.
-39-
image:
229
As with other qround water quality oroblems, the likelihood of contamination
affecting oublic health deoends on the oroximity and depth of ground water,
the existence of subsurface barriers and the location of irrigation and
drinking water wells.
I. Seotic System Percolation
Seotic tanks sometimes lead to significant ground water contamination
problems. Seotic tank oroblems usually occur when they are placed in soils
that are inadequate to oerform the necessary digestion or when they are
located near water wells.
Nitrates in excess of drinking water standards have been found in the
mountainous areas of Jefferson and Park counties. It is believed that the
contamination is due to a combination of inadequate rocky soils, proximity of
seotic tank fields to water wells and the low volume of fault zone ground
waters. Colorado is currently updating it's individual sewage disposal system
regulations.
J. Unolugged Exoloration Holes
This is believed to have the potential for being a very severe problem.
This activity often results in establishing hydrologic communication between
aquifers of widely varying quality. Depending on the relative leads in the
aquifers, ooor quality water may enter the good quality aquifer.
1. South Park Alluvial Basin — This basin was the site of extensive
drilling for uranium during the late 1970's with thousands of test holes being
drilled (some as deeo as 3,000 feet). The ground water in this discharges
into the South "latte River. There have been no studies to determine if
shallow ground waters have been impacted by the drilling.
2. Meeker Dome ~ This is located near Meeker and is the site of two
imorooerly olugged oil exploration wells. Brine from a deep aquifer was
moving uo the ooen hole and moving around the improperly set plug via
fractures in the formation surrounding the plug. This brine ultimately
discharged to the White River. The U.S. Bureau of Reclamation has reentered
the susoected oroblem wells and drilled out the old plugs. New cement plugs
were olaced at the too of the formation which is the brine source. It is
believed that this has reduced the flow of brine which was entering the
shallow aquifers and the river.
K. "rench Drains
crench drains are used to collect storm runoff from highways, parking
lots and fields. The runoff is then disposed in shallow wells, usually less
than twenty feet deeo. Many contaminants such as phenols can be introduced to
ground water through french drains, since rain water can pick up virtually any
substance which is found in the air or on the, land surface. This type of well
is often found at industrial sites.
-39-
image:
 Contaminants may include salts used for snow removal, oil and gasoline
oathogens* oesticides and herbicides, heavy metals and various organics. Th«
magnitude of ground water problems due to french drains has not been
documented.
I. 1-25 -- Most drainage from the median strip of 1-25 north of Denver
is disoosed of via french drains.
I. Sewage lagoons
A few small towns in Colorado still use unlined ponds to treat sewage.
Unlined lagoons oose a ootential threat to ground water, since nitrates and
oathogens and other undesirable material may migrate into aquifers. An added
oroblem with sewage lagoons is that unlike most surface impoundments, they are
usually near oooulation centers and rivers.
Unlined sewage lagoons are the exceotion rather than the rule because of
new regulations and better technology. A 1981 survey found only three unlined
sewage lagoons in Colorado where major ground water contamination potential
exists.
M. Natural Contamination
1. Paradox Valley Salinity — The Paradox Valley overlies a large salt
dome in Southwestern Colorado near the town of Bedrock. Recharge to the
alluvium overlying the salt circulated through the top of the dome and
leaching out the sodium chloride. This resulting ground water has a total
dissolved solid of more than 260,000 mg/liter. The ground water ultimately
discharges into the Del ores River near Bedrock.
The U.S. Bureau of Reclamation is oresently installing a well field thai
will divert the flow of brine from the spring into a deep brine disposal well.
N. Agricultural and land Use-Related
1. Northeastern Colorado -- Several -counties in Northeast Colorado have
exoerienced increases in nitrates in the ground water of the alluvium of the
South Platte River. It is suspected that the problem is due to over
aoolication of fertilizer. The water districts have asked for State and
cederal assistance in developing a regional ground water quality monitoring
orogram and guidelines for fertilizer aoolication.
2. Increasing Uranium in South Platte Alluvial Aquifers — Many domestic
wells oroduce water which has uranium in excess of the 10 picocuries/1iter
health risk guideline developed by EPA. It is believed that the amount of
uranium is increasing because of the introduction of oxygen rich water to the
alluvial aquifers during over irrigation.
-40-
image:
Contaminants may include salts used for snow removal, oil and gasoline
oathogens* oesticides and herbicides, heavy metals and various organics. Th«
magnitude of ground water problems due to french drains has not been
documented.
I. 1-25 -- Most drainage from the median strip of 1-25 north of Denver
is disoosed of via french drains.
I. Sewage lagoons
A few small towns in Colorado still use unlined ponds to treat sewage.
Unlined lagoons oose a ootential threat to ground water, since nitrates and
oathogens and other undesirable material may migrate into aquifers. An added
oroblem with sewage lagoons is that unlike most surface impoundments, they are
usually near oooulation centers and rivers.
Unlined sewage lagoons are the exceotion rather than the rule because of
new regulations and better technology. A 1981 survey found only three unlined
sewage lagoons in Colorado where major ground water contamination potential
exists.
M. Natural Contamination
1. Paradox Valley Salinity — The Paradox Valley overlies a large salt
dome in Southwestern Colorado near the town of Bedrock. Recharge to the
alluvium overlying the salt circulated through the top of the dome and
leaching out the sodium chloride. This resulting ground water has a total
dissolved solid of more than 260,000 mg/liter. The ground water ultimately
discharges into the Del ores River near Bedrock.
The U.S. Bureau of Reclamation is oresently installing a well field thai
will divert the flow of brine from the spring into a deep brine disposal well.
N. Agricultural and land Use-Related
1. Northeastern Colorado -- Several -counties in Northeast Colorado have
exoerienced increases in nitrates in the ground water of the alluvium of the
South Platte River. It is suspected that the problem is due to over
aoolication of fertilizer. The water districts have asked for State and
cederal assistance in developing a regional ground water quality monitoring
orogram and guidelines for fertilizer aoolication.
2. Increasing Uranium in South Platte Alluvial Aquifers — Many domestic
wells oroduce water which has uranium in excess of the 10 picocuries/1iter
health risk guideline developed by EPA. It is believed that the amount of
uranium is increasing because of the introduction of oxygen rich water to the
alluvial aquifers during over irrigation.
-40-
image:
 MONTANA - «,-,,
Conclusion:, Ground water oollution has occurred due to mining. Both
abandoned and active mines can discharge highly acidic water causing
degradation of qround water. Contamination of surface waters from abandoned
mining ooerations is well known, however, hidden oollution of alluvial
aquifers with acids and heavy metals occurs in every instance of acid mine
drainage to surface waters. While acid mine drainage is normally associated
with metal mines in the mountains, acid mine drainage has also occurred in the
3elt-Sand Coulee coal mining area southeast of Great Falls. Strip mining coal
also can create serious ground water oroblems.
A. Mine .Related ^Problems
1. Anaconda: Ground water around the abandoned smelter is believed to be
imoacted by solid waste dumps. Studies are continuing. Seepage from Warm
Sorings and Oooortunity tailing ponds may be occurring. There is no known use
of ground water.
2. Selt-Stockett-Sand Coulee: Acid mine drainage from abandoned coal mines
is not believed to be affecting drinking water sources but is adding metal
contaminants to the alluvium.
3. Basin Mining Area: Problems are occurring due to seepage from old
tailings oiles. No ground water is being used, but impacts have been recorded
on the following local streams: High Ore Creek, Basin Creek, Uncle Sam Gulch,
Cataract Creek.
4. Cooke City: Abandoned mine tailings are contaminating springs with heavy
metals. The main imoact is on Soda Butte Creek.
5. Colstrio: Active coal mining is occurring in the area. Studies show
ground water moving through sooils has elevated total dissolved solids,
magnesium, calcium, sulfate, lead and nickel levels. There is a possibility
the Port Union aquifer, orimarily used for stock watering might be affected.
5. Columbus: The ground water contains chromium from an old chrome ore
orocessing waste oile.
7. Decker: This is an active coal mining area similar to Colstrip with high
TOS and inorganic constituents in the alluvial ground water.
3. Hughesville: Metal contamination occurs in ground water below the old
tailings oond. There is no use of ground water in the area.
9. Helena Mining Area: Cyanide was detected in water being pumped to supply
the mill at the Franklin Mine. Cyanide in springs below the Goldsil Mine
tailings oonds have caused two fish kills in Silver Creek. Acid mine drainage
has been recorded from abandoned mines and mine tailings along Spring Creek,
Prickly Pear Creek and Ten Mile Creek. Ground water contamination has
occurred in the Soring Creek area.
image:
MONTANA - «,-,,
Conclusion:, Ground water oollution has occurred due to mining. Both
abandoned and active mines can discharge highly acidic water causing
degradation of qround water. Contamination of surface waters from abandoned
mining ooerations is well known, however, hidden oollution of alluvial
aquifers with acids and heavy metals occurs in every instance of acid mine
drainage to surface waters. While acid mine drainage is normally associated
with metal mines in the mountains, acid mine drainage has also occurred in the
3elt-Sand Coulee coal mining area southeast of Great Falls. Strip mining coal
also can create serious ground water oroblems.
A. Mine .Related ^Problems
1. Anaconda: Ground water around the abandoned smelter is believed to be
imoacted by solid waste dumps. Studies are continuing. Seepage from Warm
Sorings and Oooortunity tailing ponds may be occurring. There is no known use
of ground water.
2. Selt-Stockett-Sand Coulee: Acid mine drainage from abandoned coal mines
is not believed to be affecting drinking water sources but is adding metal
contaminants to the alluvium.
3. Basin Mining Area: Problems are occurring due to seepage from old
tailings oiles. No ground water is being used, but impacts have been recorded
on the following local streams: High Ore Creek, Basin Creek, Uncle Sam Gulch,
Cataract Creek.
4. Cooke City: Abandoned mine tailings are contaminating springs with heavy
metals. The main imoact is on Soda Butte Creek.
5. Colstrio: Active coal mining is occurring in the area. Studies show
ground water moving through sooils has elevated total dissolved solids,
magnesium, calcium, sulfate, lead and nickel levels. There is a possibility
the Port Union aquifer, orimarily used for stock watering might be affected.
5. Columbus: The ground water contains chromium from an old chrome ore
orocessing waste oile.
7. Decker: This is an active coal mining area similar to Colstrip with high
TOS and inorganic constituents in the alluvial ground water.
3. Hughesville: Metal contamination occurs in ground water below the old
tailings oond. There is no use of ground water in the area.
9. Helena Mining Area: Cyanide was detected in water being pumped to supply
the mill at the Franklin Mine. Cyanide in springs below the Goldsil Mine
tailings oonds have caused two fish kills in Silver Creek. Acid mine drainage
has been recorded from abandoned mines and mine tailings along Spring Creek,
Prickly Pear Creek and Ten Mile Creek. Ground water contamination has
occurred in the Soring Creek area.
image:
 10. Great Falls: Ground water at the abandoned Anaconda copper and zinc
refinery is laden with heavy metals. Further studies are being carried out.
There is no known use of ground water. ' .
11.- Jardine: Arsenic has been found in ground water near these mining
activities.
12. Philiosburg Mining Area: Mercury and heavy metals have been found in
alluvial aquifers in mined areas in the Flint Creek Range.
13. Silver Bow Creek: The alluvial aquifer from the confluence of Copper
Creek in Butte to the Warm Borings Ponds northeast of Anaconda has received
industrial, municioal, agricultural and doemstic wastes for more than 100
years. Contaminants include heavy metals and elemental phosphorus.
Coal seams like those found in the Fort Union Formation in eastern
Montana can be important ground water aquifers. Removal of these coal seams
has affected ground water availability in areas down gradient from strip
mines. Studies have shown that ground water moving through strip mined spoils
develooed elevated levels of total dissolved" solids (TOS), magnesium, calcium,
sulfate and heavy metals.
3. Solid Waste Disposal landfills
Ground water contamination from solid waste disposal sites occurs as
ground water moves laterally through buried wastes or as water percolates down
through waste. Prior to 1977, solid waste disposal sites or landfills were
licensed by counties, but in 1977 the Montana Solid Waste Management Bureau
was given license to establish a statewide landfill review and licensing
system. Before 1967 there were no landfill licensing or review requirements.
Landfills established orior to 1967, and to a certain extent prior to state
licensing in 1977, are more likely to cose a pollution threat to ground water.'"
Prior to the licensing requirements, many communities did not thoroughly
consider environmental consequences when siting waste disposal areas.
landfills have been sited in drainage areas with oermeable soils and shallow
ground water. Described below are landfill sites which threaten to contamin-
ate ground water. Many of the landfills have been closed or are expected to
close. Monitoring orograms are done on a casa-by-case basis and are extremely
limited due to high costs. Other landfills undoubtedly oose a threat to
ground water quality; those described below appear to pose the worst
oollution hazards:
1. Old Livingston landfill. This sanitary landfill, located aporoximately
one mile northeast of livingston adjacent to the Yellowstone River, has been
closed. The landfill area is underlain by shallow alluvial ground water. A
oortion of the landfill actually lies beneath the ground water table. The
ground water at the site has elevated TOS, hardness, alkalinity, chloride,
ootassium, total organic carbon (TOC) and chemical oxygen demand (COO), the
ground water in the general area is used for domestic, stock, irrigation and
municioal ourooses.
image:
10. Great Falls: Ground water at the abandoned Anaconda copper and zinc
refinery is laden with heavy metals. Further studies are being carried out.
There is no known use of ground water. ' .
11.- Jardine: Arsenic has been found in ground water near these mining
activities.
12. Philiosburg Mining Area: Mercury and heavy metals have been found in
alluvial aquifers in mined areas in the Flint Creek Range.
13. Silver Bow Creek: The alluvial aquifer from the confluence of Copper
Creek in Butte to the Warm Borings Ponds northeast of Anaconda has received
industrial, municioal, agricultural and doemstic wastes for more than 100
years. Contaminants include heavy metals and elemental phosphorus.
Coal seams like those found in the Fort Union Formation in eastern
Montana can be important ground water aquifers. Removal of these coal seams
has affected ground water availability in areas down gradient from strip
mines. Studies have shown that ground water moving through strip mined spoils
develooed elevated levels of total dissolved" solids (TOS), magnesium, calcium,
sulfate and heavy metals.
3. Solid Waste Disposal landfills
Ground water contamination from solid waste disposal sites occurs as
ground water moves laterally through buried wastes or as water percolates down
through waste. Prior to 1977, solid waste disposal sites or landfills were
licensed by counties, but in 1977 the Montana Solid Waste Management Bureau
was given license to establish a statewide landfill review and licensing
system. Before 1967 there were no landfill licensing or review requirements.
Landfills established orior to 1967, and to a certain extent prior to state
licensing in 1977, are more likely to cose a pollution threat to ground water.'"
Prior to the licensing requirements, many communities did not thoroughly
consider environmental consequences when siting waste disposal areas.
landfills have been sited in drainage areas with oermeable soils and shallow
ground water. Described below are landfill sites which threaten to contamin-
ate ground water. Many of the landfills have been closed or are expected to
close. Monitoring orograms are done on a casa-by-case basis and are extremely
limited due to high costs. Other landfills undoubtedly oose a threat to
ground water quality; those described below appear to pose the worst
oollution hazards:
1. Old Livingston landfill. This sanitary landfill, located aporoximately
one mile northeast of livingston adjacent to the Yellowstone River, has been
closed. The landfill area is underlain by shallow alluvial ground water. A
oortion of the landfill actually lies beneath the ground water table. The
ground water at the site has elevated TOS, hardness, alkalinity, chloride,
ootassium, total organic carbon (TOC) and chemical oxygen demand (COO), the
ground water in the general area is used for domestic, stock, irrigation and
municioal ourooses.
image:
 2. West Yellowstone Landfill. This landfill, located on Forest Service land
north of West Yellowstone, has been demonstrated to pollute ground water
beneath the site with IDS, iron, manganese and lead. A plume of contaminated
leach ate is believed to be moving toward the Madison River. There is no use
of ground water in the area. This landfill is expected to be closed.
3. Alder Qumosite. High seasonal ground water exists. No control has been
exercised over disoosal of seotic tank Dumpings or hazardous waste in the
oast. This dumosite is expected to close.
4. Stanford Qumosite. High ground water levels exist at site. A study of
alternative refuse disposal options was recently completed, but the site will
probably remain in use for some time.
5. Sheridan Dumosite. High seasonal ground water levels exist at the site. •
Negotiations on closing the landfill continue.
5. Sand Coulee Oumosite. This dump is sited in an abandoned coal mining area
with high ground water. The dump has been closed and efforts are being
initiated to "cap" the fill with less permeable cover materials.
7. Cascade Landfill. The landfill sits adjacent to the Missouri River in an
area of high ground water. This landfill is expected to close.
8. Helena landfill. This landfill is situated in moderately permeable soils
30 feet above the ground water table. It is suspected that a leachate plume
with high levels of nitrate is migrating north. Studies are continuing.
9. Scratchgravel Landfill. The landfill is situated in permeable soils 35 to
50 feet above the ground water. Samples indicate a leachate with high nitrate
(15 mg/1) and high conductivity (1500 micromhos/cm). Studies are continuing.
10. Judith Gap Oumosite. This open dump is located in a high ground water
area. Studies are continuing.
11. Anaconda Landfill. The landfill lies adjacent to Warm Springs Creek in an
area of high ground water. The landfill is still in use.
12. Plains Landfill. This landfill is located in a gravel pit with highly
permeable soils. There is positive evidence that leachate is being found and
a olume is probably moving toward the adjacent Clark's Fork River.
13. Butte Landfill. Samples have shown that ground water is being
contaminated, but the extent of the problem is unknown. Remedial efforts have
been taken to minimize the problem. Studies are continuing.
14, Big Timber Landfill. It is strongly suspected that a leachate plume from
the site may be flowing toward the Boulder River. Studies are continuing.
The site is expected to close.
15. Cut Bank Landfill. This landfill is located in an area of high.ground
water. The extent of contamination is unknown, but continued use of the site
is expected.
image:
2. West Yellowstone Landfill. This landfill, located on Forest Service land
north of West Yellowstone, has been demonstrated to pollute ground water
beneath the site with IDS, iron, manganese and lead. A plume of contaminated
leach ate is believed to be moving toward the Madison River. There is no use
of ground water in the area. This landfill is expected to be closed.
3. Alder Qumosite. High seasonal ground water exists. No control has been
exercised over disoosal of seotic tank Dumpings or hazardous waste in the
oast. This dumosite is expected to close.
4. Stanford Qumosite. High ground water levels exist at site. A study of
alternative refuse disposal options was recently completed, but the site will
probably remain in use for some time.
5. Sheridan Dumosite. High seasonal ground water levels exist at the site. •
Negotiations on closing the landfill continue.
5. Sand Coulee Oumosite. This dump is sited in an abandoned coal mining area
with high ground water. The dump has been closed and efforts are being
initiated to "cap" the fill with less permeable cover materials.
7. Cascade Landfill. The landfill sits adjacent to the Missouri River in an
area of high ground water. This landfill is expected to close.
8. Helena landfill. This landfill is situated in moderately permeable soils
30 feet above the ground water table. It is suspected that a leachate plume
with high levels of nitrate is migrating north. Studies are continuing.
9. Scratchgravel Landfill. The landfill is situated in permeable soils 35 to
50 feet above the ground water. Samples indicate a leachate with high nitrate
(15 mg/1) and high conductivity (1500 micromhos/cm). Studies are continuing.
10. Judith Gap Oumosite. This open dump is located in a high ground water
area. Studies are continuing.
11. Anaconda Landfill. The landfill lies adjacent to Warm Springs Creek in an
area of high ground water. The landfill is still in use.
12. Plains Landfill. This landfill is located in a gravel pit with highly
permeable soils. There is positive evidence that leachate is being found and
a olume is probably moving toward the adjacent Clark's Fork River.
13. Butte Landfill. Samples have shown that ground water is being
contaminated, but the extent of the problem is unknown. Remedial efforts have
been taken to minimize the problem. Studies are continuing.
14, Big Timber Landfill. It is strongly suspected that a leachate plume from
the site may be flowing toward the Boulder River. Studies are continuing.
The site is expected to close.
15. Cut Bank Landfill. This landfill is located in an area of high.ground
water. The extent of contamination is unknown, but continued use of the site
is expected.
image:
 C. Oi| and Gas exploration andDevelopment Activity - 2.J 4
Brines, often oumoed with oil to the surface, have IDS levels ranging
from 10,000 to 300,000 mg/1. They are disposed of by reinjection or by
discharging into evaporation pits. Failures in either production well or
injection well casings can allow brines to escape into aquifers containing
good quality water. Unlined evaporation pits can allow brine to seep into
shallow ground water. Spills of oil or brine at the surface can contaminate
shallow ground wter.
One oroblem is on the cort Peck Indian Reservation where poor injection
practices in the 1950's have resulted in large increases in the IDS into the
Foxhills Sandstone, which is locally used for domestic and agricultural
purposes. Several wells have been abandoned.
Underground seismic exploration for oil and gas has resulted in a concern
for ground water contamination. Shot holes are drilled less than 200 feet
deep and explosives detonated during-seismic testing. Each year thousands of
seismic test holes are drilled throughout Montana. These shot holes create
concern that shallow polluted ground waters (perhaps influenced by saline
seep) will contaminate deeper, higher quality aquifers. Seismic shot holes
have been found to partially plug themselves naturally as they cave in. There
is still concern, however, that they allow surface water to enter aquifers,
thus mixing different aquifers. There is also concern about contamination
from chemicals used in explosives. It is expected that state rules will be
established requiring shot holes to be filled.
0. Municipal/Industrial Wastewater Disposal
Many industrial and municipal wastewater disposal systems use facultative
or aerobic lagoons or evaooration and seepage ponds. Wastewater percolating
into the soil beneath these impoundments may pose a pollution threat.
An investigation completed in 1979 identified 676 surface wastewater
impoundments in the state. The majority of these were less than 10 years
old. Additional impoundments have been constructed in the last four years.
The impoundments in Montana range in size from 0.01 acre to about 700
acres. The largest are associated with mining and industrial operations and
the smallest with oil and gas production and agricultural activities. Of the
676 impoundments, 154 were believed to pose ground water contamination
potential. Only a small percentage were found to be lined or have ground
water monitoring wells.
Results of the ground water contamination potential assessment indicated
that: 1) Industrial and mining impoundments tend to be located on low ground
near streams in alluvial sand and gravel and where ground water is moving
toward the stream with no intervening water wells; 2) a very high proportion
of oil and gas impoundments are located far from large streams and ground
water aquifers; 3) a large proportion of other impoundments tend to be
located on alluvium along the ma.jor river valleys; 4) most of the impoundments
are associated with water that is a current drinking water source and 5) most
of the wastewater that is put into the impoundments has low to medium health
hazard potential.
-44-
image:
C. Oi| and Gas exploration andDevelopment Activity - 2.J 4
Brines, often oumoed with oil to the surface, have IDS levels ranging
from 10,000 to 300,000 mg/1. They are disposed of by reinjection or by
discharging into evaporation pits. Failures in either production well or
injection well casings can allow brines to escape into aquifers containing
good quality water. Unlined evaporation pits can allow brine to seep into
shallow ground water. Spills of oil or brine at the surface can contaminate
shallow ground wter.
One oroblem is on the cort Peck Indian Reservation where poor injection
practices in the 1950's have resulted in large increases in the IDS into the
Foxhills Sandstone, which is locally used for domestic and agricultural
purposes. Several wells have been abandoned.
Underground seismic exploration for oil and gas has resulted in a concern
for ground water contamination. Shot holes are drilled less than 200 feet
deep and explosives detonated during-seismic testing. Each year thousands of
seismic test holes are drilled throughout Montana. These shot holes create
concern that shallow polluted ground waters (perhaps influenced by saline
seep) will contaminate deeper, higher quality aquifers. Seismic shot holes
have been found to partially plug themselves naturally as they cave in. There
is still concern, however, that they allow surface water to enter aquifers,
thus mixing different aquifers. There is also concern about contamination
from chemicals used in explosives. It is expected that state rules will be
established requiring shot holes to be filled.
0. Municipal/Industrial Wastewater Disposal
Many industrial and municipal wastewater disposal systems use facultative
or aerobic lagoons or evaooration and seepage ponds. Wastewater percolating
into the soil beneath these impoundments may pose a pollution threat.
An investigation completed in 1979 identified 676 surface wastewater
impoundments in the state. The majority of these were less than 10 years
old. Additional impoundments have been constructed in the last four years.
The impoundments in Montana range in size from 0.01 acre to about 700
acres. The largest are associated with mining and industrial operations and
the smallest with oil and gas production and agricultural activities. Of the
676 impoundments, 154 were believed to pose ground water contamination
potential. Only a small percentage were found to be lined or have ground
water monitoring wells.
Results of the ground water contamination potential assessment indicated
that: 1) Industrial and mining impoundments tend to be located on low ground
near streams in alluvial sand and gravel and where ground water is moving
toward the stream with no intervening water wells; 2) a very high proportion
of oil and gas impoundments are located far from large streams and ground
water aquifers; 3) a large proportion of other impoundments tend to be
located on alluvium along the ma.jor river valleys; 4) most of the impoundments
are associated with water that is a current drinking water source and 5) most
of the wastewater that is put into the impoundments has low to medium health
hazard potential.
-44-
image:
 235
There are localized imoacts at some surface impoundments. For instance,
the Chamoion oulo mill oonds northwest of Missoula introduce organic
contaminants, measured as biochemical oxygen demand and color, to the Clark
Fork River alluvial aquifer. It is also believed that the extensive tailing
oonds at Warm Sorings and Oooortunity, associated with the abandoned Anaconda
smelter, contribute heavy metals and dissolved solids to the local ground
waters. However, the conclusions of the study were that surface waste water
imooundments on a statewide basis had minimal impact on the quality of ground
water in Montana.
Recently, more attention has been given to land apolication of wastes,
oarticularly municioal wastewaters. The intent is to use the nutrients in
wastewater as fertilizer, thereby eliminating or reducing surface water
oollutants and achieving a higher level of wastewater treatment. Improper
design or excessive land apolication rates, however, can cause ground water
quality problems. Generally wastewater spray irrigation or sludge injection
systems are designed so apolication rates or nutrients are balanced with
accomoanying croo uotake rates. Under this scheme heavy metal application
rates are far below allowable limits.
1. Burlington Northern Krezelak oonds — located east of Havre Mountain
off Highway 2. Site was used for disposal of oil sludge and waste oil in
unlined oonds. Site has a high ground water contamination potential.
2. Burlington Northern Racetrack Ponds -- located east of Havre off
Highway 2. Site was used for disoosal of sludge and waste oil. Site has a
high groundwater contamination ootential.
3. Carter Oil Company Refinery — located in Cut Sank. Site is
abandoned but has high ground water pollution potential from disposal of waste
oil onsite.
4. liquid Air, Inc. — located in Missoula. Disposed of waste in an
unlined oond. Site has a high pollution potential.
5. Morgan Chemical — located 5 miles northwest of Great Falls, Montana
south of 1-15. Site used trenches to dispose of pesticides. There may be
some ground water contamination.
5. Paradise Tie Treatment — located in Thompson Falls. Disposed of
waste oroducts such as oentochloroohenol in ponds near the Clark Fork River.
There is a high ootential for ground water contamination. Contaminated ground
water may end uo in the river.
7. Borden Chemical Company — located in Missoula. Site has liquid and
solid waste disoosal into a clay lined pond. There is a potential for
contamination.
8. Great Western Sugar -- located in Billings in Section 10, T15, R26E.
The site used 11 oonds to dispose of sugar mill waste. Several wells on the
east side of the olant have been contaminated. Site was given a high pollu-
tion ootential by the surface imooundment assessment study.
image:
235
There are localized imoacts at some surface impoundments. For instance,
the Chamoion oulo mill oonds northwest of Missoula introduce organic
contaminants, measured as biochemical oxygen demand and color, to the Clark
Fork River alluvial aquifer. It is also believed that the extensive tailing
oonds at Warm Sorings and Oooortunity, associated with the abandoned Anaconda
smelter, contribute heavy metals and dissolved solids to the local ground
waters. However, the conclusions of the study were that surface waste water
imooundments on a statewide basis had minimal impact on the quality of ground
water in Montana.
Recently, more attention has been given to land apolication of wastes,
oarticularly municioal wastewaters. The intent is to use the nutrients in
wastewater as fertilizer, thereby eliminating or reducing surface water
oollutants and achieving a higher level of wastewater treatment. Improper
design or excessive land apolication rates, however, can cause ground water
quality problems. Generally wastewater spray irrigation or sludge injection
systems are designed so apolication rates or nutrients are balanced with
accomoanying croo uotake rates. Under this scheme heavy metal application
rates are far below allowable limits.
1. Burlington Northern Krezelak oonds — located east of Havre Mountain
off Highway 2. Site was used for disposal of oil sludge and waste oil in
unlined oonds. Site has a high ground water contamination potential.
2. Burlington Northern Racetrack Ponds -- located east of Havre off
Highway 2. Site was used for disoosal of sludge and waste oil. Site has a
high groundwater contamination ootential.
3. Carter Oil Company Refinery — located in Cut Sank. Site is
abandoned but has high ground water pollution potential from disposal of waste
oil onsite.
4. liquid Air, Inc. — located in Missoula. Disposed of waste in an
unlined oond. Site has a high pollution potential.
5. Morgan Chemical — located 5 miles northwest of Great Falls, Montana
south of 1-15. Site used trenches to dispose of pesticides. There may be
some ground water contamination.
5. Paradise Tie Treatment — located in Thompson Falls. Disposed of
waste oroducts such as oentochloroohenol in ponds near the Clark Fork River.
There is a high ootential for ground water contamination. Contaminated ground
water may end uo in the river.
7. Borden Chemical Company — located in Missoula. Site has liquid and
solid waste disoosal into a clay lined pond. There is a potential for
contamination.
8. Great Western Sugar -- located in Billings in Section 10, T15, R26E.
The site used 11 oonds to dispose of sugar mill waste. Several wells on the
east side of the olant have been contaminated. Site was given a high pollu-
tion ootential by the surface imooundment assessment study.
image:
 E. Accidental Spins and leakage Z36
Ground water oollution has also occurred due to accidental spills of
contaminants, and from leakage from underground storage tanks. Many spills
are not documented, therefore their nature and severity is unknown.
Described below are recently documented soills and leakages of
contaminants to ground water. Many other instances of spills of pollutants to
ground waters are believed to have occurred. Most are probably minor and
their cumulative imoact is known.
1. Billings. Phenol contamination of ground water allegedly exists at
the Exxon refinery. An investigation is continuing.
2. Bonner. High arsenic levels were found in ground water, levels were
ten times the drinking water standard of 0.05 mg/1. Some domestic wells were
found to be contaminated. The source is unknown and an investigation is
continuing.
3. Bozeman. A gas station adjacent to Montana State University leaked
gasoline into shallow ground water. A similar gas leakage problem continues
to olague domestic water suoplies on the west edge of town. Surface and
ground waters have been contaminated with creosote and pentachlorophenol in
the vicinity of Idaho Pole Company on the city's north side.
4. Broadus. Gasoline leaked into shallow ground water. Twelve inches
of gasoline were found to overlay a shallow water table. Gasoline fumes
existed in the county courthouse and nearby businesses. No wells were known
to be affected by this leakage to date.
5. Conrad. A gasoline station lost approximately 12,000 gallons of
gasoline in 1975. Gasoline fumes were found in a nearby basement.
6. Oeer lodge. Gasoline odors were detected in the municipal water
suooly in 1972. Aooarently the municioal well casing leaked gasoline into the
suooly. Several thousand gallons of diesel fuel were also accidentally
soilled from a tank car in 1970 or 1971.
7. East Helena. Slag piles at the ASARCO refinery are believed to be
leaching chemicals into ground water.
8. Glendive. 18,OOQ gallons of diesel fuel were spilled on the ground
in 1975. No detailed investigation of the spill was conducted.
9. Great Falls. Shallow ground water near the Falls Chemical Plant has
been shown to contain low levels of 2,4-0. There is no use of ground water in
the immediate area, but some trees have died around a nearby wetland.
10. Helena. Diesel fuel leaked into shallow ground water by the
Burlington Northern Railroad aooeared in a Helena storm drain and was
discharged into city storm water infiltration ponds. There is no known use of
ground water in the area.
image:
E. Accidental Spins and leakage Z36
Ground water oollution has also occurred due to accidental spills of
contaminants, and from leakage from underground storage tanks. Many spills
are not documented, therefore their nature and severity is unknown.
Described below are recently documented soills and leakages of
contaminants to ground water. Many other instances of spills of pollutants to
ground waters are believed to have occurred. Most are probably minor and
their cumulative imoact is known.
1. Billings. Phenol contamination of ground water allegedly exists at
the Exxon refinery. An investigation is continuing.
2. Bonner. High arsenic levels were found in ground water, levels were
ten times the drinking water standard of 0.05 mg/1. Some domestic wells were
found to be contaminated. The source is unknown and an investigation is
continuing.
3. Bozeman. A gas station adjacent to Montana State University leaked
gasoline into shallow ground water. A similar gas leakage problem continues
to olague domestic water suoplies on the west edge of town. Surface and
ground waters have been contaminated with creosote and pentachlorophenol in
the vicinity of Idaho Pole Company on the city's north side.
4. Broadus. Gasoline leaked into shallow ground water. Twelve inches
of gasoline were found to overlay a shallow water table. Gasoline fumes
existed in the county courthouse and nearby businesses. No wells were known
to be affected by this leakage to date.
5. Conrad. A gasoline station lost approximately 12,000 gallons of
gasoline in 1975. Gasoline fumes were found in a nearby basement.
6. Oeer lodge. Gasoline odors were detected in the municipal water
suooly in 1972. Aooarently the municioal well casing leaked gasoline into the
suooly. Several thousand gallons of diesel fuel were also accidentally
soilled from a tank car in 1970 or 1971.
7. East Helena. Slag piles at the ASARCO refinery are believed to be
leaching chemicals into ground water.
8. Glendive. 18,OOQ gallons of diesel fuel were spilled on the ground
in 1975. No detailed investigation of the spill was conducted.
9. Great Falls. Shallow ground water near the Falls Chemical Plant has
been shown to contain low levels of 2,4-0. There is no use of ground water in
the immediate area, but some trees have died around a nearby wetland.
10. Helena. Diesel fuel leaked into shallow ground water by the
Burlington Northern Railroad aooeared in a Helena storm drain and was
discharged into city storm water infiltration ponds. There is no known use of
ground water in the area.
image:
 237
11. Kalisoell. Evergreen area ground water is believed to be
contaminated by multiole sources. Soills of glue wastes at Plum Creek Plywood
are believed to contribute to the oroblern.
12. laurel. Petroleum products exist in ground water near the CENEX
refinery.
13. '.ewistown. Gasoline from a filling station leaked into shallow
ground water and surfaced in the basement of an apartment building resulting
in the evacuation of the building. There is no known use of ground water in
the area.
14. Libby. Elevated levels of pentachlorophenol were discovered in
irrigation wells. They were believed to arise from spills during pole
treatment at St. Regis '.umber.
15. Livingston. Diesel fuel was discovered in a ground water drain that
enters Sacaiawea lagoon.
16. Miles City. The Chicago-Milwaukee Railroad leaked diesel fuel into
ground water over many years. The railroad has recovered about 350,000
gallons of fuel to date.
17. Missoula. A oressurized oioeline was discovered to be leaking in
1972. Aooroximately 125,000 gallons of gasoline were lost into the ground
water.
F. Agricultural Practices
Saline seeos .pose one of the greatest threats to ground water. It is
caused by the dryland farming oractice of summer fallowing. Natural
vegetation is removed and excess soil moisture allowed to accumulate. Much of
the land used for dryland farming is rich in natural salts which are
susceotible to leaching. The excess moisture moves through the soil,
dissolving the salts and becoming increasingly saline. The salty solution can
and does contaminate ground water. Often the leached solution hits an
imoermeable geological formation, moves laterally downslope and emerges at the
surface where it forms the familiar saline seep.
Saline seeos have caused great concern in the agricultural community due
to the loss of oroductive land and salinization of freshwater reservoirs.
livestock can be ooisoned from drinking this water. Also, farm and ranch
families occasionally have had to abandon drinking water supplies that became
too saline.
The oollution source mao in Figure 4 shows the general areas where
dryland farming occurs in Montana. Ground water can be contaminated by saline
seeo in any area where dryland farming takes olace. Ground water can be
severely degraded.. TOS levels from 2,000 to 15,000 mg/1, sulfate levels of
several thousand mg/1 and nitrate levels ten times the drinking water standard
of 10 mg/1 have been observed.
-4-7-
image:
237
11. Kalisoell. Evergreen area ground water is believed to be
contaminated by multiole sources. Soills of glue wastes at Plum Creek Plywood
are believed to contribute to the oroblern.
12. laurel. Petroleum products exist in ground water near the CENEX
refinery.
13. '.ewistown. Gasoline from a filling station leaked into shallow
ground water and surfaced in the basement of an apartment building resulting
in the evacuation of the building. There is no known use of ground water in
the area.
14. Libby. Elevated levels of pentachlorophenol were discovered in
irrigation wells. They were believed to arise from spills during pole
treatment at St. Regis '.umber.
15. Livingston. Diesel fuel was discovered in a ground water drain that
enters Sacaiawea lagoon.
16. Miles City. The Chicago-Milwaukee Railroad leaked diesel fuel into
ground water over many years. The railroad has recovered about 350,000
gallons of fuel to date.
17. Missoula. A oressurized oioeline was discovered to be leaking in
1972. Aooroximately 125,000 gallons of gasoline were lost into the ground
water.
F. Agricultural Practices
Saline seeos .pose one of the greatest threats to ground water. It is
caused by the dryland farming oractice of summer fallowing. Natural
vegetation is removed and excess soil moisture allowed to accumulate. Much of
the land used for dryland farming is rich in natural salts which are
susceotible to leaching. The excess moisture moves through the soil,
dissolving the salts and becoming increasingly saline. The salty solution can
and does contaminate ground water. Often the leached solution hits an
imoermeable geological formation, moves laterally downslope and emerges at the
surface where it forms the familiar saline seep.
Saline seeos have caused great concern in the agricultural community due
to the loss of oroductive land and salinization of freshwater reservoirs.
livestock can be ooisoned from drinking this water. Also, farm and ranch
families occasionally have had to abandon drinking water supplies that became
too saline.
The oollution source mao in Figure 4 shows the general areas where
dryland farming occurs in Montana. Ground water can be contaminated by saline
seeo in any area where dryland farming takes olace. Ground water can be
severely degraded.. TOS levels from 2,000 to 15,000 mg/1, sulfate levels of
several thousand mg/1 and nitrate levels ten times the drinking water standard
of 10 mg/1 have been observed.
-4-7-
image:
 NORTH DAKOTA - 238
Ground Water Use
Ground waters in North Dakota occur in the Dakota, Pierre and Fox
Hills-Hen Creek aquifers of the Cretaceous age, the Fort Union Formation of
Tertiary age and Glacial Drift aquifers of Quaternary age. Each of these
aquifers yield water of economic importance in North Dakota.
The North Dakota State Water Commission has been collecting annual water
use information since 1965. The total ground water usage in the state is
aooroximately 121 MGO, which is IQ% of the total water usage.
Ground Water Quality Concerns
North Dakota has not exoerienced any major ground water quality problems.
Contamination of aquifers has been limited to small areas caused by bacterio-
logical contamination of shallow aquifers by septic tank drain fields or
leachate from solid waste disoosal sites entering the ground water. Natural
sources of contamination, including high uranium fluoride salts and arsenic
are being discovered. A large portion of the state's ground water resources
are located at a death which better protects them from human-induced sources
of oollution. The glaciated areas where shallow water table aquifers exist
have exoerienced very few contamination oroblems due to the absence of
industry and other detrimental land uses above these aquifers.
Although the state has encountered only minor ground water contamination
incidents, the ootential for future incidents exists. The North Dakota State
Oeoartment of Health, in conjunction with the North Dakota Geological Survey,..
has comoleted a surface wastewater impoundment assessment and it indicated
that many surface impoundments are sited in geologically poor conditions and
therefore have high pollution potentials. Also, ootential ground water
quality oroblems exist in the western oart of the state due to mining, oil and
gas exoloration and other energy related impacts.
1. Southeastern North Dakota Arsenic Issue: High levels of arsenic,
above the drinking water standard of .05 mg/1 have been reported in several
wells in southeastern North Dakota. During the 1930's grasshoppers had been a
serious oroblem in the area and were treated with a bait consisting of
arsenic, bran and sawdust. Some of the arsenicals were collected and sent to
comoanies for reuse or reprocessing. Small quantities of the arsenicals are
discovered occasionally. There are reoorts of burial of these substances on
farms. It is not known whether these arsenic comoounds are the source or if
the arsenic is naturally cccurirrg. The State is investigating the site as a
oossible Suoerfund site.
2. Husky Industries, Inc., East of Dickinson, Stark County: Concern is
with oossible ohenolic contamination of ground water from briquette operation.
image:
NORTH DAKOTA - 238
Ground Water Use
Ground waters in North Dakota occur in the Dakota, Pierre and Fox
Hills-Hen Creek aquifers of the Cretaceous age, the Fort Union Formation of
Tertiary age and Glacial Drift aquifers of Quaternary age. Each of these
aquifers yield water of economic importance in North Dakota.
The North Dakota State Water Commission has been collecting annual water
use information since 1965. The total ground water usage in the state is
aooroximately 121 MGO, which is IQ% of the total water usage.
Ground Water Quality Concerns
North Dakota has not exoerienced any major ground water quality problems.
Contamination of aquifers has been limited to small areas caused by bacterio-
logical contamination of shallow aquifers by septic tank drain fields or
leachate from solid waste disoosal sites entering the ground water. Natural
sources of contamination, including high uranium fluoride salts and arsenic
are being discovered. A large portion of the state's ground water resources
are located at a death which better protects them from human-induced sources
of oollution. The glaciated areas where shallow water table aquifers exist
have exoerienced very few contamination oroblems due to the absence of
industry and other detrimental land uses above these aquifers.
Although the state has encountered only minor ground water contamination
incidents, the ootential for future incidents exists. The North Dakota State
Oeoartment of Health, in conjunction with the North Dakota Geological Survey,..
has comoleted a surface wastewater impoundment assessment and it indicated
that many surface impoundments are sited in geologically poor conditions and
therefore have high pollution potentials. Also, ootential ground water
quality oroblems exist in the western oart of the state due to mining, oil and
gas exoloration and other energy related impacts.
1. Southeastern North Dakota Arsenic Issue: High levels of arsenic,
above the drinking water standard of .05 mg/1 have been reported in several
wells in southeastern North Dakota. During the 1930's grasshoppers had been a
serious oroblem in the area and were treated with a bait consisting of
arsenic, bran and sawdust. Some of the arsenicals were collected and sent to
comoanies for reuse or reprocessing. Small quantities of the arsenicals are
discovered occasionally. There are reoorts of burial of these substances on
farms. It is not known whether these arsenic comoounds are the source or if
the arsenic is naturally cccurirrg. The State is investigating the site as a
oossible Suoerfund site.
2. Husky Industries, Inc., East of Dickinson, Stark County: Concern is
with oossible ohenolic contamination of ground water from briquette operation.
image:
 3. Landfill near Grand Forks: leachate containing toxaohene and 2-39
oossiblv other oesticides from abandoned landfill drains on occasion into
•English Coulee, which drains into the Red River.
4. Sodium Chromate, Western North Dakota: Sodium chromate is used in
oil well-drilling ooerations» Concern is with possible ground or surface
water contamination from the chromium. Numerous well-drilling operations
occur in the Region and the State is studying few sites to determine if there
is a oroblem.
5. Valley City landfill: Concern with ground water contamination due to
solid waste leachates.
5. Amoco Refinery Sludge Oumo, Mandan: Refinery sludges and waste only
disoosed of on site in oonds create ground water pollution potential.
7. North Ashing Site, six miles'northwest of Belfield, Stark County:
Concern about ground and air contamination by radium, uranium, elevated gamma
radiation, molybdenum and other heavy metals from prior uraniferrous ashing
ooerations*
8. South Ashing Site, Southeast end of Selfield, Stark County: Same as
above.
9. Bowman Lignite Ashing Site, 7 miles west of Bowman in Griffin:
Problem same as above.
image:
3. Landfill near Grand Forks: leachate containing toxaohene and 2-39
oossiblv other oesticides from abandoned landfill drains on occasion into
•English Coulee, which drains into the Red River.
4. Sodium Chromate, Western North Dakota: Sodium chromate is used in
oil well-drilling ooerations» Concern is with possible ground or surface
water contamination from the chromium. Numerous well-drilling operations
occur in the Region and the State is studying few sites to determine if there
is a oroblem.
5. Valley City landfill: Concern with ground water contamination due to
solid waste leachates.
5. Amoco Refinery Sludge Oumo, Mandan: Refinery sludges and waste only
disoosed of on site in oonds create ground water pollution potential.
7. North Ashing Site, six miles'northwest of Belfield, Stark County:
Concern about ground and air contamination by radium, uranium, elevated gamma
radiation, molybdenum and other heavy metals from prior uraniferrous ashing
ooerations*
8. South Ashing Site, Southeast end of Selfield, Stark County: Same as
above.
9. Bowman Lignite Ashing Site, 7 miles west of Bowman in Griffin:
Problem same as above.
image:
 SOUTH DAKOTA 240
Existing And Potential ground Water Quality Problems/
Due to the lack of adequate surface water supplies apart from the
Missouri River, South Dakota relies on ground water for the majority of its
needs. Shallow alluvial and glacial aquifers generally have the best water
quality within the state although some bedrock aquifers associated with the
Black Hills have good water quality. As a generalization, deeper aquifers
have increasingly ooor water quality with depth. The majority of the deep
glacial and bedrock aquifers are unsuitable for irrigation. Unfortunately,
the aquifers with the best water quality are also the most subject to
contamination. Once large areas of an aquifer are contaminated, it is
generally imoractical to return the water quality to the original state.
Therefore, it is extremely important that the shallow aquifers be protected
from ground water contamination.
1. leaking Artesian Wells
The Dakota Sandstone and other artesian aquifers underlie virtually the
entire state. Many wells drilled into the Dakota once flowed at the surface
but now no longer do so due to the decline in artesian head (water level drop
due to declining oressure). Thousands of wells have been drilled into the
Dakota and other artesian aquifers but many were improperly built and/or
abandoned. There are from 12,000 to 15,000 artesian wells within the state
that either continuously discharge to the surface or leak uoward into other
aquifers above them. This is one of the most serious ground water quality
oroblems that the state faces. The water quality of the Dakota and other deep
bedrock aquifers is generally considerably worse than that of the overlying
shallow aquifers. Leakage from artesian wells upward into shallow aquifers """
can degrade the relatively good water quality in these shallow aquifers. The
state needs to olug or cao these abandoned wells.
2. Non-Point Source Pollution
Many areas of South Dakota where sandy soils overlie shallow aquifers are
showing increasing evidence of significant nitrate contamination. In Gregory
County, every town in the county has at least one municipal well in which
nitrate levels exceed the SDWA limit of 10 mg/1 NOs as N. In the Big Sioux
Basin, at least 11 wells serving oublic water suoplies in shallow aquifers
have nitrates in excess of this limit. The SO Office of Water Quality
comoiled nitrate data from 861 wells in Hamlin and Brookings Counties in the
Big Sioux Basin and found that 239 wells (27 percent) exceeded the limit.
Nitrate contamination of shallow aquifers due to non-point source pollution is
orobably the major ground water quality problem within the state and further
research is needed to determine the extent and source of this pollution in
order to imolement measures to control this degradation of the otherwise
usually good water quality of these shallow aquifers. A study is being
conducted in the Big Sioux River Basin to define the nature, extent and health
imoact of this type of oollution.
image:
SOUTH DAKOTA 240
Existing And Potential ground Water Quality Problems/
Due to the lack of adequate surface water supplies apart from the
Missouri River, South Dakota relies on ground water for the majority of its
needs. Shallow alluvial and glacial aquifers generally have the best water
quality within the state although some bedrock aquifers associated with the
Black Hills have good water quality. As a generalization, deeper aquifers
have increasingly ooor water quality with depth. The majority of the deep
glacial and bedrock aquifers are unsuitable for irrigation. Unfortunately,
the aquifers with the best water quality are also the most subject to
contamination. Once large areas of an aquifer are contaminated, it is
generally imoractical to return the water quality to the original state.
Therefore, it is extremely important that the shallow aquifers be protected
from ground water contamination.
1. leaking Artesian Wells
The Dakota Sandstone and other artesian aquifers underlie virtually the
entire state. Many wells drilled into the Dakota once flowed at the surface
but now no longer do so due to the decline in artesian head (water level drop
due to declining oressure). Thousands of wells have been drilled into the
Dakota and other artesian aquifers but many were improperly built and/or
abandoned. There are from 12,000 to 15,000 artesian wells within the state
that either continuously discharge to the surface or leak uoward into other
aquifers above them. This is one of the most serious ground water quality
oroblems that the state faces. The water quality of the Dakota and other deep
bedrock aquifers is generally considerably worse than that of the overlying
shallow aquifers. Leakage from artesian wells upward into shallow aquifers """
can degrade the relatively good water quality in these shallow aquifers. The
state needs to olug or cao these abandoned wells.
2. Non-Point Source Pollution
Many areas of South Dakota where sandy soils overlie shallow aquifers are
showing increasing evidence of significant nitrate contamination. In Gregory
County, every town in the county has at least one municipal well in which
nitrate levels exceed the SDWA limit of 10 mg/1 NOs as N. In the Big Sioux
Basin, at least 11 wells serving oublic water suoplies in shallow aquifers
have nitrates in excess of this limit. The SO Office of Water Quality
comoiled nitrate data from 861 wells in Hamlin and Brookings Counties in the
Big Sioux Basin and found that 239 wells (27 percent) exceeded the limit.
Nitrate contamination of shallow aquifers due to non-point source pollution is
orobably the major ground water quality problem within the state and further
research is needed to determine the extent and source of this pollution in
order to imolement measures to control this degradation of the otherwise
usually good water quality of these shallow aquifers. A study is being
conducted in the Big Sioux River Basin to define the nature, extent and health
imoact of this type of oollution.
image:
 3. '.andfills
241
A review of the ground water contamination of existing solid waste
disposal sites is needed and monitoring wells are recommended for sites whare
significant ground water contamination is likely (including monitoring wells
for any new sites). Monitoring wells have been established at landfills near
the towns of Brookings, Redfield, Mitchell, Mil bank, Vermillion, Aberdeen,
Canton, Gregory, OeSmet and Huron.
4. Urban Runoff
An urban runoff study is oresently underway in the Rapid City area.
While not designed to specifically address ground water pollution, this study
should orovide insight into reoorted problems with water quality in shallow
wells in the lower Raoid Creek valley. In some instances, road salting can
also cause ground water contamination.
5. Private Sewage Disposal Systems
The inadequate location, design, construction and operation of private
sewage disoosal systems such as seotic tanks and their drainfields can cause
localized ground water contamination oroblems. Rapid development of the Black
Hills is oresently occurring and many areas of the Black Hills are unsuitable
for the olacement of large numbers of closely spaced houses with individual
sewage disoosal systems. There are presently at least 50,000 septic tank
systems in the state.
6. Private Wells — Nitrates and Bacteria
In a study of rural wells in Aurora and Brule Counties, it was found tSrat
45.7 oercent of 122 shallow wells tested had nitrates in excess of the limit
of 10 mg/1 N03 as t and that 52.I percent of 120 shallow wells tested for
coliform bacteria had 30 or more coliforms per 100 ml. Very few complete
water quality analyses are available for private wells. Trace element and
organic water quality data is esoecially lacking. Further studies of private
wells are needed to ascertain water quality problems which may be associated
with these wells. There are at least 60,000 private wells for drinking water
in the state.
7. Mining
The improoer location and construction of impoundments for mining wastes
can cause localized ground water pollution. For further discussion of this
see the 1980 South .Dakota Surface Impoundment Assessment. Extensive
exoloration is occurring in South Dakota for oil, gas and minerals, including
uranium. DVJNR estimates that aporoximately 2000 exploration holes are being
drilled annually. Improperly olugged exploration holes can cause cross
contamination of aquifer with water from a poor quality aquifer polluting an
aquifer with water of better quality. Surface contaminants may also enter
aquifers through imorooerly olugged exploration holes. Because of the
Dotential magnitude of the oroblem, DWNR plans to implement a program to
randomly check to determine if exploration holes are being properly plugged
according to state regulations.
image:
3. '.andfills
241
A review of the ground water contamination of existing solid waste
disposal sites is needed and monitoring wells are recommended for sites whare
significant ground water contamination is likely (including monitoring wells
for any new sites). Monitoring wells have been established at landfills near
the towns of Brookings, Redfield, Mitchell, Mil bank, Vermillion, Aberdeen,
Canton, Gregory, OeSmet and Huron.
4. Urban Runoff
An urban runoff study is oresently underway in the Rapid City area.
While not designed to specifically address ground water pollution, this study
should orovide insight into reoorted problems with water quality in shallow
wells in the lower Raoid Creek valley. In some instances, road salting can
also cause ground water contamination.
5. Private Sewage Disposal Systems
The inadequate location, design, construction and operation of private
sewage disoosal systems such as seotic tanks and their drainfields can cause
localized ground water contamination oroblems. Rapid development of the Black
Hills is oresently occurring and many areas of the Black Hills are unsuitable
for the olacement of large numbers of closely spaced houses with individual
sewage disoosal systems. There are presently at least 50,000 septic tank
systems in the state.
6. Private Wells — Nitrates and Bacteria
In a study of rural wells in Aurora and Brule Counties, it was found tSrat
45.7 oercent of 122 shallow wells tested had nitrates in excess of the limit
of 10 mg/1 N03 as t and that 52.I percent of 120 shallow wells tested for
coliform bacteria had 30 or more coliforms per 100 ml. Very few complete
water quality analyses are available for private wells. Trace element and
organic water quality data is esoecially lacking. Further studies of private
wells are needed to ascertain water quality problems which may be associated
with these wells. There are at least 60,000 private wells for drinking water
in the state.
7. Mining
The improoer location and construction of impoundments for mining wastes
can cause localized ground water pollution. For further discussion of this
see the 1980 South .Dakota Surface Impoundment Assessment. Extensive
exoloration is occurring in South Dakota for oil, gas and minerals, including
uranium. DVJNR estimates that aporoximately 2000 exploration holes are being
drilled annually. Improperly olugged exploration holes can cause cross
contamination of aquifer with water from a poor quality aquifer polluting an
aquifer with water of better quality. Surface contaminants may also enter
aquifers through imorooerly olugged exploration holes. Because of the
Dotential magnitude of the oroblem, DWNR plans to implement a program to
randomly check to determine if exploration holes are being properly plugged
according to state regulations.
image:
 8. Industrial Activity . "
A variety of industrial sources can cause serious localized ground water
contamination. These include leaking oil, gas and chemical tanks, chemical
and oetroleum soil Is from trucks and railroads, etc. It is recommended
monitoring wells be required for any impoundment handling industrial wastes.
To date, this has been done only on a limited basis because of the high cost
of drilling the monitoring wells.
Hazardous _Waste .Sites
1. Black Hills Ordinance Oeoot: large quantities of mustard gas were
destroyed on the orooerty. It has been reported that some mustard gas was
ooured directly on the ground.
2. Brookings Landfi11: Leachats generation and ground water contamination
ootential.
3. Edgemont: Radon migration and construction-related use of uranium
tailings in Edgemont and nearby Cottonwood Community. NRC has allocated funds
for clean-uo.
4. Highland Electric Company, Madison: Contamination of soil with
oolychlorinated biohenyls.
5. landfill near St. Onge, Lawrence County: Several hundred 5-gallon cans of
1,2-dibromomethane mixed with diesel oil were dumped.
6. Raoid City Landfill: Suspected hazardous materials disposed at the site
in the oast.
7. Redfield Iron and Metal: Site receives scrap batteries and acid. Concern
is with acid runoff from prooerty.
3. Watertown City Landfill: Concern is with off-property contamination with.
leachate. Landfill receives some hazardous waste, including some empty
oesticide containers.
9. Whitewood Creek, near Lead: Mining and ore extraction from gold
ooerations over the oast century have resulted in stream and ground water
oollution.
-SZ-
image:
8. Industrial Activity . "
A variety of industrial sources can cause serious localized ground water
contamination. These include leaking oil, gas and chemical tanks, chemical
and oetroleum soil Is from trucks and railroads, etc. It is recommended
monitoring wells be required for any impoundment handling industrial wastes.
To date, this has been done only on a limited basis because of the high cost
of drilling the monitoring wells.
Hazardous _Waste .Sites
1. Black Hills Ordinance Oeoot: large quantities of mustard gas were
destroyed on the orooerty. It has been reported that some mustard gas was
ooured directly on the ground.
2. Brookings Landfi11: Leachats generation and ground water contamination
ootential.
3. Edgemont: Radon migration and construction-related use of uranium
tailings in Edgemont and nearby Cottonwood Community. NRC has allocated funds
for clean-uo.
4. Highland Electric Company, Madison: Contamination of soil with
oolychlorinated biohenyls.
5. landfill near St. Onge, Lawrence County: Several hundred 5-gallon cans of
1,2-dibromomethane mixed with diesel oil were dumped.
6. Raoid City Landfill: Suspected hazardous materials disposed at the site
in the oast.
7. Redfield Iron and Metal: Site receives scrap batteries and acid. Concern
is with acid runoff from prooerty.
3. Watertown City Landfill: Concern is with off-property contamination with.
leachate. Landfill receives some hazardous waste, including some empty
oesticide containers.
9. Whitewood Creek, near Lead: Mining and ore extraction from gold
ooerations over the oast century have resulted in stream and ground water
oollution.
-SZ-
image:
 UTAH . 243
Ground Water Use
While ground water is found throughout the state, the quantity and
quality varies greatly. Aquifers in Utah range from unconsolidated sands and
silts in the western deserts to consolidated carbonates and sandstones in the
Great Basin in the eastern portion of the state.
These aquifers are recharged near the mountains and discharge down
gradient with ever deteriorating quality as the water moves down gradient
picking uo additional salts. Because of the complex geology of Utah, aquifers
do not extend over large areas. Rather, an aquifer is generally common to a
single valley or a oarticular sub-area. Most of the water quality monitoring
activities by the Bureau of Water Pollution Control are now limited to surface
waters. However, a major ground water monitoring program has been underway
for many years and is now being carried on by the Bureau of Public Water
Suooly. In addition, Salt Lake County has a Jordan Basin ground water study
currently in progress.
A report from the Utah Water Research laboratory by Edward P. Fisk,
entitled, A Summary; _ojf Evaluation of Shallow Ground Water Contamination
Hazards j'n 'the 'State''of jjtah ^ .June T'l98lV deals with a survey to appraise
human-induced contamination of shallow ground water in selected areas in
Utah. The survey found a number of hazards to ground water do exist and
included:
1) Shallow aquifers with-the largest amounts of deleterious contaminants
underlie cities and towns. 2) Agricultural areas generate greater
quantities of dissolved salts and possibly other contaminants, but the """
contamination is spread over considerable larger areas and thus is more
dilute. 3) Improper disposal ponds, mining operations and poorly managed
solid waste dumps are serious hazards Ixally. 4) Septic and other
wastes from recreational activities in the state are small but are an
increasing hazard.
There is an arsenic problem of natural origin associated with the
aquifers in the Hinckley-Oelta area. Even though the level of arsenic exceeds
both state and federal standards, a health effects study completed by the
State Health Department in 1980 has shown that no statistically significant
health effects are associated with the elevated levels of arsenic in the study
area.
There are nitrate problems in the Cedar Valley area in Ironton County and
the Cornish area in Cache County. With respect to Cedar Valley, the water is
drawn from deep aquifers and the sources of nitrate contamination are
unknown. The source of nitrate contamination near Cornish in Cache County is
probably from the fertilization of agricultural areas in the vicinity of the
soring water source.
A problem of fluoride contamination is associated with the Johnson water
well system in OucHesne County as well as several private well sources in that
area. The problem appears to be associated with the geologic formations from
which the water is drawn.
image:
UTAH . 243
Ground Water Use
While ground water is found throughout the state, the quantity and
quality varies greatly. Aquifers in Utah range from unconsolidated sands and
silts in the western deserts to consolidated carbonates and sandstones in the
Great Basin in the eastern portion of the state.
These aquifers are recharged near the mountains and discharge down
gradient with ever deteriorating quality as the water moves down gradient
picking uo additional salts. Because of the complex geology of Utah, aquifers
do not extend over large areas. Rather, an aquifer is generally common to a
single valley or a oarticular sub-area. Most of the water quality monitoring
activities by the Bureau of Water Pollution Control are now limited to surface
waters. However, a major ground water monitoring program has been underway
for many years and is now being carried on by the Bureau of Public Water
Suooly. In addition, Salt Lake County has a Jordan Basin ground water study
currently in progress.
A report from the Utah Water Research laboratory by Edward P. Fisk,
entitled, A Summary; _ojf Evaluation of Shallow Ground Water Contamination
Hazards j'n 'the 'State''of jjtah ^ .June T'l98lV deals with a survey to appraise
human-induced contamination of shallow ground water in selected areas in
Utah. The survey found a number of hazards to ground water do exist and
included:
1) Shallow aquifers with-the largest amounts of deleterious contaminants
underlie cities and towns. 2) Agricultural areas generate greater
quantities of dissolved salts and possibly other contaminants, but the """
contamination is spread over considerable larger areas and thus is more
dilute. 3) Improper disposal ponds, mining operations and poorly managed
solid waste dumps are serious hazards Ixally. 4) Septic and other
wastes from recreational activities in the state are small but are an
increasing hazard.
There is an arsenic problem of natural origin associated with the
aquifers in the Hinckley-Oelta area. Even though the level of arsenic exceeds
both state and federal standards, a health effects study completed by the
State Health Department in 1980 has shown that no statistically significant
health effects are associated with the elevated levels of arsenic in the study
area.
There are nitrate problems in the Cedar Valley area in Ironton County and
the Cornish area in Cache County. With respect to Cedar Valley, the water is
drawn from deep aquifers and the sources of nitrate contamination are
unknown. The source of nitrate contamination near Cornish in Cache County is
probably from the fertilization of agricultural areas in the vicinity of the
soring water source.
A problem of fluoride contamination is associated with the Johnson water
well system in OucHesne County as well as several private well sources in that
area. The problem appears to be associated with the geologic formations from
which the water is drawn.
image:
 244
Mining^ Hazardous Wastes, landfi 11^ leaking Underground Tanks, Agricultural
Practices and Septic Janks
1. Salt lake County, Utah: Threats to Salt lake County's Important
shallow aquifers occurs from the above sources. Under the 208 areawide water
quality assessment, EPA is oarticipating along with the state, county and USGS
in an investigation of these sources. The adjacent copper raining activity is
known to contribute increased levels of TOS and susoected of potential heavy
metal increases. Various hazardous waste sitas in the city include the Fenced
Barrel Site (with 2 acres of 55-gallon drums containing pesticide wastes) the
Rose Oil Sludge Oisoosal site and others. Municipal landfills in the county
have allowed industrial waste disoosal of toxic materials. A drinking water
suooly well developed by a home improvement district cannot be used because of
elevated iron levels believed to be caused by an inactive landfill. Recent
oroblems include leakage front underground gasoline storage tanks. Irrigation
return flows are said to be increasing TDS concentrations. The community of
Sandy has had to abandon two domestic wells due to higher TOS values. Poor
seotic tank cleaning practices are possibly adding trichloroethylene to the
shallow aquifers.
2. Barrel Storage, 500 West North Temple, Salt lake City: Full,
oartially full and emoty containers on site, labels indicate a number of
hazardous chemicals..
3. Defense Deoot, Ogden: Possible problems from handling hazardous
wastes in the oast.
4. Ouchesne: Six oond sitas received oil and brine water wastes.
Citizen alleged that orivate well was contaminated by waste disposal.
5. Fenced Barrel Site, Southeast of main railroad yard of Union Pacific,
Salt lake City: One to two acres of discarded 55-gallon drums, labels
indicate 2,4,0-Butyl Ester, herbicides, Thiorol-Oxydizers and other herbicide
containers.
6. Old Cobalt Tailings Pond, Magna: Possibility of ground water
contamination from cobalt refinery tailings.
7. Roosevelt, east of Neola Highway, 1 mi'le north of Roosevelt: Oil and
brine waste deoosited in 1 1/2 acre oond. Citizen complaint of private well
having been contaminated.
8. Rose Park Canals, Salt lake City: Buried city sewage canals cutting
across aooroximately ten blocks of housing developments. Concern is with
ground water contamination and eruption of disposed materials in the housing.
9. Rose Park Oil Sludge Dump, Salt lake City: Approximately 5-acre site
used to bury refinery oil wastes to depth of 14 feet. Site was used for
disoosal until 1957 when Salt lake City bought it. Most of the site is
caooed. Possible ground water contamination. EPA has authorized additional
clay cap and clay barriars under the Superfund program.
image:
244
Mining^ Hazardous Wastes, landfi 11^ leaking Underground Tanks, Agricultural
Practices and Septic Janks
1. Salt lake County, Utah: Threats to Salt lake County's Important
shallow aquifers occurs from the above sources. Under the 208 areawide water
quality assessment, EPA is oarticipating along with the state, county and USGS
in an investigation of these sources. The adjacent copper raining activity is
known to contribute increased levels of TOS and susoected of potential heavy
metal increases. Various hazardous waste sitas in the city include the Fenced
Barrel Site (with 2 acres of 55-gallon drums containing pesticide wastes) the
Rose Oil Sludge Oisoosal site and others. Municipal landfills in the county
have allowed industrial waste disoosal of toxic materials. A drinking water
suooly well developed by a home improvement district cannot be used because of
elevated iron levels believed to be caused by an inactive landfill. Recent
oroblems include leakage front underground gasoline storage tanks. Irrigation
return flows are said to be increasing TDS concentrations. The community of
Sandy has had to abandon two domestic wells due to higher TOS values. Poor
seotic tank cleaning practices are possibly adding trichloroethylene to the
shallow aquifers.
2. Barrel Storage, 500 West North Temple, Salt lake City: Full,
oartially full and emoty containers on site, labels indicate a number of
hazardous chemicals..
3. Defense Deoot, Ogden: Possible problems from handling hazardous
wastes in the oast.
4. Ouchesne: Six oond sitas received oil and brine water wastes.
Citizen alleged that orivate well was contaminated by waste disposal.
5. Fenced Barrel Site, Southeast of main railroad yard of Union Pacific,
Salt lake City: One to two acres of discarded 55-gallon drums, labels
indicate 2,4,0-Butyl Ester, herbicides, Thiorol-Oxydizers and other herbicide
containers.
6. Old Cobalt Tailings Pond, Magna: Possibility of ground water
contamination from cobalt refinery tailings.
7. Roosevelt, east of Neola Highway, 1 mi'le north of Roosevelt: Oil and
brine waste deoosited in 1 1/2 acre oond. Citizen complaint of private well
having been contaminated.
8. Rose Park Canals, Salt lake City: Buried city sewage canals cutting
across aooroximately ten blocks of housing developments. Concern is with
ground water contamination and eruption of disposed materials in the housing.
9. Rose Park Oil Sludge Dump, Salt lake City: Approximately 5-acre site
used to bury refinery oil wastes to depth of 14 feet. Site was used for
disoosal until 1957 when Salt lake City bought it. Most of the site is
caooed. Possible ground water contamination. EPA has authorized additional
clay cap and clay barriars under the Superfund program.
image:
 245
10. Valley landfill, Salt Lake City (active): Concern is with
oossibility of qround water contamination. Landfill receives municipal and
industrial waste including hazardous and toxic wastes.
II. County landfill, Salt Lake City (inactive): Possible ground water
contamination.
12. West Valley landfill, West Valley: Gasoline vapors travelling along
sewer lines have entered homes and businesses causing evacuations.
13. Atlas Mineral Corooration Mill Site, Moab: An active mill site owned
by the Atlas Mineral Coro. Radon migration and construct!"on-related use of
uranium mill tailings in the town are the concerns. Possible alluvial aquifer
contamination due to uranium and daughter products.
14. Green River Uranium Mill Tailings, 39 acres near Green River:
Inactive uranium mill tailings containing residual radioactive materials.
15. Inactive Mill Site and Town, Monticello: Inactive uranium mill site
cleaned uo by AEC in the oast. There are mill tailings and ore debris still
left in the town.
16. Uranium Mill Tailings, Thompson: Same as above.
17. Vitro Uranium Mill Tailings, 230 acres southwest of Highway 163 near
Mexican Hat: Inactive uranium mill tailings containing residual radioactive
materials.
18. Bay Area Refuse Oisoosal, West Bountiful: Disposal site received low
levels of caustics, hydrocarbon sludges, office and construction trash.
Possible qround watar contamination..
19. North Davis County landfill, layton City: This landfill received
mostly municioal waste and a small quantity of hazardous waste. Possibility
of ground water contamination.
20. Trojan Division (Gomex), Spanish Forks: Facility owned by IMC
Corooration, Trojan Division. Site received over 10,000 gallons of 5% nitric
acid waste. Possibility of ground water pollution.
21. Woods Cross Refinery, West Bountiful: Phillips Petroleum owns the
site. Facility contains some chemical and cleaning waste from fuel tanks.
Possible soil and ground water pollution.
image:
245
10. Valley landfill, Salt Lake City (active): Concern is with
oossibility of qround water contamination. Landfill receives municipal and
industrial waste including hazardous and toxic wastes.
II. County landfill, Salt Lake City (inactive): Possible ground water
contamination.
12. West Valley landfill, West Valley: Gasoline vapors travelling along
sewer lines have entered homes and businesses causing evacuations.
13. Atlas Mineral Corooration Mill Site, Moab: An active mill site owned
by the Atlas Mineral Coro. Radon migration and construct!"on-related use of
uranium mill tailings in the town are the concerns. Possible alluvial aquifer
contamination due to uranium and daughter products.
14. Green River Uranium Mill Tailings, 39 acres near Green River:
Inactive uranium mill tailings containing residual radioactive materials.
15. Inactive Mill Site and Town, Monticello: Inactive uranium mill site
cleaned uo by AEC in the oast. There are mill tailings and ore debris still
left in the town.
16. Uranium Mill Tailings, Thompson: Same as above.
17. Vitro Uranium Mill Tailings, 230 acres southwest of Highway 163 near
Mexican Hat: Inactive uranium mill tailings containing residual radioactive
materials.
18. Bay Area Refuse Oisoosal, West Bountiful: Disposal site received low
levels of caustics, hydrocarbon sludges, office and construction trash.
Possible qround watar contamination..
19. North Davis County landfill, layton City: This landfill received
mostly municioal waste and a small quantity of hazardous waste. Possibility
of ground water contamination.
20. Trojan Division (Gomex), Spanish Forks: Facility owned by IMC
Corooration, Trojan Division. Site received over 10,000 gallons of 5% nitric
acid waste. Possibility of ground water pollution.
21. Woods Cross Refinery, West Bountiful: Phillips Petroleum owns the
site. Facility contains some chemical and cleaning waste from fuel tanks.
Possible soil and ground water pollution.
image:
 WYOMING 246
Ground .W atar JJ.se
Ground water is an extensively used resource throughout Wyoming and its
use is growing. Aooroximately 65% of Wyoming's population depends on ground
water as the source for its domestic water use. The state's livestock
industry is heavily dependent on ground watar. The energy industry of Wyoming
utilizes ground water in oower generation, secondary and tertiary oil recovery
and uranium mining and processing. Although the ground water used for
irrigation is a small percentage of the total amount of water utilized for
this ouroose, it still accounts for almost half of the state's total ground
water use.
Wyoming has over 50 separate geological formations ranging in age from
pre-Cambrian to Quaternary, which are presently serving as drinking water
aquifers. Taking into account the numerous structural basins that separate
the geologic formations into distinct aquifsrs, that number increases to over
150 aquifers. Oeoending on the definition of the area! extent of an
"aquifer", and taking into account faulting, alternating sand and shale,
lenses, "leaky" aquitards and the numerous pockets of Quaternary alluvial
"aquifers" the number of drinking water "aquifers" could easily surpass 1,000.
Hazardous Waste Site .Summaries
1. /\MQCO Refinery Oumo, Casoer: Dump is across the North Platte River
from the refinery. Dumo contained unknown refinery type wastes. Wyoming
Solid Waste Program reoorts that the drums are removed and that oily dirt at
the sfte is now soread on a landfill. Clean UP is completed, monitoring
results ara needed to determine success.
2. Horse Creek, near laramie: Site contains two railroad tankers filled
with carbolic acid that were derailed in 1975. The railroad buried the cars.
Concern over oossibility of ground watar contamination.
3. Old Refinery, Newcastle: Petroleum hydrocarbons in storm sewer lines.
4. Porcuoine Creek Mine, Big Horn Mountains near Love 11: Concern is
with contamination of ground with mercury from gold mining operations. State
of Wyoming will evaluate this site.
5. Riverton SuTfuric Acid Plant, SW of Riverton, Fremont County:
Possible sulfuric acid discharge into ground water in late 1950's from
Susquehanna Western Comoany (now defunct).
6. Southwestern Refining Company, la Barge: Potential for ground water
contamination due to refinery disposal activities.
7. Union Pacific Railroad, laranvie (Creosote Plant): Report of
discharge of creosote into the laramie River. Possible discharge of organics
to alluvium.
image:
WYOMING 246
Ground .W atar JJ.se
Ground water is an extensively used resource throughout Wyoming and its
use is growing. Aooroximately 65% of Wyoming's population depends on ground
water as the source for its domestic water use. The state's livestock
industry is heavily dependent on ground watar. The energy industry of Wyoming
utilizes ground water in oower generation, secondary and tertiary oil recovery
and uranium mining and processing. Although the ground water used for
irrigation is a small percentage of the total amount of water utilized for
this ouroose, it still accounts for almost half of the state's total ground
water use.
Wyoming has over 50 separate geological formations ranging in age from
pre-Cambrian to Quaternary, which are presently serving as drinking water
aquifers. Taking into account the numerous structural basins that separate
the geologic formations into distinct aquifsrs, that number increases to over
150 aquifers. Oeoending on the definition of the area! extent of an
"aquifer", and taking into account faulting, alternating sand and shale,
lenses, "leaky" aquitards and the numerous pockets of Quaternary alluvial
"aquifers" the number of drinking water "aquifers" could easily surpass 1,000.
Hazardous Waste Site .Summaries
1. /\MQCO Refinery Oumo, Casoer: Dump is across the North Platte River
from the refinery. Dumo contained unknown refinery type wastes. Wyoming
Solid Waste Program reoorts that the drums are removed and that oily dirt at
the sfte is now soread on a landfill. Clean UP is completed, monitoring
results ara needed to determine success.
2. Horse Creek, near laramie: Site contains two railroad tankers filled
with carbolic acid that were derailed in 1975. The railroad buried the cars.
Concern over oossibility of ground watar contamination.
3. Old Refinery, Newcastle: Petroleum hydrocarbons in storm sewer lines.
4. Porcuoine Creek Mine, Big Horn Mountains near Love 11: Concern is
with contamination of ground with mercury from gold mining operations. State
of Wyoming will evaluate this site.
5. Riverton SuTfuric Acid Plant, SW of Riverton, Fremont County:
Possible sulfuric acid discharge into ground water in late 1950's from
Susquehanna Western Comoany (now defunct).
6. Southwestern Refining Company, la Barge: Potential for ground water
contamination due to refinery disposal activities.
7. Union Pacific Railroad, laranvie (Creosote Plant): Report of
discharge of creosote into the laramie River. Possible discharge of organics
to alluvium.
image:
 247
8. Riverton Uranium Mill Tailings: Inactive uranium mill tailings
containing residual radioactive materials.
9. Solit Rock Uranium Mill Town, Jeffrey City: Uranium mill tailings
and ore debris from twenty-five year old Western Nuclear Corporation mill site
have contaminated the town. Tailings oond has caused ground water
contamination which is moving off-site.
10. Soook Site, Converse County: Inactive uranium mill tailings
containing residual radioactive materials.
11. Casoer City Dumo: landfill received hazardous waste, such as tank
bottom sludges, waste oils and solvents, acids and pesticides. Dump has two
lagoons for waste disoosal. Municioal waste is disposed there too. Hazardous
waste disoosal reoorted to have ceased in January 1980. Concern over possible
surface and ground water contamination as well as air pollution.
12. leefe Plant (Mailing Address: Star Route, Randolph, UT 84Q54):
Site receives ohosohate mining and ore beneficiation waste from the owner,
Stauffer Chemical Company. Possible ground and surface water contamination.
image:
247
8. Riverton Uranium Mill Tailings: Inactive uranium mill tailings
containing residual radioactive materials.
9. Solit Rock Uranium Mill Town, Jeffrey City: Uranium mill tailings
and ore debris from twenty-five year old Western Nuclear Corporation mill site
have contaminated the town. Tailings oond has caused ground water
contamination which is moving off-site.
10. Soook Site, Converse County: Inactive uranium mill tailings
containing residual radioactive materials.
11. Casoer City Dumo: landfill received hazardous waste, such as tank
bottom sludges, waste oils and solvents, acids and pesticides. Dump has two
lagoons for waste disoosal. Municioal waste is disposed there too. Hazardous
waste disoosal reoorted to have ceased in January 1980. Concern over possible
surface and ground water contamination as well as air pollution.
12. leefe Plant (Mailing Address: Star Route, Randolph, UT 84Q54):
Site receives ohosohate mining and ore beneficiation waste from the owner,
Stauffer Chemical Company. Possible ground and surface water contamination.
image:
 248
V.
Superfund Section
Hazardous Hastes - Inactive Sites
Environmental Management Report
Page Nun bar
PART 1 - Status, Trends, and Progress to Date 250
I. Status
A. National Priorities List (NPL) '
B. High Priority Sites Not on the NPL
C. Federal Facilities
D. Assessment and Investigation
of Potential Problem Sites
II. Trends
III. Progress to Date
A. NPL-Listed Sites
8. High Priority Sites not on the NPL
C. Federal Facilities
D. Assessment and Investigation of
Potential Problem Sites
PART 2 - Problem Identification, Distribution, Ranking, 256
and Implications for Agency Management
I. Most Signj.fi cant Problems (Inacti ve Hazardous
Waste Sites Listed and Ranked)
A. NPL
B. High Priority Sites not on the NPL
C. Federal Facilities
D. Assessment of Potential Sites
II. Imp 11 cati ons for Agency Management
A. NPL
B. High Priority Sites not on the NPL
C. Federal Facilities .
HI. Problan Distribution 258
A. NPL
8. High Priority Sites Not on the NPL
C. Federal Facilities
D. Assessment and Investigation of Potential Problen Sites
image:
248
V.
Superfund Section
Hazardous Hastes - Inactive Sites
Environmental Management Report
Page Nun bar
PART 1 - Status, Trends, and Progress to Date 250
I. Status
A. National Priorities List (NPL) '
B. High Priority Sites Not on the NPL
C. Federal Facilities
D. Assessment and Investigation
of Potential Problem Sites
II. Trends
III. Progress to Date
A. NPL-Listed Sites
8. High Priority Sites not on the NPL
C. Federal Facilities
D. Assessment and Investigation of
Potential Problem Sites
PART 2 - Problem Identification, Distribution, Ranking, 256
and Implications for Agency Management
I. Most Signj.fi cant Problems (Inacti ve Hazardous
Waste Sites Listed and Ranked)
A. NPL
B. High Priority Sites not on the NPL
C. Federal Facilities
D. Assessment of Potential Sites
II. Imp 11 cati ons for Agency Management
A. NPL
B. High Priority Sites not on the NPL
C. Federal Facilities .
HI. Problan Distribution 258
A. NPL
8. High Priority Sites Not on the NPL
C. Federal Facilities
D. Assessment and Investigation of Potential Problen Sites
image:
 24.0
jiuperfund Section (continued) '
Hazardous Wastes - Inactive Sites
Page Number
ATTACH'-ENT A - Distribution of Problem Sites Among States 259
I. Problem Distribution Between States
A, National Priorities List
B. High Priority Sites not on the NPL
C. Federal Faciliti es
0. Assessment of Potential Sites
ATTACHMENT B - Synopses of Problems at Inactive Hazardous 259
e Sites In Region 8
I. National Priorities List
A. Denver Radiirn Site, Colorado (Figure 3)
B. Wood bury Chemical Company Site, Colorado (Figure 3)
C. Central City-Idaho Spri ng Mining
District Site, Colorado (Figure 2)
D. California Gulch, Colorado (Figure 2)
E. Sand Creek Industrial Site, Colorado (Figure 3)
F. Marshall Landfill, Colorado (Figure 3)
G. Silver Bow Creek, Montana (Figure 6}
H. Milltown Reservoir, Montana (Figure 6)
I. Libby Ground Water, Montana (Figure 6)
J. Anaconda Smelter, Montana (Figure 6)
K. Arsenic Trioxide Site, North Dakota (Figure 7)
L. Whitewood Creek, South Dakota (Figure 7)
M. Rosewood Park, Utah (Figure 3)
N. Union Pacific/J.H. Baxter, Wyoming (Figure 5)
II. High Priority Sites not on the NPL 264
A. Lowry Landfill, Colorado (Figure 2}
8. ASARCO Smelter, Montana (Figure 6)
III. Federal Facilities 265
A. Rocky Mountain Arsenal (Figure 3)
B. Lead vi lie Drainage Ttnnel (Figure 2)
FIGURES 1-8 (Maps showing Superfund sites) 267
GRAPHS AND CHARTS (Graphs and charts referred in text) 275
image:
24.0
jiuperfund Section (continued) '
Hazardous Wastes - Inactive Sites
Page Number
ATTACH'-ENT A - Distribution of Problem Sites Among States 259
I. Problem Distribution Between States
A, National Priorities List
B. High Priority Sites not on the NPL
C. Federal Faciliti es
0. Assessment of Potential Sites
ATTACHMENT B - Synopses of Problems at Inactive Hazardous 259
e Sites In Region 8
I. National Priorities List
A. Denver Radiirn Site, Colorado (Figure 3)
B. Wood bury Chemical Company Site, Colorado (Figure 3)
C. Central City-Idaho Spri ng Mining
District Site, Colorado (Figure 2)
D. California Gulch, Colorado (Figure 2)
E. Sand Creek Industrial Site, Colorado (Figure 3)
F. Marshall Landfill, Colorado (Figure 3)
G. Silver Bow Creek, Montana (Figure 6}
H. Milltown Reservoir, Montana (Figure 6)
I. Libby Ground Water, Montana (Figure 6)
J. Anaconda Smelter, Montana (Figure 6)
K. Arsenic Trioxide Site, North Dakota (Figure 7)
L. Whitewood Creek, South Dakota (Figure 7)
M. Rosewood Park, Utah (Figure 3)
N. Union Pacific/J.H. Baxter, Wyoming (Figure 5)
II. High Priority Sites not on the NPL 264
A. Lowry Landfill, Colorado (Figure 2}
8. ASARCO Smelter, Montana (Figure 6)
III. Federal Facilities 265
A. Rocky Mountain Arsenal (Figure 3)
B. Lead vi lie Drainage Ttnnel (Figure 2)
FIGURES 1-8 (Maps showing Superfund sites) 267
GRAPHS AND CHARTS (Graphs and charts referred in text) 275
image:
 IV.
HAZARDOUS WASTES - INACTIVE SITES (SUPERFUND)
REGION VIII ENVIRONMENTAL MANAGEMENT REPORT
PART 1
STATUS (I). TRENDS (II). PROGRESS TO DATE (III)
I. SUMMARY OF STATUS
A. NATIONAL PRIORITIES LIST fNPl) ^PROPOSED)
Region VIII has 14 sites on the proposed National Priorities List
(NPL). Six are located in Colorado, 4 are located in Montana, and Utah,
Wyoming, North Dakota, and South Dakota—each have one site. The Region has
mining sites and one radiation site in addition to the more traditional
inactive and abandoned hazardous waste sites fe.p., landfills). Mining sites
are treated somewhat differently from other NPL-listed sites. Enforcement
actions must be exhausted under CERCLA and other environmental laws before
expenditure of the fund can generally occur. Figures 1-3 show the location
of the NPL-listed sites throughout Region VIII (graphs 1 and 2).
B. HIGH PRIORITY SITES NOT ON THE NPL
Region VIII has sites that require attention even though they are not
on the proposed NPL. These are Lowry Landfill, Denver; Canon City (Lincoln
Park, Colorado); 2 radiation-contaminated structures in Monticello, Utah;
Rocky Mountain Phosphate, Garrison, and the ASARCO smelter complex, East
Helena, Montana. Lowry Landfill, a potential groundwater contamination
problem, the radiation-contamination structures at Monticello, Utah, and Rocky
Mountain Phosphate, a potential surface and groundwater contamination problem,
were nominated for the NPL. They did not score high enough using EPA's hazard
ranking system primarily because of population. Canon City (Lincoln Park), a
groundwater contamination problem, required additional information to complete
a proper evaluation. That information has been collected and the site will be
evaluated. The Region expects to submit the ASARCO smelter at the NPL's
initial quarterly update. Our evaluation could not be completed in time for
the publication of the proposed NPL. Figures ?, 4, and 6 show the location of
these sites throughout the Region.
C. FEDERAL FACILITIES
Seven Federal facilities are actual or potential oublic health and
environmental concerns to this Region. Three are located in Colorado: Rocky
Mountain Arsenal (Denver) and Pueblo Army Depot fPueblo1! owned by the Army,
and the Leadville Drainage Tunnel (Leadville) owned by the Bureau of
Reclamation. Four Department of Defense facilities in Utah are also of
concern. These are Dugway Proving Ground, Tooele Army Depot, Ogden Army
Depot, and Hill AFB. In each case, actual or ootential contamination of
surface and groundwater exists. Figures 2, 3, and 4 show the location of
- 4 -
image:
IV.
HAZARDOUS WASTES - INACTIVE SITES (SUPERFUND)
REGION VIII ENVIRONMENTAL MANAGEMENT REPORT
PART 1
STATUS (I). TRENDS (II). PROGRESS TO DATE (III)
I. SUMMARY OF STATUS
A. NATIONAL PRIORITIES LIST fNPl) ^PROPOSED)
Region VIII has 14 sites on the proposed National Priorities List
(NPL). Six are located in Colorado, 4 are located in Montana, and Utah,
Wyoming, North Dakota, and South Dakota—each have one site. The Region has
mining sites and one radiation site in addition to the more traditional
inactive and abandoned hazardous waste sites fe.p., landfills). Mining sites
are treated somewhat differently from other NPL-listed sites. Enforcement
actions must be exhausted under CERCLA and other environmental laws before
expenditure of the fund can generally occur. Figures 1-3 show the location
of the NPL-listed sites throughout Region VIII (graphs 1 and 2).
B. HIGH PRIORITY SITES NOT ON THE NPL
Region VIII has sites that require attention even though they are not
on the proposed NPL. These are Lowry Landfill, Denver; Canon City (Lincoln
Park, Colorado); 2 radiation-contaminated structures in Monticello, Utah;
Rocky Mountain Phosphate, Garrison, and the ASARCO smelter complex, East
Helena, Montana. Lowry Landfill, a potential groundwater contamination
problem, the radiation-contamination structures at Monticello, Utah, and Rocky
Mountain Phosphate, a potential surface and groundwater contamination problem,
were nominated for the NPL. They did not score high enough using EPA's hazard
ranking system primarily because of population. Canon City (Lincoln Park), a
groundwater contamination problem, required additional information to complete
a proper evaluation. That information has been collected and the site will be
evaluated. The Region expects to submit the ASARCO smelter at the NPL's
initial quarterly update. Our evaluation could not be completed in time for
the publication of the proposed NPL. Figures ?, 4, and 6 show the location of
these sites throughout the Region.
C. FEDERAL FACILITIES
Seven Federal facilities are actual or potential oublic health and
environmental concerns to this Region. Three are located in Colorado: Rocky
Mountain Arsenal (Denver) and Pueblo Army Depot fPueblo1! owned by the Army,
and the Leadville Drainage Tunnel (Leadville) owned by the Bureau of
Reclamation. Four Department of Defense facilities in Utah are also of
concern. These are Dugway Proving Ground, Tooele Army Depot, Ogden Army
Depot, and Hill AFB. In each case, actual or ootential contamination of
surface and groundwater exists. Figures 2, 3, and 4 show the location of
- 4 -
image:
 251
these sites within Region VIII. Under a CERCtA Presidential Order, the
Department of Defense has been asked to implement response actions at their
facilities. EPA remains involved, however, because the agency still is
responsible for ensuring protection of the environment and public health.
The Region, Colorado Department of Health, Shell Chemical Company,
and Department of the Army (DA) have entered into a formal agreement which
provides the basis for addressing and correcting contamination problems at
Rocky Mountain Arsenal. The Bureau of Reclamation has been asked to develop
and implement a response action at the Leadville Tunnel concurrently with
EPA's efforts at the NPL-listed California Gulch site. These latter two sites
impact each other.
EPA retains RCRA authority over all Federal facilities.
D. ASSESSMENT AND INVESTIGATION OF POTENTIAL PROBLEM SITES
The Region will visit and assess the potential contamination problem
at every known inactive or abandoned hazardous waste site during FY-83 and
FY-84. The ERRIS system will be the list of sites from which the Region will
work. Approximately 575 sites are listed on ERRIS within Region VIII. Of
these sites, approximately 250 sites reauire some type of initial assessment.
If past experience remains current, about 125 of these sites will require a
visit to complete our evaluation.
EPA is providing the states within Region VIII a one-time allocation
to assist in our evaluation effort (3012 allocation). States must submit ---
their request for this Superfund money within the next 90 days. The money
will be distributed to the States based on the number of sites within that
state listed on ERRIS, Colorado can receive up to $155,000 (highest amount);
North Dakota can receive up to $25,000 (lowest).
Almost half of the ERRIS listed sites are located in Colorado (239);
North Dakota and South Dakota have the fewest sites (approximately 35 each).
Mining, radiation, and the "traditional" sites (e.g., chemical waste problems)
compose this list (Graph 3).
II. TRENDS
EPA initially published its list of sites eligible for Superfund money in
October 1981. It contained 115 sites of which 4 were from Region VIII. these
were the Denver Radium Site, Colorado; Whitewood Creek, South Dakota; Arsenic
Trioxide Site, North Dakota; and Rose Park, Utah. In July 1982, 45 additional
sites were added. Three sites in Reaion VIII were
- 5 -
image:
251
these sites within Region VIII. Under a CERCtA Presidential Order, the
Department of Defense has been asked to implement response actions at their
facilities. EPA remains involved, however, because the agency still is
responsible for ensuring protection of the environment and public health.
The Region, Colorado Department of Health, Shell Chemical Company,
and Department of the Army (DA) have entered into a formal agreement which
provides the basis for addressing and correcting contamination problems at
Rocky Mountain Arsenal. The Bureau of Reclamation has been asked to develop
and implement a response action at the Leadville Tunnel concurrently with
EPA's efforts at the NPL-listed California Gulch site. These latter two sites
impact each other.
EPA retains RCRA authority over all Federal facilities.
D. ASSESSMENT AND INVESTIGATION OF POTENTIAL PROBLEM SITES
The Region will visit and assess the potential contamination problem
at every known inactive or abandoned hazardous waste site during FY-83 and
FY-84. The ERRIS system will be the list of sites from which the Region will
work. Approximately 575 sites are listed on ERRIS within Region VIII. Of
these sites, approximately 250 sites reauire some type of initial assessment.
If past experience remains current, about 125 of these sites will require a
visit to complete our evaluation.
EPA is providing the states within Region VIII a one-time allocation
to assist in our evaluation effort (3012 allocation). States must submit ---
their request for this Superfund money within the next 90 days. The money
will be distributed to the States based on the number of sites within that
state listed on ERRIS, Colorado can receive up to $155,000 (highest amount);
North Dakota can receive up to $25,000 (lowest).
Almost half of the ERRIS listed sites are located in Colorado (239);
North Dakota and South Dakota have the fewest sites (approximately 35 each).
Mining, radiation, and the "traditional" sites (e.g., chemical waste problems)
compose this list (Graph 3).
II. TRENDS
EPA initially published its list of sites eligible for Superfund money in
October 1981. It contained 115 sites of which 4 were from Region VIII. these
were the Denver Radium Site, Colorado; Whitewood Creek, South Dakota; Arsenic
Trioxide Site, North Dakota; and Rose Park, Utah. In July 1982, 45 additional
sites were added. Three sites in Reaion VIII were
- 5 -
image:
 252
included in this addition: Marshall Landfill, Woodbury Chemical Company site,
and the Central City-Idaho Springs Mining District. These additions are all
located in Colorado. In December 1982, the proposed NPL was published
containing 418 sites. Fourteen of these sites are located in Region VIII.
III. PROGRESS TO DATE
The Region has completed efforts at NPL-listed, other high priority, and
Federal sites which have or will yield positive environmental results.
A. NPL-LISTED SITES
1. Arsenic Trioxide site, Southeastern North Dakota: The State is
continuing its remedial investigation under terms of the cooperative
agreement. This effort is on schedule.
2. Whitewood Creek, Black Hills area, South Dakota: The
contractors selected by the State, EPA, and Homestake Mining Company to
complete the remedial investigation began field work in late March. This
effort is being conducted in accordance with the agreement reached among the
three parties.
3. Union Pacific/J. H. Baxter site, Laramie, Wyoming: The
settlement between the State and Union Pacific and Baxter to implement a
remedial investigation and remedy has been started. The Region is expecting
to initiate negotiations with the parties to undertake measures to abate
contaminants leaking from unlined ponds concurrently with their remedial
investigation.
4. Rose Park, Salt Lake Citv, Utah: The slurry wall surrounding
the sludge pit has been constructed. The clay cap construction began in late
April. Its installation is scheduled for completion in July.
S. Libby Groundwater site, Libby, Montana: A potentially
responsible party has verbally agreed to conduct a remedial investigation at
this site beginning in May. An administrative order under 106 of CERCLA has
been drafted.
6. Anaconda Smelter, Anaconda, Montana: The Region believes that a
remedy will be required to abate contamination at this facility. The Region
is meeting with the company to develop an administrative order to address our
contamination control concerns at this site. An existing agreement with
Anaconda provides for the company and EPA to perform a remedial investigation
at the site.
- 6 -
image:
252
included in this addition: Marshall Landfill, Woodbury Chemical Company site,
and the Central City-Idaho Springs Mining District. These additions are all
located in Colorado. In December 1982, the proposed NPL was published
containing 418 sites. Fourteen of these sites are located in Region VIII.
III. PROGRESS TO DATE
The Region has completed efforts at NPL-listed, other high priority, and
Federal sites which have or will yield positive environmental results.
A. NPL-LISTED SITES
1. Arsenic Trioxide site, Southeastern North Dakota: The State is
continuing its remedial investigation under terms of the cooperative
agreement. This effort is on schedule.
2. Whitewood Creek, Black Hills area, South Dakota: The
contractors selected by the State, EPA, and Homestake Mining Company to
complete the remedial investigation began field work in late March. This
effort is being conducted in accordance with the agreement reached among the
three parties.
3. Union Pacific/J. H. Baxter site, Laramie, Wyoming: The
settlement between the State and Union Pacific and Baxter to implement a
remedial investigation and remedy has been started. The Region is expecting
to initiate negotiations with the parties to undertake measures to abate
contaminants leaking from unlined ponds concurrently with their remedial
investigation.
4. Rose Park, Salt Lake Citv, Utah: The slurry wall surrounding
the sludge pit has been constructed. The clay cap construction began in late
April. Its installation is scheduled for completion in July.
S. Libby Groundwater site, Libby, Montana: A potentially
responsible party has verbally agreed to conduct a remedial investigation at
this site beginning in May. An administrative order under 106 of CERCLA has
been drafted.
6. Anaconda Smelter, Anaconda, Montana: The Region believes that a
remedy will be required to abate contamination at this facility. The Region
is meeting with the company to develop an administrative order to address our
contamination control concerns at this site. An existing agreement with
Anaconda provides for the company and EPA to perform a remedial investigation
at the site.
- 6 -
image:
 253
7. Mi 11 town Groundwater site, Mi 11 town, Montana: A cooperative
agreement is being prepared proposing a remedial investigation, feasibility
study, and Initial Remedial Measure CIRM). The IRM will provide an alternate
water supply for families who are presently paying for bottled water. Their
original water supply has become contaminated with arsenic. The draft
cooperative agreement was completed in April and is in Headquarters for
concurrence.
8. Silver Bow Creek, Butte area, Montana: A cooperative agreement
is being prepared to cover a remedial investigation and feasibility study.
Our objective is to have the draft cooperative agreement completed by June 15.
9. Denver Radium Site, Denver, Colorado: The action memorandum
authorizing expenditure of about $??0,000 of Superfund money was approved.
The money will be used to complete the feasibility study. The State's
submission was finalized April 15.
10. Marshall Landfill, Boulder County, Colorado: Browning-Ferris
Industries has verbally agreed to complete the remedial investigation,
feasibility study, and remedy, as required. Our objective is to have a signed
agreement by May 20.
11. Woodbury Chemical Company site, Denver, Colorado: EPA awarded
Superfund money to complete the remedial investigation, feasibility study, and
two initial remedial measures CIRMs). The site will be fenced to restrict
access, and a temporary clay cap will be installed to prevent additional
spread of contaminated soil by precipitation or surface water run-off.
12. Central City-Idaho Springs Mining District Site, Clear Creek
County, Colorado: EPA awarded Superfund money to complete the remedial
investigation and feasibility study.
13. California-Gulch, Leadville, Colorado: The Region met with the
Bureau of Reclamation to determine their commitment to jointly finance
remedial work with responsible parties associated with the Superfund site.
The Bureau of Reclamation owns a tunnel which discharges contaminants into the
Arkansas River a few miles upstream from the California Gulch discharge. Any
remedial action addressing California Gulch should also address the Bureau of
Reclamation's discharge. The Bureau of Reclamation agreed to participate.
The Region will meet with responsible parties to negotiate their participation
in a remedial investigation and feasibility study of California Gulch.
The Region sampled drinking water sources potentially
contaminated by California Gulch during February. Results are being evaluated.
- 7 -
image:
253
7. Mi 11 town Groundwater site, Mi 11 town, Montana: A cooperative
agreement is being prepared proposing a remedial investigation, feasibility
study, and Initial Remedial Measure CIRM). The IRM will provide an alternate
water supply for families who are presently paying for bottled water. Their
original water supply has become contaminated with arsenic. The draft
cooperative agreement was completed in April and is in Headquarters for
concurrence.
8. Silver Bow Creek, Butte area, Montana: A cooperative agreement
is being prepared to cover a remedial investigation and feasibility study.
Our objective is to have the draft cooperative agreement completed by June 15.
9. Denver Radium Site, Denver, Colorado: The action memorandum
authorizing expenditure of about $??0,000 of Superfund money was approved.
The money will be used to complete the feasibility study. The State's
submission was finalized April 15.
10. Marshall Landfill, Boulder County, Colorado: Browning-Ferris
Industries has verbally agreed to complete the remedial investigation,
feasibility study, and remedy, as required. Our objective is to have a signed
agreement by May 20.
11. Woodbury Chemical Company site, Denver, Colorado: EPA awarded
Superfund money to complete the remedial investigation, feasibility study, and
two initial remedial measures CIRMs). The site will be fenced to restrict
access, and a temporary clay cap will be installed to prevent additional
spread of contaminated soil by precipitation or surface water run-off.
12. Central City-Idaho Springs Mining District Site, Clear Creek
County, Colorado: EPA awarded Superfund money to complete the remedial
investigation and feasibility study.
13. California-Gulch, Leadville, Colorado: The Region met with the
Bureau of Reclamation to determine their commitment to jointly finance
remedial work with responsible parties associated with the Superfund site.
The Bureau of Reclamation owns a tunnel which discharges contaminants into the
Arkansas River a few miles upstream from the California Gulch discharge. Any
remedial action addressing California Gulch should also address the Bureau of
Reclamation's discharge. The Bureau of Reclamation agreed to participate.
The Region will meet with responsible parties to negotiate their participation
in a remedial investigation and feasibility study of California Gulch.
The Region sampled drinking water sources potentially
contaminated by California Gulch during February. Results are being evaluated.
- 7 -
image:
 254
14. Sand Creek Industrial Site, Denver, Colorado: The Region
initiated discussions with a potentially responsible party concerning a
portion of this site. A responsible oarty search for the site will be
completed during June. At that time, the Region will initiate negotiations.
B. HIGH PRIORITY SITES NOT ON THE NPL
1. Lowry Landfill, Denver, Colorado: The Region is conducting a
quarterly sampling of groundwater. That information is being used by the City
and County of Denver to develop a remedy. The State of Colorado and the
Region are reviewing their proposal as it becomes finalized,.
2. Rocky Mountain Phosphate, Garrison, Montana: At the Region's
prodding, the property owner made arrangements with private contractors to
remove the hazardous materials from this site. Some removal has occurred.
The remaining hazardous materials will be removed over the next several months
under a CERCLA 106 Order expected to go out in mid-May.
3. Anaconda Smelter, Great Falls, Montana: Under a formal
agreement between the State of Montana, EPA, and Anaconda Minerals Company,
that company completed a site investigation in September 1982. The results of
this investigation are being reviewed by the parties. Subsequent work will
depend on conclusions developed by this review.
4. ASARCO Smelter, East Helena, Montana: The Center for Disease
Control has indicated that they will conduct a lead blood level study of
1-5-year-old children during the soring of 1983. The Region and ASARCO are
discussing the approach to be taken to investigate potential lead
contamination of soil and surface and groundwater.
5. Monticello Radiation problem, Utah: The Region will comolete a
health risk assessment of the private home and catalogue store during May
1983. Subsequent work will depend on results of this assessment.
6. Canon City, ^Lincoln Park!, Colorado: The Region is reviewing a
recently completed assessment of oroundwater contamination at Lincoln Park.
Subsequent work will depend on results of.this review.
- 8 -
image:
254
14. Sand Creek Industrial Site, Denver, Colorado: The Region
initiated discussions with a potentially responsible party concerning a
portion of this site. A responsible oarty search for the site will be
completed during June. At that time, the Region will initiate negotiations.
B. HIGH PRIORITY SITES NOT ON THE NPL
1. Lowry Landfill, Denver, Colorado: The Region is conducting a
quarterly sampling of groundwater. That information is being used by the City
and County of Denver to develop a remedy. The State of Colorado and the
Region are reviewing their proposal as it becomes finalized,.
2. Rocky Mountain Phosphate, Garrison, Montana: At the Region's
prodding, the property owner made arrangements with private contractors to
remove the hazardous materials from this site. Some removal has occurred.
The remaining hazardous materials will be removed over the next several months
under a CERCLA 106 Order expected to go out in mid-May.
3. Anaconda Smelter, Great Falls, Montana: Under a formal
agreement between the State of Montana, EPA, and Anaconda Minerals Company,
that company completed a site investigation in September 1982. The results of
this investigation are being reviewed by the parties. Subsequent work will
depend on conclusions developed by this review.
4. ASARCO Smelter, East Helena, Montana: The Center for Disease
Control has indicated that they will conduct a lead blood level study of
1-5-year-old children during the soring of 1983. The Region and ASARCO are
discussing the approach to be taken to investigate potential lead
contamination of soil and surface and groundwater.
5. Monticello Radiation problem, Utah: The Region will comolete a
health risk assessment of the private home and catalogue store during May
1983. Subsequent work will depend on results of this assessment.
6. Canon City, ^Lincoln Park!, Colorado: The Region is reviewing a
recently completed assessment of oroundwater contamination at Lincoln Park.
Subsequent work will depend on results of.this review.
- 8 -
image:
 255
C. FEDERAL FACILITIES
1. Leadville Tunnel, Colorado: Please see discussion under the
Superfund site, California Gulch.
?. Rocky Mountain Arsenal, Denver, Colorado: EPA, the Colorado
Department of Health, Shell Chemical Company, and Department of the Army
signed a formal agreement in December 198?. This agreement provides the
mechanism to investigate and mitigate contamination problems on and off-site
resulting from arsenal activities.
D. ASSESSMENT AND INVESTIGATION OF POTENTIAL PROBLEM
"SITE?
EPA completed a screening of information on 103(c) notifications.
These sites were divided into low, medium, and high priorities for subsequent
assessment if not previously completed. The Region had completed assessments
at essentially all of the medium and high priorities. Most of the high
priority sites had been nominated for the NPL.
High priority sites are sites located near populated areas, known to
be involved in hazardous waste treatment, storage, or disposal and expected to
impact surface and groundwater. In April 1981, EPA had required past and
present owners and operators of hazardous waste sites, generators and
transporters of RCRA hazardous wastes to notify EPA of their activities if not
done previously by implementation of RCRA. Section 103{c^ of CERCLA was the
statutory basis for this requirement.
- 9 -
image:
255
C. FEDERAL FACILITIES
1. Leadville Tunnel, Colorado: Please see discussion under the
Superfund site, California Gulch.
?. Rocky Mountain Arsenal, Denver, Colorado: EPA, the Colorado
Department of Health, Shell Chemical Company, and Department of the Army
signed a formal agreement in December 198?. This agreement provides the
mechanism to investigate and mitigate contamination problems on and off-site
resulting from arsenal activities.
D. ASSESSMENT AND INVESTIGATION OF POTENTIAL PROBLEM
"SITE?
EPA completed a screening of information on 103(c) notifications.
These sites were divided into low, medium, and high priorities for subsequent
assessment if not previously completed. The Region had completed assessments
at essentially all of the medium and high priorities. Most of the high
priority sites had been nominated for the NPL.
High priority sites are sites located near populated areas, known to
be involved in hazardous waste treatment, storage, or disposal and expected to
impact surface and groundwater. In April 1981, EPA had required past and
present owners and operators of hazardous waste sites, generators and
transporters of RCRA hazardous wastes to notify EPA of their activities if not
done previously by implementation of RCRA. Section 103{c^ of CERCLA was the
statutory basis for this requirement.
- 9 -
image:
 PART 2
256
I. MOST SIGNIFICANT PROBLEMS
A. NPL
Map Key
1
2
3
4
5
6
7
8
Q
10
11
12
13
14
Site
Denver Radium Site
Woodbury Chemical Company Site
Sand Creek Industrial Site
Marshall Landfill
Central City-Idaho
Springs Mining District
California Gulch
Rose Park
Union Pacific/J.H. Baxter site
Libby Rroundwater site
Milltown Groundwater site
Anaconda Smelter site
Silver Bow Creek site
Whitewood Creek
Arsenic Trioxide site
State
Colorado
Colorado
Colorado
Colorado
Colorado
Colorado
Utah
Wyoming
Montana
Mill town
Montana
Montana
South Dakota
North Dakota
Paoe
23
23
23
23
22
22
23
25
26
26
26
26
24
28
8. HIGH PRIORITY SITES NOT ON THE NPL
A. Lowry Landfill
B. Monticello Radiation
C. Rocky Mountain Phosphate
D. Anaconda Smelter (Great Falls)
E, ASARCO Smelter
F. Canon City ^Lincoln Park)
C. FEDERAL FACILITIES
I Rocky Mountain Arsenal
II Pueblo Army Depot
III Odqen Army Depot
IV Tooele Army Depot
V Hill Air Force Base
VI Dugway Proving Grounds
VII Leadville Drainage Tunnel
Colorado
Utah
Montana
Montana
Montana
Colorado
Colorado
Colorado
Utah
Utah
Utah
Utah
Colorado
22
24
26
26
26
22
23
22
24
24
24
24
22
- 10 -
image:
PART 2
256
I. MOST SIGNIFICANT PROBLEMS
A. NPL
Map Key
1
2
3
4
5
6
7
8
Q
10
11
12
13
14
Site
Denver Radium Site
Woodbury Chemical Company Site
Sand Creek Industrial Site
Marshall Landfill
Central City-Idaho
Springs Mining District
California Gulch
Rose Park
Union Pacific/J.H. Baxter site
Libby Rroundwater site
Milltown Groundwater site
Anaconda Smelter site
Silver Bow Creek site
Whitewood Creek
Arsenic Trioxide site
State
Colorado
Colorado
Colorado
Colorado
Colorado
Colorado
Utah
Wyoming
Montana
Mill town
Montana
Montana
South Dakota
North Dakota
Paoe
23
23
23
23
22
22
23
25
26
26
26
26
24
28
8. HIGH PRIORITY SITES NOT ON THE NPL
A. Lowry Landfill
B. Monticello Radiation
C. Rocky Mountain Phosphate
D. Anaconda Smelter (Great Falls)
E, ASARCO Smelter
F. Canon City ^Lincoln Park)
C. FEDERAL FACILITIES
I Rocky Mountain Arsenal
II Pueblo Army Depot
III Odqen Army Depot
IV Tooele Army Depot
V Hill Air Force Base
VI Dugway Proving Grounds
VII Leadville Drainage Tunnel
Colorado
Utah
Montana
Montana
Montana
Colorado
Colorado
Colorado
Utah
Utah
Utah
Utah
Colorado
22
24
26
26
26
22
23
22
24
24
24
24
22
- 10 -
image:
 257
D. ASSESSMENT OF POTENTIAL SITES
The Region has tentatively identified about 140 sites as requiring no
further work (see graphs 3 and 6).
II. IMPLICATIONS FOR AGENCY MANAGEMENT
1. NPL
The State must provide a match, assure proper disposal (if required
by the response action), and operation and maintenance costs (if required by
the response action) before Federal Superfund money can be awarded to the
State. States may not be able to meet these requirements.
The fund will be spent after 7 years. It is possible that some
projects may not be completed before the fund is exhausted.
2. HIGH PRIORITY SITES NOT ON THE NPL
If a site is on the NPL, EPA needs to show only that a release may or
has actually occurred. If a site is not on the list, EPA must locate a "deep
pocket" responsible party to mitigate the problem.
3. FEDERAL FACILITIES
Federal agencies often find it difficult to devote resources to clean
up their problems. The Federal Government, however, must set the example if -
it expects cooperation from private industry.
III. PROBLEM DISTRIBUTION
A. NPL - (See Figures 1 - 8)
B. High Priority Sites Not On The NPL - "
C. Federal Facilities - "
D. Assessment and Investigation of Potential Problem
Siites
(See Graphs 3 and 6.)
- 11 -
image:
257
D. ASSESSMENT OF POTENTIAL SITES
The Region has tentatively identified about 140 sites as requiring no
further work (see graphs 3 and 6).
II. IMPLICATIONS FOR AGENCY MANAGEMENT
1. NPL
The State must provide a match, assure proper disposal (if required
by the response action), and operation and maintenance costs (if required by
the response action) before Federal Superfund money can be awarded to the
State. States may not be able to meet these requirements.
The fund will be spent after 7 years. It is possible that some
projects may not be completed before the fund is exhausted.
2. HIGH PRIORITY SITES NOT ON THE NPL
If a site is on the NPL, EPA needs to show only that a release may or
has actually occurred. If a site is not on the list, EPA must locate a "deep
pocket" responsible party to mitigate the problem.
3. FEDERAL FACILITIES
Federal agencies often find it difficult to devote resources to clean
up their problems. The Federal Government, however, must set the example if -
it expects cooperation from private industry.
III. PROBLEM DISTRIBUTION
A. NPL - (See Figures 1 - 8)
B. High Priority Sites Not On The NPL - "
C. Federal Facilities - "
D. Assessment and Investigation of Potential Problem
Siites
(See Graphs 3 and 6.)
- 11 -
image:
 ATTACHMENT A
PROBLEM DISTRIBUTION BETWEEN STATES
A. NATIONAL PRIORITIES LIST
Each state has at least one site on the proposed NPL. Colorado has 6
sites; 5 of them are within the Denver Metropolitan area. Montana has 4
sites. Each of the remaining 4 states has 1 site (Figures 1-81.
B. HIGH PRIORITY SITES NOT ON THE NPL
Of the 6 sites, Montana contains 3, Colorado has 2 and Utah has 1.
Wyoming, North Dakota and South Dakota do not have sites (Figures 1-8).
C. FEDERAL FACILITIES
Colorado has 3 sites and Utah has 4 sites. Six of the sites are
Department of Defense facilities. The remaining site, Leadville Tunnel in
Colorado, is owned by the Bureau of Reclamation (Figures 2, 3, and 4\
D. ASSESSMENT OF POTENTIAL SITES
Colorado has almost as many sites as the remainder of the Region
combined (see Graphs 3 and 6).
- 12 -
image:
ATTACHMENT A
PROBLEM DISTRIBUTION BETWEEN STATES
A. NATIONAL PRIORITIES LIST
Each state has at least one site on the proposed NPL. Colorado has 6
sites; 5 of them are within the Denver Metropolitan area. Montana has 4
sites. Each of the remaining 4 states has 1 site (Figures 1-81.
B. HIGH PRIORITY SITES NOT ON THE NPL
Of the 6 sites, Montana contains 3, Colorado has 2 and Utah has 1.
Wyoming, North Dakota and South Dakota do not have sites (Figures 1-8).
C. FEDERAL FACILITIES
Colorado has 3 sites and Utah has 4 sites. Six of the sites are
Department of Defense facilities. The remaining site, Leadville Tunnel in
Colorado, is owned by the Bureau of Reclamation (Figures 2, 3, and 4\
D. ASSESSMENT OF POTENTIAL SITES
Colorado has almost as many sites as the remainder of the Region
combined (see Graphs 3 and 6).
- 12 -
image:
 ATTACHMENT B
I. NATIONAL PRIORITIES LIST (NPL)
A. DENVER RADIUM SITE, CO (FIGURE 3):
While reviewing a 1915 U. S. Bureau of Mines report during late 1978,
an EPA investigator discovered reference to a National Radium Institute
located in Denver, Colorado. During 1979, the Colorado Department of Health
undertook a large scale investigation of the issue. With considerable support
from other State and Federal agencies ^including EPA, DOE and USGS], 35
Colorado locations were identified where radium was processed, refined, or
fabricated into various devices or products. Thirty-one of these locations
are in the City and County of Denver and include vacant land, industrial
operations, buildings, and public streets. Results from the EPA gamma
scanning van, DOE aerial radiometric survey, USGS core sampling, and numerous
other investigation activities indicated where additional survey work was
needed.
In June 1981, EPA entered into a cooperative agreement funded with
RCRA money with the Colorado Department of Health whereby EPA funded 95% of
the remedial action planning for the 31 locations. With an amendment to the
cooperative agreement, additional funds were provided for completion of the
work, and a new effort (study of disposal site alternatives) was added.
Engineering assessments and remedial action plans have been accomplished. The
disposal site alternatives report will also be available soon. The site was
listed on the Interim National Priorities List and is on the proposed National
Priorities List. The Denver Radium Site has always been an important
consideration during the Superfund legislation development, and specific
mention of the site is included in the enacted languqge.
The issue has received strong local, state, and Congressional support
for resolution. The initial remedial work was funded under a $105,000 grant,
of which the state contributed $5,000. The work included a one-time $17,000
amount for community relations development. An additional $173,000 was added,
making the total obligated to date $278,00. In August 198?, the State
submitted a cooperative agreement which proposed taking response actions at
five of the locations. EPA has not acted on that submission. The Agency
indicated that the State should request an amendment to the existing
cooperative agreement for conducting a feasibility study. The State is
oreparing that amendment.
B. WOODBURY CHEMICAL COMPANY SITE, CO (FIGURE 31:
The Woodbury Chemical Company, a pesticide formulation facility in
Commerce City, Colorado, was destroyed by fire in 1965. Fire debris and
rubble, including water-soaked bags of pesticides, were disoosed on in an
adjacent vacant lot. Soil samples taken in the lot have high levels of
- 13 -
image:
ATTACHMENT B
I. NATIONAL PRIORITIES LIST (NPL)
A. DENVER RADIUM SITE, CO (FIGURE 3):
While reviewing a 1915 U. S. Bureau of Mines report during late 1978,
an EPA investigator discovered reference to a National Radium Institute
located in Denver, Colorado. During 1979, the Colorado Department of Health
undertook a large scale investigation of the issue. With considerable support
from other State and Federal agencies ^including EPA, DOE and USGS], 35
Colorado locations were identified where radium was processed, refined, or
fabricated into various devices or products. Thirty-one of these locations
are in the City and County of Denver and include vacant land, industrial
operations, buildings, and public streets. Results from the EPA gamma
scanning van, DOE aerial radiometric survey, USGS core sampling, and numerous
other investigation activities indicated where additional survey work was
needed.
In June 1981, EPA entered into a cooperative agreement funded with
RCRA money with the Colorado Department of Health whereby EPA funded 95% of
the remedial action planning for the 31 locations. With an amendment to the
cooperative agreement, additional funds were provided for completion of the
work, and a new effort (study of disposal site alternatives) was added.
Engineering assessments and remedial action plans have been accomplished. The
disposal site alternatives report will also be available soon. The site was
listed on the Interim National Priorities List and is on the proposed National
Priorities List. The Denver Radium Site has always been an important
consideration during the Superfund legislation development, and specific
mention of the site is included in the enacted languqge.
The issue has received strong local, state, and Congressional support
for resolution. The initial remedial work was funded under a $105,000 grant,
of which the state contributed $5,000. The work included a one-time $17,000
amount for community relations development. An additional $173,000 was added,
making the total obligated to date $278,00. In August 198?, the State
submitted a cooperative agreement which proposed taking response actions at
five of the locations. EPA has not acted on that submission. The Agency
indicated that the State should request an amendment to the existing
cooperative agreement for conducting a feasibility study. The State is
oreparing that amendment.
B. WOODBURY CHEMICAL COMPANY SITE, CO (FIGURE 31:
The Woodbury Chemical Company, a pesticide formulation facility in
Commerce City, Colorado, was destroyed by fire in 1965. Fire debris and
rubble, including water-soaked bags of pesticides, were disoosed on in an
adjacent vacant lot. Soil samples taken in the lot have high levels of
- 13 -
image:
 260
aldrin, endrin, heptachlor, and toxaphene. Site security is non-existent.
The waste is uncovered. The potential exists for contamination of groundwater
and surface water.
The State submitted a cooperative agreement to conduct a remedial
investigation and feasibility study, and complete two initial remedial
measures. The site would be fenced to restrict access and a temporary clay
cap would be placed over the contaminated soil to prevent further spread of
the contamination by surface water runoff. EPA obligated Superfund money so
that the State can complete all of these tasks.
C. CENTRAL CITY-IDAHO SPRINGS MINING SITE, CO (FIGURE 2):
Acid drainage from a number of abandoned gold mines is contaminating
Clear Creek with heavy metals. The Argo Tunnel in Idaho Springs and seven
mine adits in the Central City area have been identified as sources. Both
surface water and groundwater drinking supplies are affected by this site.
The substances of concern include dissolved copper and cadmium.
The State submitted a cooperative agreement to conduct a remedial
investigation and feasibility study. EPA obligated Superfund money so that
the State can complete both of these efforts.
0. CALIFORNIA GULCH, CO (FIGURE ?):
California Gulch, located in the Leadville Mining District, has been
seriously impacted by lead, silver, zinc, copper, and aold mining activities."
Numerous abandoned mines and mine tailings piles are located in the gulch.
The most serious water Quality problem in California Gulch is acid mine
drainage from the Yak Tunnel, a 3.4-mile tunnel that was constructed from 1895
to 1909 for the purpose of exploration, transoortation of ore, and mine
drainage. There are known connections from 17 mines to the tunnel. There is
a.continuous discharge of approximately 1-3 cfs from the tunnel to the
California Gulch. This flow has a low pH (3.19-5.40) and high concentrations
of dissolved metals including iron, lead, zinc, manganese, and cadmium.
California Gulch is tributary to the Arkansas River. There is concern about
the potential for contamination of domestic groundwater supplies in the
California Gulch area, the adverse impact of fish in the Arkansas River, and
ootential adverse impacts on livestock and crops that are grown on
agricultural land which is irrigated using water from the Arkansas River.
E. SAND CREEK INDUSTRIAL SITE, CO (FIGURE 3):
The Sand Creek Industrial Site occupies more than 300 acres in
Commerce City, Colorado. Most of the site is industrially zoned and has
supported a high volume of chemical and petroleum production. The site
includes the former Oriental Refinery, the 48th and Holly Street landfill, the
Colorado Organic Chemical Corporation, acid waste disposal pits used by
- 14 -
image:
260
aldrin, endrin, heptachlor, and toxaphene. Site security is non-existent.
The waste is uncovered. The potential exists for contamination of groundwater
and surface water.
The State submitted a cooperative agreement to conduct a remedial
investigation and feasibility study, and complete two initial remedial
measures. The site would be fenced to restrict access and a temporary clay
cap would be placed over the contaminated soil to prevent further spread of
the contamination by surface water runoff. EPA obligated Superfund money so
that the State can complete all of these tasks.
C. CENTRAL CITY-IDAHO SPRINGS MINING SITE, CO (FIGURE 2):
Acid drainage from a number of abandoned gold mines is contaminating
Clear Creek with heavy metals. The Argo Tunnel in Idaho Springs and seven
mine adits in the Central City area have been identified as sources. Both
surface water and groundwater drinking supplies are affected by this site.
The substances of concern include dissolved copper and cadmium.
The State submitted a cooperative agreement to conduct a remedial
investigation and feasibility study. EPA obligated Superfund money so that
the State can complete both of these efforts.
0. CALIFORNIA GULCH, CO (FIGURE ?):
California Gulch, located in the Leadville Mining District, has been
seriously impacted by lead, silver, zinc, copper, and aold mining activities."
Numerous abandoned mines and mine tailings piles are located in the gulch.
The most serious water Quality problem in California Gulch is acid mine
drainage from the Yak Tunnel, a 3.4-mile tunnel that was constructed from 1895
to 1909 for the purpose of exploration, transoortation of ore, and mine
drainage. There are known connections from 17 mines to the tunnel. There is
a.continuous discharge of approximately 1-3 cfs from the tunnel to the
California Gulch. This flow has a low pH (3.19-5.40) and high concentrations
of dissolved metals including iron, lead, zinc, manganese, and cadmium.
California Gulch is tributary to the Arkansas River. There is concern about
the potential for contamination of domestic groundwater supplies in the
California Gulch area, the adverse impact of fish in the Arkansas River, and
ootential adverse impacts on livestock and crops that are grown on
agricultural land which is irrigated using water from the Arkansas River.
E. SAND CREEK INDUSTRIAL SITE, CO (FIGURE 3):
The Sand Creek Industrial Site occupies more than 300 acres in
Commerce City, Colorado. Most of the site is industrially zoned and has
supported a high volume of chemical and petroleum production. The site
includes the former Oriental Refinery, the 48th and Holly Street landfill, the
Colorado Organic Chemical Corporation, acid waste disposal pits used by
- 14 -
image:
 261
the L. C. Corporation, and several small residences and businesses. The area
has been the subject of health and environmental concerns for the past seven
years. Investigations by the Tri-County District Health Deoartment and the
Colorado Department of Health have linked groundwater, surface water, and soil
contamination at the Sand Creek Industrial site with four major facilities
listed above.
The orincipal contaminants which may be present at the site include
petroleum derivatives, methane, sulfuric acid, and pesticides. In June 1982,
the U. S. Environmental Protection Agency initiated a study to characterize
the contamination. Surface water, groundwater, and soil samples were taken.
F. MARSHALL LANDFILL, CO (FIGURE 3):
Marshall Landfill occupies 160 acres in Boulder County approximately
three miles southeast of the City of Boulder. The site has been a landfill
since 1965. The northern 80-acre portion was operated by a succession of four
operators from 1965 to 1974. The landfill accepted municipal waste,
unstabilized sewage sludge, and many unknown potentially hazardous wastes. In
1974 the northern oortion was closed, and the 80-acre portion to the south
opened. Since 1975, Landfill, Inc., a subsidiary of Browning-Ferris
Industries, has operated the active site. The landfill presently accepts only
municipal waste and occasionally sewage sludge from the Boulder wastewater
treatment plant.
A concern at Marshall Landfill is the potential for contamination of
the alluvial and Fox Hills aquifers. Contamination has been detected in the
alluvial groundwater on-site. Samples from wells, seeps, and a drain at the"
landfill have all shown elevated levels of priority pollutants, mainly the
volatile organics. Contamination of the Fox Hills aquifer beneath the site
has not been confirmed.
Surface water on-site in lagoons and Community Ditch, an unlined
irrrigation ditch, is contaminated. The type of contamination is similar to
that for the groundwater. In 1980, EPA and the State concluded that there was
no imminent and substantial endangerment to surface water users several miles
downstream from the landfill because contaminants could not be detected at
these locations.
The extent of the off-site groundwater contamination is not known.
The alluvial and Fox Hills aquifers serve commercial, industrial, agricultural
and domestic needs. Municipal water is not available for the homes near
Marshall Landfill.
G. SILVER BOW CREEK, MT (FIGURE 6);
Silver Bow Creek, from the confluence of Copper Creek in Butte,
Silver Bow County, Montana, to the Warm Springs Ponds, northeast of Anaconda,
Deer Lodge County, has received industrial, agricultural, municipal, and
- 15 -
image:
261
the L. C. Corporation, and several small residences and businesses. The area
has been the subject of health and environmental concerns for the past seven
years. Investigations by the Tri-County District Health Deoartment and the
Colorado Department of Health have linked groundwater, surface water, and soil
contamination at the Sand Creek Industrial site with four major facilities
listed above.
The orincipal contaminants which may be present at the site include
petroleum derivatives, methane, sulfuric acid, and pesticides. In June 1982,
the U. S. Environmental Protection Agency initiated a study to characterize
the contamination. Surface water, groundwater, and soil samples were taken.
F. MARSHALL LANDFILL, CO (FIGURE 3):
Marshall Landfill occupies 160 acres in Boulder County approximately
three miles southeast of the City of Boulder. The site has been a landfill
since 1965. The northern 80-acre portion was operated by a succession of four
operators from 1965 to 1974. The landfill accepted municipal waste,
unstabilized sewage sludge, and many unknown potentially hazardous wastes. In
1974 the northern oortion was closed, and the 80-acre portion to the south
opened. Since 1975, Landfill, Inc., a subsidiary of Browning-Ferris
Industries, has operated the active site. The landfill presently accepts only
municipal waste and occasionally sewage sludge from the Boulder wastewater
treatment plant.
A concern at Marshall Landfill is the potential for contamination of
the alluvial and Fox Hills aquifers. Contamination has been detected in the
alluvial groundwater on-site. Samples from wells, seeps, and a drain at the"
landfill have all shown elevated levels of priority pollutants, mainly the
volatile organics. Contamination of the Fox Hills aquifer beneath the site
has not been confirmed.
Surface water on-site in lagoons and Community Ditch, an unlined
irrrigation ditch, is contaminated. The type of contamination is similar to
that for the groundwater. In 1980, EPA and the State concluded that there was
no imminent and substantial endangerment to surface water users several miles
downstream from the landfill because contaminants could not be detected at
these locations.
The extent of the off-site groundwater contamination is not known.
The alluvial and Fox Hills aquifers serve commercial, industrial, agricultural
and domestic needs. Municipal water is not available for the homes near
Marshall Landfill.
G. SILVER BOW CREEK, MT (FIGURE 6);
Silver Bow Creek, from the confluence of Copper Creek in Butte,
Silver Bow County, Montana, to the Warm Springs Ponds, northeast of Anaconda,
Deer Lodge County, has received industrial, agricultural, municipal, and
- 15 -
image:
 262
private waste for over 100 years. Numberous studies by local, State, and
Federal agencies have sought solutions for the multiple sources of pollution.
Some progress has been achieved in the treatment of industrial and municipal
wastes to reduce impacts to the creek, and more importantly, the impacts of
the creek itself on the uoper Clark Fork River into which it drains. However,
recent investigations indicate that contaminants such as heavy metals and
phosphates continue to pose a threat to public health, and the aquatic
environment of the creek itself.
The Department of State Lands is trying to remove some of the
abandoned mine tailings from the banks of the Silver Bow Creek. Although this
may help rehabilitate some of the creek, further work is needed to define
contaminant sources and amounts.
H. MILLTOViN, MT (FIGURE 6):
In May 1981, environmental health officials of Missoula County took
routine samples from seven drinking water wells in Milltown, Montana. Four
showed levels of arsenic, according to the analyses of the State Department of
Health and Environmental Sciences (DHES)S that exceeded the Interim Primary
Drinking Water Standard. Subsequent analyses by DHES confirmed that the four
wells, serving a total of 35 residences, were contaminated with up to 10 times
the standard of 0.05 milligrams arsenic per liter fmg/1). Residents were
advised to seek alternate supplies of potable water. Other uncontaminated
wells in the area are apparently not capable of suppling the Milltown
consumers.
Possible sources of contamination are leachate from an abondoned
landfill located east of town (contents unkown) or solution of metals from
mill tailings (sediments) deposited behind Milltown Dam located south and
immediately adjacent to the town on the Clark Fork River. Analyses of these
sediments show total recoverable arsenic levels of up to 148 mg/1. No samples
of the landfill have yet been taken.
Milltown is located on an alluvial isthmus between the Clark Fork
River and the Blackfoot River. Groundwater hydrology is principally
influenced by these two surface streams, and the principal subsurface strata
are cobble and boulders.
I. IIB8Y GROUNDWATER, MT (FIGURE 6);
The Libby Groundwater site is located in Libby, Montana. In April
1979, in response to a homeowner's complaint of an irritating "creosote" odor
in water from a new well, the State Water Ouality Bureau found elevated levels
of pentachlorophenol. The problem was later referred for preliminary
investigation throuah the Uncontrolled Sites Program under Section 7003 of the
Resource Conservation and Recovery Act (RCRA) of 1976. In September 1980,
representatives of the U. S. Environmental Protection Agency (EPA), Lincoln
County, and St. Reqis Paper Company discussed possible sources of
contamination, including past disposal practices for creosote and other
- 16 -
image:
262
private waste for over 100 years. Numberous studies by local, State, and
Federal agencies have sought solutions for the multiple sources of pollution.
Some progress has been achieved in the treatment of industrial and municipal
wastes to reduce impacts to the creek, and more importantly, the impacts of
the creek itself on the uoper Clark Fork River into which it drains. However,
recent investigations indicate that contaminants such as heavy metals and
phosphates continue to pose a threat to public health, and the aquatic
environment of the creek itself.
The Department of State Lands is trying to remove some of the
abandoned mine tailings from the banks of the Silver Bow Creek. Although this
may help rehabilitate some of the creek, further work is needed to define
contaminant sources and amounts.
H. MILLTOViN, MT (FIGURE 6):
In May 1981, environmental health officials of Missoula County took
routine samples from seven drinking water wells in Milltown, Montana. Four
showed levels of arsenic, according to the analyses of the State Department of
Health and Environmental Sciences (DHES)S that exceeded the Interim Primary
Drinking Water Standard. Subsequent analyses by DHES confirmed that the four
wells, serving a total of 35 residences, were contaminated with up to 10 times
the standard of 0.05 milligrams arsenic per liter fmg/1). Residents were
advised to seek alternate supplies of potable water. Other uncontaminated
wells in the area are apparently not capable of suppling the Milltown
consumers.
Possible sources of contamination are leachate from an abondoned
landfill located east of town (contents unkown) or solution of metals from
mill tailings (sediments) deposited behind Milltown Dam located south and
immediately adjacent to the town on the Clark Fork River. Analyses of these
sediments show total recoverable arsenic levels of up to 148 mg/1. No samples
of the landfill have yet been taken.
Milltown is located on an alluvial isthmus between the Clark Fork
River and the Blackfoot River. Groundwater hydrology is principally
influenced by these two surface streams, and the principal subsurface strata
are cobble and boulders.
I. IIB8Y GROUNDWATER, MT (FIGURE 6);
The Libby Groundwater site is located in Libby, Montana. In April
1979, in response to a homeowner's complaint of an irritating "creosote" odor
in water from a new well, the State Water Ouality Bureau found elevated levels
of pentachlorophenol. The problem was later referred for preliminary
investigation throuah the Uncontrolled Sites Program under Section 7003 of the
Resource Conservation and Recovery Act (RCRA) of 1976. In September 1980,
representatives of the U. S. Environmental Protection Agency (EPA), Lincoln
County, and St. Reqis Paper Company discussed possible sources of
contamination, including past disposal practices for creosote and other
- 16 -
image:
 preservatives formerly used to treat wood. 263
In June 1981, EPA and County officials tested 11 wells in the Libby
area with portable field instruments. Based on those readings, grab samples
from eight wells were analyzed by a State lab for pentachlorophenol fPCP) and
polynuclear aromatic hydrocarbon fPAH) components of creosote. Three wells
showed detectable levels of these contaminants, and two approached or exceeded
proposed ambient water quality criteria for PCP. All of the wells tested are
primarily used for irrigation.
J. ANACONDA S?€LTER, MT (FIGURE 6):
The Anaconda Company copper smelter at Anaconda, Montana, operated
from the late 1800's until it closed September 29 1980. For the most part,
the wastes left on-site at closure remain. The State of Montana and the U. S.
Environmental Protection Agency (EPA) are concerned over possible release of
hazardous substances from the wastes into the environment. The Anaconda
Company voluntarily entered into an agreement with EPA and the State for a
study to identify and quantify any such substances. The sampling has been
completed, the analyses are underway.
K. ARSENIC. TRIOXIDE SITE, ND (FIGURE 8):
The Lidgerwood-Wyndmere-Rutland area of southeastern North Dakota
generally has been found to have higher than average levels of arsenic in the
shallow qroundwater aauifers. Arsenic in most drinking water in North Dakota
is below detectable limits; however, arsenic levels exceeding maximum
contaminant levels set by Federal drinking water standards have been
identified in the lidgerwood city water supply. Rutland and Wyndmere water
supolies contain the maximum acceptable limit of arsenic. Numerous private
wells on farms in the general area also exceed the maximum contaminant
levels. The specific source of arsenic has not been identified.
Heavy grasshopper infestations in the 1930's resulted in large and
repeated applications of arsenic-based poisons such as arsenic trioxide in
affected areas across the Midwest. Dated or excess poison was not ordinarily
disposed of in what today is considered a responsible manner. Poisons were
often buried near shallow groundwater aquifers, left unmarked in outbuildings,
hauled to open dumps such as abandoned gravel pits, or thrown in low,
agriculturally unproductive lands. Southeastern North Dakota was particularly
hard-hit by grasshoppers in the 1930's and use of the arsenic trioxide was
widespread.
L. WHITEWOOD CREEK, SD fFIGURE 7);
Over 100 years' worth of gold mining and mill tailings were
discharged into Wbitewoort Creek in the Black Hills area of South Dakota. The
U. S. Environmental Protection Agency (EPA) and South Dakota are concerned
about potential health and environmental impacts from contaminated soil,
groundwater, and surface water. Under a voluntary agreement, EPA, the State
- 17 -
image:
preservatives formerly used to treat wood. 263
In June 1981, EPA and County officials tested 11 wells in the Libby
area with portable field instruments. Based on those readings, grab samples
from eight wells were analyzed by a State lab for pentachlorophenol fPCP) and
polynuclear aromatic hydrocarbon fPAH) components of creosote. Three wells
showed detectable levels of these contaminants, and two approached or exceeded
proposed ambient water quality criteria for PCP. All of the wells tested are
primarily used for irrigation.
J. ANACONDA S?€LTER, MT (FIGURE 6):
The Anaconda Company copper smelter at Anaconda, Montana, operated
from the late 1800's until it closed September 29 1980. For the most part,
the wastes left on-site at closure remain. The State of Montana and the U. S.
Environmental Protection Agency (EPA) are concerned over possible release of
hazardous substances from the wastes into the environment. The Anaconda
Company voluntarily entered into an agreement with EPA and the State for a
study to identify and quantify any such substances. The sampling has been
completed, the analyses are underway.
K. ARSENIC. TRIOXIDE SITE, ND (FIGURE 8):
The Lidgerwood-Wyndmere-Rutland area of southeastern North Dakota
generally has been found to have higher than average levels of arsenic in the
shallow qroundwater aauifers. Arsenic in most drinking water in North Dakota
is below detectable limits; however, arsenic levels exceeding maximum
contaminant levels set by Federal drinking water standards have been
identified in the lidgerwood city water supply. Rutland and Wyndmere water
supolies contain the maximum acceptable limit of arsenic. Numerous private
wells on farms in the general area also exceed the maximum contaminant
levels. The specific source of arsenic has not been identified.
Heavy grasshopper infestations in the 1930's resulted in large and
repeated applications of arsenic-based poisons such as arsenic trioxide in
affected areas across the Midwest. Dated or excess poison was not ordinarily
disposed of in what today is considered a responsible manner. Poisons were
often buried near shallow groundwater aquifers, left unmarked in outbuildings,
hauled to open dumps such as abandoned gravel pits, or thrown in low,
agriculturally unproductive lands. Southeastern North Dakota was particularly
hard-hit by grasshoppers in the 1930's and use of the arsenic trioxide was
widespread.
L. WHITEWOOD CREEK, SD fFIGURE 7);
Over 100 years' worth of gold mining and mill tailings were
discharged into Wbitewoort Creek in the Black Hills area of South Dakota. The
U. S. Environmental Protection Agency (EPA) and South Dakota are concerned
about potential health and environmental impacts from contaminated soil,
groundwater, and surface water. Under a voluntary agreement, EPA, the State
- 17 -
image:
 264
of South Dakota, and Homestake Mining Company are proceeding with a remedial
investigation along the segment of the creek designated as the site. The
investigation will seek to identify the location and state of tailings
materials, the existence and forms of substances, and the potential for human
health or environmental problems.
M. ROSE PARK, UT (FIGURE 3);
The Rose Park site, located in a city park on Boy Scout Drive in Salt
Lake City (population 150}000), Utah, was used for the disposal of petroleum
wastes from the 1920's until 1957. Sludges were placed into unlined pits and
sometimes covered with lime and soil. The sludge exposed at this site is a
hazard to park users by direct physical contact.
Agreement was negotiated whereby AMOCO Oil Company will construct a
slurry wall and clay cap around the sludge. Construction is scheduled for
completion in July of 1983. The site has been fenced to prevent access and
construction is under way.
N. UNION PACIFIC/BAXTER, WY fFIGURE 51:
The Union Pacific/Baxter Tie Treating facility, located just
southwest of Laramie fpopulation 26,000)1, Wyoming, has been operating since
the 1880's. The site includes unlined surface impoundments that contain one
million cubic feet of waste. Pollutants, including pentachlorophenol,
benzene, naphthalene, toluene, and phenol, have migrated from the ponds,
contaminating shallow groundwaters and the Laramie River.
II. HIGH PRIORITY SITES NOT ON THE NPL
A. LOWRY LANDFILL, CO (FIGURE 2):
Lowry Landfill, located in Araphahoe County, is approximately 15
miles southeast of Denver. It was formerly a part of the U. S. Air Force
Lowry Bombing Range which was deeded in July 1964 by the U. S. Department of
Health and Human Services, to the City and County of Denver to be used for
"public health purposes". Until July 30, 1980, Lowry Landfill, under the
management of the City and County of Denver, received all types of domestic
industrial wastes, including up to 10 million gallons of liquid chemical
waster per year in Section 6. A technique know as co-disoosal was employed.
This consisted of excavating trenches, filling the unlined trenches with
general refuse, compacting the refuse, dumping in liquid wastes and covering
the trenches.
ASARCO SMELTER, MT (FIGURE 61:
Measurements of soils in the East Helena area (population 3-5,000
people) around the ASARCO Smelter show high lead in excess of 1,000 ppm.
- 18 -
image:
264
of South Dakota, and Homestake Mining Company are proceeding with a remedial
investigation along the segment of the creek designated as the site. The
investigation will seek to identify the location and state of tailings
materials, the existence and forms of substances, and the potential for human
health or environmental problems.
M. ROSE PARK, UT (FIGURE 3);
The Rose Park site, located in a city park on Boy Scout Drive in Salt
Lake City (population 150}000), Utah, was used for the disposal of petroleum
wastes from the 1920's until 1957. Sludges were placed into unlined pits and
sometimes covered with lime and soil. The sludge exposed at this site is a
hazard to park users by direct physical contact.
Agreement was negotiated whereby AMOCO Oil Company will construct a
slurry wall and clay cap around the sludge. Construction is scheduled for
completion in July of 1983. The site has been fenced to prevent access and
construction is under way.
N. UNION PACIFIC/BAXTER, WY fFIGURE 51:
The Union Pacific/Baxter Tie Treating facility, located just
southwest of Laramie fpopulation 26,000)1, Wyoming, has been operating since
the 1880's. The site includes unlined surface impoundments that contain one
million cubic feet of waste. Pollutants, including pentachlorophenol,
benzene, naphthalene, toluene, and phenol, have migrated from the ponds,
contaminating shallow groundwaters and the Laramie River.
II. HIGH PRIORITY SITES NOT ON THE NPL
A. LOWRY LANDFILL, CO (FIGURE 2):
Lowry Landfill, located in Araphahoe County, is approximately 15
miles southeast of Denver. It was formerly a part of the U. S. Air Force
Lowry Bombing Range which was deeded in July 1964 by the U. S. Department of
Health and Human Services, to the City and County of Denver to be used for
"public health purposes". Until July 30, 1980, Lowry Landfill, under the
management of the City and County of Denver, received all types of domestic
industrial wastes, including up to 10 million gallons of liquid chemical
waster per year in Section 6. A technique know as co-disoosal was employed.
This consisted of excavating trenches, filling the unlined trenches with
general refuse, compacting the refuse, dumping in liquid wastes and covering
the trenches.
ASARCO SMELTER, MT (FIGURE 61:
Measurements of soils in the East Helena area (population 3-5,000
people) around the ASARCO Smelter show high lead in excess of 1,000 ppm.
- 18 -
image:
 265
Analyses performed in 1975 indicated that children in East Helena also had
elevated lead levels. In the Spring of 1983, the Centers for Disease Control,
Atlanta, Georgia, is expected to conduct a survey of lead levels in
1-5-year-old children in the area of the lead smelter. EPA Region 8 is
negotiating with ASARCO to determine the impact of their smelter on area soil,
and surface and groundwater.
III. FEDERAL FACILITIES
A. ROCKY MOUNTAIN ARSENAL, CO (FIGURE 3):
Manufacturing activities at the Rocky Mountain Arsenal (RMA) near
Denver, Colorado, have resulted in contamination of groundwater. This was
first noted in 1954, when farmers north of the arsenal complained of crop
damage following irrigation with qroundwater pumped from the shallow aquifer.
Some stock and irrigation wells were abandoned because of high salinity, and
compensation was paid to a few landowners for crop damage. Evidence suggests
that the high salinity resulted from water migration from an unlined pond at
the arsenal used in Army manufacturing activities.
In 1974, organic compounds were detected in groundwater crossing the
northern arsenal boundary. The subsequent detection of di-isopropyl methyl
phosphonate fDIMP) and dicyclopentadiene (DCPD), a precursor used in pesticide
manufacturing, in wells north of the arsenal prompted the Colorado Department
of Health to issue a Cease and Desist Order in April 1975, to the Army and
Shell Chemical Company which leases buildings on the arsenal. The order
required an immediate stop to off-post surface and subsurface discharge of
DIMP and DCPD, preparation of a plan to prevent future discharge of these
pollutants and implementation of a water quality monitoring program to
demonstrate compliance with the first two requirements. DIMP resulted from
the Army manufacturing activities and DCPC from Shell manufacturing activities.
In May 1980, contamination of groundwater off-post northwest of the
arsenal was detected. Dibromochloropropane fDBCP), a pesticide manufactured
by Shell, first detected north of the arsenal in 1978, was detected in potable
water sources. The chemical has been reported to cause male sterility and is
a potential carcinogen, but a drinking water standard has not yet been
established for this chemical. In May 1982, D8CP was detected at extreme!v
low levels in a community drinking water well in Irondale. Though these
levels do not present a health risk, CDH initiated a monitoring program and
developed a plan to be implemented if a health hazard develops.
The Army has undertaken a containment remedy at the northern arsenal
boundary. A treatment system was constructed to intercept and remove organic
pollutants from groundwater egressing from the arsenal. After demonstrating
the feasibility of this system, the Army constructed an extension to intercept
other contaminated groundwater moving across the northern arsenal boundary.
It started operation in September 1981. Shell has begun constructing a
- 19 -
image:
265
Analyses performed in 1975 indicated that children in East Helena also had
elevated lead levels. In the Spring of 1983, the Centers for Disease Control,
Atlanta, Georgia, is expected to conduct a survey of lead levels in
1-5-year-old children in the area of the lead smelter. EPA Region 8 is
negotiating with ASARCO to determine the impact of their smelter on area soil,
and surface and groundwater.
III. FEDERAL FACILITIES
A. ROCKY MOUNTAIN ARSENAL, CO (FIGURE 3):
Manufacturing activities at the Rocky Mountain Arsenal (RMA) near
Denver, Colorado, have resulted in contamination of groundwater. This was
first noted in 1954, when farmers north of the arsenal complained of crop
damage following irrigation with qroundwater pumped from the shallow aquifer.
Some stock and irrigation wells were abandoned because of high salinity, and
compensation was paid to a few landowners for crop damage. Evidence suggests
that the high salinity resulted from water migration from an unlined pond at
the arsenal used in Army manufacturing activities.
In 1974, organic compounds were detected in groundwater crossing the
northern arsenal boundary. The subsequent detection of di-isopropyl methyl
phosphonate fDIMP) and dicyclopentadiene (DCPD), a precursor used in pesticide
manufacturing, in wells north of the arsenal prompted the Colorado Department
of Health to issue a Cease and Desist Order in April 1975, to the Army and
Shell Chemical Company which leases buildings on the arsenal. The order
required an immediate stop to off-post surface and subsurface discharge of
DIMP and DCPD, preparation of a plan to prevent future discharge of these
pollutants and implementation of a water quality monitoring program to
demonstrate compliance with the first two requirements. DIMP resulted from
the Army manufacturing activities and DCPC from Shell manufacturing activities.
In May 1980, contamination of groundwater off-post northwest of the
arsenal was detected. Dibromochloropropane fDBCP), a pesticide manufactured
by Shell, first detected north of the arsenal in 1978, was detected in potable
water sources. The chemical has been reported to cause male sterility and is
a potential carcinogen, but a drinking water standard has not yet been
established for this chemical. In May 1982, D8CP was detected at extreme!v
low levels in a community drinking water well in Irondale. Though these
levels do not present a health risk, CDH initiated a monitoring program and
developed a plan to be implemented if a health hazard develops.
The Army has undertaken a containment remedy at the northern arsenal
boundary. A treatment system was constructed to intercept and remove organic
pollutants from groundwater egressing from the arsenal. After demonstrating
the feasibility of this system, the Army constructed an extension to intercept
other contaminated groundwater moving across the northern arsenal boundary.
It started operation in September 1981. Shell has begun constructing a
- 19 -
image:
 266
treatment system to interceot and treat DBCP-contaminated water migrating
off-post to the northwest Hrondale area). It began operation in December
1981.
On December 6, 1982, the Army, the Colorado Department of Health,
EPA, and Shell signed a Memorandum of Agreement (MOAl. It provides the
procedures for the four parties to interact as the arsenal contamination
problem is mitigated.
B. LEADVILLE TUNNEL, CO fFISURE 2):
The Leadville Drainage Tunnel discharges acid mine water into the
Arkansas River a few miles upstream from California Gulch, a site listed on
the NPL. The Leadville Tunnel is owned by the Bureau of Reclamation,
therefore, it was not listed on the NPL. The proximity of the Leadville
Tunnel and California Gulch, however, will require the Region to address them
jointly in developing a remedy to the gold mine drainage problems at
Leadville, Colorado. The tunnel, as with California Gulch, discharges a
variety of metals into the Arkansas River (e.g., cadmium, zinc). The tunnel's
discharge contains lower levels of these metals than the California Gulch
discharge.
image:
266
treatment system to interceot and treat DBCP-contaminated water migrating
off-post to the northwest Hrondale area). It began operation in December
1981.
On December 6, 1982, the Army, the Colorado Department of Health,
EPA, and Shell signed a Memorandum of Agreement (MOAl. It provides the
procedures for the four parties to interact as the arsenal contamination
problem is mitigated.
B. LEADVILLE TUNNEL, CO fFISURE 2):
The Leadville Drainage Tunnel discharges acid mine water into the
Arkansas River a few miles upstream from California Gulch, a site listed on
the NPL. The Leadville Tunnel is owned by the Bureau of Reclamation,
therefore, it was not listed on the NPL. The proximity of the Leadville
Tunnel and California Gulch, however, will require the Region to address them
jointly in developing a remedy to the gold mine drainage problems at
Leadville, Colorado. The tunnel, as with California Gulch, discharges a
variety of metals into the Arkansas River (e.g., cadmium, zinc). The tunnel's
discharge contains lower levels of these metals than the California Gulch
discharge.
image:
 image:
 FIGURE 2
268
OL.ORADO
- 22 -
image:
FIGURE 2
268
OL.ORADO
- 22 -
image:
 FIGURE 3
269
- 23 -
image:
FIGURE 3
269
- 23 -
image:
 FIGURE 4
\ f
-^ Pl-l
2 t
/ 'j: SAUiiii ^---, • | i«
OfTU «&• U **3x* V "««vTi ^p ^•'B"X^^^O"^"/ISfl
^ f CLEAR FliXD ir-gfW -
A ^---^sM^lE
r^%^u.^^^^^fe
4*tf ^^
fVANSTONX
270
©
!^T&>'
fewra«(£7)
UAMfMG GC'*GT
NAM «C A*!*
• "«ww((5
SS'l V_
c * i * :
* «•- CFSf «T T ncvfNG LT
t' * r»
•j» !, rsS^ *."- G*CUNDS *i
•' r"^*$F-:
Lc-is f j
HUl -"MK
-- •£«.<*
CM»N^.
.PRON
»«.j:f
•ac« »m\
C1-'^
;, OKlll V'l
33-'«l( tillU^A. t
ffi^w Ah
Yc«,fi9 U*. UWTji
SPR^NGVIUUt-*
^apleton juno***.
.MISH FORK •
KMfS/
Hi AH * (Xtur INO H5 ^""" 0
-©:-
i»»to ':,-, R«>
X
A
I Wa ^u«Jrt >«»fd I
X
In* C/'tV
^antaquinj
Gosnen
..'• •. Im i?:^r'
, Aii ,
.S«i*« Saaa
»-£?*^-
Strfrt1 «x«Slu>'.
"»';.* «!>•
-r
Helps'
.(T!l
'-bciniiu
• : »•*» ,
KllSt
/©
Cii C«<
cM
X.
Sunnysids
fast Cati»i>
>-|u(NfA« j
Ko OUIA
-u«
WTHJI &f NAT
Huntmgbni
C1.1WJ
">, ^1
<f^ai* r^
Mtln
N<'
'•Ok
^,
SJrtod.",
X
,s>"4
\ i! ! ,j -' '/-^ TJ 4^'i=^-^."T•
> s - ; ; Jj '«M».«'-'flTiHii«t /'
1 / i K*f Snwwuic i» «oto« /
/•' /v* Qb lunii^LW^/ «-i
:. -,- ^v 7 jr^sr**?
•> Saliiu
'.JGRECM BIVSR
C<HC««I JtlV
^
jta«* WOW.—.
TQMWCM «U"f 4
•"i'i.
,. OfSfiT I J
J.M-JC-': »
-V
»« *H S^lp <
»»««•«
a<S..«. f")
u-.8 r^.
*•>
^^H?-/^f^---
" '" ' A J » *WV^'
^T^^^L-
Ii»«» * W t-" ., ,
****** ittuv* At \
•*V»»'Jl" ' " —'
m+af
^illMJft *Q^riClMfl«r*
CbMtiwrnl.'*
VU •
CANri>ft>*NO$ t
N*riQN4t '**|( {
©i©j?
"^
Li«" Of'IOt K!f 'Cl'Mil'l
NAM M*X
!win,-r
BJ.
Tvuan
• •— Min"«»ilU <
wjt 'ftW:*-!
Ci'dnillf
;-< J ,
/
v ajpn »
\_// /««>«.
Tf aws;
*J- J ^-" "XT' unu e**1
' t** ^ ; ^f>jra*3n*u'"" v^"r«ici>
KOV'-1' ,^,,. i^^Ld •/.
^
V
laW 0^--' i
i~+tt"^
t' \ i. , j.»_/' >»• ^<u.«t.\ •..,«=•-
i-A I &?fF, -»~<- ; > >X^,£A
NT li-^^"i"-^r>S:
"*i..V.^.>, 'i~
~ '•'?•'•, *«>..
^?fe^ ^
• f- *f_; '.\i
\^'
© -
image:
FIGURE 4
\ f
-^ Pl-l
2 t
/ 'j: SAUiiii ^---, • | i«
OfTU «&• U **3x* V "««vTi ^p ^•'B"X^^^O"^"/ISfl
^ f CLEAR FliXD ir-gfW -
A ^---^sM^lE
r^%^u.^^^^^fe
4*tf ^^
fVANSTONX
270
©
!^T&>'
fewra«(£7)
UAMfMG GC'*GT
NAM «C A*!*
• "«ww((5
SS'l V_
c * i * :
* «•- CFSf «T T ncvfNG LT
t' * r»
•j» !, rsS^ *."- G*CUNDS *i
•' r"^*$F-:
Lc-is f j
HUl -"MK
-- •£«.<*
CM»N^.
.PRON
»«.j:f
•ac« »m\
C1-'^
;, OKlll V'l
33-'«l( tillU^A. t
ffi^w Ah
Yc«,fi9 U*. UWTji
SPR^NGVIUUt-*
^apleton juno***.
.MISH FORK •
KMfS/
Hi AH * (Xtur INO H5 ^""" 0
-©:-
i»»to ':,-, R«>
X
A
I Wa ^u«Jrt >«»fd I
X
In* C/'tV
^antaquinj
Gosnen
..'• •. Im i?:^r'
, Aii ,
.S«i*« Saaa
»-£?*^-
Strfrt1 «x«Slu>'.
"»';.* «!>•
-r
Helps'
.(T!l
'-bciniiu
• : »•*» ,
KllSt
/©
Cii C«<
cM
X.
Sunnysids
fast Cati»i>
>-|u(NfA« j
Ko OUIA
-u«
WTHJI &f NAT
Huntmgbni
C1.1WJ
">, ^1
<f^ai* r^
Mtln
N<'
'•Ok
^,
SJrtod.",
X
,s>"4
\ i! ! ,j -' '/-^ TJ 4^'i=^-^."T•
> s - ; ; Jj '«M».«'-'flTiHii«t /'
1 / i K*f Snwwuic i» «oto« /
/•' /v* Qb lunii^LW^/ «-i
:. -,- ^v 7 jr^sr**?
•> Saliiu
'.JGRECM BIVSR
C<HC««I JtlV
^
jta«* WOW.—.
TQMWCM «U"f 4
•"i'i.
,. OfSfiT I J
J.M-JC-': »
-V
»« *H S^lp <
»»««•«
a<S..«. f")
u-.8 r^.
*•>
^^H?-/^f^---
" '" ' A J » *WV^'
^T^^^L-
Ii»«» * W t-" ., ,
****** ittuv* At \
•*V»»'Jl" ' " —'
m+af
^illMJft *Q^riClMfl«r*
CbMtiwrnl.'*
VU •
CANri>ft>*NO$ t
N*riQN4t '**|( {
©i©j?
"^
Li«" Of'IOt K!f 'Cl'Mil'l
NAM M*X
!win,-r
BJ.
Tvuan
• •— Min"«»ilU <
wjt 'ftW:*-!
Ci'dnillf
;-< J ,
/
v ajpn »
\_// /««>«.
Tf aws;
*J- J ^-" "XT' unu e**1
' t** ^ ; ^f>jra*3n*u'"" v^"r«ici>
KOV'-1' ,^,,. i^^Ld •/.
^
V
laW 0^--' i
i~+tt"^
t' \ i. , j.»_/' >»• ^<u.«t.\ •..,«=•-
i-A I &?fF, -»~<- ; > >X^,£A
NT li-^^"i"-^r>S:
"*i..V.^.>, 'i~
~ '•'?•'•, *«>..
^?fe^ ^
• f- *f_; '.\i
\^'
© -
image:
 en
i
n i (r'~.*J ^ix (?*)) v—*
0**n ut JK^»- • *• "«»•' v-f •( N—' /
• ,-• '/j^i,m .'•-'/•"'. /
- /f^ c,.,<»- '""
,i/~-—>_
fENNE ^-T-'J
'-^J,.,,,,,,J I
TJ
1—I
cn
?3
m
en
image:
en
i
n i (r'~.*J ^ix (?*)) v—*
0**n ut JK^»- • *• "«»•' v-f •( N—' /
• ,-• '/j^i,m .'•-'/•"'. /
- /f^ c,.,<»- '""
,i/~-—>_
fENNE ^-T-'J
'-^J,.,,,,,,J I
TJ
1—I
cn
?3
m
en
image:
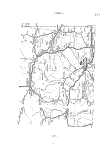 FIGURE 6
272
* \ * Itl * . * JJl '/ \&f** lit tow . * „
-.,\^u^ . -^ :. • ^JZZ V ^4^
V-N ^Js-" .-—'••'-•a ** \i«xo nf I /^j
-«.,?•., .^^V,.- -^T / Mt»*>-='"'(V;;si:i:^>
£. ^\tf^"^/- -.;»,. (wo^tauid^-BK
• rc--% J:-/v<Fx^
- 26 -
image:
FIGURE 6
272
* \ * Itl * . * JJl '/ \&f** lit tow . * „
-.,\^u^ . -^ :. • ^JZZ V ^4^
V-N ^Js-" .-—'••'-•a ** \i«xo nf I /^j
-«.,?•., .^^V,.- -^T / Mt»*>-='"'(V;;si:i:^>
£. ^\tf^"^/- -.;»,. (wo^tauid^-BK
• rc--% J:-/v<Fx^
- 26 -
image:
 1 •' ,' - • /? „ ' T • ;, — - - ------
(; ; | >• /r5 3 * •* J5 , J*?, *s*~^l' * D*Jt .*_ . i - -,
*' r li* » ' « J - ^.^fj-" - ': ' •* ^~""*r— --j^, r, -*• .A^''
j i c ,* I *" '*'£ ^xi* "r .5 5 ^ i - ^ $ ^"* * /^** iNvJr —^ * *? !/^ * *^ *
:>•« •
L
.\-rg.s-v'^
i CB^T^;-
^<sfr
-nc
rrl
?§ 3»
f; ?
t-.-:,.?
>*-
V5r£-
'•?
e/
N-
t—-
nv
^
I-
-•"-'»:! C
~—Jr
-<D-
. i * -A,?—._r___ •
«ii j :?=^=e
g
;-*'
-t-_s
I \
rS'
--li
f\
_^
" fi-
•I
T
^If
iri'e
f {.'
II.
g=|3?
-Li
,,-H
*a
%-.i
,^
\r
\
i^"'.™
-.-'« I §
l||
s f
I Ai!
*t •'
^l
Vi
<;-T\
? 4j
-f^c
JJ=^
\z&
7i
^ I ' .
_/
•-F>
?y Ir1
«-U
\
^ - /
-- riff
R. *
rtPlTr
I" .'.. i| | {\ "^-^_l?
I ^k • -L * f^.j
v Vrj.—~,^ — f. \_- ^^^^—
v*s I-,
irat 4
. W-^
-n
*—i
•cr
image:
1 •' ,' - • /? „ ' T • ;, — - - ------
(; ; | >• /r5 3 * •* J5 , J*?, *s*~^l' * D*Jt .*_ . i - -,
*' r li* » ' « J - ^.^fj-" - ': ' •* ^~""*r— --j^, r, -*• .A^''
j i c ,* I *" '*'£ ^xi* "r .5 5 ^ i - ^ $ ^"* * /^** iNvJr —^ * *? !/^ * *^ *
:>•« •
L
.\-rg.s-v'^
i CB^T^;-
^<sfr
-nc
rrl
?§ 3»
f; ?
t-.-:,.?
>*-
V5r£-
'•?
e/
N-
t—-
nv
^
I-
-•"-'»:! C
~—Jr
-<D-
. i * -A,?—._r___ •
«ii j :?=^=e
g
;-*'
-t-_s
I \
rS'
--li
f\
_^
" fi-
•I
T
^If
iri'e
f {.'
II.
g=|3?
-Li
,,-H
*a
%-.i
,^
\r
\
i^"'.™
-.-'« I §
l||
s f
I Ai!
*t •'
^l
Vi
<;-T\
? 4j
-f^c
JJ=^
\z&
7i
^ I ' .
_/
•-F>
?y Ir1
«-U
\
^ - /
-- riff
R. *
rtPlTr
I" .'.. i| | {\ "^-^_l?
I ^k • -L * f^.j
v Vrj.—~,^ — f. \_- ^^^^—
v*s I-,
irat 4
. W-^
-n
*—i
•cr
image:
 Hva_j«;:-------~~.———/«-.~-—f...^^^,,1™^..-.-^=-^-
T • - .VT
I ~(sW l*ZZ*^JSS
ff^feij^^^
?'i ' " -^W^r'- TT .r1"'"•"' .......v i-h .r.-H /,i, \^|;U:r.'j i ^ " "oiqv—'-- •
y-^SN^r^sss
nw^'-w^^
^ !i. i i
ite) ! 1?1i fi?i , -
•lllnojl ^H I ' 1 V* \
i LI wu.
v«ft*«1it T ""*1"1 :'
ii ««i™»^ '»'|fc_ I
?\ -ftST' "'"I'll f=-. Anil's
\ \»i«i«>j . Nui _!WiK>i-S
'^A-^x^sbg^r^
«»^^'i-i\. v') Si ^^^O.u--""—'HyTpi"! • ,..,»«„ A
\ ^,,.\.c ;OTrv; YF . i :•"?"'9—*
image:
Hva_j«;:-------~~.———/«-.~-—f...^^^,,1™^..-.-^=-^-
T • - .VT
I ~(sW l*ZZ*^JSS
ff^feij^^^
?'i ' " -^W^r'- TT .r1"'"•"' .......v i-h .r.-H /,i, \^|;U:r.'j i ^ " "oiqv—'-- •
y-^SN^r^sss
nw^'-w^^
^ !i. i i
ite) ! 1?1i fi?i , -
•lllnojl ^H I ' 1 V* \
i LI wu.
v«ft*«1it T ""*1"1 :'
ii ««i™»^ '»'|fc_ I
?\ -ftST' "'"I'll f=-. Anil's
\ \»i«i«>j . Nui _!WiK>i-S
'^A-^x^sbg^r^
«»^^'i-i\. v') Si ^^^O.u--""—'HyTpi"! • ,..,»«„ A
\ ^,,.\.c ;OTrv; YF . i :•"?"'9—*
image:
 275
NPL
Number of
Sites
6'
5'
4'
3
2
1
It I 1
CO KT ND SD UT WY
State
(GRAPH 1)
NPL
Number of
Sites
7'
6'
5'
4
3
2
1
1
Mining Radiation Ot
her
Type of Problem
(GRAPH 2)
- 29 -
image:
275
NPL
Number of
Sites
6'
5'
4'
3
2
1
It I 1
CO KT ND SD UT WY
State
(GRAPH 1)
NPL
Number of
Sites
7'
6'
5'
4
3
2
1
1
Mining Radiation Ot
her
Type of Problem
(GRAPH 2)
- 29 -
image:
 276
ERRIS
Number of
Sites
250'
200'
150'
100'
50'
'
I ! 1
CO MT NO SD Ut WY
State
(GRAPH 3)
- 30 -
image:
276
ERRIS
Number of
Sites
250'
200'
150'
100'
50'
'
I ! 1
CO MT NO SD Ut WY
State
(GRAPH 3)
- 30 -
image:
 NPL. High Priority. Federal Sites
Matrix
Site Name
Groundwater
Surface Water
Denver Radium Site
Woodbury Chemical Co. x
Sand Creek Industrial
Site x
Marshall Landfill x
Central City-Idaho Springs
Mining District
California Gulch x
Rose Park x
Union Pacific/
J. H. Baxter x
Libhy Groundwater x
Milltown Reservoir
Sediment . x
Anaconda Smelter x
Silver Bow Creek x
Whltewood Creek x
Arsenic Trioxide
Site x
Lowry Landfill x
Canon City
(Lincoln Park) x
Monti cello Properties
Rocky Mountain
Phosphate x
Anaconda (Great Falls) x
ASARCO Smelter x
Rocky Mountain Arsenal x
x
x
x
x
x
x
X
X
X
X
X
X
Air
x
Direct Contact
x
x
Fire & Explosion
x
x
x
x
x
x
x
Type of Hazard
(GRAPH 4)
- 31 -
image:
NPL. High Priority. Federal Sites
Matrix
Site Name
Groundwater
Surface Water
Denver Radium Site
Woodbury Chemical Co. x
Sand Creek Industrial
Site x
Marshall Landfill x
Central City-Idaho Springs
Mining District
California Gulch x
Rose Park x
Union Pacific/
J. H. Baxter x
Libhy Groundwater x
Milltown Reservoir
Sediment . x
Anaconda Smelter x
Silver Bow Creek x
Whltewood Creek x
Arsenic Trioxide
Site x
Lowry Landfill x
Canon City
(Lincoln Park) x
Monti cello Properties
Rocky Mountain
Phosphate x
Anaconda (Great Falls) x
ASARCO Smelter x
Rocky Mountain Arsenal x
x
x
x
x
x
x
X
X
X
X
X
X
Air
x
Direct Contact
x
x
Fire & Explosion
x
x
x
x
x
x
x
Type of Hazard
(GRAPH 4)
- 31 -
image:
 NPL
Status
Site Name
Remedial Investigation
Denver Radium Site 3
Woodbury Chemical Co. 3
Sand Creek Industrial
Site 6
Marshall Landfill 6.
Central City-Idaho Springs
Mining District 3
California Gulch 6
Rose Park 1
Union Pacific/
vl. H. Baxter 2
Libby Groundwater 6
Mi 11 town Reservoir
Sediment 3
Anaconda Smelter 5-6
Silver Bow Creek 3
Whitewood Creek 5
Arsenic Trioxide
Site 3
Key: 1) EPA
2^ State Only
3) Cooperative Agreement
4) State Contract
5) Voluntary Agreement
6) Compliance Agreement
Feasibility Study
3
3
6
3
1
6
3
3
(GRAPH 5)
Design
Remedial Action
ro
--J
oo
image:
NPL
Status
Site Name
Remedial Investigation
Denver Radium Site 3
Woodbury Chemical Co. 3
Sand Creek Industrial
Site 6
Marshall Landfill 6.
Central City-Idaho Springs
Mining District 3
California Gulch 6
Rose Park 1
Union Pacific/
vl. H. Baxter 2
Libby Groundwater 6
Mi 11 town Reservoir
Sediment 3
Anaconda Smelter 5-6
Silver Bow Creek 3
Whitewood Creek 5
Arsenic Trioxide
Site 3
Key: 1) EPA
2^ State Only
3) Cooperative Agreement
4) State Contract
5) Voluntary Agreement
6) Compliance Agreement
Feasibility Study
3
3
6
3
1
6
3
3
(GRAPH 5)
Design
Remedial Action
ro
--J
oo
image:
 103fc) Notification
279
Number of
Sites
250
200
150'
100
50'
! 1
1
CO MT ND SD UT WY
State
(GRAPH 6)
NPL
Number
Sites
6'
5
4'
3'
2'
r
•
i
! I 1 i
CO MT NO SO UT WY
State
(GRAPH 7^
- 33 -
image:
103fc) Notification
279
Number of
Sites
250
200
150'
100
50'
! 1
1
CO MT ND SD UT WY
State
(GRAPH 6)
NPL
Number
Sites
6'
5
4'
3'
2'
r
•
i
! I 1 i
CO MT NO SO UT WY
State
(GRAPH 7^
- 33 -
image:
 280
NPL
Number of
Sites
14
12
10
8
6
4
2
•
1 i
Remedial Feasibility Design Remedial
Investigation Study Action
Action at Sites
(GRAPH 8)
NPL
Number of
Sites
14
12'
10'
8'
6'
4'
2'
1
Ground- Surface A r Direct Fire and
water water Contact Explosion
Type of Hazard
fGRAPH 9)
- 34 -
image:
280
NPL
Number of
Sites
14
12
10
8
6
4
2
•
1 i
Remedial Feasibility Design Remedial
Investigation Study Action
Action at Sites
(GRAPH 8)
NPL
Number of
Sites
14
12'
10'
8'
6'
4'
2'
1
Ground- Surface A r Direct Fire and
water water Contact Explosion
Type of Hazard
fGRAPH 9)
- 34 -
image:
 NPL
281
Number of
Sites
14
12
10
8
6
4
2
'
•
•
•
•
I
Total Cooperative State Voluntary
Agreements Contracts Agreements
(GRAPH 10)
Compliance
- 35 -
image:
NPL
281
Number of
Sites
14
12
10
8
6
4
2
'
•
•
•
•
I
Total Cooperative State Voluntary
Agreements Contracts Agreements
(GRAPH 10)
Compliance
- 35 -
image:
 "• 282
RCRA Section
Hazardous Waste - (Active Sites)
Environmental Management Report
Page N unbar
PART 1 - Overview of Status & Trends 283
Introduction
Identification of Waste Handlers
Universe of Hazardous Wastes
Treatment Storage and Disposal Facilities (ISO's)
Conmercial Disposal Facilities Identified
Ccmmerci al Recycl ing F aci 1 iti es I denti fi ed
Hazardous Waste on Indian Reservations
Correction of Unsafe and Improper Handling Practices
Improvement of Facilities through Permitting
Trends
PART 2 ~ Significant Environmental problems at active
Hazardous Waste5ites ' 287
Criteria for Defining "Significant Problems"
Ground Water Contamination,
Causes, Barrier, Implications
Oil Refineries
C aus es, Bar ri ers, I mpl i cat i en s
R ecycl ers
Causes , Sarri ers, Imp! icati ens
Mining Wastes
Causes, Barriers, Implications
Implementation of Pretreatment Standards
Causes, Barriers, Implications
Site-Specific Problems
Denver-Arapahoe Chemical Waste Processing
Facility
Attachments
A-l Hazardous Waste Notification Figures (chart) 29$
A-2 Treatment Storage and Disposal Facilities 295
by Process and by State (chart)
A-3 Nimber of Hazardous Waste TSD Facilities by 296
T^pe of Process and by State (chart)
A-4 Location of Commercial Hazardous Waste Disposal 297 '
Facilities (map)
A-5 Location of Commercial Hazardous Waste Recycling - 298
Facilities (map)
A-6 Selected RCRA Sites with Significant 299
Ground Water Contamination Problems
A-7 Oil Refineries and Associated Installation with TSD 300
Facilities (Listed by State)
A-8 Hazardous Waste Recyclers Posing Significant Problems 301
(Selected Listing and Summaries of Three Sites)
image:
"• 282
RCRA Section
Hazardous Waste - (Active Sites)
Environmental Management Report
Page N unbar
PART 1 - Overview of Status & Trends 283
Introduction
Identification of Waste Handlers
Universe of Hazardous Wastes
Treatment Storage and Disposal Facilities (ISO's)
Conmercial Disposal Facilities Identified
Ccmmerci al Recycl ing F aci 1 iti es I denti fi ed
Hazardous Waste on Indian Reservations
Correction of Unsafe and Improper Handling Practices
Improvement of Facilities through Permitting
Trends
PART 2 ~ Significant Environmental problems at active
Hazardous Waste5ites ' 287
Criteria for Defining "Significant Problems"
Ground Water Contamination,
Causes, Barrier, Implications
Oil Refineries
C aus es, Bar ri ers, I mpl i cat i en s
R ecycl ers
Causes , Sarri ers, Imp! icati ens
Mining Wastes
Causes, Barriers, Implications
Implementation of Pretreatment Standards
Causes, Barriers, Implications
Site-Specific Problems
Denver-Arapahoe Chemical Waste Processing
Facility
Attachments
A-l Hazardous Waste Notification Figures (chart) 29$
A-2 Treatment Storage and Disposal Facilities 295
by Process and by State (chart)
A-3 Nimber of Hazardous Waste TSD Facilities by 296
T^pe of Process and by State (chart)
A-4 Location of Commercial Hazardous Waste Disposal 297 '
Facilities (map)
A-5 Location of Commercial Hazardous Waste Recycling - 298
Facilities (map)
A-6 Selected RCRA Sites with Significant 299
Ground Water Contamination Problems
A-7 Oil Refineries and Associated Installation with TSD 300
Facilities (Listed by State)
A-8 Hazardous Waste Recyclers Posing Significant Problems 301
(Selected Listing and Summaries of Three Sites)
image:
 283
EPA REGION VIII
ENVIRONMENTAL MANAGEMENT REPORT
HAZARDOUS WASTE - ACTIVE SITES (RCRA)
PART 1: OVERVIEW OF STATUS AND TRENDS
Most of the information which we have on the environmental problems posed
by active hazardous waste handlers dates from November 19, 1980, the start of
the regulatory program developed under the Resource Conservation and Recovery
Act (RCRA). Since that time, EPA has moved a long way toward defining,
analyzing and correcting those problems, but much work remains to be done in
all three areas. This section will briefly summarize and display general
background data in order to provide an overview of the status and trends of
hazardous waste management and mismanagement in Region VIII.
Identification of Waste Handlers
The identification of the number and type of hazardous waste generators,
transporters, and treatment, storage and disposal (TSD) facilities was made
possible by the requirement that EPA be notified by those engaged in each type
of activity. The chart in Attachment A-l displays the resulting figures, and
distribution by State, as gathered from the Hazardous Waste Data Management
System (HWDMS), the RCRA data base.
One of the salient facts emerging from the notification figures is that """
over half of the total of 2521 notifiers have withdrawn from the regulatory
program, due to one of the indicated exemptions or special requirements. The
significance of and problems associated with mining waste and recycling
exemptions will be discussed below. Another related fact is that over half of
the total TSD Part A permit applications filed in the Region (over 300) have
been withdrawn. Aside from the large number of protective filings, this has
been due in large part to the above-mentioned exemptions. It also stems from
a tendency to store waste for less than 90 days, and thereby obviate the need
for the permit (discussed below).
Universe of Hazardous Wastes
The main types and sources of hazardous waste generated and handled in
Region VIII are:
- electroplating bath solutions and sludges - high-tech industry;
- industrial solvents - various manufacturing processes;
- petroleum refinery wastes - oil refineries;
- pesticides - production by-products and discarded off-spec products;
- wood preservation wastes - tie and pole treatment plants;
- corrosive wastes - metal treaters, paint strippers;
- EP toxic wastes - coke and steel industry, used oils, paint production;
- ignitables - solvents, paint thinners, chemicals;
- reactive - gas plants, explosives manufacturers.
In order to better describe the universe of wastes in the Region, we intend to
develop a chart showing the frequency distribution of the most common types of
waste.
image:
283
EPA REGION VIII
ENVIRONMENTAL MANAGEMENT REPORT
HAZARDOUS WASTE - ACTIVE SITES (RCRA)
PART 1: OVERVIEW OF STATUS AND TRENDS
Most of the information which we have on the environmental problems posed
by active hazardous waste handlers dates from November 19, 1980, the start of
the regulatory program developed under the Resource Conservation and Recovery
Act (RCRA). Since that time, EPA has moved a long way toward defining,
analyzing and correcting those problems, but much work remains to be done in
all three areas. This section will briefly summarize and display general
background data in order to provide an overview of the status and trends of
hazardous waste management and mismanagement in Region VIII.
Identification of Waste Handlers
The identification of the number and type of hazardous waste generators,
transporters, and treatment, storage and disposal (TSD) facilities was made
possible by the requirement that EPA be notified by those engaged in each type
of activity. The chart in Attachment A-l displays the resulting figures, and
distribution by State, as gathered from the Hazardous Waste Data Management
System (HWDMS), the RCRA data base.
One of the salient facts emerging from the notification figures is that """
over half of the total of 2521 notifiers have withdrawn from the regulatory
program, due to one of the indicated exemptions or special requirements. The
significance of and problems associated with mining waste and recycling
exemptions will be discussed below. Another related fact is that over half of
the total TSD Part A permit applications filed in the Region (over 300) have
been withdrawn. Aside from the large number of protective filings, this has
been due in large part to the above-mentioned exemptions. It also stems from
a tendency to store waste for less than 90 days, and thereby obviate the need
for the permit (discussed below).
Universe of Hazardous Wastes
The main types and sources of hazardous waste generated and handled in
Region VIII are:
- electroplating bath solutions and sludges - high-tech industry;
- industrial solvents - various manufacturing processes;
- petroleum refinery wastes - oil refineries;
- pesticides - production by-products and discarded off-spec products;
- wood preservation wastes - tie and pole treatment plants;
- corrosive wastes - metal treaters, paint strippers;
- EP toxic wastes - coke and steel industry, used oils, paint production;
- ignitables - solvents, paint thinners, chemicals;
- reactive - gas plants, explosives manufacturers.
In order to better describe the universe of wastes in the Region, we intend to
develop a chart showing the frequency distribution of the most common types of
waste.
image:
 284
The volume and disposition of each waste type cannot be reported because
EPA Headquarters did not make the modifications to the RCRA data base which
were necessary for the 1981 Annual Report data to be entered and tabulated.
If the data base is modified in time for the 1983 Annual Report (due in March
1984), this highly important and useful information will be available to
decision makers in the government, private and public sectors.
Treatment, Storage and Disposal (TSD) Facilities
Among the various Region VIII hazardous waste TSD facilities are examples
of each general handling method, with the exception of ocean disposal. The
chart in Attachment A-2 shows the number and distribution of the types of TSD
facilities across the six states. The same basic information is presented in
a 'barrel-graph1 format in Attachment A-3. It is instructive to note that
contrary to most Regions, the number of disposal and incineration facilities
is noticeably greater than that of simple treatment and storage facilities.
It is the disposal facilities which present the greatest existing and
potential threats to groundwater (see Part 2).
Commercial Disposal Facilities
The map in Attachment A-4 shows the location of the facilities in the
Region whose primary business is the disposal of hazardous waste received from
off-site. They are:
- U.S. Pollution Control, Grassy Mountain Facility - Clive, UT
- Jim's Water Service - Gillette, WY
- Big Dipper Enterprises - Gwinner, NO
- Denver-Arapahoe Chemical Waste Processing Facility - Aurora, CO
- Highway 36 Land Development Corporation - Last Chance, CO
Since the sites in Colorado and North Dakota cannot presently operate, and the
site in Wyoming only handles certain oil industry wastes, the current
commercial disposal capacity in the Region is clearly quite limited (see
Trends, below).
Commercial Recycling Facilities
The map in Attachment A-5 displays the location of the following
commercial hazardous waste recycling facilities:
- AERR Co. - Arvada, CO
- Mountain Chemicals, Inc. - Golden, CO
- Oil & Solvent Process Co. - Henderson, CO
- Thoro Products Co. - Golden, CO
- Ekotek - Salt Lake City, UT
- Williams Strategic Metals - Laramie, WY
The number of active recycling facilities exceeds that of disposal sites,
but only a few types of wastes (such as solvents, oils and some metals) are
recycled, and recyclers present their own set of problems (see Part 2).
image:
284
The volume and disposition of each waste type cannot be reported because
EPA Headquarters did not make the modifications to the RCRA data base which
were necessary for the 1981 Annual Report data to be entered and tabulated.
If the data base is modified in time for the 1983 Annual Report (due in March
1984), this highly important and useful information will be available to
decision makers in the government, private and public sectors.
Treatment, Storage and Disposal (TSD) Facilities
Among the various Region VIII hazardous waste TSD facilities are examples
of each general handling method, with the exception of ocean disposal. The
chart in Attachment A-2 shows the number and distribution of the types of TSD
facilities across the six states. The same basic information is presented in
a 'barrel-graph1 format in Attachment A-3. It is instructive to note that
contrary to most Regions, the number of disposal and incineration facilities
is noticeably greater than that of simple treatment and storage facilities.
It is the disposal facilities which present the greatest existing and
potential threats to groundwater (see Part 2).
Commercial Disposal Facilities
The map in Attachment A-4 shows the location of the facilities in the
Region whose primary business is the disposal of hazardous waste received from
off-site. They are:
- U.S. Pollution Control, Grassy Mountain Facility - Clive, UT
- Jim's Water Service - Gillette, WY
- Big Dipper Enterprises - Gwinner, NO
- Denver-Arapahoe Chemical Waste Processing Facility - Aurora, CO
- Highway 36 Land Development Corporation - Last Chance, CO
Since the sites in Colorado and North Dakota cannot presently operate, and the
site in Wyoming only handles certain oil industry wastes, the current
commercial disposal capacity in the Region is clearly quite limited (see
Trends, below).
Commercial Recycling Facilities
The map in Attachment A-5 displays the location of the following
commercial hazardous waste recycling facilities:
- AERR Co. - Arvada, CO
- Mountain Chemicals, Inc. - Golden, CO
- Oil & Solvent Process Co. - Henderson, CO
- Thoro Products Co. - Golden, CO
- Ekotek - Salt Lake City, UT
- Williams Strategic Metals - Laramie, WY
The number of active recycling facilities exceeds that of disposal sites,
but only a few types of wastes (such as solvents, oils and some metals) are
recycled, and recyclers present their own set of problems (see Part 2).
image:
 285
Hazardous Waste on Indian Reservations
The 27 Indian reservations within Region VIII constitute a large land area
and socio-economic context with a real potential for serious hazardous waste
problems. Most of our work has been on solid (non-hazardous) waste matters,
but the two spheres naturally overlap. Since our recent inventory indicated
that only one out of over 100 solid waste disposal sites an Indian reservations
qualify as a sanitary landfill, the danger from misuse of hazardous wastes is
great. The current number of active hazardous waste handlers on Indian
reservations is small: a TSD facility at a munitions test plant in Skull
Valley, Utah (Hercules Tekoi), a small quantity generator (formerly a storage
facility) on the Ft. Berthold Reservation, North~Dakota (Northrop
Electronics), and a transporter (Hidatco, Inc.) working out of the Ft.
Berthold Reservation. But increasing energy resource development and economic
pressures for new, isolated hazardous waste sites, make Indian reservations
prime targets for problems. In order to correct and avoid such problems, we
are providing solid waste assistance and training to some reservations,
including four for hazardous waste in particular, in FY 1984. More funding
and support for such efforts is needed if we are to meet the challenge.
Correction of Unsafe and Improper Handling Practices
EPA and the States in Region VIII have conducted over 1800 RCRA
compliance inspections and 57 probable cause inspections (e.g., citizen
complaints, 'midnight dumping* incidents). Improved handling practices have
come from both in-field inspector recommendations and formal enforcement
actions. Through December of 1982, we have taken the following number and
types of enforcement actions (including warning letters, complaints and final
orders): 46 for improper treatment, storage or disposal practices, 100 for
inadequate plans or records, 12 for discrepancies or non-use of shipping
manifests, and 72 for lack of, or unacceptable, financial assurance or
insurance instruments. (In tabulating these figures, each violation found fand
corresponding correction made) has been counted just once, even if achieving
compliance required more than one step in the enforcement process.)
Improvement of Facilities Through Permitting
Another mechanism used for improving and safeguarding the environment in
regard to hazardous waste is that of RCRA permit issuance for treatment,
storage and disposal facilities. We have requested Part 8 permit applications
from 49 facilities thus far, and will continue to do so at the rate of
approximately three per month. In making our Part B requests, we have focused
on those sites where complying with the final (Part 254) permit standards will
result in significant improvements. In October of 1981, Region VIII issued
the first RCRA permit in the nation to the Oil and Solvent Process Company, a
recycling facility near Denver, Colorado. It is important to issue permits
for new facilities such as this in order to increase the commercial hazardous
waste treatment, storage and disposal capacity in the Region (as discussed
below).
image:
285
Hazardous Waste on Indian Reservations
The 27 Indian reservations within Region VIII constitute a large land area
and socio-economic context with a real potential for serious hazardous waste
problems. Most of our work has been on solid (non-hazardous) waste matters,
but the two spheres naturally overlap. Since our recent inventory indicated
that only one out of over 100 solid waste disposal sites an Indian reservations
qualify as a sanitary landfill, the danger from misuse of hazardous wastes is
great. The current number of active hazardous waste handlers on Indian
reservations is small: a TSD facility at a munitions test plant in Skull
Valley, Utah (Hercules Tekoi), a small quantity generator (formerly a storage
facility) on the Ft. Berthold Reservation, North~Dakota (Northrop
Electronics), and a transporter (Hidatco, Inc.) working out of the Ft.
Berthold Reservation. But increasing energy resource development and economic
pressures for new, isolated hazardous waste sites, make Indian reservations
prime targets for problems. In order to correct and avoid such problems, we
are providing solid waste assistance and training to some reservations,
including four for hazardous waste in particular, in FY 1984. More funding
and support for such efforts is needed if we are to meet the challenge.
Correction of Unsafe and Improper Handling Practices
EPA and the States in Region VIII have conducted over 1800 RCRA
compliance inspections and 57 probable cause inspections (e.g., citizen
complaints, 'midnight dumping* incidents). Improved handling practices have
come from both in-field inspector recommendations and formal enforcement
actions. Through December of 1982, we have taken the following number and
types of enforcement actions (including warning letters, complaints and final
orders): 46 for improper treatment, storage or disposal practices, 100 for
inadequate plans or records, 12 for discrepancies or non-use of shipping
manifests, and 72 for lack of, or unacceptable, financial assurance or
insurance instruments. (In tabulating these figures, each violation found fand
corresponding correction made) has been counted just once, even if achieving
compliance required more than one step in the enforcement process.)
Improvement of Facilities Through Permitting
Another mechanism used for improving and safeguarding the environment in
regard to hazardous waste is that of RCRA permit issuance for treatment,
storage and disposal facilities. We have requested Part 8 permit applications
from 49 facilities thus far, and will continue to do so at the rate of
approximately three per month. In making our Part B requests, we have focused
on those sites where complying with the final (Part 254) permit standards will
result in significant improvements. In October of 1981, Region VIII issued
the first RCRA permit in the nation to the Oil and Solvent Process Company, a
recycling facility near Denver, Colorado. It is important to issue permits
for new facilities such as this in order to increase the commercial hazardous
waste treatment, storage and disposal capacity in the Region (as discussed
below).
image:
 286
Trends
In the short period that EPA has regulated active hazardous waste
handlers, certain trends have begun to emerge, some negative and some positive
from the standpoint of the environment. On the negative side, perhaps the
major emerging problem in Region VIII is the lack of commercial disposal
capacity. For various reasons, including State siting laws (which give
counties the power to veto the establishment of new facilities), as well as a
legacy of a dearth of adequate facilities, the number of commercial disposal
sites within the Region is much below current demand. We cannot determine the
size of the gap between waste generation and disposal capacity until and
unless the Annual Report data is computerized (as discussed above). The
impacts of this gap include higher costs for waste shipments out of state and
out of Region, more likelihood of 'midnight dumping1, and more risk of
accidents during long distance shipments. It should also be pointed out that
there are no commercial incineration facilities in Region VIII.
Another, related trend, which has not quite been felt yet, is the
'weeding out1 of poorly run facilities. Certain facilities, especially the
older recyclers (see Attachment A-8), may not be able to come into compliance
with the new standards for waste management under RCRA. While the closing
down of such operations can be considered an improvement for the environment
in one sense, it can also be seen as a further reduction in the available
commercial waste management capacity in the Region.
A final negative trend which deserves mention is the tendency for storage
permit applicants to reduce their storage period to less than 90 days, and
thereby eliminate the need for the permit. Approximately 50 facilities in
Region VIII have withdrawn their applications for this reason. There are at
least two problems associated with this trend. First, waste must be shipped
off-site more often, thus increasing the risks of transportation accidents and
decreasing the economies of scale. And second, storing for less than 90 days
places the facilities under the much less stringent generator requirements,
which increases the possibility of mismanagement. One solution to this
situation which has been suggested by EPA but not yet acted upon, is to have
some kind of permit-by-rule for small or short-term storage facilities, with
requirements which are stricter than that for generators but less burdensome
than the full TSD requirments.
We can also point to a few positive trends. First, based upon our
contacts with the regulated community, and judging from the number of
withdrawals for this reason (134 total; see Attachment A-l), there has been an
increase in the recycling of hazardous wastes. This is not surprising, given
the rising costs for disposal. It also is not surprising that generators are
changing their production processes so as to reduce the amount of waste
generated. We do not have the data to demonstrate this because we have yet to
receive Annual Reports for more than one year. Finally, there is a growing
trend toward the installation of pretreatment units, which then discharge
non-hazardous waste into publicly owned treatment works. Although this
eliminates the need for storage and transportation of the wastes, it amplifies
the need for an effective pretreatment program (see Part 2).
image:
286
Trends
In the short period that EPA has regulated active hazardous waste
handlers, certain trends have begun to emerge, some negative and some positive
from the standpoint of the environment. On the negative side, perhaps the
major emerging problem in Region VIII is the lack of commercial disposal
capacity. For various reasons, including State siting laws (which give
counties the power to veto the establishment of new facilities), as well as a
legacy of a dearth of adequate facilities, the number of commercial disposal
sites within the Region is much below current demand. We cannot determine the
size of the gap between waste generation and disposal capacity until and
unless the Annual Report data is computerized (as discussed above). The
impacts of this gap include higher costs for waste shipments out of state and
out of Region, more likelihood of 'midnight dumping1, and more risk of
accidents during long distance shipments. It should also be pointed out that
there are no commercial incineration facilities in Region VIII.
Another, related trend, which has not quite been felt yet, is the
'weeding out1 of poorly run facilities. Certain facilities, especially the
older recyclers (see Attachment A-8), may not be able to come into compliance
with the new standards for waste management under RCRA. While the closing
down of such operations can be considered an improvement for the environment
in one sense, it can also be seen as a further reduction in the available
commercial waste management capacity in the Region.
A final negative trend which deserves mention is the tendency for storage
permit applicants to reduce their storage period to less than 90 days, and
thereby eliminate the need for the permit. Approximately 50 facilities in
Region VIII have withdrawn their applications for this reason. There are at
least two problems associated with this trend. First, waste must be shipped
off-site more often, thus increasing the risks of transportation accidents and
decreasing the economies of scale. And second, storing for less than 90 days
places the facilities under the much less stringent generator requirements,
which increases the possibility of mismanagement. One solution to this
situation which has been suggested by EPA but not yet acted upon, is to have
some kind of permit-by-rule for small or short-term storage facilities, with
requirements which are stricter than that for generators but less burdensome
than the full TSD requirments.
We can also point to a few positive trends. First, based upon our
contacts with the regulated community, and judging from the number of
withdrawals for this reason (134 total; see Attachment A-l), there has been an
increase in the recycling of hazardous wastes. This is not surprising, given
the rising costs for disposal. It also is not surprising that generators are
changing their production processes so as to reduce the amount of waste
generated. We do not have the data to demonstrate this because we have yet to
receive Annual Reports for more than one year. Finally, there is a growing
trend toward the installation of pretreatment units, which then discharge
non-hazardous waste into publicly owned treatment works. Although this
eliminates the need for storage and transportation of the wastes, it amplifies
the need for an effective pretreatment program (see Part 2).
image:
 287
PART 2: SIGNIFICANT ENVIRONMENTAL PROBLEMS AT ACTIVE HAZARDOUS WASTE SITES
For the purposes of this report, we have designated certain environmental
problems as especially 'significant1. The criteria for making that
designation, and for ranking the problems in the order presented, are similar
to the criteria we use for prioritizing Part B permit requests and selecting
'major' facilities. They include the following factors, which are not
strictly rank-ordered:
• presence and extent of environmental or human health damage or danger
- groundwater or surface water contamination
- potential impact on public health
• type of waste
- acutely hazardous, ignitable, toxic, reactive, etc.
• type of operation
- handling method(s)
- probability of mismanagement and risk
• size of operation
- volume and variety of wastes handled
- facility design capacity
• location
- nearness to and size of population in area
- surrounding land use
- proximity to sensitive resources (e.g., surface or drinking water)
• compliance history
- past or pending enforcement actions
- types of violations.
Rather then attempting to list, rank and discuss all of the Region VIII
hazardous waste handlers which may exhibit significant environmental problems
based on the above criteria, we have chosen to present certain key, generic
types of problems and then cite some of the most representative and important
cases which illustrate those problems. All but the last of the problems
discussed below are 'abatement' problems, which currently result in adverse
environmental effects. However, they each may also be considered as
'potential degradation' problems, since the full extent of degradation is
still being studied and determined. Toward that end, we identify those areas
where additional monitoring or research is needed to understand the severity
and cause of the problems.
The following significant environmental problems are discussed: groundwater
contamination, oil refineries, recyclers, mining wastes, implementation of
pretreatment standards, and a site-specific case (the Denver-Arapahoe Chemical
Waste Processing Facility).
image:
287
PART 2: SIGNIFICANT ENVIRONMENTAL PROBLEMS AT ACTIVE HAZARDOUS WASTE SITES
For the purposes of this report, we have designated certain environmental
problems as especially 'significant1. The criteria for making that
designation, and for ranking the problems in the order presented, are similar
to the criteria we use for prioritizing Part B permit requests and selecting
'major' facilities. They include the following factors, which are not
strictly rank-ordered:
• presence and extent of environmental or human health damage or danger
- groundwater or surface water contamination
- potential impact on public health
• type of waste
- acutely hazardous, ignitable, toxic, reactive, etc.
• type of operation
- handling method(s)
- probability of mismanagement and risk
• size of operation
- volume and variety of wastes handled
- facility design capacity
• location
- nearness to and size of population in area
- surrounding land use
- proximity to sensitive resources (e.g., surface or drinking water)
• compliance history
- past or pending enforcement actions
- types of violations.
Rather then attempting to list, rank and discuss all of the Region VIII
hazardous waste handlers which may exhibit significant environmental problems
based on the above criteria, we have chosen to present certain key, generic
types of problems and then cite some of the most representative and important
cases which illustrate those problems. All but the last of the problems
discussed below are 'abatement' problems, which currently result in adverse
environmental effects. However, they each may also be considered as
'potential degradation' problems, since the full extent of degradation is
still being studied and determined. Toward that end, we identify those areas
where additional monitoring or research is needed to understand the severity
and cause of the problems.
The following significant environmental problems are discussed: groundwater
contamination, oil refineries, recyclers, mining wastes, implementation of
pretreatment standards, and a site-specific case (the Denver-Arapahoe Chemical
Waste Processing Facility).
image:
 288
6ROUNDHATER CONTAMINATION
Causes of the Problem
There are 73 hazardous waste management facilities in Region VIII which
are required to conduct groundwater monitoring. (See the Si/Disposal column
in the chart in Attachment A-2.) Many of them have exhibited serious
groundwater contamination problems as a result of inadequate disposal
practices. Ten companies have applied for groundwater monitoring waivers (per
40 CFR 265.90(c)), but a waiver was not deemed appropriate in any of those
cases. To date, no facility has provided an adequate technical justification
for receiving a waiver appproval. Attachment A-6 discusses four of the most
significant groundwater problem sites in the Region.
Barriers to Solution
Facilities are obtaining groundwater monitoring data as required, but we
have noted that some control wells upgradient of hazardous waste management
areas are contaminated and therefore not useful. The groundwater parameters
(265.92(b)(3)) may not provide adequate indicators of groundwater
contamination. Presently, this concern cannot be addressed until the permit
evaluation process begins.
Implications for Agency Management
Based on evidence of environmental contamination, several facilities are
moving into the assessment phase (265.93). In general, more guidance,
technical information and work is needed on many groundwater contamination and
monitoring issues, including the waiver provision, well location and
construction standards, and the designation of aquifers.
image:
288
6ROUNDHATER CONTAMINATION
Causes of the Problem
There are 73 hazardous waste management facilities in Region VIII which
are required to conduct groundwater monitoring. (See the Si/Disposal column
in the chart in Attachment A-2.) Many of them have exhibited serious
groundwater contamination problems as a result of inadequate disposal
practices. Ten companies have applied for groundwater monitoring waivers (per
40 CFR 265.90(c)), but a waiver was not deemed appropriate in any of those
cases. To date, no facility has provided an adequate technical justification
for receiving a waiver appproval. Attachment A-6 discusses four of the most
significant groundwater problem sites in the Region.
Barriers to Solution
Facilities are obtaining groundwater monitoring data as required, but we
have noted that some control wells upgradient of hazardous waste management
areas are contaminated and therefore not useful. The groundwater parameters
(265.92(b)(3)) may not provide adequate indicators of groundwater
contamination. Presently, this concern cannot be addressed until the permit
evaluation process begins.
Implications for Agency Management
Based on evidence of environmental contamination, several facilities are
moving into the assessment phase (265.93). In general, more guidance,
technical information and work is needed on many groundwater contamination and
monitoring issues, including the waiver provision, well location and
construction standards, and the designation of aquifers.
image:
 289
OIL REFINERIES
Causes of the Problem
Oil refineries constitute one of the major types of hazardous waste
producing industries in Region VIII (see Attachment A-7). Nearly all of the
oil refineries have land disposal or land treatment facilities which are
impacting groundwater. Many refineries also have inactive Superfund sites
from past practices. Disposal methods for toxic refinery wastes have tended
to take advantage of wide open spaces instead of environmentally sound waste
management techniaues.
3arriers to So1ution
Many refineries are trying to delist their wastes at the same time that
those wastes are contaminating groundwater. Region VIII has taken the
position that the delisting of refinery wastes should not be allowed until a
chemical test is developed and promulgated that adequately addresses these
types of wastes. The current extraction procedure toxicity test is not
appropriate for oily wastes. Distinguishing old contamination from current
contamination is also a real problem.
Implications for Agency Management
More time and resources need to be expended to gather data on groundwater
pollution within the environs of refinery sites. We also need to do more
studies on the organic constituents of refinery wastes in order to determine
their toxicological significance. It may be advisable to revise the basis for
the listing of refinery wastes to include organics. Also, the exemption for
oil and gas production wastes (261.4(b)(5)) may merit reconsideration in
conjunction with the above.
image:
289
OIL REFINERIES
Causes of the Problem
Oil refineries constitute one of the major types of hazardous waste
producing industries in Region VIII (see Attachment A-7). Nearly all of the
oil refineries have land disposal or land treatment facilities which are
impacting groundwater. Many refineries also have inactive Superfund sites
from past practices. Disposal methods for toxic refinery wastes have tended
to take advantage of wide open spaces instead of environmentally sound waste
management techniaues.
3arriers to So1ution
Many refineries are trying to delist their wastes at the same time that
those wastes are contaminating groundwater. Region VIII has taken the
position that the delisting of refinery wastes should not be allowed until a
chemical test is developed and promulgated that adequately addresses these
types of wastes. The current extraction procedure toxicity test is not
appropriate for oily wastes. Distinguishing old contamination from current
contamination is also a real problem.
Implications for Agency Management
More time and resources need to be expended to gather data on groundwater
pollution within the environs of refinery sites. We also need to do more
studies on the organic constituents of refinery wastes in order to determine
their toxicological significance. It may be advisable to revise the basis for
the listing of refinery wastes to include organics. Also, the exemption for
oil and gas production wastes (261.4(b)(5)) may merit reconsideration in
conjunction with the above.
image:
 290
RECYCLERS
Causes of the Problem
Recyclers of industrial waste chemicals posa significant problems because
of a lingering history of unsafe hazardous waste management practices.
Unmarked drums leaking waste directly onto the ground have not been uncommon
for these types of facilities. Older recycling facilities are often located
in densely populated, high-risk areas. Recyclers handling flammable materials
are of special concern because of the possibility for fires. Attachment A-8
lists some of the significant problem recyclers in the Region.
Barriers to Solution
Part of the problem is that, while trying to encourage recycling, the
Agency has promulgated a complete exemption from regulation for certain
recycled wastes. 40 CFR 261.6(a) allows for the generation, transportation,
treatment and storage of characteristic (Subpart C) wastes, prior to
recycling, without any regulation. Consequently, many hazardous wastes
intended for recycling are not managed according to safe handling or
engineering practices. Some facilities have taken the attitude that this
exempts them from any and all requirements under RCRA, and intense litigation
is often necessary to bring them into compliance with those regulations which_
do apply.
Alternatively, 40 CFR 261.6(b) provides more stringent control for listed
(Subpart 0) wastes destined for recycling. The wastes must be manifested and
the receiving facility must be permitted or have interim status to receive and
treat the waste. These two different requirements relating to recycling of
waste have caused considerable confusion. There are very little chemical or
toxicological differences between the non-regulated characteristic wastes and
the regulated listed wastes, but the regulations, and therefore handling
methods, differ widely.
Implications for Agency Management
The current RCRA regulations definitely encourage recycling of certain
wastes, but they also sacrifice a great deal of needed environmental
protection. When and if the regulatory changes proposed on April 4, 1983
become final, they will help to clarify handling requirements and impose more
consistent control over recyclers, while still encouraging recycling. These
regulations also address long term storage of hazardous wastes and require
facilities to process the wastes within a set time period. Currently, a
facility can state that it intends to recycle a waste, but not get around to
it for years, if ever. In order to enhance resource conservation and
recovery, more work on the technical and regulatory aspects of hazardous waste
recycling needs to be done.
image:
290
RECYCLERS
Causes of the Problem
Recyclers of industrial waste chemicals posa significant problems because
of a lingering history of unsafe hazardous waste management practices.
Unmarked drums leaking waste directly onto the ground have not been uncommon
for these types of facilities. Older recycling facilities are often located
in densely populated, high-risk areas. Recyclers handling flammable materials
are of special concern because of the possibility for fires. Attachment A-8
lists some of the significant problem recyclers in the Region.
Barriers to Solution
Part of the problem is that, while trying to encourage recycling, the
Agency has promulgated a complete exemption from regulation for certain
recycled wastes. 40 CFR 261.6(a) allows for the generation, transportation,
treatment and storage of characteristic (Subpart C) wastes, prior to
recycling, without any regulation. Consequently, many hazardous wastes
intended for recycling are not managed according to safe handling or
engineering practices. Some facilities have taken the attitude that this
exempts them from any and all requirements under RCRA, and intense litigation
is often necessary to bring them into compliance with those regulations which_
do apply.
Alternatively, 40 CFR 261.6(b) provides more stringent control for listed
(Subpart 0) wastes destined for recycling. The wastes must be manifested and
the receiving facility must be permitted or have interim status to receive and
treat the waste. These two different requirements relating to recycling of
waste have caused considerable confusion. There are very little chemical or
toxicological differences between the non-regulated characteristic wastes and
the regulated listed wastes, but the regulations, and therefore handling
methods, differ widely.
Implications for Agency Management
The current RCRA regulations definitely encourage recycling of certain
wastes, but they also sacrifice a great deal of needed environmental
protection. When and if the regulatory changes proposed on April 4, 1983
become final, they will help to clarify handling requirements and impose more
consistent control over recyclers, while still encouraging recycling. These
regulations also address long term storage of hazardous wastes and require
facilities to process the wastes within a set time period. Currently, a
facility can state that it intends to recycle a waste, but not get around to
it for years, if ever. In order to enhance resource conservation and
recovery, more work on the technical and regulatory aspects of hazardous waste
recycling needs to be done.
image:
 291
MINING WASTES
Causes of the Problem
Mining wastes pose a significant environmental concern in Region VIII
because of their volume and the likely possibility of surface and groundwater
contamination. This contamination can result from the disposal of mine waste
material using common, least-cost methods.
Barriers to Solution
Since the passage of the Solid Waste Disposal Act Amendment of 1980, the
mining exemption has been a source of controversy in Region VIII. There is
general agreement that waste chemical products (such as pesticides) listed in
40 CFR 261.33(e) and solvents used at mines must be managed as regulated
hazardous wastes, because they are not unique to the mining industry. There
are several instances, however, of disagreement on the extent of other aspects
of this exemption. The Region VIII position is that only mill tailings, waste
rock or other wastes generated in the mining process are exempted. We have
regarded hazardous wastes generated from secondary processes, such as
upgrading the mined ore, as covered by RCRA. Kennecott Copper in Utah has
contested our position on this matter and has gone to EPA Headquarters for
clarification. Headquarters has initially upheld our position on a specific
electrotwinning process involved in Kennecott1s operation, but the matter is
under further review.
Implications for Agency Management
The regulation of mining wastes needs clarification by EPA. Headquarters
has conducted sampling of certain mining wastes to determine the extent of the
environmental problems involved. It would be useful for the Regions to see a
synopsis of the data and conclusions. Industry has asked questions about the
study which we could not discuss. We should also be involved in the next
stages of evaluation and policy-making.
image:
291
MINING WASTES
Causes of the Problem
Mining wastes pose a significant environmental concern in Region VIII
because of their volume and the likely possibility of surface and groundwater
contamination. This contamination can result from the disposal of mine waste
material using common, least-cost methods.
Barriers to Solution
Since the passage of the Solid Waste Disposal Act Amendment of 1980, the
mining exemption has been a source of controversy in Region VIII. There is
general agreement that waste chemical products (such as pesticides) listed in
40 CFR 261.33(e) and solvents used at mines must be managed as regulated
hazardous wastes, because they are not unique to the mining industry. There
are several instances, however, of disagreement on the extent of other aspects
of this exemption. The Region VIII position is that only mill tailings, waste
rock or other wastes generated in the mining process are exempted. We have
regarded hazardous wastes generated from secondary processes, such as
upgrading the mined ore, as covered by RCRA. Kennecott Copper in Utah has
contested our position on this matter and has gone to EPA Headquarters for
clarification. Headquarters has initially upheld our position on a specific
electrotwinning process involved in Kennecott1s operation, but the matter is
under further review.
Implications for Agency Management
The regulation of mining wastes needs clarification by EPA. Headquarters
has conducted sampling of certain mining wastes to determine the extent of the
environmental problems involved. It would be useful for the Regions to see a
synopsis of the data and conclusions. Industry has asked questions about the
study which we could not discuss. We should also be involved in the next
stages of evaluation and policy-making.
image:
 292
IMPLEMENTATION OF PRETREATMENT STANDARDS
Causes of the Problem
The RCRA hazardous waste regulations were issued with a reliance on the
implementation of an effective pretreatment program to prevent improper
disposal of hazardous wastes into public owned treatment works (POTWs). The
existing RCRA regulations exempt wastes which are discharged in conjunction
with domestic sewage (40 CFR 261.4(a)(l)(ii)). In the absence of a fully
enforced pretreatment program, some hazardous waste generators are using this
as a means to avoid proper handling of their wastes.
Barriers to Solution
The pretreatment program has been plagued with controversy,
misunderstanding, and resistance. Insufficient development and dissemination
of information as to the impact of hazardous wastes on the POTWs, their
sludges, and the streams into which they discharge, has lead to a general
questioning of the costs versus benefits of the pretreatment regulations.
This has been coupled with EPA's apparent inability to get out timely or
effective guidance and policy on the pretreatment program.
Implications for Agency Management
An effective hazardous waste regulatory program under RCRA is in part
dependent on an adequate pretreatment program. EPA needs to develop a more
urgent and thorough implementation of the pretreatment standards.
image:
292
IMPLEMENTATION OF PRETREATMENT STANDARDS
Causes of the Problem
The RCRA hazardous waste regulations were issued with a reliance on the
implementation of an effective pretreatment program to prevent improper
disposal of hazardous wastes into public owned treatment works (POTWs). The
existing RCRA regulations exempt wastes which are discharged in conjunction
with domestic sewage (40 CFR 261.4(a)(l)(ii)). In the absence of a fully
enforced pretreatment program, some hazardous waste generators are using this
as a means to avoid proper handling of their wastes.
Barriers to Solution
The pretreatment program has been plagued with controversy,
misunderstanding, and resistance. Insufficient development and dissemination
of information as to the impact of hazardous wastes on the POTWs, their
sludges, and the streams into which they discharge, has lead to a general
questioning of the costs versus benefits of the pretreatment regulations.
This has been coupled with EPA's apparent inability to get out timely or
effective guidance and policy on the pretreatment program.
Implications for Agency Management
An effective hazardous waste regulatory program under RCRA is in part
dependent on an adequate pretreatment program. EPA needs to develop a more
urgent and thorough implementation of the pretreatment standards.
image:
 29:
SITE-SPECIFIC PROBLEMS
Denver-Arapahoe Chemical. Haste Processing Facility
This was the only commercial site in the Region for a long time. It is
now closed for failure to meet the siting requirements under state law. The
facility has about 16,000 barrels of liquid waste in a disposal burial cell.
It also has three surface impoundments, one of which has leaked and been
ordered emptied. We have taken enforcement action against the facility on a
number of RCRA violations. It is located within the major metropolitan area
in the Region.
image:
29:
SITE-SPECIFIC PROBLEMS
Denver-Arapahoe Chemical. Haste Processing Facility
This was the only commercial site in the Region for a long time. It is
now closed for failure to meet the siting requirements under state law. The
facility has about 16,000 barrels of liquid waste in a disposal burial cell.
It also has three surface impoundments, one of which has leaked and been
ordered emptied. We have taken enforcement action against the facility on a
number of RCRA violations. It is located within the major metropolitan area
in the Region.
image:
 Attachment A-l
Prepared by:
EPA REGION VIII
5/10/83
Jon Mlnkoff
Waste Mgmt Branch
State Gen
CO
MT
NO
SD
UT
WY
Total
304
101
53
57
224
109
848
HAZARDOUS WASTE NOTIFICATION FIGURES*
SQG
175
29
49
21
26
5?
352
Trans
134
33
17
34
70
45
333
TSD
52
17
9
1
44
16
139
Non-IS
TSD
1
2
2
1
2
8
Fed
18
6
5
9
7
1
46
CIS
63
7
2
2
8
6
88
Withdrawals
NHW
205
32
24
110
52
80
503
XMT
95
39
9
4
83
44
274
RCY
94
14
31
34
3
35
211
TOT
457
92
66
150
146
1.65
1076
Valid
Notiflers
383
130
67
97
269
147
1093
*Note:
Gen = generators, SQG = small quantity generators, Trans = transporters, TSD = treatment, storage and disposal
facilities, Non-IS TSD = permit applicants not having interim status because of notifying after 8/18/80 or
filing Part A after 11/19/80, Fed = federal, Withdrawals = notlflers which have fully withdrawn from the system
for the reason indicated: CIS = closed, NHW = no hazardous waste, XMT = exempted from regulation (e.g.,
mining, particular wastes, etc.), RCY - recycling onsite or characteristic waste: exempt), TOT = total
withdrawals (does not include SQGs), Valid Notlfiers = active waste handlers still "in the system". These
figures are subject to the vicissitudes of daily forms processing.
Source: HWDMS
vO
image:
Attachment A-l
Prepared by:
EPA REGION VIII
5/10/83
Jon Mlnkoff
Waste Mgmt Branch
State Gen
CO
MT
NO
SD
UT
WY
Total
304
101
53
57
224
109
848
HAZARDOUS WASTE NOTIFICATION FIGURES*
SQG
175
29
49
21
26
5?
352
Trans
134
33
17
34
70
45
333
TSD
52
17
9
1
44
16
139
Non-IS
TSD
1
2
2
1
2
8
Fed
18
6
5
9
7
1
46
CIS
63
7
2
2
8
6
88
Withdrawals
NHW
205
32
24
110
52
80
503
XMT
95
39
9
4
83
44
274
RCY
94
14
31
34
3
35
211
TOT
457
92
66
150
146
1.65
1076
Valid
Notiflers
383
130
67
97
269
147
1093
*Note:
Gen = generators, SQG = small quantity generators, Trans = transporters, TSD = treatment, storage and disposal
facilities, Non-IS TSD = permit applicants not having interim status because of notifying after 8/18/80 or
filing Part A after 11/19/80, Fed = federal, Withdrawals = notlflers which have fully withdrawn from the system
for the reason indicated: CIS = closed, NHW = no hazardous waste, XMT = exempted from regulation (e.g.,
mining, particular wastes, etc.), RCY - recycling onsite or characteristic waste: exempt), TOT = total
withdrawals (does not include SQGs), Valid Notlfiers = active waste handlers still "in the system". These
figures are subject to the vicissitudes of daily forms processing.
Source: HWDMS
vO
image:
 295
Attachment A-2
Source: HWDMS 5/10/83
EPA REGION VIII
TREATMENT. STORAGE AND DISPOSAL FACILITIES*
# of Permit Treatment SI/ Open
Applicants or Storage Disposal UIC Incin Pet
52 28 20
17 3 13 -
9 271
1 1 -
44 18 20 1 1
16 3 13 - 1
Total 139 55 73 2 11
*Note: This chart shows the number of TSD facilities having the processes
indicated. Treatment or Storage = in tanks, containers 5/or piles only,
SI/Disposal = surface impoundments (storage or treatment ) &/or disposal by
landfill, land application, UIC or surface impoundment (facilities listed in
the Si/Disposal column often have simple storage or treatment as well, but are
not included in that column), UIC = underground injection control (the two UIC
facilities are also included under Si/Disposal), Incin = incineration (8 of
the incineration facilities also have and are included under Si/Disposal)
Open Pet = open detonation. These figures are not totally reliable due to
protective filings, inaccurate forms, incomplete data entry, etc.
Prepared by:
Jon Minkoff
Waste Management Branch
image:
295
Attachment A-2
Source: HWDMS 5/10/83
EPA REGION VIII
TREATMENT. STORAGE AND DISPOSAL FACILITIES*
# of Permit Treatment SI/ Open
Applicants or Storage Disposal UIC Incin Pet
52 28 20
17 3 13 -
9 271
1 1 -
44 18 20 1 1
16 3 13 - 1
Total 139 55 73 2 11
*Note: This chart shows the number of TSD facilities having the processes
indicated. Treatment or Storage = in tanks, containers 5/or piles only,
SI/Disposal = surface impoundments (storage or treatment ) &/or disposal by
landfill, land application, UIC or surface impoundment (facilities listed in
the Si/Disposal column often have simple storage or treatment as well, but are
not included in that column), UIC = underground injection control (the two UIC
facilities are also included under Si/Disposal), Incin = incineration (8 of
the incineration facilities also have and are included under Si/Disposal)
Open Pet = open detonation. These figures are not totally reliable due to
protective filings, inaccurate forms, incomplete data entry, etc.
Prepared by:
Jon Minkoff
Waste Management Branch
image:
 296
Source: HWDMS
Attachment A-3
5/10/83
Number of
Facilities
60
Number of Hazardous Waste
Treatment, Storage & Disposal Facilities
by Type of Process & State
50
40
30
20
10
52
28
17
44
26'
18
CO
MT
NO
SO
UT
16
13
WY State
Disposal; Treatment & storage surface
impoundments; Incineration; Open detonation
Storage in tanks, containers & piles;
Treatment in tanks
image:
296
Source: HWDMS
Attachment A-3
5/10/83
Number of
Facilities
60
Number of Hazardous Waste
Treatment, Storage & Disposal Facilities
by Type of Process & State
50
40
30
20
10
52
28
17
44
26'
18
CO
MT
NO
SO
UT
16
13
WY State
Disposal; Treatment & storage surface
impoundments; Incineration; Open detonation
Storage in tanks, containers & piles;
Treatment in tanks
image:
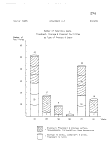 Sourcej Part A Permit Applications
Attachment A-4
5/10/83
= operating
X = not operating
NORTH
DAKOTA
SOUTH
DAKOTA
Commercial Hazardous Waste
Disposal Facilities
Denver-Arapahoe Chemical Haste Processing
Facility - Aurora, CO (not operating) !
Highway 36 Land Development Corporation '
- Last Chance, CO (not constructed)
U.S. Pollution Control, Inc. (Grassy
Mountain Facility) - Clive, UT
Jim's Water Service - Gillette, WY
(oil industry wastes only)
Big Dipper Enterprises, Inc.
- Gwinner, ND (not operating)
UTAH
COLORADO
!\J
image:
Sourcej Part A Permit Applications
Attachment A-4
5/10/83
= operating
X = not operating
NORTH
DAKOTA
SOUTH
DAKOTA
Commercial Hazardous Waste
Disposal Facilities
Denver-Arapahoe Chemical Haste Processing
Facility - Aurora, CO (not operating) !
Highway 36 Land Development Corporation '
- Last Chance, CO (not constructed)
U.S. Pollution Control, Inc. (Grassy
Mountain Facility) - Clive, UT
Jim's Water Service - Gillette, WY
(oil industry wastes only)
Big Dipper Enterprises, Inc.
- Gwinner, ND (not operating)
UTAH
COLORADO
!\J
image:
 298
c
T
c
<-
.£
It
image:
298
c
T
c
<-
.£
It
image:
 -17-
299
Attachment A-6
Selected RCRA Sites_with Significant
Groundwater Contamination Problems
There are a number of site-specific groundwater contamination problems in
the Region that are of concern due to the extent, nature and location of the
contamination. The following are four of the more noteworthy cases.
Union Pacific Railroad fJ.H. Baxter) - Laramie, WY
The facility has three surface impoundments. Preliminary data suggest they
are leaking, possibly in the groundwater table. The State of Wyoming has
serious concerns about the facility. We are reviewing our options under RCRA
and CERCLA. The company has announced that it intends to close the facility.
Rocky Mountain Arsenal— Commerce City, CO
Basin F on the Arsenal contains hazardous waste and is contaminating
groundwater. The Arsenal has been studying ways to ameliorate the groundwater
problem at the site. The problem is very complex. The Part B permit
application has been requested and received.
Husky Refinery - Cody, WY
The landfarm is leaching heavy metals into the shallow groundwater system and
eventually to the river.
Texaco Refinery - Casper, WY
Texaco operates a leaking chemical evaporation pond. The company is working
with EPA and the State of Wyoming to develop ameliorative actions and proper
closure.
Source: RCRA and CERCLA inspection reports and enforcement documents
Date: 5/10/33
image:
-17-
299
Attachment A-6
Selected RCRA Sites_with Significant
Groundwater Contamination Problems
There are a number of site-specific groundwater contamination problems in
the Region that are of concern due to the extent, nature and location of the
contamination. The following are four of the more noteworthy cases.
Union Pacific Railroad fJ.H. Baxter) - Laramie, WY
The facility has three surface impoundments. Preliminary data suggest they
are leaking, possibly in the groundwater table. The State of Wyoming has
serious concerns about the facility. We are reviewing our options under RCRA
and CERCLA. The company has announced that it intends to close the facility.
Rocky Mountain Arsenal— Commerce City, CO
Basin F on the Arsenal contains hazardous waste and is contaminating
groundwater. The Arsenal has been studying ways to ameliorate the groundwater
problem at the site. The problem is very complex. The Part B permit
application has been requested and received.
Husky Refinery - Cody, WY
The landfarm is leaching heavy metals into the shallow groundwater system and
eventually to the river.
Texaco Refinery - Casper, WY
Texaco operates a leaking chemical evaporation pond. The company is working
with EPA and the State of Wyoming to develop ameliorative actions and proper
closure.
Source: RCRA and CERCLA inspection reports and enforcement documents
Date: 5/10/33
image:
 -18-
Attachment A-7
300
011 Refineries and Associated Installations with TSD Facilities
State & Facility
Colorado
Conoco Refinery
Gary Refining
Montana
Conoco Refinery
Conoco Landfarm
Exxon Refinery
North Dakota
Amoco Refinery
Flying J, Inc.
Utah
(Westland Refinery)
Amoco Refinery
Amoco Remote Tank Farm
Chevron Refinery
Chevron Red Wash Unit
Ekotek
Golden Eagle Refinery
Husky Refinery
Phillips Refinery
Plateau Refinery
Wyoming
Amoco Refinery
Amoco Pipeline Tank Farm
Glenrock Refinery
Husky Refinery
Husky Refinery
Little America Refinery
Sinclair Refinery
Texaco Refinery
Wyoming Refining Co.
Location
Commerce City, CO
Fruita, CO
Billings, MT
Billings, MT
Billings, MT
Mandan, ND
Williston, ND
Salt Lake City, UT
Salt Lake City,
Salt Lake City,
Vernal, UT
Salt Lake City,
Woods Cross, UT
Salt Lake City,
Woods Cross, UT
Roosevelt, UT
Casper, WY
Casper, WY
Glenrock, WY
Cheyenne, WY
Cody, WY
Evansville, WY
Sinclair, WY
Casper, WY
Newcastle, WY
UT
UT
UT
UT
Source: HWDMS
Date: 5/10/83
image:
-18-
Attachment A-7
300
011 Refineries and Associated Installations with TSD Facilities
State & Facility
Colorado
Conoco Refinery
Gary Refining
Montana
Conoco Refinery
Conoco Landfarm
Exxon Refinery
North Dakota
Amoco Refinery
Flying J, Inc.
Utah
(Westland Refinery)
Amoco Refinery
Amoco Remote Tank Farm
Chevron Refinery
Chevron Red Wash Unit
Ekotek
Golden Eagle Refinery
Husky Refinery
Phillips Refinery
Plateau Refinery
Wyoming
Amoco Refinery
Amoco Pipeline Tank Farm
Glenrock Refinery
Husky Refinery
Husky Refinery
Little America Refinery
Sinclair Refinery
Texaco Refinery
Wyoming Refining Co.
Location
Commerce City, CO
Fruita, CO
Billings, MT
Billings, MT
Billings, MT
Mandan, ND
Williston, ND
Salt Lake City, UT
Salt Lake City,
Salt Lake City,
Vernal, UT
Salt Lake City,
Woods Cross, UT
Salt Lake City,
Woods Cross, UT
Roosevelt, UT
Casper, WY
Casper, WY
Glenrock, WY
Cheyenne, WY
Cody, WY
Evansville, WY
Sinclair, WY
Casper, WY
Newcastle, WY
UT
UT
UT
UT
Source: HWDMS
Date: 5/10/83
image:
 -19- 301
Attachment A-8
Hazardous Waste Recyclers Posing Significant Problems
The following cases illustrate the some of the main problems associated
with recyclers in Region VIII.
American Ecological Recycling Research Company (AERR Co.) - Arvada, CO
A civil complaint (under 7003 of RCRA) was initiated against AERR Co. in 1980
because the site posed an imminent and substantial threat to human health and
the environment due to leaking drums, fire hazards, and inadequate plans,
records and security. The Part B permit application for this facility was one
of the first to be requested, and it is still under review.
Micronutrients International - Erda, UT
This facility has waste piles containing emission control flue dust (waste
code K061) which are improperly managed, with the result that wind and water
erosion cause migration of the hazardous waste off-site. The imminent
bankruptcy and closure of the site makes matters more difficult.
Mountain Chemicals, Inc. - Golden, CO
An enforcement action was taken against this chemical recycler, which stores
large quantities of ignitable solvents in a residential area. The violations
included leaking drums, improper storage of ignitable liquids, and failure to
obtain the required sudden accident insurance. The Part B application for
Mountain Chemicals is currently under review.
Source: RCRA inspection reports and enforcement documents
Date: 5/10/83
image:
-19- 301
Attachment A-8
Hazardous Waste Recyclers Posing Significant Problems
The following cases illustrate the some of the main problems associated
with recyclers in Region VIII.
American Ecological Recycling Research Company (AERR Co.) - Arvada, CO
A civil complaint (under 7003 of RCRA) was initiated against AERR Co. in 1980
because the site posed an imminent and substantial threat to human health and
the environment due to leaking drums, fire hazards, and inadequate plans,
records and security. The Part B permit application for this facility was one
of the first to be requested, and it is still under review.
Micronutrients International - Erda, UT
This facility has waste piles containing emission control flue dust (waste
code K061) which are improperly managed, with the result that wind and water
erosion cause migration of the hazardous waste off-site. The imminent
bankruptcy and closure of the site makes matters more difficult.
Mountain Chemicals, Inc. - Golden, CO
An enforcement action was taken against this chemical recycler, which stores
large quantities of ignitable solvents in a residential area. The violations
included leaking drums, improper storage of ignitable liquids, and failure to
obtain the required sudden accident insurance. The Part B application for
Mountain Chemicals is currently under review.
Source: RCRA inspection reports and enforcement documents
Date: 5/10/83
image:
 VII.
Radi ati on Sectl on
Environmental Management Report
Page Nunber
Part I Overview of Status and Trends 304
Introductory Summary Paragraph
External Exposure Issue
Internal Exposure Issues
Part II Ranki ng of R egi cnal E nvi ronmental
Problems and Implications for Agency Management
308
Introductory Paragraph
A. Ranki ng of R ad i ol ogi cal P ro bl ens 308
1. Uncontrolled Radioactive Waste Sites
2. Uranium Mill Tailings Remedial Action
3. Indoor Radon Progeny
4. Radi oacti vity in Dri nki ng Water
5. Low-Level Radioactive Waste Disposal
6. High-Level Radioactive Waste Disposal
8. Implications of this Report 31 2
1 . CERCLA
2. UMTRAP
3. Indoor Radon Progeny
4. Rad i oacti vi ty i n W ater
5.' Low-Level Waste Disposal
6. High-Level Radioactive Waste
image:
VII.
Radi ati on Sectl on
Environmental Management Report
Page Nunber
Part I Overview of Status and Trends 304
Introductory Summary Paragraph
External Exposure Issue
Internal Exposure Issues
Part II Ranki ng of R egi cnal E nvi ronmental
Problems and Implications for Agency Management
308
Introductory Paragraph
A. Ranki ng of R ad i ol ogi cal P ro bl ens 308
1. Uncontrolled Radioactive Waste Sites
2. Uranium Mill Tailings Remedial Action
3. Indoor Radon Progeny
4. Radi oacti vity in Dri nki ng Water
5. Low-Level Radioactive Waste Disposal
6. High-Level Radioactive Waste Disposal
8. Implications of this Report 31 2
1 . CERCLA
2. UMTRAP
3. Indoor Radon Progeny
4. Rad i oacti vi ty i n W ater
5.' Low-Level Waste Disposal
6. High-Level Radioactive Waste
image:
 303
R adi ati on S ectj on (con ti nued}
Page Nunber
Attachment A: Radiation Problems and Issues 315
I. Uranium Industry
Inacti ve/Abandoned Urani un Mil 1 s
Acti ve Urani UP Mills
Special Concerns - 320
Uravan Mill
Edgemcnt Mill
Cotter Mill
Vitro Tailings Site
Urani un Minas
n. Radioacti vi ty in Ground Water 321
III. CERaA Actions 323
Denver Radiun Site
Monti cello, Utah
Colorado Vanadiun Sites
Uraniferous Lignite Mines
IV. Radioactive Waste Disposal 329
Low-Level Waste
High-Level Waste
V. Ncni oni zi ng Radi ati on . 330
High-Voltage Transmission lines
Rcdi of requency/Micro wa^s
VI. Emergency Res pons e P1 anni ng 331
Fort St. Vrain
Rocky Flats
VII. Indoor Radon Progency Issue 333
image:
303
R adi ati on S ectj on (con ti nued}
Page Nunber
Attachment A: Radiation Problems and Issues 315
I. Uranium Industry
Inacti ve/Abandoned Urani un Mil 1 s
Acti ve Urani UP Mills
Special Concerns - 320
Uravan Mill
Edgemcnt Mill
Cotter Mill
Vitro Tailings Site
Urani un Minas
n. Radioacti vi ty in Ground Water 321
III. CERaA Actions 323
Denver Radiun Site
Monti cello, Utah
Colorado Vanadiun Sites
Uraniferous Lignite Mines
IV. Radioactive Waste Disposal 329
Low-Level Waste
High-Level Waste
V. Ncni oni zi ng Radi ati on . 330
High-Voltage Transmission lines
Rcdi of requency/Micro wa^s
VI. Emergency Res pons e P1 anni ng 331
Fort St. Vrain
Rocky Flats
VII. Indoor Radon Progency Issue 333
image:
 VII.
RADIATION SECTION 7 (] A
REGION VIII ENVIRONMENTAL MANAGEMENT REPORT -*u H
Overview of Status and Trends
EPA's primary radiation role is to reduce unnecessary and
avoidable radiation doses from environmental sources. Although the
Agency has done some work in the area of discretionary sources where
individuals are selectively exposed, the primary thrust has been
with population exposure to ambient levels and avoidable increases
to those levels. Figure I shows that naturally occurring sources
are the major route. It is important to note that technological
enhancement of that route is the major concern in Region VIII, and
hence we feel one of the more important radiation interests of the
Agency. Some of the most significant reductions in environmental
radiation dose to the Region VIII population are expected to occur
occur during the next 5 to 10 years. Unfortunately, we also
anticipate a dramatic increase in dose to some portions of the
population. We explain these seemingly conflicting expectations in
the overview below.
External Exposure
Gamma rays are the radiation of interest with respect to
external exposure to the body. The altitude of the Rocky Mountain
Region as well as its mineralization result in elevated exposure
from natural cosmic and terrestrial sources. Exposures in Colorado- -
are typically two to three times those in seacoast states. Figure
II vividly depicts the national variation in background radiation,
and shows that the highest levels are in Region VIII. The
mineralization of this region gave birth to many mineral extraction
industries. The Rocky Mountain mineral corridor as depicted in
Figure III, provides visualization of the extent of this issue in
Region VIII. Mines and mills brought radioactive materials from
deep within the earth to the surface, where the resulting tailings
could be moved by water, wind, and man, and provide additional
sources of exposure to populations. The movement of contaminants
from uranium mills is now being addressed by EPA's standards under
the Uranium Mill Tailings Radiation Control Act and the Uranium Fuel
Cycle Regulations. Airborne migration from operational sources such
as coal fired power plants and phosphate operations are being
considered for control by regulations issued under authority of the
Clean Air Act Amendments of 1977. As a result of improved practices
which are to be required by these standards and regulations, the
external radiation dose to the population, especially in the near
vicinity of such operations, is expected to decline over the next
few years. The Regional Office is directly involved in certain
aspects of standards development, particularly in working groups
and steering committee interactions. Much work is needed at the
Regional level to ensure that the standard developments are
appropriate for the needs, that the EPA requirements are being met,
and that the regional issues are recognized and addressed.
image:
VII.
RADIATION SECTION 7 (] A
REGION VIII ENVIRONMENTAL MANAGEMENT REPORT -*u H
Overview of Status and Trends
EPA's primary radiation role is to reduce unnecessary and
avoidable radiation doses from environmental sources. Although the
Agency has done some work in the area of discretionary sources where
individuals are selectively exposed, the primary thrust has been
with population exposure to ambient levels and avoidable increases
to those levels. Figure I shows that naturally occurring sources
are the major route. It is important to note that technological
enhancement of that route is the major concern in Region VIII, and
hence we feel one of the more important radiation interests of the
Agency. Some of the most significant reductions in environmental
radiation dose to the Region VIII population are expected to occur
occur during the next 5 to 10 years. Unfortunately, we also
anticipate a dramatic increase in dose to some portions of the
population. We explain these seemingly conflicting expectations in
the overview below.
External Exposure
Gamma rays are the radiation of interest with respect to
external exposure to the body. The altitude of the Rocky Mountain
Region as well as its mineralization result in elevated exposure
from natural cosmic and terrestrial sources. Exposures in Colorado- -
are typically two to three times those in seacoast states. Figure
II vividly depicts the national variation in background radiation,
and shows that the highest levels are in Region VIII. The
mineralization of this region gave birth to many mineral extraction
industries. The Rocky Mountain mineral corridor as depicted in
Figure III, provides visualization of the extent of this issue in
Region VIII. Mines and mills brought radioactive materials from
deep within the earth to the surface, where the resulting tailings
could be moved by water, wind, and man, and provide additional
sources of exposure to populations. The movement of contaminants
from uranium mills is now being addressed by EPA's standards under
the Uranium Mill Tailings Radiation Control Act and the Uranium Fuel
Cycle Regulations. Airborne migration from operational sources such
as coal fired power plants and phosphate operations are being
considered for control by regulations issued under authority of the
Clean Air Act Amendments of 1977. As a result of improved practices
which are to be required by these standards and regulations, the
external radiation dose to the population, especially in the near
vicinity of such operations, is expected to decline over the next
few years. The Regional Office is directly involved in certain
aspects of standards development, particularly in working groups
and steering committee interactions. Much work is needed at the
Regional level to ensure that the standard developments are
appropriate for the needs, that the EPA requirements are being met,
and that the regional issues are recognized and addressed.
image:
 Estimated Exposure of U.S. Population
from Environmental'
and Discretionary Sources
18.8 Million
Person-Rems
per Year
Tobacco Products
Unknown
Contribution
Building Materials
Radon in Natural Gas,
Air Travel, etc.
1.3 Million
Person-Rems per Year
>. Radon
«. Decay
vfroducts
Unknown
Contribution
Environmental-
Sources
1.1 Million
Person-Rems
per Year
Unknown
Contribution
Estimated Health Effrcts
for Known Contributions
8.500 I—
0)
O-
o 4,250
E
3
2
Discretionary
Environmental I I
Total
Cancers
Fatal
Cancers
Birth
Defects
Sum of Known Contributions
is 21.2 Million Person-Rems per Year
O
Exposure Distribution and Health Effects from Ionizing Radiation
i pure 1
image:
Estimated Exposure of U.S. Population
from Environmental'
and Discretionary Sources
18.8 Million
Person-Rems
per Year
Tobacco Products
Unknown
Contribution
Building Materials
Radon in Natural Gas,
Air Travel, etc.
1.3 Million
Person-Rems per Year
>. Radon
«. Decay
vfroducts
Unknown
Contribution
Environmental-
Sources
1.1 Million
Person-Rems
per Year
Unknown
Contribution
Estimated Health Effrcts
for Known Contributions
8.500 I—
0)
O-
o 4,250
E
3
2
Discretionary
Environmental I I
Total
Cancers
Fatal
Cancers
Birth
Defects
Sum of Known Contributions
is 21.2 Million Person-Rems per Year
O
Exposure Distribution and Health Effects from Ionizing Radiation
i pure 1
image:
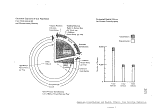 Figure II
COMBINED TERRESTLAI. and COSMIC RADIATION EXPOSURE by STATE
Millirenis Per Year
image:
Figure II
COMBINED TERRESTLAI. and COSMIC RADIATION EXPOSURE by STATE
Millirenis Per Year
image:
 MINERAL CORRIDOR
307
Rocky Mountain Mineral Corridor
Figure III
image:
MINERAL CORRIDOR
307
Rocky Mountain Mineral Corridor
Figure III
image:
 Internal Exposure
Radiation dose to the internal organs of the body, resulting
from ingested or inhaled radioactive material is of far greater
concern because the doses are usually much greater than external
doses and occur over longer periods, up to a lifetime. As with
external exposure, the primary Regional role is closely involved
with ensuring that these radiation doses will also decline as a
result of controls required by the standards and regulations noted
above. In addition, projects designed to remove radioactive
contaminants from drinking water will further reduce the population
dose. These internal dose reductions are expected to be far more
significant than the reduction in external dose.
Uranium in drinking water remains a widespread problem in
Region VIII. There are no regulations limiting uranium in drinking
water because a cost-effective removal process has not yet been
proven. Research in this area is proceeding. Another significant
concern with respect to future radiation protection lies with the
internal dose resulting from inhaled radioactive radon decay product
concentrations in the home. A popular and inexpensive conservation
measure used by homeowners that can increase these concentrations
is caulking. The resulting decreased ventilation rate exacerbates
the problem of elevated radon daughter levels. Since a person
generally spends more time in his home than elsewhere, the increased
risk of lung cancer associated with elevated radon progeny levels in
the home can be significant.
Part II. Ranking of Regional Environmental Problems and
Imp 1ications for Agency Management
Overviews of salient radiation medium issues are presented in
Attachment A. This section draws on the material in Attachment A to
provide a cursory discussion of a) the most significant radiological
problems in the Region, ranked in approximate order of severity, the
causes of these problems, and current and possible actions to
address them; and b) the current barriers that exist to solving the
problems and the implications for future Agency management.
A. Ranking of Radiological Problems
The most significant radiological problems are discussed here.
The issues ara ranked by health impact primarily, and political
implications secondarily.
image:
Internal Exposure
Radiation dose to the internal organs of the body, resulting
from ingested or inhaled radioactive material is of far greater
concern because the doses are usually much greater than external
doses and occur over longer periods, up to a lifetime. As with
external exposure, the primary Regional role is closely involved
with ensuring that these radiation doses will also decline as a
result of controls required by the standards and regulations noted
above. In addition, projects designed to remove radioactive
contaminants from drinking water will further reduce the population
dose. These internal dose reductions are expected to be far more
significant than the reduction in external dose.
Uranium in drinking water remains a widespread problem in
Region VIII. There are no regulations limiting uranium in drinking
water because a cost-effective removal process has not yet been
proven. Research in this area is proceeding. Another significant
concern with respect to future radiation protection lies with the
internal dose resulting from inhaled radioactive radon decay product
concentrations in the home. A popular and inexpensive conservation
measure used by homeowners that can increase these concentrations
is caulking. The resulting decreased ventilation rate exacerbates
the problem of elevated radon daughter levels. Since a person
generally spends more time in his home than elsewhere, the increased
risk of lung cancer associated with elevated radon progeny levels in
the home can be significant.
Part II. Ranking of Regional Environmental Problems and
Imp 1ications for Agency Management
Overviews of salient radiation medium issues are presented in
Attachment A. This section draws on the material in Attachment A to
provide a cursory discussion of a) the most significant radiological
problems in the Region, ranked in approximate order of severity, the
causes of these problems, and current and possible actions to
address them; and b) the current barriers that exist to solving the
problems and the implications for future Agency management.
A. Ranking of Radiological Problems
The most significant radiological problems are discussed here.
The issues ara ranked by health impact primarily, and political
implications secondarily.
image:
 1. Uncontrolled Radioactive Waste Sites 309
Mining and milling have been major contributors to the Rocky
Mountain Region economy throughout its history. Unfortunately,
uncontrolled mining and especially milling practices have left a
legacy of hazardous sites. Although it is common knowledge that
uranium and radium extraction circuits result in radioactive
tailings, many other milling operations such as those for vanadium,
phosphate, and fluorspar also produce tailings which are
radioactive. In Region VIII we are investigating about two dozen
abandoned sites and defining their radiological hazards. The
material has frequently been intentionally moved by contractors who
need fill material and by masons who value the sandy tails for their
fine qualities as aggregate in concrete and mortar. Additionally,
phosphate slag and ash from coal-fired power plants have reportedly
been used as fill or construction material. Since radioactivity is
not detectable without instruments, it is likely that the potential
hazards were neither known nor understood by the persons involved.
Through these processes, as well as by wind/water erosion and
leaching, the radioactive material is migrating to populated areas.
Hence, the piles may pose a hazard to people living many miles
away. The solution to this problem requires not only the
stabilization of the piles to insure that no more material leaves
the site, but also the cleanup of structures into which the
radioactive materials have been incorporated. In several cases the
only funding mechanism for the cleanup is the Superfund.
2. Uranium Mill Tailings Remedial Action
The Uranium Mill Tailings Radiation Control Act of 1978. ordered-
EPA. to set standards for the stabilization or removal of tailings at
24 inactive uranium milling operations around the country, 16 of
which are in Region VIII. The Act orders the Department of Energy
to perform the cleanups in cooperation with the affected states and
requires NRC to oversee the cleanup operations and insure compliance
with the EPA standards. DOE recently issued its Draft Environmental
Impact Statement (DEIS) for the first of the remedial action plans.
EPA VIII was asked by Region III and by Headquarters to provide
coranents on the Canonsburg DEIS. The plan preferred by DOE would
appear to provide environmental protection for only a few years.
DOE's aim was apparently to spend as little as possible on the
cleanup. In so doing, the benefit/cost ratio becomes unacceptably
low, in our opinion. Since so many of the UMTRAP sites are in
Region VIII, we must be especially concerned with the precedent DOE
sets in Pennsylvania. If their remedial action approach does not
change, we will have serious environmental and political problems at
many of the 17 sites here. In order to insure against this
situation, we are attending the public meetings concerning the sites
in Region VIII, cormrunicating informally with DOE, and providing
detailed, formal comments to DOE on their DEIS's and FEIS's. We
anticipate a very heavy work-load in the next year addressing these
sites.
image:
1. Uncontrolled Radioactive Waste Sites 309
Mining and milling have been major contributors to the Rocky
Mountain Region economy throughout its history. Unfortunately,
uncontrolled mining and especially milling practices have left a
legacy of hazardous sites. Although it is common knowledge that
uranium and radium extraction circuits result in radioactive
tailings, many other milling operations such as those for vanadium,
phosphate, and fluorspar also produce tailings which are
radioactive. In Region VIII we are investigating about two dozen
abandoned sites and defining their radiological hazards. The
material has frequently been intentionally moved by contractors who
need fill material and by masons who value the sandy tails for their
fine qualities as aggregate in concrete and mortar. Additionally,
phosphate slag and ash from coal-fired power plants have reportedly
been used as fill or construction material. Since radioactivity is
not detectable without instruments, it is likely that the potential
hazards were neither known nor understood by the persons involved.
Through these processes, as well as by wind/water erosion and
leaching, the radioactive material is migrating to populated areas.
Hence, the piles may pose a hazard to people living many miles
away. The solution to this problem requires not only the
stabilization of the piles to insure that no more material leaves
the site, but also the cleanup of structures into which the
radioactive materials have been incorporated. In several cases the
only funding mechanism for the cleanup is the Superfund.
2. Uranium Mill Tailings Remedial Action
The Uranium Mill Tailings Radiation Control Act of 1978. ordered-
EPA. to set standards for the stabilization or removal of tailings at
24 inactive uranium milling operations around the country, 16 of
which are in Region VIII. The Act orders the Department of Energy
to perform the cleanups in cooperation with the affected states and
requires NRC to oversee the cleanup operations and insure compliance
with the EPA standards. DOE recently issued its Draft Environmental
Impact Statement (DEIS) for the first of the remedial action plans.
EPA VIII was asked by Region III and by Headquarters to provide
coranents on the Canonsburg DEIS. The plan preferred by DOE would
appear to provide environmental protection for only a few years.
DOE's aim was apparently to spend as little as possible on the
cleanup. In so doing, the benefit/cost ratio becomes unacceptably
low, in our opinion. Since so many of the UMTRAP sites are in
Region VIII, we must be especially concerned with the precedent DOE
sets in Pennsylvania. If their remedial action approach does not
change, we will have serious environmental and political problems at
many of the 17 sites here. In order to insure against this
situation, we are attending the public meetings concerning the sites
in Region VIII, cormrunicating informally with DOE, and providing
detailed, formal comments to DOE on their DEIS's and FEIS's. We
anticipate a very heavy work-load in the next year addressing these
sites.
image:
 3. Indoor Radon Progeny
310
Radon, the gaseous decay product of radium, is released from
the soil everywhere, but at generally greater rates in the
mineralized Rocky Mountain region. When radon daughters are trapped
within a structure, the inhabitants' lifetime lung cancer risk
increases by about 1% for every .01 increase in Working Level, which
is a measure of the radon daughter concentration. As ventilation
rates decrease in response to government sponsored energy
conservation programs, the radon progeny concentrations will further
increase, exacerbating the problem. Figure XIV shows the routes of
radon entry into homes. EPA has estimated that decreasing the
average ventilation rate in U.S. homes by one-half could lead to an
increase of 10,000 to 20,000 lung cancer cases per year. This year
EPA concludes a study of radon progeny measurement techniques which
is being conducted in Butte, Montana. Although a follow-up study of
alternatives for lowering radon progeny concentrations in homes has
been proposed, no funding has been made available. The Regional
program is, however, providing limited technical support to a
Colorado Energy Research Institute study of indoor radon levels at a
few homes in the Denver area.
4. Radioactivity in Drinking Water
Due to the widespread existence of naturally occurring
radioactive minerals thoughout most of Region VIII, it is not
surprising that elevated levels of radioactivity also exist in a
number of domestic water supplies. The map in Figure III shows the
mineral corridor within Region VIII. The primary concern is with
ground water, since the water from these supplies has filtered
through the mineralized zones. The resulting concentrations of
radium and uranium are highly variable, and not predictable from one
location to the next. However, in a number of instances they exceed
EPA radium standards or uranium guidance considerations. It is
estimated that approximately 26% of the Colorado community water
supplies will exceed the above limits, South Dakota 14, Wyoming 4,
and Montana 4. Additionally, about 10 Indian water systems in
Region VIII have uranium concentrations exceeding the guidance
considerations. Since over 80% of the community water supplies in
Region VIII are small distributors utilizing ground water, it seems
likely that the number of water systems of concern will increase in
the future. This is because testing for many of these water
supplies has not yet been performed. From initial results though, it
has been estimated that for uranium concentrating alone, over 200
Colorado supplies and 400 Regional supplies could be affected.
image:
3. Indoor Radon Progeny
310
Radon, the gaseous decay product of radium, is released from
the soil everywhere, but at generally greater rates in the
mineralized Rocky Mountain region. When radon daughters are trapped
within a structure, the inhabitants' lifetime lung cancer risk
increases by about 1% for every .01 increase in Working Level, which
is a measure of the radon daughter concentration. As ventilation
rates decrease in response to government sponsored energy
conservation programs, the radon progeny concentrations will further
increase, exacerbating the problem. Figure XIV shows the routes of
radon entry into homes. EPA has estimated that decreasing the
average ventilation rate in U.S. homes by one-half could lead to an
increase of 10,000 to 20,000 lung cancer cases per year. This year
EPA concludes a study of radon progeny measurement techniques which
is being conducted in Butte, Montana. Although a follow-up study of
alternatives for lowering radon progeny concentrations in homes has
been proposed, no funding has been made available. The Regional
program is, however, providing limited technical support to a
Colorado Energy Research Institute study of indoor radon levels at a
few homes in the Denver area.
4. Radioactivity in Drinking Water
Due to the widespread existence of naturally occurring
radioactive minerals thoughout most of Region VIII, it is not
surprising that elevated levels of radioactivity also exist in a
number of domestic water supplies. The map in Figure III shows the
mineral corridor within Region VIII. The primary concern is with
ground water, since the water from these supplies has filtered
through the mineralized zones. The resulting concentrations of
radium and uranium are highly variable, and not predictable from one
location to the next. However, in a number of instances they exceed
EPA radium standards or uranium guidance considerations. It is
estimated that approximately 26% of the Colorado community water
supplies will exceed the above limits, South Dakota 14, Wyoming 4,
and Montana 4. Additionally, about 10 Indian water systems in
Region VIII have uranium concentrations exceeding the guidance
considerations. Since over 80% of the community water supplies in
Region VIII are small distributors utilizing ground water, it seems
likely that the number of water systems of concern will increase in
the future. This is because testing for many of these water
supplies has not yet been performed. From initial results though, it
has been estimated that for uranium concentrating alone, over 200
Colorado supplies and 400 Regional supplies could be affected.
image:
 5. Low-Level Radioactive Waste Disposal
311
Commercial low-level radioactive wastes have been disposed of
in shallow disoosal sites across the U.S. for many years. However,
most of the sites have closed due to environmental/public health
risks, political pressure, poor siting, poor management, site
filling, and a number of other factors. At the present time, only
one site {Hanford site at Rich land, WA) projects any confidence for
remaining open in the foreseeable future. During the last few
years, the states with active low-level commercial waste disposal
sites have become increasingly agitated with the reality of being
the hosts for the ever-increasing volume of the nation's low-level
wastes. Resulting state-originated curbs in volumes of waste
disposal, increased regulatory requirements, and non-renewal of
operating permits caused recognition of the need for a national
long-term waste management policy. In response to this need, the
Congress enacted legislation in December, 1980, which authorizes
regional compacts among states for the disposal of low-level
wastes. Under this concept, host (receiving) states can refuse
shipments from other non-compact states as of January 1, 1986. The
major problem today is that the compact concept is not well
organized, and may not provide economical disposal sites.
Meanwhile, the time remaining to design and construct adequate
disposal sites for the nation's needs grows increasingly short.
6. High-Level Radioactive Waste Disposal
High-level radioactive wastes are defined as being spent
nuclear fuel, and both solid and liquid wastes resulting from
reprocessing of irradiated reactor fuel. Although these wastes are
produced in small quantities, their proper management and disposal
are important because of the inherent hazards of the large amount of
radioactivity they contain. The wastes contain both fission
products and transuranics. These wastes have been accumulating in
the country for 37 years, but no final disposal sites for the wastes
are now available. To correct this, in December 1982, Federal
legislation was enacted which sets a timetable for DOE to develop
and operate a final disposal repository. One of the three areas
under consideration is the Paradox Basin in southeastern, Utah.
This consideration has been the cause of much controversy at both
the local and state levels.
image:
5. Low-Level Radioactive Waste Disposal
311
Commercial low-level radioactive wastes have been disposed of
in shallow disoosal sites across the U.S. for many years. However,
most of the sites have closed due to environmental/public health
risks, political pressure, poor siting, poor management, site
filling, and a number of other factors. At the present time, only
one site {Hanford site at Rich land, WA) projects any confidence for
remaining open in the foreseeable future. During the last few
years, the states with active low-level commercial waste disposal
sites have become increasingly agitated with the reality of being
the hosts for the ever-increasing volume of the nation's low-level
wastes. Resulting state-originated curbs in volumes of waste
disposal, increased regulatory requirements, and non-renewal of
operating permits caused recognition of the need for a national
long-term waste management policy. In response to this need, the
Congress enacted legislation in December, 1980, which authorizes
regional compacts among states for the disposal of low-level
wastes. Under this concept, host (receiving) states can refuse
shipments from other non-compact states as of January 1, 1986. The
major problem today is that the compact concept is not well
organized, and may not provide economical disposal sites.
Meanwhile, the time remaining to design and construct adequate
disposal sites for the nation's needs grows increasingly short.
6. High-Level Radioactive Waste Disposal
High-level radioactive wastes are defined as being spent
nuclear fuel, and both solid and liquid wastes resulting from
reprocessing of irradiated reactor fuel. Although these wastes are
produced in small quantities, their proper management and disposal
are important because of the inherent hazards of the large amount of
radioactivity they contain. The wastes contain both fission
products and transuranics. These wastes have been accumulating in
the country for 37 years, but no final disposal sites for the wastes
are now available. To correct this, in December 1982, Federal
legislation was enacted which sets a timetable for DOE to develop
and operate a final disposal repository. One of the three areas
under consideration is the Paradox Basin in southeastern, Utah.
This consideration has been the cause of much controversy at both
the local and state levels.
image:
 312
8. Implications of this Report
This section summarizes the barriers to resolution of the
issues noted above and indicates what assistance the Region may need
from Headquarters to resolve the problems.
1. CERCLA
(a) The principal barriers to the use of Superfund for
radiation-contaminated sites are:
(1) The systematic bias of the Hazard Ranking System (Mitre
Model) against radiation sites which are not in heavily
populated areas but which need to be addressed to stop the
intentional transport of radioactive material to populated
areas.
(2) Lack of guidance from Superfund on what constitutes an
adequate risk assessment for any particular site.
(3) Lack of a clear and unequivocal Superfund policy on the
clean-up of radiation sites. (We have been told by one
state that they do not want to "jump through hoops" for
CERCLA if HQ is deliberately trying to throw obstacles in
the path of their submission for a radiological cleanup.)
(b) The actions requested of Headquarters are:
(1) Modify the Hazard Ranking System to more equitably consider
situations such as those noted above,
(2) Develop a clear policy, subject to as little interpretation
as possible, concerning radiation sites,
(3) Develop a checklist with detailed examples of all documents
required for Superfund consideration of a site.
(4) Provide clear guidance to states on various issues pertinent
to their responsibility e.g. credits for past work, and
betterment of property following remedial action.
image:
312
8. Implications of this Report
This section summarizes the barriers to resolution of the
issues noted above and indicates what assistance the Region may need
from Headquarters to resolve the problems.
1. CERCLA
(a) The principal barriers to the use of Superfund for
radiation-contaminated sites are:
(1) The systematic bias of the Hazard Ranking System (Mitre
Model) against radiation sites which are not in heavily
populated areas but which need to be addressed to stop the
intentional transport of radioactive material to populated
areas.
(2) Lack of guidance from Superfund on what constitutes an
adequate risk assessment for any particular site.
(3) Lack of a clear and unequivocal Superfund policy on the
clean-up of radiation sites. (We have been told by one
state that they do not want to "jump through hoops" for
CERCLA if HQ is deliberately trying to throw obstacles in
the path of their submission for a radiological cleanup.)
(b) The actions requested of Headquarters are:
(1) Modify the Hazard Ranking System to more equitably consider
situations such as those noted above,
(2) Develop a clear policy, subject to as little interpretation
as possible, concerning radiation sites,
(3) Develop a checklist with detailed examples of all documents
required for Superfund consideration of a site.
(4) Provide clear guidance to states on various issues pertinent
to their responsibility e.g. credits for past work, and
betterment of property following remedial action.
image:
 2. UMTRAP 3 1 3
(a) The principal barriers associated with effective cleanup and
disposal at these sites are:
(1) DOE's choice among remedial action alternatives
(2) The eqiovocal nature of the EPA inactive site standards
with respect to RCRA requirements.
(b) The actions requested of Headquarters are:
(1) Provision of technical support in evaluating unusual
remedial action proposals.
(2) Unequivocal interpretation of the reference in the
inactive sites standards to EPA's Hazardous Waste
Management System.
3. Indoor Radon Progeny
(a) The principal barriers to determination of a cost-effective
control technology for radon and radon daughters are:
(1) Lack of lead authority and appropriate funding within EPA to
conduct studies on control alternatives (such authority for
EPA was suggested by the General Accounting Office in 1980
in its report "Indoor Air Pollution: A Growing Health
Peril").
(2) OMB's decision to remove responsibility for such work from....
ORP and to place it in ORD while simultaneously cutting the
associated FTE's from ORP and not providing them to ORD -
in effect cancelling the program.
(b) The action requested of the Headquarters is to work toward
obtaining lead authority and appropriate funding for indoor air
pollution problems.
4. Radioactivity in Water
(a) The major barriers to providing remedial action on drinking
water supplies are:
(1) The states need to catch up on their backlog of water supply
analyses in order to determine what supplies are out of
compliance with requirements.
(2) Appropriate procedures are needed for disposal of
radioactive sludges and other wastes associated with removal
treatment processes.
(3) No guidance is available for agricultural and livestock
water use.
10
image:
2. UMTRAP 3 1 3
(a) The principal barriers associated with effective cleanup and
disposal at these sites are:
(1) DOE's choice among remedial action alternatives
(2) The eqiovocal nature of the EPA inactive site standards
with respect to RCRA requirements.
(b) The actions requested of Headquarters are:
(1) Provision of technical support in evaluating unusual
remedial action proposals.
(2) Unequivocal interpretation of the reference in the
inactive sites standards to EPA's Hazardous Waste
Management System.
3. Indoor Radon Progeny
(a) The principal barriers to determination of a cost-effective
control technology for radon and radon daughters are:
(1) Lack of lead authority and appropriate funding within EPA to
conduct studies on control alternatives (such authority for
EPA was suggested by the General Accounting Office in 1980
in its report "Indoor Air Pollution: A Growing Health
Peril").
(2) OMB's decision to remove responsibility for such work from....
ORP and to place it in ORD while simultaneously cutting the
associated FTE's from ORP and not providing them to ORD -
in effect cancelling the program.
(b) The action requested of the Headquarters is to work toward
obtaining lead authority and appropriate funding for indoor air
pollution problems.
4. Radioactivity in Water
(a) The major barriers to providing remedial action on drinking
water supplies are:
(1) The states need to catch up on their backlog of water supply
analyses in order to determine what supplies are out of
compliance with requirements.
(2) Appropriate procedures are needed for disposal of
radioactive sludges and other wastes associated with removal
treatment processes.
(3) No guidance is available for agricultural and livestock
water use.
10
image:
 314
(b) The actions requested of Headquarters include:
Provision of guidance or standards for uraniurrm in drinking water
and guidance for radioactivity in livestock and agricultural water
uses.
5. Low-Level Waste Disposal
(a) The principal barriers to obtaining timely and satifactory
waste disposal sites are:
(1) The states within the interstate compacts need to form
viable agreements that address requirements for siting,
operation, and final disposal.
(2) States need to commit to an interstate compact group, and
the groups need to consider consolidation in order to form
economically feasible operations.
(3) The entire concept must move forward in order to meet
Congressionally mandated deadlines.
(b) The actions requested of Headquarters are:
(1) Development and promulgation of EPA low-level waste disposal
standards.
(2) Encourage the states and interstate compact groups to move
ahead aggressively in forming viable agreements and
developing disposal sites within time constraints.
6. High-Level Radioactive Waste
(a) The major barriers to developing a waste repository include:
(1) State resistance to having a site within their boundaries
(2) Inconclusive testing
(3) Short time table in designating appropriate sites
(b) Actions requested of Headquarters at this time are limited to
provision of timely information regarding technical issues and
schedules changes.
11
image:
314
(b) The actions requested of Headquarters include:
Provision of guidance or standards for uraniurrm in drinking water
and guidance for radioactivity in livestock and agricultural water
uses.
5. Low-Level Waste Disposal
(a) The principal barriers to obtaining timely and satifactory
waste disposal sites are:
(1) The states within the interstate compacts need to form
viable agreements that address requirements for siting,
operation, and final disposal.
(2) States need to commit to an interstate compact group, and
the groups need to consider consolidation in order to form
economically feasible operations.
(3) The entire concept must move forward in order to meet
Congressionally mandated deadlines.
(b) The actions requested of Headquarters are:
(1) Development and promulgation of EPA low-level waste disposal
standards.
(2) Encourage the states and interstate compact groups to move
ahead aggressively in forming viable agreements and
developing disposal sites within time constraints.
6. High-Level Radioactive Waste
(a) The major barriers to developing a waste repository include:
(1) State resistance to having a site within their boundaries
(2) Inconclusive testing
(3) Short time table in designating appropriate sites
(b) Actions requested of Headquarters at this time are limited to
provision of timely information regarding technical issues and
schedules changes.
11
image:
 ATTACHMENT A: MEDIUM-BY-MEDIUM OVERVIEWS. , •? i c
I. URANIUM INDUSTRY
Inactive/Abandoned Uranium Mills
In November 1978 the Uranium Mill Tailings Radiation Control
Act (UMTRCA) became law. In the Act, Congress ordered EPA to
develop standards for the decommissioning of 25 inactive uranium
mill sites and contaminated properties in the vicinity of each. The
law was designed to manage the health risks associated with uranium
mill tailings, which pose a greater long term ingestion hazard than
high level waste from nuclear reactors (see Figure IV). The
Department of Energy is tasked by UMTRCA to perform the cleanup
operations, and the Nuclear Regulatory Commission is required to
oversee the cleanup efforts and insure that the EPA standards are
met.
EPA published its standards for the 26 sites in January,
1983. DOE published an EIS for the first cleanup in November,
1982. Cleanup of all the sites is expected to cost $300 - 400
million. Sixteen of the 25 sites are within Region VIII as shown in
Figure V. The Region VIII office is reviewing the EIS's for each
cleanup and providing technical advice when necessary. It is hoped
that within 7 years every one of the 26 sites will have been
decommissioned.
Active Uranium Mills
The Uranium Hill Tailings Radiation Control Act also specified
that EPA develop standards to protect the public health and safety
from hazards associated with tailings at active sites (Figure VI).
EPA proposed those standards in April of 1983. These standards set
limits on emissions of radiation and hazardous materials from active
and decommissioned facilities in order to prevent the spread of
contamination (Figure VII). For years, a number of tailings
impoundments were designed to leak as a means to discharge excess
water. Contaminated aquifers have been the result. The "active
mill tailings standards," will insure that such design is not used
in the future.
The active site standards will also help insure that the
decommissioning of currently licensed facilities is done
appropriately. NRC has yet to preside over the decommissioning of a
uranium mill. These standards will provide guidance to NRC as it
addresses the many mills which may close permanently due to the
currently depressed market for uranium.
The active site standards may also be used to delineate cleanup
criteria for aquifers and lands which have become contaminated as a
result of accidents or leakage at currently licensed mills.
12
image:
ATTACHMENT A: MEDIUM-BY-MEDIUM OVERVIEWS. , •? i c
I. URANIUM INDUSTRY
Inactive/Abandoned Uranium Mills
In November 1978 the Uranium Mill Tailings Radiation Control
Act (UMTRCA) became law. In the Act, Congress ordered EPA to
develop standards for the decommissioning of 25 inactive uranium
mill sites and contaminated properties in the vicinity of each. The
law was designed to manage the health risks associated with uranium
mill tailings, which pose a greater long term ingestion hazard than
high level waste from nuclear reactors (see Figure IV). The
Department of Energy is tasked by UMTRCA to perform the cleanup
operations, and the Nuclear Regulatory Commission is required to
oversee the cleanup efforts and insure that the EPA standards are
met.
EPA published its standards for the 26 sites in January,
1983. DOE published an EIS for the first cleanup in November,
1982. Cleanup of all the sites is expected to cost $300 - 400
million. Sixteen of the 25 sites are within Region VIII as shown in
Figure V. The Region VIII office is reviewing the EIS's for each
cleanup and providing technical advice when necessary. It is hoped
that within 7 years every one of the 26 sites will have been
decommissioned.
Active Uranium Mills
The Uranium Hill Tailings Radiation Control Act also specified
that EPA develop standards to protect the public health and safety
from hazards associated with tailings at active sites (Figure VI).
EPA proposed those standards in April of 1983. These standards set
limits on emissions of radiation and hazardous materials from active
and decommissioned facilities in order to prevent the spread of
contamination (Figure VII). For years, a number of tailings
impoundments were designed to leak as a means to discharge excess
water. Contaminated aquifers have been the result. The "active
mill tailings standards," will insure that such design is not used
in the future.
The active site standards will also help insure that the
decommissioning of currently licensed facilities is done
appropriately. NRC has yet to preside over the decommissioning of a
uranium mill. These standards will provide guidance to NRC as it
addresses the many mills which may close permanently due to the
currently depressed market for uranium.
The active site standards may also be used to delineate cleanup
criteria for aquifers and lands which have become contaminated as a
result of accidents or leakage at currently licensed mills.
12
image:
 316
H
t—i
O
i-i
X
c
c-1
2
O
•z.
M
Compari
ison of Toxicity of High Level Wastes and Uranium Mill Tailings
Figure IV
High Level Wastes
Mill Tailings
STORAGE TIME (YEARS)
13
image:
316
H
t—i
O
i-i
X
c
c-1
2
O
•z.
M
Compari
ison of Toxicity of High Level Wastes and Uranium Mill Tailings
Figure IV
High Level Wastes
Mill Tailings
STORAGE TIME (YEARS)
13
image:
 Figure V
LOCATION - UMTRAP SITES
©BELFIELD
BOWMAN
CONVERSE
0
RIVERTON
(2)
GRAND JCT.
,,. »GUNNISON
N*irTA»*SUCKROCK(2i
ftDURANGO
MEXICAN HAT |»
AMBROSIA
LAKE
image:
Figure V
LOCATION - UMTRAP SITES
©BELFIELD
BOWMAN
CONVERSE
0
RIVERTON
(2)
GRAND JCT.
,,. »GUNNISON
N*irTA»*SUCKROCK(2i
ftDURANGO
MEXICAN HAT |»
AMBROSIA
LAKE
image:
 .'.WYOMING MINERAL
j
s
BEAR CREEK URANIUM
/ UCP-G«S H,LLS
EXXON f—
-^-r^tTfo /s/iycctf/si
• -4- PATHFINDER-SHIRLEY BASIN
PETRO70MICS
UNITED NUCLEAR-
-X
CONOCO-PIONEER
SOLUTION ENGINEERING \
WYOMING
U.S. STEEL-
NIAGARA MOHAWK
URANIUM RESOURCES-CONOCO-FRAMCO
URANIUM RESOURCES
MOBIL OIL
• Conventional mills
A Solution mining operations
H Byproducts (rom phosphoric acid mills
Y Heap leaching dumps, tailings, or copper dumps
• Recovered (rom phosphoric acid producud Irimi
phosphate rock mined in the USA,
the uranium is returned to the USA.
Figure VI i
U.S. Uranium Processing Plants: Operating as of January 1. 1981
OJ
QO
image:
.'.WYOMING MINERAL
j
s
BEAR CREEK URANIUM
/ UCP-G«S H,LLS
EXXON f—
-^-r^tTfo /s/iycctf/si
• -4- PATHFINDER-SHIRLEY BASIN
PETRO70MICS
UNITED NUCLEAR-
-X
CONOCO-PIONEER
SOLUTION ENGINEERING \
WYOMING
U.S. STEEL-
NIAGARA MOHAWK
URANIUM RESOURCES-CONOCO-FRAMCO
URANIUM RESOURCES
MOBIL OIL
• Conventional mills
A Solution mining operations
H Byproducts (rom phosphoric acid mills
Y Heap leaching dumps, tailings, or copper dumps
• Recovered (rom phosphoric acid producud Irimi
phosphate rock mined in the USA,
the uranium is returned to the USA.
Figure VI i
U.S. Uranium Processing Plants: Operating as of January 1. 1981
OJ
QO
image:
 Mine &
Mill
MI lAoioAcnvi litmus or ntiuAti CONCHN i«t
at oeon m IMFOIIMICI
InQ DtuCHIlKS Of '"«!>. I) • JJI(U.
Environmental Pathways fpr Mine and Mill Effluents
image:
Mine &
Mill
MI lAoioAcnvi litmus or ntiuAti CONCHN i«t
at oeon m IMFOIIMICI
InQ DtuCHIlKS Of '"«!>. I) • JJI(U.
Environmental Pathways fpr Mine and Mill Effluents
image:
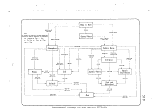 Special Concerns 320
Uravan Mill, Uravan, Colorado
EPA's Uranium Fuel Cycle Standards (40CFR19Q) set limits on the
dose an individual in the general public may receive due to the
uranium fuel cycle facility operations. Uranium milling operations
are a part of the fuel cycle. Studies have shown that the only mill
in the nation which does not comply with these standards is Union
Carbide's Uravan operation. The Regional Radiation Program is
working with the Colorado Department of Health in evaluating
tailings management plans which, when implemented, would limit the
exposure to the general public.
Edgemont Mill, Edgemont, South Dakota
The Edgemont Mill, though not operating, has an active NRC
license. TVA, the owners, plan to decommission the mill in the next
few years. EPA Region VIII found major flaws in the decommissioning
plan approved by the NRC, and has discussed options for resolution
with EPA HQ, NRC, and the office of Senator Abdnor of South Dakota.
The offsite cleanup has been assured by passage of a recent bill,
introduced by Senator Abdnor, which includes the Edgemont offsite
remedial actions under the UMTRCA program managed by DOE.
Cotter Mill, Canon City, Colorado
The Cotter Corporation mill near Canon City, Colorado, has long
been suspected of contaminating the aquifer beneath the Lincoln Park-
residential area with leachate from the its tailings ponds. Because
ground water studies are time consuming, difficult, and subject to
interpretation, the allegations against Cotter have not been
proven. EPA is currently sponsoring a detailed study of existing
data from the Cotter environs to narrow future investigations to the
most productive avenues. Region VIII has been assisted by the
Colorado Department of Health in our investigations.
Vitro Uranium Mill Tailings Site, Salt Lake City
The Vitro tailings site is an abandoned uranium milling
operation located in Salt Lake City. Contamination by the tailings
extends to the surrounding area and dwellings. The Vitro site is
one of the high priority remedial action sites under DOE's Uranium
Mill Tailings Remedial Action Program. The Department of Energy
would like to stabilize the pile in place. However, this would
limit the usefulness of the land to the Central Valley Water
Reclamation Facility Board which owns the land and proposes to
expand its treatment facilities onto the site by means of an
already- awarded EPA grant. The Region VIII Radiation Program has
discussed the options with DOE and the Central Valley authorities
and reviewed and commented on DOE's draft EIS for the cleanup of the
Vitro site which was released in February, 1983.
17
image:
Special Concerns 320
Uravan Mill, Uravan, Colorado
EPA's Uranium Fuel Cycle Standards (40CFR19Q) set limits on the
dose an individual in the general public may receive due to the
uranium fuel cycle facility operations. Uranium milling operations
are a part of the fuel cycle. Studies have shown that the only mill
in the nation which does not comply with these standards is Union
Carbide's Uravan operation. The Regional Radiation Program is
working with the Colorado Department of Health in evaluating
tailings management plans which, when implemented, would limit the
exposure to the general public.
Edgemont Mill, Edgemont, South Dakota
The Edgemont Mill, though not operating, has an active NRC
license. TVA, the owners, plan to decommission the mill in the next
few years. EPA Region VIII found major flaws in the decommissioning
plan approved by the NRC, and has discussed options for resolution
with EPA HQ, NRC, and the office of Senator Abdnor of South Dakota.
The offsite cleanup has been assured by passage of a recent bill,
introduced by Senator Abdnor, which includes the Edgemont offsite
remedial actions under the UMTRCA program managed by DOE.
Cotter Mill, Canon City, Colorado
The Cotter Corporation mill near Canon City, Colorado, has long
been suspected of contaminating the aquifer beneath the Lincoln Park-
residential area with leachate from the its tailings ponds. Because
ground water studies are time consuming, difficult, and subject to
interpretation, the allegations against Cotter have not been
proven. EPA is currently sponsoring a detailed study of existing
data from the Cotter environs to narrow future investigations to the
most productive avenues. Region VIII has been assisted by the
Colorado Department of Health in our investigations.
Vitro Uranium Mill Tailings Site, Salt Lake City
The Vitro tailings site is an abandoned uranium milling
operation located in Salt Lake City. Contamination by the tailings
extends to the surrounding area and dwellings. The Vitro site is
one of the high priority remedial action sites under DOE's Uranium
Mill Tailings Remedial Action Program. The Department of Energy
would like to stabilize the pile in place. However, this would
limit the usefulness of the land to the Central Valley Water
Reclamation Facility Board which owns the land and proposes to
expand its treatment facilities onto the site by means of an
already- awarded EPA grant. The Region VIII Radiation Program has
discussed the options with DOE and the Central Valley authorities
and reviewed and commented on DOE's draft EIS for the cleanup of the
Vitro site which was released in February, 1983.
17
image:
 321
Uranium Mines
NRC doesn't have authority for regulation of uranium mining, so
that responsibility is left to the states. This is a major issue in
Wyoming, and has become even more pronounced now because of the
depressed mining industry and resulting closure of mines. For some
time, the state has recognized the importance of mine site
preoperational monitoring and adequate decommissioning and
reclamation requirements. Accordingly, the state has developed
monitoring, control and reclamation requirements that are designed
to minimize impacts and preserve natural resources for future uses.
There is some evidence that other states have reviewed Wyoming's
lead and are interested in implementing similar controls. A recent
problem, however, is associated with mine closures from a
financially strapped industry. Many of these mines were
inadequately developed and no resources were set aside for adequate
reclamation. Additionally, the mining companies are reluctant to
admit that they will have no future interest in the mines. These
circumstances have placed the state in the difficult position of
balancing industry needs with environmental concerns.
II. Radioactivity in Ground Water
It appears that naturally occuring radioactivity in ground water is
an important issue in South Dakota, Wyoming, Colorado, and parts of
Montana, although only Colorado has detailed monitoring records.
Compliance with the requirements of the EPA Interim Primary Drinking
Water Standards is the highest priority, but a number of other
concerns exist with respect to concentrations of uranium (for which
neither standards nor guidance exist), and with respect to other
uses of water (including livestock, agriculture, and wildlife
uses). In most cases the issue involves avoidance of naturally
occurring, but elevated, radioactivity levels, but in other cases
the issue involves what we term "technologically enhanced levels of
naturally occurring radioactivity". In some of these cases (such as
the Midland, SD and North Table Mountain/Ralston Creek drinking
water supplies) interagency cooperation has brought about
encouraging resolutions. In other cases, the water suplies still
await innovative resolution and/or guidance. The attached Figure
VIII shows a typical range of elevated uranium and radium
concentrations in drinking water supplies for the most affected
states in the Region. Although sketchy (due to incomplete sampling)
the chart can be used as an indicator of the type and level of
concern within the states. It is fairly evident that much more work
is needed, and that EPA Region VIII involvement is instrumental.
18
image:
321
Uranium Mines
NRC doesn't have authority for regulation of uranium mining, so
that responsibility is left to the states. This is a major issue in
Wyoming, and has become even more pronounced now because of the
depressed mining industry and resulting closure of mines. For some
time, the state has recognized the importance of mine site
preoperational monitoring and adequate decommissioning and
reclamation requirements. Accordingly, the state has developed
monitoring, control and reclamation requirements that are designed
to minimize impacts and preserve natural resources for future uses.
There is some evidence that other states have reviewed Wyoming's
lead and are interested in implementing similar controls. A recent
problem, however, is associated with mine closures from a
financially strapped industry. Many of these mines were
inadequately developed and no resources were set aside for adequate
reclamation. Additionally, the mining companies are reluctant to
admit that they will have no future interest in the mines. These
circumstances have placed the state in the difficult position of
balancing industry needs with environmental concerns.
II. Radioactivity in Ground Water
It appears that naturally occuring radioactivity in ground water is
an important issue in South Dakota, Wyoming, Colorado, and parts of
Montana, although only Colorado has detailed monitoring records.
Compliance with the requirements of the EPA Interim Primary Drinking
Water Standards is the highest priority, but a number of other
concerns exist with respect to concentrations of uranium (for which
neither standards nor guidance exist), and with respect to other
uses of water (including livestock, agriculture, and wildlife
uses). In most cases the issue involves avoidance of naturally
occurring, but elevated, radioactivity levels, but in other cases
the issue involves what we term "technologically enhanced levels of
naturally occurring radioactivity". In some of these cases (such as
the Midland, SD and North Table Mountain/Ralston Creek drinking
water supplies) interagency cooperation has brought about
encouraging resolutions. In other cases, the water suplies still
await innovative resolution and/or guidance. The attached Figure
VIII shows a typical range of elevated uranium and radium
concentrations in drinking water supplies for the most affected
states in the Region. Although sketchy (due to incomplete sampling)
the chart can be used as an indicator of the type and level of
concern within the states. It is fairly evident that much more work
is needed, and that EPA Region VIII involvement is instrumental.
18
image:
 WYOMING
MONTANA
SOUTH DAKOTA
COLORADO
INDIAN RES.
UaUioucl J v j ty in Sulocted WaLef but>|>lji:» jn Kegion VI II
J-1'in»re VIII
liim Rock HuLterite Colony
i. C
Atkins Tlr. Park
S,and Coulee
llumboit
Wr/777T7777m
Hartford
TYPICAL HIGH RANGE CONCENTRATIONS in REGION VIII WATER SUPPLIES
O.
Radium
Ra MCL (2) USAG Consideration
y/TT/m "afford
ssmsnimm^
77T777777777/////////////]
wrmmu /////////////,i
V7////////////////M
2ZZZZ7222Zi2ZZZZZZIZZZZZ3
ND
10
20
30 AO 50
RADIOACTIVITY (pCi/1)
80
90
100
150
image:
WYOMING
MONTANA
SOUTH DAKOTA
COLORADO
INDIAN RES.
UaUioucl J v j ty in Sulocted WaLef but>|>lji:» jn Kegion VI II
J-1'in»re VIII
liim Rock HuLterite Colony
i. C
Atkins Tlr. Park
S,and Coulee
llumboit
Wr/777T7777m
Hartford
TYPICAL HIGH RANGE CONCENTRATIONS in REGION VIII WATER SUPPLIES
O.
Radium
Ra MCL (2) USAG Consideration
y/TT/m "afford
ssmsnimm^
77T777777777/////////////]
wrmmu /////////////,i
V7////////////////M
2ZZZZ7222Zi2ZZZZZZIZZZZZ3
ND
10
20
30 AO 50
RADIOACTIVITY (pCi/1)
80
90
100
150
image:
 III. CERCLA ACTIONS
323
Under the authority of the Comprehensive Environmental
Response, Compensation, and Liability Act of 1980, twelve
uncontrolled radioactive hazardous waste sites have been identified
in Region VIII. The attached map of many of the CERCLA
investigation sites (Figure IX) shows that the sites are
concentrated in Colorado, with several other sites located in Utah,
North Dakota, and South Dakota. All of the sites are associated
with past generations of mining, milling or refining of radioactive
material. In some cases the ore was processed for the radioactivity
content (uranium or radium), and in others (such as vanadium
production) the radioactivity was an unwanted contaminant. In all
cases, the radiation issue is the result of technologically enhanced
naturally occuring radioactivity remaining in the waste materials.
The waste material is subject to further degradation, and is a
source of radiation exposure to the public.
Denver Radium Site
The CERCLA National Priorties List published on December 30,
1982, includes the Denver Radium Site among its 418 listings. This
means that the Denver Radium Site is eligible for consideration of
expenditure from the CERCLA Superfund resources for site
investigation, cleanup, and disposal purposes. Figure X shows the
locations of radium wastes which are undergoing investigation.
These include business locations, open land, and streets and
alleys. The primary health risk comes from exposure to gamma
radiation and to inhalation of radon gas decay products. The health
risk involves both existing and potential radiation exposures.
The Denver Radium Site is the result of poorly understood
health risks, and many years of neglect. The issue started in the
early 1900s when radium was highly touted as a panacea for ill
health. During that time, a number of ore processing and product
fabrication facilities sprang up with little regard for the
voluminous wastes generated (Figure XI), or the facilities
contaminated. Although the operations have long since terminated,
the radium, with a half-life of 1620 years, is still as hazardous
today as when it was originally refined.
Under a cooperative agreement with EPA, the Colorado Department
of Health has developed seventeen individual site engineering
assessments and remedial action plans. Additionally, they have
prepared a report for all the streets and alleys, and a general
summary report which describes the remedial action work performed
previously. Another report which evaluates final disposal site
alternatives was recently completed. At this time, CDH and EPA are
undertaking another cooperative agreement to finish the assesments,
and perform a feasibility study. Meanwhile the Regional Office is
developing a. health risk analysis, and preparing for corrective
action work.
20
image:
III. CERCLA ACTIONS
323
Under the authority of the Comprehensive Environmental
Response, Compensation, and Liability Act of 1980, twelve
uncontrolled radioactive hazardous waste sites have been identified
in Region VIII. The attached map of many of the CERCLA
investigation sites (Figure IX) shows that the sites are
concentrated in Colorado, with several other sites located in Utah,
North Dakota, and South Dakota. All of the sites are associated
with past generations of mining, milling or refining of radioactive
material. In some cases the ore was processed for the radioactivity
content (uranium or radium), and in others (such as vanadium
production) the radioactivity was an unwanted contaminant. In all
cases, the radiation issue is the result of technologically enhanced
naturally occuring radioactivity remaining in the waste materials.
The waste material is subject to further degradation, and is a
source of radiation exposure to the public.
Denver Radium Site
The CERCLA National Priorties List published on December 30,
1982, includes the Denver Radium Site among its 418 listings. This
means that the Denver Radium Site is eligible for consideration of
expenditure from the CERCLA Superfund resources for site
investigation, cleanup, and disposal purposes. Figure X shows the
locations of radium wastes which are undergoing investigation.
These include business locations, open land, and streets and
alleys. The primary health risk comes from exposure to gamma
radiation and to inhalation of radon gas decay products. The health
risk involves both existing and potential radiation exposures.
The Denver Radium Site is the result of poorly understood
health risks, and many years of neglect. The issue started in the
early 1900s when radium was highly touted as a panacea for ill
health. During that time, a number of ore processing and product
fabrication facilities sprang up with little regard for the
voluminous wastes generated (Figure XI), or the facilities
contaminated. Although the operations have long since terminated,
the radium, with a half-life of 1620 years, is still as hazardous
today as when it was originally refined.
Under a cooperative agreement with EPA, the Colorado Department
of Health has developed seventeen individual site engineering
assessments and remedial action plans. Additionally, they have
prepared a report for all the streets and alleys, and a general
summary report which describes the remedial action work performed
previously. Another report which evaluates final disposal site
alternatives was recently completed. At this time, CDH and EPA are
undertaking another cooperative agreement to finish the assesments,
and perform a feasibility study. Meanwhile the Regional Office is
developing a. health risk analysis, and preparing for corrective
action work.
20
image:
 Figure IX CERCLA INVESTIGATION SITES
324
INFORMATION
1. Denver Radium site, included in National Priority List.
2. Hendricks Mill, active.
3. Jamestown Mining District, inactive.
4. Loma vanadium site, inactive.
5. Gateway vanadium site, inactive.
6. Monticello vanadium tailings use.
7. Inactive tailings site, still to be assessed.
8. Sawpit vanadium site, inactive.
9. Placerville vanadium site, inactive
10.Vanadium mill, inactive.
11.Abandoned uraniferous lignite mines, Bel field/Bowman, ND.
12.Abandoned uraniferous lignite mines, Cave Hills, SD.
image:
Figure IX CERCLA INVESTIGATION SITES
324
INFORMATION
1. Denver Radium site, included in National Priority List.
2. Hendricks Mill, active.
3. Jamestown Mining District, inactive.
4. Loma vanadium site, inactive.
5. Gateway vanadium site, inactive.
6. Monticello vanadium tailings use.
7. Inactive tailings site, still to be assessed.
8. Sawpit vanadium site, inactive.
9. Placerville vanadium site, inactive
10.Vanadium mill, inactive.
11.Abandoned uraniferous lignite mines, Bel field/Bowman, ND.
12.Abandoned uraniferous lignite mines, Cave Hills, SD.
image:
 N>
CO
I—1
o
m
rt
po
cj
H
PI
ro
-~i
rt U3 CJ CO :
O rt o rt
OJ
CD
<<
c
O.
fD C J> -"• 3> _i.
O- 3 < 3 < INI
cr CD to fD o
no 3
ur —' ~h c/) —t> AJ
fD <-f -i rt -i
a o
co a
O
n rt
BJ
n>
rt
rt
ID
O 5>
3 <
-u en
c rt
a- 3"
rt
3: o
' O
rt
^: UD i
ft) rt i
—i. ,
O 3="
?B
P'
s: -<
<'-'0~*'"nrn-<c:i--'?3-x3<ooh--coooji(ji^)^orv)i-icu ot--ac
^r^,1^2 o=>rocwojrtra=rrt — oow^oaa.o-^ar
oiOfDOCjCn-J-'. rOQ.'^O-JOojOQ.Ocri-'-jOrtC-'. • |X5 u>
w000)3-sc-t/r<uDcxA-uic:<nrtcQ. -•• *» ex •-> fD • UD— •
- . -j- — •
3 re rt co --. -< cr
CO
rt
O
in
o.
o
fD
-o
(D
o
o
1/1
CO
rt
12°
cu
i O-
o
o
GO
rt
Of CD
01 I
rt -J.
ir-a
(D
3
-n
o
rt rt — • co
c: 0)0
n
3 on H-.
3 rt
3 O
PJ £=
co
O
J>
~Q <
fi> a>
r-t ±3
(T)
— ' -P> go IN) O O 1
UD— • o »/>?-• ui o i:
oo n> • (- 12 aT
0 rn 3 rt o i— ac XD a:m(^^
' *» ° ' wo. a:ctnmS-i^cL
fD
o
o
o
o
o
r-t
n»
o
r~
m
en
m
a
o
K)
cn
PJ
a
image:
N>
CO
I—1
o
m
rt
po
cj
H
PI
ro
-~i
rt U3 CJ CO :
O rt o rt
OJ
CD
<<
c
O.
fD C J> -"• 3> _i.
O- 3 < 3 < INI
cr CD to fD o
no 3
ur —' ~h c/) —t> AJ
fD <-f -i rt -i
a o
co a
O
n rt
BJ
n>
rt
rt
ID
O 5>
3 <
-u en
c rt
a- 3"
rt
3: o
' O
rt
^: UD i
ft) rt i
—i. ,
O 3="
?B
P'
s: -<
<'-'0~*'"nrn-<c:i--'?3-x3<ooh--coooji(ji^)^orv)i-icu ot--ac
^r^,1^2 o=>rocwojrtra=rrt — oow^oaa.o-^ar
oiOfDOCjCn-J-'. rOQ.'^O-JOojOQ.Ocri-'-jOrtC-'. • |X5 u>
w000)3-sc-t/r<uDcxA-uic:<nrtcQ. -•• *» ex •-> fD • UD— •
- . -j- — •
3 re rt co --. -< cr
CO
rt
O
in
o.
o
fD
-o
(D
o
o
1/1
CO
rt
12°
cu
i O-
o
o
GO
rt
Of CD
01 I
rt -J.
ir-a
(D
3
-n
o
rt rt — • co
c: 0)0
n
3 on H-.
3 rt
3 O
PJ £=
co
O
J>
~Q <
fi> a>
r-t ±3
(T)
— ' -P> go IN) O O 1
UD— • o »/>?-• ui o i:
oo n> • (- 12 aT
0 rn 3 rt o i— ac XD a:m(^^
' *» ° ' wo. a:ctnmS-i^cL
fD
o
o
o
o
o
r-t
n»
o
r~
m
en
m
a
o
K)
cn
PJ
a
image:
 FIGURE XI
waste Volumes At
Denver Radium Sites
WASTE VOLUME
THOUSANDS OF CUBIC YARDS
326
CREATIVE ILLUKLHATIOS
SOEINSON BRICK & TILE
1000 H. LOUISIAHA
DU WALD STEEL
IJTT'L HOUSE OF PAHCAKES
B S C METALS
G & L GRANITE
SHATTUCX CHEMICAL
SUDD IKVESTXEKT
1285 S. SASTA FE
SDCKY KTS SESEAECH
RUBT HILL PARK
ALLIED CHEHICAL
image:
FIGURE XI
waste Volumes At
Denver Radium Sites
WASTE VOLUME
THOUSANDS OF CUBIC YARDS
326
CREATIVE ILLUKLHATIOS
SOEINSON BRICK & TILE
1000 H. LOUISIAHA
DU WALD STEEL
IJTT'L HOUSE OF PAHCAKES
B S C METALS
G & L GRANITE
SHATTUCX CHEMICAL
SUDD IKVESTXEKT
1285 S. SASTA FE
SDCKY KTS SESEAECH
RUBT HILL PARK
ALLIED CHEHICAL
image:
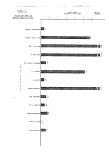 327
Monticello, Utah
Monti cello is the site of two structures which were constructed
with radioactive tailings from a nearby uranium mill. In February
1982, Region VIII submitted a request to EPA headquarters for
planned removal operation at the two locations. The request was
denied by the HQ Superfund office despite the fact that the elevated
radon and radon progeny concentrations in the structures present a
serious health risk to those who live and work there as shown in
Figure XII. Additional attempts to secure a CERLA-funded cleanup
have been unsuccessful, but the Regional Office continues to pursue
a solution to the problem. Most recently, an increase in the hazard
ranking model score required to place a site on the National
Priority List, has once again removed Monti cello from consideration
for a CERCLA funded cleanup.
Colorado Vanadium Sites
Eleven sites from North Dakota to southern Utah are the
subjects of this group of investigations shown in Figure IX. All
are related to mining/milling operations, most of which are now
inactive. At the Western Slope sites vanadium and uranium were
milled, leaving large radioactive tailings piles which are now
suffering wind and water erosion. More important, however, is the
fact that tailings from these unstabilized piles have been
intentionally removed by people who valued the tails as fine sandy
fill or building materials, but who were presumably unaware of their
radioactive nature. Once incorporated in a structure or used as
fill beneath or next to the foundation of a building, the tails can
increase the radon and radon progeny levels in the structure.
Elevated radon progeny concentrations have been correlated with an
increased risk of lung cancer in inhabitants of buildings so
contaminated. Although investigations have been performed at most
of these sites, some studies await the spring of 1983.
The Hendricks Mill, in Boulder, Colorado, was the site of a
fluorspar milling operation which began in 1936 and continued at
about 100 tons/day under various owners until 1974. The fluorspar
milling ceased in 1974 when a massive cave-in at the Burlington Mine
in the Jamestown mining district cut off the ore supply to the
mill. The radioactive fluorspar tailings, and some radium mill
tailings brought to the Hendricks site in 1970, make the Hendricks
impoundment moderately radioactive. Although the tails which are in
the impoundment are secure, there was a breach in the impoundment at
one time and apparently a break in the slurry pipeline, both of
which allowed the tailings to flow beyond the impoundment. Those
tailings are visible outside of the impoundment, and although they
do not appear to pose any serious threat to the environment, good
practice dictates that they should be returned to the impoundment.
24
image:
327
Monticello, Utah
Monti cello is the site of two structures which were constructed
with radioactive tailings from a nearby uranium mill. In February
1982, Region VIII submitted a request to EPA headquarters for
planned removal operation at the two locations. The request was
denied by the HQ Superfund office despite the fact that the elevated
radon and radon progeny concentrations in the structures present a
serious health risk to those who live and work there as shown in
Figure XII. Additional attempts to secure a CERLA-funded cleanup
have been unsuccessful, but the Regional Office continues to pursue
a solution to the problem. Most recently, an increase in the hazard
ranking model score required to place a site on the National
Priority List, has once again removed Monti cello from consideration
for a CERCLA funded cleanup.
Colorado Vanadium Sites
Eleven sites from North Dakota to southern Utah are the
subjects of this group of investigations shown in Figure IX. All
are related to mining/milling operations, most of which are now
inactive. At the Western Slope sites vanadium and uranium were
milled, leaving large radioactive tailings piles which are now
suffering wind and water erosion. More important, however, is the
fact that tailings from these unstabilized piles have been
intentionally removed by people who valued the tails as fine sandy
fill or building materials, but who were presumably unaware of their
radioactive nature. Once incorporated in a structure or used as
fill beneath or next to the foundation of a building, the tails can
increase the radon and radon progeny levels in the structure.
Elevated radon progeny concentrations have been correlated with an
increased risk of lung cancer in inhabitants of buildings so
contaminated. Although investigations have been performed at most
of these sites, some studies await the spring of 1983.
The Hendricks Mill, in Boulder, Colorado, was the site of a
fluorspar milling operation which began in 1936 and continued at
about 100 tons/day under various owners until 1974. The fluorspar
milling ceased in 1974 when a massive cave-in at the Burlington Mine
in the Jamestown mining district cut off the ore supply to the
mill. The radioactive fluorspar tailings, and some radium mill
tailings brought to the Hendricks site in 1970, make the Hendricks
impoundment moderately radioactive. Although the tails which are in
the impoundment are secure, there was a breach in the impoundment at
one time and apparently a break in the slurry pipeline, both of
which allowed the tailings to flow beyond the impoundment. Those
tailings are visible outside of the impoundment, and although they
do not appear to pose any serious threat to the environment, good
practice dictates that they should be returned to the impoundment.
24
image:
 Figure XII MONTICELLO. UT RADIOACTIVE TAILINGS ISSUE
(mR/h)
NJ
Ul
VVi-i J
0.3
0.2 '
n i „
u * -i
0.08 _
0.05-
0.02
****
.-******
ir****
"i
4****
', •.
<*•))"'
:/t-*>
.J-JL,.A.Jt,
. ii *k *V>»
S * '-• « >
v'1 *»^l^l-
rv^i
•''•;: ; 3f
"' ' » ?
1 ,
ll
^
r***********
:******!
****•
t'^i I'V'* '
«v, -t V'/o
)'• . '' .''^ . "i
ivfti
***C*I
• i •'
' & * $ $
fii
****4
0.3
.0.2
0.1
0.08
0.05
0.02
OVERALL
AVERAGE
MAIN FLOOR'
AVERAGE
BUILDING
AVERAGE
E
Annual Avg. Radon
Progeny Conc.(WL) '
••EPA Standards 1
set at 0.02 (WL) i
i
Gamma Exp. Rate i
(mR/h) i
••EPA Standards ',
set at 0.02 (mR/h),
RESIDENCE
BUSINESS
ro
image:
Figure XII MONTICELLO. UT RADIOACTIVE TAILINGS ISSUE
(mR/h)
NJ
Ul
VVi-i J
0.3
0.2 '
n i „
u * -i
0.08 _
0.05-
0.02
****
.-******
ir****
"i
4****
', •.
<*•))"'
:/t-*>
.J-JL,.A.Jt,
. ii *k *V>»
S * '-• « >
v'1 *»^l^l-
rv^i
•''•;: ; 3f
"' ' » ?
1 ,
ll
^
r***********
:******!
****•
t'^i I'V'* '
«v, -t V'/o
)'• . '' .''^ . "i
ivfti
***C*I
• i •'
' & * $ $
fii
****4
0.3
.0.2
0.1
0.08
0.05
0.02
OVERALL
AVERAGE
MAIN FLOOR'
AVERAGE
BUILDING
AVERAGE
E
Annual Avg. Radon
Progeny Conc.(WL) '
••EPA Standards 1
set at 0.02 (WL) i
i
Gamma Exp. Rate i
(mR/h) i
••EPA Standards ',
set at 0.02 (mR/h),
RESIDENCE
BUSINESS
ro
image:
 329
Uranlferous Lignite Mines
In extreme southwest North Dakota and northwest South Dakota
there are approximately a dozen abandoned lignite (low-grade coal)
mines which produced relatively high-grade uranium ore during the
late 50s1 and early 60s1. These strip mines vary in size from a few
city blocks to rather large surface disruptions approaching a mile
or so in length. The ore was purchased under government contract
after an ashing process in either the mine pits or at separate
rotary kiln facilities. Upon termination of the government
contracts, the mining and ashing ceased, and the sites were
abandoned with essentaially no reclamation. Several large
corporations were involved. Under the Uranium Mill Tailings
Remedial Action Control Act of 1978, DOE accepted two rotary kiln
sites for remedial action, but rejected the mine sites. EPA Region
VIII participated in a pilot project cleanup of one small mine site
under the direction of various NO state agencies, and funding by the
U.S. Office of Surface Mines. However, a number of larger mines
still need site assessment, and remedial action consideration. Of
highest priority are those sites where ashing occurred in the pits.
At some of these sites offsite contamination is evident, past
episodes of livestock molybdenosis have been documented, and concern
for public exposure and continued degradation persists. The EPA
Regional Office expects to provide continued monitoring equipment
and technical assistance as resources permit.
Radioactive Waste Disposal
Low-Level Waste
Since the December, 1980, Congressionally-enacted legislation
authorizing regional compacts for disposal of low-level wastes, the
states have divided into interstate compact groups. In Region VIII,
the states have divided into four different compacts, with one of
the states negotiating with more than one compact group. The State
of Colorado produces by far the largest quantity of wastes (as shown
by the following table), and has taken a DOE-financed lead for
finalizing the Rocky Mountain Compact. Since most of the other
states within the Region have not chosen to affiliate with the Rocky
Mountain Compact, the leads for compact negotiations involving the
other states are outside Region VIII. Accordingly, we do not have
as much information on the status and direction of those
negotiations. This means that we will need to maintain more direct
involvement with the individual states in order to ensure that a
comprehensive waste management policy for Region VIII is
maintained. Our current primary concern is with the apparent lack
of committment on the part of some states, to form timely and
economically feasible compacts. At this time, it appears that the
states' main interests are in minimizing their role and liability.
EPA Region VIII is also concerned with the timely development of EPA
low-level waste standards which will affect Regional waste
management policy, but these unfortunately are a low priority in
standards development.
26
image:
329
Uranlferous Lignite Mines
In extreme southwest North Dakota and northwest South Dakota
there are approximately a dozen abandoned lignite (low-grade coal)
mines which produced relatively high-grade uranium ore during the
late 50s1 and early 60s1. These strip mines vary in size from a few
city blocks to rather large surface disruptions approaching a mile
or so in length. The ore was purchased under government contract
after an ashing process in either the mine pits or at separate
rotary kiln facilities. Upon termination of the government
contracts, the mining and ashing ceased, and the sites were
abandoned with essentaially no reclamation. Several large
corporations were involved. Under the Uranium Mill Tailings
Remedial Action Control Act of 1978, DOE accepted two rotary kiln
sites for remedial action, but rejected the mine sites. EPA Region
VIII participated in a pilot project cleanup of one small mine site
under the direction of various NO state agencies, and funding by the
U.S. Office of Surface Mines. However, a number of larger mines
still need site assessment, and remedial action consideration. Of
highest priority are those sites where ashing occurred in the pits.
At some of these sites offsite contamination is evident, past
episodes of livestock molybdenosis have been documented, and concern
for public exposure and continued degradation persists. The EPA
Regional Office expects to provide continued monitoring equipment
and technical assistance as resources permit.
Radioactive Waste Disposal
Low-Level Waste
Since the December, 1980, Congressionally-enacted legislation
authorizing regional compacts for disposal of low-level wastes, the
states have divided into interstate compact groups. In Region VIII,
the states have divided into four different compacts, with one of
the states negotiating with more than one compact group. The State
of Colorado produces by far the largest quantity of wastes (as shown
by the following table), and has taken a DOE-financed lead for
finalizing the Rocky Mountain Compact. Since most of the other
states within the Region have not chosen to affiliate with the Rocky
Mountain Compact, the leads for compact negotiations involving the
other states are outside Region VIII. Accordingly, we do not have
as much information on the status and direction of those
negotiations. This means that we will need to maintain more direct
involvement with the individual states in order to ensure that a
comprehensive waste management policy for Region VIII is
maintained. Our current primary concern is with the apparent lack
of committment on the part of some states, to form timely and
economically feasible compacts. At this time, it appears that the
states' main interests are in minimizing their role and liability.
EPA Region VIII is also concerned with the timely development of EPA
low-level waste standards which will affect Regional waste
management policy, but these unfortunately are a low priority in
standards development.
26
image:
 High-level Waste
330
Another radioactive waste disposal issue is high-level waste.
Military high-level and transuranic wastes are the sole
responsibility of the federal government, and they are temporarily
stored at federal facilities. As it looks now, these wastes will be
solidified and disposed of at the Carlsbad, NM Waste Isolation Pilot
Project site. Spent fuel assemblies from commercial nuclear power
plants are currently kept in rapidly-filling storage pools at the
plant site. Part of the reason for the storage pools nearing
capicity is the federal policy of not reprocessing spent fuel for
Plutonium non-proliferation reasons. Although Region VIII is not
impacted by the shortage of storage space, one of the prime areas
under review for a waste disposal repository is located in Utah.
This site is under consideration for inclusion in a list of five
candidates from which the best site will be selected in 1985, with
construction beginning about 1990. As might be expected, the site
has generated considerable controversy which is expected to increase
dramatically as the Congressionally-mandated dates draw nearer.
Low Level Radioactive Waste Volumes & Interstate Compacts
State Name
North Dakota*
South Dakota
Montana
Wvoming
Utah
Colorado
Volume (annual
4
1
6
400
2022
24584
Compact
Midwest
Midwest
Northwest
Rocky Mtn.
Northwest
Rocky Mtn.
Alternate Compact
North West
* The North Dakota Legislative Assembly recently defeated a bill for
entering the Midwest Compact. Waste disposal plans are uncertain.
Total National Volume = 151,540 m3 annually which includes commercial,
nuclear power, medical, industrial, government, and military wastes.
V. Nonionizing Radiations (NIR)
Forms of nonionizing radiation that are familiar to most of us
are visible light, infrared radiation from a heat lamp, radio
frequency radiation used in the transmission of AM and FM radio and
VHF and UHF television, microwaves used to heat food or as
communications carriers, and the electric and magnetic fields
associated with power sources like high voltage transmission lines.
The Radiation Programs Office routinely receives inquiries
concerning the bioeffects of nonionizing radiation associated with
radio and TV transmission towers and with high voltage transmission
lines (HVTL's).
27
image:
High-level Waste
330
Another radioactive waste disposal issue is high-level waste.
Military high-level and transuranic wastes are the sole
responsibility of the federal government, and they are temporarily
stored at federal facilities. As it looks now, these wastes will be
solidified and disposed of at the Carlsbad, NM Waste Isolation Pilot
Project site. Spent fuel assemblies from commercial nuclear power
plants are currently kept in rapidly-filling storage pools at the
plant site. Part of the reason for the storage pools nearing
capicity is the federal policy of not reprocessing spent fuel for
Plutonium non-proliferation reasons. Although Region VIII is not
impacted by the shortage of storage space, one of the prime areas
under review for a waste disposal repository is located in Utah.
This site is under consideration for inclusion in a list of five
candidates from which the best site will be selected in 1985, with
construction beginning about 1990. As might be expected, the site
has generated considerable controversy which is expected to increase
dramatically as the Congressionally-mandated dates draw nearer.
Low Level Radioactive Waste Volumes & Interstate Compacts
State Name
North Dakota*
South Dakota
Montana
Wvoming
Utah
Colorado
Volume (annual
4
1
6
400
2022
24584
Compact
Midwest
Midwest
Northwest
Rocky Mtn.
Northwest
Rocky Mtn.
Alternate Compact
North West
* The North Dakota Legislative Assembly recently defeated a bill for
entering the Midwest Compact. Waste disposal plans are uncertain.
Total National Volume = 151,540 m3 annually which includes commercial,
nuclear power, medical, industrial, government, and military wastes.
V. Nonionizing Radiations (NIR)
Forms of nonionizing radiation that are familiar to most of us
are visible light, infrared radiation from a heat lamp, radio
frequency radiation used in the transmission of AM and FM radio and
VHF and UHF television, microwaves used to heat food or as
communications carriers, and the electric and magnetic fields
associated with power sources like high voltage transmission lines.
The Radiation Programs Office routinely receives inquiries
concerning the bioeffects of nonionizing radiation associated with
radio and TV transmission towers and with high voltage transmission
lines (HVTL's).
27
image:
 331
High Voltage Transmission Lines
We have prepared a form letter discussing the hazards
associated with HVTL's - primarily relating to electric shock - and
distribute this letter with two supporting documents in response to
inquires. With respect to hazards associated with NIR near radio
and TV transmission towers, EPA is currently developing guidance on
the maximum allowable ambient NIR levels in the appropriate
frequency range. It is anticipated that the FCC will use this
guidance when it considers applications for new transmission
licenses. This guidance is supported not only by consumers but also
by industry which prefers uniform federal guidance to a
proliferation of local regulations.
Radiofrequency/Microwaves
One situation in Region VIII which deserves attention is the
Lookout Mountain "antenna farm" just west of Denver. The NIR
exposure levels there are significantly elevated with respect to
average levels in the nation. To illustrate this point, 99.4£ of
the U.S. population is exposed to luW/cm^ NIR or less.
Measurements taken on Lookout Mountain in 1978 were up to
approximately 19uW/cm^ and new antennae have been added to the
"farm" since then. Levels such as these result in interference with
electrical equipment such as stereos, but whether they adversely
effect human biological systems directly has not yet been
established.
VI. Emergency Response Planning
Fort St. Vrain
Following the accident at the Three Mile Island nuclear plant,
President Carter ordered that a radiological emergency response plan
(RERP) be developed for every commercial nuclear plant. Typically
the RERP is prepared by the state and utility, and federal agencies,
chaired by the Federal Emergency Management Agency, review, comment,
and approve of the plan. EPA has specific responsibilities in these
plan reviews, and participates in an umpiring role in the annual
exercise and critque of the RERP. The Ft. St. Vrain nuclear
generating plant now has an approved RERP. An update of the plan is
expected in the near future. EPA will participate in the evaluation.
28
image:
331
High Voltage Transmission Lines
We have prepared a form letter discussing the hazards
associated with HVTL's - primarily relating to electric shock - and
distribute this letter with two supporting documents in response to
inquires. With respect to hazards associated with NIR near radio
and TV transmission towers, EPA is currently developing guidance on
the maximum allowable ambient NIR levels in the appropriate
frequency range. It is anticipated that the FCC will use this
guidance when it considers applications for new transmission
licenses. This guidance is supported not only by consumers but also
by industry which prefers uniform federal guidance to a
proliferation of local regulations.
Radiofrequency/Microwaves
One situation in Region VIII which deserves attention is the
Lookout Mountain "antenna farm" just west of Denver. The NIR
exposure levels there are significantly elevated with respect to
average levels in the nation. To illustrate this point, 99.4£ of
the U.S. population is exposed to luW/cm^ NIR or less.
Measurements taken on Lookout Mountain in 1978 were up to
approximately 19uW/cm^ and new antennae have been added to the
"farm" since then. Levels such as these result in interference with
electrical equipment such as stereos, but whether they adversely
effect human biological systems directly has not yet been
established.
VI. Emergency Response Planning
Fort St. Vrain
Following the accident at the Three Mile Island nuclear plant,
President Carter ordered that a radiological emergency response plan
(RERP) be developed for every commercial nuclear plant. Typically
the RERP is prepared by the state and utility, and federal agencies,
chaired by the Federal Emergency Management Agency, review, comment,
and approve of the plan. EPA has specific responsibilities in these
plan reviews, and participates in an umpiring role in the annual
exercise and critque of the RERP. The Ft. St. Vrain nuclear
generating plant now has an approved RERP. An update of the plan is
expected in the near future. EPA will participate in the evaluation.
28
image:
 f\i
ro
E
>
LU
n3
OJ
O
c
o
o.
o
OJ
co
cr>
CU
a>
o o
o o
*-i to
CXJ
S
rrl
C r—
>• 4->
•!-> UU
O o
<i_ o;
60
d
• H
c
RJ
—I
P-.
60
OJ
C
M
c
0
-H
t>n
image:
f\i
ro
E
>
LU
n3
OJ
O
c
o
o.
o
OJ
co
cr>
CU
a>
o o
o o
*-i to
CXJ
S
rrl
C r—
>• 4->
•!-> UU
O o
<i_ o;
60
d
• H
c
RJ
—I
P-.
60
OJ
C
M
c
0
-H
t>n
image:
 333
Rocky Flats
The Rocky Flats Nuclear Weapons Plant located just northwest of
Denver developed an RERP which has been reviewed by the State of
Colorado. Federal agencies, including EPA, have umpired one of the
exercises of the Rocky Flats plan. In addition the EPA Region VIII
Radiation Programs Office, at the request of the Colorado Department
of Health, is participating in the assessment of the Rocky Flats.
"maximum credible accident" on which the RERP is based.
Figure XIII indicates the proximity of facilities along
Colorado Rocky Mountain front range, and the relative location of
Denver and surrounding towns.
VII. Indoor Radon Progeny
Several areas in the nation experience elevated levels of radon
gas exhaled from soils. These are typically mineralized areas such
as the Rocky Mountain Region. When radon is released to the
atmosphere, it is immediately diluted to inconsequential
concentrations by the ambient air and especially by breezes. Radon
which finds its way into homes, however, becomes trapped and decays
to further radioactive species which can accumulate to levels that
are associated with significantly increased lung cancer risk (Figure
XIV). Energy conservation measures which reduce ventilation rates
also increase the radon daughter concentrations in homes. In 1978
the Montana Department of Health and Environmental Sciences
discovered elevated radon daughter levels which exceeded EPA
guidelines (in many homes in Butte). Realizing the public health
implications of radon in homes and the state of the art of radon
daughter measurement, the Office of Radiation Programs sponsored a
study of measurement techniques using Butte as a laboratory. This
is the most extensive study of radon daughter measurement techniques
ever attempted, and it will soon be completed. The study does not
address techniques for lowering the radon daughter concentrations in
homes, however. Many such remedial alternatives have been proposed
and implemented, but no study comparing cost and effectiveness has
been attempted. The results of such a study would be very important
as the nation strives to tighten residences against air infiltraton.
30
image:
333
Rocky Flats
The Rocky Flats Nuclear Weapons Plant located just northwest of
Denver developed an RERP which has been reviewed by the State of
Colorado. Federal agencies, including EPA, have umpired one of the
exercises of the Rocky Flats plan. In addition the EPA Region VIII
Radiation Programs Office, at the request of the Colorado Department
of Health, is participating in the assessment of the Rocky Flats.
"maximum credible accident" on which the RERP is based.
Figure XIII indicates the proximity of facilities along
Colorado Rocky Mountain front range, and the relative location of
Denver and surrounding towns.
VII. Indoor Radon Progeny
Several areas in the nation experience elevated levels of radon
gas exhaled from soils. These are typically mineralized areas such
as the Rocky Mountain Region. When radon is released to the
atmosphere, it is immediately diluted to inconsequential
concentrations by the ambient air and especially by breezes. Radon
which finds its way into homes, however, becomes trapped and decays
to further radioactive species which can accumulate to levels that
are associated with significantly increased lung cancer risk (Figure
XIV). Energy conservation measures which reduce ventilation rates
also increase the radon daughter concentrations in homes. In 1978
the Montana Department of Health and Environmental Sciences
discovered elevated radon daughter levels which exceeded EPA
guidelines (in many homes in Butte). Realizing the public health
implications of radon in homes and the state of the art of radon
daughter measurement, the Office of Radiation Programs sponsored a
study of measurement techniques using Butte as a laboratory. This
is the most extensive study of radon daughter measurement techniques
ever attempted, and it will soon be completed. The study does not
address techniques for lowering the radon daughter concentrations in
homes, however. Many such remedial alternatives have been proposed
and implemented, but no study comparing cost and effectiveness has
been attempted. The results of such a study would be very important
as the nation strives to tighten residences against air infiltraton.
30
image:
 334
RADCf! GAS
\ I RADON PROG5W
\
/ /
GAMMA RADIATION , 1 / /
'Figure XIV
Routes of Radon Entry into Homes
31
image:
334
RADCf! GAS
\ I RADON PROG5W
\
/ /
GAMMA RADIATION , 1 / /
'Figure XIV
Routes of Radon Entry into Homes
31
image:
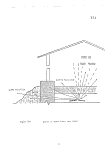 viii. 3oS
Pesticides and Toxics Section
Environmental Management Report
Page Number,
I Overview Status and Trends 3336
II Signifi cant Probl ens and Implications: Pesticides 338
A. Pesticide Contamination of Wildlife
B. Pesti cide Misuse
C. Pesticide Drift
D. Pesticide Orun Storage and Disposal
Significant Problems and Implications: Toxics 339
A. Asbestos
8. PCSs
III Emerging Issues 340
Attachment A: Media Overview - Pesticides
Table A: Pesti cide-Caused Fish Kills 341
Table B: Wyoming Pesticide Use Inspections 342
and Violations
Table C: Colorado Pesticide Use Inspections 342
and Violations
Table D: Utah Pesticide Use Inspections 343
and Viol ations
Table £: South Dakota Pesticide Use 343
and Viol ations
Table F: Montana Pesticide Use Inspections 344
and Vi ol ati ons
Table G: Pesticide Drift: Colorado and Wyoming 346
Table H: Pesticide Drift: North Dakota, South 346
Dakota, Utah
Table I: Poisonings: Due to Pesticides 347
Att achment B: Medi a Qyervl ew. -_ Toxi cs 348
A. Asbestos
B. PCB's
Table J: PCS Inspections and Violations - 348
Region 8
image:
viii. 3oS
Pesticides and Toxics Section
Environmental Management Report
Page Number,
I Overview Status and Trends 3336
II Signifi cant Probl ens and Implications: Pesticides 338
A. Pesticide Contamination of Wildlife
B. Pesti cide Misuse
C. Pesticide Drift
D. Pesticide Orun Storage and Disposal
Significant Problems and Implications: Toxics 339
A. Asbestos
8. PCSs
III Emerging Issues 340
Attachment A: Media Overview - Pesticides
Table A: Pesti cide-Caused Fish Kills 341
Table B: Wyoming Pesticide Use Inspections 342
and Violations
Table C: Colorado Pesticide Use Inspections 342
and Violations
Table D: Utah Pesticide Use Inspections 343
and Viol ations
Table £: South Dakota Pesticide Use 343
and Viol ations
Table F: Montana Pesticide Use Inspections 344
and Vi ol ati ons
Table G: Pesticide Drift: Colorado and Wyoming 346
Table H: Pesticide Drift: North Dakota, South 346
Dakota, Utah
Table I: Poisonings: Due to Pesticides 347
Att achment B: Medi a Qyervl ew. -_ Toxi cs 348
A. Asbestos
B. PCB's
Table J: PCS Inspections and Violations - 348
Region 8
image:
 VIII.
REGION VIII ENVIRONMENTAL MANAGEMENT REPORT
PESTICIDES AND TOXICS
I. OVERVIEW: STATUS AND TRENDS
Our view of the current status and our insights into possible trends come
from continued involvement with state agencies on pesticide and toxics issues
regarding state inspection and complaint response activities under FIFRA, as
well as on annual analysis done to establish enforcement priorities.
Additional information on toxics problems in air and water is provided under
the media in which they occur.
Some very general long-term trends have been observed to date. Generally,
fewer pesticide poisonings seem to be occurring in recent years, possibly due
to child proof pesticide containers and the fact that organophosphate
pesticides are being respected for their acute hazard potential. We expect
the year-by-year data in future Environmental Management Reports to reflect
this trend. As discussed in this paper, definitive trends regarding drift and
disposal of pesticide containers have not been observed.
Certain Region VIII states are especially concerned with unique pesticide
problems. Montana is concerned with the buildup of endrin residues in the
environment and the buildup of certain pesticides in game birds. Wyoming,
Montana, Utah, Colorado and South Dakota are very interested in the use of
1080 for coyote control, and if the Administrator allows the use of this
chemical, EPA will have to work closely with the states to implement proper
programs for its use.
Regarding the asbestos-in-schools program, we are aware of several
asbestos removals at schools but at this time our data are not compiled in a
manner so as to allow us to assess the true status of removal actions. After
the mandatory rule takes effect requiring schools to keep records, we will
have better figures for future Environmental Management Reports.
Methods of disposing of PCBs are still in the developmental stages and
disposal costs remain high. However, we are observing significant quantities
of PCBs being moved toward disposal facilities. We are attempting to gather
actual figures on the flow of PCBs for disposal from Region VIII, and we hope
to have more definitive information in future Environmental Management Reports.
- 1 -
image:
VIII.
REGION VIII ENVIRONMENTAL MANAGEMENT REPORT
PESTICIDES AND TOXICS
I. OVERVIEW: STATUS AND TRENDS
Our view of the current status and our insights into possible trends come
from continued involvement with state agencies on pesticide and toxics issues
regarding state inspection and complaint response activities under FIFRA, as
well as on annual analysis done to establish enforcement priorities.
Additional information on toxics problems in air and water is provided under
the media in which they occur.
Some very general long-term trends have been observed to date. Generally,
fewer pesticide poisonings seem to be occurring in recent years, possibly due
to child proof pesticide containers and the fact that organophosphate
pesticides are being respected for their acute hazard potential. We expect
the year-by-year data in future Environmental Management Reports to reflect
this trend. As discussed in this paper, definitive trends regarding drift and
disposal of pesticide containers have not been observed.
Certain Region VIII states are especially concerned with unique pesticide
problems. Montana is concerned with the buildup of endrin residues in the
environment and the buildup of certain pesticides in game birds. Wyoming,
Montana, Utah, Colorado and South Dakota are very interested in the use of
1080 for coyote control, and if the Administrator allows the use of this
chemical, EPA will have to work closely with the states to implement proper
programs for its use.
Regarding the asbestos-in-schools program, we are aware of several
asbestos removals at schools but at this time our data are not compiled in a
manner so as to allow us to assess the true status of removal actions. After
the mandatory rule takes effect requiring schools to keep records, we will
have better figures for future Environmental Management Reports.
Methods of disposing of PCBs are still in the developmental stages and
disposal costs remain high. However, we are observing significant quantities
of PCBs being moved toward disposal facilities. We are attempting to gather
actual figures on the flow of PCBs for disposal from Region VIII, and we hope
to have more definitive information in future Environmental Management Reports.
- 1 -
image:
 337
It has been suggested that the Region might rely upon published scientific
studies for indications of the status and trends of pesticides in the
environment. A major constraint in using existing published research to
define the extent of these pesticide impacts on human health or the
environment is that in most cases, the data has not been collected on a
systematic national or regional basis over a long enough period of years to
enable one to evaluate trends. Isolated short-term studies of limited
geographic scope have been done to assess acute and chronic health effects of
pesticide exposure or to monitor the residues of particular pesticides. For
obvious reasons, these cannot be relied upon as annual measures of
environmental quality. Nevertheless, even if there were regional data
available, trends of pesticide residues in the environment would still not be
clear. The likelihood of pesticide exposure is dependent upon the nature and
occurrence of pest infestations which will vary from year to year, and the
types and extent of pesticide usage. For these reasons, it is impossible to
extrapolate available published research for a regionwide analysis of the
impacts of pesticides on humans, fish and wildlife or the environment.
image:
337
It has been suggested that the Region might rely upon published scientific
studies for indications of the status and trends of pesticides in the
environment. A major constraint in using existing published research to
define the extent of these pesticide impacts on human health or the
environment is that in most cases, the data has not been collected on a
systematic national or regional basis over a long enough period of years to
enable one to evaluate trends. Isolated short-term studies of limited
geographic scope have been done to assess acute and chronic health effects of
pesticide exposure or to monitor the residues of particular pesticides. For
obvious reasons, these cannot be relied upon as annual measures of
environmental quality. Nevertheless, even if there were regional data
available, trends of pesticide residues in the environment would still not be
clear. The likelihood of pesticide exposure is dependent upon the nature and
occurrence of pest infestations which will vary from year to year, and the
types and extent of pesticide usage. For these reasons, it is impossible to
extrapolate available published research for a regionwide analysis of the
impacts of pesticides on humans, fish and wildlife or the environment.
image:
 33S
II. SIGNIFICANT PROBLEMS AND IMPLICATIONS: PESTICIDES
A. Pesticide Contamination of Wildlife
Pesticide contamination of wildlife is a problem of unknown but
possibly large dimensions within Region VIII. Sparked by the
findings of surprisingly high Endrin levels in waterfowl and upland
gamebirds in Montana in 1981, literature searching and monitoring
efforts were begun to gain a better understanding of the scope of the
problem. With additional monitoring, several other persistant
hydrocarbons of both industrial and pesticide origins have been
detected. Because the paths of the Pacific and Central waterfowl
fly ways, cut through the Region, identification of exposure patterns
is difficult.
National pesticide residue studies have been conducted by the U.S.
Fish and Wildlife Service Research Center Lab in Patuxent every three
years on starlings and ducks. The data have not yet been summarized
so as to allow conclusions or identify trends. The Region is working
to digest this information and will include it in future reports.
A recent incident involving the organophosphate pesticide, Phorate,
indicated that significant birdkilis mignt also occur after proper
application of the pesticide. This might suggest unexpected risks to
the general population and to waterways.
Data collected at several laboratories have shown elevated levels of
heptachlor and heptachlor epoxide, a pesticide with only limited
labelled uses in this region. The presence of this pesticide and
residue in both migratory and non-migratory birds is very difficult
to explain using data involving legal usage of the parent pesticide.
B. Pesticide Misuse
Violation of pesticide label conditions is one of the more serious
environmental problems related to pesticide use. Impacts from misuse
include damaged crops, human effects, environmental residues in
wildlife and crops and in some cases a general accumulation of
chemicals in the natural environment. It is necessary that EPA
maintain an enforcement program that draws attention to such misuse
through rigorous inspections of users by state inspection personnel
and active pursuit of case preparation against violators.
C. Pesticide Drift
Pesticide drift, measured as non-target vegetation destruction by
herbicides, is another problem in Region VIII. Drift problems occur
when applicators spraying fields inadvertently spray neighboring
fields, shelterbelts or other adjacent properties. In Region VIII,
the destruction of sunflower crops by applicators spraying 2,4-D on
small grains is the most common type of rural drift complaint. The
encroachment of residential areas near agricultural lands also leads
to drift incidents.
image:
33S
II. SIGNIFICANT PROBLEMS AND IMPLICATIONS: PESTICIDES
A. Pesticide Contamination of Wildlife
Pesticide contamination of wildlife is a problem of unknown but
possibly large dimensions within Region VIII. Sparked by the
findings of surprisingly high Endrin levels in waterfowl and upland
gamebirds in Montana in 1981, literature searching and monitoring
efforts were begun to gain a better understanding of the scope of the
problem. With additional monitoring, several other persistant
hydrocarbons of both industrial and pesticide origins have been
detected. Because the paths of the Pacific and Central waterfowl
fly ways, cut through the Region, identification of exposure patterns
is difficult.
National pesticide residue studies have been conducted by the U.S.
Fish and Wildlife Service Research Center Lab in Patuxent every three
years on starlings and ducks. The data have not yet been summarized
so as to allow conclusions or identify trends. The Region is working
to digest this information and will include it in future reports.
A recent incident involving the organophosphate pesticide, Phorate,
indicated that significant birdkilis mignt also occur after proper
application of the pesticide. This might suggest unexpected risks to
the general population and to waterways.
Data collected at several laboratories have shown elevated levels of
heptachlor and heptachlor epoxide, a pesticide with only limited
labelled uses in this region. The presence of this pesticide and
residue in both migratory and non-migratory birds is very difficult
to explain using data involving legal usage of the parent pesticide.
B. Pesticide Misuse
Violation of pesticide label conditions is one of the more serious
environmental problems related to pesticide use. Impacts from misuse
include damaged crops, human effects, environmental residues in
wildlife and crops and in some cases a general accumulation of
chemicals in the natural environment. It is necessary that EPA
maintain an enforcement program that draws attention to such misuse
through rigorous inspections of users by state inspection personnel
and active pursuit of case preparation against violators.
C. Pesticide Drift
Pesticide drift, measured as non-target vegetation destruction by
herbicides, is another problem in Region VIII. Drift problems occur
when applicators spraying fields inadvertently spray neighboring
fields, shelterbelts or other adjacent properties. In Region VIII,
the destruction of sunflower crops by applicators spraying 2,4-D on
small grains is the most common type of rural drift complaint. The
encroachment of residential areas near agricultural lands also leads
to drift incidents.
image:
 339
D. Pesticide Drum Storage and Disposal
Pesticide drum storage and disposal requirements will be tightened
under RCRA regulations. It is possible that these tighter
requirements could mean an increase in illegal disposal of these
drums or their contents. There is no data to indicate the present
fate of pesticide drums. Montana State personnel are concerned that
these drums are being used without proper prior cleanup as pier
supports, otherwise disposed of near water sources, or used as
barbeques and garbage cans. Given the lack of information and the
possibilities of serious health and water quality impacts, drum
disposal has been identified as an issue for further investigation.
SIGNIFICANT PROBLEMS AND IMPLICATIONS: TOXICS
A. Asbestos
EPA is concerned with the disease-causing potential of intermittent,
low-level exposures to asbestos that can occur in some school
buildings. The durability of asbestos fibers, their small size and
fibrous shape allow them to remian airborne for long periods of
time. Some fibers which are inhaled will remain in the lungs
indefinitely. Under the Section 6a of the Toxic Substances Control
Act, the Agency has taken steps to minimize the exposure of school
children to asbestos.
In Region VIII, information was distributed to the states and schooT
districts informing them of the asbestos problem and recommending
that each school locate the amount of friable asbestos in their
building(s) and take action to remove or safely contain that
material. Because of the voluntary nature of the asbestos reporting
provisions of the regulations, it is impossible at this time to
present meaningful statistics on the number of school districts which
have identified asbestos or taken action to remove or encapsulate
it. By early 1983, the Region VIII Asbestos Technical Advisor had
visited 615 of the 746 school districts in Region VIII (excluding
Montana). Also, approximately 268 Montana school districts of the
393 districts in the state responded to a questionnaire indicating
that they have inspected their buildings. No reliable statistics on
asbestos found or removed are available at this time.
8. PCBs
Because the Agency's responsibilities for PCB's do not include
environmental monitoring, it is difficult to arrive at a meaningful
environmental quality measure with which to assess the effectiveness
of EPA's regulatory efforts. One possibile measure might be the
amount of PCB's from Region VIII which are destroyed each year
compared to the amount of PCB's which are estimated to exist in the
Region. However, the accuracy of the published figures on existing
amounts of PCB's in the Region is questionable, and it is not clear
at this time whether the waste destruction companies will be able to
provide us with information on the amount destroyed.
image:
339
D. Pesticide Drum Storage and Disposal
Pesticide drum storage and disposal requirements will be tightened
under RCRA regulations. It is possible that these tighter
requirements could mean an increase in illegal disposal of these
drums or their contents. There is no data to indicate the present
fate of pesticide drums. Montana State personnel are concerned that
these drums are being used without proper prior cleanup as pier
supports, otherwise disposed of near water sources, or used as
barbeques and garbage cans. Given the lack of information and the
possibilities of serious health and water quality impacts, drum
disposal has been identified as an issue for further investigation.
SIGNIFICANT PROBLEMS AND IMPLICATIONS: TOXICS
A. Asbestos
EPA is concerned with the disease-causing potential of intermittent,
low-level exposures to asbestos that can occur in some school
buildings. The durability of asbestos fibers, their small size and
fibrous shape allow them to remian airborne for long periods of
time. Some fibers which are inhaled will remain in the lungs
indefinitely. Under the Section 6a of the Toxic Substances Control
Act, the Agency has taken steps to minimize the exposure of school
children to asbestos.
In Region VIII, information was distributed to the states and schooT
districts informing them of the asbestos problem and recommending
that each school locate the amount of friable asbestos in their
building(s) and take action to remove or safely contain that
material. Because of the voluntary nature of the asbestos reporting
provisions of the regulations, it is impossible at this time to
present meaningful statistics on the number of school districts which
have identified asbestos or taken action to remove or encapsulate
it. By early 1983, the Region VIII Asbestos Technical Advisor had
visited 615 of the 746 school districts in Region VIII (excluding
Montana). Also, approximately 268 Montana school districts of the
393 districts in the state responded to a questionnaire indicating
that they have inspected their buildings. No reliable statistics on
asbestos found or removed are available at this time.
8. PCBs
Because the Agency's responsibilities for PCB's do not include
environmental monitoring, it is difficult to arrive at a meaningful
environmental quality measure with which to assess the effectiveness
of EPA's regulatory efforts. One possibile measure might be the
amount of PCB's from Region VIII which are destroyed each year
compared to the amount of PCB's which are estimated to exist in the
Region. However, the accuracy of the published figures on existing
amounts of PCB's in the Region is questionable, and it is not clear
at this time whether the waste destruction companies will be able to
provide us with information on the amount destroyed.
image:
 III. EMERGING ISSUES
Based upon the staff's involvement in regional toxics and pesticides
issues, we can identify several important emerging issues which merit the
Agency's attention:
1. Contamination of groundwater
2. Non-target impacts caused by pesticides
3. Identification of problem chemicals
4. Use of pesticides in irrigation sprinkler systems
1. Groundwater contamination is the Region's potentially most serious
emerging problem. Groundwater quality is threatened by mining, mineral and
uranium exploration, oil and gas development, deep well injection of wastes,
and chemical contamination of recharge zones. Little baseline water quality
or groundwater movement data is available, and a comprehensive effort is
needed to collect data upon which protective or remedial actions might be
based.
2. Non-target impacts caused by pesticides are also a potential problem of
undefined dimensions within the Region. The Regional Office and the States
receive numerous complaints about damage to nontarget species resulting from
pesticides such as herbicides, chlorinated hydrocarbon pesticides, paraquat
and the organophosphates. However, there is no broad surveillance network
except the annual songbird census through which to gather the statistical
information needed to determine the extent of this environmental impact.
3. As the Region becomes aware of problem chemicals which have not been
recognized as hazardous under TSCA, the Regional Toxics program will bring
these chemicals to the attention to EPA Headquarters and the appropriate state
agencies. These chemicals might be identified through inspections, complaint
information or contacts with other governmental agencies.
4. Recently, it has come to our attention that chemical companies are
beginning to. market the idea of using certain pesticides in center-pivot
irrigation sprinkler systems. Our concerns about this practice include the
possibility of the pesticide back-flushing into the water source through
inoperable or non-existent back-siphoning valves; exposure to the public
through unattended, runaway sprinkling systems; and exposure to the employees
using the pesticide and working in the fields. Secondary concerns involve the
ability of such systems to deliver the proper concentration to the crop.
image:
III. EMERGING ISSUES
Based upon the staff's involvement in regional toxics and pesticides
issues, we can identify several important emerging issues which merit the
Agency's attention:
1. Contamination of groundwater
2. Non-target impacts caused by pesticides
3. Identification of problem chemicals
4. Use of pesticides in irrigation sprinkler systems
1. Groundwater contamination is the Region's potentially most serious
emerging problem. Groundwater quality is threatened by mining, mineral and
uranium exploration, oil and gas development, deep well injection of wastes,
and chemical contamination of recharge zones. Little baseline water quality
or groundwater movement data is available, and a comprehensive effort is
needed to collect data upon which protective or remedial actions might be
based.
2. Non-target impacts caused by pesticides are also a potential problem of
undefined dimensions within the Region. The Regional Office and the States
receive numerous complaints about damage to nontarget species resulting from
pesticides such as herbicides, chlorinated hydrocarbon pesticides, paraquat
and the organophosphates. However, there is no broad surveillance network
except the annual songbird census through which to gather the statistical
information needed to determine the extent of this environmental impact.
3. As the Region becomes aware of problem chemicals which have not been
recognized as hazardous under TSCA, the Regional Toxics program will bring
these chemicals to the attention to EPA Headquarters and the appropriate state
agencies. These chemicals might be identified through inspections, complaint
information or contacts with other governmental agencies.
4. Recently, it has come to our attention that chemical companies are
beginning to. market the idea of using certain pesticides in center-pivot
irrigation sprinkler systems. Our concerns about this practice include the
possibility of the pesticide back-flushing into the water source through
inoperable or non-existent back-siphoning valves; exposure to the public
through unattended, runaway sprinkling systems; and exposure to the employees
using the pesticide and working in the fields. Secondary concerns involve the
ability of such systems to deliver the proper concentration to the crop.
image:
 34!
ATTACHMENT A: .MEDIA OVERVIEW - PESTICIDES
There are no statistics available on the amounts of pesticides used in
Region VIII. However, we do know that there are approximately 56,500 private
applicators and 10,200 commercial applicators who are certified to apply
restricted use pesticides in Region VIII. These figures do not include
homeowners or other users who apply non-restricted use pesticides.
EPA has collected some data on possible damage measures for estimating the
misuse of pesticides in the environment: fish kills, pesticide use
violations, non-target vegetation destruction by herbicides (pesticide drift),
and acute and chronic human health effects. The data on the extent of the
problem in each of these areas is sketchy. Much of what has been reported in
the past is scattered in complaint files of the Fish and Wildlife or
Agriculture agencies of the States or Federal Government. Some misuse
incidents are never reported.
We are requesting data from each of our states on the reported instances
of fish kills due to pesticides. Historical fish kill data have been
retrieved from the STORET system and are presented below. It should be
remembered that this information is based only upon incidents which were
reported by state or Federal agency personnel.
Table A:
SUSPECTED PESTICIDE-CAUSED FISH KILLS. 1960-1980*
Suspected Pesticide-
Caused Incidents
* of Fish Killed
CO
5
37650
Total # of Fish-Kill
Incidents(all causes) 42
# of Fish Killed 1521119
MT
27
51850
66
520118
ND
3
49900
30
616600
SD
3
110000
24
559297
UT WY
5 4
7670 230S
37
93745
40
86S18
* only includes agricultural incidents reported to
state or federal agencies; does not include
fish kills caused by spills occuring during trans-
port or manufacture of pesticides. Based upon best
available data.
Data obtained from STORET
Pesticide use violations are documented in the course of pesticide dealer
and applicator inspections conducted by EPA and the States, and also in the
course of following up on complaints reported to either the Regional Office or
the states. Tables 3 and C on the following page depict pesticide use
violations which were taken from EPA's inspection and complaint records for
Colorado and Wyoming, where the Agency has primary enforcement authority.
Tables D thru F present information from the State Enforcement Grant reports.
image:
34!
ATTACHMENT A: .MEDIA OVERVIEW - PESTICIDES
There are no statistics available on the amounts of pesticides used in
Region VIII. However, we do know that there are approximately 56,500 private
applicators and 10,200 commercial applicators who are certified to apply
restricted use pesticides in Region VIII. These figures do not include
homeowners or other users who apply non-restricted use pesticides.
EPA has collected some data on possible damage measures for estimating the
misuse of pesticides in the environment: fish kills, pesticide use
violations, non-target vegetation destruction by herbicides (pesticide drift),
and acute and chronic human health effects. The data on the extent of the
problem in each of these areas is sketchy. Much of what has been reported in
the past is scattered in complaint files of the Fish and Wildlife or
Agriculture agencies of the States or Federal Government. Some misuse
incidents are never reported.
We are requesting data from each of our states on the reported instances
of fish kills due to pesticides. Historical fish kill data have been
retrieved from the STORET system and are presented below. It should be
remembered that this information is based only upon incidents which were
reported by state or Federal agency personnel.
Table A:
SUSPECTED PESTICIDE-CAUSED FISH KILLS. 1960-1980*
Suspected Pesticide-
Caused Incidents
* of Fish Killed
CO
5
37650
Total # of Fish-Kill
Incidents(all causes) 42
# of Fish Killed 1521119
MT
27
51850
66
520118
ND
3
49900
30
616600
SD
3
110000
24
559297
UT WY
5 4
7670 230S
37
93745
40
86S18
* only includes agricultural incidents reported to
state or federal agencies; does not include
fish kills caused by spills occuring during trans-
port or manufacture of pesticides. Based upon best
available data.
Data obtained from STORET
Pesticide use violations are documented in the course of pesticide dealer
and applicator inspections conducted by EPA and the States, and also in the
course of following up on complaints reported to either the Regional Office or
the states. Tables 3 and C on the following page depict pesticide use
violations which were taken from EPA's inspection and complaint records for
Colorado and Wyoming, where the Agency has primary enforcement authority.
Tables D thru F present information from the State Enforcement Grant reports.
image:
 OF INSPECTIONS/VIOLATIONS
t—>i_.Hji_.t\)ixoi\jr\Jco
ocnocnocnocno
} . -, I (-..J /. I \ I , i !_. L
ro en ~-j
cnocn
:-
-h
~S
O
3
m
-a
3^
?3
CO
o
o
oo
oo
m
o
i—i
O
z
oo
zz m
o oo
>—t O
O i-t
__ o
o
o
o to
z rn
oo
oo
TJ
m
o
co
r—
rn
o
o
CO
# OF INSPECTIONS/VIOLATIONS
oo
cu
n>
Q.
O
I
O
-s
o
rn
T)
00
NO VIOLATIONS REPORTED
CO
r>o
tMP.r.Mw-.JI. £•'<*• :,£—~M*.T-~f-.l£~-*£~.t- <«.,.. . fc -~ £.-£..£. £.^L^, £~, ~Z~*-Ji^..
m
VIOLATIO
z
CO
i
INSPECTI
g
oo
J> TD
z rn
a oo
— I
•< t-i
H-l O
O i-t
C a
;?> rn
-H
i~i cr
o oo
^m
i — i
z
CO
-o
O
— 1
o
_~P
^CM
OO
YOMING
3>
co
CO
Osl
image:
OF INSPECTIONS/VIOLATIONS
t—>i_.Hji_.t\)ixoi\jr\Jco
ocnocnocnocno
} . -, I (-..J /. I \ I , i !_. L
ro en ~-j
cnocn
:-
-h
~S
O
3
m
-a
3^
?3
CO
o
o
oo
oo
m
o
i—i
O
z
oo
zz m
o oo
>—t O
O i-t
__ o
o
o
o to
z rn
oo
oo
TJ
m
o
co
r—
rn
o
o
CO
# OF INSPECTIONS/VIOLATIONS
oo
cu
n>
Q.
O
I
O
-s
o
rn
T)
00
NO VIOLATIONS REPORTED
CO
r>o
tMP.r.Mw-.JI. £•'<*• :,£—~M*.T-~f-.l£~-*£~.t- <«.,.. . fc -~ £.-£..£. £.^L^, £~, ~Z~*-Ji^..
m
VIOLATIO
z
CO
i
INSPECTI
g
oo
J> TD
z rn
a oo
— I
•< t-i
H-l O
O i-t
C a
;?> rn
-H
i~i cr
o oo
^m
i — i
z
CO
-o
O
— 1
o
_~P
^CM
OO
YOMING
3>
co
CO
Osl
image:
 # OF INSPECTIONS/VIOLATIONS
DO
flJ
n>
o -?
-1 oo
3
0
g
i-4-
L~T ""n
o' -1
3 CO
-J
CO
rh
rt- ID
fD ^
rn 0°
S1 ro
-h
O
~i
ro
3
fD
=3
r+
-s
S
<-«-
t— ' t— ' H-> H-« ro ro ro
ro en * — \ c> ro en ^^4 CD ro en
en oen oeno enotno
^ | ^j, ^ ^ ^ J_ J _1 A
~ffi%\
•&-£-£~£i
NO VIOLATIONS REPORTED
tj co H
mo 3>
'7/7/f77\ to cr co
o
NO VIOLATIONS REPORTED 5 ° »
rn ?<:
O
c: -H
to i>
m
1
U
NO VIOLATIONS REPORTED o
~" ._ i
' — 1
o
2:
CO
_^
J-*
o
1—4
o
g
1
o toto
i*™" *n *
i w ^~|
3> mi— i
-H 00
O "-HO
~z. om
to 2:
toe:
to
# OF INSPECTIONS/VIOLATIONS
en o
CO
o
3
a
-h
O
Cu
O
a
CO
ct-
pi
r+
n>
m
a
-h
O
-J
n
§
ro
cr>
-5
fa
03
O
CO
-<
CO
en
_i—
i— • i— • t— » i— >i\i ro ro ro
o ro en -xio ro en *-j
o en o en o en O en
NO VIOLATIONS REPORTED
-o
m
CO
o
I — I
o
to
-a
o
2:
CO
a
o
to
CO
r~
m
CA!
image:
# OF INSPECTIONS/VIOLATIONS
DO
flJ
n>
o -?
-1 oo
3
0
g
i-4-
L~T ""n
o' -1
3 CO
-J
CO
rh
rt- ID
fD ^
rn 0°
S1 ro
-h
O
~i
ro
3
fD
=3
r+
-s
S
<-«-
t— ' t— ' H-> H-« ro ro ro
ro en * — \ c> ro en ^^4 CD ro en
en oen oeno enotno
^ | ^j, ^ ^ ^ J_ J _1 A
~ffi%\
•&-£-£~£i
NO VIOLATIONS REPORTED
tj co H
mo 3>
'7/7/f77\ to cr co
o
NO VIOLATIONS REPORTED 5 ° »
rn ?<:
O
c: -H
to i>
m
1
U
NO VIOLATIONS REPORTED o
~" ._ i
' — 1
o
2:
CO
_^
J-*
o
1—4
o
g
1
o toto
i*™" *n *
i w ^~|
3> mi— i
-H 00
O "-HO
~z. om
to 2:
toe:
to
# OF INSPECTIONS/VIOLATIONS
en o
CO
o
3
a
-h
O
Cu
O
a
CO
ct-
pi
r+
n>
m
a
-h
O
-J
n
§
ro
cr>
-5
fa
03
O
CO
-<
CO
en
_i—
i— • i— • t— » i— >i\i ro ro ro
o ro en -xio ro en *-j
o en o en o en O en
NO VIOLATIONS REPORTED
-o
m
CO
o
I — I
o
to
-a
o
2:
CO
a
o
to
CO
r~
m
CA!
image:
 1/1
c
o
4->
O
O)
Q.
l/>
M-
9ft'
1200 1
1100
1000
900 I
800-|
700 -j
600 -|
500
400 -
100 -
50 -
344
TABLE F:
MONTANA PESTICIDE USE INSPECTIONS
AND VIOLATIONS
PESTICIDE USE
INSPECTIONS
VIOLATIONS
FY'80 FY'81 FY'82(lst & 2nd qtrs only)
Based on information from EPA Montana Office
image:
1/1
c
o
4->
O
O)
Q.
l/>
M-
9ft'
1200 1
1100
1000
900 I
800-|
700 -j
600 -|
500
400 -
100 -
50 -
344
TABLE F:
MONTANA PESTICIDE USE INSPECTIONS
AND VIOLATIONS
PESTICIDE USE
INSPECTIONS
VIOLATIONS
FY'80 FY'81 FY'82(lst & 2nd qtrs only)
Based on information from EPA Montana Office
image:
 345
In order to characterize the problem of pesticide drift, Tables G and H
were developed from information in the Region's complaint files for Colorado
and Wyoming and from responses that we received from the other states. They
illustrate the number of times damage has been reported due to pesticide drift,
Information on chronic human health effects due to pesticide poisoning is
currently not available for the Region. Some information on acute human
health effects is located in the files of Poison Control Centers and hospital
emergency rooms. It should be kept in mind that many incidents of this type
go unreported. Table I on page 12 depicts the poisonings reported to the
Rocky Mountain Poison Control Center during 1981 which were
pesticide-related. The total number of incidents reported represents all the
cases which the Poison Control Center handled during 1981, and includes cases
from 50 states and the District of Columbia. There were 46,264 cases (all
causes) from Colorado. No breakdown for Colorado or Region VIII states was
available for the number of pesticide poisonings.
image:
345
In order to characterize the problem of pesticide drift, Tables G and H
were developed from information in the Region's complaint files for Colorado
and Wyoming and from responses that we received from the other states. They
illustrate the number of times damage has been reported due to pesticide drift,
Information on chronic human health effects due to pesticide poisoning is
currently not available for the Region. Some information on acute human
health effects is located in the files of Poison Control Centers and hospital
emergency rooms. It should be kept in mind that many incidents of this type
go unreported. Table I on page 12 depicts the poisonings reported to the
Rocky Mountain Poison Control Center during 1981 which were
pesticide-related. The total number of incidents reported represents all the
cases which the Poison Control Center handled during 1981, and includes cases
from 50 states and the District of Columbia. There were 46,264 cases (all
causes) from Colorado. No breakdown for Colorado or Region VIII states was
available for the number of pesticide poisonings.
image:
 # OF COMPLAINTS/VIOLATIONS
OF COMPLAINTS/VIOLATIONS
OQ
H-» !-• ro- ro co co -P» -t»
cnooi o en o tn o en
t— > ro co -p» en
a o o o o
cn--j
oo
oovo
oo
o
o
NO VIOLATIONS REPORTED
NO COMPLAINTS OR
VIOLATIONS REPORTED
NO VIOLATIONS REPORTED
NO COMPLAINTS OR
VIOLATIONS REPORTED
m
co
o
a
m
o
g
§
CO
o
§
oo
r~
m
3:
1 1 1 J J 1 L J_ . .1 L_.
co
CD
O
O
a
o
O
m
GO
O
i—i
a
m
o
-<
O
O
o
73
CD
rt
ro
o
o
o
o
3:
CK
o
CO
—\
CO
CO
image:
# OF COMPLAINTS/VIOLATIONS
OF COMPLAINTS/VIOLATIONS
OQ
H-» !-• ro- ro co co -P» -t»
cnooi o en o tn o en
t— > ro co -p» en
a o o o o
cn--j
oo
oovo
oo
o
o
NO VIOLATIONS REPORTED
NO COMPLAINTS OR
VIOLATIONS REPORTED
NO VIOLATIONS REPORTED
NO COMPLAINTS OR
VIOLATIONS REPORTED
m
co
o
a
m
o
g
§
CO
o
§
oo
r~
m
3:
1 1 1 J J 1 L J_ . .1 L_.
co
CD
O
O
a
o
O
m
GO
O
i—i
a
m
o
-<
O
O
o
73
CD
rt
ro
o
o
o
o
3:
CK
o
CO
—\
CO
CO
image:
 347
Table I; Poisonings Due to Pesticides—1981
Rocky Mountain Poison Center
PESTICIDES
HERBICIDES
2-4-0 162
*Paraquat 7
Triazine 25
Urea 3
Dinitrphenol 25
INSECTICIDES/FUNGICIDES
-Carbamates 277
-Chlorinated hydrocarbons 471
Insecticide Repellents 121
Metaldehyde 9
Napthalene 95
Piperonyl Butoxide 63
Pyrethrins Pyrethroids 155
-Organophosphates 627
Rotenone 12
Sabadilla 1
Avitrol 4 Aminopyridine 0
Senomyl 3
*Cycloheximide 3
Dichlone 3
Phthalenride 13
RODENT 1C IDES
Antu 0
Arsenic 4
*Fluoroacetate 4
Phosphorous 9
Vacor 5
Marfarin 368
FUMIGANTS
*Methyl Bromide 8
TOTAL (ALL PESTICIDE-RaATED): 2,473 Cases
*Restricted Use Pesticides
-Class of Pesticides Which Includes Restricted Use Products
Total number of poisoning cases (all causes) handled by the Rocky
Mountain Poison Control Center during 1981: 60,828 cases.
image:
347
Table I; Poisonings Due to Pesticides—1981
Rocky Mountain Poison Center
PESTICIDES
HERBICIDES
2-4-0 162
*Paraquat 7
Triazine 25
Urea 3
Dinitrphenol 25
INSECTICIDES/FUNGICIDES
-Carbamates 277
-Chlorinated hydrocarbons 471
Insecticide Repellents 121
Metaldehyde 9
Napthalene 95
Piperonyl Butoxide 63
Pyrethrins Pyrethroids 155
-Organophosphates 627
Rotenone 12
Sabadilla 1
Avitrol 4 Aminopyridine 0
Senomyl 3
*Cycloheximide 3
Dichlone 3
Phthalenride 13
RODENT 1C IDES
Antu 0
Arsenic 4
*Fluoroacetate 4
Phosphorous 9
Vacor 5
Marfarin 368
FUMIGANTS
*Methyl Bromide 8
TOTAL (ALL PESTICIDE-RaATED): 2,473 Cases
*Restricted Use Pesticides
-Class of Pesticides Which Includes Restricted Use Products
Total number of poisoning cases (all causes) handled by the Rocky
Mountain Poison Control Center during 1981: 60,828 cases.
image:
 ATTACHMENT A: MEDIA OVERVIEW - TOXICS
A. Asbestos
After May, 1983, the Technical Advisor will begin revisiting the districts
which during his first trip had identified schools with friable materials
possibly containing asbestos. After this second round of visits, it should be
possible to present better data on asbestos problems in Region VIII schools.
8. PCB's
Some secondary measures for which the Region can produce data would
include the compliance ratios or numbers of "serious violations" for
facilities within the Region which have PCB's. Serious violations in this
case would be spill or leakage violations. However, these compliance or
violation figures would not give the reader a true picture of the presence or
absence of PCB's in the environment. Table 0 below characterizes inspections
and violations in Region VIII.
TABLE J:
2 250 -
2 225 - PCS INSPECTIONS AND
< 200 - VIOLATIONS: REGION VIII ;
o • :
> 175 - ; ;
«/i 150 - ! :
- r~ -
. ' INSPECTIONS
£ 100 -
S 75-
fe 50 -
VIOLATIONS
25 - :m .V^ ; ^\\ Sm LEAKAGE
VIOLATIONS
FY'30 FY'81 FY'82
Based on information from EPA RS
image:
ATTACHMENT A: MEDIA OVERVIEW - TOXICS
A. Asbestos
After May, 1983, the Technical Advisor will begin revisiting the districts
which during his first trip had identified schools with friable materials
possibly containing asbestos. After this second round of visits, it should be
possible to present better data on asbestos problems in Region VIII schools.
8. PCB's
Some secondary measures for which the Region can produce data would
include the compliance ratios or numbers of "serious violations" for
facilities within the Region which have PCB's. Serious violations in this
case would be spill or leakage violations. However, these compliance or
violation figures would not give the reader a true picture of the presence or
absence of PCB's in the environment. Table 0 below characterizes inspections
and violations in Region VIII.
TABLE J:
2 250 -
2 225 - PCS INSPECTIONS AND
< 200 - VIOLATIONS: REGION VIII ;
o • :
> 175 - ; ;
«/i 150 - ! :
- r~ -
. ' INSPECTIONS
£ 100 -
S 75-
fe 50 -
VIOLATIONS
25 - :m .V^ ; ^\\ Sm LEAKAGE
VIOLATIONS
FY'30 FY'81 FY'82
Based on information from EPA RS
image:
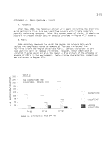 Region 8 Environmental- Management Report
EPA-9QS/9-83-001 May, 1983
image:
Region 8 Environmental- Management Report
EPA-9QS/9-83-001 May, 1983
image: