<pubnumber> R273194
 </pubnumber>
<title>Identification and Control Of Petrochemical Pollutants Inhibitory To Anaerobic Processes</title>
<pages>125</pages>
<pubyear>1973</pubyear>
<provider>NEPIS</provider>
<access>online</access>
<operator>LAI</operator>
<scandate>20061006</scandate>
<origin>hardcopy</origin>
<type>single page tiff</type>
<keyword>inhibition anaerobic inhibitory acclimation substrate warburg ethyl acrylate crotonaldehyde test activity concentration unit feed gas limited production studies figure packed</keyword>
<author>Hovious, J. C. Waggy, G. T. ; Conway, Richard A. United States. Environmental Protection Agency. Office of Research and Monitoring.</author>
<publisher>For sale by the Supt. of Docs., U.S. Govt. Print. Off.,</publisher>
<subject> Petroleum waste ; Chemical inhibitors ; Sewage--Purification--Biological treatment</subject>
<abstract></abstract>
EPA-R2-73-194
APRIL 1973 Environmental Protection Technology Series
Identification and Control
of Petrochemical Pollutants
Inhibitory to Anaerobic Processes
\
UJ
Office of Research and Monitoring
U.S. Environmental Protection Agency
Washington, D.C. 20460
image:
</pubnumber>
<title>Identification and Control Of Petrochemical Pollutants Inhibitory To Anaerobic Processes</title>
<pages>125</pages>
<pubyear>1973</pubyear>
<provider>NEPIS</provider>
<access>online</access>
<operator>LAI</operator>
<scandate>20061006</scandate>
<origin>hardcopy</origin>
<type>single page tiff</type>
<keyword>inhibition anaerobic inhibitory acclimation substrate warburg ethyl acrylate crotonaldehyde test activity concentration unit feed gas limited production studies figure packed</keyword>
<author>Hovious, J. C. Waggy, G. T. ; Conway, Richard A. United States. Environmental Protection Agency. Office of Research and Monitoring.</author>
<publisher>For sale by the Supt. of Docs., U.S. Govt. Print. Off.,</publisher>
<subject> Petroleum waste ; Chemical inhibitors ; Sewage--Purification--Biological treatment</subject>
<abstract></abstract>
EPA-R2-73-194
APRIL 1973 Environmental Protection Technology Series
Identification and Control
of Petrochemical Pollutants
Inhibitory to Anaerobic Processes
\
UJ
Office of Research and Monitoring
U.S. Environmental Protection Agency
Washington, D.C. 20460
image:
 RESEARCH REPORTING SERIES
Research reports of the Office of Research and
Monitoring, Environmental Protection Agency, have
been grouped into five series. These five broad
categories were established to facilitate further
development and application of environmental
technology. Elimination of traditional grouping
was consciously planned to foster technology
transfer and a maximum interface in related
fields. The five series are:
1. Environmental Health Effects Research
2. Environmental Protection Technology
3. Ecological Research
U. Environmental Monitoring
5. Socioeconomic Environmental Studies
This report has been assigned to the ENVIRONMENTAL
PROTECTION TECHNOLOGY series. This series
describes research performed to develop and
demonstrate instrumentation, equipment and
methodology to repair or prevent environmental
degradation from point and non-point sources of
pollution. This work provides the new or improved
technology required for the control and treatment
of pollution sources to meet environmental quality
standards.
image:
RESEARCH REPORTING SERIES
Research reports of the Office of Research and
Monitoring, Environmental Protection Agency, have
been grouped into five series. These five broad
categories were established to facilitate further
development and application of environmental
technology. Elimination of traditional grouping
was consciously planned to foster technology
transfer and a maximum interface in related
fields. The five series are:
1. Environmental Health Effects Research
2. Environmental Protection Technology
3. Ecological Research
U. Environmental Monitoring
5. Socioeconomic Environmental Studies
This report has been assigned to the ENVIRONMENTAL
PROTECTION TECHNOLOGY series. This series
describes research performed to develop and
demonstrate instrumentation, equipment and
methodology to repair or prevent environmental
degradation from point and non-point sources of
pollution. This work provides the new or improved
technology required for the control and treatment
of pollution sources to meet environmental quality
standards.
image:
 EPA-R2-73-19A
April 1973
IDENTIFICATION AND CONTROL OF PETROCHEMICAL POLLUTANTS
INHIBITORY TO ANAEROBIC PROCESSES
By
J. C. Hovious
G. T. Waggy
R. A. Conway
Project 12020 FER
Project Officer
Ray George
Environmental Protection Agency
Wheeling Field Office
303 Methodist Building
Wheeling, West Virginia 26003
Prepared for
OFFICE OF RESEARCH AND MONITORING
U.S. ENVIRONMENTAL PROTECTION AGENCY
WASHINGTON, D.C. 20460
1 North !',';.„ , ^. ^,:i /a
Chicago, Illinois 60606
image:
EPA-R2-73-19A
April 1973
IDENTIFICATION AND CONTROL OF PETROCHEMICAL POLLUTANTS
INHIBITORY TO ANAEROBIC PROCESSES
By
J. C. Hovious
G. T. Waggy
R. A. Conway
Project 12020 FER
Project Officer
Ray George
Environmental Protection Agency
Wheeling Field Office
303 Methodist Building
Wheeling, West Virginia 26003
Prepared for
OFFICE OF RESEARCH AND MONITORING
U.S. ENVIRONMENTAL PROTECTION AGENCY
WASHINGTON, D.C. 20460
1 North !',';.„ , ^. ^,:i /a
Chicago, Illinois 60606
image:
 EPA Review Notice
This report has been reviewed by the
Environmental Protection Agency and
approved for publication. Approval
does not signify that the contents
necessarily reflect the views and policies
of the Environmental Protection Agency,
nor does mention of trade names or
commercial products constitute endoresement
or recommendations for use.
11
ENVIRONMEN
image:
EPA Review Notice
This report has been reviewed by the
Environmental Protection Agency and
approved for publication. Approval
does not signify that the contents
necessarily reflect the views and policies
of the Environmental Protection Agency,
nor does mention of trade names or
commercial products constitute endoresement
or recommendations for use.
11
ENVIRONMEN
image:
 ABSTRACT
Identification studies were made on potentially
inhibitory materials using a Warburg respirometer
procedure and an unacclimated anaerobic biomass.
Identified inhibitory materials and concentrations for a
50 percent decrease in activity were acrolein (20-50 mg/1),
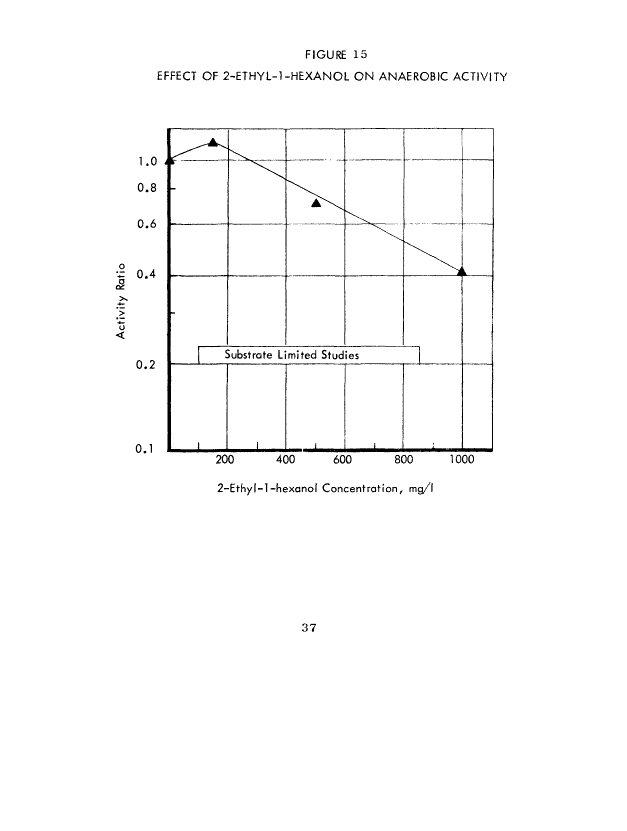
formaldehyde (50-100 mg/1), 2-ethyl-l-hexanol
(500-1000 mg/1), methyl isobutyl ketone (100-300 mg/1),
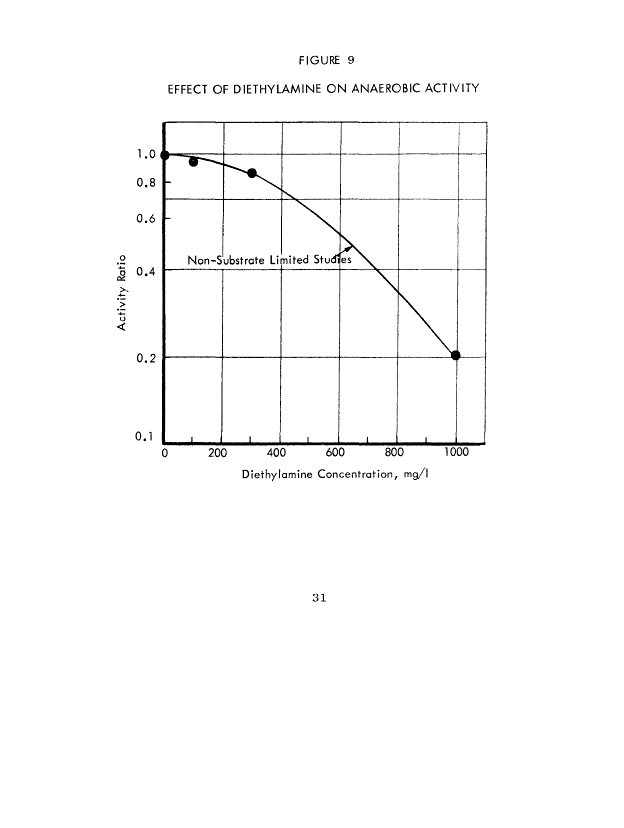
diethylamine (300-1000 mg/1), acrylonitrile (100 mg/1),
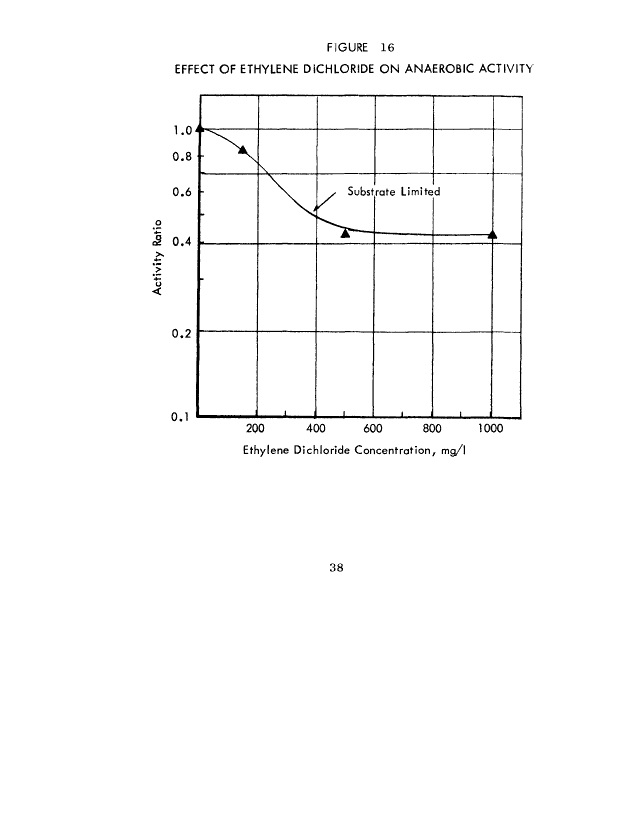
2-methyl-5-ethylpyridine (100 mg/1), ethylene dichloride
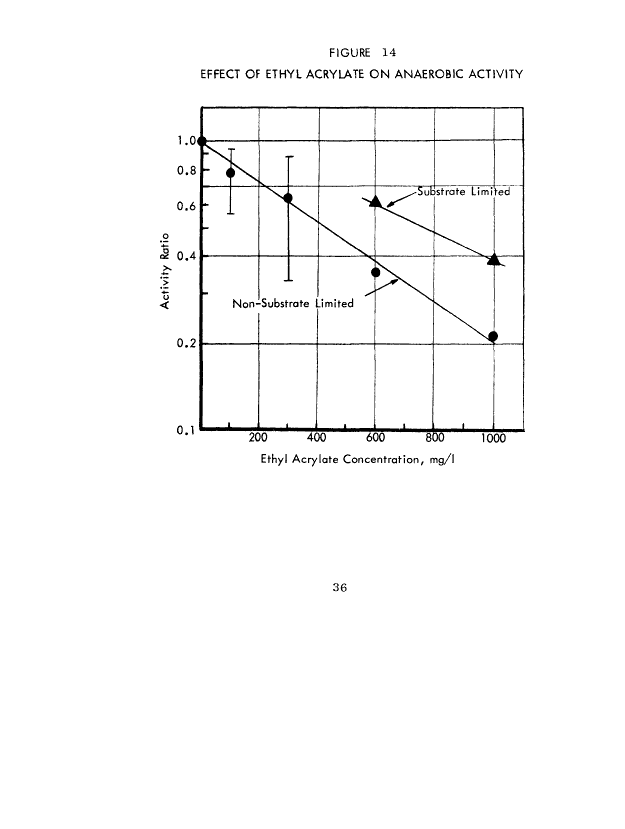
(150-500 mg/1), ethyl acrylate (300-600 mg/1), and
phenol (300-LOOO mg/1). Inhibitory effects were more
severe at high volatile acid concentrations.
Acclimation of anaerobic biomass to crotonaldehyde,
phenol, ethyl acrylate, and sodium acrylate was studied
in mixed digesters. An acclimated culture was developed
for crotonaldehyde, phenol, and to some degree to ethyl
acrylate. No acclimation was observed for sodium acrylate.
Cultures acclimated to crotonaldehyde and ethyl acrylate
were able to degrade the material while phenol was not
degraded with acclimation but was no longer inhibitory.
Additional acclimation studies were made in continuously
fed anaerobic filters. A filter was acclimated to a
crotonaldehyde concentration of 600 mg/1 as compared to
the 50-100 mg/1 inhibitory in Warburg studies. Treatment
of formaldehyde, ethyl acrylate, phenol, and acrylonitrile
indicated synergestic inhibitory effects. These mixed
inhibitors were treated satisfactorily at low concentra-
tions in two series anaerobic filters, however, increasing
inhibitor concentrations resulted in failure of both
filters. Actual waste streams treated in an anaerobic
filter indicated that inhibition from crotonaldehyde
could be avoided in a chemical manufacturing waste by
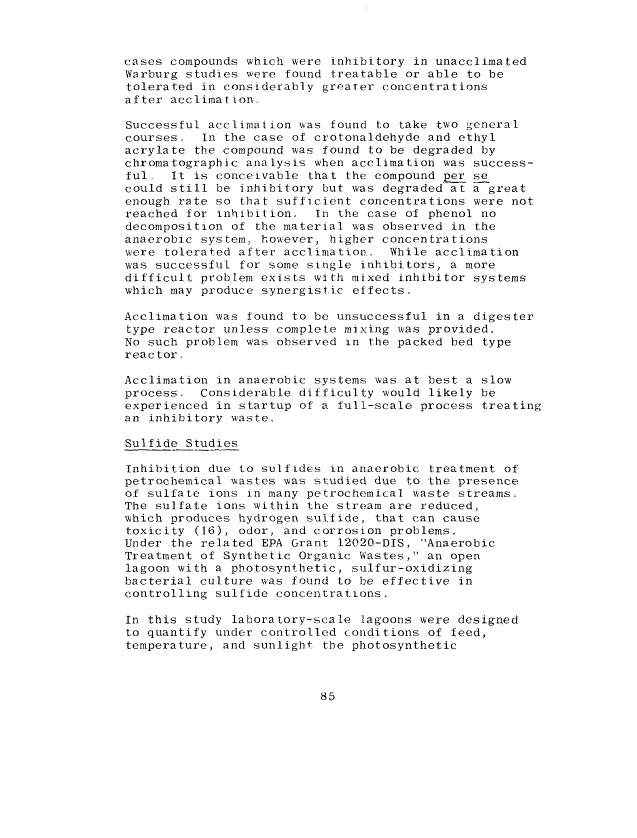
dilution. Successful treatment of "hard" surfactant
containing wastes was also noted. Other means of
overcoming inhibition were discussed.
111
image:
ABSTRACT
Identification studies were made on potentially
inhibitory materials using a Warburg respirometer
procedure and an unacclimated anaerobic biomass.
Identified inhibitory materials and concentrations for a
50 percent decrease in activity were acrolein (20-50 mg/1),
formaldehyde (50-100 mg/1), 2-ethyl-l-hexanol
(500-1000 mg/1), methyl isobutyl ketone (100-300 mg/1),
diethylamine (300-1000 mg/1), acrylonitrile (100 mg/1),
2-methyl-5-ethylpyridine (100 mg/1), ethylene dichloride
(150-500 mg/1), ethyl acrylate (300-600 mg/1), and
phenol (300-LOOO mg/1). Inhibitory effects were more
severe at high volatile acid concentrations.
Acclimation of anaerobic biomass to crotonaldehyde,
phenol, ethyl acrylate, and sodium acrylate was studied
in mixed digesters. An acclimated culture was developed
for crotonaldehyde, phenol, and to some degree to ethyl
acrylate. No acclimation was observed for sodium acrylate.
Cultures acclimated to crotonaldehyde and ethyl acrylate
were able to degrade the material while phenol was not
degraded with acclimation but was no longer inhibitory.
Additional acclimation studies were made in continuously
fed anaerobic filters. A filter was acclimated to a
crotonaldehyde concentration of 600 mg/1 as compared to
the 50-100 mg/1 inhibitory in Warburg studies. Treatment
of formaldehyde, ethyl acrylate, phenol, and acrylonitrile
indicated synergestic inhibitory effects. These mixed
inhibitors were treated satisfactorily at low concentra-
tions in two series anaerobic filters, however, increasing
inhibitor concentrations resulted in failure of both
filters. Actual waste streams treated in an anaerobic
filter indicated that inhibition from crotonaldehyde
could be avoided in a chemical manufacturing waste by
dilution. Successful treatment of "hard" surfactant
containing wastes was also noted. Other means of
overcoming inhibition were discussed.
111
image:
 image:
 CONTENTS
Section Page
I Conclusions 1
II Recommendations 3
III Introduction 5
IV Identification of Inhibitory 7
Chemicals
V Control of Inhibitory Materials 45
VI Acknowledgements 95
VII References 97
VIII Appendix 99
image:
CONTENTS
Section Page
I Conclusions 1
II Recommendations 3
III Introduction 5
IV Identification of Inhibitory 7
Chemicals
V Control of Inhibitory Materials 45
VI Acknowledgements 95
VII References 97
VIII Appendix 99
image:
 FIGURES
No. Page
1 Effect of Various Compounds on 9
Anaerobic Activity of
Domestic Sludge
2 Fed-Warburg Data Collection and 16
Handling
3 Typical Warburg Respirometer Test 17
Data
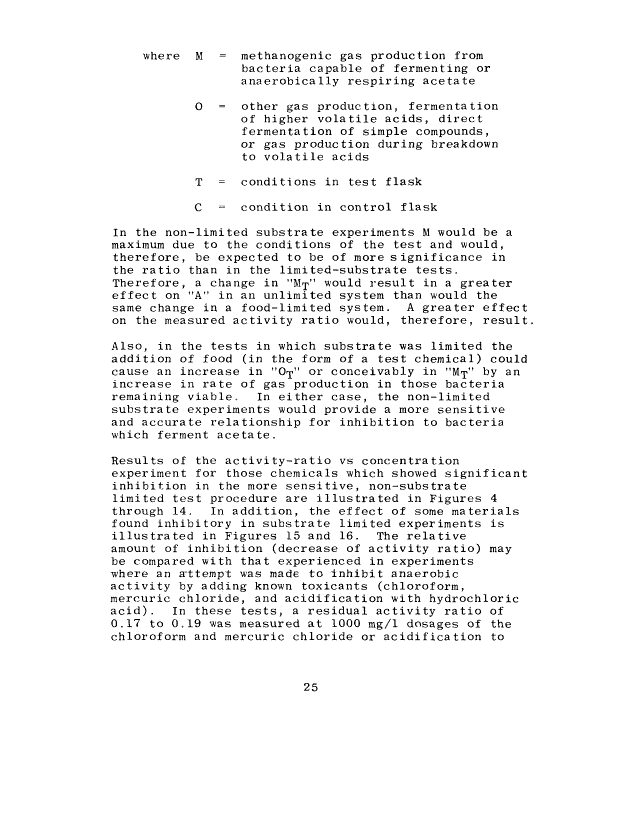
4 Effect of Acrolein on Anaerobic 26
Activity
5 Effect of Crotonaldehyde on 27
Anaerobic Activity
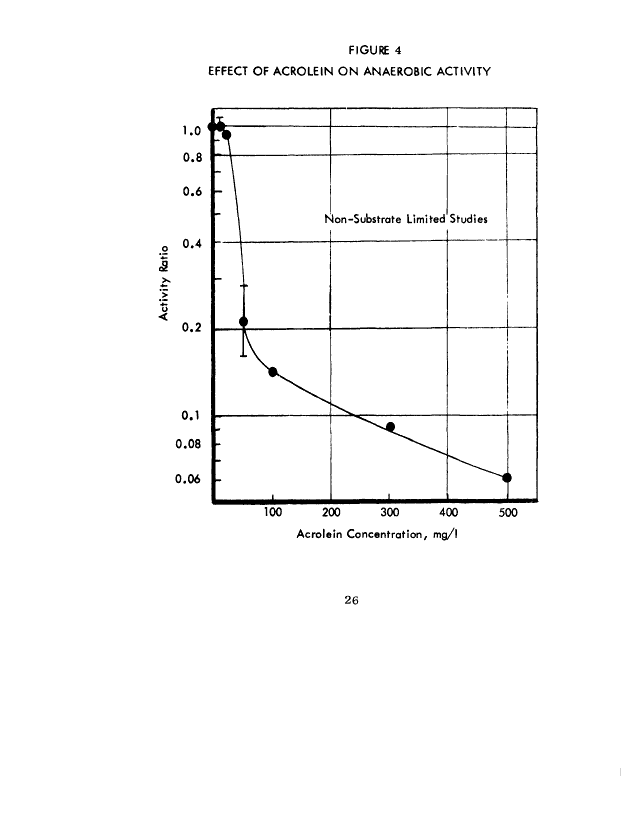
6 Effect of Formaldehyde on Anaerobic 28
Activity
7 Effect of Methyl Isobutyl Ketone 29
on Anaerobic Activity
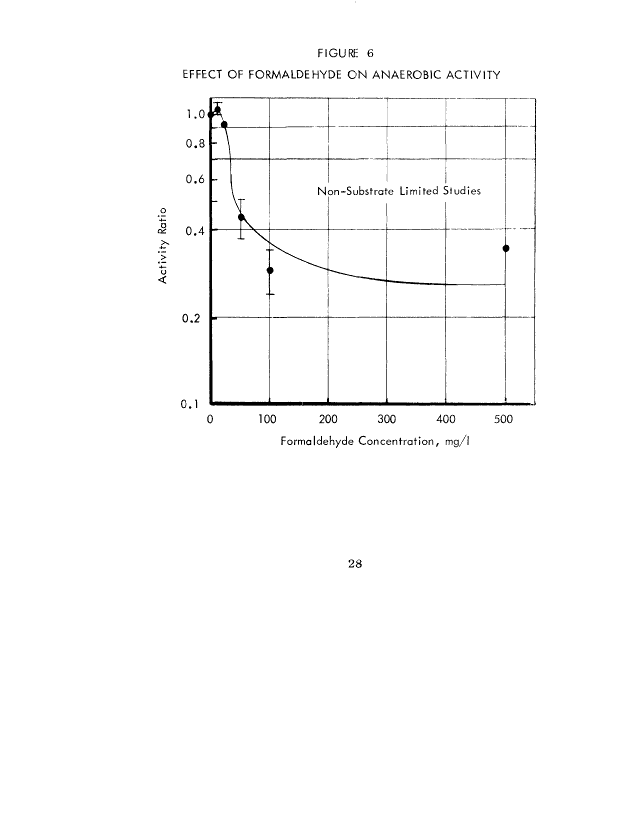
8 Effect of Ethylenediamine on 30
Anaerobic Activity
9 Effect of Diethylamine on Anaerobic 31
Activity
10 Effect of Acrylonitrile on Anaerobic 32
Activity
11 Effect of 2-Methyl-5-Ethylpyridine 33
on Anaerobic Activity
12 Effect of Phenol on Anaerobic Activity 34
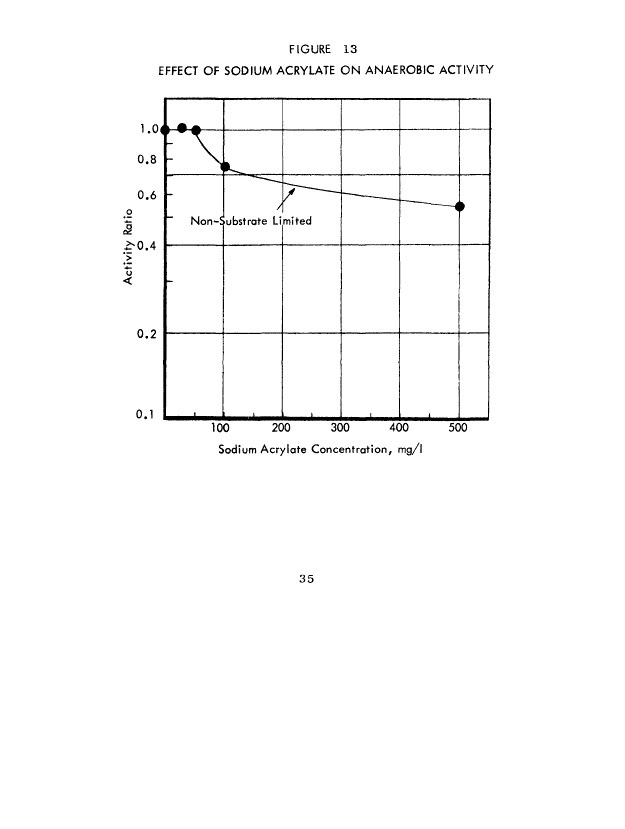
13 Effect of Sodium Acrylate on 35
Anaerobic Activity
14 Effect of Ethyl Acrylate on Anaerobic 36
Activity
15 Effect of 2-Ethyl-l-hexanol on 37
Anaerobic Activity
vi
image:
FIGURES
No. Page
1 Effect of Various Compounds on 9
Anaerobic Activity of
Domestic Sludge
2 Fed-Warburg Data Collection and 16
Handling
3 Typical Warburg Respirometer Test 17
Data
4 Effect of Acrolein on Anaerobic 26
Activity
5 Effect of Crotonaldehyde on 27
Anaerobic Activity
6 Effect of Formaldehyde on Anaerobic 28
Activity
7 Effect of Methyl Isobutyl Ketone 29
on Anaerobic Activity
8 Effect of Ethylenediamine on 30
Anaerobic Activity
9 Effect of Diethylamine on Anaerobic 31
Activity
10 Effect of Acrylonitrile on Anaerobic 32
Activity
11 Effect of 2-Methyl-5-Ethylpyridine 33
on Anaerobic Activity
12 Effect of Phenol on Anaerobic Activity 34
13 Effect of Sodium Acrylate on 35
Anaerobic Activity
14 Effect of Ethyl Acrylate on Anaerobic 36
Activity
15 Effect of 2-Ethyl-l-hexanol on 37
Anaerobic Activity
vi
image:
 No. Page
16 Effect of Ethylene Bichloride on 38
Anaerobic Activity
17 Batch-Fed Anaerobic Reactors 47
18 Batch-Fed Completely Mixed Anaerobic 48
Reactors
19 Acclimation Studies with Crotonaldehyde 50
20 Acclimation Studies with Ethyl Acrylate 51
21 Acclimation Studies with Methyl Ethyl 52
Pyridine
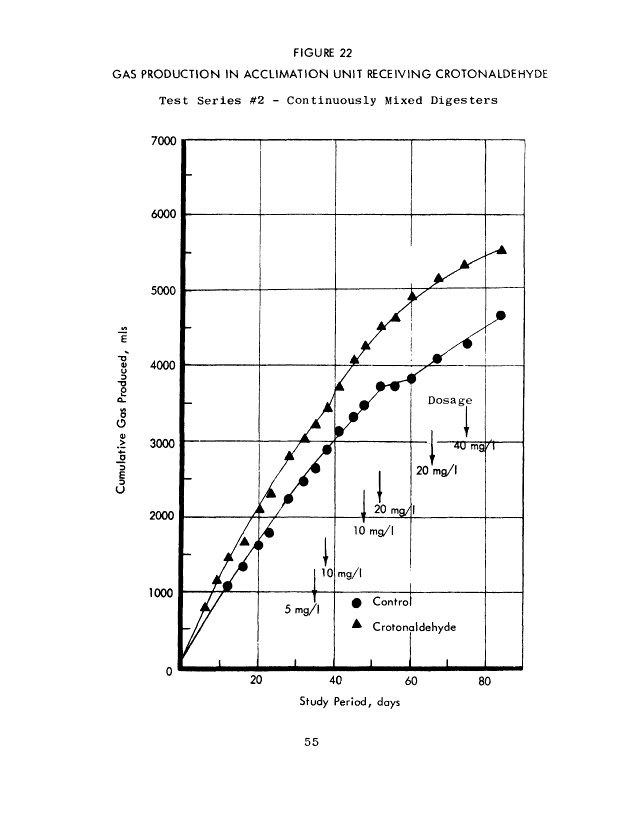
22 Gas Production in Acclimation Unit 55
Receiving Crotonaldehyde
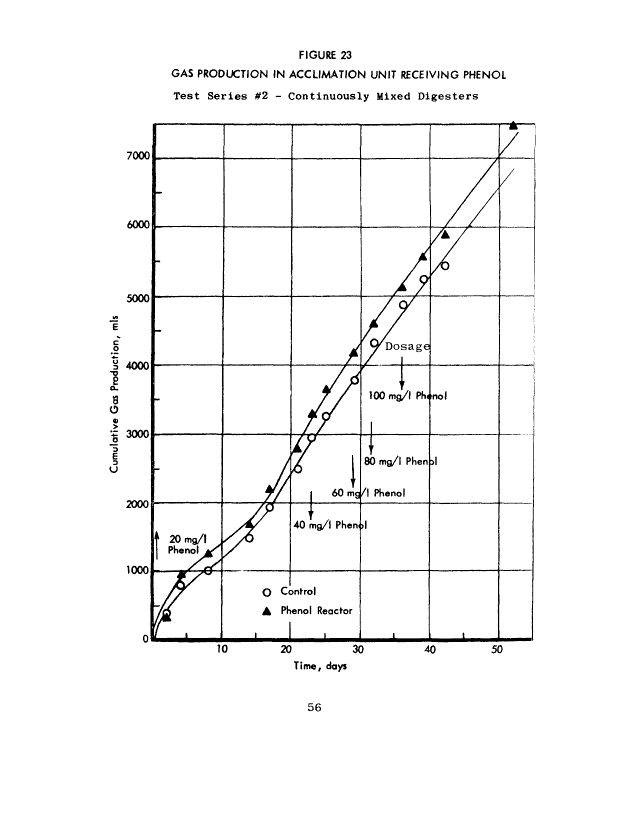
23 Gas Production in Acclimation Unit 56
Receiving Phenol
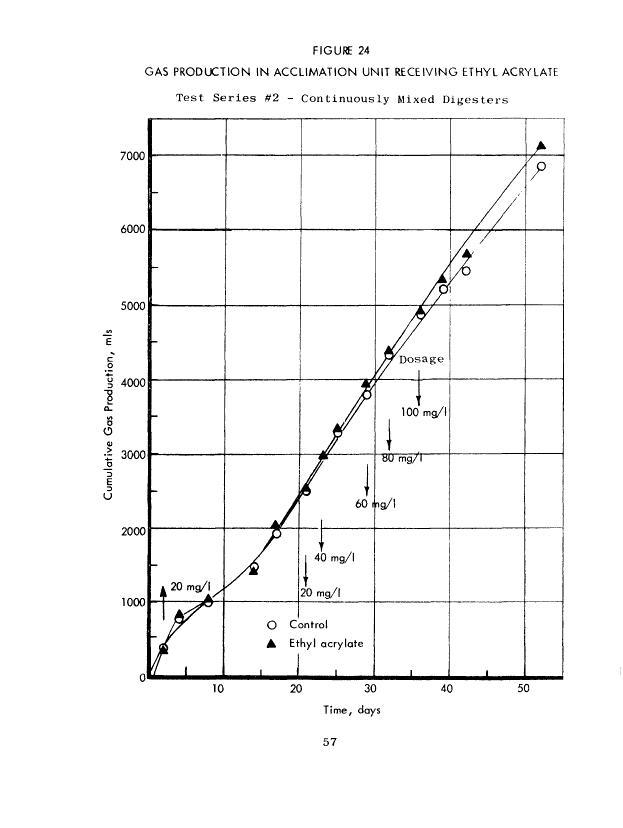
24 Gas Production in Acclimation Unit 57
Receiving Ethyl Acrylate
25 Gas Production in Acclimation Unit 58
Receiving Sodium Acrylate
26 Warburg Test of Acclimation to 59
Crotonaldehyde
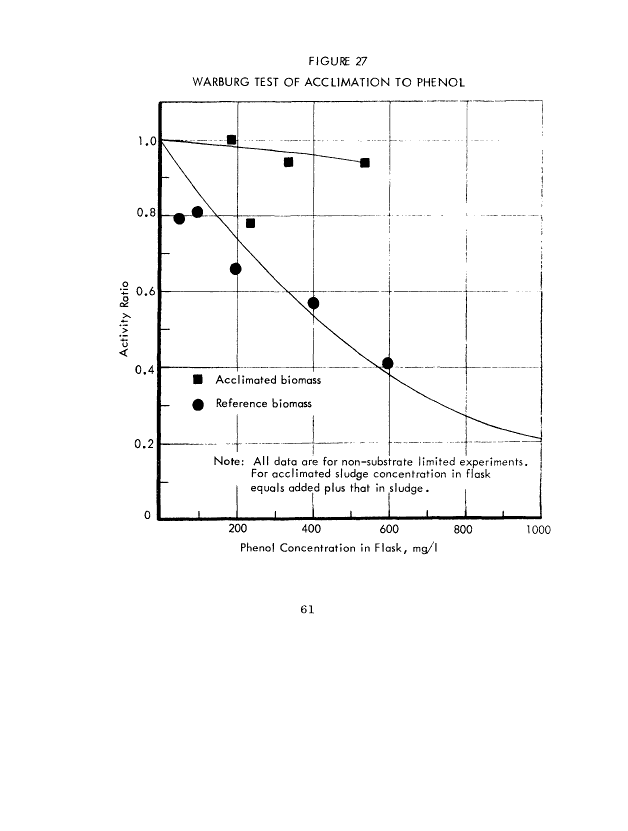
27 Warburg Test of Acclimation to Phenol 61
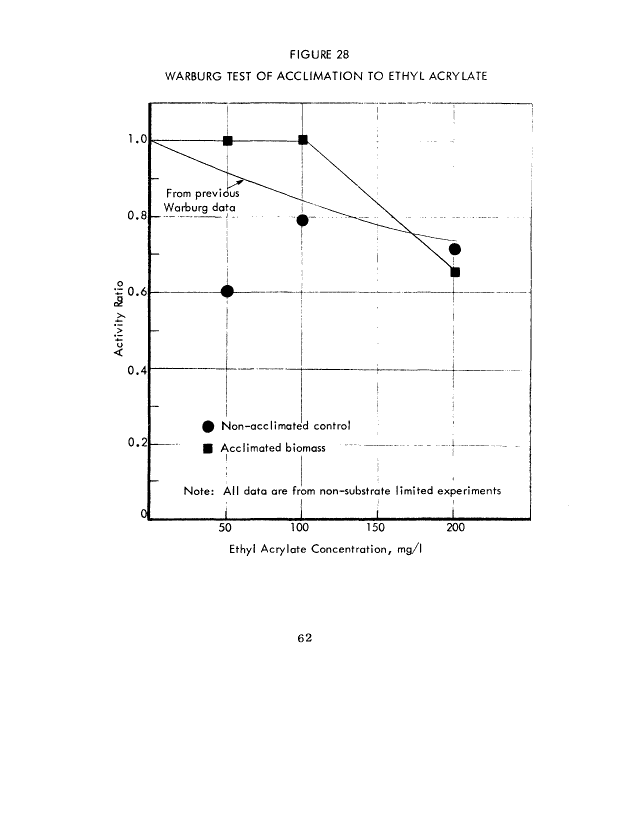
28 Warburg Test of Acclimation to Ethyl 62
Acrylate
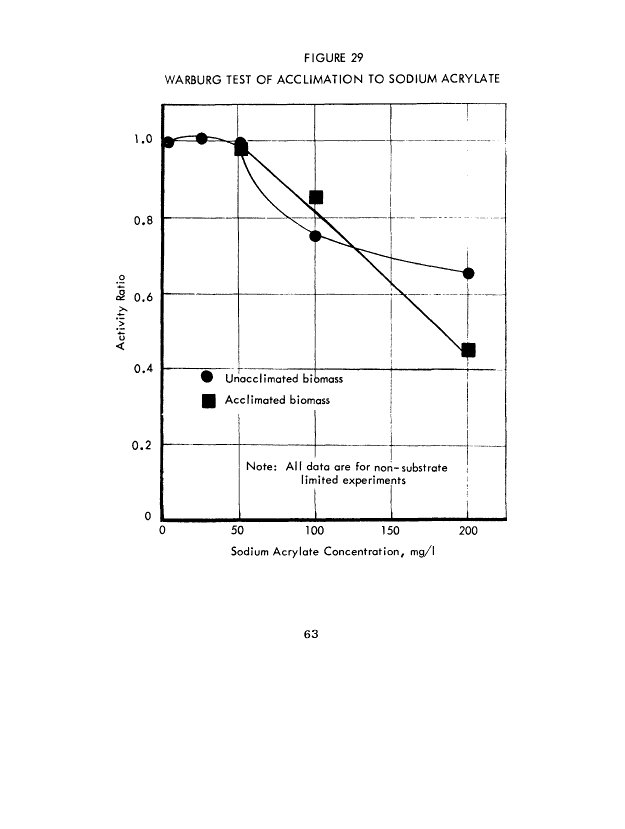
29 Warburg Test of Acclimation to Sodium 63
Acrylate
30 Packed-Bed Anaerobic Reactor 66
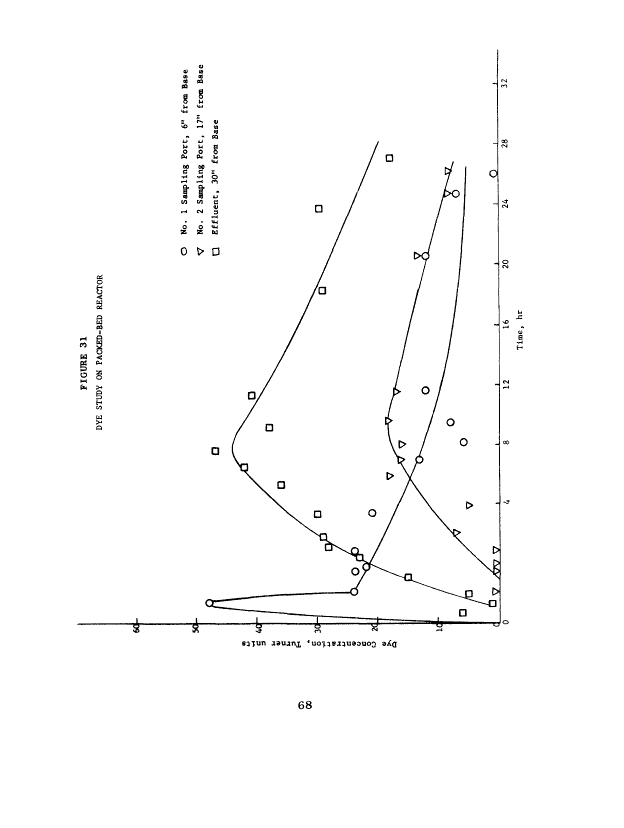
31 Dye Study on Packed-Bed Reactor 68
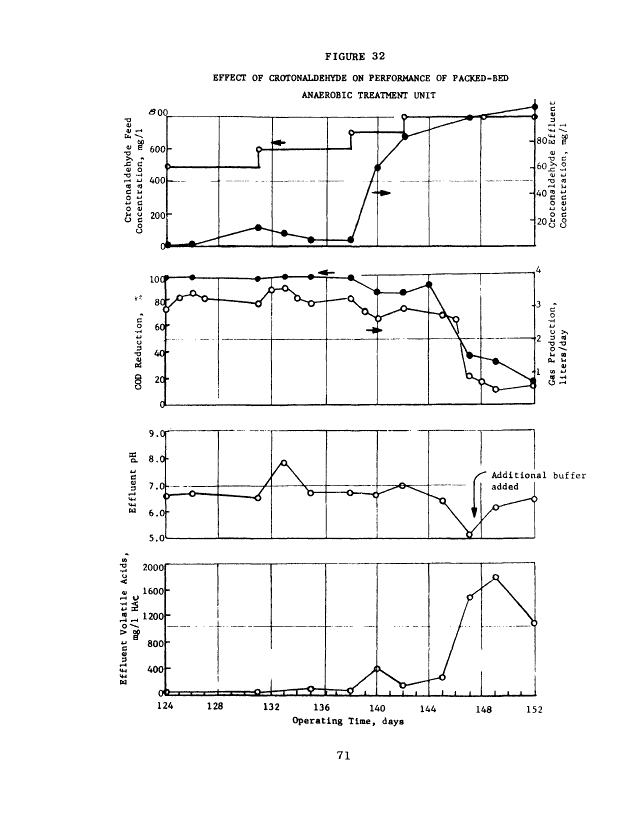
32 Effect of Crotonaldehyde on Performance 71
of Packed-Bed Anaerobic Treatment
Unit
vii
image:
No. Page
16 Effect of Ethylene Bichloride on 38
Anaerobic Activity
17 Batch-Fed Anaerobic Reactors 47
18 Batch-Fed Completely Mixed Anaerobic 48
Reactors
19 Acclimation Studies with Crotonaldehyde 50
20 Acclimation Studies with Ethyl Acrylate 51
21 Acclimation Studies with Methyl Ethyl 52
Pyridine
22 Gas Production in Acclimation Unit 55
Receiving Crotonaldehyde
23 Gas Production in Acclimation Unit 56
Receiving Phenol
24 Gas Production in Acclimation Unit 57
Receiving Ethyl Acrylate
25 Gas Production in Acclimation Unit 58
Receiving Sodium Acrylate
26 Warburg Test of Acclimation to 59
Crotonaldehyde
27 Warburg Test of Acclimation to Phenol 61
28 Warburg Test of Acclimation to Ethyl 62
Acrylate
29 Warburg Test of Acclimation to Sodium 63
Acrylate
30 Packed-Bed Anaerobic Reactor 66
31 Dye Study on Packed-Bed Reactor 68
32 Effect of Crotonaldehyde on Performance 71
of Packed-Bed Anaerobic Treatment
Unit
vii
image:
 No. Page
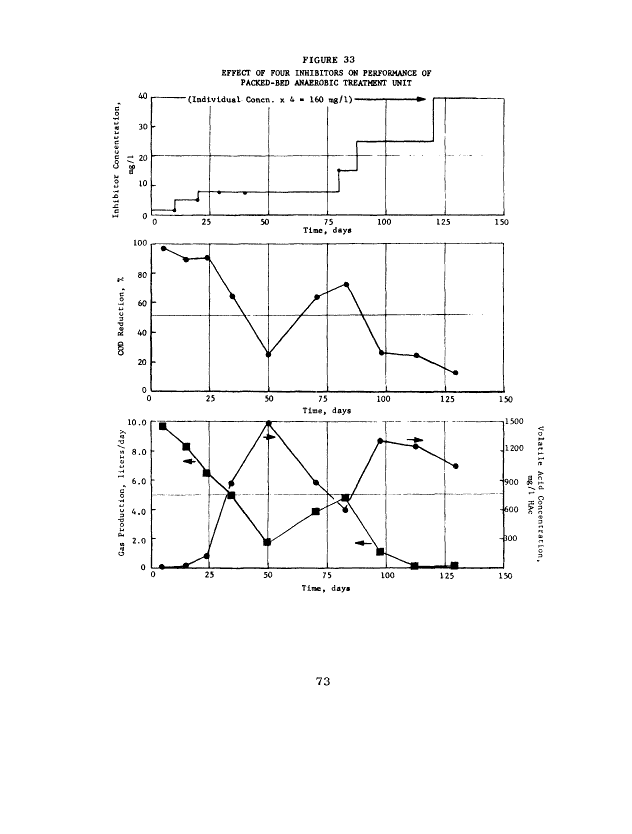
33 Effect of Four Inhibitors on Performance 73
of Packed-Bed Anaerobic Treatment Unit
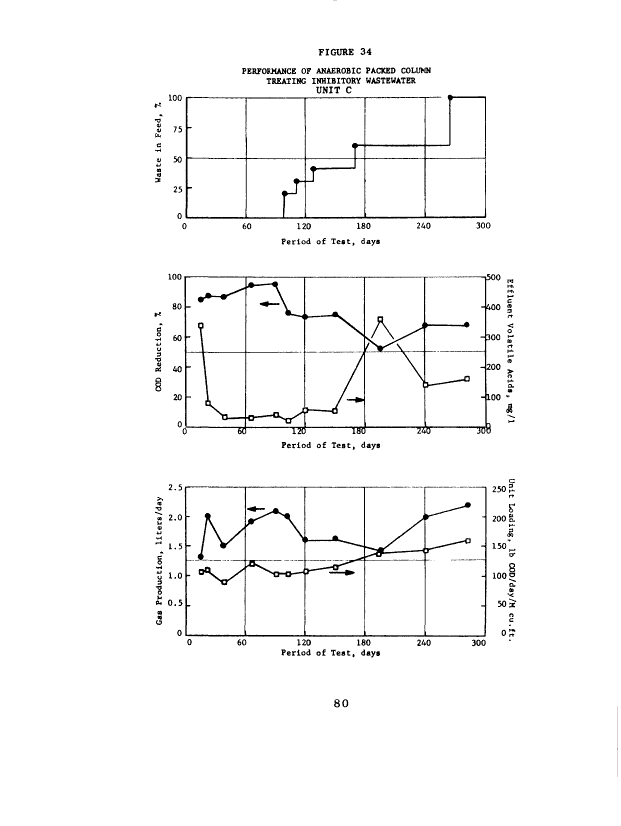
34 Performance of Anaerobic Packed Column 80
Treating Inhibitory Wastewater
35 Peformance of Anaerobic Packed Column 84
Treating Surfactant Containing
Wastewater
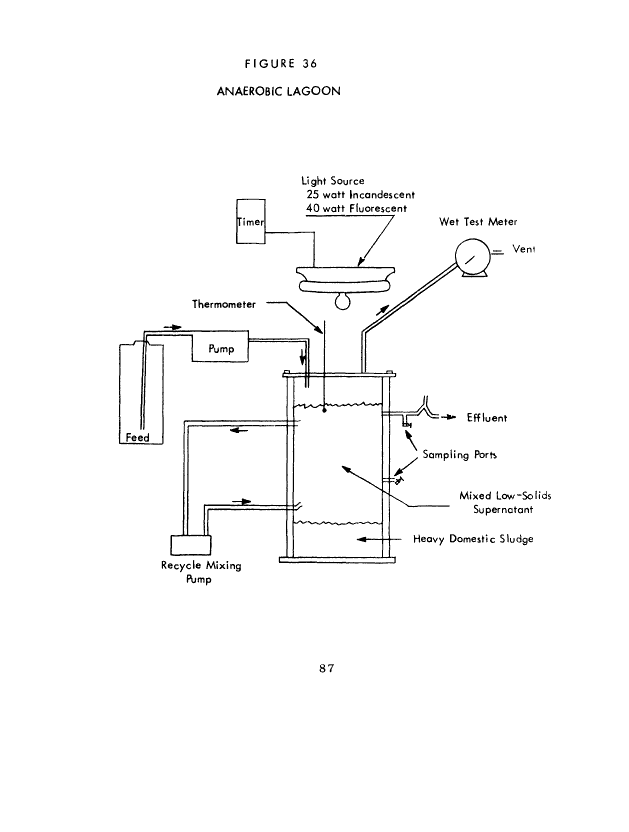
36 Anaerobic Lagoon 87
37 Lagoon Sulfate-Sulfide Concentrations 93
Vlll
image:
No. Page
33 Effect of Four Inhibitors on Performance 73
of Packed-Bed Anaerobic Treatment Unit
34 Performance of Anaerobic Packed Column 80
Treating Inhibitory Wastewater
35 Peformance of Anaerobic Packed Column 84
Treating Surfactant Containing
Wastewater
36 Anaerobic Lagoon 87
37 Lagoon Sulfate-Sulfide Concentrations 93
Vlll
image:
 TABLES
No. Page
1 Effect of Various Compounds Toward 11
Anaerobic Biological Treatment
2 Computation of Rate of Substrate 13
Removal at Various Substrate
Concentrations
3 Rate of Gas Production at Various 14
Supplemental Acetate Levels
4 Chemical Structures Evaluated in 19
Warburg Inhibition Studies
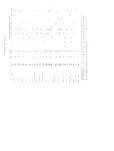
5 Individual Warburg Inhibition Data 22
for Non-Substrate-Limiting
Conditions
6 Summary of Effects of Tested Materials 23
on Anaerobic Activity
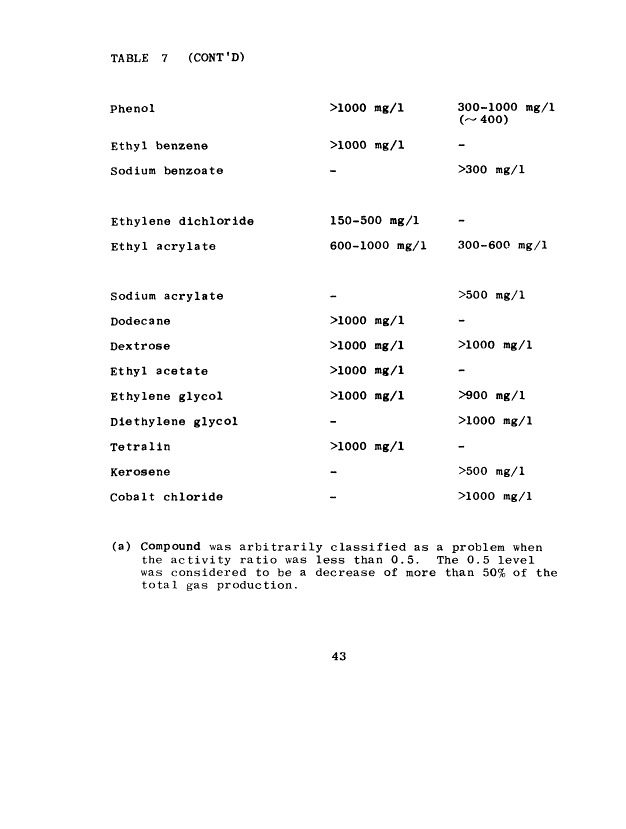
7 Identified Problem Concentrations of 42
Tested Materials
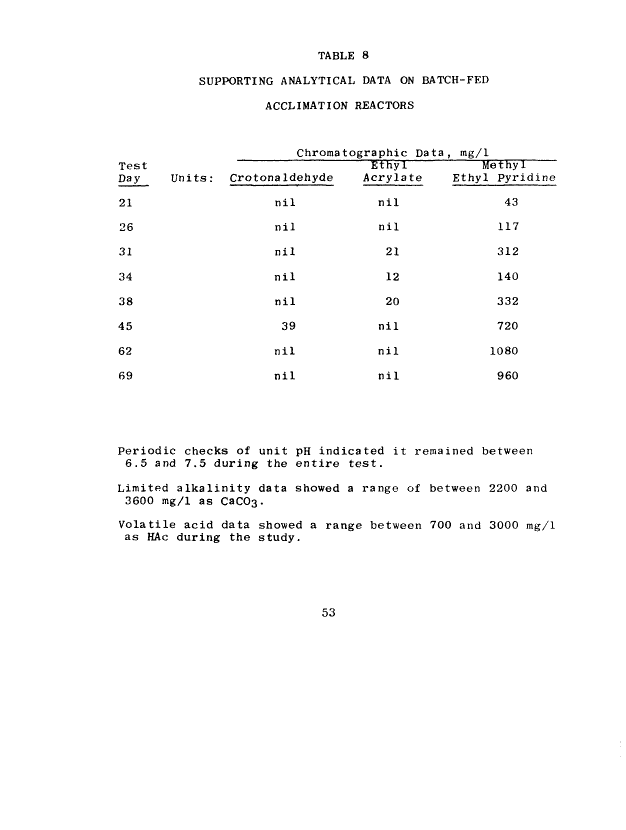
8 Supporting Analytical Data on Batch-Fed 53
Acclimation Reactors
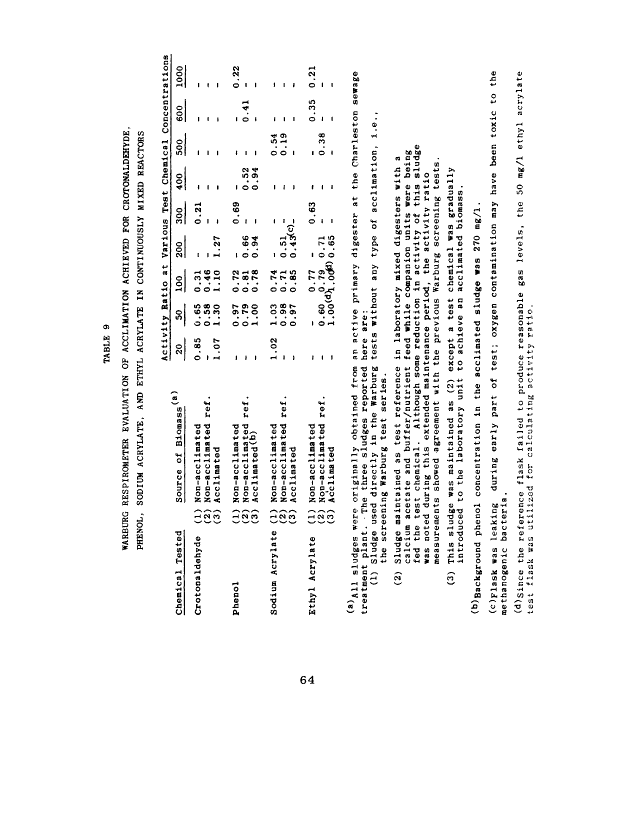
9 Warburg Respirometer Evaluation of 64
Acclimation Achieved for
Crotonaldehyde, Phenol, Sodium
Acrylate, and Ethyl Acrylate in
Continuously Mixed Reactors
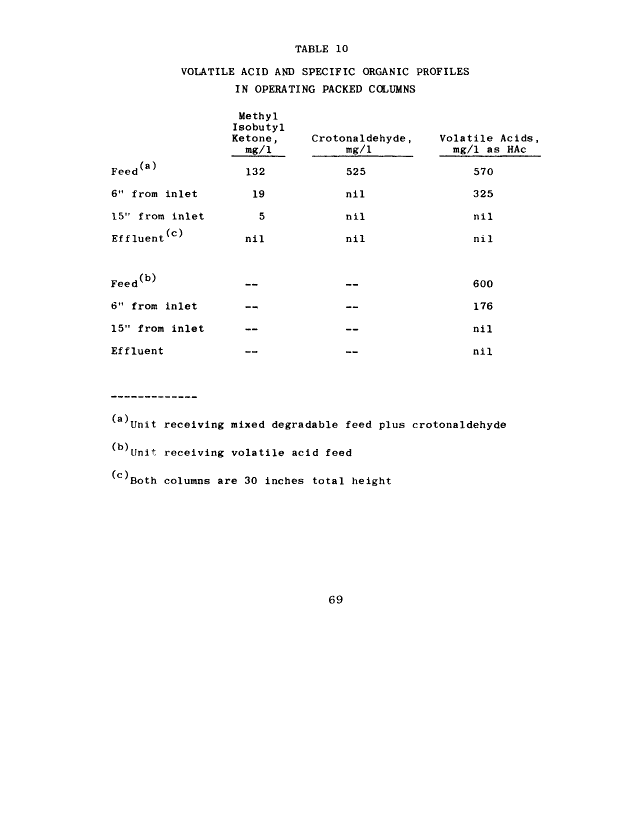
10 Volatile Acid and Specific Organic 69
Profiles in Operating Columns
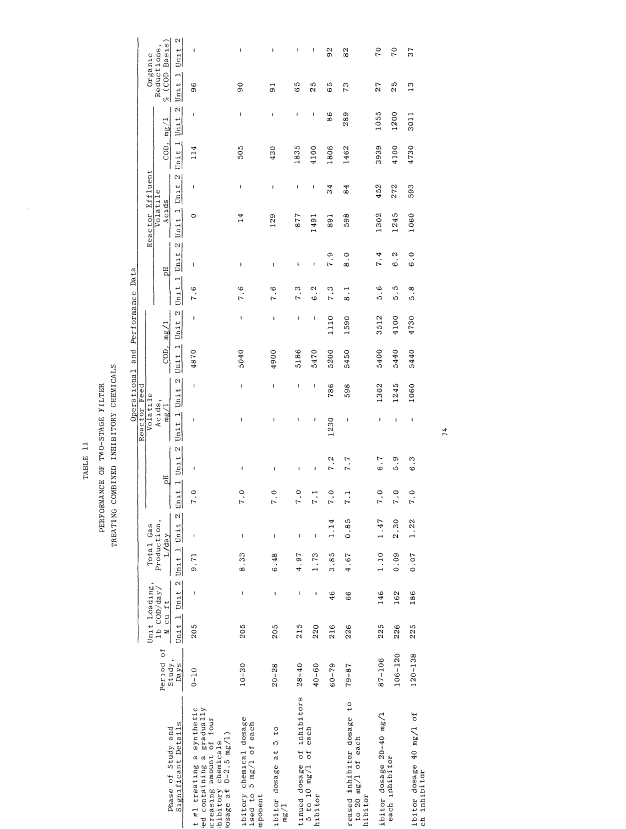
11 Performance of Two-Stage Filter 74
Treating Combined Inhibitory
Chemicals
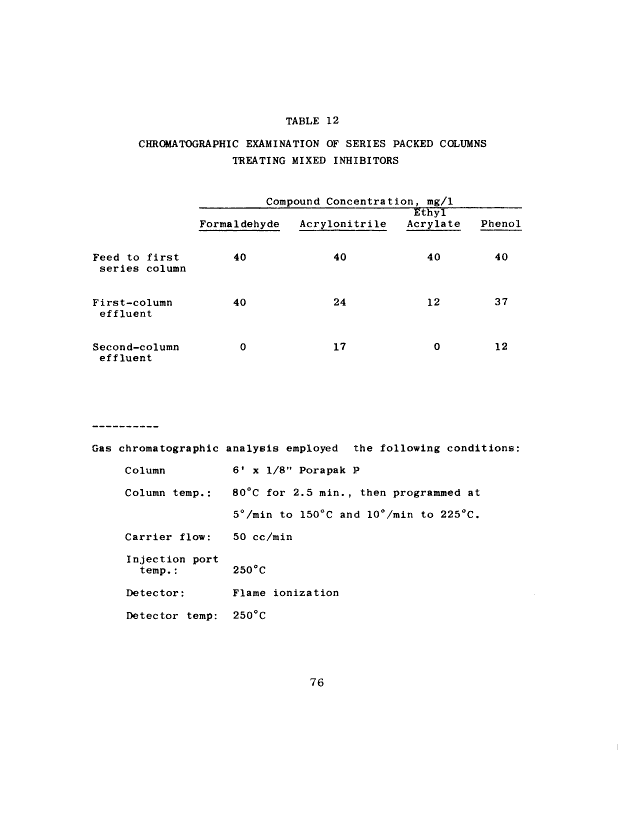
12 Chromatographic Examination of Series 76
Packed Columns Treating Mixed
Inhibitors
IX
image:
TABLES
No. Page
1 Effect of Various Compounds Toward 11
Anaerobic Biological Treatment
2 Computation of Rate of Substrate 13
Removal at Various Substrate
Concentrations
3 Rate of Gas Production at Various 14
Supplemental Acetate Levels
4 Chemical Structures Evaluated in 19
Warburg Inhibition Studies
5 Individual Warburg Inhibition Data 22
for Non-Substrate-Limiting
Conditions
6 Summary of Effects of Tested Materials 23
on Anaerobic Activity
7 Identified Problem Concentrations of 42
Tested Materials
8 Supporting Analytical Data on Batch-Fed 53
Acclimation Reactors
9 Warburg Respirometer Evaluation of 64
Acclimation Achieved for
Crotonaldehyde, Phenol, Sodium
Acrylate, and Ethyl Acrylate in
Continuously Mixed Reactors
10 Volatile Acid and Specific Organic 69
Profiles in Operating Columns
11 Performance of Two-Stage Filter 74
Treating Combined Inhibitory
Chemicals
12 Chromatographic Examination of Series 76
Packed Columns Treating Mixed
Inhibitors
IX
image:
 No. Page
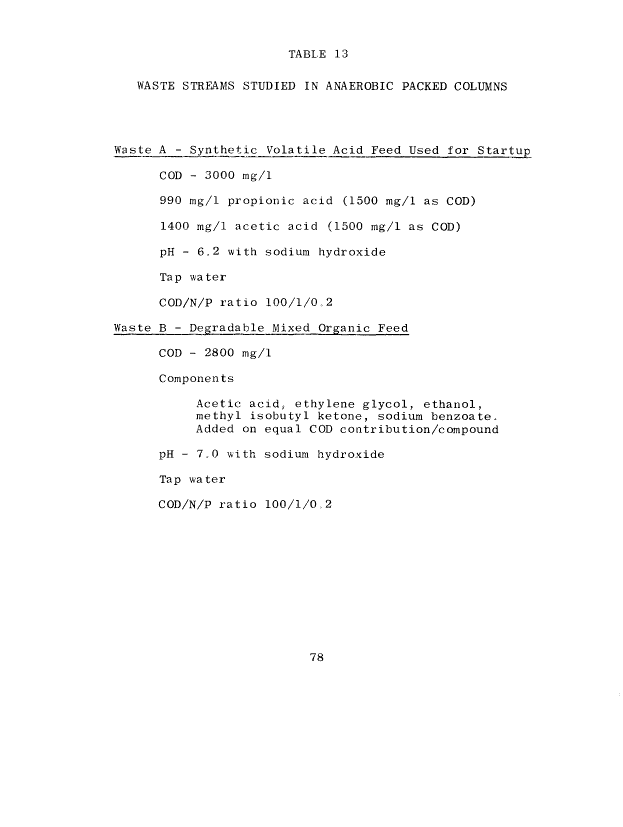
13 Waste Streams Studied in Anaerobic 78
Packed Columns
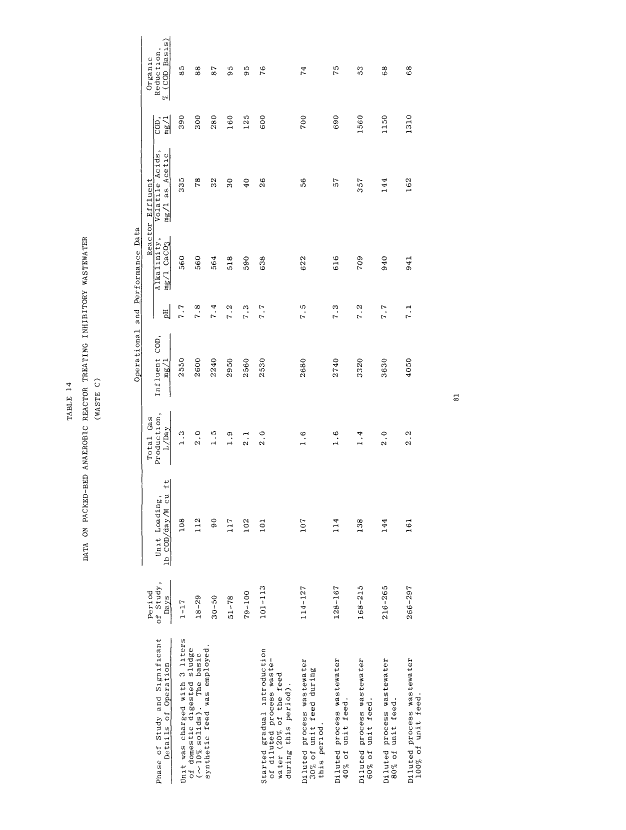
14 Data on Packed-Bed Anaerobic Reactor 81
Treating Inhibitory Wastewater
15 Data on Packed-Bed Anaerobic Reactor 83
Treating Surfactant Containing
Wastewater
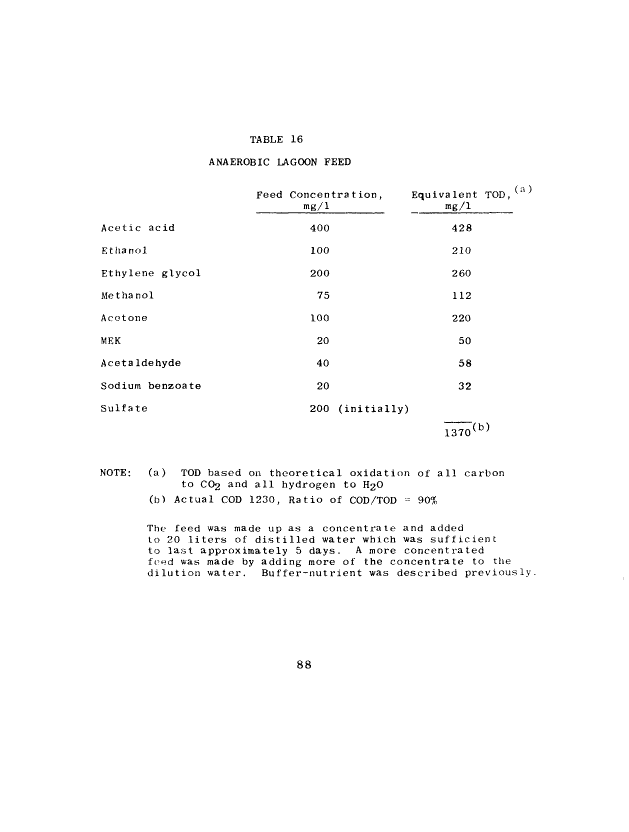
16 Anaerobic Lagoon Feed 88
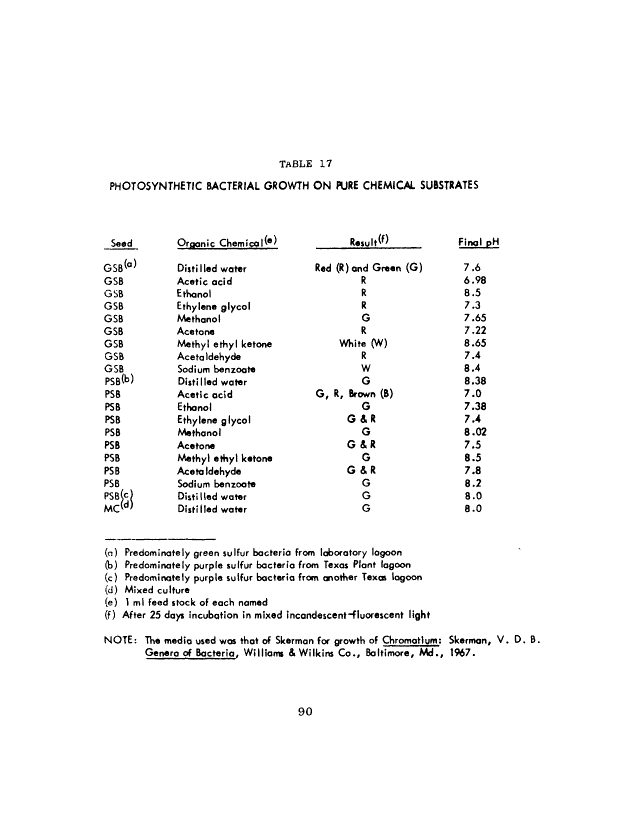
17 Photosynthetic Bacterial Growth on 90
Pure Chemical Substrates
18 Sulfur Lagoon Data 91
x
image:
No. Page
13 Waste Streams Studied in Anaerobic 78
Packed Columns
14 Data on Packed-Bed Anaerobic Reactor 81
Treating Inhibitory Wastewater
15 Data on Packed-Bed Anaerobic Reactor 83
Treating Surfactant Containing
Wastewater
16 Anaerobic Lagoon Feed 88
17 Photosynthetic Bacterial Growth on 90
Pure Chemical Substrates
18 Sulfur Lagoon Data 91
x
image:
 SECTION I
CONCLUSIONS
1. A rapid, reproducible procedure using a Warburg
respirometer was developed to assess and quantify the
inhibitory effect of materials on unacclimated anaerobic
microorganisms which metabolize acetate. This procedure
provides lower threshold limits of material concentration
for inhibition. Greater concentrations could possibly be
tolerated by acclimated anaerobic organisms.
2. The <y<-fi unsaturated aldehydes were particularly
inhibitory to unacclimated anaerobic systems at low
concentrations of 20-100 mg/1. Other materials which
could result in inhibition problems were found to be
2-ethyl-l-hexanol, methyl isobutyl ketone, diethylamine,
ethylenediamine, acrylonitrile, 2-methyl-5-ethylpyridine,
phenol, ethylene dichloride, and ethyl acrylate.
3. Inhibition of gas production was found to be more
severe in a system containing volatile acid concentrations
greater than 500 mg/1 as acetic. Inhibition also occurred
at lower concentrations of test material under these
conditions.
4. Introduction of test material at a gradually increasing
level to continuously mixed batch-fed digesters resulted in
acclimation and increased resistance to inhibition by
crotonaldehyde, ethyl acrylate and phenol. Crotonaldehyde
and ethyl acrylate were degraded completely in the
acclimation digesters, while phenol was not. Similar
acclimation experiments with sodium acrylate indicated
no significant increase in resistance to inhibition.
5. Acclimation of anaerobic microorganisms in mixed
digester cultures was found to be at best a difficult
and long-term procedure with only moderate chances of
success.
6. A continuously fed anaerobic, packed-bed filter was
able to treat successfully a stream containing 600 mg/1
crotonaldehyde at a 1.5 day detention time. Crotonaldehyde
had been proved inhibitory to unacclimated microorganisms
at 50 to 100 mg/1. The column failed at about a concen-
tration range of 700 to 800 mg/1.
image:
SECTION I
CONCLUSIONS
1. A rapid, reproducible procedure using a Warburg
respirometer was developed to assess and quantify the
inhibitory effect of materials on unacclimated anaerobic
microorganisms which metabolize acetate. This procedure
provides lower threshold limits of material concentration
for inhibition. Greater concentrations could possibly be
tolerated by acclimated anaerobic organisms.
2. The <y<-fi unsaturated aldehydes were particularly
inhibitory to unacclimated anaerobic systems at low
concentrations of 20-100 mg/1. Other materials which
could result in inhibition problems were found to be
2-ethyl-l-hexanol, methyl isobutyl ketone, diethylamine,
ethylenediamine, acrylonitrile, 2-methyl-5-ethylpyridine,
phenol, ethylene dichloride, and ethyl acrylate.
3. Inhibition of gas production was found to be more
severe in a system containing volatile acid concentrations
greater than 500 mg/1 as acetic. Inhibition also occurred
at lower concentrations of test material under these
conditions.
4. Introduction of test material at a gradually increasing
level to continuously mixed batch-fed digesters resulted in
acclimation and increased resistance to inhibition by
crotonaldehyde, ethyl acrylate and phenol. Crotonaldehyde
and ethyl acrylate were degraded completely in the
acclimation digesters, while phenol was not. Similar
acclimation experiments with sodium acrylate indicated
no significant increase in resistance to inhibition.
5. Acclimation of anaerobic microorganisms in mixed
digester cultures was found to be at best a difficult
and long-term procedure with only moderate chances of
success.
6. A continuously fed anaerobic, packed-bed filter was
able to treat successfully a stream containing 600 mg/1
crotonaldehyde at a 1.5 day detention time. Crotonaldehyde
had been proved inhibitory to unacclimated microorganisms
at 50 to 100 mg/1. The column failed at about a concen-
tration range of 700 to 800 mg/1.
image:
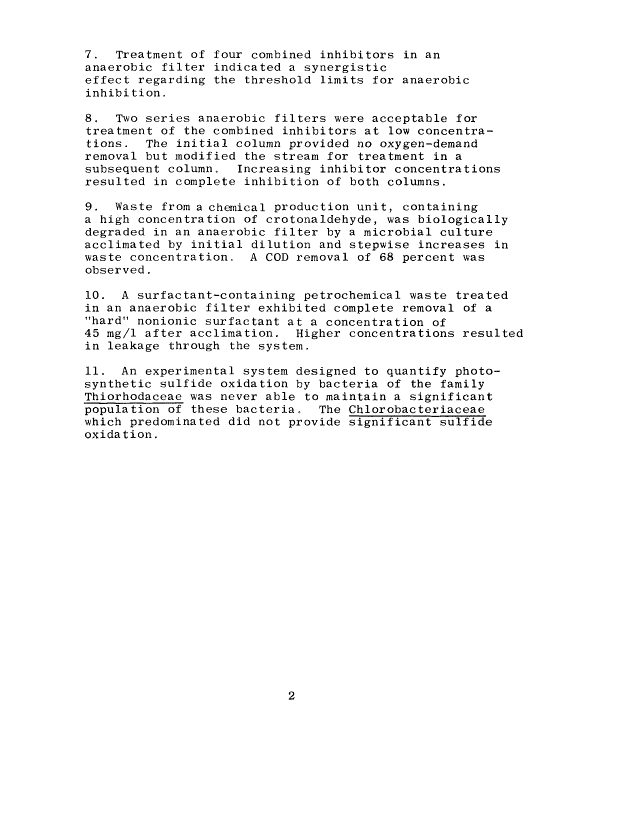
 7. Treatment of four combined inhibitors in an
anaerobic filter indicated a synergistic
effect regarding the threshold limits for anaerobic
inhibition.
8. Two series anaerobic filters were acceptable for
treatment of the combined inhibitors at low concentra-
tions. The initial column provided no oxygen-demand
removal but modified the stream for treatment in a
subsequent column. Increasing inhibitor concentrations
resulted in complete inhibition of both columns.
9. Waste from a chemical production unit, containing
a high concentration of crotonaldehyde, was biologically
degraded in an anaerobic filter by a microbial culture
acclimated by initial dilution and stepwise increases in
waste concentration. A COD removal of 68 percent was
observed.
10. A surfactant-containing petrochemical waste treated
in an anaerobic filter exhibited complete removal of a
"hard" nonionic surfactant at a concentration of
45 mg/1 after acclimation. Higher concentrations resulted
in leakage through the system.
11. An experimental system designed to quantify photo-
synthetic sulfide oxidation by bacteria of the family
Thiorhodaceae was never able to maintain a significant
population of these bacteria. The Chlorobacteriaceae
which predominated did not provide significant sulfide
oxidation.
image:
7. Treatment of four combined inhibitors in an
anaerobic filter indicated a synergistic
effect regarding the threshold limits for anaerobic
inhibition.
8. Two series anaerobic filters were acceptable for
treatment of the combined inhibitors at low concentra-
tions. The initial column provided no oxygen-demand
removal but modified the stream for treatment in a
subsequent column. Increasing inhibitor concentrations
resulted in complete inhibition of both columns.
9. Waste from a chemical production unit, containing
a high concentration of crotonaldehyde, was biologically
degraded in an anaerobic filter by a microbial culture
acclimated by initial dilution and stepwise increases in
waste concentration. A COD removal of 68 percent was
observed.
10. A surfactant-containing petrochemical waste treated
in an anaerobic filter exhibited complete removal of a
"hard" nonionic surfactant at a concentration of
45 mg/1 after acclimation. Higher concentrations resulted
in leakage through the system.
11. An experimental system designed to quantify photo-
synthetic sulfide oxidation by bacteria of the family
Thiorhodaceae was never able to maintain a significant
population of these bacteria. The Chlorobacteriaceae
which predominated did not provide significant sulfide
oxidation.
image:
 SECTION II
RECOMMENDATIONS
It is recommended that:
1. Long-term continuously-fed reaction studies tailored
to the expected treatment conditions be conducted for
wastes having a mixture of anaerobic inhibitors or a
system which will receive a continuous inhibitor dosage
due to
a) The synergestic effects of mixed inhibitors.
b) The variation of inhibitory effect with
system volatile acid levels.
c) Bioacclimation which can be achieved with
certain potentially inhibitory chemicals.
2. That the "activity ratio" procedure be utilized to
determine approximate concentration limits for single
material inhibition of unacclimated anaerobic systems.
Such ratios would reflect the effects of "slug" doses
on anaerobic systems.
3. That further study of photosynthetic, sulfur-
oxidizing bacteria be conducted including the environ-
mental conditions for optimal growth and the effects
of petrochemical waste constituents on metabolism.
Field studies are recommended since a significant
population of these bacteria could not be maintained
during laboratory studies conducted as part of this
project.
4. Experimental results obtained by using acclimated
sludge on a limited basis warrants further work in this
area. It would be expected that highest activity
ratios would be obtained by using an acclimated biota.
image:
SECTION II
RECOMMENDATIONS
It is recommended that:
1. Long-term continuously-fed reaction studies tailored
to the expected treatment conditions be conducted for
wastes having a mixture of anaerobic inhibitors or a
system which will receive a continuous inhibitor dosage
due to
a) The synergestic effects of mixed inhibitors.
b) The variation of inhibitory effect with
system volatile acid levels.
c) Bioacclimation which can be achieved with
certain potentially inhibitory chemicals.
2. That the "activity ratio" procedure be utilized to
determine approximate concentration limits for single
material inhibition of unacclimated anaerobic systems.
Such ratios would reflect the effects of "slug" doses
on anaerobic systems.
3. That further study of photosynthetic, sulfur-
oxidizing bacteria be conducted including the environ-
mental conditions for optimal growth and the effects
of petrochemical waste constituents on metabolism.
Field studies are recommended since a significant
population of these bacteria could not be maintained
during laboratory studies conducted as part of this
project.
4. Experimental results obtained by using acclimated
sludge on a limited basis warrants further work in this
area. It would be expected that highest activity
ratios would be obtained by using an acclimated biota.
image:
 image:
 SECTION III
INTRODUCTION
Treatment of aqueous wastes from petrochemical manufac-
turing facilities has been found to be complicated com-
ponents inhibitory to biological treatment systems at
relatively low concentrations (1, 2). During an EPA
funded anaerobic process development grant (12020-DIS),
the use of high rate anaerobic systems was precluded
due to inhibition problems. While considerable
experimental effort has been spent on the behavior of
specific synthetic organic materials in aerobic
systems (3-8), virtually no work has been published on
inhibition in anaerobic systems with the exceptions of
volatile acids and inorganic materials (9). With the
development of anaerobic processes specifically for
petrochemical wastes (1, 2, 10), the need for inhibition
data on specific materials is apparent. Such data are
also needed for operation of anaerobic digesters receiving
sludges from aerobic systems treating petrochemical
wastes.
Inhibition of a microbiological process may result from
a general effect on the environment of the process as a
whole, or effects on the specific cells or enzymes
within the process. As an example, addition of a strong
acid in excess of system buffering capacity would result
in inhibition due to low system pH while a mercury salt
will combine with the enzymes containing sulfur in thiol
groups (-SH) thus inhibiting activity. As the general
environmental limits for anaerobic treatment are well
defined and every attempt is made to control these in a
treatment process, this study was centered on the effects
of materials which would act on cellular constituents or
enzyme systems.
Inhibition of a chemical on a cellular constituent may
be the result of a reaction with some essential group of a
protein or other molecule or adsorption at the cell
surface. Such a reaction may result in conversion
of a metabolically active substance to an inactive
substance or a change in cell permeability. An example
of reaction with an essential group of a protein would
be the mercury-thiol bonding while surface active
materials such as phenols are inhibitory due to inter-
ference with cellular permeability.
image:
SECTION III
INTRODUCTION
Treatment of aqueous wastes from petrochemical manufac-
turing facilities has been found to be complicated com-
ponents inhibitory to biological treatment systems at
relatively low concentrations (1, 2). During an EPA
funded anaerobic process development grant (12020-DIS),
the use of high rate anaerobic systems was precluded
due to inhibition problems. While considerable
experimental effort has been spent on the behavior of
specific synthetic organic materials in aerobic
systems (3-8), virtually no work has been published on
inhibition in anaerobic systems with the exceptions of
volatile acids and inorganic materials (9). With the
development of anaerobic processes specifically for
petrochemical wastes (1, 2, 10), the need for inhibition
data on specific materials is apparent. Such data are
also needed for operation of anaerobic digesters receiving
sludges from aerobic systems treating petrochemical
wastes.
Inhibition of a microbiological process may result from
a general effect on the environment of the process as a
whole, or effects on the specific cells or enzymes
within the process. As an example, addition of a strong
acid in excess of system buffering capacity would result
in inhibition due to low system pH while a mercury salt
will combine with the enzymes containing sulfur in thiol
groups (-SH) thus inhibiting activity. As the general
environmental limits for anaerobic treatment are well
defined and every attempt is made to control these in a
treatment process, this study was centered on the effects
of materials which would act on cellular constituents or
enzyme systems.
Inhibition of a chemical on a cellular constituent may
be the result of a reaction with some essential group of a
protein or other molecule or adsorption at the cell
surface. Such a reaction may result in conversion
of a metabolically active substance to an inactive
substance or a change in cell permeability. An example
of reaction with an essential group of a protein would
be the mercury-thiol bonding while surface active
materials such as phenols are inhibitory due to inter-
ference with cellular permeability.
image:
 Enzyme inhibition results from competition between the
inhibitor and substrate for attachment sites on the
enzyme, an attraction of the inhibitor for a part of
the enzyme, or destruction of an essential functional
group of the enzyme. The relative effect of any inhibitory
material on a microbial process may be expected to depend
on the properties of the microbial growth. As an
example, rapidly growing cells would be expected
to be more susceptible to inhibitory materials than
slower growing cells since a higher uptake and conversion
of substrate is in progress. Also, microorganisms which
grow in clusters or have slime layers would be expected
to be less sensitive than dispersed organisms as less
opportunity is available for inhibitor-organism contact.
Application of various inhibition theories to an
anaerobic treatment process is complicated by the mixed
biological cultures necessary within the process and the
mixture commonly present in the waste. While a material
may be inhibitory to one type of organism within a
treatment system, there may well be others present
which can degrade the material and thus overcome the
inhibitory effects. Mixed chemicals could also have
synergistic or antagonistic effects on the culture.
In order to develop a widely usable set of data, initial
screening studies for inhibition were performed with a
single material and an unacclimated, mixed anaerobic
culture. Many materials which were found to be
inhibitory in short-term screening studies were then
subjected to acclimation procedures, either as the
single compound or in a real waste stream to measure
long-term effects in more realistic situations.
Materials of particular interest were alpha-beta
unsaturated carbonyl compounds, since these have been
previously identified as inhibitory in aerobic system (5).
Once the inhibitory materials and related problem
concentrations are known, procedures may be developed
for control of the inhibitory effects. A classic
example would be the control of heavy metal toxicity
in digesters by the addition of sulfates which are
reduced bacterially to sulfides, resulting in a non-
toxic, heavy metal-sulfide precipitate.
image:
Enzyme inhibition results from competition between the
inhibitor and substrate for attachment sites on the
enzyme, an attraction of the inhibitor for a part of
the enzyme, or destruction of an essential functional
group of the enzyme. The relative effect of any inhibitory
material on a microbial process may be expected to depend
on the properties of the microbial growth. As an
example, rapidly growing cells would be expected
to be more susceptible to inhibitory materials than
slower growing cells since a higher uptake and conversion
of substrate is in progress. Also, microorganisms which
grow in clusters or have slime layers would be expected
to be less sensitive than dispersed organisms as less
opportunity is available for inhibitor-organism contact.
Application of various inhibition theories to an
anaerobic treatment process is complicated by the mixed
biological cultures necessary within the process and the
mixture commonly present in the waste. While a material
may be inhibitory to one type of organism within a
treatment system, there may well be others present
which can degrade the material and thus overcome the
inhibitory effects. Mixed chemicals could also have
synergistic or antagonistic effects on the culture.
In order to develop a widely usable set of data, initial
screening studies for inhibition were performed with a
single material and an unacclimated, mixed anaerobic
culture. Many materials which were found to be
inhibitory in short-term screening studies were then
subjected to acclimation procedures, either as the
single compound or in a real waste stream to measure
long-term effects in more realistic situations.
Materials of particular interest were alpha-beta
unsaturated carbonyl compounds, since these have been
previously identified as inhibitory in aerobic system (5).
Once the inhibitory materials and related problem
concentrations are known, procedures may be developed
for control of the inhibitory effects. A classic
example would be the control of heavy metal toxicity
in digesters by the addition of sulfates which are
reduced bacterially to sulfides, resulting in a non-
toxic, heavy metal-sulfide precipitate.
image:
 SECTION IV
IDENTIFICATION OF INHIBITORY CHEMICALS
Initial Screening Tests
In order to screen the effects of a number of materials
on anaerobic processes, a method was needed which would
provide direct, reproducible inhibition data with a
minimum effort for each material tested.
Metabolic parameters such as cell growth, organic
reduction, and gas uptake or production in anaerobic
systems are normally utilized to monitor microorganism
activity. The required methanogenic phase of a non-
photosynthetic anaerobic process is generally conceded
to be both the most sensitive and the rate-limiting
step in anaerobic treatment, excluding systems based
on nitrate or sulfate reduction. Careful measurement
of gas produced in test units was, therefore, selected
as the indicator of bacterial activity. Cell growth
and organic reduction measurements were not considered
suitable for the type of short-term, small-volume tests
envisioned for this phase of the study.
The Warburg constant-volume respirometer was selected for
use in screening tests due to its high sensitivity to
gas pressure changes and the potential for rapid collection
of data. Anaerobic Warburg procedures in the
literature (11, 12), emphasize the importance of
developing carefully controlled operating techniques.
The necessity of an oxygen-free atmosphere over the
anaerobic biomass during the system charging and
throughout the test period presents operational
problems which needed to be solved prior to conducting
quantitative Warburg studies with the test chemicals.
Procedure
In initial qualitative tests, a Warburg respirometer
fitted with 18 flasks and manometers was used to
measure the effect of individual chemicals on the
methanogenic bacteria by monitoring gas production.
The flasks (140-ml volume) were charged initially with
sufficient nitrogen-sparged distilled water so that
when dilution water plus nutrients, domestic anaerobic
sludge, and test chemicals were added, a final volume
image:
SECTION IV
IDENTIFICATION OF INHIBITORY CHEMICALS
Initial Screening Tests
In order to screen the effects of a number of materials
on anaerobic processes, a method was needed which would
provide direct, reproducible inhibition data with a
minimum effort for each material tested.
Metabolic parameters such as cell growth, organic
reduction, and gas uptake or production in anaerobic
systems are normally utilized to monitor microorganism
activity. The required methanogenic phase of a non-
photosynthetic anaerobic process is generally conceded
to be both the most sensitive and the rate-limiting
step in anaerobic treatment, excluding systems based
on nitrate or sulfate reduction. Careful measurement
of gas produced in test units was, therefore, selected
as the indicator of bacterial activity. Cell growth
and organic reduction measurements were not considered
suitable for the type of short-term, small-volume tests
envisioned for this phase of the study.
The Warburg constant-volume respirometer was selected for
use in screening tests due to its high sensitivity to
gas pressure changes and the potential for rapid collection
of data. Anaerobic Warburg procedures in the
literature (11, 12), emphasize the importance of
developing carefully controlled operating techniques.
The necessity of an oxygen-free atmosphere over the
anaerobic biomass during the system charging and
throughout the test period presents operational
problems which needed to be solved prior to conducting
quantitative Warburg studies with the test chemicals.
Procedure
In initial qualitative tests, a Warburg respirometer
fitted with 18 flasks and manometers was used to
measure the effect of individual chemicals on the
methanogenic bacteria by monitoring gas production.
The flasks (140-ml volume) were charged initially with
sufficient nitrogen-sparged distilled water so that
when dilution water plus nutrients, domestic anaerobic
sludge, and test chemicals were added, a final volume
image:
 of 50 milliliters would result. The test chemical was
added to give the desired final concentration (usually
150, 500 or 1000 mg/1). Aliquots of one-percent
solutions of the water-soluble test chemicals were
used, while insoluble chemicals were added via a micro-
syringe technique. Twenty milliliters of nitrogen-
sparged dilution water, containing one milliliter of
buffer-nutrient solution per liter were then added,
followed by 25 milliliters of undiluted anaerobic sludge
conditioned at 35°C. All transfers were made under a
nitrogen-gas blanket.
The flasks were then attached to the manometer and
placed in the 35°C bath. The side arm of the flask was
opened, and nitrogen was purged through the flask for
30 minutes. The nitrogen was turned off, the side arms
closed and the shaker mechanism started. Gas pressure
changes were very rapid during the first few minutes
as equilibrium was reached between the dissolved gases
in the sludge and the nitrogen atmosphere. After
shaking 15 minutes, the manometers were leveled, and
gas pressure was measured at desired intervals.
Pressure readings were corrected for changes in
atmospheric pressure and temperature by using a
thermobarometer flask containing only distilled water.
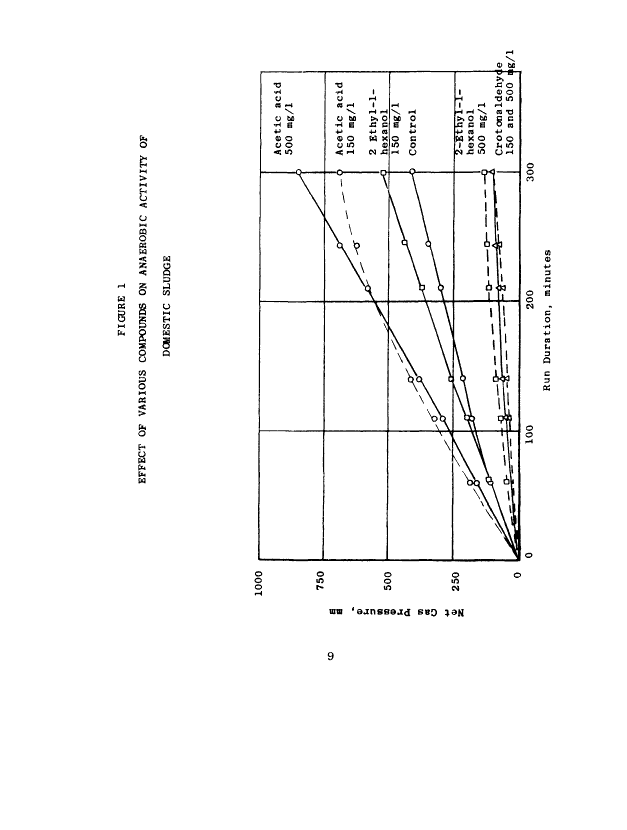
Corrected gas pressure values were plotted against
time for a period of 300 minutes to show the relative
rate of gas production during this period.
Gas production of the control flask (seed biomass) would
represent the cumulative production from methane
fermentation, anaerobic respiration, and fermentation
of carbohydrates and other materials in the domestic
waste solids used as seed. Addition of a test chemical
could affect the gas production in one of three ways -
increased production, no change, or decreased production.
An increased production would indicate that the test
material was degradable by the anaerobic sludge, although
not necessarily through methane fermentation. No
change in gas production from the control indicates no
net inhibition and/or degradation, while a decrease in
gas production shows inhibition. The effect of some
selected chemicals on the activity of domestic
anaerobic sludge is shown in Figure 1.
8
image:
of 50 milliliters would result. The test chemical was
added to give the desired final concentration (usually
150, 500 or 1000 mg/1). Aliquots of one-percent
solutions of the water-soluble test chemicals were
used, while insoluble chemicals were added via a micro-
syringe technique. Twenty milliliters of nitrogen-
sparged dilution water, containing one milliliter of
buffer-nutrient solution per liter were then added,
followed by 25 milliliters of undiluted anaerobic sludge
conditioned at 35°C. All transfers were made under a
nitrogen-gas blanket.
The flasks were then attached to the manometer and
placed in the 35°C bath. The side arm of the flask was
opened, and nitrogen was purged through the flask for
30 minutes. The nitrogen was turned off, the side arms
closed and the shaker mechanism started. Gas pressure
changes were very rapid during the first few minutes
as equilibrium was reached between the dissolved gases
in the sludge and the nitrogen atmosphere. After
shaking 15 minutes, the manometers were leveled, and
gas pressure was measured at desired intervals.
Pressure readings were corrected for changes in
atmospheric pressure and temperature by using a
thermobarometer flask containing only distilled water.
Corrected gas pressure values were plotted against
time for a period of 300 minutes to show the relative
rate of gas production during this period.
Gas production of the control flask (seed biomass) would
represent the cumulative production from methane
fermentation, anaerobic respiration, and fermentation
of carbohydrates and other materials in the domestic
waste solids used as seed. Addition of a test chemical
could affect the gas production in one of three ways -
increased production, no change, or decreased production.
An increased production would indicate that the test
material was degradable by the anaerobic sludge, although
not necessarily through methane fermentation. No
change in gas production from the control indicates no
net inhibition and/or degradation, while a decrease in
gas production shows inhibition. The effect of some
selected chemicals on the activity of domestic
anaerobic sludge is shown in Figure 1.
8
image:
 <0 DC
&
M
>
§
-1 §
w
g 8
5 g
fe O W
a <§
w
3
8
CO
§
l-l
OS
H
3
a
•H
c
o
•H
•M
CO
h
Q
C
3
O
O
o
o
o
o
m
IN
mm 'aanssajd SBQ
image:
<0 DC
&
M
>
§
-1 §
w
g 8
5 g
fe O W
a <§
w
3
8
CO
§
l-l
OS
H
3
a
•H
c
o
•H
•M
CO
h
Q
C
3
O
O
o
o
o
o
m
IN
mm 'aanssajd SBQ
image:
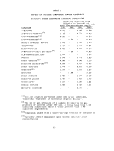
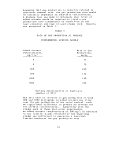
 The activity of the test sludge system relative to that
of the unfed sludge control was computed by dividing
the millimeters of gas pressure built up by the sample
by the millimeters of gas pressure built up by the
control after 300 minutes. These data are summarized
in Table 1.
10
image:
The activity of the test sludge system relative to that
of the unfed sludge control was computed by dividing
the millimeters of gas pressure built up by the sample
by the millimeters of gas pressure built up by the
control after 300 minutes. These data are summarized
in Table 1.
10
image:
 TABLE 1
EFFECT OF VARIOUS COMPOUNDS TOWARD ANAEROBIC
ACTIVITY UNDER SUBSTRATE LIMITING CONDITIONS
(3)
Compound
t-Butanol
2-Ethyl-l-hexanol
Crotonaldehyde(^)
Crotonaldehyde(4)
Methyl isobutyl ketone
Isophorone
Aerylonitrile
2-Methyl-5-ethyl pyridine
N,N-DimethyIaniline
Phenol
C3)
Ethyl benzene
Ethylene dichloride
Ethyl acrylate
Dodecane(3)
Dextrose
Ethyl acetate
Ethylene glycol
Tetralin(3)
Sodium acetate
Mercuric chloride
(3)
,(3)
Relative Activity with
Respect to Control at
Four Concentrations (mg/1)
(2)
150 200
0.91
1.15
0.23
0.54
1 .05
1.13
0.63
1.20
1.07
1.06
0.96
0.84
1.04
1.04
1.98
1 .40
1.46
1.23
1.88
_ _
500
0.96
0.71
-
-
1.05
1.12
0.43
-
-
1.15
0.96
0.43
0.61
1.10
-
1.77
1.65
1.29
2.02
0.27
1000
0.89
0.42
0.23
0.49
1.03
0.81
0.35
0.65
1.37
1.02
1.10
0.43
0.39
1.27
2.30
2.19
1.70
1.24
1.30
_
(1)
Initial studies performed under EPA Grant 12020-DIS,
"Anaerobic Treatment of Synthetic Organic wastes".
(2)
The mm of gas pressure of a sample divided by mm gas
pressure of control after 300 min; a value less than 1,
indicates inhibition while a value greater than 1.00
indicates degradation.
(3)
(4)
00
Compounds added with a micro-syringe because of solubility
Variable effect dependent upon system volatile acid
concentration.
11
image:
TABLE 1
EFFECT OF VARIOUS COMPOUNDS TOWARD ANAEROBIC
ACTIVITY UNDER SUBSTRATE LIMITING CONDITIONS
(3)
Compound
t-Butanol
2-Ethyl-l-hexanol
Crotonaldehyde(^)
Crotonaldehyde(4)
Methyl isobutyl ketone
Isophorone
Aerylonitrile
2-Methyl-5-ethyl pyridine
N,N-DimethyIaniline
Phenol
C3)
Ethyl benzene
Ethylene dichloride
Ethyl acrylate
Dodecane(3)
Dextrose
Ethyl acetate
Ethylene glycol
Tetralin(3)
Sodium acetate
Mercuric chloride
(3)
,(3)
Relative Activity with
Respect to Control at
Four Concentrations (mg/1)
(2)
150 200
0.91
1.15
0.23
0.54
1 .05
1.13
0.63
1.20
1.07
1.06
0.96
0.84
1.04
1.04
1.98
1 .40
1.46
1.23
1.88
_ _
500
0.96
0.71
-
-
1.05
1.12
0.43
-
-
1.15
0.96
0.43
0.61
1.10
-
1.77
1.65
1.29
2.02
0.27
1000
0.89
0.42
0.23
0.49
1.03
0.81
0.35
0.65
1.37
1.02
1.10
0.43
0.39
1.27
2.30
2.19
1.70
1.24
1.30
_
(1)
Initial studies performed under EPA Grant 12020-DIS,
"Anaerobic Treatment of Synthetic Organic wastes".
(2)
The mm of gas pressure of a sample divided by mm gas
pressure of control after 300 min; a value less than 1,
indicates inhibition while a value greater than 1.00
indicates degradation.
(3)
(4)
00
Compounds added with a micro-syringe because of solubility
Variable effect dependent upon system volatile acid
concentration.
11
image:
 Methanogenic Inhibition
After completion of the initial screening effort, the
need for a test more sensitive for detecting inhibition
to methane bacteria was evident. A Warburg test procedure
was developed similar to that used in the initial
screening studies except that a degradable supplement
of sodium acetate was added to ensure that the
methanogenic bacteria would be functioning at a maximum
rate in a non-food limited situation. This maximum
metabolic rate would also be expected to result in
greater sensitivity to inhibitory materials.
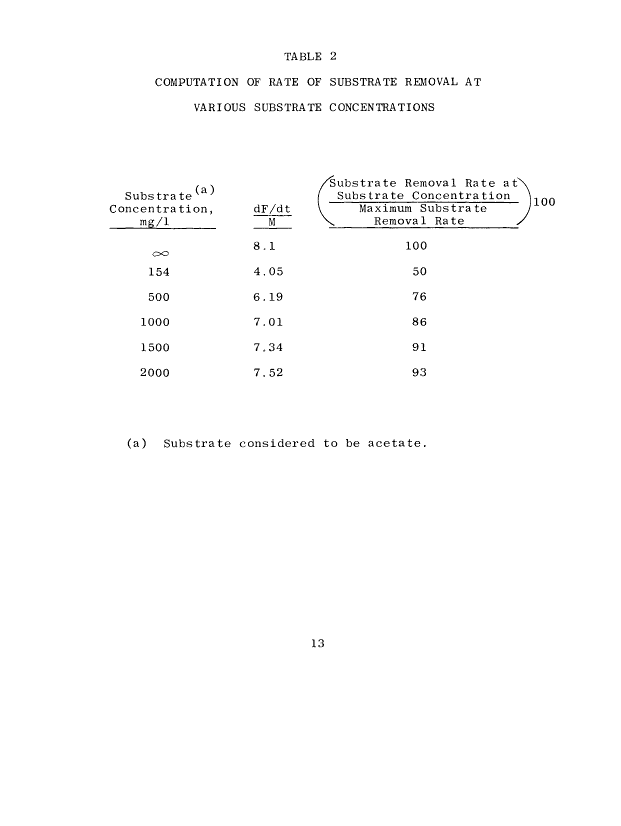
Lawrence and McCarty (13) have measured the rate of
substrate utilization and the various constants for
a formula similar to the Monod relationships for
anaerobic methane fermentation:
dF/dt =
kMS
K
where dF/dt = rate of waste utilization per
unit volume of digester, mass/
volume-time
M
S
k
microorganism
mass/volume
concentration,
= waste concentration, mass/volume
= maximum rate of waste utilization
per unit weight of microorganisms
occuring at high waste concentra-
tion, time-1, k = 8.1 mg/mg-day
for acetate substrate at 35°C, and
= half velocity constant equal to
the waste concentration when dF/dt
is equal to one-half of the
maximum rate, k, mass/volume,
Ks = 154 mg/1 for acetate substrate
at 35°C
Calculation of substrate removal rate relative to the
theoretical maximum at various substrate (acetate)
concentrations is illustrated in Table 2.
12
image:
Methanogenic Inhibition
After completion of the initial screening effort, the
need for a test more sensitive for detecting inhibition
to methane bacteria was evident. A Warburg test procedure
was developed similar to that used in the initial
screening studies except that a degradable supplement
of sodium acetate was added to ensure that the
methanogenic bacteria would be functioning at a maximum
rate in a non-food limited situation. This maximum
metabolic rate would also be expected to result in
greater sensitivity to inhibitory materials.
Lawrence and McCarty (13) have measured the rate of
substrate utilization and the various constants for
a formula similar to the Monod relationships for
anaerobic methane fermentation:
dF/dt =
kMS
K
where dF/dt = rate of waste utilization per
unit volume of digester, mass/
volume-time
M
S
k
microorganism
mass/volume
concentration,
= waste concentration, mass/volume
= maximum rate of waste utilization
per unit weight of microorganisms
occuring at high waste concentra-
tion, time-1, k = 8.1 mg/mg-day
for acetate substrate at 35°C, and
= half velocity constant equal to
the waste concentration when dF/dt
is equal to one-half of the
maximum rate, k, mass/volume,
Ks = 154 mg/1 for acetate substrate
at 35°C
Calculation of substrate removal rate relative to the
theoretical maximum at various substrate (acetate)
concentrations is illustrated in Table 2.
12
image:
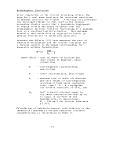 TABLE 2
COMPUTATION OF RATE OF SUBSTRATE REMOVAL AT
VARIOUS SUBSTRATE CONCENTRATIONS
Substrate
(a)
'Substrate Removal Rate
Substrate Concentration
Concentration,
mg/1
CO
154
500
1000
1500
2000
dF/dt V
M
8.1
4.05
6.19
7.01
7.34
7.52
Maximum Substrate
V Removal Rate
100
50
76
86
91
93
100
(a) Substrate considered to be acetate.
13
image:
TABLE 2
COMPUTATION OF RATE OF SUBSTRATE REMOVAL AT
VARIOUS SUBSTRATE CONCENTRATIONS
Substrate
(a)
'Substrate Removal Rate
Substrate Concentration
Concentration,
mg/1
CO
154
500
1000
1500
2000
dF/dt V
M
8.1
4.05
6.19
7.01
7.34
7.52
Maximum Substrate
V Removal Rate
100
50
76
86
91
93
100
(a) Substrate considered to be acetate.
13
image:
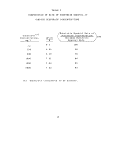 Assuming that gas production is directly related to
substrate removal rate, the gas production rate would
be similarly dependent on substrate concentration.
A Warburg test was made to determine what level of
added acetate would be required to yield a gas
production rate independent of added feed in the
test situation and type of seed sludge used. Results
are presented in Table 3,
TABLE 3
RATE OF GAS PRODUCTION AT VARIOUS
SUPPLEMENTAL ACETATE LEVELS
Added Acetate
Concentration,
mg/1 Ac~
0
0
500
500
1000
1000
Rate of Gas
Production,
mm/hr
73
75
165
143
142
165
Warburg determination of duplicate
samples at 35°C
The data show an increase in gas production at both
500 and 1000 milligrams of added acetate per liter
over the gas production of the unfed control, with
no significant difference in production between the
two acetate concentrations. Apparently with the
sludge used in these particular experiments,
an added acetate concentration of 500 mg/1 in addition
to the volatile acids contained in the digesting
sludge was sufficient to guarantee a non-food-
limited condition for gas production rate.
1.4
image:
Assuming that gas production is directly related to
substrate removal rate, the gas production rate would
be similarly dependent on substrate concentration.
A Warburg test was made to determine what level of
added acetate would be required to yield a gas
production rate independent of added feed in the
test situation and type of seed sludge used. Results
are presented in Table 3,
TABLE 3
RATE OF GAS PRODUCTION AT VARIOUS
SUPPLEMENTAL ACETATE LEVELS
Added Acetate
Concentration,
mg/1 Ac~
0
0
500
500
1000
1000
Rate of Gas
Production,
mm/hr
73
75
165
143
142
165
Warburg determination of duplicate
samples at 35°C
The data show an increase in gas production at both
500 and 1000 milligrams of added acetate per liter
over the gas production of the unfed control, with
no significant difference in production between the
two acetate concentrations. Apparently with the
sludge used in these particular experiments,
an added acetate concentration of 500 mg/1 in addition
to the volatile acids contained in the digesting
sludge was sufficient to guarantee a non-food-
limited condition for gas production rate.
1.4
image:
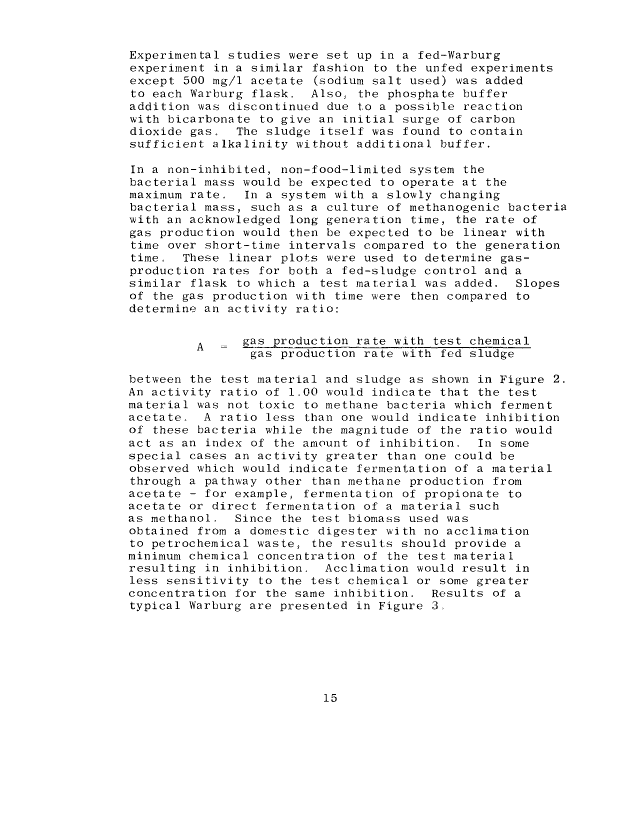
 Experimental studies were set up in a fed-Warburg
experiment in a similar fashion to the unfed experiments
except 500 mg/1 acetate (sodium salt used) was added
to each Warburg flask. Also, the phosphate buffer
addition was discontinued due to a possible reaction
with bicarbonate to give an initial surge of carbon
dioxide gas. The sludge itself was found to contain
sufficient alkalinity without additional buffer.
In a non-inhibited, non-food-limited system the
bacterial mass would be expected to operate at the
maximum rate. In a system with a slowly changing
bacterial mass, such as a culture of methanogenic bacteria
with an acknowledged long generation time, the rate of
gas production would then be expected to be linear with
time over short-time intervals compared to the generation
time. These linear plots were used to determine gas-
production rates for both a fed-sludge control and a
similar flask to which a test material was added. Slopes
of the gas production with time were then compared to
determine an activity ratio:
A = gas production rate with test chemical
gas production rate with fed sludge
between the test material and sludge as shown in Figure 2.
An activity ratio of 1.00 would indicate that the test
material was not toxic to methane bacteria which ferment
acetate. A ratio less than one would indicate inhibition
of these bacteria while the magnitude of the ratio would
act as an index of the amount of inhibition. In some
special cases an activity greater than one could be
observed which would indicate fermentation of a material
through a pathway other than methane production from
acetate - for example, fermentation of propionate to
acetate or direct fermentation of a material such
as methanol. Since the test biomass used was
obtained from a domestic digester with no acclimation
to petrochemical waste, the results should provide a
minimum chemical concentration of the test material
resulting in inhibition. Acclimation would result in
less sensitivity to the test chemical or some greater
concentration for the same inhibition. Results of a
typical Warburg are presented in Figure 3.
15
image:
Experimental studies were set up in a fed-Warburg
experiment in a similar fashion to the unfed experiments
except 500 mg/1 acetate (sodium salt used) was added
to each Warburg flask. Also, the phosphate buffer
addition was discontinued due to a possible reaction
with bicarbonate to give an initial surge of carbon
dioxide gas. The sludge itself was found to contain
sufficient alkalinity without additional buffer.
In a non-inhibited, non-food-limited system the
bacterial mass would be expected to operate at the
maximum rate. In a system with a slowly changing
bacterial mass, such as a culture of methanogenic bacteria
with an acknowledged long generation time, the rate of
gas production would then be expected to be linear with
time over short-time intervals compared to the generation
time. These linear plots were used to determine gas-
production rates for both a fed-sludge control and a
similar flask to which a test material was added. Slopes
of the gas production with time were then compared to
determine an activity ratio:
A = gas production rate with test chemical
gas production rate with fed sludge
between the test material and sludge as shown in Figure 2.
An activity ratio of 1.00 would indicate that the test
material was not toxic to methane bacteria which ferment
acetate. A ratio less than one would indicate inhibition
of these bacteria while the magnitude of the ratio would
act as an index of the amount of inhibition. In some
special cases an activity greater than one could be
observed which would indicate fermentation of a material
through a pathway other than methane production from
acetate - for example, fermentation of propionate to
acetate or direct fermentation of a material such
as methanol. Since the test biomass used was
obtained from a domestic digester with no acclimation
to petrochemical waste, the results should provide a
minimum chemical concentration of the test material
resulting in inhibition. Acclimation would result in
less sensitivity to the test chemical or some greater
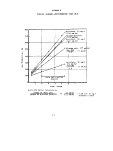
concentration for the same inhibition. Results of a
typical Warburg are presented in Figure 3.
15
image:
 c
o
•rl
V
<J
3
•O
0
M
n
O
FIGURE 2
FED-WARBURG DATA COLLECTION AND HANDLING
Control
Typical Feed Would Consist
of:
1. Sludge
2. Dilution Water
3. Sodium Acetate
(500 mg/1 Ac)
Time
a
o
•rl
•P
U
3
TJ
O
cn
CJ
O
Feed
Test Flask
Typical Feed Would Consist
of:
Sludge
Dilution Water
Sodium Acetate Feed
(500 mg/1 Ac)
4. Test Material
Time
Activity Ratio A = T/S
16
image:
c
o
•rl
V
<J
3
•O
0
M
n
O
FIGURE 2
FED-WARBURG DATA COLLECTION AND HANDLING
Control
Typical Feed Would Consist
of:
1. Sludge
2. Dilution Water
3. Sodium Acetate
(500 mg/1 Ac)
Time
a
o
•rl
•P
U
3
TJ
O
cn
CJ
O
Feed
Test Flask
Typical Feed Would Consist
of:
Sludge
Dilution Water
Sodium Acetate Feed
(500 mg/1 Ac)
4. Test Material
Time
Activity Ratio A = T/S
16
image:
 FIGUHE 3
TYPICAL WARBURG RESPIROMETER TEST DATA
0
u
1
800
700
600
500
400
300
200
100
Acrolein, 10 mg/1
(119 mm/hr)
Sludge/Acetate
(111 mm/hr)
Acrolein, 20 mg/1
(lp3 mm/hr)
Sludge only (77 mm,
520-250 - 77 mm/hr
*3 . O
Acrolein, 50 mg/1
(31 mm/hr)
275-165 = 31 mm/hr
Rate Calculation
Period
12345
Time, hours
Activity ratio calculation:
Slope of Test Unit
'hr)
STope of Acetate Control
or
31 mm/hr
111 mm/hr
0.28 for 50 mg/1
acrolein concn.
17
image:
FIGUHE 3
TYPICAL WARBURG RESPIROMETER TEST DATA
0
u
1
800
700
600
500
400
300
200
100
Acrolein, 10 mg/1
(119 mm/hr)
Sludge/Acetate
(111 mm/hr)
Acrolein, 20 mg/1
(lp3 mm/hr)
Sludge only (77 mm,
520-250 - 77 mm/hr
*3 . O
Acrolein, 50 mg/1
(31 mm/hr)
275-165 = 31 mm/hr
Rate Calculation
Period
12345
Time, hours
Activity ratio calculation:
Slope of Test Unit
'hr)
STope of Acetate Control
or
31 mm/hr
111 mm/hr
0.28 for 50 mg/1
acrolein concn.
17
image:
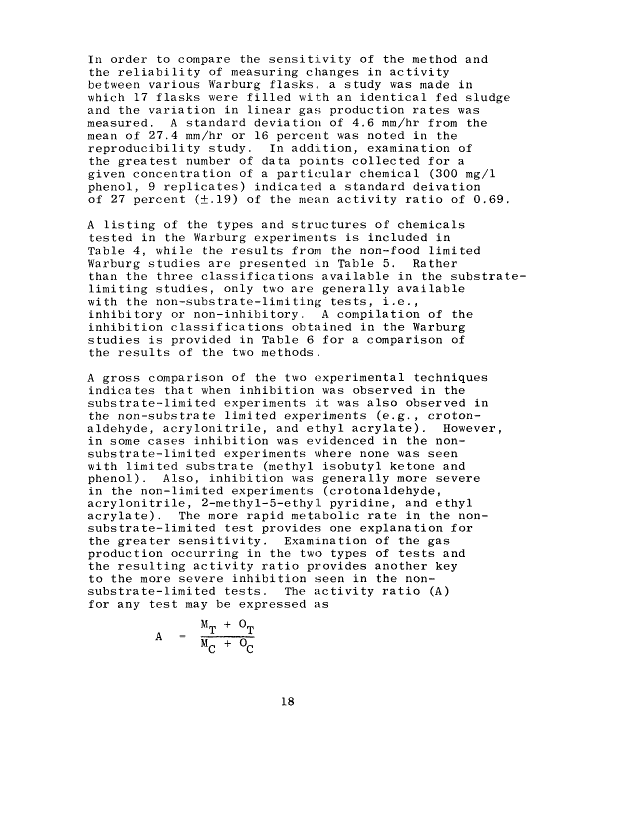
 In order to compare the sensitivity of the method and
the reliability of measuring changes in activity
between various Warburg flasks, a study was made in
which 17 flasks were filled with an identical fed sludge
and the variation in linear gas production rates was
measured. A standard deviation of 4.6 mm/hr from the
mean of 27.4 mm/hr or 16 percent was noted in the
reproducibility study. In addition, examination of
the greatest number of data points collected for a
given concentration of a particular chemical (300 mg/1
phenol, 9 replicates) indicated a standard deivation
of 27 percent (±.19) of the mean activity ratio of 0.69.
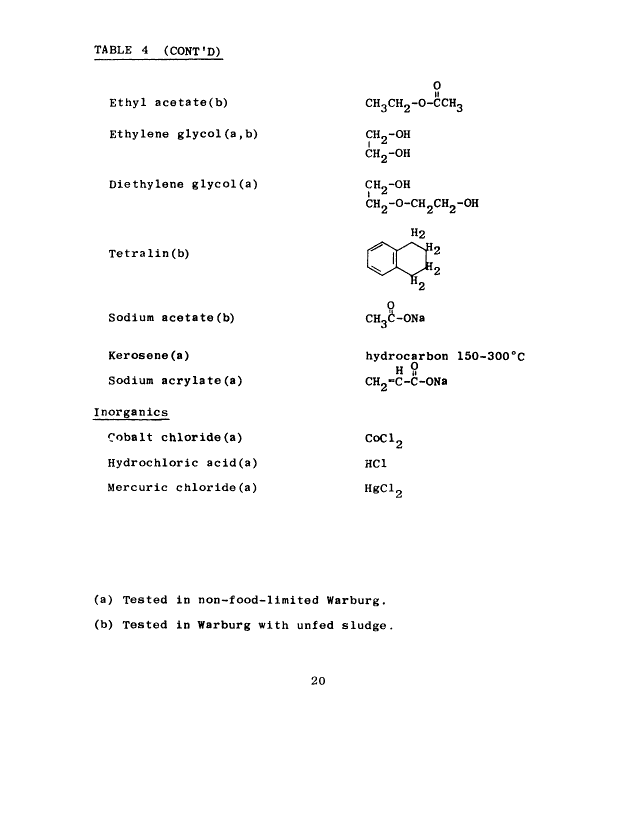
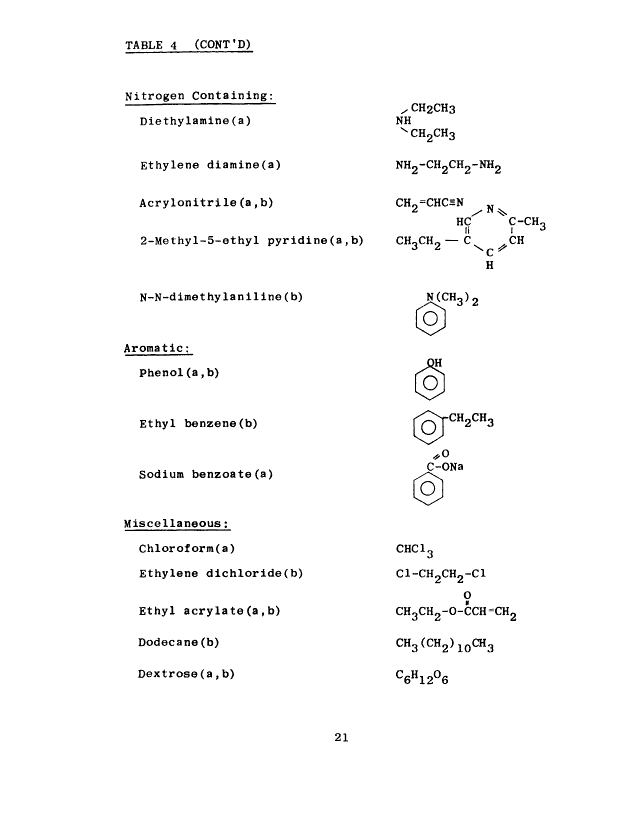
A listing of the types and structures of chemicals
tested in the Warburg experiments is included in
Table 4, while the results from the non-food limited
Warburg studies are presented in Table 5. Rather
than the three classifications available in the substrate-
limiting studies, only two are generally available
with the non-substrate-limiting tests, i.e.,
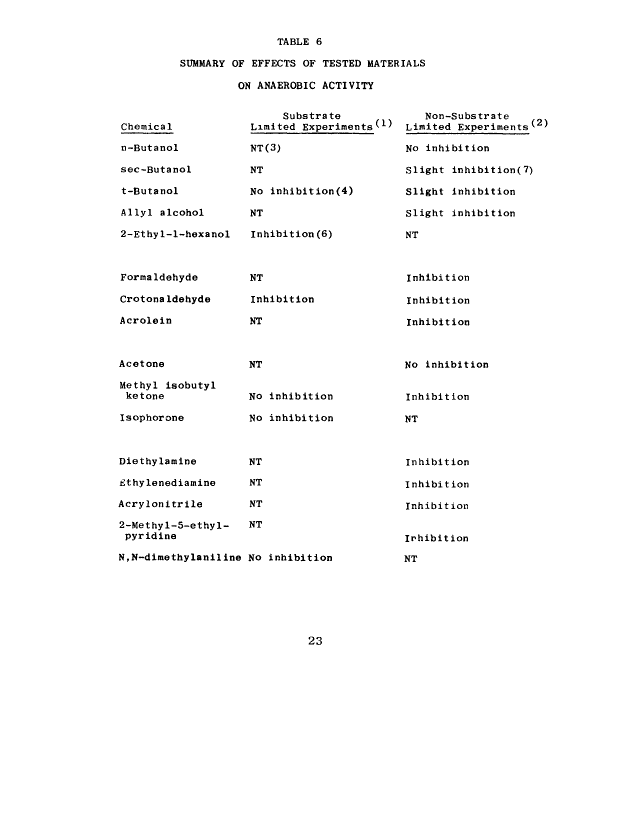
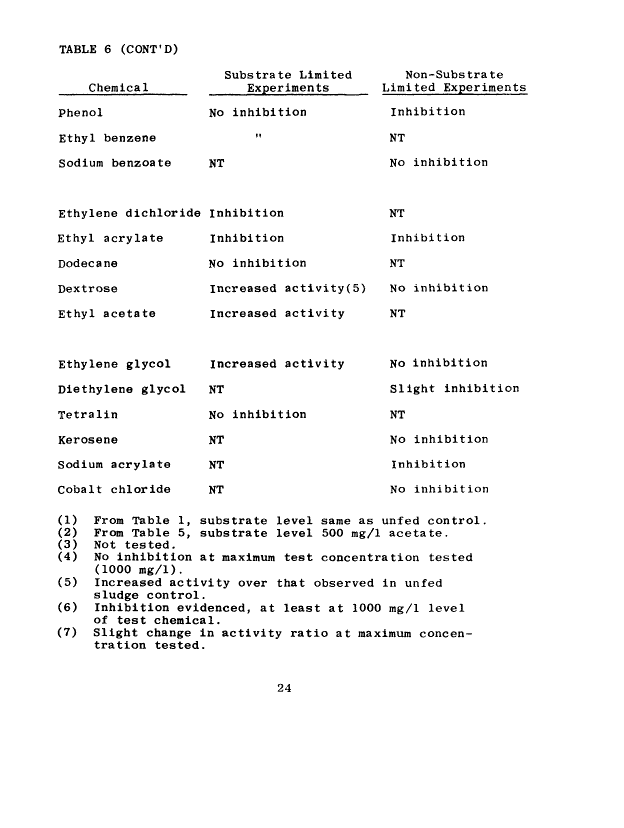
inhibitory or non-inhibitory. A compilation of the
inhibition classifications obtained in the Warburg
studies is provided in Table 6 for a comparison of
the results of the two methods.
A gross comparison of the two experimental techniques
indicates that when inhibition was observed in the
substrate-limited experiments it was also observed in
the non-substrate limited experiments (e.g., croton-
aldehyde, acrylonitrile, and ethyl acrylate). However,
in some cases inhibition was evidenced in the non-
substrate-limited experiments where none was seen
with limited substrate (methyl isobutyl ketone and
phenol). Also, inhibition was generally more severe
in the non-limited experiments (crotonaldehyde,
acrylonitrile, 2-methyl-5-ethyl pyridine, and ethyl
acrylate). The more rapid metabolic rate in the non-
substrate-limited test provides one explanation for
the greater sensitivity. Examination of the gas
production occurring in the two types of tests and
the resulting activity ratio provides another key
to the more severe inhibition seen in the non-
substrate-limited tests. The activity ratio (A)
for any test may be expressed as
MT + 0
A = —
MC + °C
18
image:
In order to compare the sensitivity of the method and
the reliability of measuring changes in activity
between various Warburg flasks, a study was made in
which 17 flasks were filled with an identical fed sludge
and the variation in linear gas production rates was
measured. A standard deviation of 4.6 mm/hr from the
mean of 27.4 mm/hr or 16 percent was noted in the
reproducibility study. In addition, examination of
the greatest number of data points collected for a
given concentration of a particular chemical (300 mg/1
phenol, 9 replicates) indicated a standard deivation
of 27 percent (±.19) of the mean activity ratio of 0.69.
A listing of the types and structures of chemicals
tested in the Warburg experiments is included in
Table 4, while the results from the non-food limited
Warburg studies are presented in Table 5. Rather
than the three classifications available in the substrate-
limiting studies, only two are generally available
with the non-substrate-limiting tests, i.e.,
inhibitory or non-inhibitory. A compilation of the
inhibition classifications obtained in the Warburg
studies is provided in Table 6 for a comparison of
the results of the two methods.
A gross comparison of the two experimental techniques
indicates that when inhibition was observed in the
substrate-limited experiments it was also observed in
the non-substrate limited experiments (e.g., croton-
aldehyde, acrylonitrile, and ethyl acrylate). However,
in some cases inhibition was evidenced in the non-
substrate-limited experiments where none was seen
with limited substrate (methyl isobutyl ketone and
phenol). Also, inhibition was generally more severe
in the non-limited experiments (crotonaldehyde,
acrylonitrile, 2-methyl-5-ethyl pyridine, and ethyl
acrylate). The more rapid metabolic rate in the non-
substrate-limited test provides one explanation for
the greater sensitivity. Examination of the gas
production occurring in the two types of tests and
the resulting activity ratio provides another key
to the more severe inhibition seen in the non-
substrate-limited tests. The activity ratio (A)
for any test may be expressed as
MT + 0
A = —
MC + °C
18
image:
 TABLE 4
CHEMICAL STRUCTURES EVALUATED IN WARBURG
INHIBITION STUDIES
Chemical
Formula
Alcohols:
n-Butanol(a)
sec-Butanol(a)
t-Butanol(a,b)
Allyl alcohol(a)
2-Ethyl-l-hexanol(b)
Aldehydes:
Formaldehyde(a)
CrotonaIdehyde(a,b)
Acrolein(a)
Ketones:
Acetone(a)
Methyl isobutyl ketone(a,b)
Isophorone(b)
OH
I
CHoC-OH
3CH3
CH2=CHCH2-OH
CH3CH2CH2CH2CHCH2-OH
CH2CH3
H2C=0
CH3C=CC=O
H HH
CH2=CHCH
O
0
CH3CCH3
O
CHQCHCH0CCH
CH3
O
n
^c^
H9C CH
£\ II
o-C C-CH
19
image:
TABLE 4
CHEMICAL STRUCTURES EVALUATED IN WARBURG
INHIBITION STUDIES
Chemical
Formula
Alcohols:
n-Butanol(a)
sec-Butanol(a)
t-Butanol(a,b)
Allyl alcohol(a)
2-Ethyl-l-hexanol(b)
Aldehydes:
Formaldehyde(a)
CrotonaIdehyde(a,b)
Acrolein(a)
Ketones:
Acetone(a)
Methyl isobutyl ketone(a,b)
Isophorone(b)
OH
I
CHoC-OH
3CH3
CH2=CHCH2-OH
CH3CH2CH2CH2CHCH2-OH
CH2CH3
H2C=0
CH3C=CC=O
H HH
CH2=CHCH
O
0
CH3CCH3
O
CHQCHCH0CCH
CH3
O
n
^c^
H9C CH
£\ II
o-C C-CH
19
image:
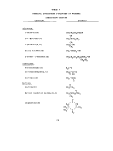 TABLE 4 (CONT'D)
Ethyl acetate(b)
Ethylene glycol(a,b)
Diethylene glycol(a)
Tetralin(b)
Sodium acetate(b)
Kerosene(a)
Sodium aerylate (a)
Inorganics
Cobalt chloride(a)
Hydrochloric acid(a)
Mercuric chloride(a)
CH3CH2-O-CCH3
CH2-OH
CH2-OH
CH2-OH
CH2-0-CH2CH2-OH
CH3C-ONa
hydrocarbon 150-300°C
H °
CH2=C-C-ONa
CoCl,
HC1
HgCl,
(a) Tested in non-food-limited Warburg.
(b) Tested in Warburg with unfed sludge
20
image:
TABLE 4 (CONT'D)
Ethyl acetate(b)
Ethylene glycol(a,b)
Diethylene glycol(a)
Tetralin(b)
Sodium acetate(b)
Kerosene(a)
Sodium aerylate (a)
Inorganics
Cobalt chloride(a)
Hydrochloric acid(a)
Mercuric chloride(a)
CH3CH2-O-CCH3
CH2-OH
CH2-OH
CH2-OH
CH2-0-CH2CH2-OH
CH3C-ONa
hydrocarbon 150-300°C
H °
CH2=C-C-ONa
CoCl,
HC1
HgCl,
(a) Tested in non-food-limited Warburg.
(b) Tested in Warburg with unfed sludge
20
image:
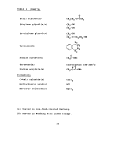 TABLE 4 (CONT'D)
Nitrogen Containing:
Diethylamine(a)
Ethylene diamine(a)
AeryIonitrile(a,b)
CH2CH3
NH
X
CH2CH3
NH2-CH2CH2-NH,
CH0=CHC=N
2
HC C-CH
I! I
2-Methyl-5-ethyl pyridine(a,b) CH~CH0 — C „ CH
J * ^C^
H
N-N-dimethylaniline(b)
Aromatic:
Phenol (a, b)
Ethyl benzene (b)
Sodium benzoate(a)
Miscellaneous ;
Chloroform(a)
Ethylene dichloride(b)
Ethyl acrylate(a,b)
Dodecane(b)
Dextrose (a ,b)
N(CH3)2
j-CH2CH3
C-ONa
o
CHC13
C1-CH2CH2-C1
O
CH3CH2-0-CCH=CH2
CH3(CH2)10CH3
C6H12°6
21
image:
TABLE 4 (CONT'D)
Nitrogen Containing:
Diethylamine(a)
Ethylene diamine(a)
AeryIonitrile(a,b)
CH2CH3
NH
X
CH2CH3
NH2-CH2CH2-NH,
CH0=CHC=N
2
HC C-CH
I! I
2-Methyl-5-ethyl pyridine(a,b) CH~CH0 — C „ CH
J * ^C^
H
N-N-dimethylaniline(b)
Aromatic:
Phenol (a, b)
Ethyl benzene (b)
Sodium benzoate(a)
Miscellaneous ;
Chloroform(a)
Ethylene dichloride(b)
Ethyl acrylate(a,b)
Dodecane(b)
Dextrose (a ,b)
N(CH3)2
j-CH2CH3
C-ONa
o
CHC13
C1-CH2CH2-C1
O
CH3CH2-0-CCH=CH2
CH3(CH2)10CH3
C6H12°6
21
image:
 image:
 8 I
3 Ul
g gs
image:
8 I
3 Ul
g gs
image:
 Chemical
TABLE 6
SUMMARY OF EFFECTS OF TESTED MATERIALS
ON ANAEROBIC ACTIVITY
Substrate Non-Substrate
Limited Experiments^ ' Limited Experiments^ '
n-Butanol
sec-Butanol
t-Butanol
Allyl alcohol
2-Ethyl-l-hexanol
NT(3)
NT
No inhibition(4)
NT
Inhibition(6)
No inhibition
Slight inhibition(7)
Slight inhibition
Slight inhibition
NT
Formaldehyde
Crotonaldehyde
Acrolein
NT
Inhibition
NT
Inhibition
Inhibition
Inhibition
Acetone
Methyl isobutyl
ketone
Isophorone
NT
No inhibition
No inhibition
No inhibition
Inhibition
NT
Diethylamine NT
Ethylenediamine NT
Acrylonitrile NT
2-Methyl-5-ethyl- NT
pyridine
N,N-dimethylaniline No inhibition
Inhibition
Inhibition
Inhibition
Inhibition
NT
23
image:
Chemical
TABLE 6
SUMMARY OF EFFECTS OF TESTED MATERIALS
ON ANAEROBIC ACTIVITY
Substrate Non-Substrate
Limited Experiments^ ' Limited Experiments^ '
n-Butanol
sec-Butanol
t-Butanol
Allyl alcohol
2-Ethyl-l-hexanol
NT(3)
NT
No inhibition(4)
NT
Inhibition(6)
No inhibition
Slight inhibition(7)
Slight inhibition
Slight inhibition
NT
Formaldehyde
Crotonaldehyde
Acrolein
NT
Inhibition
NT
Inhibition
Inhibition
Inhibition
Acetone
Methyl isobutyl
ketone
Isophorone
NT
No inhibition
No inhibition
No inhibition
Inhibition
NT
Diethylamine NT
Ethylenediamine NT
Acrylonitrile NT
2-Methyl-5-ethyl- NT
pyridine
N,N-dimethylaniline No inhibition
Inhibition
Inhibition
Inhibition
Inhibition
NT
23
image:
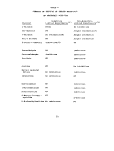 TABLE 6 (CONT'D)
Chemical
Phenol
Ethyl benzene
Sodium benzoate
Substrate Limited
Experiments
No inhibition
NT
Non-Substrate
Limited Experiments
Inhibition
NT
No inhibition
Ethylene dichloride Inhibition
Ethyl acrylate inhibition
Dodecane No inhibition
Dextrose Increased activity(S)
Ethyl acetate Increased activity
NT
Inhibition
NT
No inhibition
NT
Ethylene glycol
Diethylene glycol
Tetralin
Kerosene
Sodium acrylate
Cobalt chloride
Increased activity
NT
No inhibition
NT
NT
NT
No inhibition
Slight inhibition
NT
No inhibition
Inhibition
No inhibition
(1) From Table 1, substrate level same as unfed control
(2) From Table 5, substrate level 500 mg/1 acetate.
(3) Not tested.
(4) No inhibition at maximum test concentration tested
(1000 mg/1).
(5) Increased activity over that observed in unfed
sludge control.
(6) Inhibition evidenced, at least at 1000 mg/1 level
of test chemical.
(7) Slight change in activity ratio at maximum concen-
tration tested.
24
image:
TABLE 6 (CONT'D)
Chemical
Phenol
Ethyl benzene
Sodium benzoate
Substrate Limited
Experiments
No inhibition
NT
Non-Substrate
Limited Experiments
Inhibition
NT
No inhibition
Ethylene dichloride Inhibition
Ethyl acrylate inhibition
Dodecane No inhibition
Dextrose Increased activity(S)
Ethyl acetate Increased activity
NT
Inhibition
NT
No inhibition
NT
Ethylene glycol
Diethylene glycol
Tetralin
Kerosene
Sodium acrylate
Cobalt chloride
Increased activity
NT
No inhibition
NT
NT
NT
No inhibition
Slight inhibition
NT
No inhibition
Inhibition
No inhibition
(1) From Table 1, substrate level same as unfed control
(2) From Table 5, substrate level 500 mg/1 acetate.
(3) Not tested.
(4) No inhibition at maximum test concentration tested
(1000 mg/1).
(5) Increased activity over that observed in unfed
sludge control.
(6) Inhibition evidenced, at least at 1000 mg/1 level
of test chemical.
(7) Slight change in activity ratio at maximum concen-
tration tested.
24
image:
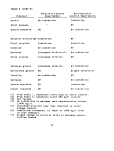 where M = methanogenic gas production from
bacteria capable of fermenting or
anaerobically respiring acetate
O = other gas production, fermentation
of higher volatile acids, direct
fermentation of simple compounds,
or gas production during breakdown
to volatile acids
T = conditions in test flask
C = condition in control flask
In the non-limited substrate experiments M would be a
maximum due to the conditions of the test and would,
therefore, be expected to be of more significance in
the ratio than in the limited-substrate tests.
Therefore, a change in "M-p" would result in a greater
effect on "A" in an unlimited system than would the
same change in a food-limited system. A greater effect
on the measured activity ratio would, therefore, result
Also, in the tests in which substrate was limited the
addition of food (in the form of a test chemical) could
cause an increase in "Op" or conceivably in "M-p" by an
increase in rate of gas production in those bacteria
remaining viable. In either case, the non-limited
substrate experiments would provide a more sensitive
and accurate relationship for inhibition to bacteria
which ferment acetate.
Results of the activity-ratio vs concentration
experiment for those chemicals which showed significant
inhibition in the more sensitive, non-substrate
limited test procedure are illustrated in Figures 4
through 14. In addition, the effect of some materials
found inhibitory in substrate limited experiments is
illustrated in Figures 15 and 16. The relative
amount of inhibition (decrease of activity ratio) may
be compared with that experienced in experiments
where an attempt was made to Inhibit anaerobic
activity by adding known toxicants (chloroform,
mercuric chloride, and acidification with hydrochloric
acid). In these tests, a residual activity ratio of
0.17 to 0.19 was measured at 1000 mg/1 dosages of the
chloroform and mercuric chloride or acidification to
25
image:
where M = methanogenic gas production from
bacteria capable of fermenting or
anaerobically respiring acetate
O = other gas production, fermentation
of higher volatile acids, direct
fermentation of simple compounds,
or gas production during breakdown
to volatile acids
T = conditions in test flask
C = condition in control flask
In the non-limited substrate experiments M would be a
maximum due to the conditions of the test and would,
therefore, be expected to be of more significance in
the ratio than in the limited-substrate tests.
Therefore, a change in "M-p" would result in a greater
effect on "A" in an unlimited system than would the
same change in a food-limited system. A greater effect
on the measured activity ratio would, therefore, result
Also, in the tests in which substrate was limited the
addition of food (in the form of a test chemical) could
cause an increase in "Op" or conceivably in "M-p" by an
increase in rate of gas production in those bacteria
remaining viable. In either case, the non-limited
substrate experiments would provide a more sensitive
and accurate relationship for inhibition to bacteria
which ferment acetate.
Results of the activity-ratio vs concentration
experiment for those chemicals which showed significant
inhibition in the more sensitive, non-substrate
limited test procedure are illustrated in Figures 4
through 14. In addition, the effect of some materials
found inhibitory in substrate limited experiments is
illustrated in Figures 15 and 16. The relative
amount of inhibition (decrease of activity ratio) may
be compared with that experienced in experiments
where an attempt was made to Inhibit anaerobic
activity by adding known toxicants (chloroform,
mercuric chloride, and acidification with hydrochloric
acid). In these tests, a residual activity ratio of
0.17 to 0.19 was measured at 1000 mg/1 dosages of the
chloroform and mercuric chloride or acidification to
25
image:
 FIGURE 4
EFFECT OF ACROLEIN ON ANAEROBIC ACTIVITY
Non-Substrate Limited Studies
0.06 -
100 200 300 400
Acrolein Concentration, mg/l
500
26
image:
FIGURE 4
EFFECT OF ACROLEIN ON ANAEROBIC ACTIVITY
Non-Substrate Limited Studies
0.06 -
100 200 300 400
Acrolein Concentration, mg/l
500
26
image:
 FIGURE 5
EFFECT OF CROTONALDEHYDE ON ANAEROBIC ACTIVITY
1.0
0.8
0.6
o
I 0.4
x
0.2
0.1
Substrate Limited
-- Non-Substrate LimJted
100 200 300 400 500
Crotonaldehyde Concentration, mg/l
27
image:
FIGURE 5
EFFECT OF CROTONALDEHYDE ON ANAEROBIC ACTIVITY
1.0
0.8
0.6
o
I 0.4
x
0.2
0.1
Substrate Limited
-- Non-Substrate LimJted
100 200 300 400 500
Crotonaldehyde Concentration, mg/l
27
image:
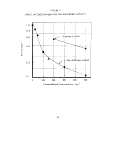 FIGURE 6
EFFECT OF FORMALDEHYDE ON ANAEROBIC ACTIVITY
1.0
0.8
0.6
0.4
0.2
Non-Substrate Limited Studies
0.1
0
100 200 300 400
Formaldehyde Concentration, mg/l
500
28
image:
FIGURE 6
EFFECT OF FORMALDEHYDE ON ANAEROBIC ACTIVITY
1.0
0.8
0.6
0.4
0.2
Non-Substrate Limited Studies
0.1
0
100 200 300 400
Formaldehyde Concentration, mg/l
500
28
image:
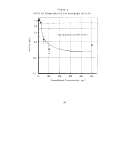 FIGURE 7
EFFECT Of METHYL ISOBUTYL KETONE ON ANAEROBIC ACTIVITY
1.0
0.2
N on-Substrate Limited,
0.1
200 400 600 800 1000
Methyl Isobutyl Ketone Concentration, mg/l
29
image:
FIGURE 7
EFFECT Of METHYL ISOBUTYL KETONE ON ANAEROBIC ACTIVITY
1.0
0.2
N on-Substrate Limited,
0.1
200 400 600 800 1000
Methyl Isobutyl Ketone Concentration, mg/l
29
image:
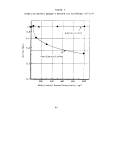 FIGURE 8
EFFECT OF ETHYLENEDIAMINE ON ANAEROBIC ACTIVITY
1.0
0.8
0.6
xO.4
">
*-
u
<
0.2
0.1
0
Non-Substrate Limited Studies
TOO 200 300 400 500
Ethylenediamine Concentration, mg/l
30
image:
FIGURE 8
EFFECT OF ETHYLENEDIAMINE ON ANAEROBIC ACTIVITY
1.0
0.8
0.6
xO.4
">
*-
u
<
0.2
0.1
0
Non-Substrate Limited Studies
TOO 200 300 400 500
Ethylenediamine Concentration, mg/l
30
image:
 FIGURE 9
EFFECT OF DIETHYLAMINE ON ANAEROBIC ACTIVITY
0 200 400 600 800 1000
Diethylamine Concentration, mg/l
31
image:
FIGURE 9
EFFECT OF DIETHYLAMINE ON ANAEROBIC ACTIVITY
0 200 400 600 800 1000
Diethylamine Concentration, mg/l
31
image:
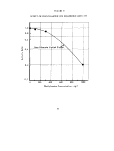 FIGURE 10
EFFECT OF ACRYLONITR1LE': ON ANAEROBIC ACTIVITY
0.2
0.1
Non-Limited Substrate
200 400 600 800 1000
Acrylonitrile Concentration, mg/l
32
image:
FIGURE 10
EFFECT OF ACRYLONITR1LE': ON ANAEROBIC ACTIVITY
0.2
0.1
Non-Limited Substrate
200 400 600 800 1000
Acrylonitrile Concentration, mg/l
32
image:
 FIGURE 11
EFFECT OF 2-METHYL-5-ETHYLPYRIDINE ON ANAEROBIC ACTIVITY
Non-Substrate Limited
200 400 600 800 1000
2-Methyl-5-ethylpyricjine Concentration, mg/l
33
image:
FIGURE 11
EFFECT OF 2-METHYL-5-ETHYLPYRIDINE ON ANAEROBIC ACTIVITY
Non-Substrate Limited
200 400 600 800 1000
2-Methyl-5-ethylpyricjine Concentration, mg/l
33
image:
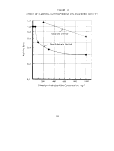 FIGURE 12
EFFECT OF PHENOL ON ANAEROBIC ACTIVITY
0.8
0.6
I 0>4
x
0.2
0.1
7
/. Substrate Limited
Non-Substrate Limited
200 400 600 800
Phenol Concentration, mg/l
1000
34
image:
FIGURE 12
EFFECT OF PHENOL ON ANAEROBIC ACTIVITY
0.8
0.6
I 0>4
x
0.2
0.1
7
/. Substrate Limited
Non-Substrate Limited
200 400 600 800
Phenol Concentration, mg/l
1000
34
image:
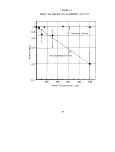 FIGURE 13
EFFECT OF SODIUM ACRYLATE ON ANAEROBIC ACTIVITY
0.8
0.6
^o
I
^0.4
0.2
0.1
Non-Substrate Limited
100 200 300 400 500
Sodium Aery late Concentration, mg/l
35
image:
FIGURE 13
EFFECT OF SODIUM ACRYLATE ON ANAEROBIC ACTIVITY
0.8
0.6
^o
I
^0.4
0.2
0.1
Non-Substrate Limited
100 200 300 400 500
Sodium Aery late Concentration, mg/l
35
image:
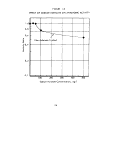 FIGURE 14
EFFECT OF ETHYL ACRYLATE ON ANAEROBIC ACTIVITY
Non-Substrate Limited
200 400 600 800
Ethyl Aery late Concentration, mg/l
1000
36
image:
FIGURE 14
EFFECT OF ETHYL ACRYLATE ON ANAEROBIC ACTIVITY
Non-Substrate Limited
200 400 600 800
Ethyl Aery late Concentration, mg/l
1000
36
image:
 FIGURE 15
EFFECT OF 2-ETHYL-1-HEXANOL ON ANAEROBIC ACTIVITY
1.0
0.8
0.6
•z 0.4
0.2
0.1
Substrate Limited Studies
200 400 600 800 1000
2-Ethyl-l-hexanol Concentration, mg/l
37
image:
FIGURE 15
EFFECT OF 2-ETHYL-1-HEXANOL ON ANAEROBIC ACTIVITY
1.0
0.8
0.6
•z 0.4
0.2
0.1
Substrate Limited Studies
200 400 600 800 1000
2-Ethyl-l-hexanol Concentration, mg/l
37
image:
 FIGURE 16
EFFECT OF ETHYLENE DiCHLORIDE ON ANAEROBIC ACTIVITY
1.0
0.8
0.6
0.4
0.2
0.1
Substrate Limited
200 400 600 800 1000
Ethylene Dichloride Concentration, mg/l
38
image:
FIGURE 16
EFFECT OF ETHYLENE DiCHLORIDE ON ANAEROBIC ACTIVITY
1.0
0.8
0.6
0.4
0.2
0.1
Substrate Limited
200 400 600 800 1000
Ethylene Dichloride Concentration, mg/l
38
image:
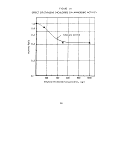 pH 2 in the non-substrate-Limited tests, A residual
ratio of 0,27 was measured at a mercuric chloride
dosage of 500 mg/1 in the food-limited tests.
All of the aldehydes tested (formaldehyde, croton-
aldehyde, and acrolein) exhibited severe effects;
acrolein (Figure 4) displayed the most adverse
effect (inhibitions below that observed in the
intentionally exhibited systems) at concentrations
of 100 mg/1 followed by crotonaIdehyde (Figure 5,
below killed-system activity at 300 mg/1) and
formaldehyde (Figure 6), All compounds were a
definite problem at the 50 mg/1 concentration level.
In the case of crotonaidehyde„ a greater inhibition
was observed in the non-substrate-limited study,
which could possibly be explained as previously
described.
In the studies with methyl isobutyl ketone (Figure 7),
no inhibition was noted in the substrate-limited
experiments. Although an initial rise in activity
was noted at a 50 mg/1 dosage level, a significant
inhibition was apparent at 100 mg/1 and above
in non-limited systems. Inhibition was found to
increase with concentration but was less than
experienced in the intentionally inhibited systems
indicating some residual activity.
Experiments were conducted with five nitrogen-containing
compounds -- diethylamine, ethylenediamine, aerylonitrile,
2-methyl-5-ethyl pyridine. and N,N-dimethylaniline.
Ethylenediamine (Figure 8) was found to be severely
inhibitory (A = 0.21) at 300 mg/1 with a slight
decrease in activity at LOO mg/L in non-substrate
limited experiments. Diethylamine (Figure 9) was
less inhibitory than the ethylenediamine, an activity
of 0.20 was measured at the 1000 mg/L concentration.
The 0.2 activity ratio is comparable to that observed
in the system which were intentionally inhibited,
Acrylonitrile is one of the few synthetic organic
materials which has been examined previously (14)
in anaerobic systems. AeryLonitrile additions of
50 and 100 mg/1 resulted in a marked decrease in
activity to a ratio of 0,5 at the 100 mg/1 level in
non-substrate-limited tests (Figure 10), A further
decrease in activity was noted up to 1000 mg/1, the
highest concentration tested. Inhibition was found
39
image:
pH 2 in the non-substrate-Limited tests, A residual
ratio of 0,27 was measured at a mercuric chloride
dosage of 500 mg/1 in the food-limited tests.
All of the aldehydes tested (formaldehyde, croton-
aldehyde, and acrolein) exhibited severe effects;
acrolein (Figure 4) displayed the most adverse
effect (inhibitions below that observed in the
intentionally exhibited systems) at concentrations
of 100 mg/1 followed by crotonaIdehyde (Figure 5,
below killed-system activity at 300 mg/1) and
formaldehyde (Figure 6), All compounds were a
definite problem at the 50 mg/1 concentration level.
In the case of crotonaidehyde„ a greater inhibition
was observed in the non-substrate-limited study,
which could possibly be explained as previously
described.
In the studies with methyl isobutyl ketone (Figure 7),
no inhibition was noted in the substrate-limited
experiments. Although an initial rise in activity
was noted at a 50 mg/1 dosage level, a significant
inhibition was apparent at 100 mg/1 and above
in non-limited systems. Inhibition was found to
increase with concentration but was less than
experienced in the intentionally inhibited systems
indicating some residual activity.
Experiments were conducted with five nitrogen-containing
compounds -- diethylamine, ethylenediamine, aerylonitrile,
2-methyl-5-ethyl pyridine. and N,N-dimethylaniline.
Ethylenediamine (Figure 8) was found to be severely
inhibitory (A = 0.21) at 300 mg/1 with a slight
decrease in activity at LOO mg/L in non-substrate
limited experiments. Diethylamine (Figure 9) was
less inhibitory than the ethylenediamine, an activity
of 0.20 was measured at the 1000 mg/L concentration.
The 0.2 activity ratio is comparable to that observed
in the system which were intentionally inhibited,
Acrylonitrile is one of the few synthetic organic
materials which has been examined previously (14)
in anaerobic systems. AeryLonitrile additions of
50 and 100 mg/1 resulted in a marked decrease in
activity to a ratio of 0,5 at the 100 mg/1 level in
non-substrate-limited tests (Figure 10), A further
decrease in activity was noted up to 1000 mg/1, the
highest concentration tested. Inhibition was found
39
image:
 in substrate-limited experiments, As noted with other
materials, this inhibition was not so severe as in the
experiments with excess substrate„ Residual activity
was noted since in no case was the inhibition observed
as severe as those systems which were intentionally
inhibited,
Experiments with 2-methyl-5-ethylpyridine indicated no
toxicity up to 50 mg/1 concentration, and inhibition
at 100 mg/1 and above in non-substrate limited tests
(Figure 11). With substrate limiting an apparent
degradation of the material was noted at 200 mg/1
with a slight inhibition at 1000 mg/1.
Phenol (Figure 12) was tested for inhibition as an
example of an aromatic compound which is known to be
inhibitory to unacclimated aerobic systems. In non-
substrate-limited experiments phenol was increasingly
inhibitory at concentrations up to 1000 mg/1, the
highest level tested. No inhibition and no additional
gas production was noted over the range of 0 to 1000 mg/1
in substrate-limited tests.
Two acrylates, sodium acrylate (Figure 13) and ethyl
acrylate (Figure 14) were found to be inhibitory.
Sodium acrylate was slightly inhibitory on non-
substrate-limited experiments at concentrations of
100 mg/1 and above while ethyl acrylate was more
inhibitory at higher concentrations. Ethyl acrylate,
as mentioned previously for other compounds, was
more inhibitory in non-substrate-limited experiments.
Two materials (2-ethyl-l-hexanol and ethylene
dichloride) were found inhibitory in substrate
limited studies. Activity for 2-ethyl-l-hexanol
(Figure 15) exhibited a classical response to increases
in 2-ethyl-l-hexanoL concentration; a small amount
stimulated activity while larger concentrations were
inhibitory. Ethylene dichloride was also tested
in a substrate-limiting experiment and found to be
inhibitory. The materials were not tested in
unlimited substrate experiments, but based on data
for other materials, should be considered inhibitory.
40
image:
in substrate-limited experiments, As noted with other
materials, this inhibition was not so severe as in the
experiments with excess substrate„ Residual activity
was noted since in no case was the inhibition observed
as severe as those systems which were intentionally
inhibited,
Experiments with 2-methyl-5-ethylpyridine indicated no
toxicity up to 50 mg/1 concentration, and inhibition
at 100 mg/1 and above in non-substrate limited tests
(Figure 11). With substrate limiting an apparent
degradation of the material was noted at 200 mg/1
with a slight inhibition at 1000 mg/1.
Phenol (Figure 12) was tested for inhibition as an
example of an aromatic compound which is known to be
inhibitory to unacclimated aerobic systems. In non-
substrate-limited experiments phenol was increasingly
inhibitory at concentrations up to 1000 mg/1, the
highest level tested. No inhibition and no additional
gas production was noted over the range of 0 to 1000 mg/1
in substrate-limited tests.
Two acrylates, sodium acrylate (Figure 13) and ethyl
acrylate (Figure 14) were found to be inhibitory.
Sodium acrylate was slightly inhibitory on non-
substrate-limited experiments at concentrations of
100 mg/1 and above while ethyl acrylate was more
inhibitory at higher concentrations. Ethyl acrylate,
as mentioned previously for other compounds, was
more inhibitory in non-substrate-limited experiments.
Two materials (2-ethyl-l-hexanol and ethylene
dichloride) were found inhibitory in substrate
limited studies. Activity for 2-ethyl-l-hexanol
(Figure 15) exhibited a classical response to increases
in 2-ethyl-l-hexanoL concentration; a small amount
stimulated activity while larger concentrations were
inhibitory. Ethylene dichloride was also tested
in a substrate-limiting experiment and found to be
inhibitory. The materials were not tested in
unlimited substrate experiments, but based on data
for other materials, should be considered inhibitory.
40
image:
 Discussion
Examination of the inhibition data from the screening-
type test yields several notable points both for
overcoming the effects of inhibitory material and for
application of these data to operating systems. The
c* - ft unsaturated compounds were found to be
inhibitory to anaerobic systems; the aldehydes
producing the most severe problems. Inhibition in
all cases was most pronounced in systems which were
non-substrate limited. Such a situation would be
comparable to a highly-loaded anaerobic treatment
unit or a treatment unit with a high volatile acid
content. A decrease in inhibition was noted with a
lower volatile acid content.
Experimental data for the screening studies was
obtained using only an active methane-producing,
unacclimated, domestic digester sludge. In many
cases acclimation of methane-forming or
other types of bacteria presumably could develop
a greater resistance to the particular compound.
A summary of problem concentrations for the various
tests is provided in Table 7.
41
image:
Discussion
Examination of the inhibition data from the screening-
type test yields several notable points both for
overcoming the effects of inhibitory material and for
application of these data to operating systems. The
c* - ft unsaturated compounds were found to be
inhibitory to anaerobic systems; the aldehydes
producing the most severe problems. Inhibition in
all cases was most pronounced in systems which were
non-substrate limited. Such a situation would be
comparable to a highly-loaded anaerobic treatment
unit or a treatment unit with a high volatile acid
content. A decrease in inhibition was noted with a
lower volatile acid content.
Experimental data for the screening studies was
obtained using only an active methane-producing,
unacclimated, domestic digester sludge. In many
cases acclimation of methane-forming or
other types of bacteria presumably could develop
a greater resistance to the particular compound.
A summary of problem concentrations for the various
tests is provided in Table 7.
41
image:
 TABLE 7
IDENTIFIED PROBLEM CONCENTRATIONS OF TESTED MATERIALS
(a)
Chemical
n-Butanol
sec-Butanol
t-Butanol
Ally! alcohol
2-Ethyl-l-hexanol
Problem Concentration
Substrate
Limiting
>1000 mg/1
500-1000 mg/1
Non-Substrate
Limiting
XLOOO mg/1
>1000 mg/1.
>1000 mg/1.
>1000 mg/1.
Formaldehyde
CrotonaIdehyde
Acrolein
200 mg/1
50-100 mg/1
50-100 mg/1
20-50 mg/1
Acetone
Methyl isobutyl ketone
Isophorone
>1000 mg/1
XLOOO mg/1
XLOOO mg/1
100-300 mg/1
Diethylamine
Ethylene diamine
Acrylonitrile
2-Methyl-5-ethylpyridine
N,N-dimethylaniline
150-500 mg/1
>1000 mg/1
>1000 mg/1
300-1000 mg/1
100-300 mg/1
100 mg/1
100 mg/1
42
image:
TABLE 7
IDENTIFIED PROBLEM CONCENTRATIONS OF TESTED MATERIALS
(a)
Chemical
n-Butanol
sec-Butanol
t-Butanol
Ally! alcohol
2-Ethyl-l-hexanol
Problem Concentration
Substrate
Limiting
>1000 mg/1
500-1000 mg/1
Non-Substrate
Limiting
XLOOO mg/1
>1000 mg/1.
>1000 mg/1.
>1000 mg/1.
Formaldehyde
CrotonaIdehyde
Acrolein
200 mg/1
50-100 mg/1
50-100 mg/1
20-50 mg/1
Acetone
Methyl isobutyl ketone
Isophorone
>1000 mg/1
XLOOO mg/1
XLOOO mg/1
100-300 mg/1
Diethylamine
Ethylene diamine
Acrylonitrile
2-Methyl-5-ethylpyridine
N,N-dimethylaniline
150-500 mg/1
>1000 mg/1
>1000 mg/1
300-1000 mg/1
100-300 mg/1
100 mg/1
100 mg/1
42
image:
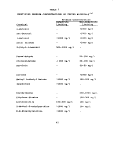 TABLE 7 (CONT'D)
Phenol
Ethyl benzene
Sodium benzoate
>1000 mg/1
>1000 mg/1
300-1000 mg/1
(~ 400)
>300 mg/1
Ethylene dichloride
Ethyl acrylate
150-500 mg/1
600-1000 mg/1 300-600 mg/1
Sodium acrylate
Dodecane
Dextrose
Ethyl acetate
Ethylene glycol
Diethylene glycol
Tetralin
Kerosene
Cobalt chloride
XLOOO mg/1
XLOOO mg/1
>1000 mg/1
>1000 mg/1
>1000 mg/1
>500 mg/1
>1000 mg/1
>900 mg/1
>1000 mg/1
>500 mg/1
>1000 mg/1
(a) Compound was arbitrarily classified as a problem when
the activity ratio was less than 0.5. The 0.5 level
was considered to be a decrease of more than 50% of the
total gas production.
43
image:
TABLE 7 (CONT'D)
Phenol
Ethyl benzene
Sodium benzoate
>1000 mg/1
>1000 mg/1
300-1000 mg/1
(~ 400)
>300 mg/1
Ethylene dichloride
Ethyl acrylate
150-500 mg/1
600-1000 mg/1 300-600 mg/1
Sodium acrylate
Dodecane
Dextrose
Ethyl acetate
Ethylene glycol
Diethylene glycol
Tetralin
Kerosene
Cobalt chloride
XLOOO mg/1
XLOOO mg/1
>1000 mg/1
>1000 mg/1
>1000 mg/1
>500 mg/1
>1000 mg/1
>900 mg/1
>1000 mg/1
>500 mg/1
>1000 mg/1
(a) Compound was arbitrarily classified as a problem when
the activity ratio was less than 0.5. The 0.5 level
was considered to be a decrease of more than 50% of the
total gas production.
43
image:
 image:
 SECTION V
CONTROL OF INHIBITORY MATERIALS
Once problem compounds and associated inhibitory concen-
trations of these materials are identified, it becomes
necessary to avert the potential inhibition if anaerobic
treatment is to remain a viable alternative. Since the
anaerobic process undoubtedly would be employed as a
pretreatment step (the anaerobic effluent is generally
not suited for discharge to the environment), a bypass of
anaerobic pretreatment for a problem stream could be
utilized.
Another potential control mechanism could be dilution of
the problem waste with other waste streams to maintain a
concentration below that found to be inhibitory. Dilution
with clean water would be unfeasible as the economics of
anaerobic treatment are based on treatment of a concen-
trated waste and a low-flow volume is desirable. Either
effluent recycle or other wastes could be used for dilu-
tion .
If the inhibitory material occurred in batch discharges,
impounding and a slow release to treatment at a concen-
tration less than inhibitory could effectively avoid
problems.
Design of a lower rate anaerobic system such as the
anaerobic lagoon utilized in previous studies (1, 2, 10)
would also be effective in combating inhibition due to
the greater inhibition observed in a highly loaded,
rapidly growing system.
Perhaps the most effective means of overcoming inhibition
with a steady feed of inhibitory material would be
through bacterial acclimation to allow higher concen-
trations of problem chemicals to be treated without
inhibition. Although desirable, acclimation of
methanogenic bacteria does not necessarily have to
occur for the system to be effective. For example, a
culture of acid-forming bacteria might be developed
to partially degrade the inhibitory material to maintain
a low enough concentration in a continuously fed system
so that inhibition problems with methane bacteria would
not result. Such a system could occur either as a
completely mixed reaction system with a rapid decomposi-
tion of inhibitors or in a staged system with inhibitory
45
image:
SECTION V
CONTROL OF INHIBITORY MATERIALS
Once problem compounds and associated inhibitory concen-
trations of these materials are identified, it becomes
necessary to avert the potential inhibition if anaerobic
treatment is to remain a viable alternative. Since the
anaerobic process undoubtedly would be employed as a
pretreatment step (the anaerobic effluent is generally
not suited for discharge to the environment), a bypass of
anaerobic pretreatment for a problem stream could be
utilized.
Another potential control mechanism could be dilution of
the problem waste with other waste streams to maintain a
concentration below that found to be inhibitory. Dilution
with clean water would be unfeasible as the economics of
anaerobic treatment are based on treatment of a concen-
trated waste and a low-flow volume is desirable. Either
effluent recycle or other wastes could be used for dilu-
tion .
If the inhibitory material occurred in batch discharges,
impounding and a slow release to treatment at a concen-
tration less than inhibitory could effectively avoid
problems.
Design of a lower rate anaerobic system such as the
anaerobic lagoon utilized in previous studies (1, 2, 10)
would also be effective in combating inhibition due to
the greater inhibition observed in a highly loaded,
rapidly growing system.
Perhaps the most effective means of overcoming inhibition
with a steady feed of inhibitory material would be
through bacterial acclimation to allow higher concen-
trations of problem chemicals to be treated without
inhibition. Although desirable, acclimation of
methanogenic bacteria does not necessarily have to
occur for the system to be effective. For example, a
culture of acid-forming bacteria might be developed
to partially degrade the inhibitory material to maintain
a low enough concentration in a continuously fed system
so that inhibition problems with methane bacteria would
not result. Such a system could occur either as a
completely mixed reaction system with a rapid decomposi-
tion of inhibitors or in a staged system with inhibitory
45
image:
 material degradation in the first stage and methane
decomposition in subsequent stages.
The previously cited screening-type data on inhibition
obtained using a Warburg respirometer are representative
of inhibitors to methanogenic bacteria under spill or
other shock-loading conditions. In order to assess
the chemical's effect on the methanogenic bacterial
culture when received on a regular basis tests with
biomass which has had an opportunity to adapt or
acclimate are necessary.
Two types of studies were conducted regarding anaerobic
bacterial acclimation to chemicals inhibitory to methane
production. In the first type, attempts were made to
acclimate the methane organisms per se to selected
inhibitory materials. In a second series of experiments,
inhibitory materials were treated in continuous flow,
packed-bed reactors to evaluate the ability of the total
anaerobic biomass to acclimate to and degrade the
material. Chemicals were selected for acclimation
testing based primarily on their presence in known
inhibitory waste flows in large concentrations.
Batch-Fed Anaerobic Digestion Studies
Test Series #1 Acclimation studies were initiated
using the reactors shown in Figure 17. Within these
reactors an anaerobic biomass was subjected to slowly
increasing amounts of a specific chemical structure
in the feed. An initial test series was set up to
develop suitable sampling and refeeding techniques.
Sampling and refeeding of the unit was accomplished
23 times without any loss of activity in the control
units which received no inhibitory materials. A
detailed experimental procedure is presented in
Appendix I.
Test Series #2 Based on the results of this first
test series several modifications were made in the
subsequent test procedures. The major changes
consisted of continual mixing, which replaced the
twice daily mixing. Experimental apparatus is
illustrated in Figure 18 while a detailed procedure
is included in Appendix I.
46
image:
material degradation in the first stage and methane
decomposition in subsequent stages.
The previously cited screening-type data on inhibition
obtained using a Warburg respirometer are representative
of inhibitors to methanogenic bacteria under spill or
other shock-loading conditions. In order to assess
the chemical's effect on the methanogenic bacterial
culture when received on a regular basis tests with
biomass which has had an opportunity to adapt or
acclimate are necessary.
Two types of studies were conducted regarding anaerobic
bacterial acclimation to chemicals inhibitory to methane
production. In the first type, attempts were made to
acclimate the methane organisms per se to selected
inhibitory materials. In a second series of experiments,
inhibitory materials were treated in continuous flow,
packed-bed reactors to evaluate the ability of the total
anaerobic biomass to acclimate to and degrade the
material. Chemicals were selected for acclimation
testing based primarily on their presence in known
inhibitory waste flows in large concentrations.
Batch-Fed Anaerobic Digestion Studies
Test Series #1 Acclimation studies were initiated
using the reactors shown in Figure 17. Within these
reactors an anaerobic biomass was subjected to slowly
increasing amounts of a specific chemical structure
in the feed. An initial test series was set up to
develop suitable sampling and refeeding techniques.
Sampling and refeeding of the unit was accomplished
23 times without any loss of activity in the control
units which received no inhibitory materials. A
detailed experimental procedure is presented in
Appendix I.
Test Series #2 Based on the results of this first
test series several modifications were made in the
subsequent test procedures. The major changes
consisted of continual mixing, which replaced the
twice daily mixing. Experimental apparatus is
illustrated in Figure 18 while a detailed procedure
is included in Appendix I.
46
image:
 O
U
o
IX CD
- o
Ml HA
5 ULJ
D <
O Z
TL <
o
I
X
u
47
image:
O
U
o
IX CD
- o
Ml HA
5 ULJ
D <
O Z
TL <
o
I
X
u
47
image:
 LU
C£
U
OQ
- g
^- LLJ
D
O
u
-<f O
- s
O
U
o
CO
X
Q_
O
z -j
O
48
image:
LU
C£
U
OQ
- g
^- LLJ
D
O
u
-<f O
- s
O
U
o
CO
X
Q_
O
z -j
O
48
image:
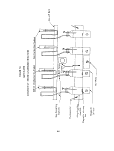 Once the desired test chemical dosage was achieved and
gas production remained suitable, biomass samples were
removed from these mixed acclimators for use in
evaluation tests in a Warburg respirometer to measure
the degree of acclimation obtained by methanogenic
bacteria. The same Warburg procedures were utilized
with these acclimated sludges as were employed in the
previous inhibition testing.
Acclimator Data
The gas production data obtained from the initial series
of batch-fed acclimation tests are presented in Figures 19
through 21 as compared to the degradable calcium acetate
control. The two test systems fed a degradable substrate
remained active over an extended period through many
sampling and refeeding operations. No notable difference
was observed between the two control units. Although
the sampling and refeeding technique was a success, the
process failed to achieve the ultimate goal of acclimation
with ethyl acrylate and methyl ethyl pyridine while
one of the crotonaldehyde reactors did acclimate.
As presented in Figure 19, one unit receiving croton-
aldehyde was acclimated to a 80 mg/1 (concentration
when introduced to test bottle) dosage while the other
unit exhibited complete inhibition of gas production
at the 70 to 80 mg/1 dosage. It should be noted that
the applied inhibitory concentrations are those which
would occur when the material is mixed with the contents
of the reactor. If no degradation of the material
occurs, the actual concentration in the reactor will
build to some greater level which must be determined
chromatographically. The unit which acclimated did
undergo a lag period but rapidly recovered after
cesation of the crotonaldehyde feed. No recovery
was noted in the inhibited unit. Crotonaldehyde
was found only once by chromatographic analyses
(Table 8) within the unit samples taken before feeding -
indicating no residual accumulation from feeding
to feeding and a degradation within the unit. The
70 to 80 mg/1 inhibitory level agrees well with the
inhibitory concentration found in the non-acclimated
biomass studies.
49
image:
Once the desired test chemical dosage was achieved and
gas production remained suitable, biomass samples were
removed from these mixed acclimators for use in
evaluation tests in a Warburg respirometer to measure
the degree of acclimation obtained by methanogenic
bacteria. The same Warburg procedures were utilized
with these acclimated sludges as were employed in the
previous inhibition testing.
Acclimator Data
The gas production data obtained from the initial series
of batch-fed acclimation tests are presented in Figures 19
through 21 as compared to the degradable calcium acetate
control. The two test systems fed a degradable substrate
remained active over an extended period through many
sampling and refeeding operations. No notable difference
was observed between the two control units. Although
the sampling and refeeding technique was a success, the
process failed to achieve the ultimate goal of acclimation
with ethyl acrylate and methyl ethyl pyridine while
one of the crotonaldehyde reactors did acclimate.
As presented in Figure 19, one unit receiving croton-
aldehyde was acclimated to a 80 mg/1 (concentration
when introduced to test bottle) dosage while the other
unit exhibited complete inhibition of gas production
at the 70 to 80 mg/1 dosage. It should be noted that
the applied inhibitory concentrations are those which
would occur when the material is mixed with the contents
of the reactor. If no degradation of the material
occurs, the actual concentration in the reactor will
build to some greater level which must be determined
chromatographically. The unit which acclimated did
undergo a lag period but rapidly recovered after
cesation of the crotonaldehyde feed. No recovery
was noted in the inhibited unit. Crotonaldehyde
was found only once by chromatographic analyses
(Table 8) within the unit samples taken before feeding -
indicating no residual accumulation from feeding
to feeding and a degradation within the unit. The
70 to 80 mg/1 inhibitory level agrees well with the
inhibitory concentration found in the non-acclimated
biomass studies.
49
image:
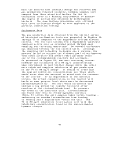 FIGURE 19
ACCLIMATION STUDIES WITH CRCTONALDEIIYDE
Test Series #1 - Intermittent Mixing
2800
r
Crotonaidehyde
20 40
Time in Reactor, days
50
image:
FIGURE 19
ACCLIMATION STUDIES WITH CRCTONALDEIIYDE
Test Series #1 - Intermittent Mixing
2800
r
Crotonaidehyde
20 40
Time in Reactor, days
50
image:
 FIGURE 20
ACCLIMATION STUDIES WITH ETHYL ACRYLATE
Test Series #1 - Intermittent Mixing
2800
20 40 60
Time in Reactor, days
51
image:
FIGURE 20
ACCLIMATION STUDIES WITH ETHYL ACRYLATE
Test Series #1 - Intermittent Mixing
2800
20 40 60
Time in Reactor, days
51
image:
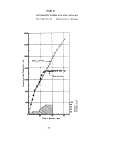 FIGURE 21
ACCLIMATION STUDIES WITH METHYL ETHYL PYRIDINE
Test Series #1 - Intermittent Mixing
2800
2400 -
2000
1600
a
O
.> 1200
3
D
U
Methyl ethyl pyridipe
400
20 40
Time in Reactor, days
52
image:
FIGURE 21
ACCLIMATION STUDIES WITH METHYL ETHYL PYRIDINE
Test Series #1 - Intermittent Mixing
2800
2400 -
2000
1600
a
O
.> 1200
3
D
U
Methyl ethyl pyridipe
400
20 40
Time in Reactor, days
52
image:
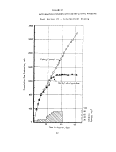 TABLE 8
SUPPORTING ANALYTICAL DATA ON BATCH-FED
ACCLIMATION REACTORS
Chromatographic Data, mg/1
Test
Day
21
26
31
34
38
45
62
69
Units: Crotonaldehyde
nil
nil
nil
nil
nil
39
nil
nil
Ethyl
Acrylate
nil
nil
21
12
20
nil
nil
nil
Methyl
Ethyl Pyridine
43
117
312
140
332
720
1080
960
Periodic checks of unit pH indicated it remained between
6.5 and 7.5 during the entire test.
Limited alkalinity data showed a range of between 2200 and
3600 mg/1 as
Volatile acid data showed a range between 700 and 3000 mg/1
as HAc during the study.
53
image:
TABLE 8
SUPPORTING ANALYTICAL DATA ON BATCH-FED
ACCLIMATION REACTORS
Chromatographic Data, mg/1
Test
Day
21
26
31
34
38
45
62
69
Units: Crotonaldehyde
nil
nil
nil
nil
nil
39
nil
nil
Ethyl
Acrylate
nil
nil
21
12
20
nil
nil
nil
Methyl
Ethyl Pyridine
43
117
312
140
332
720
1080
960
Periodic checks of unit pH indicated it remained between
6.5 and 7.5 during the entire test.
Limited alkalinity data showed a range of between 2200 and
3600 mg/1 as
Volatile acid data showed a range between 700 and 3000 mg/1
as HAc during the study.
53
image:
 Ethyl acrylate exhibited inhibitory properties to both
experimental units at reactor concentrations of 60 to
70 mg/1, while methyl ethyl pyridine showed problems at
the 40 to 50 mg/1 feed level. Chromatographic data on
periodic acclimator samples showed only a small test-
chemical buildup in the ethyl acrylate bottle indicating
some degradation of this structure, as noted in those
systems treating crotonaldehyde„ Similar data on the
bottles containing methyl ethyl pyridine (MEP) indicated
a fairly rapid increase in residual concentration of
the test chemical. While the apparent inhibition
occurred at the 40 to 50 mg/1 dosage level, an actual
concentration of 117 mg/1 was present in the bottle.
The inhibitory concentration of ethyl acrylate found
in the acclimation tests was less than that observed
in non-food limited tests with unacclimated biomass
(60 to 70 versus 40 mg/1) while the methyl ethyl
pyridine concentration remaining in the bottle was
close to the 100 mg/1 concentration which proved
inhibitory in screening tests,
Based on the results of this first acclimation effort,,
the continuously mixed acclimation system was employed
in Test Series #2. The gas production data presented
in Figures 22 through 25 for the continuously mixed
test series indicate some acclimation of the culture
to crotonaldehyde, while in the units fed phenol,
sodium acrylate and ethyl acrylate, inhibitory levels
were not reached. The acclimation unit receiving
crotonaldehyde produced more cumulative gas than did
the control due to a leak in the control during the
first days of the experiment.
A Warburg respirometer test utilizing cultures from
the control and crotonaldehyde units on Day 84 of the
acclimation period confirmed that the culture was
acclimated to crotonaldehyde dosages of at least
200 mg/1. These results are shown in Figure 26
along with previous Warburg inhibition data on croton-
aldehyde. All Warburg studies were performed as
previously described over a 12-hour test period.
The gas production data shown in Figures 23 through
25 still indicate inhibition with sodium acrylate
(gas production lower than control) while a degree
of acclimation apparently was achieved with phenol
and ethyl acrylate. Warburg respirometer studies
54
image:
Ethyl acrylate exhibited inhibitory properties to both
experimental units at reactor concentrations of 60 to
70 mg/1, while methyl ethyl pyridine showed problems at
the 40 to 50 mg/1 feed level. Chromatographic data on
periodic acclimator samples showed only a small test-
chemical buildup in the ethyl acrylate bottle indicating
some degradation of this structure, as noted in those
systems treating crotonaldehyde„ Similar data on the
bottles containing methyl ethyl pyridine (MEP) indicated
a fairly rapid increase in residual concentration of
the test chemical. While the apparent inhibition
occurred at the 40 to 50 mg/1 dosage level, an actual
concentration of 117 mg/1 was present in the bottle.
The inhibitory concentration of ethyl acrylate found
in the acclimation tests was less than that observed
in non-food limited tests with unacclimated biomass
(60 to 70 versus 40 mg/1) while the methyl ethyl
pyridine concentration remaining in the bottle was
close to the 100 mg/1 concentration which proved
inhibitory in screening tests,
Based on the results of this first acclimation effort,,
the continuously mixed acclimation system was employed
in Test Series #2. The gas production data presented
in Figures 22 through 25 for the continuously mixed
test series indicate some acclimation of the culture
to crotonaldehyde, while in the units fed phenol,
sodium acrylate and ethyl acrylate, inhibitory levels
were not reached. The acclimation unit receiving
crotonaldehyde produced more cumulative gas than did
the control due to a leak in the control during the
first days of the experiment.
A Warburg respirometer test utilizing cultures from
the control and crotonaldehyde units on Day 84 of the
acclimation period confirmed that the culture was
acclimated to crotonaldehyde dosages of at least
200 mg/1. These results are shown in Figure 26
along with previous Warburg inhibition data on croton-
aldehyde. All Warburg studies were performed as
previously described over a 12-hour test period.
The gas production data shown in Figures 23 through
25 still indicate inhibition with sodium acrylate
(gas production lower than control) while a degree
of acclimation apparently was achieved with phenol
and ethyl acrylate. Warburg respirometer studies
54
image:
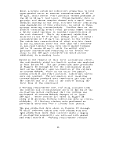 FIGURE 22
GAS PRODUCTION IN ACCLIMATION UNIT RECEIVING CROTONALDEHYDE
Test Series #2 - Continuously Mixed Digesters
7000
in
E
-o
V
o
8
O
0>
Ji
3
u
6000
5000
4000
3000
2000
1000
Con fro
Crotonaldehyde
40 60
Study Period, days
55
image:
FIGURE 22
GAS PRODUCTION IN ACCLIMATION UNIT RECEIVING CROTONALDEHYDE
Test Series #2 - Continuously Mixed Digesters
7000
in
E
-o
V
o
8
O
0>
Ji
3
u
6000
5000
4000
3000
2000
1000
Con fro
Crotonaldehyde
40 60
Study Period, days
55
image:
 FIGURE 23
GAS PRODUCTION IN ACCLIMATION UNIT RECEIVING PHENOL
Test Series #2 - Continuously Mixed Digesters
7000
O Control
A Phenol Reactor
20 30
Time, days
50
56
image:
FIGURE 23
GAS PRODUCTION IN ACCLIMATION UNIT RECEIVING PHENOL
Test Series #2 - Continuously Mixed Digesters
7000
O Control
A Phenol Reactor
20 30
Time, days
50
56
image:
 FIGURE 24
GAS PRODUCTION IN ACCLIMATION UNIT RECEIVING ETHYL ACRYLATE
Test Series #2 - Continuously Mixed Digesters
7000
6000
5000
1/1
E
•4-
u
i
4000
VI
O
o
r 3000
E
U
2000
1000
O Control
A Ethyl aerylate
57
image:
FIGURE 24
GAS PRODUCTION IN ACCLIMATION UNIT RECEIVING ETHYL ACRYLATE
Test Series #2 - Continuously Mixed Digesters
7000
6000
5000
1/1
E
•4-
u
i
4000
VI
O
o
r 3000
E
U
2000
1000
O Control
A Ethyl aerylate
57
image:
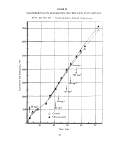 FIGURE 25
GAS PRODUCTION IN ACCLIMATION UNIT RECEIVING SODIUM ACRYLATE
Test Series #2 - Continuously Mixed Digesters
7000
6000
5000
in
E
o
3 4000
o
o
0>
•j: 3000
D
u
2000
1000
10
20mg/l
60
I 20 mg/l
40 mg/l
O Control
A Sodium Acrylate
'Dosage
100 mg/
80 mg/l
mg/l
20 30
Time, days
40
50
58
image:
FIGURE 25
GAS PRODUCTION IN ACCLIMATION UNIT RECEIVING SODIUM ACRYLATE
Test Series #2 - Continuously Mixed Digesters
7000
6000
5000
in
E
o
3 4000
o
o
0>
•j: 3000
D
u
2000
1000
10
20mg/l
60
I 20 mg/l
40 mg/l
O Control
A Sodium Acrylate
'Dosage
100 mg/
80 mg/l
mg/l
20 30
Time, days
40
50
58
image:
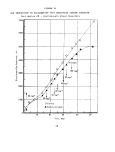 FIGURE 26
WARBURG TEST OF ACCLIMATION TO CROTONALDEHYDE
0.4
0.2
0
Unacclimated biomass
Acclimated biomass
Note: All data are for non-substrate limited experiments
50 100 150 200
Crotonaldehyde Concentration, mg/l
59
image:
FIGURE 26
WARBURG TEST OF ACCLIMATION TO CROTONALDEHYDE
0.4
0.2
0
Unacclimated biomass
Acclimated biomass
Note: All data are for non-substrate limited experiments
50 100 150 200
Crotonaldehyde Concentration, mg/l
59
image:
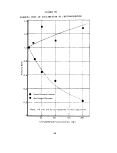 on these acclimated cultures performed on Day 54 of
the study, (Figures 27 through 29) show that the culture
was definitely acclimated to phenol at added levels of up
to 400 mg/1. This 400 mg/1 concentration was considerably
above that fed to the acclimation unit. Consideration
of the residual phenol in the reactor sludge (270 mg/1)
indicates acclimation at concentrations of 635 mg/1
since 50 percent by volume sludge was added to the
Warburg flask.
The ethyl acrylate Warburg indicated a decreased
inhibition at concentrations of 50 and 100 mg/1 levels
(the maximum concentration to the acclimation unit) but
an activity similar to that in non-acclimated reference
sludge and domestic sludge at 200 mg/1. Thus an acclima-
tion was seen to the level of material steadily fed but
none above this concentration,, No residual ethyl
acrylate was found in the reactor by chromatographic
analysis indicating that the material degraded.
No increase in resistance to sodium acrylate inhibition
was noted with the acclimated biomass. This might be
predicted from the gas production in the acclimation
reactors which was noted to be lower than that in both
the calcium acetate control and the units receiving
phenol and ethyl acrylate. Leakage in the highest
concentration of sodium acrylate listed in the Warburg
experiment may account for the greater inhibition over
that seen in the non-acclimated experiments.
A data summary of the acclimation of methane bacteria
to the four materials is presented in Table 9. Informa-
tion on the maximum concentrations of crotonaldehyde
and phenol which could be tolerated by the acclimated
biomass would be desirable, however, once the acclima-
tion reactors had been opened for sludge removal it
was considered undesirable to reuse the sludge for
further Warburg studies due to oxygen contamination
and resulting toxicity.
Packed Column Studies
The anaerobic packed column reactor ( 1, 15) was chosen
for testing inhibition of selected chemicals in an on-
line treatment system due to the stability of operation
of laboratory units of this type, the plug-flow tendency
of this type reactor, and the potential economic
advantage of this type anaerobic system over the complete
mix, digestion unit ( 1 ).
image:
on these acclimated cultures performed on Day 54 of
the study, (Figures 27 through 29) show that the culture
was definitely acclimated to phenol at added levels of up
to 400 mg/1. This 400 mg/1 concentration was considerably
above that fed to the acclimation unit. Consideration
of the residual phenol in the reactor sludge (270 mg/1)
indicates acclimation at concentrations of 635 mg/1
since 50 percent by volume sludge was added to the
Warburg flask.
The ethyl acrylate Warburg indicated a decreased
inhibition at concentrations of 50 and 100 mg/1 levels
(the maximum concentration to the acclimation unit) but
an activity similar to that in non-acclimated reference
sludge and domestic sludge at 200 mg/1. Thus an acclima-
tion was seen to the level of material steadily fed but
none above this concentration,, No residual ethyl
acrylate was found in the reactor by chromatographic
analysis indicating that the material degraded.
No increase in resistance to sodium acrylate inhibition
was noted with the acclimated biomass. This might be
predicted from the gas production in the acclimation
reactors which was noted to be lower than that in both
the calcium acetate control and the units receiving
phenol and ethyl acrylate. Leakage in the highest
concentration of sodium acrylate listed in the Warburg
experiment may account for the greater inhibition over
that seen in the non-acclimated experiments.
A data summary of the acclimation of methane bacteria
to the four materials is presented in Table 9. Informa-
tion on the maximum concentrations of crotonaldehyde
and phenol which could be tolerated by the acclimated
biomass would be desirable, however, once the acclima-
tion reactors had been opened for sludge removal it
was considered undesirable to reuse the sludge for
further Warburg studies due to oxygen contamination
and resulting toxicity.
Packed Column Studies
The anaerobic packed column reactor ( 1, 15) was chosen
for testing inhibition of selected chemicals in an on-
line treatment system due to the stability of operation
of laboratory units of this type, the plug-flow tendency
of this type reactor, and the potential economic
advantage of this type anaerobic system over the complete
mix, digestion unit ( 1 ).
image:
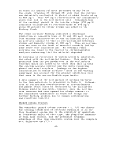 1.0
0.8
o
<
0.4
0.2
0
FIGURE 27
WARBURG TEST OF ACCLIMATION TO PHENOL
Acclimated biomass
Reference biomass
Note: All data are for non-substrate limited experiments.
For acclimated sludge concentration in flask
equals added plus that in sludge.
200 400 600 800
Phenol Concentration in Flask, mg/'l
1000
61
image:
1.0
0.8
o
<
0.4
0.2
0
FIGURE 27
WARBURG TEST OF ACCLIMATION TO PHENOL
Acclimated biomass
Reference biomass
Note: All data are for non-substrate limited experiments.
For acclimated sludge concentration in flask
equals added plus that in sludge.
200 400 600 800
Phenol Concentration in Flask, mg/'l
1000
61
image:
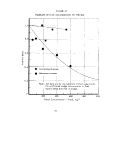 FIGURE 28
WARBURG TEST OF ACCLIMATION TO ETHYL ACRYLATE
1.0
0.8
From previous
Warburg data
u
0.4
0.2
Non-acclimated control
Acclimated biomass
Note: All data are from non-substrate limited experiments
50 100 150 200
Ethyl Acrylate Concentration, mg/l
62
image:
FIGURE 28
WARBURG TEST OF ACCLIMATION TO ETHYL ACRYLATE
1.0
0.8
From previous
Warburg data
u
0.4
0.2
Non-acclimated control
Acclimated biomass
Note: All data are from non-substrate limited experiments
50 100 150 200
Ethyl Acrylate Concentration, mg/l
62
image:
 FIGURE 29
WARBURG TEST OF ACCLIMATION TO SODIUM ACRYLATE
Unacclimated bi
Acclimated biomass
Note: All data are for non-substrate
limited experiments
50 100 150 200
Sodium Acrylate Concentration, mg/l
63
image:
FIGURE 29
WARBURG TEST OF ACCLIMATION TO SODIUM ACRYLATE
Unacclimated bi
Acclimated biomass
Note: All data are for non-substrate
limited experiments
50 100 150 200
Sodium Acrylate Concentration, mg/l
63
image:
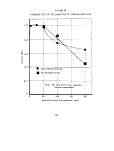 O)
H
DO
ACHIEVED FOR CROTONALDEHYDE,
CONTINUOUSLY MIXED REACTORS
§ 2
H s
EVALUATION OF ACCLIM.
ATE, AND ETHYL ACRYLA
W >i
w o
RESPIROM
SODIUM A
i J
5 0
S |
M
B
O O CM rH
•H O CM CM 4) 4> 0)
4-> O • M £ 4-"
cgrHiiiolll'IOIlcg -M eg
4-> O O >>
B rH m co 4-> •«
CD O ^" CO O
O O • B on
B<OIIIIOIIIIOII O- -H
O 4J CD X rH
O C<1 O >>
•fl« CB 00 CD -H 4-> £
rH O in rH CO iH 4->
eg o • • • >H - 4) BO)
o m i i i iiiooi 101 ra c tie en CD
•H £ O « C T3 • 5 I~l
8 C-H-H3CO .O \
CD Ml1 4-> J3 CD rH 4-> >. bfl
s: o in o> eDeg4->.flo)OtoiH CDE
OO • • .C E 1-1 -H CD -H &.
«* III IOO III III 4->-H i* CD CO 4J 4-> eg • eg o
4J rHrH-Heg3M.Cin
CQ 4-JCJCOCDJHlHhOTJlO
CD rH 0) co raorH&4Jfirara->,(D
EH O CM <O (O ra 0) >• T-I »H E rH eg J3
toco oil oil 111 oil a> <H ca4->o-Ho> -H t&
O <S B) M B >.-H l-i ra O HI
IH O CM <OCJ1 in^* t*- IO bOQ< 13 -H CJ CO CD t*» 4-> (1)
>CM 1 1 rH IOO IOO IOO T) 4-> TD O -H ho ra ra B CD
^ 0>iH4->a>(HOSlD-'-' iH
4-» •ttXXXBOJSd'H-HoB
eg rH tO O CM rH 00 Tj" rH lO •> O> O (- B i-l M ra 4-> JD B rH ^ eg 10
OCO^«rH»oo.>i>t»aot-l>O eg eg BO. r-iUU 4J eg
•rlrH OOrH OOO OOO O O-tH -H 4J >.O-Hie*C-)<8 MO
*. S't.sfc.ejO -000)
eg C'Q.ooB'Hia+'aa rH
« maooi>a>ocoao>> oo n -.-•iDOtiaww-tc j2 •
o (omco 01 » o o a> a> <oo a- •• -^ cgrH-ncDocD to CD no
4J OOtHOO-HrHOO IO>-H •«*!.» OXiO > >T3>> O+-'
•H 4-- eg Dl*3CD(L>egCDCDXto«i
> OCOegTJUM-H-t-iOcgt.!
•H mt- O) niu^r-li3a)CQ,4->J3ra a>
4->ooOo O fcitfl CDtiegfioS'-rH.1-.
o N • • • ta>aiC(Dca>a>ra-H4J 4->
< OlrH III rHIl III CISA4-> -HO-lCDCDXiU rHlfl 0>-H
Q4->4->XO U CD O -•
gT3ClO 4)4->OB CDV CJ4-* 3-rl
CDrH-UBCO-Hx: eg T34->
t +-> 3 ID C O cg4->/-s4-> <H OO
r-v ot,-ititibe?'^cn a
-^ <H <H <H <H 0>CD»CD<I-I30CD4->IO h O CI
10 V CD CD CD CtiWO>CJ2T3C«>.Cra <-J "1
10 rH rH (4 rH lHO>VlV.4JB»fc|1-IQ. 4-'
a e6M^3*JrHrHCDE'OO TJeil
8 "O13 "OTS "0*0 "0*0 -r-'CD4-*(fl4->Q)<^4JCDO>-M C >t Or-l
O CD © 3) CD s^ CD IB O C? -Q ^^ fl) 01 *H X C? C CO O rH i— t ^J
03 ra eg eg eg^ caeo eg eg 3-H 4->3-MegO4->eg egr-i
B B -O B B T3 SET) SET) >«-< M ArH(aeg4->X) eg CD u-ieis
<H -Hi-ICD -H -H 4) -H-HO) -Ht-ICD •-'(/)>. (H W ra -H ' Beg >H O
o o eg o o eg o o ra o o eg acD4->A B-H-Pmcg c B in !-.
CD OOS UCJ8 cjus ejcjE PcDo*H*0egS ^ S<1) Q> *^ cgO
U ra eg 1-1 eg eg -H eg ra -H eg ra -H -H ,H a; eg a> CDbDO -C cj (H rHt-<
rH II>H llrH I I rH I 1 rH (>O.OrH^C:CD.CB.Ca!4-> B 3 <tH
3 coo n a o BBO a o o -H4->-H -ri4->o-Huieg 013 T)
O O 0 O OOO O O o O O O (-, T) M ra ra U ? O O -(DO
W S5S5< USSC-a: S5S5< S5,Z!< OO) E4->4->4->3io 4-> eg o H
JSTJ'H C 0> I/I "O +-> CD rH MT-( C'r4
rHCMCO rHCMCO rHCNCO rHCMCO rH.(00> M CO 4-> 13 0 T3 0) B -H O> rH-H
13 CD 4->CDCJCD3J3OtiIOIOCXa>cgCD
CDCD 4-> CD I/)BClOlOCA'H4->B3 O r-H^tnUI
4J-O eg +J Ctteg-OTJO ifliotHiS ts
W >. rH eei MrH 3CD3rHT3(fleg-r44-' B (OO <UE«
CD J3 >> rH T) O.>H J3rHcgO)cgCDJ3B 3 eg-H n
-O O >H -H 4-> IH CD 10
egeg < CDrn'cM coJ-JlflOOr-i
CJB rH S ,_(gv_.--' w u eg B B <»•<
•HO O 3 rH rH4-> cgrHeg'H
B+J B -H >» <eg CQtuJSOT-t-1
CDO CD tj js x-xCD «-N'-^4-'x^t']
J3 IH J2 O 4J ra I-i £ O U TD :l)
oo o. w w --4J ^.v_e^4J
64
image:
O)
H
DO
ACHIEVED FOR CROTONALDEHYDE,
CONTINUOUSLY MIXED REACTORS
§ 2
H s
EVALUATION OF ACCLIM.
ATE, AND ETHYL ACRYLA
W >i
w o
RESPIROM
SODIUM A
i J
5 0
S |
M
B
O O CM rH
•H O CM CM 4) 4> 0)
4-> O • M £ 4-"
cgrHiiiolll'IOIlcg -M eg
4-> O O >>
B rH m co 4-> •«
CD O ^" CO O
O O • B on
B<OIIIIOIIIIOII O- -H
O 4J CD X rH
O C<1 O >>
•fl« CB 00 CD -H 4-> £
rH O in rH CO iH 4->
eg o • • • >H - 4) BO)
o m i i i iiiooi 101 ra c tie en CD
•H £ O « C T3 • 5 I~l
8 C-H-H3CO .O \
CD Ml1 4-> J3 CD rH 4-> >. bfl
s: o in o> eDeg4->.flo)OtoiH CDE
OO • • .C E 1-1 -H CD -H &.
«* III IOO III III 4->-H i* CD CO 4J 4-> eg • eg o
4J rHrH-Heg3M.Cin
CQ 4-JCJCOCDJHlHhOTJlO
CD rH 0) co raorH&4Jfirara->,(D
EH O CM <O (O ra 0) >• T-I »H E rH eg J3
toco oil oil 111 oil a> <H ca4->o-Ho> -H t&
O <S B) M B >.-H l-i ra O HI
IH O CM <OCJ1 in^* t*- IO bOQ< 13 -H CJ CO CD t*» 4-> (1)
>CM 1 1 rH IOO IOO IOO T) 4-> TD O -H ho ra ra B CD
^ 0>iH4->a>(HOSlD-'-' iH
4-» •ttXXXBOJSd'H-HoB
eg rH tO O CM rH 00 Tj" rH lO •> O> O (- B i-l M ra 4-> JD B rH ^ eg 10
OCO^«rH»oo.>i>t»aot-l>O eg eg BO. r-iUU 4J eg
•rlrH OOrH OOO OOO O O-tH -H 4J >.O-Hie*C-)<8 MO
*. S't.sfc.ejO -000)
eg C'Q.ooB'Hia+'aa rH
« maooi>a>ocoao>> oo n -.-•iDOtiaww-tc j2 •
o (omco 01 » o o a> a> <oo a- •• -^ cgrH-ncDocD to CD no
4J OOtHOO-HrHOO IO>-H •«*!.» OXiO > >T3>> O+-'
•H 4-- eg Dl*3CD(L>egCDCDXto«i
> OCOegTJUM-H-t-iOcgt.!
•H mt- O) niu^r-li3a)CQ,4->J3ra a>
4->ooOo O fcitfl CDtiegfioS'-rH.1-.
o N • • • ta>aiC(Dca>a>ra-H4J 4->
< OlrH III rHIl III CISA4-> -HO-lCDCDXiU rHlfl 0>-H
Q4->4->XO U CD O -•
gT3ClO 4)4->OB CDV CJ4-* 3-rl
CDrH-UBCO-Hx: eg T34->
t +-> 3 ID C O cg4->/-s4-> <H OO
r-v ot,-ititibe?'^cn a
-^ <H <H <H <H 0>CD»CD<I-I30CD4->IO h O CI
10 V CD CD CD CtiWO>CJ2T3C«>.Cra <-J "1
10 rH rH (4 rH lHO>VlV.4JB»fc|1-IQ. 4-'
a e6M^3*JrHrHCDE'OO TJeil
8 "O13 "OTS "0*0 "0*0 -r-'CD4-*(fl4->Q)<^4JCDO>-M C >t Or-l
O CD © 3) CD s^ CD IB O C? -Q ^^ fl) 01 *H X C? C CO O rH i— t ^J
03 ra eg eg eg^ caeo eg eg 3-H 4->3-MegO4->eg egr-i
B B -O B B T3 SET) SET) >«-< M ArH(aeg4->X) eg CD u-ieis
<H -Hi-ICD -H -H 4) -H-HO) -Ht-ICD •-'(/)>. (H W ra -H ' Beg >H O
o o eg o o eg o o ra o o eg acD4->A B-H-Pmcg c B in !-.
CD OOS UCJ8 cjus ejcjE PcDo*H*0egS ^ S<1) Q> *^ cgO
U ra eg 1-1 eg eg -H eg ra -H eg ra -H -H ,H a; eg a> CDbDO -C cj (H rHt-<
rH II>H llrH I I rH I 1 rH (>O.OrH^C:CD.CB.Ca!4-> B 3 <tH
3 coo n a o BBO a o o -H4->-H -ri4->o-Huieg 013 T)
O O 0 O OOO O O o O O O (-, T) M ra ra U ? O O -(DO
W S5S5< USSC-a: S5S5< S5,Z!< OO) E4->4->4->3io 4-> eg o H
JSTJ'H C 0> I/I "O +-> CD rH MT-( C'r4
rHCMCO rHCMCO rHCNCO rHCMCO rH.(00> M CO 4-> 13 0 T3 0) B -H O> rH-H
13 CD 4->CDCJCD3J3OtiIOIOCXa>cgCD
CDCD 4-> CD I/)BClOlOCA'H4->B3 O r-H^tnUI
4J-O eg +J Ctteg-OTJO ifliotHiS ts
W >. rH eei MrH 3CD3rHT3(fleg-r44-' B (OO <UE«
CD J3 >> rH T) O.>H J3rHcgO)cgCDJ3B 3 eg-H n
-O O >H -H 4-> IH CD 10
egeg < CDrn'cM coJ-JlflOOr-i
CJB rH S ,_(gv_.--' w u eg B B <»•<
•HO O 3 rH rH4-> cgrHeg'H
B+J B -H >» <eg CQtuJSOT-t-1
CDO CD tj js x-xCD «-N'-^4-'x^t']
J3 IH J2 O 4J ra I-i £ O U TD :l)
oo o. w w --4J ^.v_e^4J
64
image:
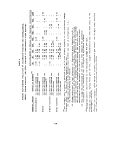 Packed Column - Procedures
Packed-bed reactor studies were carried out with two
types of equipment. The first system was a single-
walled plexiglass unit warmed by heating tape, while
a later system employed a larger, jacketed reactor
which was warmed by water circulated from a constant-
temperature bath.
The initial design shown in Figure 30 consisted of a
packed column of 3-liter void capacity. Two units
of this type were seeded, with 300 ml of screened,
primary digested sludge (7.7 percent total solids)
from a domestic sewage treatment plant and operated
on a synthetic volatile-acid feed (Feed A, Table 13)
with a detention time of 1.5 days at 35°C temperature.
After startup (approximately two months) the reactors
were converted to a degradable, mixed organic feed
(Feed B, Table 13). Feed B was used in most of the
studies with packed-bed reactors as either the initial
feed or as a supplementary food supply even though
later Warburg inhibition-tests show methyl isobutyl
ketone to be inhibitory to non-acclimated sludge.
This component may have been responsible for the
seemingly excessive 3-month time interval required
to achieve high reactor performance (90-95 percent
COD reduction).
Operational data taken during packed-bed studies
consisted of the following:
1. Chemical oxygen demand or total carbon
on samples of unit feed and effluent.
These samples were filtered through
0.45u membrane-filter paper and refrigerated
until analyzed.
2. Daily gas production monitored by in-line
gas meters and frequent mass spectro-
graphic analyses.
3. An occasional gas chromatographic comparison
made on the unit feed and effluent samples.
4. Reactor environmental parameters of pH,
volatile acids, and alkalinity.
65
image:
Packed Column - Procedures
Packed-bed reactor studies were carried out with two
types of equipment. The first system was a single-
walled plexiglass unit warmed by heating tape, while
a later system employed a larger, jacketed reactor
which was warmed by water circulated from a constant-
temperature bath.
The initial design shown in Figure 30 consisted of a
packed column of 3-liter void capacity. Two units
of this type were seeded, with 300 ml of screened,
primary digested sludge (7.7 percent total solids)
from a domestic sewage treatment plant and operated
on a synthetic volatile-acid feed (Feed A, Table 13)
with a detention time of 1.5 days at 35°C temperature.
After startup (approximately two months) the reactors
were converted to a degradable, mixed organic feed
(Feed B, Table 13). Feed B was used in most of the
studies with packed-bed reactors as either the initial
feed or as a supplementary food supply even though
later Warburg inhibition-tests show methyl isobutyl
ketone to be inhibitory to non-acclimated sludge.
This component may have been responsible for the
seemingly excessive 3-month time interval required
to achieve high reactor performance (90-95 percent
COD reduction).
Operational data taken during packed-bed studies
consisted of the following:
1. Chemical oxygen demand or total carbon
on samples of unit feed and effluent.
These samples were filtered through
0.45u membrane-filter paper and refrigerated
until analyzed.
2. Daily gas production monitored by in-line
gas meters and frequent mass spectro-
graphic analyses.
3. An occasional gas chromatographic comparison
made on the unit feed and effluent samples.
4. Reactor environmental parameters of pH,
volatile acids, and alkalinity.
65
image:
 FIGURE 30
PACKED-BED ANAEROBIC REACTOR
Thermometer
Plexiglass
•— Dispersion
4" O.D.
Plexiglass
Tube with
1/2" Berl
Saddles
Feed
Stainless Steel Screen
66
image:
FIGURE 30
PACKED-BED ANAEROBIC REACTOR
Thermometer
Plexiglass
•— Dispersion
4" O.D.
Plexiglass
Tube with
1/2" Berl
Saddles
Feed
Stainless Steel Screen
66
image:
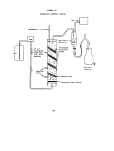 In order to evaluate the actual detention time and flow
characteristics in the packed-columns, dye tests were
performed on a heated column free of biological solids
using Rhodamine B as a tracer. The results of these
tests shown in Figure 31 indicate considerable short
circuiting with an actual effective detention time
of 12 hours rather than the theoretical 36 hours.
Visual observations during the test indicated a dye
interface moving as a slug along thermal gradients
created by the external heating tapes, which allowed
the dye to reach a higher concentration in the
effluent than in an internal sampling port.
An attempted dye study on a solids-containing packed-
bed reactor failed due to excessive absorption of the
dye. Biological solids in the unit might reduce some
of the short circuiting, but should not change the
general trend of these results. The dye studies indicate
that although short circuiting exists, the feed was
not mixed through the column but retained partial
identity as a slug, at least during the first twelve
hours of the test. Volatile acid and specific organic
profiles obtained through the column (Table 10) are
further indicators that complete mixing did not exist
in the operating columns.
To approximate more nearly a plug-flow system, a
double-walled or jacketed plexiglass reactor was
designed to eliminate the temperature gradients
observed in the single-walled reactor equipped with
heating tape. Water from a constant-temperature bath
was circulated through the jacket to maintain an
even temperature.
Studies using the anaerobic packed columns progressed
in the following fashion. During the first phase one
column was used as a control treating the degradable
Substrate B in Table 13 to achieve a performance
base while the other received this feed plus a
slowly increasing dosage of crotonaldehyde. The
objective was to compare the acclimation in an on-line,
bench-scale treatment system to that seen in the
previously cited methanogenic batch fed studies
performed in continuously-mixed digesters.
67
image:
In order to evaluate the actual detention time and flow
characteristics in the packed-columns, dye tests were
performed on a heated column free of biological solids
using Rhodamine B as a tracer. The results of these
tests shown in Figure 31 indicate considerable short
circuiting with an actual effective detention time
of 12 hours rather than the theoretical 36 hours.
Visual observations during the test indicated a dye
interface moving as a slug along thermal gradients
created by the external heating tapes, which allowed
the dye to reach a higher concentration in the
effluent than in an internal sampling port.
An attempted dye study on a solids-containing packed-
bed reactor failed due to excessive absorption of the
dye. Biological solids in the unit might reduce some
of the short circuiting, but should not change the
general trend of these results. The dye studies indicate
that although short circuiting exists, the feed was
not mixed through the column but retained partial
identity as a slug, at least during the first twelve
hours of the test. Volatile acid and specific organic
profiles obtained through the column (Table 10) are
further indicators that complete mixing did not exist
in the operating columns.
To approximate more nearly a plug-flow system, a
double-walled or jacketed plexiglass reactor was
designed to eliminate the temperature gradients
observed in the single-walled reactor equipped with
heating tape. Water from a constant-temperature bath
was circulated through the jacket to maintain an
even temperature.
Studies using the anaerobic packed columns progressed
in the following fashion. During the first phase one
column was used as a control treating the degradable
Substrate B in Table 13 to achieve a performance
base while the other received this feed plus a
slowly increasing dosage of crotonaldehyde. The
objective was to compare the acclimation in an on-line,
bench-scale treatment system to that seen in the
previously cited methanogenic batch fed studies
performed in continuously-mixed digesters.
67
image:
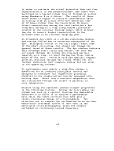 01
01 10
a eg
<o pa
o o
CL, PL,
O
z
0
O •*-!
z u
D
n
H
sifun jauanx
68
image:
01
01 10
a eg
<o pa
o o
CL, PL,
O
z
0
O •*-!
z u
D
n
H
sifun jauanx
68
image:
 TABLE 10
VOLATILE ACID AND SPECIFIC ORGANIC PROFILES
IN OPERATING PACKED COLUMNS
Feed(a)
6" from inlet
15" from inlet
(r)
Effluentv '
Methyl
Isobutyl
Ketone,
mg/1
132
19
5
nil
Crotonaldehyde,
mg/1
525
nil
nil
nil
Volatile Acids,
mg/1 as HAc
570
325
nil
nil
Feed(b)
6" from inlet
15" from inlet
Effluent
600
176
nil
nil
(a)
(b)
(c)
Unit receiving mixed degradable feed plus crotonaldehyde
Unit receiving volatile acid feed
Both columns are 30 inches total height
69
image:
TABLE 10
VOLATILE ACID AND SPECIFIC ORGANIC PROFILES
IN OPERATING PACKED COLUMNS
Feed(a)
6" from inlet
15" from inlet
(r)
Effluentv '
Methyl
Isobutyl
Ketone,
mg/1
132
19
5
nil
Crotonaldehyde,
mg/1
525
nil
nil
nil
Volatile Acids,
mg/1 as HAc
570
325
nil
nil
Feed(b)
6" from inlet
15" from inlet
Effluent
600
176
nil
nil
(a)
(b)
(c)
Unit receiving mixed degradable feed plus crotonaldehyde
Unit receiving volatile acid feed
Both columns are 30 inches total height
69
image:
 During the second study, a combination of four inhibitors
(formaldehyde, ethyl acrylate, phenol, and acrylonitrile)
was slowly introduced to a column to the point of
complete inhibition (as measured by reduction COD
removal and gas production); the effluent from this
column was fed to another column for possible further
treatment.
The final phase utilized the performance of the control
observed in the first studies as compared to the
performance in treatment of two process unit waste
streams from one of Union Carbide Corporation's
petrochemical manufacturing facilities. These wastes
were introduced over a period of time to allow
acclimation to inhibitory materials known to be
present.
Packed-Bed Results
The control unit receiving the Synthetic Feed "B"
provided a baseline removal of 90 to 98 percent of
the applied COD while operating at a temperature
of 35°C, a detention time of 1.5 days, and a
volumetric loading of 110 to 130 Ib COD/1000 ft3-day.
Gas production for this unit ranged from 1.5 to
2 liters/day.
Crotonaldehyde Unit - Performance of the packed column
receiving the synthetic plus crotonaldehyde. both
under steady operating conditions and during failure
are illustrated in Figure 32. The unit had success-
fully received up to 500 mg/1 of crotonaldehyde in
gradually increasing (over 132 days) dosage with no
adverse effects. During this time the COD reduction
was comparable to that observed in the control unit
and gas production was in excess of that in the
control, both indicating degradation of the croton-
aldehyde .
Preliminary operational problems developed on Day 140
after two days of 700 mg/1 crotonaldehyde feed. A
drop in both gas production and COD removal was noted
at this time, and subsequent chromatographic analysis
indicated considerable leakage of crotonaldehyde
in the effluent. After the influent concentration
was increased to 800 mg/1 a complete failure of the
unit was observed. The effluent pH remained within
70
image:
During the second study, a combination of four inhibitors
(formaldehyde, ethyl acrylate, phenol, and acrylonitrile)
was slowly introduced to a column to the point of
complete inhibition (as measured by reduction COD
removal and gas production); the effluent from this
column was fed to another column for possible further
treatment.
The final phase utilized the performance of the control
observed in the first studies as compared to the
performance in treatment of two process unit waste
streams from one of Union Carbide Corporation's
petrochemical manufacturing facilities. These wastes
were introduced over a period of time to allow
acclimation to inhibitory materials known to be
present.
Packed-Bed Results
The control unit receiving the Synthetic Feed "B"
provided a baseline removal of 90 to 98 percent of
the applied COD while operating at a temperature
of 35°C, a detention time of 1.5 days, and a
volumetric loading of 110 to 130 Ib COD/1000 ft3-day.
Gas production for this unit ranged from 1.5 to
2 liters/day.
Crotonaldehyde Unit - Performance of the packed column
receiving the synthetic plus crotonaldehyde. both
under steady operating conditions and during failure
are illustrated in Figure 32. The unit had success-
fully received up to 500 mg/1 of crotonaldehyde in
gradually increasing (over 132 days) dosage with no
adverse effects. During this time the COD reduction
was comparable to that observed in the control unit
and gas production was in excess of that in the
control, both indicating degradation of the croton-
aldehyde .
Preliminary operational problems developed on Day 140
after two days of 700 mg/1 crotonaldehyde feed. A
drop in both gas production and COD removal was noted
at this time, and subsequent chromatographic analysis
indicated considerable leakage of crotonaldehyde
in the effluent. After the influent concentration
was increased to 800 mg/1 a complete failure of the
unit was observed. The effluent pH remained within
70
image:
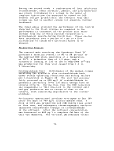 FIGURE 32
EFFECT OF CROTONALDEHTOE ON PERFORMANCE OF PACKED-BED
ANAEROBIC TREATMENT UNIT
9.0
o. 8.0
u
I 7.0
C
y-i
" 6.0
s n
"
/
/
— • — o
A,
>)_
OH«— ^
^1
eh-
(
^
^v 1
v
\/
" Addttior
added
_^-<^
Cr*~-^
^r
al buffer
j
124
132 136 1AO 144
Operating Time, days
71
148
152
image:
FIGURE 32
EFFECT OF CROTONALDEHTOE ON PERFORMANCE OF PACKED-BED
ANAEROBIC TREATMENT UNIT
9.0
o. 8.0
u
I 7.0
C
y-i
" 6.0
s n
"
/
/
— • — o
A,
>)_
OH«— ^
^1
eh-
(
^
^v 1
v
\/
" Addttior
added
_^-<^
Cr*~-^
^r
al buffer
j
124
132 136 1AO 144
Operating Time, days
71
148
152
image:
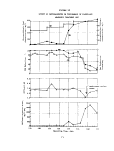 the desired range until about five days after the first
problem indication, at which time additional buffer was
required. The five-day lag indicates that the pH level
was not a contributing factor in the unit upset.
The crotonaldehyde concentrations treated in this study
are considerably greater than those at which inhibition
was noted in both the substrate limiting (200 mg/1) and
non-substrate limiting (150 to 200 mg/1) unacclimated
Warburg experiments. Although the upper limit of an
acclimated system in Warburg experiments was not
determined, the 600 mg/1 concentration which was
effectively treated was considerably greater than that
tested in the acclimated equipment and should yield
an effective upper limit for an acclimated system.
Effect of Combined Inhibitors
An examination of the effects of combined inhibitors
was made in a packed column in which four known
inhibitors (formaldehyde, ethyl acrylate, phenol and
acrylonitrile) were introduced in slowly increasing
quantities (equal concentration of each) spiked into
the degradable synthetic organic substrate. In the
latter part of the study after the column was inhibited
severely in gas production and COD removal but was
still producing volatile acids, the effluent was
treated in another column to determine the efficiency
of the packed column as a pretreatment, detoxifying
device.
Data obtained during the period of increasing concen-
tration of inhibitory materials and subsequent failure
of the column are presented in Figure 33 while data
on both the first and second of the series units are
presented in Table 11. System performance was inhibited
initially at 7.5 mg/1 dosage of each material but
subsequently recovered. Increasing the concentration
to 25 mg/1 of each material resulted in a complete
cessation of gas production and essentially no COD
removal. The acid-forming segment of the population
was still active as evidenced by the buildup in
effluent volatile-acid concentration. During the period
of time that a 25 mg/1 inhibitor concentration or
less was applied to the first of the series units,
the second unit was able to perform well on the
effluent yielding a 70 percent COD removal and above
72
image:
the desired range until about five days after the first
problem indication, at which time additional buffer was
required. The five-day lag indicates that the pH level
was not a contributing factor in the unit upset.
The crotonaldehyde concentrations treated in this study
are considerably greater than those at which inhibition
was noted in both the substrate limiting (200 mg/1) and
non-substrate limiting (150 to 200 mg/1) unacclimated
Warburg experiments. Although the upper limit of an
acclimated system in Warburg experiments was not
determined, the 600 mg/1 concentration which was
effectively treated was considerably greater than that
tested in the acclimated equipment and should yield
an effective upper limit for an acclimated system.
Effect of Combined Inhibitors
An examination of the effects of combined inhibitors
was made in a packed column in which four known
inhibitors (formaldehyde, ethyl acrylate, phenol and
acrylonitrile) were introduced in slowly increasing
quantities (equal concentration of each) spiked into
the degradable synthetic organic substrate. In the
latter part of the study after the column was inhibited
severely in gas production and COD removal but was
still producing volatile acids, the effluent was
treated in another column to determine the efficiency
of the packed column as a pretreatment, detoxifying
device.
Data obtained during the period of increasing concen-
tration of inhibitory materials and subsequent failure
of the column are presented in Figure 33 while data
on both the first and second of the series units are
presented in Table 11. System performance was inhibited
initially at 7.5 mg/1 dosage of each material but
subsequently recovered. Increasing the concentration
to 25 mg/1 of each material resulted in a complete
cessation of gas production and essentially no COD
removal. The acid-forming segment of the population
was still active as evidenced by the buildup in
effluent volatile-acid concentration. During the period
of time that a 25 mg/1 inhibitor concentration or
less was applied to the first of the series units,
the second unit was able to perform well on the
effluent yielding a 70 percent COD removal and above
72
image:
 40
30
| - 20
O tt>
u
o
.0
f4
c
10 .
100
FIGURE 33
EFFECT OF FOUR INHIBITORS ON PERFORMANCE OF
PACKED-BED ANAEROBIC TREATMENT UNIT
(ladi
_ -T^
vidual Conor
. x 4 - 160
mg/D-
25
50
75
Time, days
100
125
150
150
73
image:
40
30
| - 20
O tt>
u
o
.0
f4
c
10 .
100
FIGURE 33
EFFECT OF FOUR INHIBITORS ON PERFORMANCE OF
PACKED-BED ANAEROBIC TREATMENT UNIT
(ladi
_ -T^
vidual Conor
. x 4 - 160
mg/D-
25
50
75
Time, days
100
125
150
150
73
image:
 image:
 CO
o
03 M
pq S
FH W
rH CJ
w «
§ 8
EH M
CO PH
rH 1 rH
rH 0 K
H S 5
CQ PH Q
*33 O W
EH isr-
o cn
z s
< o
s o
0 0
PS M
W EH
0. «•
M
EH
-p
cd
P
CD
CJ
a
s
o
CH
SH
•0
C
ri
rH
cd
C
o
H
-p
cd
SH
CD
Q.
O
^-*
~ 01
0) H
G G 01
H O ri
C -H «
B -P
he o Q
S3 O
•O CJ
o ^
cs
EiSJ
rH
\
bO
S
Q
0
0
p
C
CD
3
rH CO
<H rH
'H H CO
W P T3
rH rH O
0 0 <!
-p >
o
CO
PS
Q.
rH
"\
bo
e
o"
o
13
D
o> CD
ii i— i
rH 01 rH
h -U T3\
O ri H bf
P rH 0 6
o o <
CO
«
a
Q
A
01 C
ri 0
O -H >)
P ri
rH O TJ
ri 3 'v
-P T3 rj
0 O
EH SH
O,
-
C >,
H ri
•a -a p
ri \ <H
o o
rJ 0 3
U O
-p
H a a
C rH
p
CM
-p
H
P
rH
P
H
G
P
CM
p
H
P
rH
.p
• H
C
CM
-P
H
C
rH
•H
C
CM
-P
H
C
p
p
rH
C
P
CM
-p
•H
C
p
rH
P
•rl
a
O
CM
-p
• H
P
rH
P
•H
C
P
CM
£
P
rH
p
H
P
CM
p
•H
C
p
rH
P
H
C
P
CM
p
H
C
p
rH
•P
-H
G
P
O
t3 >> 03
0 T3 >!
H 3 ri
in P Q
CD CO
P.
01
T3 rH
C! -H
ri cd
-p
>> CO
•0 Q
3
-p p
co a
ri
4H CJ
O -H
0) H
CO S
cd be
a H
ft CO
1
CO
CD
1
•*
rH
rH
1
O
1
CO
f^.
1
o
f^
CO
1
1
1
o
1
rH
f~
Ol
1
m
o
o
rH
1
O
o >,
•H rH
•P rH SH
CD ri 3
a 3 o
•P 13 <H ^^
>, SH <H CO \
01 be O rH U)
ri S
ri ri P o
C .H m
ho bo 3 S •
a a o CD CM
H -H B J3 1
P c cd o o
ri -H
CO ffl aO !>>-r>
rH P fl SH ri
-P C! -rl O
O 01 -P CO
rH CJ ri -H be
it co .a cd
T3 rl -H M
-p CD o -C o
1
o
01
1
m
o
i
Tj<
rH
1
to
t^
1
o
o
m
i
i
i
o
i
CO
CO
00
1
m
o
o
CO
o
rH
CD
bOJ=
« 0
CO id
O CD
•a
rH O
ri
U rH
S bJD
CD S
U m
>-. o -p
!H -P C
O CO
-p ~o a
•H CD O
£i 01 a
H -H £
1
rH
01
i
o
CO
Ol
CM
rH
1
to
t>.
1
o
o
^
1
1
1
o
1
CO
to
1
m
o
CM
CO
CM
1
O
CM
O
-p
in
ri
CO
ho
ri
0]
0
•a
FH
0 rH
•P \
•H be
H
1 1
in m
to CM
i i
in o
CO O
00 rH
rH Tf
1 1
t> rH
» Cl
rH
1 1
CO CM
t> to
1 1
CO O
00 i>
in m
i i
i i
i i
O rH
1 1
t> CO
Tjl rH
t 1
m o
rH CM
CM CM
O O
TJl CO
t 1
00 0
CM -*
01
rl
O
-P
•rH
X!
•H r]
J3 O
C ri
H CO
O O
CD rH
ri bo
01 S
O
-a o
rH SH
•a o
CO O -P
3 P -H
H m H
P JH
CM
Ol
in
CD
CO
X
CO
o
00
rH
CO
rH
01
00
cn
t>.
CO
^N.
o
rH
rH
rH
O
O
CM
in
CO
X
o
CO
CM
rH
CM
•>,'
O
^}*
rH
rH
m
CO
CO
CO
to
rH
CM
Ol
1
O
CO
IN
X
CO
h-
Ol
X
CM
CM
CO
T*
rH
CO
X
01
m
0
X
rH
X
O
01
m
o
m
in
X
01
1C
t
l>
,-J
rH
m
X
o
CO
^
CO
CO
CO
IN
CM
[>.
X
1
cn
o
-p
tD
ri
CO
o a
•a o
ri
SH CD
O
•H O
•a
•H rH
a be
•H S
•a o o
CO CM -P
CO -H
ri O -fl
CO -P -H
SH 43
O O
t^ t^
i> in
CM CM
in o
in o
O CN
rH rH
Ol O
CO 0
Ol rH
CO ^
CM CM
in t-
•^ IN
CM in
o ^
CO CM
rH rH
•^ CM
r> to
to m
m in
CM O
rH 0
in rH
CO ^
O O
o •*
m m
CM m
o ^p
CO CM
rH rH
1 1
t> Ol
co in
o o
t~ t>
t^ o
^ CO
rH CM
O Ol
rH O
rH 0
CO CM
rJH CO
rH rH
in co
IN CM
CM CM
O
tO CM
O rH
rH 1
1 tD
l> O
CO rH
H
be
S
o
1
o
IN !-,
0
CD -P
bo-H
ri rO
01 -H
O J3
•O G
H
H
o a
P O
•H «
a co
•H
t»
CO
CO
rH
rH
rH
O
CO
O
CO
t-
-*
CO
cn
in
o
to
o
,H
O
CO
X
m
o
CO
o
•t
m
o
to
o
rH
1
CO
to
o
CM
CM
rH
O
O
to
X
rH
m
CM
CM
X
CO
rH
1
O
CM
rH
tfH
O
rH
S*N
B
O
CO
bO rl
cd o
01 -P
O -H
T3 .<">
SH X!
O C
•P -H
•H
a a
•H O
image:
CO
o
03 M
pq S
FH W
rH CJ
w «
§ 8
EH M
CO PH
rH 1 rH
rH 0 K
H S 5
CQ PH Q
*33 O W
EH isr-
o cn
z s
< o
s o
0 0
PS M
W EH
0. «•
M
EH
-p
cd
P
CD
CJ
a
s
o
CH
SH
•0
C
ri
rH
cd
C
o
H
-p
cd
SH
CD
Q.
O
^-*
~ 01
0) H
G G 01
H O ri
C -H «
B -P
he o Q
S3 O
•O CJ
o ^
cs
EiSJ
rH
\
bO
S
Q
0
0
p
C
CD
3
rH CO
<H rH
'H H CO
W P T3
rH rH O
0 0 <!
-p >
o
CO
PS
Q.
rH
"\
bo
e
o"
o
13
D
o> CD
ii i— i
rH 01 rH
h -U T3\
O ri H bf
P rH 0 6
o o <
CO
«
a
Q
A
01 C
ri 0
O -H >)
P ri
rH O TJ
ri 3 'v
-P T3 rj
0 O
EH SH
O,
-
C >,
H ri
•a -a p
ri \ <H
o o
rJ 0 3
U O
-p
H a a
C rH
p
CM
-p
H
P
rH
P
H
G
P
CM
p
H
P
rH
.p
• H
C
CM
-P
H
C
rH
•H
C
CM
-P
H
C
p
p
rH
C
P
CM
-p
•H
C
p
rH
P
•rl
a
O
CM
-p
• H
P
rH
P
•H
C
P
CM
£
P
rH
p
H
P
CM
p
•H
C
p
rH
P
H
C
P
CM
p
H
C
p
rH
•P
-H
G
P
O
t3 >> 03
0 T3 >!
H 3 ri
in P Q
CD CO
P.
01
T3 rH
C! -H
ri cd
-p
>> CO
•0 Q
3
-p p
co a
ri
4H CJ
O -H
0) H
CO S
cd be
a H
ft CO
1
CO
CD
1
•*
rH
rH
1
O
1
CO
f^.
1
o
f^
CO
1
1
1
o
1
rH
f~
Ol
1
m
o
o
rH
1
O
o >,
•H rH
•P rH SH
CD ri 3
a 3 o
•P 13 <H ^^
>, SH <H CO \
01 be O rH U)
ri S
ri ri P o
C .H m
ho bo 3 S •
a a o CD CM
H -H B J3 1
P c cd o o
ri -H
CO ffl aO !>>-r>
rH P fl SH ri
-P C! -rl O
O 01 -P CO
rH CJ ri -H be
it co .a cd
T3 rl -H M
-p CD o -C o
1
o
01
1
m
o
i
Tj<
rH
1
to
t^
1
o
o
m
i
i
i
o
i
CO
CO
00
1
m
o
o
CO
o
rH
CD
bOJ=
« 0
CO id
O CD
•a
rH O
ri
U rH
S bJD
CD S
U m
>-. o -p
!H -P C
O CO
-p ~o a
•H CD O
£i 01 a
H -H £
1
rH
01
i
o
CO
Ol
CM
rH
1
to
t>.
1
o
o
^
1
1
1
o
1
CO
to
1
m
o
CM
CO
CM
1
O
CM
O
-p
in
ri
CO
ho
ri
0]
0
•a
FH
0 rH
•P \
•H be
H
1 1
in m
to CM
i i
in o
CO O
00 rH
rH Tf
1 1
t> rH
» Cl
rH
1 1
CO CM
t> to
1 1
CO O
00 i>
in m
i i
i i
i i
O rH
1 1
t> CO
Tjl rH
t 1
m o
rH CM
CM CM
O O
TJl CO
t 1
00 0
CM -*
01
rl
O
-P
•rH
X!
•H r]
J3 O
C ri
H CO
O O
CD rH
ri bo
01 S
O
-a o
rH SH
•a o
CO O -P
3 P -H
H m H
P JH
CM
Ol
in
CD
CO
X
CO
o
00
rH
CO
rH
01
00
cn
t>.
CO
^N.
o
rH
rH
rH
O
O
CM
in
CO
X
o
CO
CM
rH
CM
•>,'
O
^}*
rH
rH
m
CO
CO
CO
to
rH
CM
Ol
1
O
CO
IN
X
CO
h-
Ol
X
CM
CM
CO
T*
rH
CO
X
01
m
0
X
rH
X
O
01
m
o
m
in
X
01
1C
t
l>
,-J
rH
m
X
o
CO
^
CO
CO
CO
IN
CM
[>.
X
1
cn
o
-p
tD
ri
CO
o a
•a o
ri
SH CD
O
•H O
•a
•H rH
a be
•H S
•a o o
CO CM -P
CO -H
ri O -fl
CO -P -H
SH 43
O O
t^ t^
i> in
CM CM
in o
in o
O CN
rH rH
Ol O
CO 0
Ol rH
CO ^
CM CM
in t-
•^ IN
CM in
o ^
CO CM
rH rH
•^ CM
r> to
to m
m in
CM O
rH 0
in rH
CO ^
O O
o •*
m m
CM m
o ^p
CO CM
rH rH
1 1
t> Ol
co in
o o
t~ t>
t^ o
^ CO
rH CM
O Ol
rH O
rH 0
CO CM
rJH CO
rH rH
in co
IN CM
CM CM
O
tO CM
O rH
rH 1
1 tD
l> O
CO rH
H
be
S
o
1
o
IN !-,
0
CD -P
bo-H
ri rO
01 -H
O J3
•O G
H
H
o a
P O
•H «
a co
•H
t»
CO
CO
rH
rH
rH
O
CO
O
CO
t-
-*
CO
cn
in
o
to
o
,H
O
CO
X
m
o
CO
o
•t
m
o
to
o
rH
1
CO
to
o
CM
CM
rH
O
O
to
X
rH
m
CM
CM
X
CO
rH
1
O
CM
rH
tfH
O
rH
S*N
B
O
CO
bO rl
cd o
01 -P
O -H
T3 .<">
SH X!
O C
•P -H
•H
a a
•H O
image:
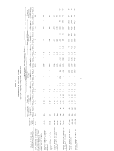 in the second reactor and an 88 percent removal in both
reactors As the concentration of each inhibitor was
raised to 40 mg/1 the second column was inhibited. The
acid-forming culture in the primary column was also
inhibited as evidenced by the decrease in effluent
volatile-acid concentration. An active volatile-acid-
forming culture would be necessary to alter the toxic
materials and prevent leakage of inhibitory materials
into the effluent.
Examination of the inhibitory concentration of each of
the four materials (Table 7 ) indicates that at the
40 mg/1 feed concentration formaldehyde was near the
inhibitory dosage while the ethyl acrylate, acrylonitrile,
and phenol was well below inhibitory levels for the
individual material. The severe nature of the
inhibition observed at this concentration indicates
that toxicity may be due to a cumulative effect of
the four materials.
Data collected from chromatographic examination of
the effluent of the two series columns on Day 125 are
presented in Table 12. During this time period the
second series column failed, The first column shows
virtually no alteration of the applied phenol or
formaldehyde, which allowed these materials to pass
through and inhibit the second unit. In summary,
the series operational system was found to be an
effective treatment scheme for the mixed inhibitors
at low concentrations, but failed with the penetration
of inhibitors at higher dosage levels. The mixed
inhibitors were indicated to act synergistically
since they were more detrimental to unit performance
as a mixture than would have been predicted based
on individual chemical inhibition tests.
In order to apply the results of this study, two actual
waste streams from one of Union Carbide's synthetic
organic chemical plants were treated in anaerobic
packed-bed reactors. These streams contained materials
which were identified as inhibitory in screening
studies or were detrimental to aerobic treatment.
The two streams used in testing were selected so
that neither associated cations nor contained
sulfates would cause toxicity problems, which might
complicate interpretation of any inhibition due to
organic constituents. In addition, wastes selected
75
image:
in the second reactor and an 88 percent removal in both
reactors As the concentration of each inhibitor was
raised to 40 mg/1 the second column was inhibited. The
acid-forming culture in the primary column was also
inhibited as evidenced by the decrease in effluent
volatile-acid concentration. An active volatile-acid-
forming culture would be necessary to alter the toxic
materials and prevent leakage of inhibitory materials
into the effluent.
Examination of the inhibitory concentration of each of
the four materials (Table 7 ) indicates that at the
40 mg/1 feed concentration formaldehyde was near the
inhibitory dosage while the ethyl acrylate, acrylonitrile,
and phenol was well below inhibitory levels for the
individual material. The severe nature of the
inhibition observed at this concentration indicates
that toxicity may be due to a cumulative effect of
the four materials.
Data collected from chromatographic examination of
the effluent of the two series columns on Day 125 are
presented in Table 12. During this time period the
second series column failed, The first column shows
virtually no alteration of the applied phenol or
formaldehyde, which allowed these materials to pass
through and inhibit the second unit. In summary,
the series operational system was found to be an
effective treatment scheme for the mixed inhibitors
at low concentrations, but failed with the penetration
of inhibitors at higher dosage levels. The mixed
inhibitors were indicated to act synergistically
since they were more detrimental to unit performance
as a mixture than would have been predicted based
on individual chemical inhibition tests.
In order to apply the results of this study, two actual
waste streams from one of Union Carbide's synthetic
organic chemical plants were treated in anaerobic
packed-bed reactors. These streams contained materials
which were identified as inhibitory in screening
studies or were detrimental to aerobic treatment.
The two streams used in testing were selected so
that neither associated cations nor contained
sulfates would cause toxicity problems, which might
complicate interpretation of any inhibition due to
organic constituents. In addition, wastes selected
75
image:
 TABLE 12
CHROMATOGRAPHIC EXAMINATION OF SERIES PACKED COLUMNS
TREATING MIXED INHIBITORS
Compound Concentration, mg/1
Feed to first
series column
First-column
effluent
Second-column
effluent
Ethyl
Formaldehyde Acrylonitrile Acrylate Phenol
40
40
40
24
17
40
12
40
37
12
Gas chromatographic analysis employed the following conditions:
Column 6' x 1/8" Porapak P
Column temp.: 80°C for 2.5 min., then programmed at
5°/min to 150°C and 10°/min to 225°C.
Carrier flow: 50 cc/min
Injection port
temp.: 250°C
Detector: Flame ionization
Detector temp: 250°C
76
image:
TABLE 12
CHROMATOGRAPHIC EXAMINATION OF SERIES PACKED COLUMNS
TREATING MIXED INHIBITORS
Compound Concentration, mg/1
Feed to first
series column
First-column
effluent
Second-column
effluent
Ethyl
Formaldehyde Acrylonitrile Acrylate Phenol
40
40
40
24
17
40
12
40
37
12
Gas chromatographic analysis employed the following conditions:
Column 6' x 1/8" Porapak P
Column temp.: 80°C for 2.5 min., then programmed at
5°/min to 150°C and 10°/min to 225°C.
Carrier flow: 50 cc/min
Injection port
temp.: 250°C
Detector: Flame ionization
Detector temp: 250°C
76
image:
 were of reasonably low flow and high carbon concentra-
tion which would make separate anaerobic treatment a more
practical consideration.
The actual waste streams selected for study are described
in Table 13. The streams were modified as described below
prior to feeding to the packed-bed reactors. Waste C
was diluted with eight volumes of tap water to 1) provide
an equivalent COD loading to previous studies, 2) to
dilute known or suspected inhibitors (crotonaldehyde
and acetaldehyde in particular), and 3) to yield a
reasonable volatile acid level in the feed. Unit D
waste was increased in strength by adding 50 percent
by volume of the following mixture:
Acrylic acid - 270 mg/1
Acetic acid - 2430
Acetone - 405
Acetaldehyde - 135
Isobutanol - 270
Isopropanol - 270
TERGITOL Surfactant NPX - dosage increased
during course of experiment
The additives were used to compensate for dilute waste
content in samples collected from the operating unit
during the studies and to provide a reasonable COD
loading.
Experiments treating actual waste streams were conducted
in a manner similar to those with crotonaldehyde as
previously cited. The reactor was first seeded with
domestic anaerobic sludge and the degradable supplemental
feed used to achieve a suitable culture capable of
90 to 98 percent COD reduction. The waste in question
was then introduced slowly until it reached 100 percent
of the reactor feed.
Unit C - Data obtained while treating the inhibitory
waste are summarized in Figure 34 and Table 14.
Introduction of the wastewater resulted in a reduction
of performance from the 90 to 98 percent obtained
with degradable Waste B to an equilibrium level of
68 percent when treating 100 percent of the diluted
unit feed. A period of inhibition was initially
noted at 60 percent feed strength, but continued
feeding at this level resulted in a resumption of
satisfactory performance, Chromatographic examina-
77
image:
were of reasonably low flow and high carbon concentra-
tion which would make separate anaerobic treatment a more
practical consideration.
The actual waste streams selected for study are described
in Table 13. The streams were modified as described below
prior to feeding to the packed-bed reactors. Waste C
was diluted with eight volumes of tap water to 1) provide
an equivalent COD loading to previous studies, 2) to
dilute known or suspected inhibitors (crotonaldehyde
and acetaldehyde in particular), and 3) to yield a
reasonable volatile acid level in the feed. Unit D
waste was increased in strength by adding 50 percent
by volume of the following mixture:
Acrylic acid - 270 mg/1
Acetic acid - 2430
Acetone - 405
Acetaldehyde - 135
Isobutanol - 270
Isopropanol - 270
TERGITOL Surfactant NPX - dosage increased
during course of experiment
The additives were used to compensate for dilute waste
content in samples collected from the operating unit
during the studies and to provide a reasonable COD
loading.
Experiments treating actual waste streams were conducted
in a manner similar to those with crotonaldehyde as
previously cited. The reactor was first seeded with
domestic anaerobic sludge and the degradable supplemental
feed used to achieve a suitable culture capable of
90 to 98 percent COD reduction. The waste in question
was then introduced slowly until it reached 100 percent
of the reactor feed.
Unit C - Data obtained while treating the inhibitory
waste are summarized in Figure 34 and Table 14.
Introduction of the wastewater resulted in a reduction
of performance from the 90 to 98 percent obtained
with degradable Waste B to an equilibrium level of
68 percent when treating 100 percent of the diluted
unit feed. A period of inhibition was initially
noted at 60 percent feed strength, but continued
feeding at this level resulted in a resumption of
satisfactory performance, Chromatographic examina-
77
image:
 TABLE 13
WASTE STREAMS STUDIED IN ANAEROBIC PACKED COLUMNS
Waste A - Synthetic Volatile Acid Feed Used for Startup
COD - 3000 mg/1
990 mg/1 propionic acid (1500 mg/1 as COD)
1400 mg/1 acetic acid (1500 mg/1 as COD)
pH - 6.2 with sodium hydroxide
Tap water
COD/N/P ratio 100/1/0.2
Waste B - Degradable Mixed Organic Feed
COD - 2800 mg/1
Components
Acetic acid, ethylene glycol, ethanol,
methyl isobutyl ketone, sodium benzoate.
Added on equal COD contribution/compound
pH - 7,0 with sodium hydroxide
Tap water
COD/N/P ratio 100/1/0.2
78
image:
TABLE 13
WASTE STREAMS STUDIED IN ANAEROBIC PACKED COLUMNS
Waste A - Synthetic Volatile Acid Feed Used for Startup
COD - 3000 mg/1
990 mg/1 propionic acid (1500 mg/1 as COD)
1400 mg/1 acetic acid (1500 mg/1 as COD)
pH - 6.2 with sodium hydroxide
Tap water
COD/N/P ratio 100/1/0.2
Waste B - Degradable Mixed Organic Feed
COD - 2800 mg/1
Components
Acetic acid, ethylene glycol, ethanol,
methyl isobutyl ketone, sodium benzoate.
Added on equal COD contribution/compound
pH - 7,0 with sodium hydroxide
Tap water
COD/N/P ratio 100/1/0.2
78
image:
 TABLE 13 (CONTINUED)
Waste C - Inhibitory Waste
Total Carbon - 10,000 rag/1
COD - 25,000 rag/1
Na and Ca content - 400-800 mg/1
Sulfate - 20 rag/1
Identified major constituents and order-of-magnitude con-
centrations, rag/1
Butanol 200 mg/1
Ethanol 200
Acetic Acid 2500
Butyric acid 300
Acetaldehyde 700
Crotonaldehyde 1500
Waste D - Surfactant-Containing Waste
Total Carbon - 800-1500 mg/1
Na and Ca content - 1000-2000 mg/1
Sulfate - 55 mg/1
Identified major constituents and order-of-magnitude con-
centrations
Isobutanol - 60 mg/1 Crotonaldehyde- 10
Ethanol - 5 Acetone - 5
Acetic acid - 10 mg/1 Benzene - 50
Acrylic acid - 10 mg/1 Methyl ethyl pyridine - 10
Acetaldehyde - 10 Isobutyl acrylate - 20
Surfactant concentration -
10-15 mg/1
79
image:
TABLE 13 (CONTINUED)
Waste C - Inhibitory Waste
Total Carbon - 10,000 rag/1
COD - 25,000 rag/1
Na and Ca content - 400-800 mg/1
Sulfate - 20 rag/1
Identified major constituents and order-of-magnitude con-
centrations, rag/1
Butanol 200 mg/1
Ethanol 200
Acetic Acid 2500
Butyric acid 300
Acetaldehyde 700
Crotonaldehyde 1500
Waste D - Surfactant-Containing Waste
Total Carbon - 800-1500 mg/1
Na and Ca content - 1000-2000 mg/1
Sulfate - 55 mg/1
Identified major constituents and order-of-magnitude con-
centrations
Isobutanol - 60 mg/1 Crotonaldehyde- 10
Ethanol - 5 Acetone - 5
Acetic acid - 10 mg/1 Benzene - 50
Acrylic acid - 10 mg/1 Methyl ethyl pyridine - 10
Acetaldehyde - 10 Isobutyl acrylate - 20
Surfactant concentration -
10-15 mg/1
79
image:
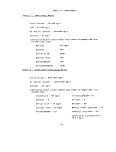 FIGURE 34
PERFOFMANCE OF ANAEROBIC PACKED COLUMN
TREATING INHIBITORY WASTEWATER
UNIT C
1UU
H
*
•o
5! 75
[*
a
2 »
to
3
25
0
0
-
-
r^
J
60 120 180 240 30
Period of Teat, days
300
TZD ISO
Period of Test, days
2.5
120 180
Period of Test, days
240
300
80
image:
FIGURE 34
PERFOFMANCE OF ANAEROBIC PACKED COLUMN
TREATING INHIBITORY WASTEWATER
UNIT C
1UU
H
*
•o
5! 75
[*
a
2 »
to
3
25
0
0
-
-
r^
J
60 120 180 240 30
Period of Teat, days
300
TZD ISO
Period of Test, days
2.5
120 180
Period of Test, days
240
300
80
image:
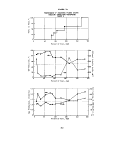 I
S5
M
O
M
EH
S
o w
E- H
o co
ffl
o
OJ
w
CJ
g
§
01
C 01
cj o d
ri H CQ
a 4J
cct o Q
ho 3 O
h 13 CJ
o <»•--
-rH
O BO
CJ E
01 U
•a H
•H 4-1
O 0
4J <
C CB
01 rH 01
3 H d
rH 4-1
<H d rH
HH rH \
W 0 ho
> e
i*
o
o -
cd >, CO
0 4-1 O
PS -H CJ
a d
H CJ
rH
d rH
rH Ml
< e
«
Q
a"
o
CJ
4-1 rH
C \
0 M
3 S
<H
1 — 1
01 C
cd 0
O H >,
4J d
rH O Q
d 3 \
4-> T3 i-5
0 0
EH Sn
ft
4-1
<H
- 3
ho CJ
C
•H S
T3 \
d >*
0 d
iJ T3
4-> n
H O
a o
£1
in
00
10
0
CO
in
CO
CO
o
CO
in
".
t>
0
iC
to
CN
CO
r— I
00
o
1— (
00 r- iO iO tO
oo oo a> 01 is
o o o m o
O (30 CO CN O
CO CN r-H rH tO
00 M O O CD
l> CO CO -<t CM
o -^ co o oo
(O <£ r-H ffi CO
iO ifM iO i/3 to
00 ^ CM .-0 »
o o o o o
O T)< iO to CO
<C CM C7) tfl lO
CM CM CN CN CM
o <o en i-t o
CN H rH CN CN
CN O t> CM i-i
H ai r-H o o
r-l ,—) ,H rH
00
to
00
to
O
o
o
CT>
CO
CM
CM
to
o>
o
o
•t
01
o
00
to
o
CM
CO
CO
O O
co m
to o
CO •*
o
CM
O 3 01
•H 4J >i
h CO d
cu D
ft 'i i
O
^
d
O
H
<H a
H O
C -H
hJD-P
H d
QJ
•a ft
c O
d
>, 0
•o
3 0)
4-1 rH
CO -H
d
O O
Q
0
d
ft
c-
r-H
1
rH
01
«
Q)
4-1
•H
H
CO
^
4-)
•H
•a
en
CM
i
00
rH
CB
ho O
•a -H
3 01
rH d
01 £1
•O 0
0 a
4-> H
01
0
ho •
0) H ^
hfiTS 01
^
d
i!
O
01
d
4J
H
C
P
•a
O -H
•H rH
4-1 O
01 01
0 0
T3 rH
O ^
O
UO
1
O
CO
•a
0
0
rH
ft
E
0
0)
d
S
•a
0
0
u
•H
4J
0
C!
01
O rH
CO O rH
C~ rH 1
1 1 rH
rH Ol O
UO t- rH
Q
O
•H 1
4-> 0
0 4->
3 01 T3
T3 rf 0
O £ 0
^4 'H
4J 01
C 0) 0
H 0 .a
U 4-1
rH O
Ed >t "H
3 ft 0
•a
d T3 b^
^ 0 O
BO-P 0)
rj , ^
T3 rH
0 -H ^
4J -a 0
SH 4-i
d =f-l d
4J O S
CO
,—y
T3
O
•H
^,
ft
01
X!
4-1
ho
fi
•H
ri
3
CM
rH
1
rH
i-H
0
d C
? -H
4-1 3
01 T3
d
9 •O
cu
01 CD
01 <H
0
0 4J
O -H
ri EH
ft 3
0 O
3 B«
rH 0
•H CO
Q
T3
O
H
ri
0
ft
01
-H
4-1
CO
rH
1
00
CN
rH
0
d
CB
01
d •
9 -a
0
01 0
0
O 4-1
O -H
ft 3
•a <H
0 O
3 6*
rH O
0
rH
cq
1
00
rH
0
cd
s
0
4-1
01
E5 13
0
01 0
0) 'H
0
O 4J
O -H
in C
ft 3
•O <H
0 O
-u
3 cs*
rH O
•H CO
Q
CO
CM
1
CO
rH
CM
h
0
d
0
01
d •
s -o
0
01 0
» <H
0
O V
O -H
ri d
ft 3
•a <H
0 O
4-)
3 B^
rH O
•H CO
Q
CM
1
CO
CD
CM
0
+J
d
f
0
4J
0) •
cd ^a
S 0
0
01 <H
to
0 4->
O -rH
0 C
ri 3
ft
"H
•a o
0
4J B^
3 O
rH O
•H rH
P
image:
I
S5
M
O
M
EH
S
o w
E- H
o co
ffl
o
OJ
w
CJ
g
§
01
C 01
cj o d
ri H CQ
a 4J
cct o Q
ho 3 O
h 13 CJ
o <»•--
-rH
O BO
CJ E
01 U
•a H
•H 4-1
O 0
4J <
C CB
01 rH 01
3 H d
rH 4-1
<H d rH
HH rH \
W 0 ho
> e
i*
o
o -
cd >, CO
0 4-1 O
PS -H CJ
a d
H CJ
rH
d rH
rH Ml
< e
«
Q
a"
o
CJ
4-1 rH
C \
0 M
3 S
<H
1 — 1
01 C
cd 0
O H >,
4J d
rH O Q
d 3 \
4-> T3 i-5
0 0
EH Sn
ft
4-1
<H
- 3
ho CJ
C
•H S
T3 \
d >*
0 d
iJ T3
4-> n
H O
a o
£1
in
00
10
0
CO
in
CO
CO
o
CO
in
".
t>
0
iC
to
CN
CO
r— I
00
o
1— (
00 r- iO iO tO
oo oo a> 01 is
o o o m o
O (30 CO CN O
CO CN r-H rH tO
00 M O O CD
l> CO CO -<t CM
o -^ co o oo
(O <£ r-H ffi CO
iO ifM iO i/3 to
00 ^ CM .-0 »
o o o o o
O T)< iO to CO
<C CM C7) tfl lO
CM CM CN CN CM
o <o en i-t o
CN H rH CN CN
CN O t> CM i-i
H ai r-H o o
r-l ,—) ,H rH
00
to
00
to
O
o
o
CT>
CO
CM
CM
to
o>
o
o
•t
01
o
00
to
o
CM
CO
CO
O O
co m
to o
CO •*
o
CM
O 3 01
•H 4J >i
h CO d
cu D
ft 'i i
O
^
d
O
H
<H a
H O
C -H
hJD-P
H d
QJ
•a ft
c O
d
>, 0
•o
3 0)
4-1 rH
CO -H
d
O O
Q
0
d
ft
c-
r-H
1
rH
01
«
Q)
4-1
•H
H
CO
^
4-)
•H
•a
en
CM
i
00
rH
CB
ho O
•a -H
3 01
rH d
01 £1
•O 0
0 a
4-> H
01
0
ho •
0) H ^
hfiTS 01
^
d
i!
O
01
d
4J
H
C
P
•a
O -H
•H rH
4-1 O
01 01
0 0
T3 rH
O ^
O
UO
1
O
CO
•a
0
0
rH
ft
E
0
0)
d
S
•a
0
0
u
•H
4J
0
C!
01
O rH
CO O rH
C~ rH 1
1 1 rH
rH Ol O
UO t- rH
Q
O
•H 1
4-> 0
0 4->
3 01 T3
T3 rf 0
O £ 0
^4 'H
4J 01
C 0) 0
H 0 .a
U 4-1
rH O
Ed >t "H
3 ft 0
•a
d T3 b^
^ 0 O
BO-P 0)
rj , ^
T3 rH
0 -H ^
4J -a 0
SH 4-i
d =f-l d
4J O S
CO
,—y
T3
O
•H
^,
ft
01
X!
4-1
ho
fi
•H
ri
3
CM
rH
1
rH
i-H
0
d C
? -H
4-1 3
01 T3
d
9 •O
cu
01 CD
01 <H
0
0 4J
O -H
ri EH
ft 3
0 O
3 B«
rH 0
•H CO
Q
T3
O
H
ri
0
ft
01
-H
4-1
CO
rH
1
00
CN
rH
0
d
CB
01
d •
9 -a
0
01 0
0
O 4-1
O -H
ft 3
•a <H
0 O
3 6*
rH O
0
rH
cq
1
00
rH
0
cd
s
0
4-1
01
E5 13
0
01 0
0) 'H
0
O 4J
O -H
in C
ft 3
•O <H
0 O
-u
3 cs*
rH O
•H CO
Q
CO
CM
1
CO
rH
CM
h
0
d
0
01
d •
s -o
0
01 0
» <H
0
O V
O -H
ri d
ft 3
•a <H
0 O
4-)
3 B^
rH O
•H CO
Q
CM
1
CO
CD
CM
0
+J
d
f
0
4J
0) •
cd ^a
S 0
0
01 <H
to
0 4->
O -rH
0 C
ri 3
ft
"H
•a o
0
4J B^
3 O
rH O
•H rH
P
image:
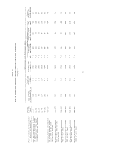 tion of the column effluent on Day 227 when the reactor
was receiving 60 percent inhibitory feed indicated that
the reduction in COD efficiency was caused by leakage
of acetaldehyde contained in the waste and methyl
isobutyl ketone contained in the supplemental feed.
Unit D - Data obtained while treating the surfactant-
containing waste are presented in Table 15 and Figure 35,
The waste was treated fairly well in terms of COD
removal at 100 percent of the feed, although a decrease
in COD removal from greater than 90 percent to
65 percent was noted above 80 percent (by volume) actual
wastewater in the feed. Treatment of this unit waste
was of particular interest due to contained "hard"
surfactants which caused foaming problems and are
not degraded in aerobic systems. If not degraded, these
surfactants could be expected to cause similar
problems in mixed anaerobic systems, particularly in a
system employing organism separation and recycle.
Surfactant measurements (cobalt-thiocyanate-active-
surfactant measurements, Appendix I) indicated that
the "hard" surfactants were not detected in the
effluent from the anaerobic reactor at waste concen-
trations of 45 mg/1 and below. The analysis is a
measurement of surfactant remaining in its original
form, since a color complex is formed with oxide chains
of six or more units. Supplementary foaming experiments
(Appendix I) indicated that the removal of greater
than 90 percent surfactant level was accompanied by a
decrease in foamabillty of at least 50 percent.
Foamability data would be conservative since many
biological systems have a tendency to produce foam.
Supplemental surfactant added to the unit waste up
to a concentration of 160 mg/1 resulted in a break-
through of material measurable by the cobalt-
thiocyanate method as indicated in Figure 35.
Once the surfactant began to appear in the
effluent there was essentially no decrease in
foamability.
Discussion of Acclimation Achieved
The conservative nature of the estimates of inhibitory
concentrations defined during initial Warburg studies
with unacclimated biomass was emphasized by the results
of anaerobic bacterial acclimation studies. In many
82
image:
tion of the column effluent on Day 227 when the reactor
was receiving 60 percent inhibitory feed indicated that
the reduction in COD efficiency was caused by leakage
of acetaldehyde contained in the waste and methyl
isobutyl ketone contained in the supplemental feed.
Unit D - Data obtained while treating the surfactant-
containing waste are presented in Table 15 and Figure 35,
The waste was treated fairly well in terms of COD
removal at 100 percent of the feed, although a decrease
in COD removal from greater than 90 percent to
65 percent was noted above 80 percent (by volume) actual
wastewater in the feed. Treatment of this unit waste
was of particular interest due to contained "hard"
surfactants which caused foaming problems and are
not degraded in aerobic systems. If not degraded, these
surfactants could be expected to cause similar
problems in mixed anaerobic systems, particularly in a
system employing organism separation and recycle.
Surfactant measurements (cobalt-thiocyanate-active-
surfactant measurements, Appendix I) indicated that
the "hard" surfactants were not detected in the
effluent from the anaerobic reactor at waste concen-
trations of 45 mg/1 and below. The analysis is a
measurement of surfactant remaining in its original
form, since a color complex is formed with oxide chains
of six or more units. Supplementary foaming experiments
(Appendix I) indicated that the removal of greater
than 90 percent surfactant level was accompanied by a
decrease in foamabillty of at least 50 percent.
Foamability data would be conservative since many
biological systems have a tendency to produce foam.
Supplemental surfactant added to the unit waste up
to a concentration of 160 mg/1 resulted in a break-
through of material measurable by the cobalt-
thiocyanate method as indicated in Figure 35.
Once the surfactant began to appear in the
effluent there was essentially no decrease in
foamability.
Discussion of Acclimation Achieved
The conservative nature of the estimates of inhibitory
concentrations defined during initial Warburg studies
with unacclimated biomass was emphasized by the results
of anaerobic bacterial acclimation studies. In many
82
image:
 image:
 in
rH
W
P5
H
os
w
EH
•^
H d
SH -P
w d
< P
01
0 0
X C
,z; g
< 0
EH IH
55 SH
0 0
u a
1
H -0
Z; c
IS a
O i — l
«D d
rH C!
PS O
£3 H
I/I 4->
d
O co
n
O X-N O
2; P
hH
H M
g |
N_ f
PS
8
o
<s
w
PJ
as
w
Q
w
M
p
W
U
a
0
g
Q
M
o a 10
•H 0 d
a H to
d -P
MOP
in 3 O
o -a o
CO -^
PS
-rH
O M
0 E
4-1
C -
d «
-P C rH
O CO \
d -P he
•H a g
.H 0
3 O
-P CO
a
0>
3 o
rH ID rH
<H r-H -P
4H H 0] rH QJ
W P TJ \ 0
d rH tU3 <£
SH r-H O S
O O < 01
-P > d
o
d
CO
OS SX CO
4J O
•H U
Q d
H O
i-H
d I-H
i — i En
< a
a
a
c -
d -P
•a -P a I-H
01 o CO \
(D d -P M
Ifc *H C B
h 0
3 CJ
in
TJ -rH
co 0 \
CO O M
rH 0 8
M C
d O
O -H >>
•w d
r-H O TJ
d 3 \
•P T3 J
0 O
H !H
H >,
•a a
O^IH
*3 g
-p o o
•H
c .a
r^ rH
.
f>J
T3 T3
O 3 U]
•H -*J p*i
SH t/3 nJ
(D P
O
T3
-P (U CD
C Ml fti
J^> «
.== C
b^ -H
=H
0
TJ
Jw W
cd I-H
•H
>> 03
T3 4J C
3 0) O
-P Q H
W -P
-M cU
SH C m
O c3 (U
o a
0) -H O
U) 4-4
0] H
J3 G
£X faJD
H
K!
CD
O
m
00
i— t
i
i
1
in
to
i
10
0
01
N
i— (
•tf
0
[>
rH
CO
.—(
1
^
h <H
O 0
+J
U rH
rf S
OJ
.M O
O
T3 CD
0)
IH 4-
03 "r-
0
rH
X
O
i-H
lO
1
Tp
^]
rH
I
rH
[^
t
O
o
f-
CN
^
rH
T^
rH
, — |
^
1
CO
T3
CO
•P
10
0
bJD
•H
O
H
-P
CO
S
O
T3
rH
(J»
o
m
(N
1
l>
^
O
i-H
to
CM
t^
1
s
(O
Ol
^
QQ
0
01
1
CO
•a
• o
x^ CO
0] <H
TJ
•H O
rH -H
O -P
Id CO
05 a
•^ >,
CO
bfi o
•0 -rl
3 01
rH d
01 CQ
r-
o
01
i
to
f^
o
to
in
CO
f.
i
o
to
CM
rH
CM
CO
r-H
i-H
r-H
1
rH
0) 0)
N O
•H C
S d
•H S
•P rl
n o
O fH
tn
O 01
-p a
TJ -P
0) H
01 a
a 3
^
en
to
m
i-H
1
rH
I-H
in
to
t~
l~
in
o
CO
to
01
to
CO
1
rH
CM
'
a
o
•H
-P
u
5
O
!H
•P
G
•H
r-H
ClJ
3
T3
cd
o
(N O
co a>
CO rH
CD rH
^ CO
1 1
to o
CO CO
en to
O (D
CO iO
0 C-
l> l>
10 O
rH
0 0
CO ^
tO CM
CN CO
00 ^
m <N
rH (N
m co
CO (0
i i
CO tD
W CO
o o
CN CO
(fl
w
Q)
U
O h
0,-P
cu ?
JH O
•p -p
CO
'H cl
O ~£
I-HOOO mcocNCOoci
CTlG)OOQOI>'C.7)I^*tD CO
r-^coco^cnr-rHN
iOcOCOO^^J1COI> CO
CNCMCOCOXlMI>rHOO
i— 1
1 1 1 1 O O H CM CM
rH CM
COt^-r-HOCOOCMCOt>
rocM-^fcoto inaio
rH -^ Tp CM
CJ1O toiOOCM^fT)lO
t^-CTlOOO^CMC.yiOrQtO
iOt>OOOOOOlOl-H'!^1
rH rH rH rH
COCOCNmt-CO-O^!-
i>i>oot>c^[>r*i>t^
o
CM
1
oioinioioo^o o
rHCMCMCMCMCO^CO1^
rH CM
ooooooooo
COOOOOOO^rH^CTl
CMCMCNCMCOCMCMCMOJ
c^a^otocococococi
CM^cv1lOoOC>ll>COCO
OOrHrHCMCMrHlMrH
rH^OCOO^COCOC^-d
oocnOr-itot-rHinco
I 1 1 1 1 1 1 1 1
toooaiOrHcor-Hin
ooooooo ^
rH
<H "O
o cu
Ift rQ
CU ri JH CD tfl -P -H
J3 & CD> -Pj^fl^
+j^j -PCD flCDcSO
-P-S 3j3 -.HOGriOCD
•H[fl0 0)OQri O^rt-O
rdbot/ia^cn OCCD£+J^!>>
CcadridO o-POcn^rH
rty^+JC3O'O.MrHtf}^ b-CO
rH rH^CD'HCDH&iflO-PG'H
tflri-'HCDCDT3Q>r3OrtEHrO CD
-POH a-p TJ i-na
CD!H >rt 2!>1riJ3,c3CD.C.rJ. C W
gaaS;i[ncn:S-P =H4J-P-Hrf
00
CO
o
f*«
"^
rH
CO
CO
t>
E>
^
r-H
rH
CO
rH
t>
^.
0
CO
rH
O
CO
00
CO
10
i-H
H
CO
O
a>
i
CTi
CD
S
rH
image:
in
rH
W
P5
H
os
w
EH
•^
H d
SH -P
w d
< P
01
0 0
X C
,z; g
< 0
EH IH
55 SH
0 0
u a
1
H -0
Z; c
IS a
O i — l
«D d
rH C!
PS O
£3 H
I/I 4->
d
O co
n
O X-N O
2; P
hH
H M
g |
N_ f
PS
8
o
<s
w
PJ
as
w
Q
w
M
p
W
U
a
0
g
Q
M
o a 10
•H 0 d
a H to
d -P
MOP
in 3 O
o -a o
CO -^
PS
-rH
O M
0 E
4-1
C -
d «
-P C rH
O CO \
d -P he
•H a g
.H 0
3 O
-P CO
a
0>
3 o
rH ID rH
<H r-H -P
4H H 0] rH QJ
W P TJ \ 0
d rH tU3 <£
SH r-H O S
O O < 01
-P > d
o
d
CO
OS SX CO
4J O
•H U
Q d
H O
i-H
d I-H
i — i En
< a
a
a
c -
d -P
•a -P a I-H
01 o CO \
(D d -P M
Ifc *H C B
h 0
3 CJ
in
TJ -rH
co 0 \
CO O M
rH 0 8
M C
d O
O -H >>
•w d
r-H O TJ
d 3 \
•P T3 J
0 O
H !H
H >,
•a a
O^IH
*3 g
-p o o
•H
c .a
r^ rH
.
f>J
T3 T3
O 3 U]
•H -*J p*i
SH t/3 nJ
(D P
O
T3
-P (U CD
C Ml fti
J^> «
.== C
b^ -H
=H
0
TJ
Jw W
cd I-H
•H
>> 03
T3 4J C
3 0) O
-P Q H
W -P
-M cU
SH C m
O c3 (U
o a
0) -H O
U) 4-4
0] H
J3 G
£X faJD
H
K!
CD
O
m
00
i— t
i
i
1
in
to
i
10
0
01
N
i— (
•tf
0
[>
rH
CO
.—(
1
^
h <H
O 0
+J
U rH
rf S
OJ
.M O
O
T3 CD
0)
IH 4-
03 "r-
0
rH
X
O
i-H
lO
1
Tp
^]
rH
I
rH
[^
t
O
o
f-
CN
^
rH
T^
rH
, — |
^
1
CO
T3
CO
•P
10
0
bJD
•H
O
H
-P
CO
S
O
T3
rH
(J»
o
m
(N
1
l>
^
O
i-H
to
CM
t^
1
s
(O
Ol
^
QQ
0
01
1
CO
•a
• o
x^ CO
0] <H
TJ
•H O
rH -H
O -P
Id CO
05 a
•^ >,
CO
bfi o
•0 -rl
3 01
rH d
01 CQ
r-
o
01
i
to
f^
o
to
in
CO
f.
i
o
to
CM
rH
CM
CO
r-H
i-H
r-H
1
rH
0) 0)
N O
•H C
S d
•H S
•P rl
n o
O fH
tn
O 01
-p a
TJ -P
0) H
01 a
a 3
^
en
to
m
i-H
1
rH
I-H
in
to
t~
l~
in
o
CO
to
01
to
CO
1
rH
CM
'
a
o
•H
-P
u
5
O
!H
•P
G
•H
r-H
ClJ
3
T3
cd
o
(N O
co a>
CO rH
CD rH
^ CO
1 1
to o
CO CO
en to
O (D
CO iO
0 C-
l> l>
10 O
rH
0 0
CO ^
tO CM
CN CO
00 ^
m <N
rH (N
m co
CO (0
i i
CO tD
W CO
o o
CN CO
(fl
w
Q)
U
O h
0,-P
cu ?
JH O
•p -p
CO
'H cl
O ~£
I-HOOO mcocNCOoci
CTlG)OOQOI>'C.7)I^*tD CO
r-^coco^cnr-rHN
iOcOCOO^^J1COI> CO
CNCMCOCOXlMI>rHOO
i— 1
1 1 1 1 O O H CM CM
rH CM
COt^-r-HOCOOCMCOt>
rocM-^fcoto inaio
rH -^ Tp CM
CJ1O toiOOCM^fT)lO
t^-CTlOOO^CMC.yiOrQtO
iOt>OOOOOOlOl-H'!^1
rH rH rH rH
COCOCNmt-CO-O^!-
i>i>oot>c^[>r*i>t^
o
CM
1
oioinioioo^o o
rHCMCMCMCMCO^CO1^
rH CM
ooooooooo
COOOOOOO^rH^CTl
CMCMCNCMCOCMCMCMOJ
c^a^otocococococi
CM^cv1lOoOC>ll>COCO
OOrHrHCMCMrHlMrH
rH^OCOO^COCOC^-d
oocnOr-itot-rHinco
I 1 1 1 1 1 1 1 1
toooaiOrHcor-Hin
ooooooo ^
rH
<H "O
o cu
Ift rQ
CU ri JH CD tfl -P -H
J3 & CD> -Pj^fl^
+j^j -PCD flCDcSO
-P-S 3j3 -.HOGriOCD
•H[fl0 0)OQri O^rt-O
rdbot/ia^cn OCCD£+J^!>>
CcadridO o-POcn^rH
rty^+JC3O'O.MrHtf}^ b-CO
rH rH^CD'HCDH&iflO-PG'H
tflri-'HCDCDT3Q>r3OrtEHrO CD
-POH a-p TJ i-na
CD!H >rt 2!>1riJ3,c3CD.C.rJ. C W
gaaS;i[ncn:S-P =H4J-P-Hrf
00
CO
o
f*«
"^
rH
CO
CO
t>
E>
^
r-H
rH
CO
rH
t>
^.
0
CO
rH
O
CO
00
CO
10
i-H
H
CO
O
a>
i
CTi
CD
S
rH
image:
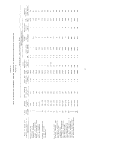 TABLE i?
PHOTOSYNTHETIC BACTERIAL GROWTH ON PURE CHEMICAL SUBSTRATES
Seed Oroanic Chemical V1) Result^'
GSB(a) Distil led water
GSB Acetic acid
GSB Ethanol
GSB Ethylene glycol
GSB Methanol
GSB Acetone
GSB Methyl ethyl ketone
GSB Acetaldehyde
GSB Sodium benzoate
PSB^) Distilled water
PSB Acetic acid
PSB Ethanol
PSB Ethylene glycol
PSB Methanol
PSB Acetone
PSB Methyl ethyl ketone
PSB Acetaldehyde
PSB Sodium benzoate
PSB(c) Distilled water
MOd) Distil led water
(a) Predominately green sulfur bacteria
(b) Predominately purple sulfur bacteria
(c) Predominately purple sulfur bacteria
(d) Mixed culture
(e) 1 ml feed stock of each named
Red (R) and Green (G)
R
R
R
G
R
White (W)
R
W
G
G, R, Brown (B)
G
G&R
G
G &R
G
G &R
G
G
G
from laboratory lagoon
from Texas Plant lagoon
from another Texas lagoon
Finol pH
7.6
6.98
8.5
7.3
7.65
7.22
8.65
7.4
8.4
8.38
7.0
7.38
7.4
8.02
7.5
8.5
7.8
8.2
8.0
8.0
(f) After 25 days incubation in mixed incandescent-fluorescent light
NOTE: The media used was that of Skerman for growth of Chromotlum; Skerman, V. D. B.
Genera of Bacteria, Williams AWilkins Co., Baltimore, Md., 1967.
90
image:
TABLE i?
PHOTOSYNTHETIC BACTERIAL GROWTH ON PURE CHEMICAL SUBSTRATES
Seed Oroanic Chemical V1) Result^'
GSB(a) Distil led water
GSB Acetic acid
GSB Ethanol
GSB Ethylene glycol
GSB Methanol
GSB Acetone
GSB Methyl ethyl ketone
GSB Acetaldehyde
GSB Sodium benzoate
PSB^) Distilled water
PSB Acetic acid
PSB Ethanol
PSB Ethylene glycol
PSB Methanol
PSB Acetone
PSB Methyl ethyl ketone
PSB Acetaldehyde
PSB Sodium benzoate
PSB(c) Distilled water
MOd) Distil led water
(a) Predominately green sulfur bacteria
(b) Predominately purple sulfur bacteria
(c) Predominately purple sulfur bacteria
(d) Mixed culture
(e) 1 ml feed stock of each named
Red (R) and Green (G)
R
R
R
G
R
White (W)
R
W
G
G, R, Brown (B)
G
G&R
G
G &R
G
G &R
G
G
G
from laboratory lagoon
from Texas Plant lagoon
from another Texas lagoon
Finol pH
7.6
6.98
8.5
7.3
7.65
7.22
8.65
7.4
8.4
8.38
7.0
7.38
7.4
8.02
7.5
8.5
7.8
8.2
8.0
8.0
(f) After 25 days incubation in mixed incandescent-fluorescent light
NOTE: The media used was that of Skerman for growth of Chromotlum; Skerman, V. D. B.
Genera of Bacteria, Williams AWilkins Co., Baltimore, Md., 1967.
90
image:
 Chlorobium chlorophyll while the red growth had those
characteristics of Chromatium species. Attempts
were made to seed with purple sulfur bacteria from
a waste treatment lagoon at Union Carbide's Texas
City Plant. After approximately two months of
operation the green sulfur bacteria containing
Chlorobium chlorophyll became the predominant
population. Attempts made to swing population
predominance to purple sulfur bacteria by pH
adjustment and by increasing feed stock concentration
were unsuccessful, so the less common green
sulfur bacteria of the family Chlorobacteriaceae
were used in these studies rather than the
Thiorhodaceae identified in the lagoons under
Grant 12020-DIS.
In an attempt to determine whether some component
in the feed was limiting growth, an experiment
was designed to test growth of the red and green
sulfur forms on various pure chemical substrates.
Results are included in Table 17. Results are not
conclusive but indicate that both green and purple
sulfur bacteria can grow on the media utilized in
the presence of acetic acid, ethanol, ethylene
glycol, acetone and acetaldehyde. The purple
sulfur bacteria were not observed to grow in the
presence of methanol, methyl ethyl ketone, or
sodium benzoate in this test. It is to be under-
stood that although the photosynthetic bacteria
can grow, they do not necessarily oxidize sulfides.
This work was not continued due to the limited
scope of the sponsoring project and lack of pure
photosynthetic bacterial cultures. It could act
as a starting point for other work testing inhibition
of organic chemicals on lagoon ecology.
In the face of changing photosynthetic cultures
the units provided approximately equal removal of
applied COD during the initial period. COD removals
during the length of the experiment are given in
Table 18.
Experiments were also conducted during the initial
period to measure diurnal changes in parameters
expected to vary in a situation of bacterial photo-
synthesis. Measurements of pH at the end of the
dark period and at the end of the light period during
89
image:
Chlorobium chlorophyll while the red growth had those
characteristics of Chromatium species. Attempts
were made to seed with purple sulfur bacteria from
a waste treatment lagoon at Union Carbide's Texas
City Plant. After approximately two months of
operation the green sulfur bacteria containing
Chlorobium chlorophyll became the predominant
population. Attempts made to swing population
predominance to purple sulfur bacteria by pH
adjustment and by increasing feed stock concentration
were unsuccessful, so the less common green
sulfur bacteria of the family Chlorobacteriaceae
were used in these studies rather than the
Thiorhodaceae identified in the lagoons under
Grant 12020-DIS.
In an attempt to determine whether some component
in the feed was limiting growth, an experiment
was designed to test growth of the red and green
sulfur forms on various pure chemical substrates.
Results are included in Table 17. Results are not
conclusive but indicate that both green and purple
sulfur bacteria can grow on the media utilized in
the presence of acetic acid, ethanol, ethylene
glycol, acetone and acetaldehyde. The purple
sulfur bacteria were not observed to grow in the
presence of methanol, methyl ethyl ketone, or
sodium benzoate in this test. It is to be under-
stood that although the photosynthetic bacteria
can grow, they do not necessarily oxidize sulfides.
This work was not continued due to the limited
scope of the sponsoring project and lack of pure
photosynthetic bacterial cultures. It could act
as a starting point for other work testing inhibition
of organic chemicals on lagoon ecology.
In the face of changing photosynthetic cultures
the units provided approximately equal removal of
applied COD during the initial period. COD removals
during the length of the experiment are given in
Table 18.
Experiments were also conducted during the initial
period to measure diurnal changes in parameters
expected to vary in a situation of bacterial photo-
synthesis. Measurements of pH at the end of the
dark period and at the end of the light period during
89
image:
 TABLE 16
ANAEROBIC LAGOON FEED
(a )
Feed Concentration, Equivalent TOD,
mg/1 mg/1
Acetic acid 400 428
Ethanol 100 210
Ethylene glycol 200 260
Methanol 75 112
Acetone 100 220
MEK 20 50
Acetaldehyde 40 58
Sodium benzoate 20 32
Sulfate 200 (initially)
1370(b)
NOTE: (a) TOD based on theoretical oxidation of all carbon
to CO2 and all hydrogen to H2O
(b) Actual COD 1230, Ratio of COD/TOD = 90%
The feed was made up as a concentrate and added
to 20 liters of distilled water which was sufficient
to last approximately 5 days. A more concentrated
feed was made by adding more of the concentrate to the
dilution water. Buffer-nutrient was described previously
88
image:
TABLE 16
ANAEROBIC LAGOON FEED
(a )
Feed Concentration, Equivalent TOD,
mg/1 mg/1
Acetic acid 400 428
Ethanol 100 210
Ethylene glycol 200 260
Methanol 75 112
Acetone 100 220
MEK 20 50
Acetaldehyde 40 58
Sodium benzoate 20 32
Sulfate 200 (initially)
1370(b)
NOTE: (a) TOD based on theoretical oxidation of all carbon
to CO2 and all hydrogen to H2O
(b) Actual COD 1230, Ratio of COD/TOD = 90%
The feed was made up as a concentrate and added
to 20 liters of distilled water which was sufficient
to last approximately 5 days. A more concentrated
feed was made by adding more of the concentrate to the
dilution water. Buffer-nutrient was described previously
88
image:
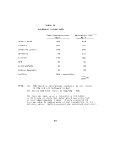 FIGURE 36
ANAEROBIC LAGOON
Light Source
25 watt Incandescent
40 watt Fluorescent
Wet Test Meter
— Vent
Effluent
Sampling Porh
Mixed Lev/-Solids
Supernatant
Heavy Domestic Sludge
Recycle Mixing
rXimp
87
image:
FIGURE 36
ANAEROBIC LAGOON
Light Source
25 watt Incandescent
40 watt Fluorescent
Wet Test Meter
— Vent
Effluent
Sampling Porh
Mixed Lev/-Solids
Supernatant
Heavy Domestic Sludge
Recycle Mixing
rXimp
87
image:
 oxidation of produced sulfides, This oxidation would
provide a means of off-setting toxicity of sulfides
produced in anaerobic treatment of high sulfate wastes
as well as yield additional capacity for reduction
of oxygen-demanding wastes through re-oxidation of
sulfides to sulfates and by providing an additional
bacterial culture which could oxidize organic wastes.
The experimental apparatus described as follows was
assembled and seeded in an effort to reproduce
average feed and environmental conditions observed
in the previous experimental work.
Ex pe r i m e n t a 1 Ajjp a r a_t, us a n d__Proc e dur e for J5u 1 f jl de Study
The Laboratory lagoons consisted of two identical
units as illustrated in Figure 36. The containers
were constructed from glass battery jars while the
tops were of plate glass, which was selected to
allow passage of Light wavelengths desirable to
sulfur bacteria „ Continuous feed of the mixed
chemical feed indicated in Table 16 was provided
in order to treat a representative waste and to
develop an acclimated sludge. Continuous mixing
was provided via a recycle pump while an incandescent-
fluorescent mixed light source was connected in
series with a timer to allow any light-dark ratio
desired. Gas produced was measured using a wet test
meter and was sampled using a hypodermic syringe.
The units were initially seeded to a depth of 3 inches
with a 23 percent, solids domestic primary sludge
from the St. Albans, West Virginia wastewater
treatment facility. Hydraulic retention time
was set at 15 days. Samples from each unit
were taken each working day and were analyzed
daily for pH and periodically for COD, volatile
acids, alkalinity, sulfides, sulfates and ORP,
Daily gas production measurements were made.
ts of ___Sulf_ide _J3tudy
During the startup period both units were operated
on a 12-hr, light-dark cycle, During this
period, the suspended culture within the units
swung from a green to a red predominant coloration.
At times, one unit would be red, while the other
was green. Light absorption spectra indicated the
green growth had the predominant peaks for
86
image:
oxidation of produced sulfides, This oxidation would
provide a means of off-setting toxicity of sulfides
produced in anaerobic treatment of high sulfate wastes
as well as yield additional capacity for reduction
of oxygen-demanding wastes through re-oxidation of
sulfides to sulfates and by providing an additional
bacterial culture which could oxidize organic wastes.
The experimental apparatus described as follows was
assembled and seeded in an effort to reproduce
average feed and environmental conditions observed
in the previous experimental work.
Ex pe r i m e n t a 1 Ajjp a r a_t, us a n d__Proc e dur e for J5u 1 f jl de Study
The Laboratory lagoons consisted of two identical
units as illustrated in Figure 36. The containers
were constructed from glass battery jars while the
tops were of plate glass, which was selected to
allow passage of Light wavelengths desirable to
sulfur bacteria „ Continuous feed of the mixed
chemical feed indicated in Table 16 was provided
in order to treat a representative waste and to
develop an acclimated sludge. Continuous mixing
was provided via a recycle pump while an incandescent-
fluorescent mixed light source was connected in
series with a timer to allow any light-dark ratio
desired. Gas produced was measured using a wet test
meter and was sampled using a hypodermic syringe.
The units were initially seeded to a depth of 3 inches
with a 23 percent, solids domestic primary sludge
from the St. Albans, West Virginia wastewater
treatment facility. Hydraulic retention time
was set at 15 days. Samples from each unit
were taken each working day and were analyzed
daily for pH and periodically for COD, volatile
acids, alkalinity, sulfides, sulfates and ORP,
Daily gas production measurements were made.
ts of ___Sulf_ide _J3tudy
During the startup period both units were operated
on a 12-hr, light-dark cycle, During this
period, the suspended culture within the units
swung from a green to a red predominant coloration.
At times, one unit would be red, while the other
was green. Light absorption spectra indicated the
green growth had the predominant peaks for
86
image:
 cases compounds which were inhibitory in unacclimated
Warburg studies were found treatable or able to be
tolerated in considerably greater concentrations
after acclimation,
Successful acclimation was found to take two general
courses. In the case of crotonaldehyde and ethyl
acrylate the compound was found to be degraded by
chroma tographic analysis when acclimation was success-
ful,, It is conceivable that the compound per se_
could still be inhibitory but was degraded at a great
enough rate so that sufficient concentrations were not
reached for inhibition. In the case of phenol no
decomposition of the material was observed in the
anaerobic system, however, higher concentrations
were tolerated after acclimation. While acclimation
was successful for some single inhibitors, a more
difficult problem exists with mixed inhibitor systems
which may produce synergistic effects.
Acclimation was found to be unsuccessful in a digester
type reactor unless complete mixing was provided.
No such problem was observed in the packed bed type
reactor .
Acclimation in anaerobic systems was at best a slow
process. Considerable difficulty would likely be
experienced in startup of a full-scale process treating
an inhibitory waste.
Inhibition due to sulfides in anaerobic treatment of
petrochemical wastes was studied due to the presence
of sulfate ions in many petrochemical waste streams.
The sulfate ions within the stream are reduced,
which produces hydrogen sulfide, that can cause
toxicity (16), odor, and corrosion problems.
Under the related EPA Grant 1202Q-DIS, "Anaerobic
Treatment of Synthetic Organic Wastes," an open
lagoon with a photosynthetic , sulfur-oxidizing
bacterial culture was found to be effective in
controlling sulfide concentrations.
In this study laboratory-scale lagoons were designed
to quantify under controlled conditions of feed,
temperature, and sunlight, the photosynthetic
85
image:
cases compounds which were inhibitory in unacclimated
Warburg studies were found treatable or able to be
tolerated in considerably greater concentrations
after acclimation,
Successful acclimation was found to take two general
courses. In the case of crotonaldehyde and ethyl
acrylate the compound was found to be degraded by
chroma tographic analysis when acclimation was success-
ful,, It is conceivable that the compound per se_
could still be inhibitory but was degraded at a great
enough rate so that sufficient concentrations were not
reached for inhibition. In the case of phenol no
decomposition of the material was observed in the
anaerobic system, however, higher concentrations
were tolerated after acclimation. While acclimation
was successful for some single inhibitors, a more
difficult problem exists with mixed inhibitor systems
which may produce synergistic effects.
Acclimation was found to be unsuccessful in a digester
type reactor unless complete mixing was provided.
No such problem was observed in the packed bed type
reactor .
Acclimation in anaerobic systems was at best a slow
process. Considerable difficulty would likely be
experienced in startup of a full-scale process treating
an inhibitory waste.
Inhibition due to sulfides in anaerobic treatment of
petrochemical wastes was studied due to the presence
of sulfate ions in many petrochemical waste streams.
The sulfate ions within the stream are reduced,
which produces hydrogen sulfide, that can cause
toxicity (16), odor, and corrosion problems.
Under the related EPA Grant 1202Q-DIS, "Anaerobic
Treatment of Synthetic Organic Wastes," an open
lagoon with a photosynthetic , sulfur-oxidizing
bacterial culture was found to be effective in
controlling sulfide concentrations.
In this study laboratory-scale lagoons were designed
to quantify under controlled conditions of feed,
temperature, and sunlight, the photosynthetic
85
image:
 image:
 FIGURE 35
PERFORMANCE OF ANAEROBIC PACKED COLUMN
TREATING SURFACTANT CONTAINING WASTEWATER
0
100,-
100 200 300
Period of Test, days
400
2.5
100 200 300
Period of Test, days
400
250
100 200 300
Period of Test, days
400
84
image:
FIGURE 35
PERFORMANCE OF ANAEROBIC PACKED COLUMN
TREATING SURFACTANT CONTAINING WASTEWATER
0
100,-
100 200 300
Period of Test, days
400
2.5
100 200 300
Period of Test, days
400
250
100 200 300
Period of Test, days
400
84
image:
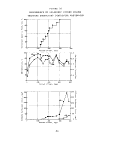 D| 3
image:
D| 3
image:
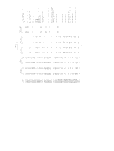 one day indicated no change during the photo period
(4/6 and 4/7/70). Measurements of sulfates and sulfides
under the same conditions at a later date also indicated
no change from day-night values (6/17/70) under the
low levels of feed sulfate tested.
After essentially identical performance had been
established in the two units, Unit B was covered
with black polyethylene while Unit A was subjected
to conditions of continuous light. The units were
then operated at the initial 200 mg/1 feed sulfate
level while increasing the concentration of organic
in the feed to determine differences in sulfur
transformation in the light-dark cases under
varying conditions of organic loading. As indicated
in Table 18, while the feed concentration was raised
to three times the original level no significant
differences were observed in measured sulfide levels, also
in neither unit was the sulfate concentration depleted
completely as would be expected in an anaerobic
environment. The increased feed brought the units
almost to failure as measured by pH and volatile
acid levels. Feed was, therefore, terminated for a
period of two weeks and was resumed for the remainder
of the experiment at a level of 1.5 times that given
in Table 16.
The final state of experimentation was a rapid increase
in sulfate feed concentration to unit failure. As
evidenced in the plot of sulfur compounds versus
time (Figure 37), the sulfates became a problem
at a level between 1500 and 3000 mg/1. Sulfates were
not quantitatively reduced to sulfides but lagged
well behind the equivalent level of applied sulfates.
During the period of initial operation approximately
75 percent of the applied sulfates were present in
the mixed reactor as sulfides. Both the light and
dark reactors experienced approximately the same
level. The lighted system apparently maintained
a greater level of bacterial activity and, hence,
a more rapid conversion was evidenced during the
final sulfate feed acceleration. The dark unit
provided a much lower overall sulfide level. If
photosynthetic oxidation were the controlling
mechanism limiting sulfide level, the results would
be reversed - that is, the light unit would have the
lower sulfide level.
92
image:
one day indicated no change during the photo period
(4/6 and 4/7/70). Measurements of sulfates and sulfides
under the same conditions at a later date also indicated
no change from day-night values (6/17/70) under the
low levels of feed sulfate tested.
After essentially identical performance had been
established in the two units, Unit B was covered
with black polyethylene while Unit A was subjected
to conditions of continuous light. The units were
then operated at the initial 200 mg/1 feed sulfate
level while increasing the concentration of organic
in the feed to determine differences in sulfur
transformation in the light-dark cases under
varying conditions of organic loading. As indicated
in Table 18, while the feed concentration was raised
to three times the original level no significant
differences were observed in measured sulfide levels, also
in neither unit was the sulfate concentration depleted
completely as would be expected in an anaerobic
environment. The increased feed brought the units
almost to failure as measured by pH and volatile
acid levels. Feed was, therefore, terminated for a
period of two weeks and was resumed for the remainder
of the experiment at a level of 1.5 times that given
in Table 16.
The final state of experimentation was a rapid increase
in sulfate feed concentration to unit failure. As
evidenced in the plot of sulfur compounds versus
time (Figure 37), the sulfates became a problem
at a level between 1500 and 3000 mg/1. Sulfates were
not quantitatively reduced to sulfides but lagged
well behind the equivalent level of applied sulfates.
During the period of initial operation approximately
75 percent of the applied sulfates were present in
the mixed reactor as sulfides. Both the light and
dark reactors experienced approximately the same
level. The lighted system apparently maintained
a greater level of bacterial activity and, hence,
a more rapid conversion was evidenced during the
final sulfate feed acceleration. The dark unit
provided a much lower overall sulfide level. If
photosynthetic oxidation were the controlling
mechanism limiting sulfide level, the results would
be reversed - that is, the light unit would have the
lower sulfide level.
92
image:
 image:
 CO
to
Z
o
oc
UJ
U
Z
o
u
O
Z
o
o
o
88888888
I/Bui '(£ x ^ -6-8) ..^OS so I8A»1 jnilnS
93
image:
CO
to
Z
o
oc
UJ
U
Z
o
u
O
Z
o
o
o
88888888
I/Bui '(£ x ^ -6-8) ..^OS so I8A»1 jnilnS
93
image:
 When the sulfide level within the lighted lagoon
reached the 140 to 170 mg/1 sulfide-ion level, the
COD reduction within the unit rapidly dropped.
Attempts were made to revive the system by decreasing
organic feed levels with no success, The dark unit
maintained a satisfactory level of reduction during
this period. Strangely, the conventional parameter
of pH did not forecast the unit failure as pH was
satisfactory at all times. Possibly inhibition was
total rather than selective for methane bacteria
at the level observed. The observed level of
sulfide at which inhibition occurred was slightly
below the 200 mg/1 soluble sulfides quoted as
inhibitory by Lawrence, McCarty, and Guerin (16).
Purple sulfur bacteria reportedly (17, 18) are
inhibited in their utilization of sulfides by
presence of a more readily degradable feed such as
acetate. The observed extent of this sparing action
varies with the reporting investigator. Apparently
a similar phenomena exists with the green sulfur
group containing Chlorobium chlorophyll. The unit
providing a light source for photosynthetic growth
did not at any time exhibit significant evidence
of sulfide oxidation in diurnal measurements or in
comparison with an unlighted unit.
The lack of photosynthetic sulfur oxidation observed
in these studies was in direct contrast to the high
degree of oxidation previously reported in pilot-
scale anaerobic facilities treating similar wastes (10)
One immediately obvious difference between the
experimental systems was the predominant bacterial
groups present - Thiorhodaceae when oxidation was
observed and Chlorobacteriaceae when no oxidation
was observed. Some fundamental research beyond
the scope of this project on environmental conditions
for growth and inhibition would be required to
document the cause for the change in predominance
between the two systems.
94
image:
When the sulfide level within the lighted lagoon
reached the 140 to 170 mg/1 sulfide-ion level, the
COD reduction within the unit rapidly dropped.
Attempts were made to revive the system by decreasing
organic feed levels with no success, The dark unit
maintained a satisfactory level of reduction during
this period. Strangely, the conventional parameter
of pH did not forecast the unit failure as pH was
satisfactory at all times. Possibly inhibition was
total rather than selective for methane bacteria
at the level observed. The observed level of
sulfide at which inhibition occurred was slightly
below the 200 mg/1 soluble sulfides quoted as
inhibitory by Lawrence, McCarty, and Guerin (16).
Purple sulfur bacteria reportedly (17, 18) are
inhibited in their utilization of sulfides by
presence of a more readily degradable feed such as
acetate. The observed extent of this sparing action
varies with the reporting investigator. Apparently
a similar phenomena exists with the green sulfur
group containing Chlorobium chlorophyll. The unit
providing a light source for photosynthetic growth
did not at any time exhibit significant evidence
of sulfide oxidation in diurnal measurements or in
comparison with an unlighted unit.
The lack of photosynthetic sulfur oxidation observed
in these studies was in direct contrast to the high
degree of oxidation previously reported in pilot-
scale anaerobic facilities treating similar wastes (10)
One immediately obvious difference between the
experimental systems was the predominant bacterial
groups present - Thiorhodaceae when oxidation was
observed and Chlorobacteriaceae when no oxidation
was observed. Some fundamental research beyond
the scope of this project on environmental conditions
for growth and inhibition would be required to
document the cause for the change in predominance
between the two systems.
94
image:
 SECTION VI
ACKNOWLEDGMENTS
This project was completed by the Research and
Development Department of Union Carbide Corporation,
Chemicals and Plastics Division, under
the general supervision of Mr. R. A. Conway
and the immediate direction of Mr. J. C. Hovious.
Mr. J. F. Dietrich and Mr. G. T. Waggy conducted
most of the laboratory studies and Mr. Waggy
shared the reporting responsibilities with
Mr. Hovious.
The contributions of Messrs. J. W. Ferguson (Project
Officer), J. A. Horn and Ray George of EPA are
gratefully acknowledged.
Dr. P. L. McCarty of Stanford University and
Dr. J. Vennes of the University of North Dakota
contributed valuable technical assistance as
consultants.
95
image:
SECTION VI
ACKNOWLEDGMENTS
This project was completed by the Research and
Development Department of Union Carbide Corporation,
Chemicals and Plastics Division, under
the general supervision of Mr. R. A. Conway
and the immediate direction of Mr. J. C. Hovious.
Mr. J. F. Dietrich and Mr. G. T. Waggy conducted
most of the laboratory studies and Mr. Waggy
shared the reporting responsibilities with
Mr. Hovious.
The contributions of Messrs. J. W. Ferguson (Project
Officer), J. A. Horn and Ray George of EPA are
gratefully acknowledged.
Dr. P. L. McCarty of Stanford University and
Dr. J. Vennes of the University of North Dakota
contributed valuable technical assistance as
consultants.
95
image:
 image:
 SECTION VII
REFERENCES
1. Fisher, J. A., Hovious, J. C., Kumke, G. W., and
Conway, R. A., Water - 1970, AIChE Chemical
Engineering Process Symposium Series, 67, 107
(1971).
2. Hovious, J. C., Conway, R. A., and Harvey, Z. B.,
"Pilot Studies of Biological Alternatives for
Petrochemical Waste Treatment," Presented at
26th Purdue Ind. Waste Conference, May 4-6, 1971.
3. Heukelekian, H., and Rand, M. C., J. Water Pollution
Control Federation, 27, 9, 1040 (1955).
4. Lamb, C. R. and Jenkins, G. F., Proc. 7th Ind. Waste
Conference, Purdue Univ. Ext. Ser. 79, 326 (1952).
5. Stack, V. T., Jr., Industrial and Engineering
Chemistry, 4£, 5, 913 (1957).
6. Hatfield, R., Industrial and Engineering Chemistry,
49_, 2, 192 (195TT
7. Gerhold, R. M. and Malaney, G. W., J. Water
Pollution Control Federation, 38, 4, 562 (1966).
8. Buzzell, J. C., Jr., Thompson, C. H., and
Ryckman, D. W., Behavior of Organic Chemicals
in the Aquatic Environment, Part III - Behavior
in Aerobic Treatment Systems (Activated Sludge),
Manufacturing Chemists Association(1969).
9. McCarty, P. L., Public Works, 95, 10, 123; 11, 91
(1964).
10. Hovious, J. C., Conway, R. A., and Ganze, C. W.,
"Anaerobic Lagoon Pretreatment of Petrochemical
Wastes," Presented at 44th Annual WPCF Convention,
October 3-8, 1971.
11. Umbreit, W. W., Burria, R. H., and Stauffer, J. F.,
Manometric Techniques, Burgess Publishing Company,
Minneapolis, Minnesota, 4th ed. (1964).
97
image:
SECTION VII
REFERENCES
1. Fisher, J. A., Hovious, J. C., Kumke, G. W., and
Conway, R. A., Water - 1970, AIChE Chemical
Engineering Process Symposium Series, 67, 107
(1971).
2. Hovious, J. C., Conway, R. A., and Harvey, Z. B.,
"Pilot Studies of Biological Alternatives for
Petrochemical Waste Treatment," Presented at
26th Purdue Ind. Waste Conference, May 4-6, 1971.
3. Heukelekian, H., and Rand, M. C., J. Water Pollution
Control Federation, 27, 9, 1040 (1955).
4. Lamb, C. R. and Jenkins, G. F., Proc. 7th Ind. Waste
Conference, Purdue Univ. Ext. Ser. 79, 326 (1952).
5. Stack, V. T., Jr., Industrial and Engineering
Chemistry, 4£, 5, 913 (1957).
6. Hatfield, R., Industrial and Engineering Chemistry,
49_, 2, 192 (195TT
7. Gerhold, R. M. and Malaney, G. W., J. Water
Pollution Control Federation, 38, 4, 562 (1966).
8. Buzzell, J. C., Jr., Thompson, C. H., and
Ryckman, D. W., Behavior of Organic Chemicals
in the Aquatic Environment, Part III - Behavior
in Aerobic Treatment Systems (Activated Sludge),
Manufacturing Chemists Association(1969).
9. McCarty, P. L., Public Works, 95, 10, 123; 11, 91
(1964).
10. Hovious, J. C., Conway, R. A., and Ganze, C. W.,
"Anaerobic Lagoon Pretreatment of Petrochemical
Wastes," Presented at 44th Annual WPCF Convention,
October 3-8, 1971.
11. Umbreit, W. W., Burria, R. H., and Stauffer, J. F.,
Manometric Techniques, Burgess Publishing Company,
Minneapolis, Minnesota, 4th ed. (1964).
97
image:
 12. McCarty, P. L., Jeris, J. S., and Murdock, W.,
J. Water Pollution Control Federation, 35, 12,
1501 (1963).
13. Lawrence, A. W. and McCarty, P. L., J. Water
Pollution Control Federation, 41, Rl (1969).
14. Lank, J. C., Jr., and Wallace, A. T., "Effect of
Acrylonitrile on Anaerobic Digestion of Domestic
Sludge," Presented at the Purdue Industrial Waste
Conference, May 1970.
15. Young, J. C. and McCarty, P. L., J. Water Pollution
Control Federation, 4J^ 5, R160 (1969).
16. Lawrence, A. W., McCarty, P. L,, and Guerin, F. J. A.,
Int. Journal Air Water Pollut., 1_0, 207 (1966).
17. Shaposhnika, V. N., Osnitskaya, L. K., and Chudina, V. I.,
Mikrobiologiya, 29, 9 (1960).
18. Vennes, J. W., Personal communication.
19. Standard Methods for the Examination of Water and
Wastewater, 12th ed., Am. Public Health Assoc., Inc.,
New York (1965).
20. Mausner, M., et al., "The Status of Biodegradability
Testing of Nonionic Surfactants," Scientific and
Technical Report No. 6 published by the Soap and
Detergent Association, October 1969.
21. Hovious, J. C., Fisher, J. A., and Conway, R. A.,
"Anaerobic Treatment of Synthetic Organic Wastes,"
Water Pollution Research Series 12020 DIS 01/72,
January 1972.
98
image:
12. McCarty, P. L., Jeris, J. S., and Murdock, W.,
J. Water Pollution Control Federation, 35, 12,
1501 (1963).
13. Lawrence, A. W. and McCarty, P. L., J. Water
Pollution Control Federation, 41, Rl (1969).
14. Lank, J. C., Jr., and Wallace, A. T., "Effect of
Acrylonitrile on Anaerobic Digestion of Domestic
Sludge," Presented at the Purdue Industrial Waste
Conference, May 1970.
15. Young, J. C. and McCarty, P. L., J. Water Pollution
Control Federation, 4J^ 5, R160 (1969).
16. Lawrence, A. W., McCarty, P. L,, and Guerin, F. J. A.,
Int. Journal Air Water Pollut., 1_0, 207 (1966).
17. Shaposhnika, V. N., Osnitskaya, L. K., and Chudina, V. I.,
Mikrobiologiya, 29, 9 (1960).
18. Vennes, J. W., Personal communication.
19. Standard Methods for the Examination of Water and
Wastewater, 12th ed., Am. Public Health Assoc., Inc.,
New York (1965).
20. Mausner, M., et al., "The Status of Biodegradability
Testing of Nonionic Surfactants," Scientific and
Technical Report No. 6 published by the Soap and
Detergent Association, October 1969.
21. Hovious, J. C., Fisher, J. A., and Conway, R. A.,
"Anaerobic Treatment of Synthetic Organic Wastes,"
Water Pollution Research Series 12020 DIS 01/72,
January 1972.
98
image:
 SECTION VIII
APPENDIX
Analytical Methods
A. Alkalinity - Alkalinity was determined to
the methyl orange end point as given in
Standard Methods (19)
B. Anaerobic Gas Composition - Gas composition
was measured using mass spectrographic
equipment
C. Chemical Oxygen Demand (COD) - COD
determinations were made on filtered
samples by the dichromate-reflux method
as presented in Standard Methods (19)
D. Determination of Polyether Nonionic
Surfactants
Reagents
a. Cobaltous Thiocyanate Reagent:
Dissolve 28 grams of cobaltous
nitrate hexahydrate, Co (1^)3)2'6 H20,
and 62 grams of ammonium thiocyanate
in 85 grams of distilled water. Pre-
extract the reagent with three ten-mi
portions of chloroform.
b. Ethyl Ether: Reagent grade (use
appropriate precautions when handling
ethers)
c. Chloroform: Reagent grade
Procedure
a. To a 250-ml cylinder add 50 ml of
sample and 50 ml of ethyl ether.
b. Via a glass-frit sparging tube, pass
nitrogen thru the aqueous phase,
permitting the bubbles to form in the
aqueous phase before passing into
the ether layer. Allow this sparging
to continue for five minutes.
99
image:
SECTION VIII
APPENDIX
Analytical Methods
A. Alkalinity - Alkalinity was determined to
the methyl orange end point as given in
Standard Methods (19)
B. Anaerobic Gas Composition - Gas composition
was measured using mass spectrographic
equipment
C. Chemical Oxygen Demand (COD) - COD
determinations were made on filtered
samples by the dichromate-reflux method
as presented in Standard Methods (19)
D. Determination of Polyether Nonionic
Surfactants
Reagents
a. Cobaltous Thiocyanate Reagent:
Dissolve 28 grams of cobaltous
nitrate hexahydrate, Co (1^)3)2'6 H20,
and 62 grams of ammonium thiocyanate
in 85 grams of distilled water. Pre-
extract the reagent with three ten-mi
portions of chloroform.
b. Ethyl Ether: Reagent grade (use
appropriate precautions when handling
ethers)
c. Chloroform: Reagent grade
Procedure
a. To a 250-ml cylinder add 50 ml of
sample and 50 ml of ethyl ether.
b. Via a glass-frit sparging tube, pass
nitrogen thru the aqueous phase,
permitting the bubbles to form in the
aqueous phase before passing into
the ether layer. Allow this sparging
to continue for five minutes.
99
image:
 c. Pour the two phases into a separatory
funnel and discard the aqueous
(bottom layer).
d. Place the separatory funnel in a steam
bath and evaporate the ethyl ether (vent)
e. After the ethyl ether is evaporated and
the funnel has cooled, add 2 ml of
cobaltous thiocyanate reagent.
f. Swirl the cobaltous thiocyanate
reagent over the entire surface
of the funnel.
g. Via a pipet, add five ml of chloroform
to the funnel and shake for one minute.
h. Allow the phases to separate, then
draw off enough of the chloroform
layer (thru a glass plug in the funnel
stem) to fill a one-centimeter absorption
cell.
i. A blank is prepared by starting with step
j. Measure the absorbance of 620 mu on
a spectrophotometer (Beckman Model B
or its equivalent) using the blank
to set the instrument zero.
Calculation
Surfactant concentration is calculated based
on standard curves prepared for the individual
surfactants.
E. Soluble Sulfides - Sulfides were monitored
by Orion Research Incorporated selective
ion electrode.
F. pH - pH was measured using the Glass Electrode
Method specified in Standard Methods (19).
100
image:
c. Pour the two phases into a separatory
funnel and discard the aqueous
(bottom layer).
d. Place the separatory funnel in a steam
bath and evaporate the ethyl ether (vent)
e. After the ethyl ether is evaporated and
the funnel has cooled, add 2 ml of
cobaltous thiocyanate reagent.
f. Swirl the cobaltous thiocyanate
reagent over the entire surface
of the funnel.
g. Via a pipet, add five ml of chloroform
to the funnel and shake for one minute.
h. Allow the phases to separate, then
draw off enough of the chloroform
layer (thru a glass plug in the funnel
stem) to fill a one-centimeter absorption
cell.
i. A blank is prepared by starting with step
j. Measure the absorbance of 620 mu on
a spectrophotometer (Beckman Model B
or its equivalent) using the blank
to set the instrument zero.
Calculation
Surfactant concentration is calculated based
on standard curves prepared for the individual
surfactants.
E. Soluble Sulfides - Sulfides were monitored
by Orion Research Incorporated selective
ion electrode.
F. pH - pH was measured using the Glass Electrode
Method specified in Standard Methods (19).
100
image:
 G. Sulfate - Sulfate ion concentrations were
measured using the Turbidimetric Method
presented in Standard Methods. The analysis
was investigated, and no interferences were
found in the anaerobic system.
H. Volatile Acids - Volatile acid concentrations
were determined by the Column-Partition
Chromatographic Method presented in Standard
Methods.
I. Total Carbon (TC) - Total carbon measurements
were made on filtered samples using the
Union Carbide Total Carbon Analyzer,
J. Foam - Foam measurements across the unit
were made by the following procedure
published by the Soap and Detergent
Association (20), A 50-ml aliquot of the
sample whose foaming ability was to be measured
was placed in a scrupulously cleaned, 100-ml,
glass-stoppered, graduated cylinder. The
cylinder was shaken by hand for 15 seconds
at a rate of 2 to 3 vigorous strokes in a
vertical direction per second. The volume
of foam was visually read from the calibra-
tions on the cylinder after the vessel had
set for 15 seconds and 60 seconds. The foam
volume was read in milliliters and reported
as "ml of foam per 50 ml of solution."
A foam reading of zero was reserved for the
condition of absolutely no foam. When
the surface of the test solution was only
partially covered with foam, such as by
a ring of small bubbles around the periphery
of the graduate, a special measuring
technique was used. The volume of foam was
estimated to the nearest 0.1 ml by viewing
from above and comparing to a standard set of
diagrams. The cylinders used were thoroughly
cleaned and rinsed prior to and between
foam measurements. The precision of
foam measurements was improved significantly
by having all determinations in a series
of tests performed by the same person.
101
image:
G. Sulfate - Sulfate ion concentrations were
measured using the Turbidimetric Method
presented in Standard Methods. The analysis
was investigated, and no interferences were
found in the anaerobic system.
H. Volatile Acids - Volatile acid concentrations
were determined by the Column-Partition
Chromatographic Method presented in Standard
Methods.
I. Total Carbon (TC) - Total carbon measurements
were made on filtered samples using the
Union Carbide Total Carbon Analyzer,
J. Foam - Foam measurements across the unit
were made by the following procedure
published by the Soap and Detergent
Association (20), A 50-ml aliquot of the
sample whose foaming ability was to be measured
was placed in a scrupulously cleaned, 100-ml,
glass-stoppered, graduated cylinder. The
cylinder was shaken by hand for 15 seconds
at a rate of 2 to 3 vigorous strokes in a
vertical direction per second. The volume
of foam was visually read from the calibra-
tions on the cylinder after the vessel had
set for 15 seconds and 60 seconds. The foam
volume was read in milliliters and reported
as "ml of foam per 50 ml of solution."
A foam reading of zero was reserved for the
condition of absolutely no foam. When
the surface of the test solution was only
partially covered with foam, such as by
a ring of small bubbles around the periphery
of the graduate, a special measuring
technique was used. The volume of foam was
estimated to the nearest 0.1 ml by viewing
from above and comparing to a standard set of
diagrams. The cylinders used were thoroughly
cleaned and rinsed prior to and between
foam measurements. The precision of
foam measurements was improved significantly
by having all determinations in a series
of tests performed by the same person.
101
image:
 Experimental Procedures
Intermittently Mixed Digesters (Test Series #1) - The
technique used in Test Series #1 utilized ten one-quart
bottles as reactors, which allowed for duplicate test
units for three chemicals and two biomass controls
(one set of controls being fed calcium acetate). A
typical bottle charge consisted of 300 ml of screened
seed sludge from an anaerobic digester at a domestic
wastewater treatment plant, 0.5 ml of a buffer/nutrient
solution (21), 3 ml of calcium acetate solution to provide
approximately 300 mg/1 COD and the balance of the
liter made up with tap water and test chemical
dosage. Only 900 ml of this mixture were charged
to the bottle as 100 ml were retained for analysis.
The reactors were placed in a 35°C bath and attached
to a water-displacement gas measuring system.
The reactors were manually agitated twice daily and
gas production was recorded daily. Periodic unit
sampling was accomplished by withdrawing 30 ml of the
supernatant by attaching a 50-ml syringe to the
surgical tubing on the sample tube and releasing
the screw clamp. Gas readings were recorded before
and after sampling in order to correct for any volume
changes. Refeeding of the unit was achieved in much
the same way by diluting 3 ml of acetate solution,
0.1 ml of the buffer/nutrient and the desired test
chemical dosage to 30 ml in distilled water and
injecting the mixture into the sample tube by syringe
and then resealing the system. Although refeeding
was initially set up on a regular schedule, unit
activity or gas production ultimately controlled
the periodic refeeding and the rate of increases
in the test chemical dosages. During periods of
reduced gas production, the test chemical feeding
was held off to allow the system to recover.
Continuously Mixed Digesters (Test Series #2) -
Subsequent acclimation test series were based on
larger-volume, completely mixed reactors. Large
magnetic mixers were used to supply constant
agitation in the four half-gallon bottles utilized
as reactors. The bottle charge consisted of the
following:
102
image:
Experimental Procedures
Intermittently Mixed Digesters (Test Series #1) - The
technique used in Test Series #1 utilized ten one-quart
bottles as reactors, which allowed for duplicate test
units for three chemicals and two biomass controls
(one set of controls being fed calcium acetate). A
typical bottle charge consisted of 300 ml of screened
seed sludge from an anaerobic digester at a domestic
wastewater treatment plant, 0.5 ml of a buffer/nutrient
solution (21), 3 ml of calcium acetate solution to provide
approximately 300 mg/1 COD and the balance of the
liter made up with tap water and test chemical
dosage. Only 900 ml of this mixture were charged
to the bottle as 100 ml were retained for analysis.
The reactors were placed in a 35°C bath and attached
to a water-displacement gas measuring system.
The reactors were manually agitated twice daily and
gas production was recorded daily. Periodic unit
sampling was accomplished by withdrawing 30 ml of the
supernatant by attaching a 50-ml syringe to the
surgical tubing on the sample tube and releasing
the screw clamp. Gas readings were recorded before
and after sampling in order to correct for any volume
changes. Refeeding of the unit was achieved in much
the same way by diluting 3 ml of acetate solution,
0.1 ml of the buffer/nutrient and the desired test
chemical dosage to 30 ml in distilled water and
injecting the mixture into the sample tube by syringe
and then resealing the system. Although refeeding
was initially set up on a regular schedule, unit
activity or gas production ultimately controlled
the periodic refeeding and the rate of increases
in the test chemical dosages. During periods of
reduced gas production, the test chemical feeding
was held off to allow the system to recover.
Continuously Mixed Digesters (Test Series #2) -
Subsequent acclimation test series were based on
larger-volume, completely mixed reactors. Large
magnetic mixers were used to supply constant
agitation in the four half-gallon bottles utilized
as reactors. The bottle charge consisted of the
following:
102
image:
 995 ml tap water
500 ml screened domestic primary digester
sludge
1 ml phosphate buffer-ammonium chloride
nutrient solution (COD/N/P ratio of 100/6/2)
4.5 ml calcium acetate solution
(10 percent acetate-ion content)
The charged reactors were placed in a 35°C constant
temperature bath and connected by rubber tubing to
the inverted-graduate gas collection system. The
water displacement bath was maintained at a pH of
4 to minimize carbon dioxide solubility. Since
no pH problems were evident in the initial test
series, the sampling procedure was eliminated from
this study in an effort to reduce the possibility
of oxygen contamination of the reactors. Refeeding
procedures were the same as in the initial series,
except that the volume of feed was reduced to avoid
over-filling the reactor since no effluent was
taken. Usually the acetate solution, test chemical,
and buffer system was less than 10 ml total volume.
Mixing of this feed out of the addition tube and
into the reactor was obtained by pumping the syringe
after the addition.
103
image:
995 ml tap water
500 ml screened domestic primary digester
sludge
1 ml phosphate buffer-ammonium chloride
nutrient solution (COD/N/P ratio of 100/6/2)
4.5 ml calcium acetate solution
(10 percent acetate-ion content)
The charged reactors were placed in a 35°C constant
temperature bath and connected by rubber tubing to
the inverted-graduate gas collection system. The
water displacement bath was maintained at a pH of
4 to minimize carbon dioxide solubility. Since
no pH problems were evident in the initial test
series, the sampling procedure was eliminated from
this study in an effort to reduce the possibility
of oxygen contamination of the reactors. Refeeding
procedures were the same as in the initial series,
except that the volume of feed was reduced to avoid
over-filling the reactor since no effluent was
taken. Usually the acetate solution, test chemical,
and buffer system was less than 10 ml total volume.
Mixing of this feed out of the addition tube and
into the reactor was obtained by pumping the syringe
after the addition.
103
image:
 image:
 SELECTED WATER
RESOURCES ABSTRACTS
INPUT TRANSACTION FORM
1. Report No.
3. Accession No.
w
4. Title Identification and Control of
Petrochemical Pollutants Inhibitory to
Anaerobic Processes
7. Author(s)
Hovious, J. C., Waggy, G. T., Conway, R. A.
5. Report Date 1/73
6.
8. Performing Organization
Report If o.
10. Project No.
12020-FER
11. Contract/Grant No.
13. Type of Report and ,
9. Organization
Union Carbide Corporation, Chemicals and Plastics
Division, Research and Development Department,
South Charleston, West Virginia
12. Sponsoring Organization Ett^Jk3PCHMiental PTOt«e%tttll ;AgeQcy, OfflCS cl1; ItattMUhdU '&VL<A
15. Supplementary Notes Monitoring
Environmental Protection Agency report
number, EPA-R2-73-194, April 1973.
16. Abstract
Identification studies were made on potentially inhibitory materials using
an unacclimated anaerobic biomass. Identified inhibitory materials and
concentrations in mg/1 for a 50 percent decrease in activity were
acrolein (20-50), formaldehyde (50-100) crotonaldehyde (50-100),
2-ethyl-l-hexanol (500-1000), methyl isobutyl ketone (100-300),
diethylamine (300-1000 mg/1), acrylonitrile (100 mg/1), 2-methyl-5-
ethylpyridine (100), ethylene dichloride (150-500), ethyl aerylate
(300-600), and phenol (300-1000). Inhibitory effects were more severe
at high volatile acid concentrations.
Acclimated cultures were developed in mixed digesters for crotonaldehyde,
phenol, and to some degree to ethyl acrylate. No acclimation was
observed for sodium acrylate.
An anaerobic filter was acclimated to 600 mg/1 crotonaldehyde as compared
to the 50-100 mg/1 unacclimated inhibitory level. Treatment of formalde-
hyde, ethyl acrylate, phenol, and acrylonitrile indicated synergestic
inhibition. Anaerobic filter studies also indicated that crotonaldehyde
inhibition could be avoided in a chemical manufacturing waste by dilution
successful treatment of "hard" surfactant containing wastes also was noter
17a. Descriptors
17b. Identifiers
Chemical Wastes*, Industrial Wastes*, Anaerobic Treatment,*
Anaerobic Digestion Methane Bacteria
Inhibition*
17c. COWRR Field & Group
18. Availability
19, Security Class.
(Report)
20. Security Class.
(Page)
21. No. of
Pages
22.
Send To :
WATER RESOURCES SCIENTIFIC INFORMATION CENTER
US DEPARTMENT OFTHE INTERIOR
WASHINGTON. D. C 20240
Abstractor HOVJOUS, J. C.
^institution Union Carbide Corporation
WRSICt02(REV JUNE 1971)
GP 0 9 13.261
image:
SELECTED WATER
RESOURCES ABSTRACTS
INPUT TRANSACTION FORM
1. Report No.
3. Accession No.
w
4. Title Identification and Control of
Petrochemical Pollutants Inhibitory to
Anaerobic Processes
7. Author(s)
Hovious, J. C., Waggy, G. T., Conway, R. A.
5. Report Date 1/73
6.
8. Performing Organization
Report If o.
10. Project No.
12020-FER
11. Contract/Grant No.
13. Type of Report and ,
9. Organization
Union Carbide Corporation, Chemicals and Plastics
Division, Research and Development Department,
South Charleston, West Virginia
12. Sponsoring Organization Ett^Jk3PCHMiental PTOt«e%tttll ;AgeQcy, OfflCS cl1; ItattMUhdU '&VL<A
15. Supplementary Notes Monitoring
Environmental Protection Agency report
number, EPA-R2-73-194, April 1973.
16. Abstract
Identification studies were made on potentially inhibitory materials using
an unacclimated anaerobic biomass. Identified inhibitory materials and
concentrations in mg/1 for a 50 percent decrease in activity were
acrolein (20-50), formaldehyde (50-100) crotonaldehyde (50-100),
2-ethyl-l-hexanol (500-1000), methyl isobutyl ketone (100-300),
diethylamine (300-1000 mg/1), acrylonitrile (100 mg/1), 2-methyl-5-
ethylpyridine (100), ethylene dichloride (150-500), ethyl aerylate
(300-600), and phenol (300-1000). Inhibitory effects were more severe
at high volatile acid concentrations.
Acclimated cultures were developed in mixed digesters for crotonaldehyde,
phenol, and to some degree to ethyl acrylate. No acclimation was
observed for sodium acrylate.
An anaerobic filter was acclimated to 600 mg/1 crotonaldehyde as compared
to the 50-100 mg/1 unacclimated inhibitory level. Treatment of formalde-
hyde, ethyl acrylate, phenol, and acrylonitrile indicated synergestic
inhibition. Anaerobic filter studies also indicated that crotonaldehyde
inhibition could be avoided in a chemical manufacturing waste by dilution
successful treatment of "hard" surfactant containing wastes also was noter
17a. Descriptors
17b. Identifiers
Chemical Wastes*, Industrial Wastes*, Anaerobic Treatment,*
Anaerobic Digestion Methane Bacteria
Inhibition*
17c. COWRR Field & Group
18. Availability
19, Security Class.
(Report)
20. Security Class.
(Page)
21. No. of
Pages
22.
Send To :
WATER RESOURCES SCIENTIFIC INFORMATION CENTER
US DEPARTMENT OFTHE INTERIOR
WASHINGTON. D. C 20240
Abstractor HOVJOUS, J. C.
^institution Union Carbide Corporation
WRSICt02(REV JUNE 1971)
GP 0 9 13.261
image:
 Environment -.1 " ; • L„ •-1 1on Agency
Library, 1' ,
1 North V.MC. . j.- . i ,£
Chicago, Illinois 60'506
image:
Environment -.1 " ; • L„ •-1 1on Agency
Library, 1' ,
1 North V.MC. . j.- . i ,£
Chicago, Illinois 60'506
image:
 image:
 g. s
S S-
n j»
a n
a S
3 «
s G
S" ?!
X
M
?B
w
n
; tear off label,
1
n
g
3
-
o
rf
-<
0
e
a
o
3
0
a.
rs
1
O
ft
O
utinue receiving
3j
•T
ft
3-
3
ft'
E.
3
•a
0
n
%
O
K
B
a
3
g-
S
i-
above address.
H-
•*»
•<
o
c
•*
a
n
Wl
£R"
5'
n
0
3
o
t, please change
o
3
£r
rt
V
er
o
S
F
£
^)
M
o
-*,
-4t
o
p>
CD
c
0)
3
(t
01
01
p«
«[
<o'
3-
Z
0
3.
3"
O
V
i
o
5
IS
IO
>1
i3)
i
IO
a
o
c
r+
(t
00
CO
0
X
_^
_i
0)
I
$
•<
>J
p
^
A
0)
r+
11
O
•1
3
01
B
3
a
TJ
c
tr
0
2.
ions
O
A
3
ft
-^
rn
Z
<
7
O
z
2
m
Z
H
>
r
TJ
3
O
H
m
0
H
O
Z
G)
m
Z
o
CD
o
0
X
0)
13
ft
0
— •
p
Fourth-
O
0
0)
0)
3
2.
«
m
TJ
>
1
U
Q
OT
I
5
0
z
s
m
Z
i
i
0
z
i
i
n
o
a
H
g
PI
O
"t
R
a
2
g
w
image:
g. s
S S-
n j»
a n
a S
3 «
s G
S" ?!
X
M
?B
w
n
; tear off label,
1
n
g
3
-
o
rf
-<
0
e
a
o
3
0
a.
rs
1
O
ft
O
utinue receiving
3j
•T
ft
3-
3
ft'
E.
3
•a
0
n
%
O
K
B
a
3
g-
S
i-
above address.
H-
•*»
•<
o
c
•*
a
n
Wl
£R"
5'
n
0
3
o
t, please change
o
3
£r
rt
V
er
o
S
F
£
^)
M
o
-*,
-4t
o
p>
CD
c
0)
3
(t
01
01
p«
«[
<o'
3-
Z
0
3.
3"
O
V
i
o
5
IS
IO
>1
i3)
i
IO
a
o
c
r+
(t
00
CO
0
X
_^
_i
0)
I
$
•<
>J
p
^
A
0)
r+
11
O
•1
3
01
B
3
a
TJ
c
tr
0
2.
ions
O
A
3
ft
-^
rn
Z
<
7
O
z
2
m
Z
H
>
r
TJ
3
O
H
m
0
H
O
Z
G)
m
Z
o
CD
o
0
X
0)
13
ft
0
— •
p
Fourth-
O
0
0)
0)
3
2.
«
m
TJ
>
1
U
Q
OT
I
5
0
z
s
m
Z
i
i
0
z
i
i
n
o
a
H
g
PI
O
"t
R
a
2
g
w
image: