<pubnumber>600878017</pubnumber>
<title>Microbiological Methods for Monitoring the Environment Water and Wastes</title>
<pages>354</pages>
<pubyear>1978</pubyear>
<provider>NEPIS</provider>
<access>online</access>
<operator>mja</operator>
<scandate>05/18/16</scandate>
<origin>PDF</origin>
<type>single page tiff</type>
<keyword>agar water broth sample laboratory colonies test media fecal tubes sterile microbiological dilution mpn medium filter membrane plate count part</keyword>
<author>Bordner, Robert.; Winter, John A.; Scarpino, Pasquale. Bordner, Robert. ; Winter, John A. ; Scarpino, Pasquale. Environmental Monitoring and Support Laboratory, Cincinnati, Ohio. Environmental Monitoring and Support Laboratory (Cincinnati, Ohio)</author>
<publisher>Environmental Protection Agency, Office of Research and Development, Environmental Monitoring and Support Laboratory ;</publisher>
<subject>Water--Microbiology; Water--Waste; Sewage--Microbiology; Aquatic microbiology; Water analysis; Water quality; Manuals; Potable water; Law enforcement; Monitoring; Surface waters; Coliform bacteria; Feces; Streptococcus; Salmonella; Actinomycetales; Culture media; Counting; Indicator organisms; Laboratory equipment; Enterobacteriaceae; Safety </subject>
<abstract>This first EPA manual contains uniform laboratory and field methods for microbiological analyses of waters and wastewaters, and is recommended in enforcement, monitoring and research activities. The procedures are prepared in detailed, stepwise form for the bench worker. The manual covers coliform, fecal coliform, fecal streptococci, Salmonella, actinomycetes, and Standard Plate Count organisms with the necessary support sections on sampling, equipment, media, basic techniques, safety, and quality assurance. </abstract>
EPA-600/8-78-017
December 1978
MICROBIOLOGICAL METHODS FOR MONITORING
THE ENVIRONMENT
Wafer and Wastes
Edited by
Robert Bordner and John Winter
Environmental Monitoring and Support Laboratory-Cincinnati
Cincinnati, Ohio 45268
and Pasquale Scarpino, University of Cincinnati
Cincinnati, Ohio 45219
Prepared in part under EPA Contract No, 68-03-0431
Project Officer
John Winter
Environmental Monitoring and Support Laboratory
Cincinnati, Ohio 45268
ENVIRONMENTAL MONITORING AND SUPPORT LABORATORY
OFFICE OF RESEARCH AND DEVELOPMENT
U.S. ENVIRONMENTAL PROTECTION AGENCY
CINCINNATI, OHIO 45268
s/Q Printed on Recycled Paper
image:
 DISCLAIMER
This report has been reviewed by the Environmental Monitoring and Support Laboratory-
Cincinnati, U.S. Environmental Protection Agency and approved for publication. Mention of trade
names or commercial products does not constitute endorsement or recommendation for use.
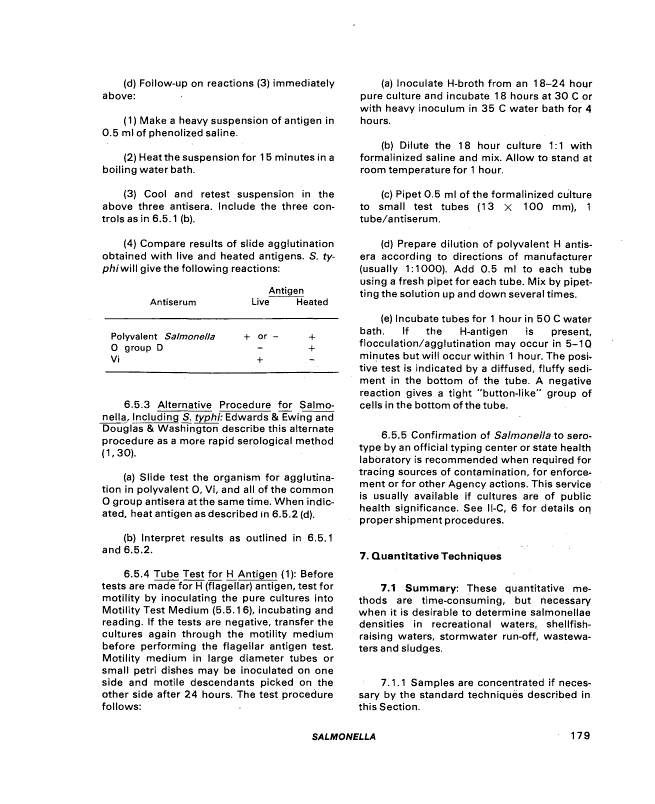
MICROBIOLOGICAL MANUAL 1978
image:
DISCLAIMER
This report has been reviewed by the Environmental Monitoring and Support Laboratory-
Cincinnati, U.S. Environmental Protection Agency and approved for publication. Mention of trade
names or commercial products does not constitute endorsement or recommendation for use.
MICROBIOLOGICAL MANUAL 1978
image:
 FOREWORD
Environmental measurements are required to determine the quality of ambient waters and the
Character of waste effluents. The Environmental Monitoring and Support Laboratory (EMSL^—
Cincinnati conducts research to: • • ••'*•'•
* Develop and evaluate techniques to measure the presence and concentration of
physical, chemical, and radiological pollutants in water, wastewater, bottom
sediments, and solid waste.
* Investigate methods for the concentration, recovery, and identification of viruses,
bacteria and other microorganisms in water.
* Conduct studies to determine the responses of aquatic organisms to water quality.
• Conduct an Agency-wide quality assurance program to assure standardization and
quality control of systems for monitoring water and wastewater.
This publication of EMSL-Cincinnati, contains the methods selected by consensus of EPA
senior microbiologists for parameters of interest to the Agency. Federal agencies, states,
municipalities, universities, private laboratories, and industry should find this manual of assistanpe
in monitoring and controlling microbiological pollution in the environment.
DwightG. Ballinger
Director, EMSL-Cincinnati
image:
FOREWORD
Environmental measurements are required to determine the quality of ambient waters and the
Character of waste effluents. The Environmental Monitoring and Support Laboratory (EMSL^—
Cincinnati conducts research to: • • ••'*•'•
* Develop and evaluate techniques to measure the presence and concentration of
physical, chemical, and radiological pollutants in water, wastewater, bottom
sediments, and solid waste.
* Investigate methods for the concentration, recovery, and identification of viruses,
bacteria and other microorganisms in water.
* Conduct studies to determine the responses of aquatic organisms to water quality.
• Conduct an Agency-wide quality assurance program to assure standardization and
quality control of systems for monitoring water and wastewater.
This publication of EMSL-Cincinnati, contains the methods selected by consensus of EPA
senior microbiologists for parameters of interest to the Agency. Federal agencies, states,
municipalities, universities, private laboratories, and industry should find this manual of assistanpe
in monitoring and controlling microbiological pollution in the environment.
DwightG. Ballinger
Director, EMSL-Cincinnati
image:
 PREFACE
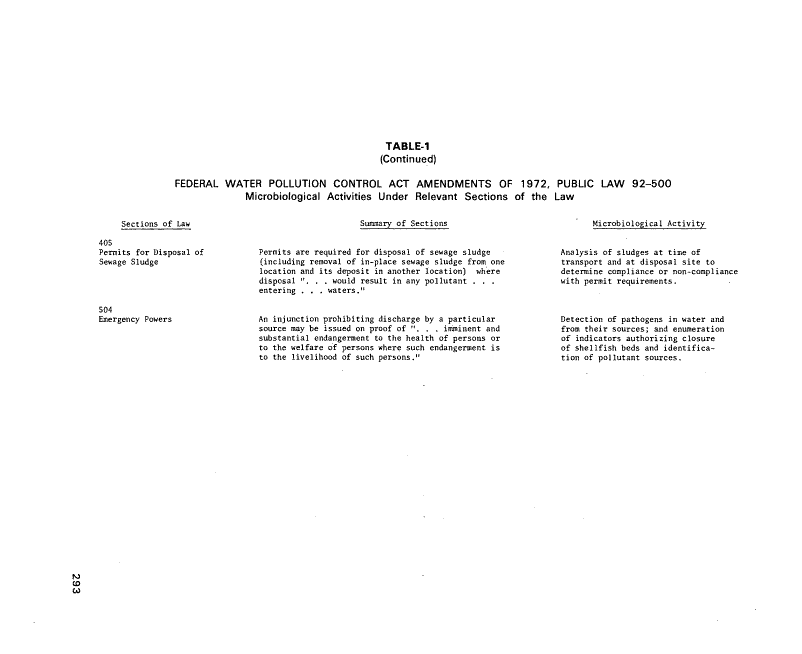
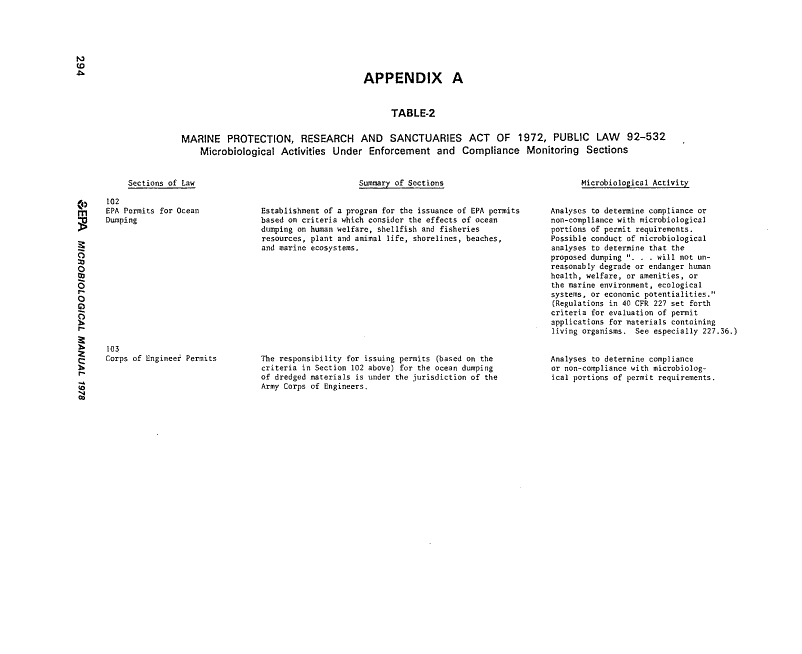
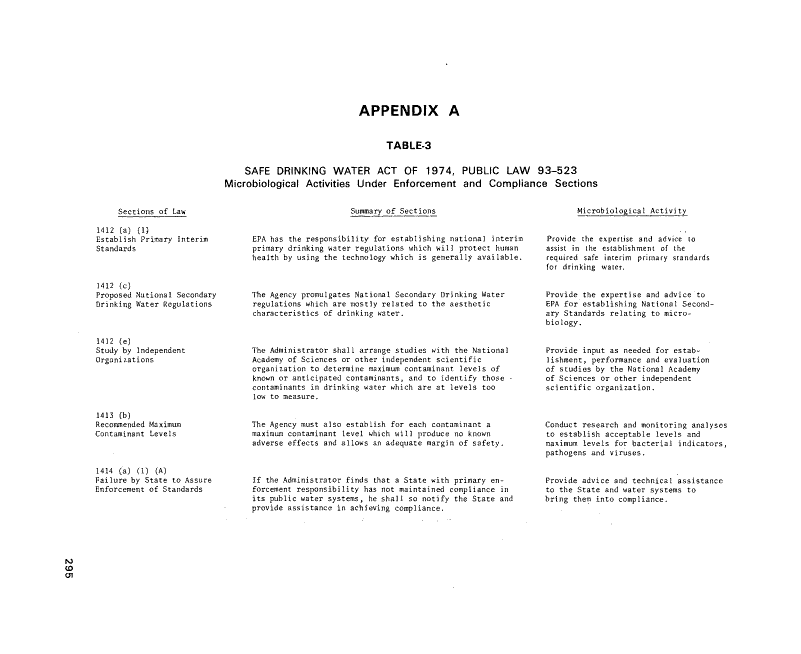
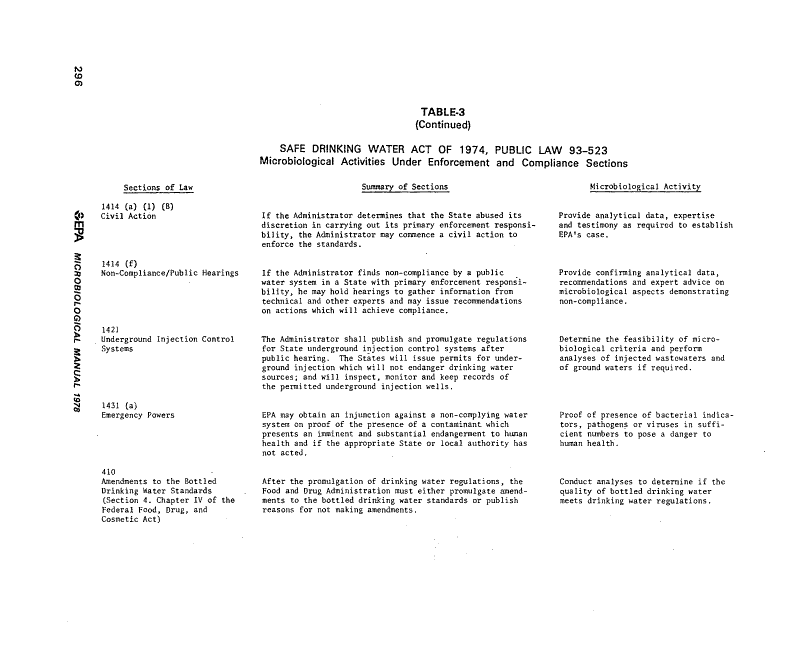
The Federal Water Pollution Control Act Amendments of 1972, the Marine Protection,
Research, and Sanctuaries Act of 1972, and the Safe Drinking Water Act of 1974, require that EPA
develop and select methods for environmental monitoring and research on public and private
water supplies, rivers, lakes, ground waters, wastewaters and the marine environment for the
purposes of setting and enforcing environmental standards and ultimately enhancing the quality of
the environment. This manual of methodology supports these needs.
Under the direction of a Steering Committee formed for the development of an Agency
microbiology manual, a seminar was held among representative Agency microbiologists in San
Francisco, January, 1973. Assignments were made to committee members for the preparation of
first draft material. The basic design, format and content of the manual, were established and the
first drafts presented and reviewed at the second meeting of the Committee in January, 1974 at
Cincinnati.
The drafts submitted by the Steering Committee members were formatted and developed into
the initial version under EPA Contract No. 68-03-0431 by Dr. Pasquale Scarpino, Professor of
Environmental Engineering, Department of Civil and Environmental Engineering, University of
Cincinnati, working with the two EPA editors: Robert Bordner, Chief Microbiology Section,
Biological Methods Branch and John Winter, Chief, Quality Assurance Branch, both of EMSL-
Cincinnati. Subsquently, these editors added technical detail and the necessary information
reflecting Agency policies. Valuable source documents for This Manual were Current Practices in
Water Microbiology, National Training and Operational Technology Center and Handbook for
Evaluating Water Bacteriological Laboratories, Municipal Environmental Research Center, both of
U.S. EPA, Cincinnati, Ohio. The refined product is presented here.
Comments or questions concerning the manual should be directed to:
Robert Bordner or John Winter
U.S. Environmental Protection Agency
EMSC-Cincinnati
Cincinnati, OH 45268
<SER*\ MICROBIOLOGICAL MANUAL 1978
image:
PREFACE
The Federal Water Pollution Control Act Amendments of 1972, the Marine Protection,
Research, and Sanctuaries Act of 1972, and the Safe Drinking Water Act of 1974, require that EPA
develop and select methods for environmental monitoring and research on public and private
water supplies, rivers, lakes, ground waters, wastewaters and the marine environment for the
purposes of setting and enforcing environmental standards and ultimately enhancing the quality of
the environment. This manual of methodology supports these needs.
Under the direction of a Steering Committee formed for the development of an Agency
microbiology manual, a seminar was held among representative Agency microbiologists in San
Francisco, January, 1973. Assignments were made to committee members for the preparation of
first draft material. The basic design, format and content of the manual, were established and the
first drafts presented and reviewed at the second meeting of the Committee in January, 1974 at
Cincinnati.
The drafts submitted by the Steering Committee members were formatted and developed into
the initial version under EPA Contract No. 68-03-0431 by Dr. Pasquale Scarpino, Professor of
Environmental Engineering, Department of Civil and Environmental Engineering, University of
Cincinnati, working with the two EPA editors: Robert Bordner, Chief Microbiology Section,
Biological Methods Branch and John Winter, Chief, Quality Assurance Branch, both of EMSL-
Cincinnati. Subsquently, these editors added technical detail and the necessary information
reflecting Agency policies. Valuable source documents for This Manual were Current Practices in
Water Microbiology, National Training and Operational Technology Center and Handbook for
Evaluating Water Bacteriological Laboratories, Municipal Environmental Research Center, both of
U.S. EPA, Cincinnati, Ohio. The refined product is presented here.
Comments or questions concerning the manual should be directed to:
Robert Bordner or John Winter
U.S. Environmental Protection Agency
EMSC-Cincinnati
Cincinnati, OH 45268
<SER*\ MICROBIOLOGICAL MANUAL 1978
image:
 TABLE OF CONTENTS
Page
Foreword iii
Preface iv
Figures vii
Tables x
Acknowledgements xv
PART I INTRODUCTION 1
PART II GENERAL OPERATIONS
A. Sample Collection, Preservation and Storage 5
B. Laboratory Equipment, Techniques and Media 32
C. Isolation and Enumeration of Bacteria 59
D. Selection of Analytical Methods 91
PART III ANALYTICAL METHODOLOGY
A. Standard Plate Count , 101
B. Total Coliforms 108
C. Fecal Coliforms 124
D. Fecal Streptococci 135
E. Salmonella. 154
F. Actinomycetes 186
PART IV QUALITY CONTROL
A. Laboratory Operations 194
B. Statistics for Microbiology 225
C. Analytical Quality Control Procedures 231
PART V LABORATORY MANAGEMENT
A. Development of a Quality Control Program 244
B. Manpower and Analytical Costs 246
C. Safety 259
D. Legal Considerations 277
image:
TABLE OF CONTENTS
Page
Foreword iii
Preface iv
Figures vii
Tables x
Acknowledgements xv
PART I INTRODUCTION 1
PART II GENERAL OPERATIONS
A. Sample Collection, Preservation and Storage 5
B. Laboratory Equipment, Techniques and Media 32
C. Isolation and Enumeration of Bacteria 59
D. Selection of Analytical Methods 91
PART III ANALYTICAL METHODOLOGY
A. Standard Plate Count , 101
B. Total Coliforms 108
C. Fecal Coliforms 124
D. Fecal Streptococci 135
E. Salmonella. 154
F. Actinomycetes 186
PART IV QUALITY CONTROL
A. Laboratory Operations 194
B. Statistics for Microbiology 225
C. Analytical Quality Control Procedures 231
PART V LABORATORY MANAGEMENT
A. Development of a Quality Control Program 244
B. Manpower and Analytical Costs 246
C. Safety 259
D. Legal Considerations 277
image:
 APPENDICES
A. Microbiological Activities under the Water Laws 289
B. Certification of Water Supply Laboratories 297
C. Bibliography 324
INDEX 325
Vi oV MICROBIOLOGICAL MANUAL 1978
image:
APPENDICES
A. Microbiological Activities under the Water Laws 289
B. Certification of Water Supply Laboratories 297
C. Bibliography 324
INDEX 325
Vi oV MICROBIOLOGICAL MANUAL 1978
image:
 FIGURES
Number Page
Il-A-1 Suggested Sample Containers 7
II-A-2 Demonstration of Technique Used in Grab Sampling of Surface
Waters 9
II-A-3 Weighted Bottle Frame and Sample Bottle for Grab Sampling 10
II-A-4 Zobell J-Z Sampler,.,,.. , ,. 11
ll-A-5 Niskin Depth Sampler 12
II-A-6 New York State Dept of Health Depth Sampler 13
ll-A-7 Kemmerer Depth Sampler 15
II-A-8 Van Donsel-Geldreich Sediment Sampler 16
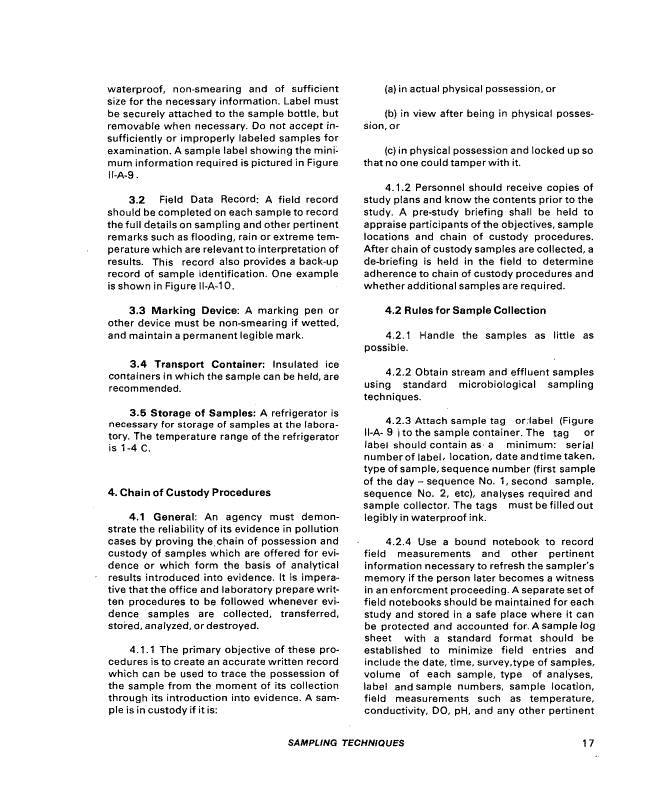
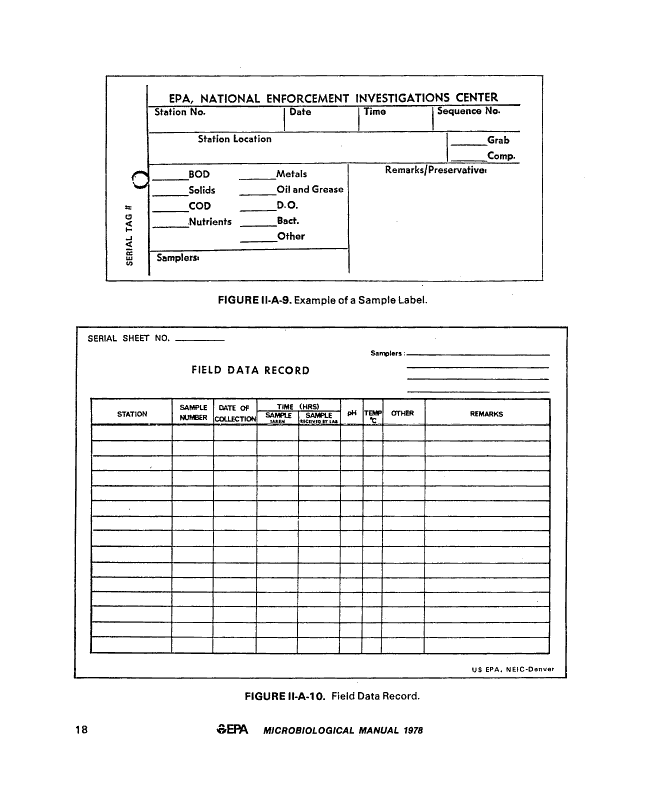
ll-A-9 Example of a Sample Label 18
M-A-10 Field Data Record 18
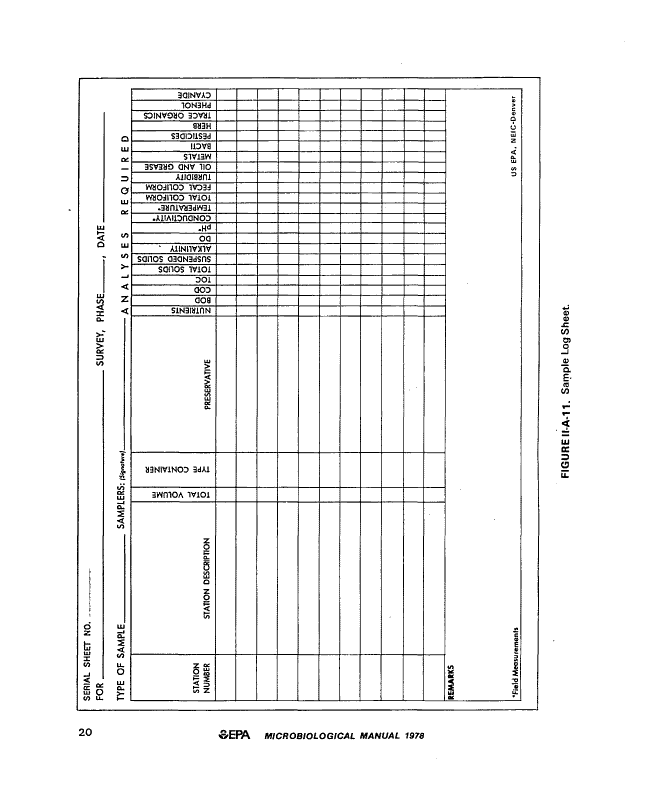
II-A-11 Sample Log Sheet 20
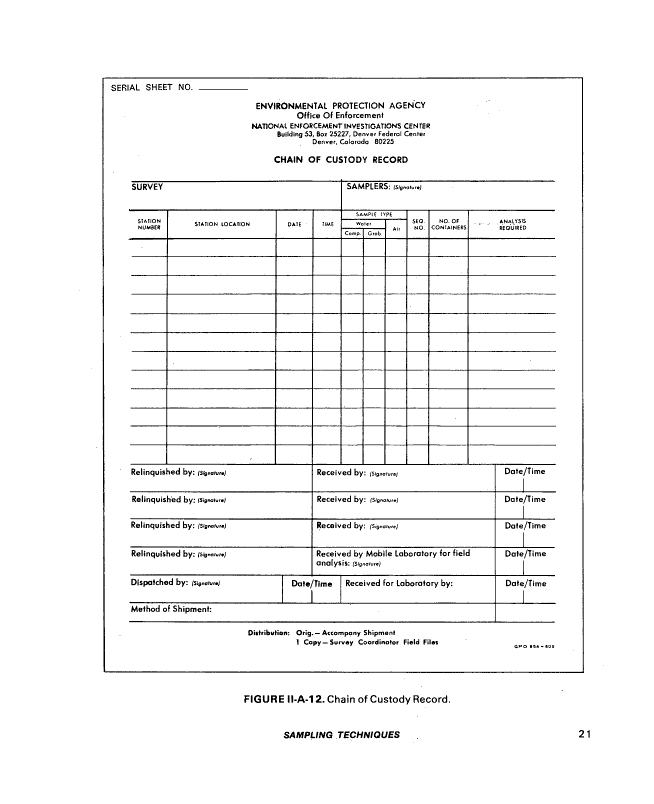
II-A-12 Chain of Custody Record..., 21
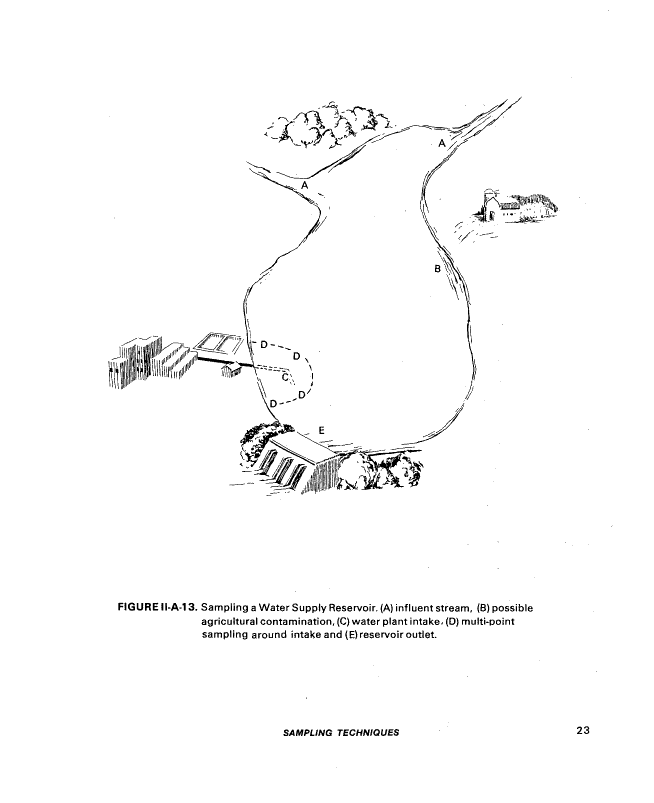
II-A-13 Sampling a Water Supply Reservoir 23
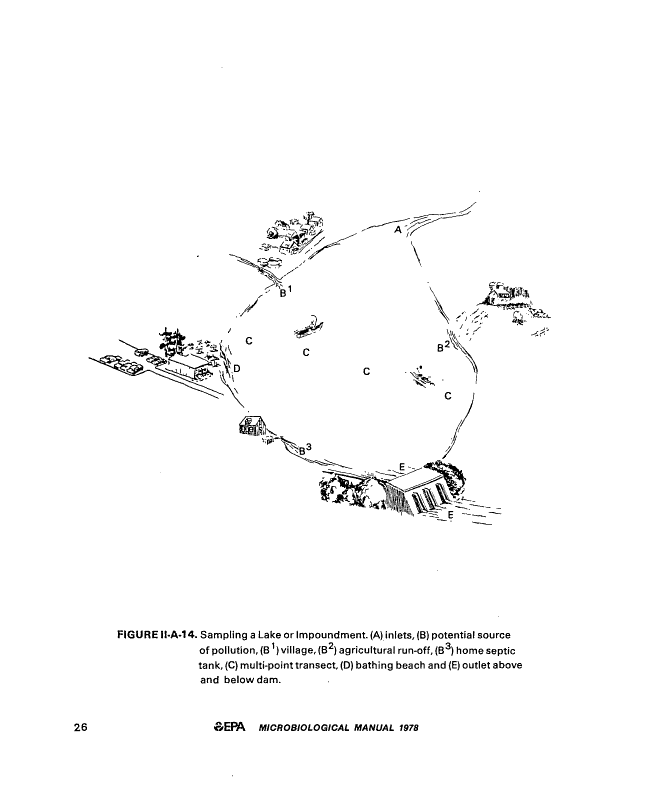
II-A-14 Sampling a Lake or Impoundment 26
II-A-15 Sampling a Large Stream 27
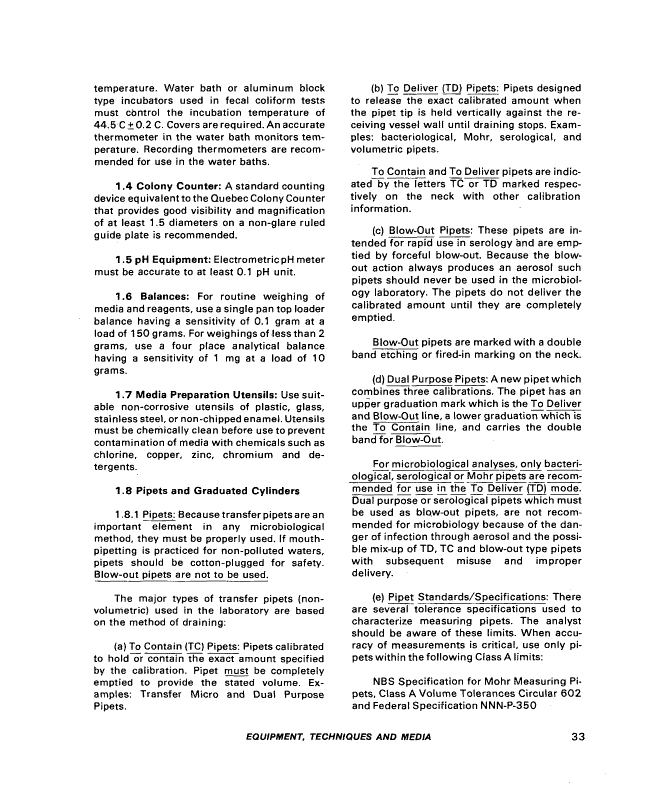
II-B-1 Finger-mounted Pipetting Device.. 35
ll-B-2 Enlargement of Pipetting Device Tip 35
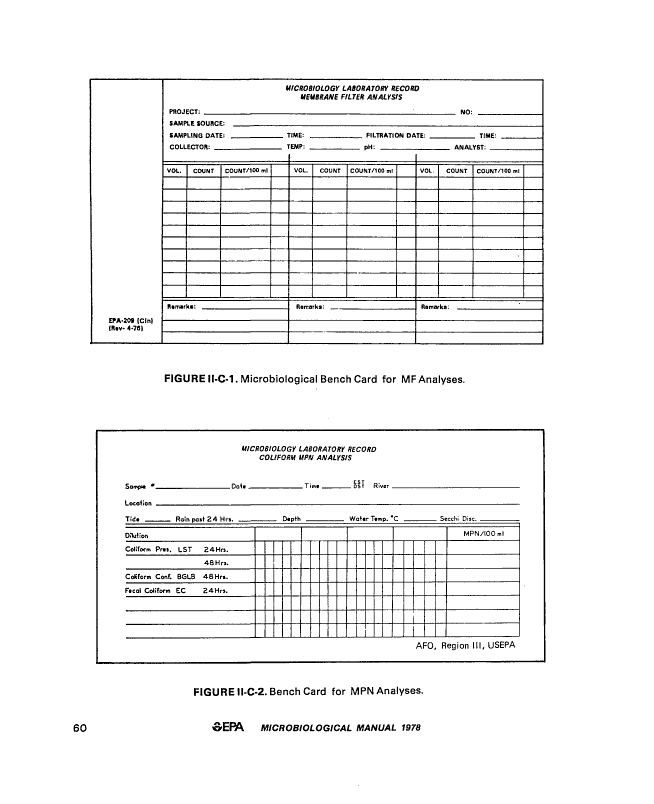
ll-C-1 Microbiological Bench Cards for MF Analyses 60
ll-C-2 Bench Cards for MPN Analyses 60
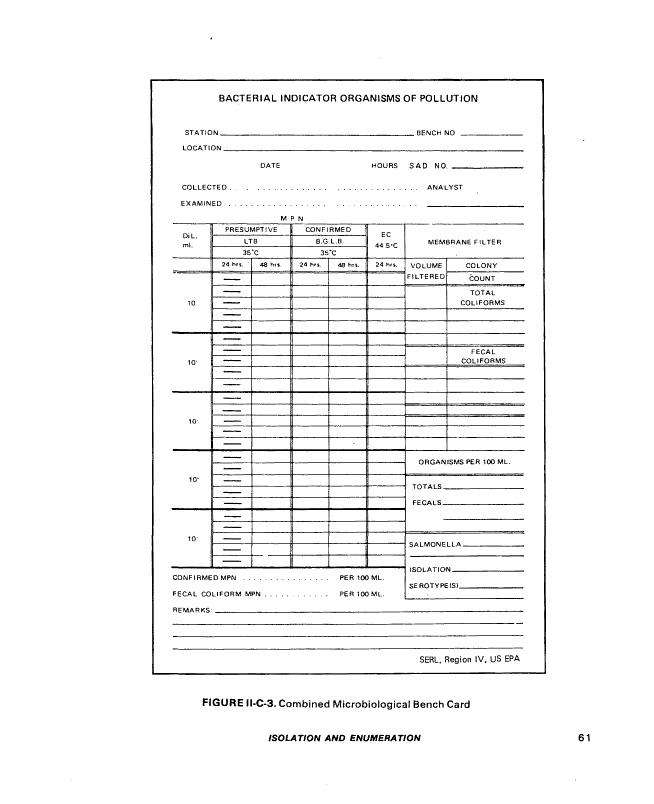
II-C-3 Combined Microbiological Bench Card 61
vii
image:
FIGURES
Number Page
Il-A-1 Suggested Sample Containers 7
II-A-2 Demonstration of Technique Used in Grab Sampling of Surface
Waters 9
II-A-3 Weighted Bottle Frame and Sample Bottle for Grab Sampling 10
II-A-4 Zobell J-Z Sampler,.,,.. , ,. 11
ll-A-5 Niskin Depth Sampler 12
II-A-6 New York State Dept of Health Depth Sampler 13
ll-A-7 Kemmerer Depth Sampler 15
II-A-8 Van Donsel-Geldreich Sediment Sampler 16
ll-A-9 Example of a Sample Label 18
M-A-10 Field Data Record 18
II-A-11 Sample Log Sheet 20
II-A-12 Chain of Custody Record..., 21
II-A-13 Sampling a Water Supply Reservoir 23
II-A-14 Sampling a Lake or Impoundment 26
II-A-15 Sampling a Large Stream 27
II-B-1 Finger-mounted Pipetting Device.. 35
ll-B-2 Enlargement of Pipetting Device Tip 35
ll-C-1 Microbiological Bench Cards for MF Analyses 60
ll-C-2 Bench Cards for MPN Analyses 60
II-C-3 Combined Microbiological Bench Card 61
vii
image:
 II-C-4 Preparation of Decimal Dilution 63
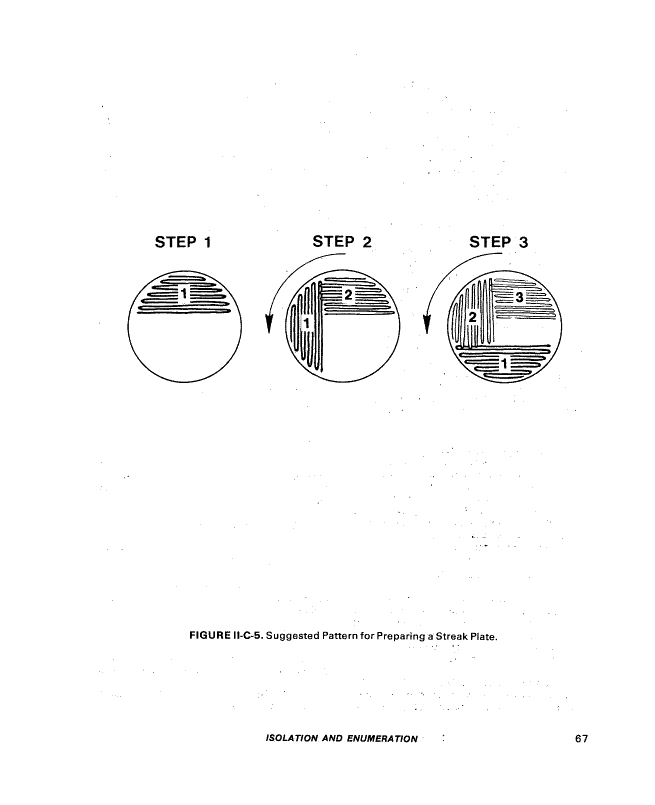
ll-C-5 Suggested Pattern'for Preparing a Streak Plate , 67
1I-C-6 Membrane Filtration Units Made by Various Manufacturers for
Detection of Bacteria in Aqueous Suspensions ,..„ 72
II-C-7 Exploded View of a Stainless Steel Membrane Filtration Unit 73
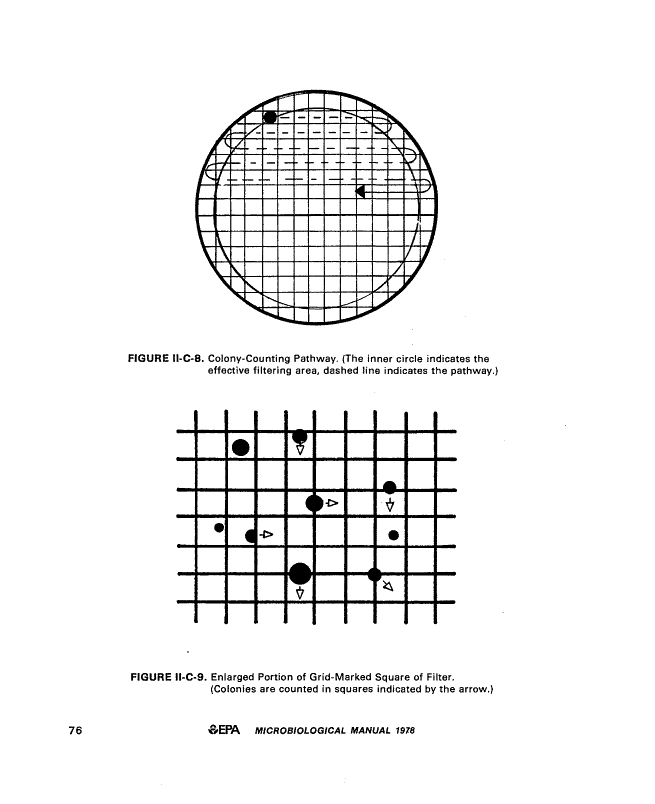
ll-C-8 Colony Counting Pathway 76
ll-C-9 Enlarged Portion of Grid-Marked Square of Filter , 76
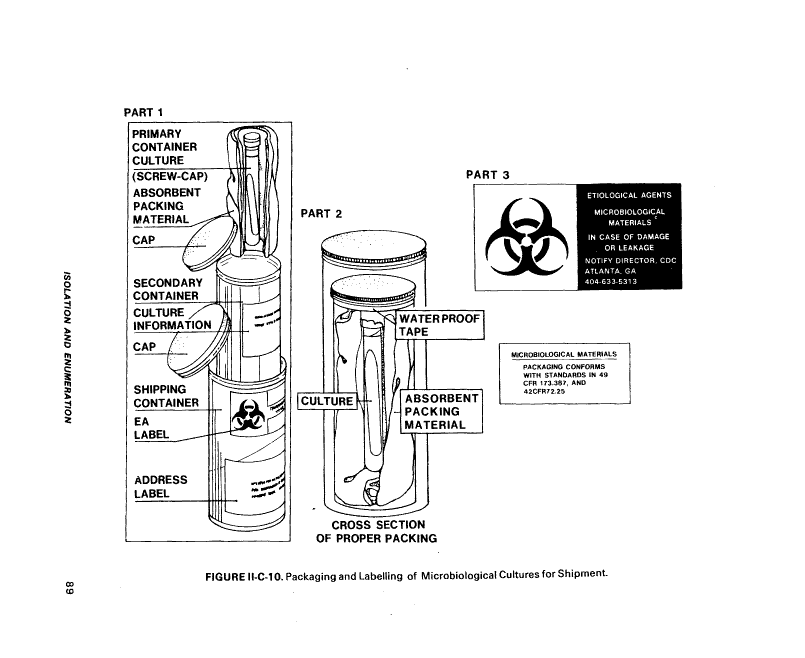
II-C-10 Packaging and Labelling of Microbiological Cultures for
Shipment „ , ..,.. 89
III-A-1 Typical Dilution Series for Standard Plate Count , 103
HI-B-1 Verification of Total Coliform Colonies on the Membrane Filter 115
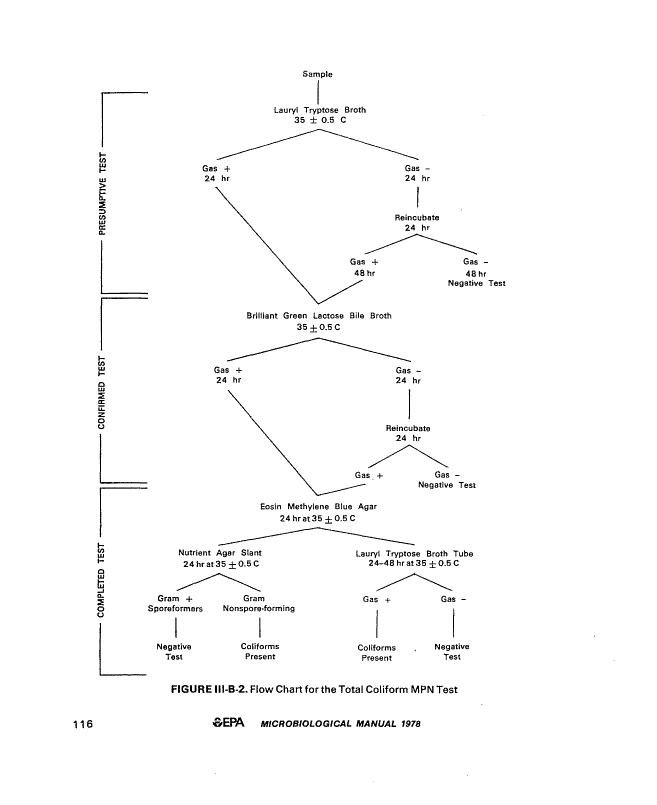
III-B-2 Flow Chart for the Total Coliform MPN Test...., , 116
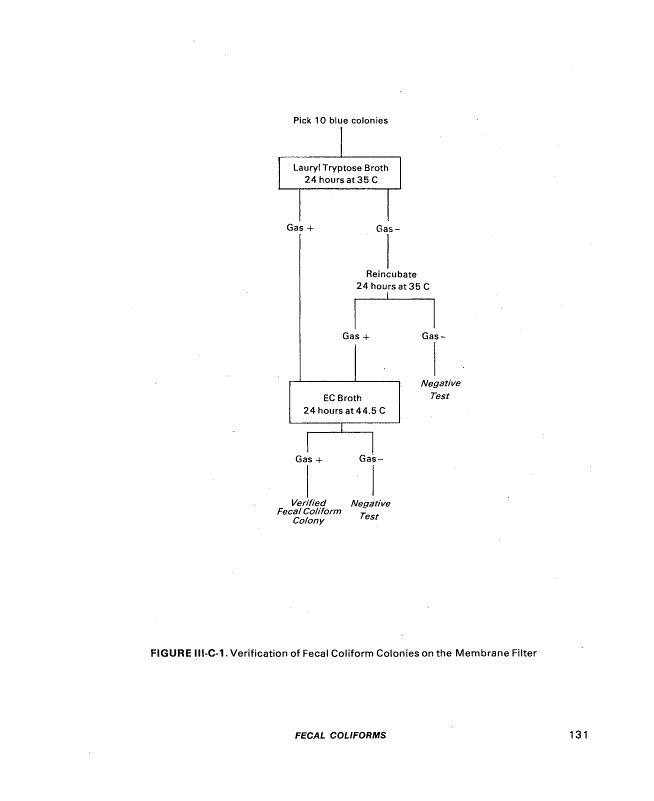
lll-C-1 Verification of Fecal Coliform Colonies on the Membrane Filter.... 131
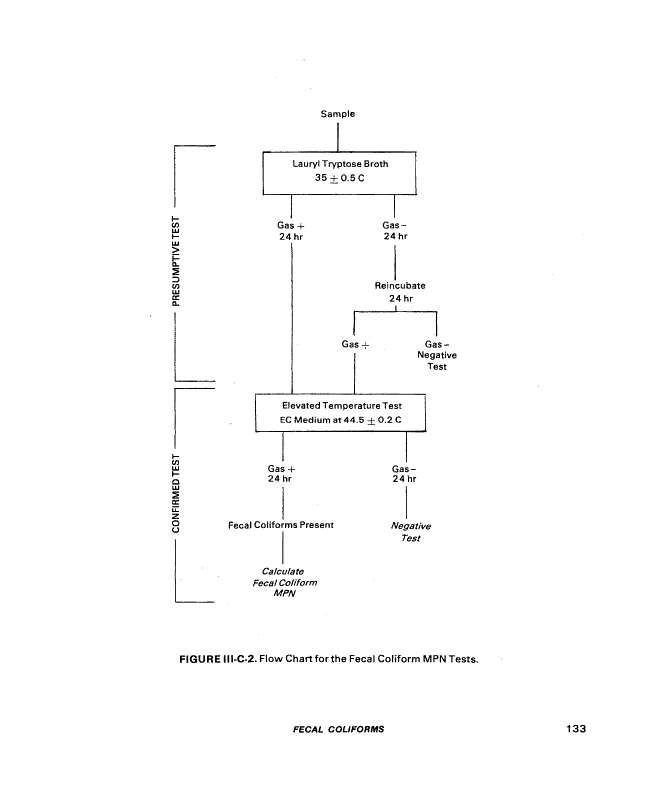
lll-C-2 Flow Chart for the Fecal Coliform MPN Test , 133
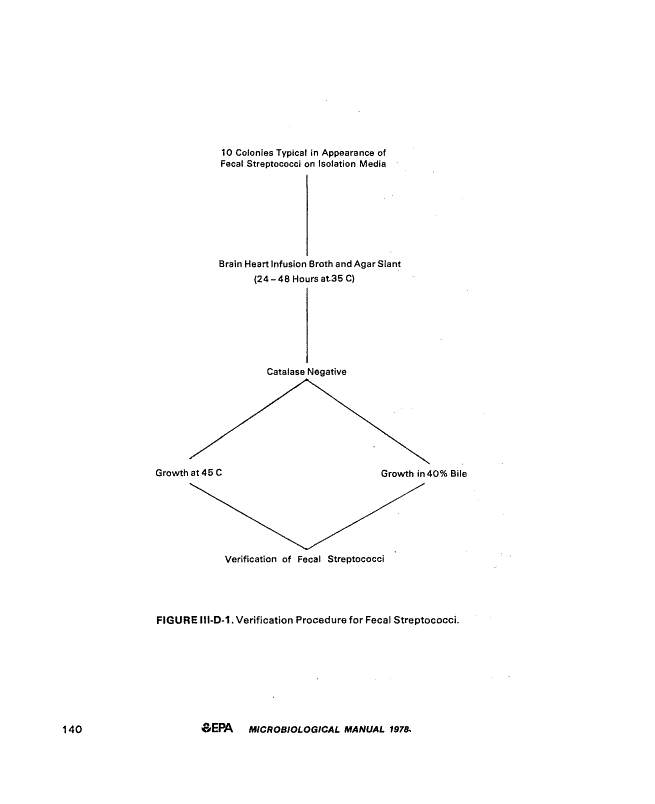
lll-D-1 Verification Procedure for Fecal Streptococci ; , ,,..,...,. 140
lll-D-2 Isolation and Identification of Fecal Streptococcci, General
Scheme , 141
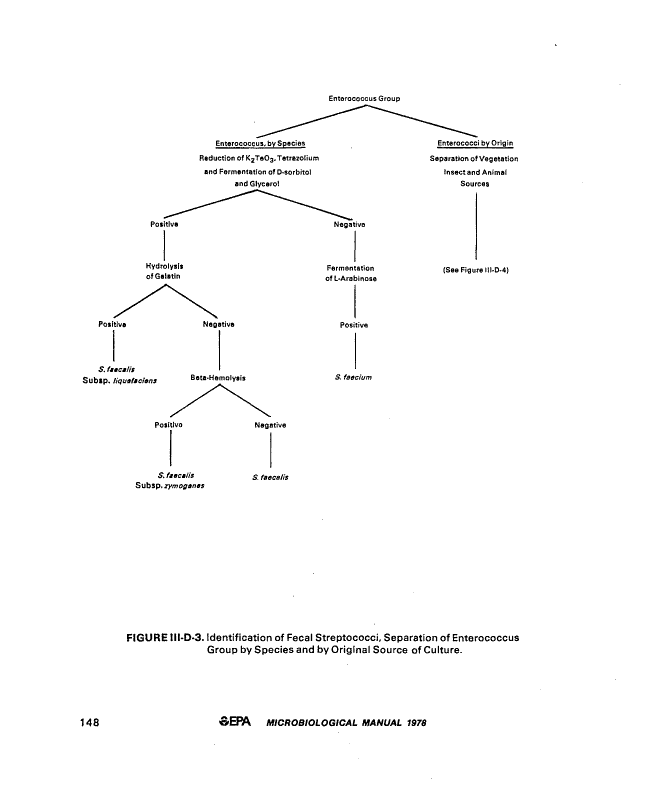
III-D-3 Identification of Fecal Streptococci, Separation of Enterococcus
Group by Species and by Original Source of Culture ,.,... 148
Ill-D-4 Identification of Fecal Streptococci, Separation of Enterococci
from Vegetation, Insect and Animal Sources.. 151
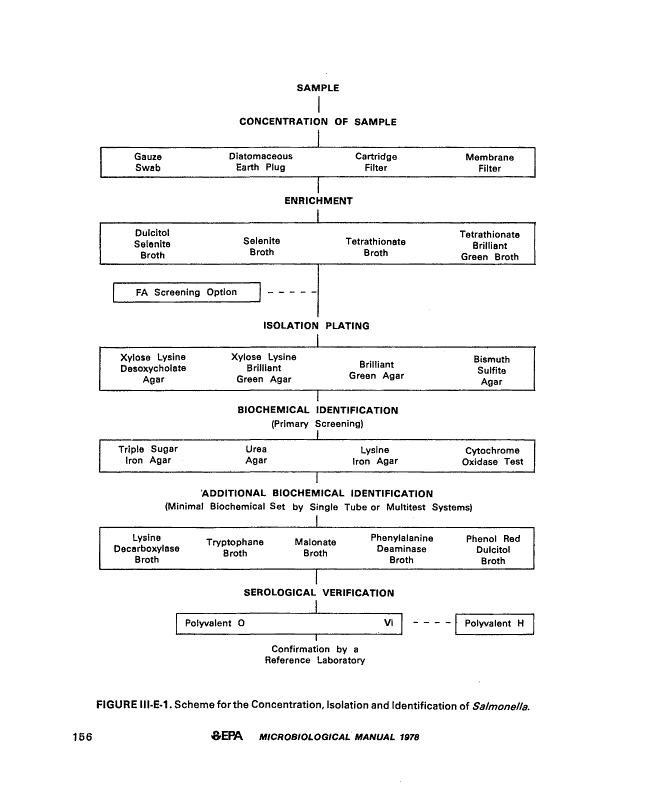
lll-E-1 Scheme for the Concentration, Isolation and Identification of
Salmonella ,..,.,.»...„ 156
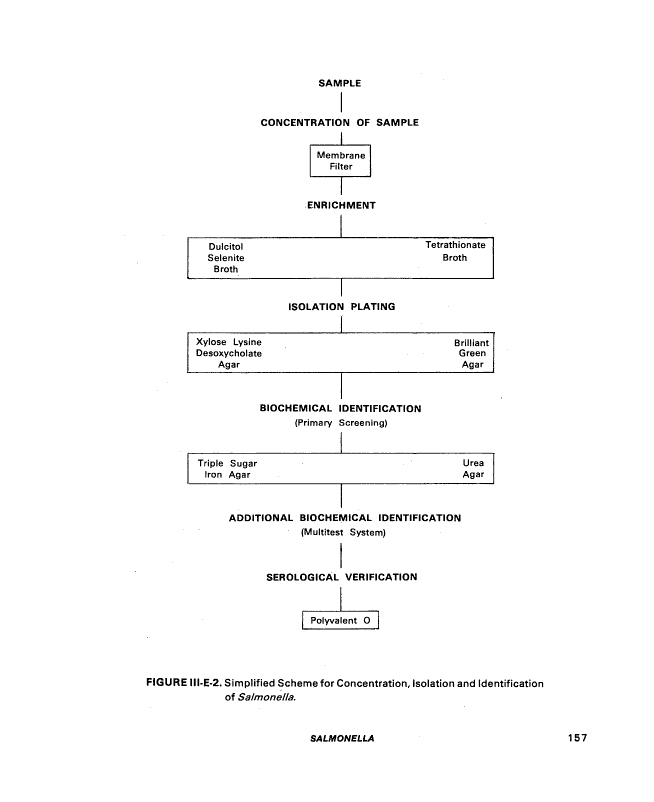
lll-E-2 Simplified Scheme for Concentration, Isolation and Identification
of Salmonella..., 157
lll-E-3 Dimensions of the Gauze Swabs 158
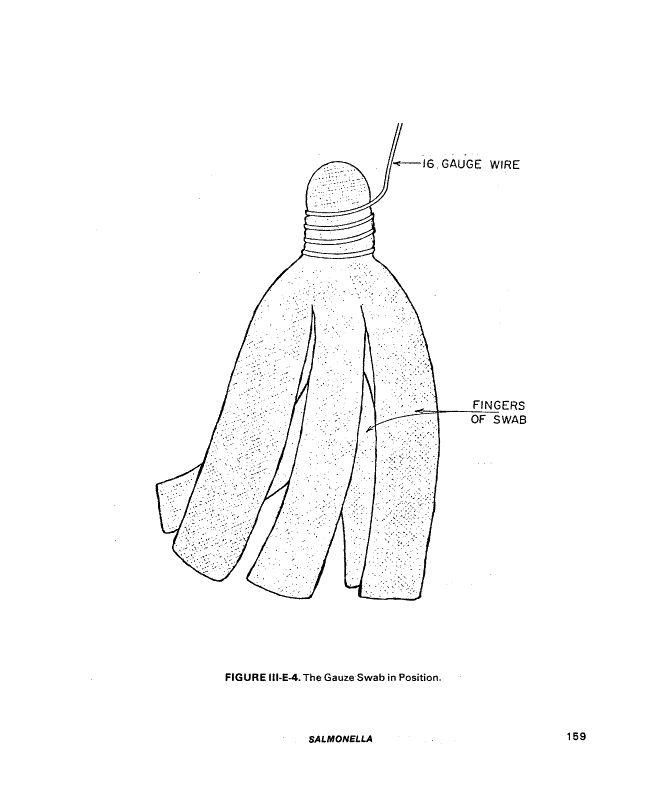
IH-E-4 The Gauze Swab in Position , , 159
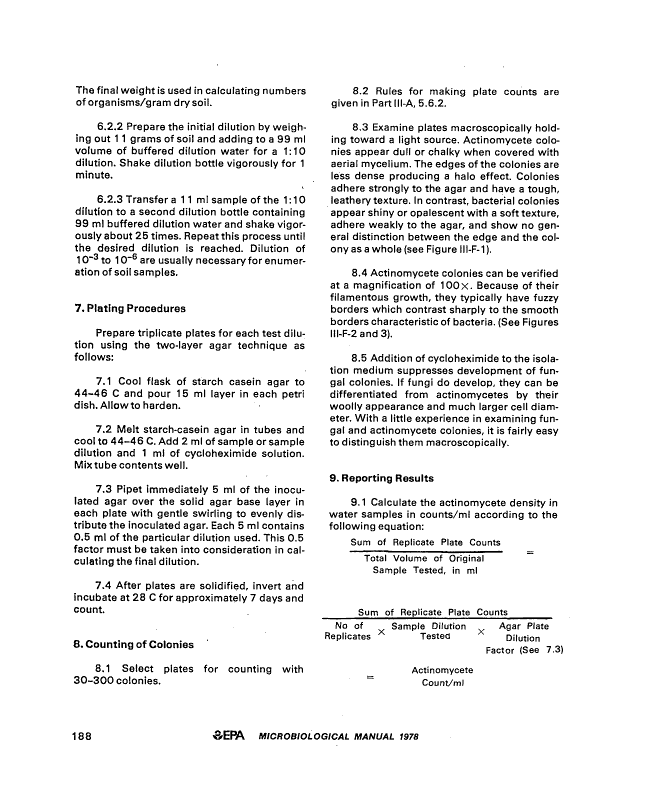
III-F-1 A Plate Containing Bacterial and Actinornycete Colonies., ,,.. 189
Vlii ©EPA MICROBIOLOGICAL MANUAL 1978
image:
II-C-4 Preparation of Decimal Dilution 63
ll-C-5 Suggested Pattern'for Preparing a Streak Plate , 67
1I-C-6 Membrane Filtration Units Made by Various Manufacturers for
Detection of Bacteria in Aqueous Suspensions ,..„ 72
II-C-7 Exploded View of a Stainless Steel Membrane Filtration Unit 73
ll-C-8 Colony Counting Pathway 76
ll-C-9 Enlarged Portion of Grid-Marked Square of Filter , 76
II-C-10 Packaging and Labelling of Microbiological Cultures for
Shipment „ , ..,.. 89
III-A-1 Typical Dilution Series for Standard Plate Count , 103
HI-B-1 Verification of Total Coliform Colonies on the Membrane Filter 115
III-B-2 Flow Chart for the Total Coliform MPN Test...., , 116
lll-C-1 Verification of Fecal Coliform Colonies on the Membrane Filter.... 131
lll-C-2 Flow Chart for the Fecal Coliform MPN Test , 133
lll-D-1 Verification Procedure for Fecal Streptococci ; , ,,..,...,. 140
lll-D-2 Isolation and Identification of Fecal Streptococcci, General
Scheme , 141
III-D-3 Identification of Fecal Streptococci, Separation of Enterococcus
Group by Species and by Original Source of Culture ,.,... 148
Ill-D-4 Identification of Fecal Streptococci, Separation of Enterococci
from Vegetation, Insect and Animal Sources.. 151
lll-E-1 Scheme for the Concentration, Isolation and Identification of
Salmonella ,..,.,.»...„ 156
lll-E-2 Simplified Scheme for Concentration, Isolation and Identification
of Salmonella..., 157
lll-E-3 Dimensions of the Gauze Swabs 158
IH-E-4 The Gauze Swab in Position , , 159
III-F-1 A Plate Containing Bacterial and Actinornycete Colonies., ,,.. 189
Vlii ©EPA MICROBIOLOGICAL MANUAL 1978
image:
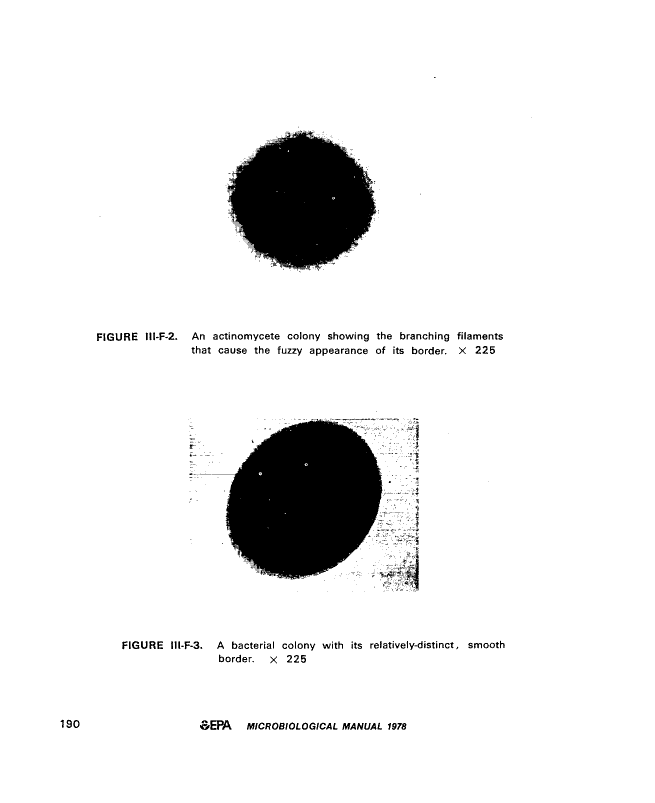
 lll-F-2 An Actinomycete Colony Showing the Branching Filaments that
Cause the Fuzzy Appearance of its Border 190
lll-F-3 A Bacterial Colony with its Relatively-Distinct, Smooth Border 190
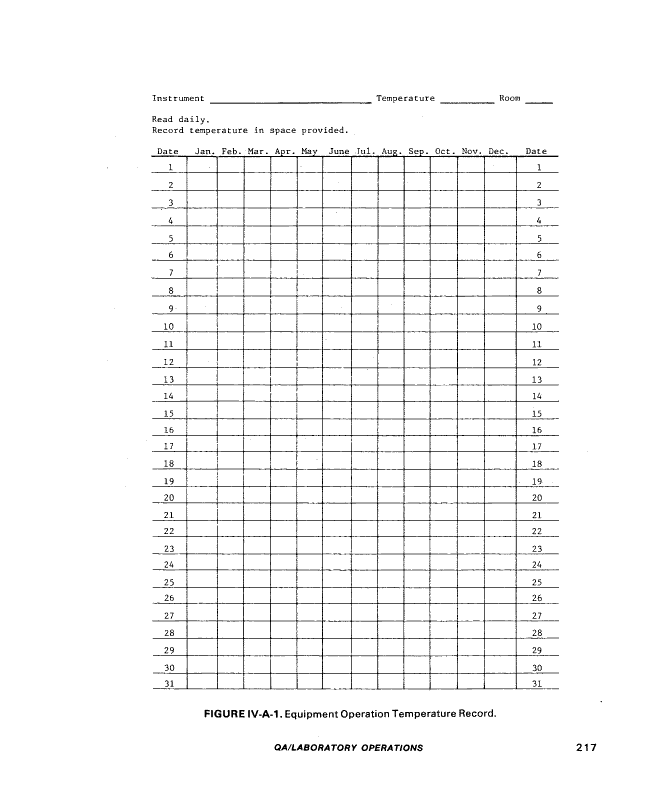
IV-A-1 Equipment Operation Temperature Record 217
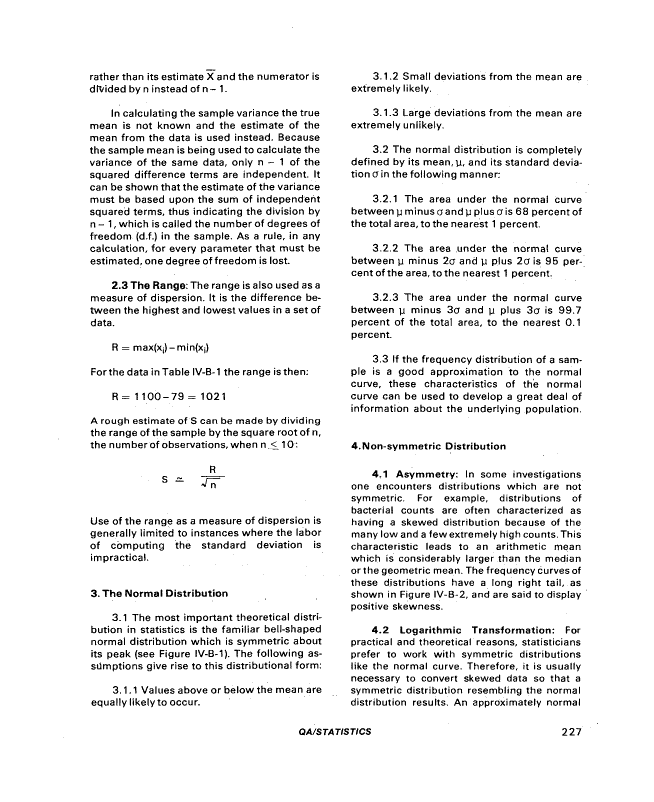
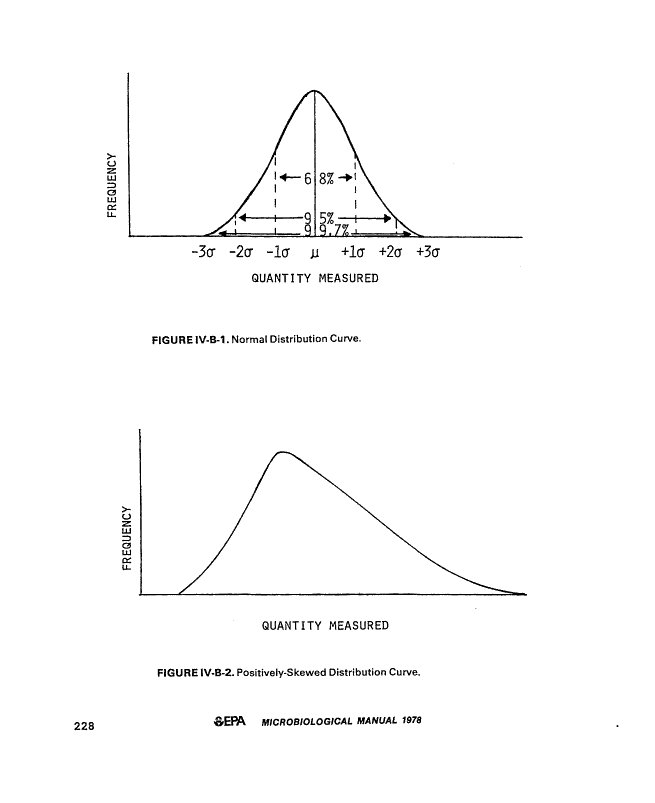
IV-B-1 Normal Distribution Curve 228
IV-B-2 Positively-Skewed Distribution Curve 228
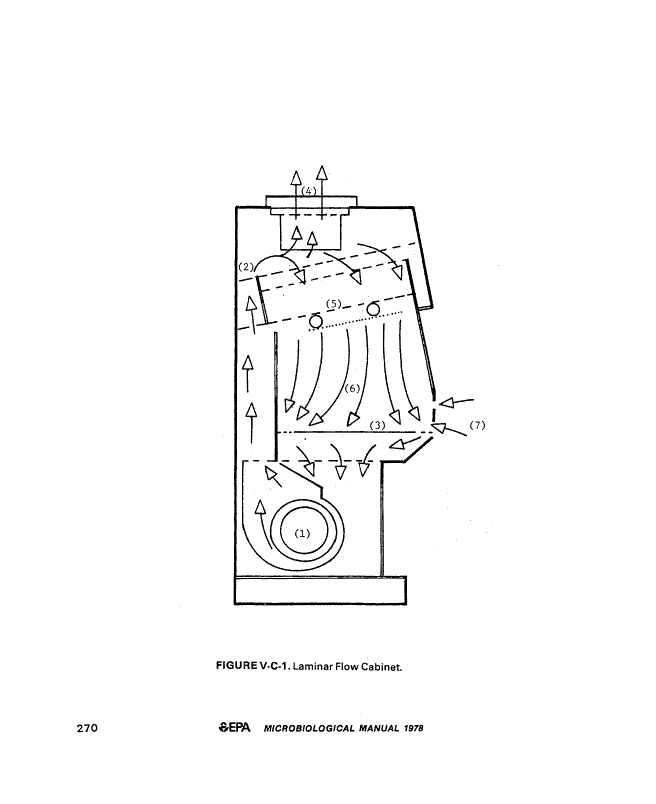
V-C-1 Laminar Flow Cabinet 270
V-C-2 Example of Biohazard Sign... ..„ 271
IX
image:
lll-F-2 An Actinomycete Colony Showing the Branching Filaments that
Cause the Fuzzy Appearance of its Border 190
lll-F-3 A Bacterial Colony with its Relatively-Distinct, Smooth Border 190
IV-A-1 Equipment Operation Temperature Record 217
IV-B-1 Normal Distribution Curve 228
IV-B-2 Positively-Skewed Distribution Curve 228
V-C-1 Laminar Flow Cabinet 270
V-C-2 Example of Biohazard Sign... ..„ 271
IX
image:
 TABLES
Number ' Page
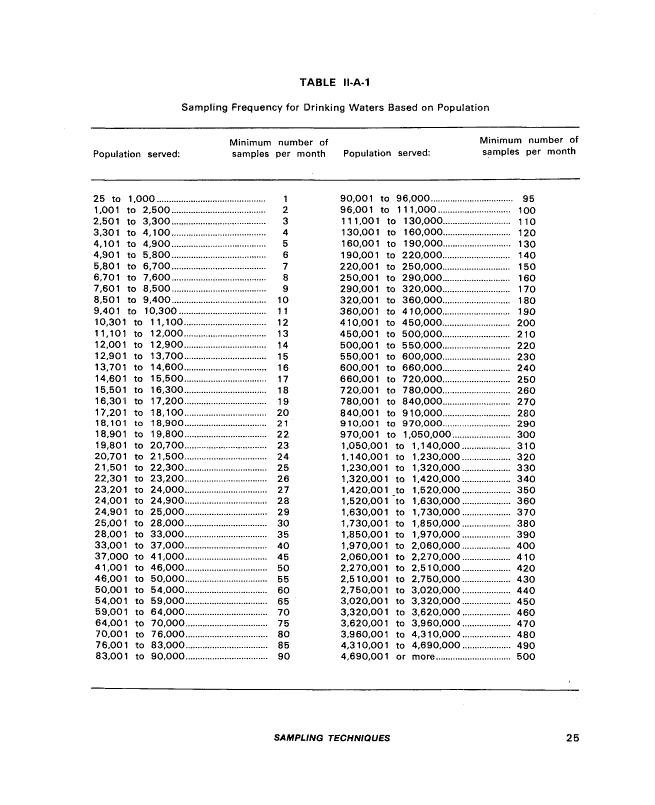
ll-A-1 Sampling Frequency Based on Population 25
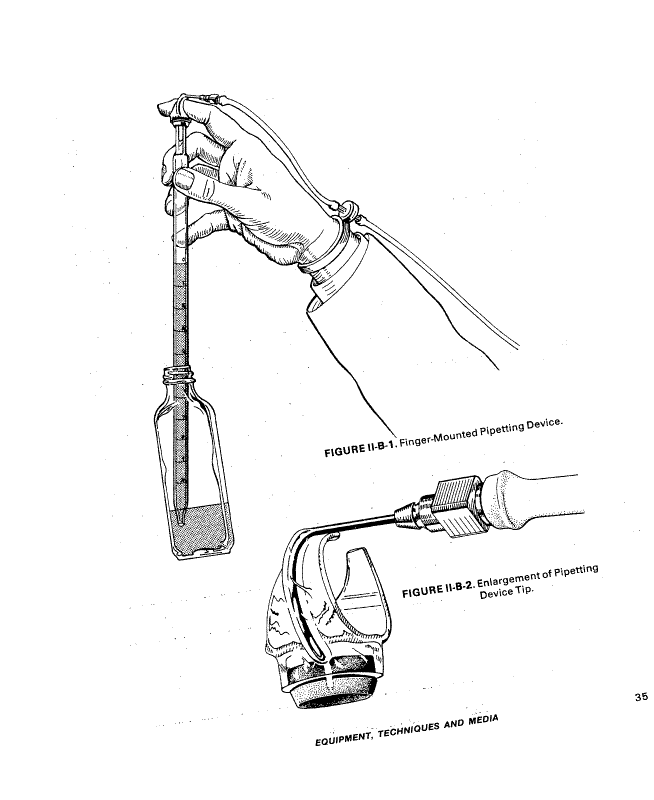
H-B-1 Relationship of Steam Pressure to Temperature in the Autoclave. 37
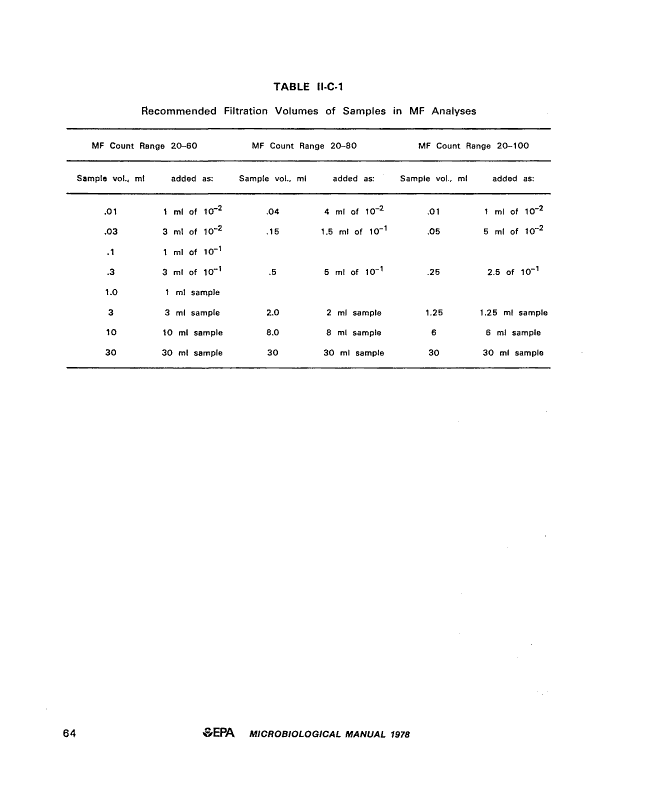
II-C-1 Recommended Filtration Volumes of Samples in MF Analyses....... 64
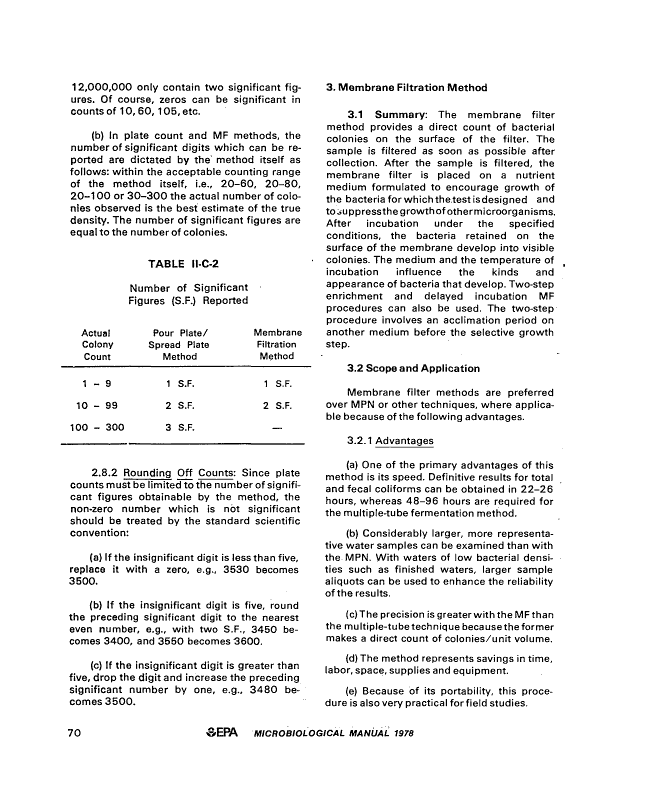
ll-C-2 Number of Significant Figures (S.F.) Reported 70
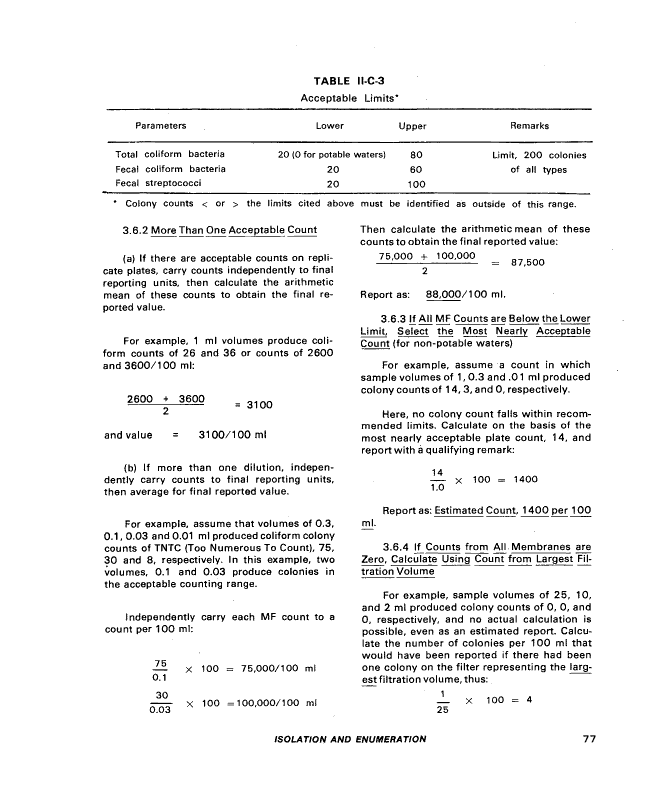
H-C-3 Acceptable Limits '. . '. 77
lf-C-4 Most Probable Number Index and 95% Confidence Limits for
Five Tube, Three Dilution Series 82
H-C-5 Most Probable Number Index and 95% Confidence Limits for
Testing Potable Waters 83
II-C-6 Selection of Code Results, Five Tube Series 85
1I-D-1 Approved Test Procedures for the Analyses of Pollutants (40
CFR 136) .". , 93
II-D-2 Water Quality Standards.,! '. ".. 94
H-D-3 Water Quality Criteria 95
II-D-4 Selection of Methods for Problem Samples „.,...... i8
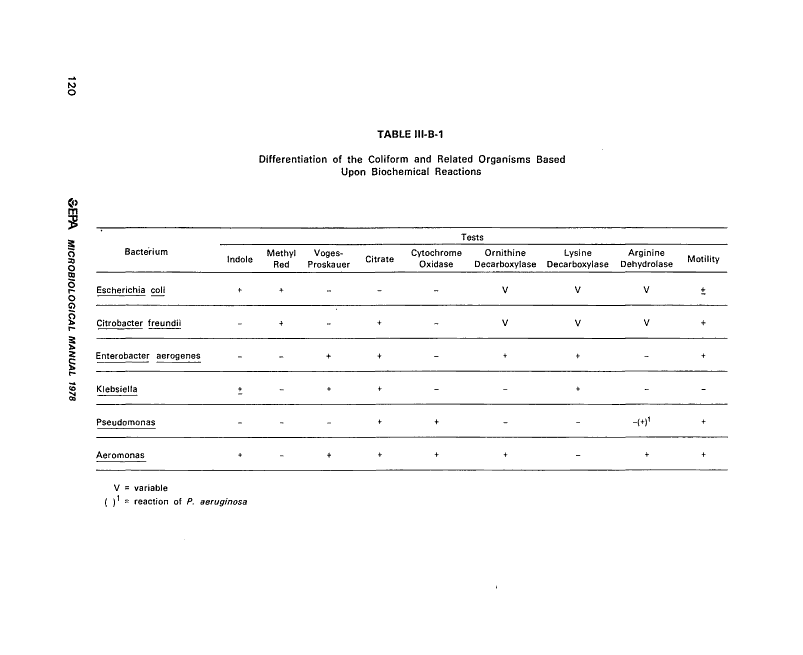
lll-B-1 Differentiation of the Conform and Related Organisms Based on
Biochemical Reactions 120
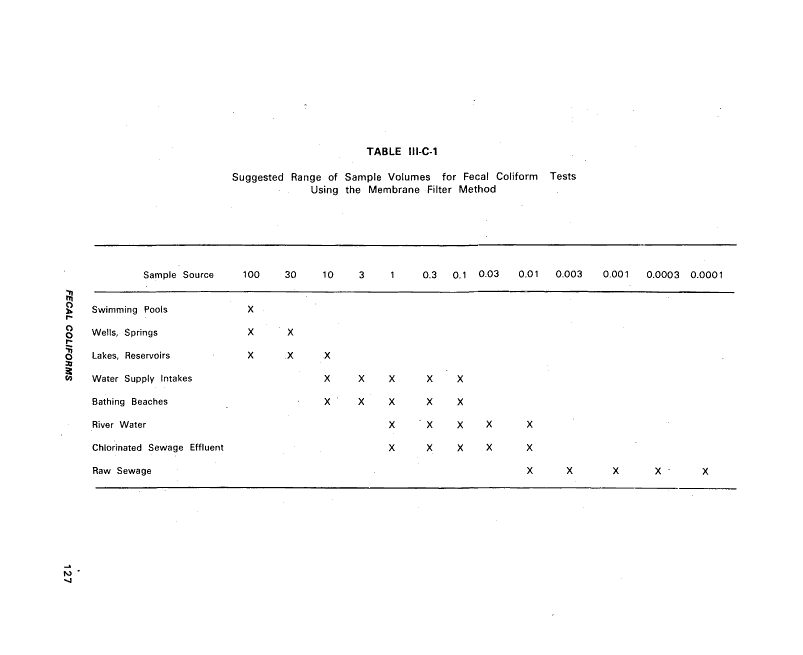
lll-C-1 Suggested Range of Sample Volumes for Fecal Coliform Tests
Using the Membrane Filter Methods^, 127
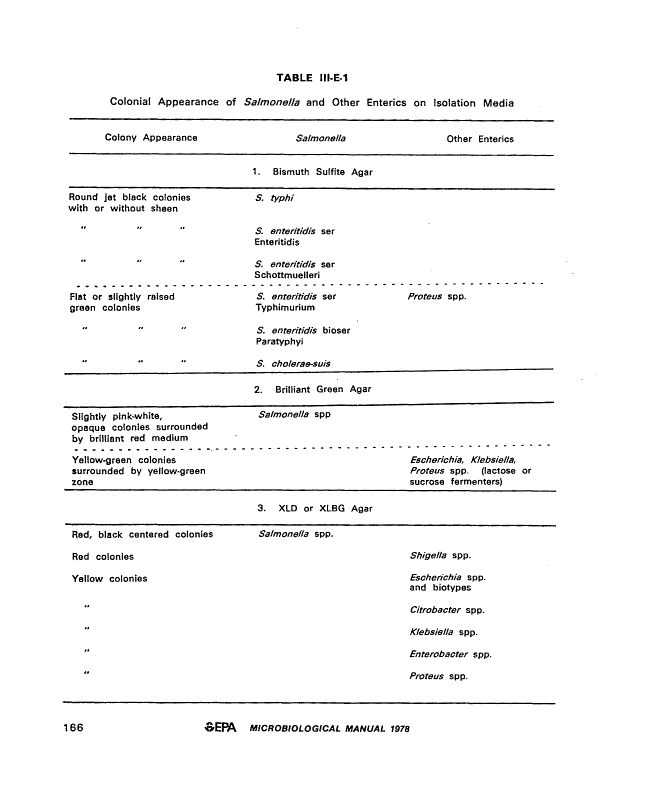
lll-E-1 Colonial Appearance of Salmonella and Other Enterics on
Isolation Media 166
III-E-2 Production Rate and Time Requirements of Multitest Systems 174
X &EFA MICROBIOLOGICAL MANUAL 1978
image:
TABLES
Number ' Page
ll-A-1 Sampling Frequency Based on Population 25
H-B-1 Relationship of Steam Pressure to Temperature in the Autoclave. 37
II-C-1 Recommended Filtration Volumes of Samples in MF Analyses....... 64
ll-C-2 Number of Significant Figures (S.F.) Reported 70
H-C-3 Acceptable Limits '. . '. 77
lf-C-4 Most Probable Number Index and 95% Confidence Limits for
Five Tube, Three Dilution Series 82
H-C-5 Most Probable Number Index and 95% Confidence Limits for
Testing Potable Waters 83
II-C-6 Selection of Code Results, Five Tube Series 85
1I-D-1 Approved Test Procedures for the Analyses of Pollutants (40
CFR 136) .". , 93
II-D-2 Water Quality Standards.,! '. ".. 94
H-D-3 Water Quality Criteria 95
II-D-4 Selection of Methods for Problem Samples „.,...... i8
lll-B-1 Differentiation of the Conform and Related Organisms Based on
Biochemical Reactions 120
lll-C-1 Suggested Range of Sample Volumes for Fecal Coliform Tests
Using the Membrane Filter Methods^, 127
lll-E-1 Colonial Appearance of Salmonella and Other Enterics on
Isolation Media 166
III-E-2 Production Rate and Time Requirements of Multitest Systems 174
X &EFA MICROBIOLOGICAL MANUAL 1978
image:
 III-E-3 Reported Shelf-Life of Multitest Systems With or Without
Refrigeration 174
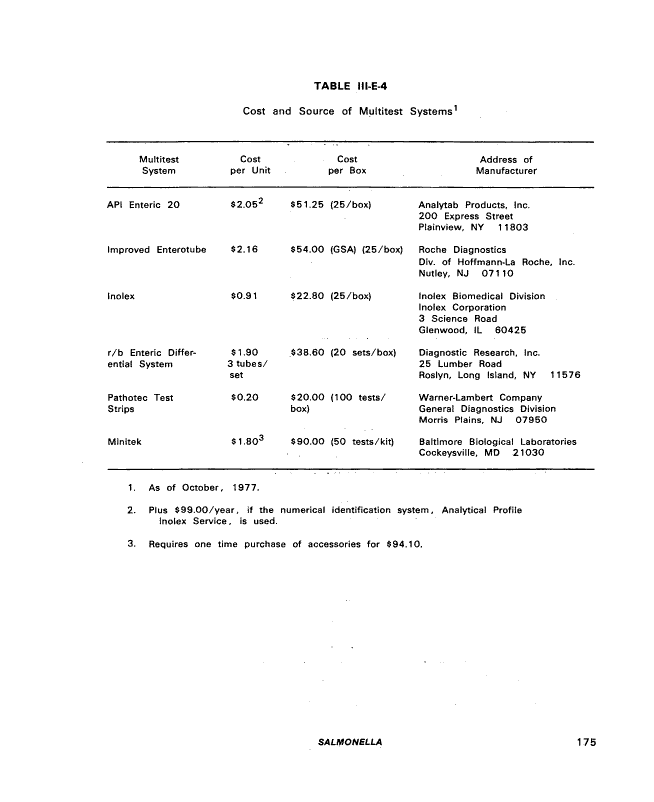
HI-E-4 Cost and Source of Multitest Systems 175
lll-E-5 Biochemical Characteristics of the Enterobacteriaceae , 176
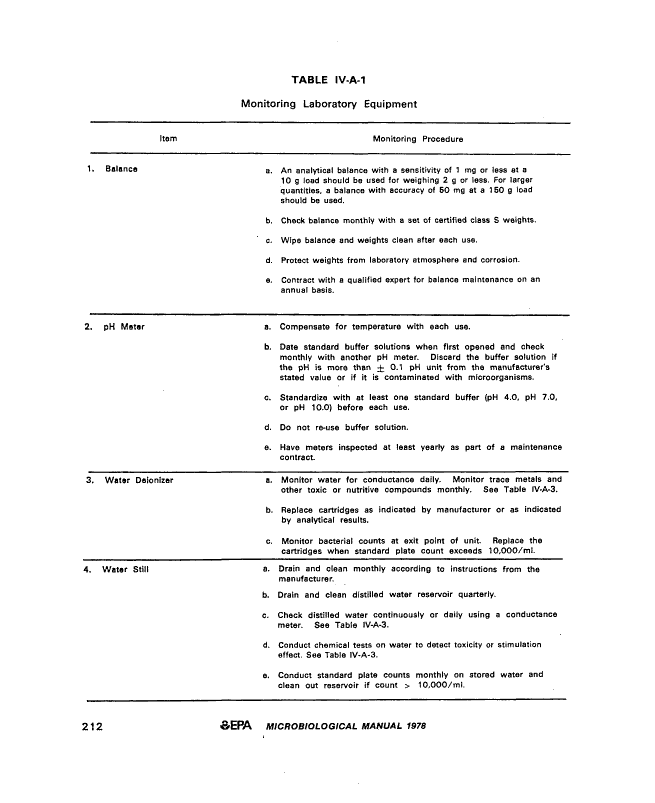
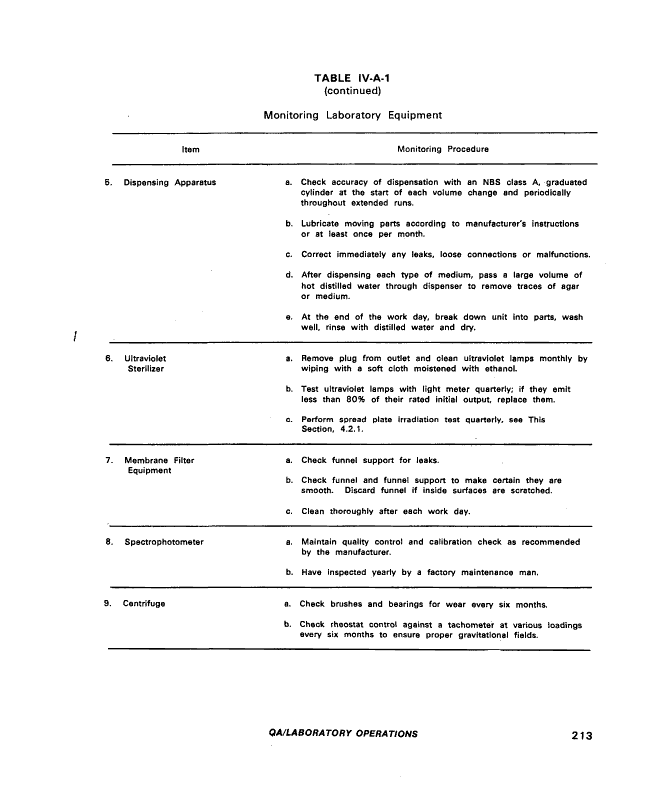
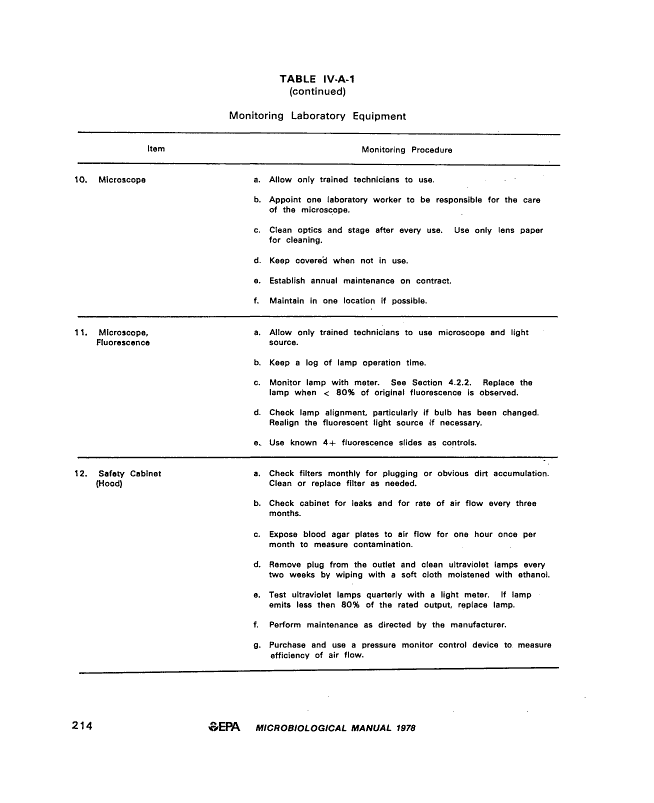
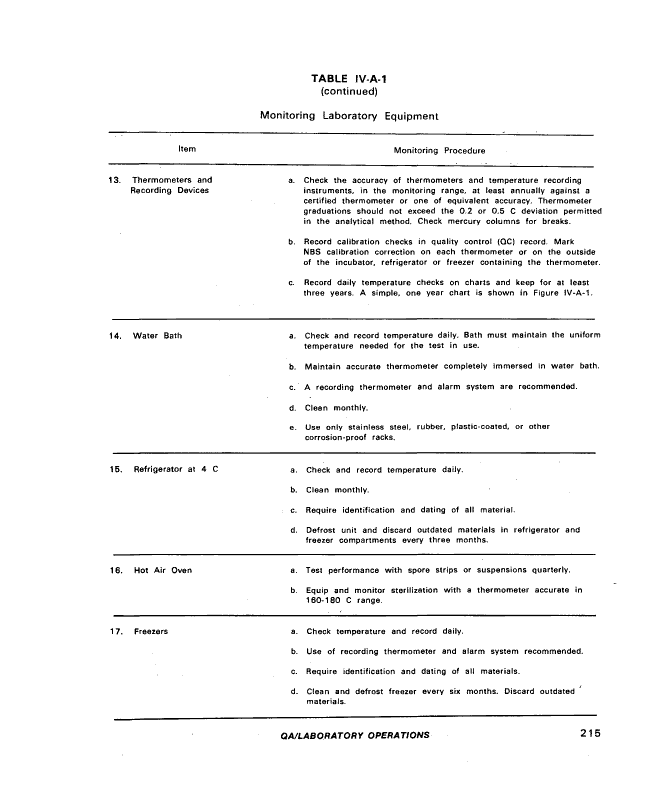
IV-A-1 Monitoring Laboratory Equipment.;.......' 212
IV-A-2 Glassware Maintenance , 218
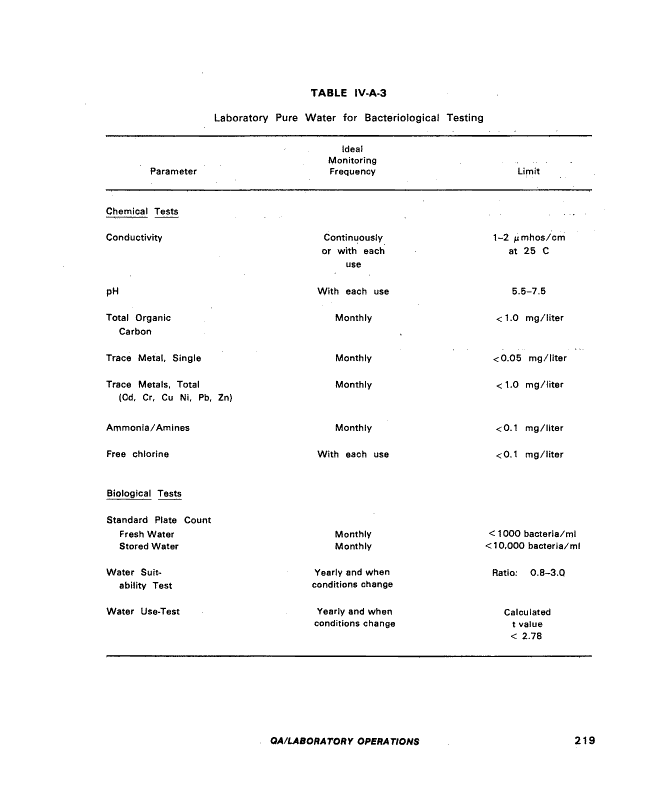
IV-A-3 Laboratory Pure Water for Bacteriological Testing 219
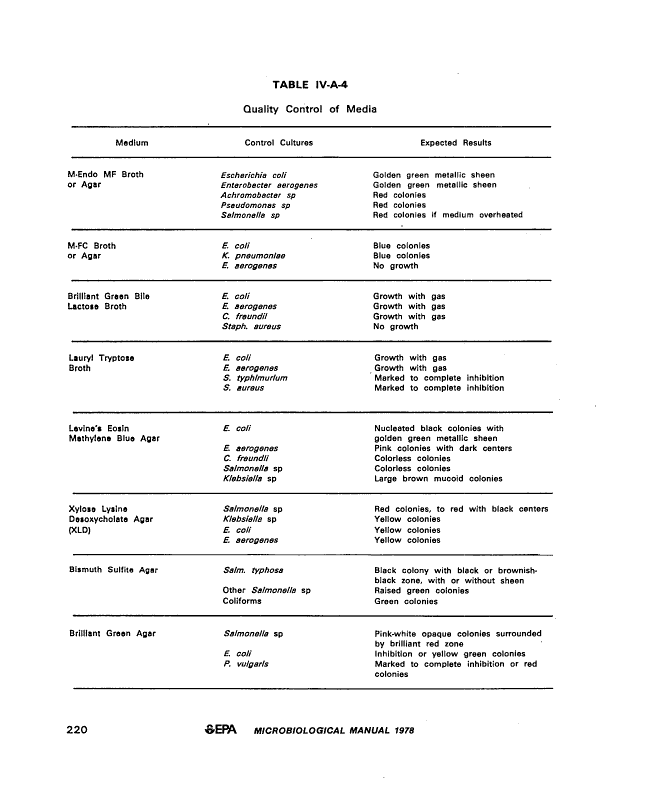
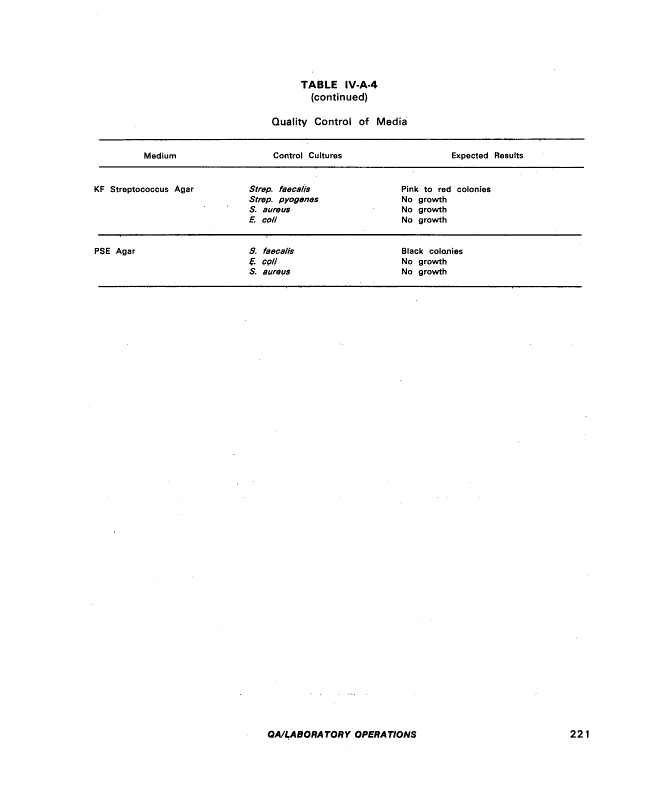
IV-A-4 Quality Control of Media . 220
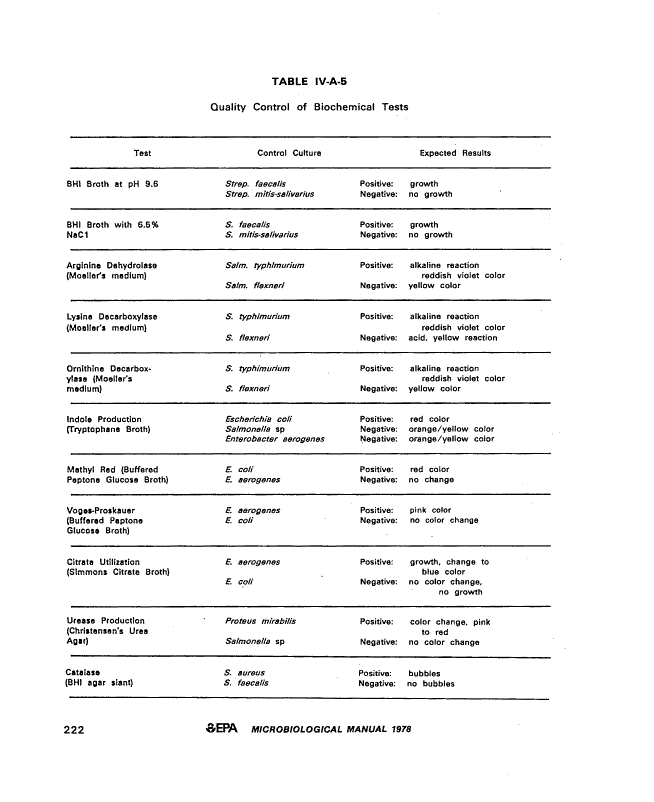
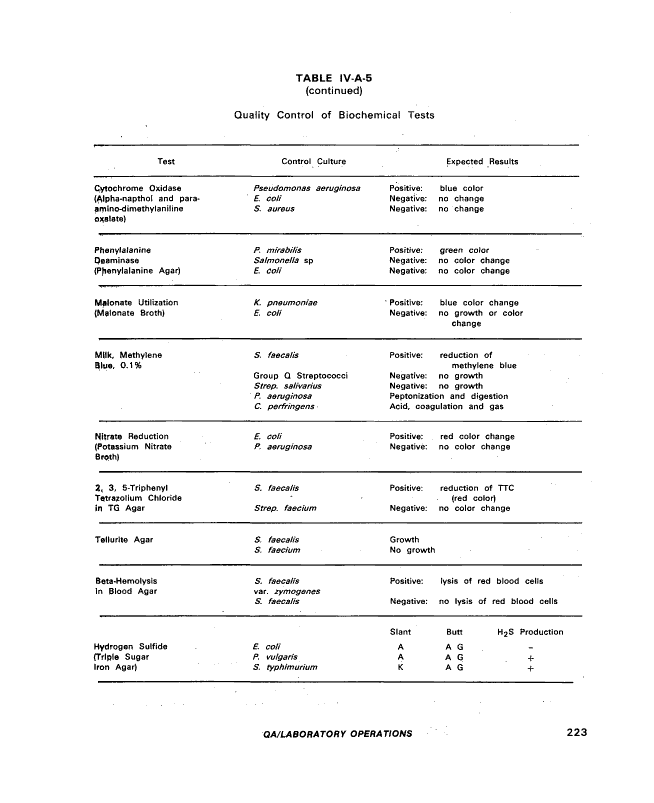
IVTA-5 Quality Control of Biochemical Tests 222
IV-B-1 Microbiological Results, count/100 ml 225
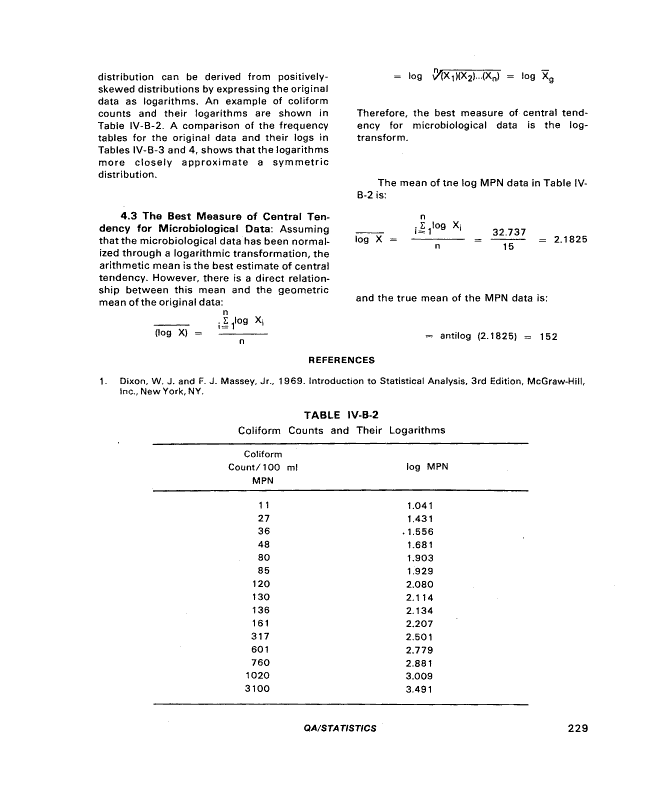
IV-B-2 Colifdrm Counts and Their. Logarithms 229
IV-B-3 Comparison of Frequency of MPN Data 230
IV-B-4 Comparison of Frequency of Log MPN Data 230
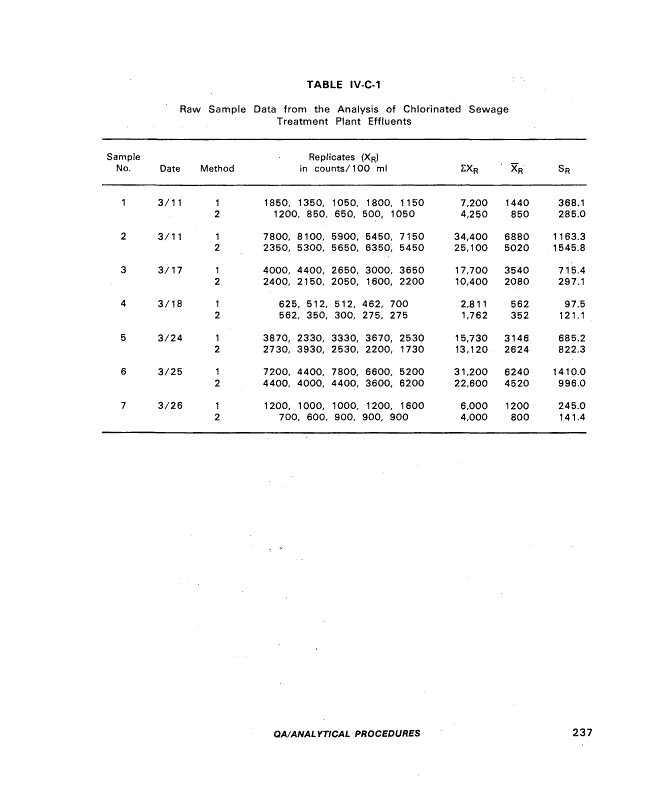
IV-C-1 Raw Sample Data from the Analysis of Chlorinated Sewage
Treatment Plant Effluents.^ '....... ':.......... ...:.. 237
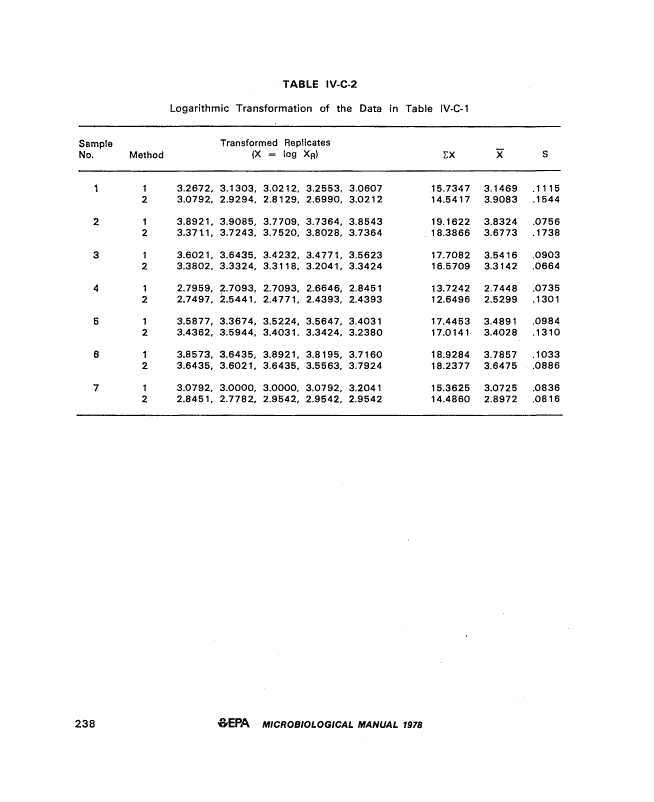
IV-C-2 Logarithmic Transformation of the Data in Table IV-C-1 238
IV-C-3 Analysis of Difference Between Means 241
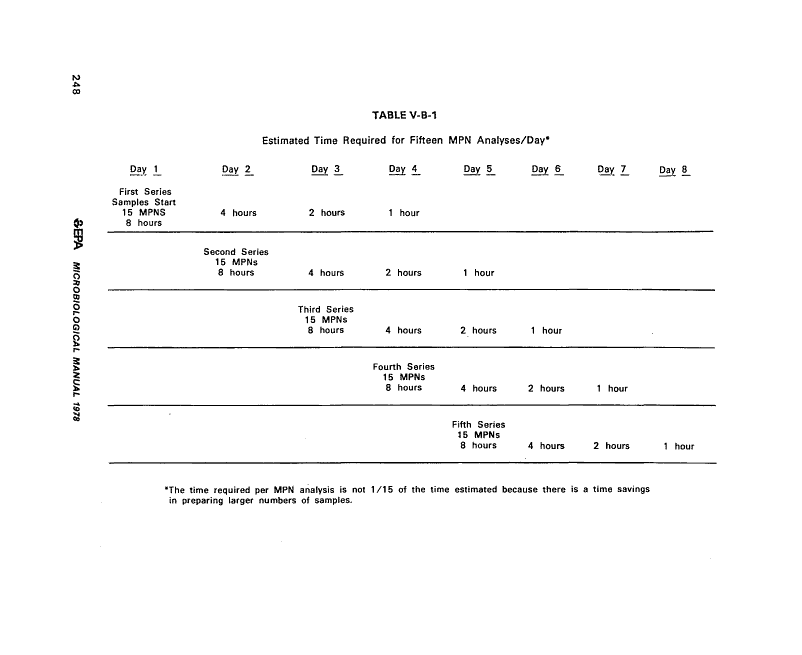
V-B-1 Estimated Time Required for Twenty MPN Analyses 248
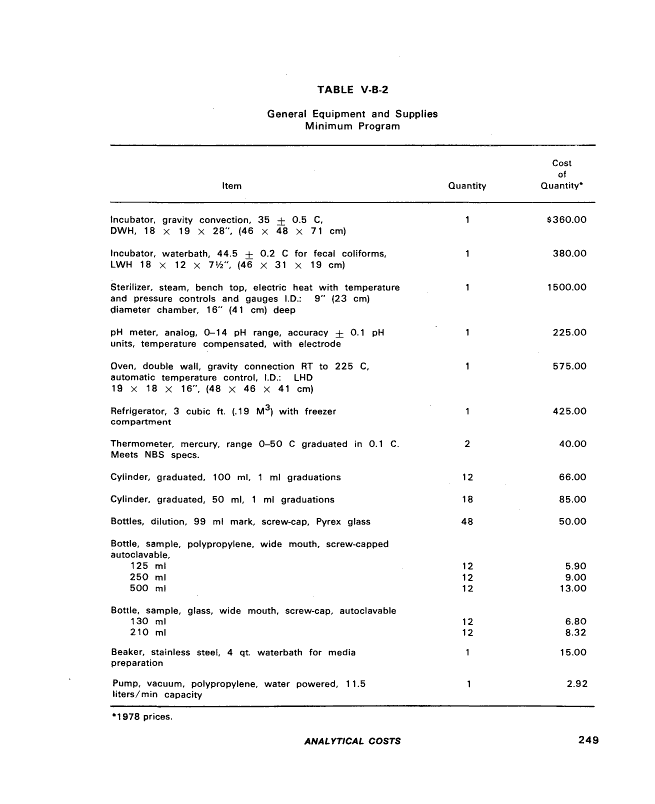
V-B-2 General Equipment and Supplies Minimum Program, Yearly Basis 249
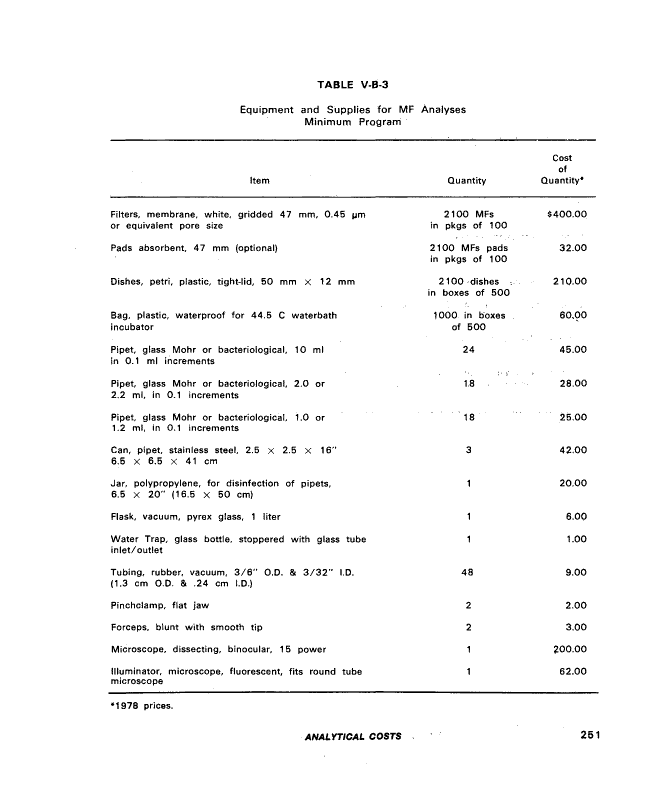
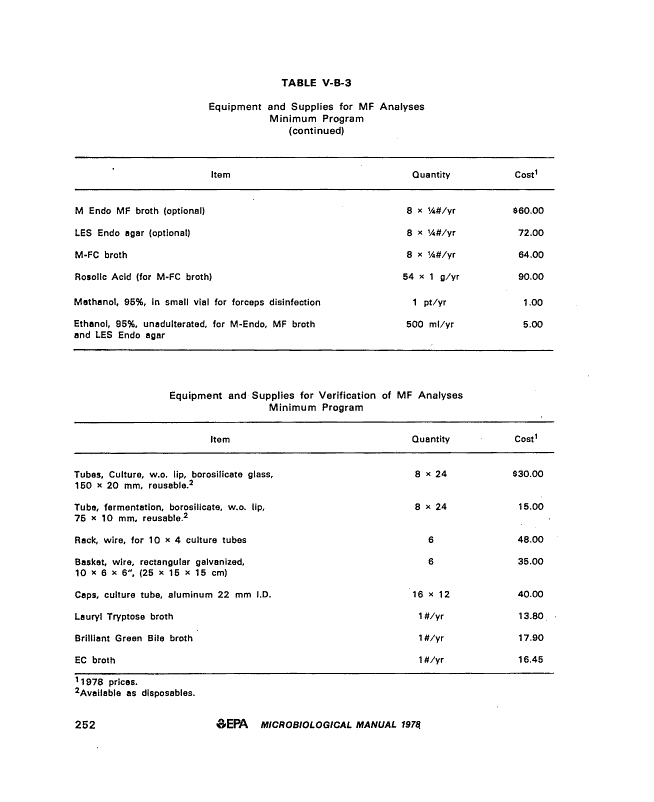
V-B-3 Equipment and Supplies for MF Analyses Minimum Program.... 251
V-B-4 Equipment and Supplies for MPN Analyses Minimum Program 253
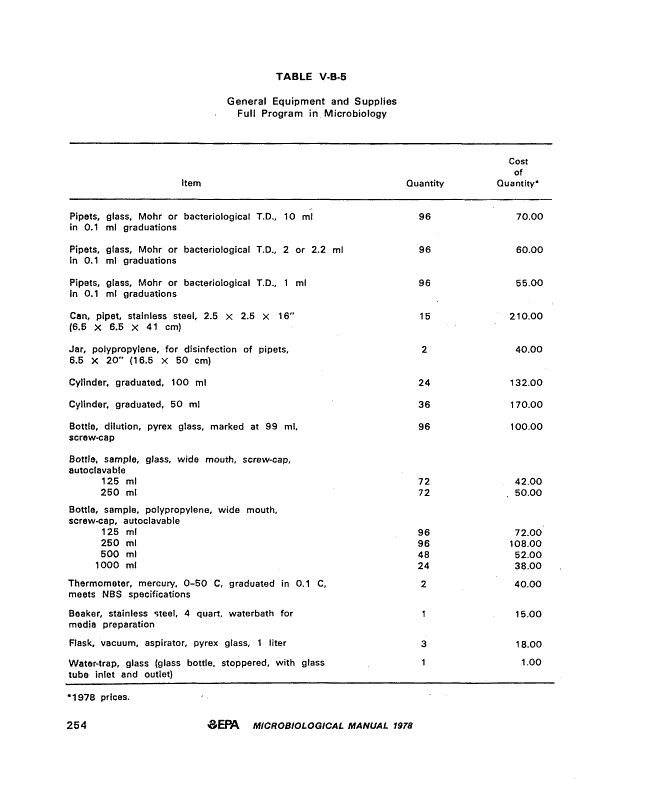
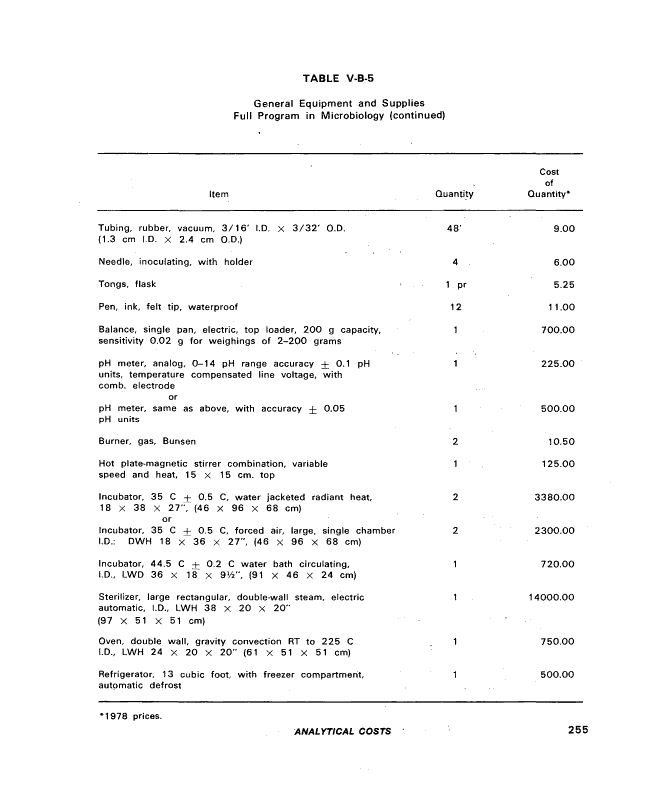
V-B-5 General Equipment and Supplies Full Program in Microbiology
Weekly Basis .....I .....; 254
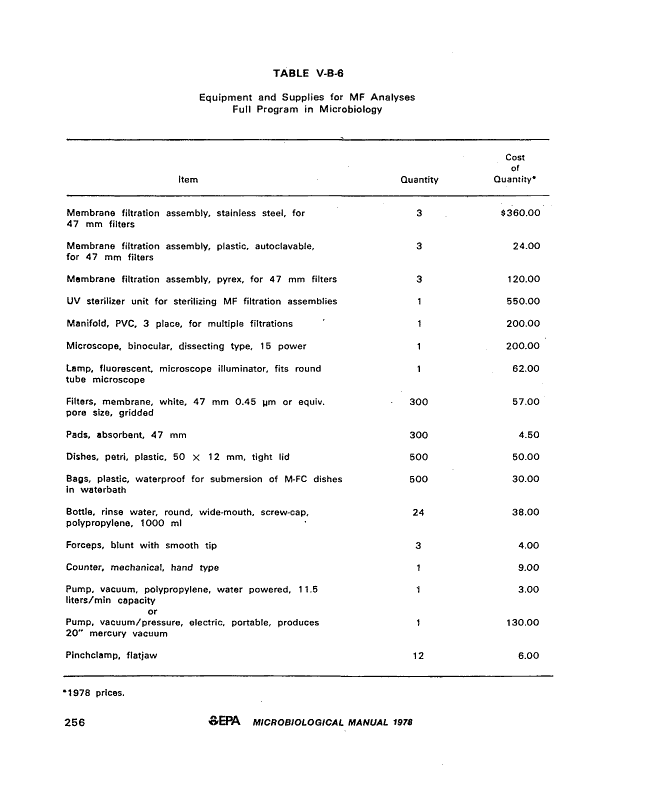
V-B-6 Equipment and Supplies for MF Analyses Full Program in
Microbiology, Weekly Basis...; 256
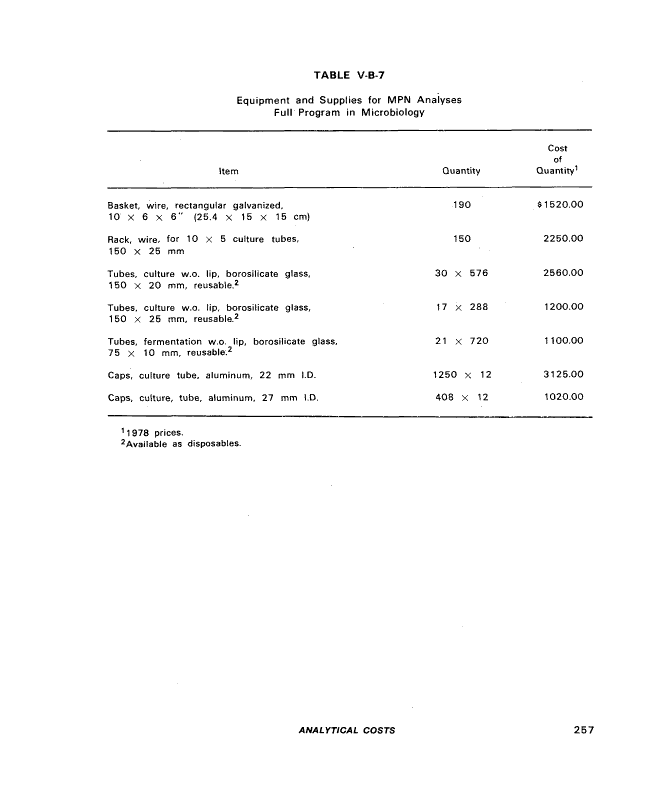
V-B-7 Equipment and Supplies for MPN Analyses Full Program in
Microbiology, Weekly Basis 257
V-B-8 Media for Full Program in Microbiology Laboratory Usage for
each Week/100 Samples : 258
XI
image:
III-E-3 Reported Shelf-Life of Multitest Systems With or Without
Refrigeration 174
HI-E-4 Cost and Source of Multitest Systems 175
lll-E-5 Biochemical Characteristics of the Enterobacteriaceae , 176
IV-A-1 Monitoring Laboratory Equipment.;.......' 212
IV-A-2 Glassware Maintenance , 218
IV-A-3 Laboratory Pure Water for Bacteriological Testing 219
IV-A-4 Quality Control of Media . 220
IVTA-5 Quality Control of Biochemical Tests 222
IV-B-1 Microbiological Results, count/100 ml 225
IV-B-2 Colifdrm Counts and Their. Logarithms 229
IV-B-3 Comparison of Frequency of MPN Data 230
IV-B-4 Comparison of Frequency of Log MPN Data 230
IV-C-1 Raw Sample Data from the Analysis of Chlorinated Sewage
Treatment Plant Effluents.^ '....... ':.......... ...:.. 237
IV-C-2 Logarithmic Transformation of the Data in Table IV-C-1 238
IV-C-3 Analysis of Difference Between Means 241
V-B-1 Estimated Time Required for Twenty MPN Analyses 248
V-B-2 General Equipment and Supplies Minimum Program, Yearly Basis 249
V-B-3 Equipment and Supplies for MF Analyses Minimum Program.... 251
V-B-4 Equipment and Supplies for MPN Analyses Minimum Program 253
V-B-5 General Equipment and Supplies Full Program in Microbiology
Weekly Basis .....I .....; 254
V-B-6 Equipment and Supplies for MF Analyses Full Program in
Microbiology, Weekly Basis...; 256
V-B-7 Equipment and Supplies for MPN Analyses Full Program in
Microbiology, Weekly Basis 257
V-B-8 Media for Full Program in Microbiology Laboratory Usage for
each Week/100 Samples : 258
XI
image:
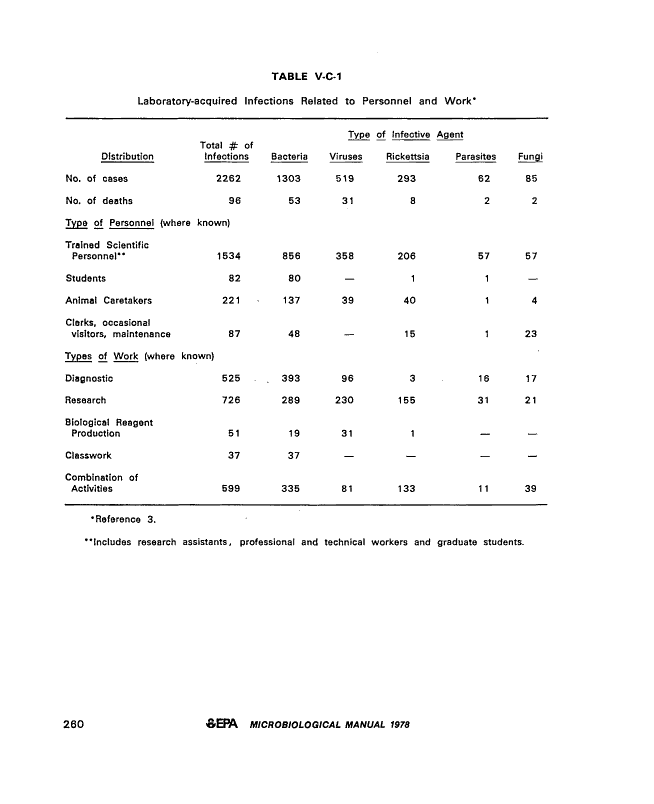
 V-C-1 Laboratory-acquired Infections Related to Personnel and Work 260
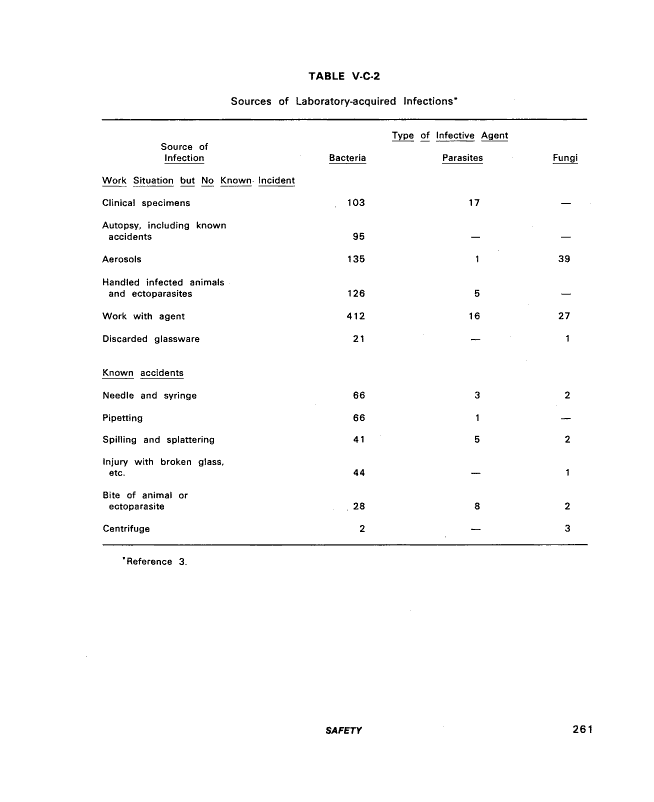
V-C-2 Sources of Laboratory-acquired Infections 261
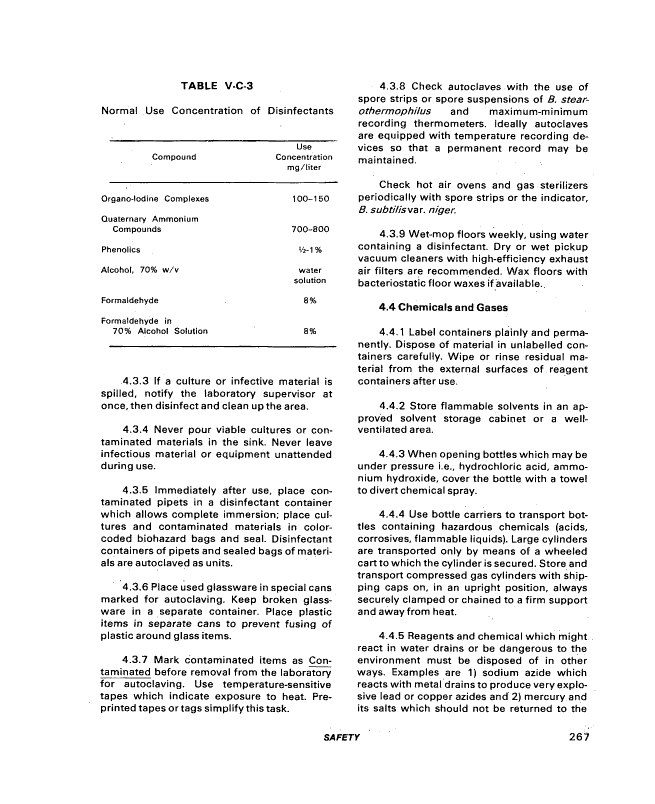
V-C-3 Normal Use Concentration of Disinfectants 267
Xii vyEFVX MICROBIOLOGICAL MANUAL 1978
image:
V-C-1 Laboratory-acquired Infections Related to Personnel and Work 260
V-C-2 Sources of Laboratory-acquired Infections 261
V-C-3 Normal Use Concentration of Disinfectants 267
Xii vyEFVX MICROBIOLOGICAL MANUAL 1978
image:
 THE MICROBIOLOGY METHODS STEERING COMMITTEE
OF EPA
Cochairpersons: Robert Bordner and John Winter
Environmental Monitoring and Support Laboratory-Cincinnati
Members:
William Stang Harold Jeter (retired)
Edwin Geldreich Francis Brezenski
Kathleen Shimmin
xiii
image:
THE MICROBIOLOGY METHODS STEERING COMMITTEE
OF EPA
Cochairpersons: Robert Bordner and John Winter
Environmental Monitoring and Support Laboratory-Cincinnati
Members:
William Stang Harold Jeter (retired)
Edwin Geldreich Francis Brezenski
Kathleen Shimmin
xiii
image:
 CONTRIBUTORS BY SECTION
Sampling '*•
William Stang
NEIC-Denver
General Laboratory Equipment/Media
Robert Bordner and John Winter
EMSL-Cincinnati
Pasquale Scarpino
UC Dept. of Environ. Engineering
Isolation and Enumeration of Bacteria
Robert Bordner and John Winter
EMSL-Cincinnati
Pasquale Scarpino
UC Dept. of Environ. Engineering
Selection of Analytical Methods
Robert Bordner and John Winter
EMSL-Cincinnati
Standard Plate Count
Raymond Taylor
MERL-Cincinnati
Total Coliforms
Harold Jeter (retired)
National Training Center
ERC-Cincinnati
Fecal Coliforms
Edwin Geldreich
MERL-Cincinnati
Fecal Streptococci
Francis Brezenski
Region II
Salmonella
Kathleen Shimmin
Alameda Laboratory
Region IX
Donald Spino
MERL-Cincinnati
Actinomycetes
Robert Safferman
EMSL-Cincinnati
Quality Control
Robert Bordner
EMSL-Cincinnati
Development of a Quality Control Program
John Winter
EMSL-Cincinnati
Manpower and Analytical Costs
Robert Bordner and John Winter
EMSL-Cincinnati
Legal Considerations
Dave Shedroff
Office of Enforcement
Washington, DC
Carroll Wills
NEIC-Denver
Safety
Robert Bordner and John Winter
EMSL-Cincinnati
Pasquale Scarpino
UC Dept of Environ. Engineering
MICROBIOLOGICAL MANUAL 1978
image:
CONTRIBUTORS BY SECTION
Sampling '*•
William Stang
NEIC-Denver
General Laboratory Equipment/Media
Robert Bordner and John Winter
EMSL-Cincinnati
Pasquale Scarpino
UC Dept. of Environ. Engineering
Isolation and Enumeration of Bacteria
Robert Bordner and John Winter
EMSL-Cincinnati
Pasquale Scarpino
UC Dept. of Environ. Engineering
Selection of Analytical Methods
Robert Bordner and John Winter
EMSL-Cincinnati
Standard Plate Count
Raymond Taylor
MERL-Cincinnati
Total Coliforms
Harold Jeter (retired)
National Training Center
ERC-Cincinnati
Fecal Coliforms
Edwin Geldreich
MERL-Cincinnati
Fecal Streptococci
Francis Brezenski
Region II
Salmonella
Kathleen Shimmin
Alameda Laboratory
Region IX
Donald Spino
MERL-Cincinnati
Actinomycetes
Robert Safferman
EMSL-Cincinnati
Quality Control
Robert Bordner
EMSL-Cincinnati
Development of a Quality Control Program
John Winter
EMSL-Cincinnati
Manpower and Analytical Costs
Robert Bordner and John Winter
EMSL-Cincinnati
Legal Considerations
Dave Shedroff
Office of Enforcement
Washington, DC
Carroll Wills
NEIC-Denver
Safety
Robert Bordner and John Winter
EMSL-Cincinnati
Pasquale Scarpino
UC Dept of Environ. Engineering
MICROBIOLOGICAL MANUAL 1978
image:
 ACKNOWLEDGEMENTS
The Committee wishes to acknowledge the many EPA microbiologists and others who
participated in the development or review of the manual. These include, in regional and program
order: .
Region I
Howard Davis and Edward Gritsavage •
Regional Laboratory
Needham Heights, MA
Victor Cabelli, Alfred Dufour and Morris Levin
Environmental Research Laboratory
Narragansett, RI •••...-,..
Region II
Isidore Seidenberg (retired)
Edison Water Laboratory
Edison, NJ
Region III .
Leonard Guarraia Don Lear' . '
Office of Water & Hazardous Materials Annapolis Field Station
Washington, DC Annapolis, MD
Region IV
Bobby Joe Carroll and Ralph Gentry A! Bourquin
S & A Division, SERL Pensacola Station
Athens, GA Pensacola, FL
Region V
James Adams
Central Regional Laboratory
Chicago, 1L
Region VI ,
Harold Cumiford
Houston Facility
Houston, TX
Region VII
Carl Bailey
Regional Laboratory
Kansas City, MO
- xv
image:
ACKNOWLEDGEMENTS
The Committee wishes to acknowledge the many EPA microbiologists and others who
participated in the development or review of the manual. These include, in regional and program
order: .
Region I
Howard Davis and Edward Gritsavage •
Regional Laboratory
Needham Heights, MA
Victor Cabelli, Alfred Dufour and Morris Levin
Environmental Research Laboratory
Narragansett, RI •••...-,..
Region II
Isidore Seidenberg (retired)
Edison Water Laboratory
Edison, NJ
Region III .
Leonard Guarraia Don Lear' . '
Office of Water & Hazardous Materials Annapolis Field Station
Washington, DC Annapolis, MD
Region IV
Bobby Joe Carroll and Ralph Gentry A! Bourquin
S & A Division, SERL Pensacola Station
Athens, GA Pensacola, FL
Region V
James Adams
Central Regional Laboratory
Chicago, 1L
Region VI ,
Harold Cumiford
Houston Facility
Houston, TX
Region VII
Carl Bailey
Regional Laboratory
Kansas City, MO
- xv
image:
 Region VIII
John Manhart
Regional Laboratory, Denver Federal Center
Denver, CO
Region IX
Harold Scotten
Alameda Laboratory
Alameda, CA
Region X
George J. Vasconcelos and Richard Bauer
Regional Laboratory
Seattle, WA
Martin Knittel
Environmental Research Laboratory
Corvallis, OR
Ronald Gordon
Alaska Water Laboratory
College, AK
Cincinnati Environmental Research Center
Joseph Santner and Rocco Russomanno
National Training Center
Martin Allen, Harry Nash and Don Reasoner
Municipal Environmental Research Laboratory
Louis Resi
Division of Technical Support
Bernard Kenner (retired)
Municipal Environmental Reserach Laboratory (AWTRL)
Paul Britton, Terry Covert and Herbert Manning
Environmental Monitoring and Support Laboratory
Elmer Akin and Walter Jakubowski
Health Effects Research Laboratory
PREPARATION OF THIS VOLUME
The editors acknowledge gratefully the excellent technical skills of organization, proofreading,
typing and computerized text editing performed by M. Mary Sullivan, Her contribution of hard work
and sacrifice of personal time to this manual cannot be overstated.
XVi V>EPA MICROBIOLOGICAL MANUAL 1978
image:
Region VIII
John Manhart
Regional Laboratory, Denver Federal Center
Denver, CO
Region IX
Harold Scotten
Alameda Laboratory
Alameda, CA
Region X
George J. Vasconcelos and Richard Bauer
Regional Laboratory
Seattle, WA
Martin Knittel
Environmental Research Laboratory
Corvallis, OR
Ronald Gordon
Alaska Water Laboratory
College, AK
Cincinnati Environmental Research Center
Joseph Santner and Rocco Russomanno
National Training Center
Martin Allen, Harry Nash and Don Reasoner
Municipal Environmental Research Laboratory
Louis Resi
Division of Technical Support
Bernard Kenner (retired)
Municipal Environmental Reserach Laboratory (AWTRL)
Paul Britton, Terry Covert and Herbert Manning
Environmental Monitoring and Support Laboratory
Elmer Akin and Walter Jakubowski
Health Effects Research Laboratory
PREPARATION OF THIS VOLUME
The editors acknowledge gratefully the excellent technical skills of organization, proofreading,
typing and computerized text editing performed by M. Mary Sullivan, Her contribution of hard work
and sacrifice of personal time to this manual cannot be overstated.
XVi V>EPA MICROBIOLOGICAL MANUAL 1978
image:
 PART I. INTRODUCTION
As the only direct measures of pollution by man and other warm-blooded animals,
microbiological parameters contribute unique information on water and wastewater quality and
public health risk from waterborne disease. Microbiological analyses are conducted to:
Monitor ambient water quality for recreational, industrial, agricultural and water supply uses,
Assure the safety of potable water
Monitor municipal and industrial discharges.
Identify the sources of bacterial pollutants,
and evaluate water resources.
Role of the Aquatic Microbiologist
Although their primary role is to produce valid data for management decisions,
microbiologists should also participate in survey planning and evaluation, develop new microbjal
parameters and methodology, consult on microbiological problems, establish and monitor criteria
and standards, testify in administrative hearings and court cases, train laboratory staffs and
research special problems. Microbiologists should also go beyond sanitary microbiology to solve
taste and odor problems, to study microbiological transformations, and to apply other
measurements to the aquatic ecosystem.
Scope of the Microbiology Manual Series
This EPA manual provides uniform laboratory and field methods for microbiological analyses
of the environment. The analytical methods are standardized procedures recommended for use in
enforcement, monitoring and research. However, they are not intended to inhrbit or prevent
methods research and development. Exploratory and developmental methods are compiled sepa-
rately for evaluation but are part of the EPA Microbiology Manual Series.
The environmental areas covered will include:
* All waters — fresh, estuarine, marine, shellfish-growing, agricultural, ground, surface,
finished, recreational and industrial processing.
INTRODUCTION
image:
PART I. INTRODUCTION
As the only direct measures of pollution by man and other warm-blooded animals,
microbiological parameters contribute unique information on water and wastewater quality and
public health risk from waterborne disease. Microbiological analyses are conducted to:
Monitor ambient water quality for recreational, industrial, agricultural and water supply uses,
Assure the safety of potable water
Monitor municipal and industrial discharges.
Identify the sources of bacterial pollutants,
and evaluate water resources.
Role of the Aquatic Microbiologist
Although their primary role is to produce valid data for management decisions,
microbiologists should also participate in survey planning and evaluation, develop new microbjal
parameters and methodology, consult on microbiological problems, establish and monitor criteria
and standards, testify in administrative hearings and court cases, train laboratory staffs and
research special problems. Microbiologists should also go beyond sanitary microbiology to solve
taste and odor problems, to study microbiological transformations, and to apply other
measurements to the aquatic ecosystem.
Scope of the Microbiology Manual Series
This EPA manual provides uniform laboratory and field methods for microbiological analyses
of the environment. The analytical methods are standardized procedures recommended for use in
enforcement, monitoring and research. However, they are not intended to inhrbit or prevent
methods research and development. Exploratory and developmental methods are compiled sepa-
rately for evaluation but are part of the EPA Microbiology Manual Series.
The environmental areas covered will include:
* All waters — fresh, estuarine, marine, shellfish-growing, agricultural, ground, surface,
finished, recreational and industrial processing.
INTRODUCTION
image:
 * All wastewaters of microbiological concern - domestic waste effluents, industrial
wastes such as food, dairy, meat, tanning, sugar, textile, pulp and paper, shellfish
processing and agricultural wastes such as feedlot and irrigation runoff.
• Other areas of the environment - air, sediments, soils, sludges, oils, leachates,
vegetation, etc.
Coverage of the First Edition of the Manual
Although the scope of the Manual Series is broad and inclusive of many parameters and
sample types, the first edition describes primarily the analytical methods that meet the immediate
needs of the Agency. These are the key parameters that are accepted and used for water quality,
compliance monitoring and enforcement under Federal Water Pollution Control Act, PL 92-500,
Marine Protection, Research, and Sanctuaries Act, PL 92-532 and the Safe Drinking Water Act, PL
93-523. The necessary supportive sections include: sample collection, equipment and techniques,
cultural media, glassware preparation, quality control, data handling, safety, legal considerations
and selection of analytical methods.
Focus of the Manual
This Manual is intended for use by the supervisor or analyst who may be a professional
microbiologist, a technician, chemist, engineer or plant operator. Regardless of other skills, the
supervisor and analyst should have received at least two weeks training in each parameter from a
federal or state agency or from a university.
To assist the newanalyst, Part II has been prepared as a basic discussion on laboratory operations
and for general guidance to permit use of the manual by those required to do microbiological
analyses. The trained analyst will be familiar and knowledgeable of most of these techniques.
The analytical procedures in Part HI are written in a stepwise manner so that the manual can be
used both at bench level and as a reference book. Part IV emphasizes the important, but often neglect-
ed need for quality control in microbiological analyses, while Part V describes general considerations
for laboratory management.
Objectives
The objectives of This Manual are to:
* Select the best method currently available for use in the environmental monitoring,
compliance monitoring, enforcement and research activities of the Agency,
» Establish uniform application of microbiological methods so that only the best methods
are used and perpetuated, data from different laboratories or surveys can be fairly
compared and/or results can be stored in a common data bank, e.g., STORET, for later
use.
» Provide guidance on the use of these methods, their" advantages, limitations and
application to various types of water and wastes.
• Establish recognized procedures for method selection and evaluation that will form the
baseline against which othertests forthe same or new parameters can be measured.
* Emphasize the analytical quality control and management practices that should be
performed in the laboratory to assure valid data.
2 4>EPA MICROBIOLOGICAL MANUAL 1978
image:
* All wastewaters of microbiological concern - domestic waste effluents, industrial
wastes such as food, dairy, meat, tanning, sugar, textile, pulp and paper, shellfish
processing and agricultural wastes such as feedlot and irrigation runoff.
• Other areas of the environment - air, sediments, soils, sludges, oils, leachates,
vegetation, etc.
Coverage of the First Edition of the Manual
Although the scope of the Manual Series is broad and inclusive of many parameters and
sample types, the first edition describes primarily the analytical methods that meet the immediate
needs of the Agency. These are the key parameters that are accepted and used for water quality,
compliance monitoring and enforcement under Federal Water Pollution Control Act, PL 92-500,
Marine Protection, Research, and Sanctuaries Act, PL 92-532 and the Safe Drinking Water Act, PL
93-523. The necessary supportive sections include: sample collection, equipment and techniques,
cultural media, glassware preparation, quality control, data handling, safety, legal considerations
and selection of analytical methods.
Focus of the Manual
This Manual is intended for use by the supervisor or analyst who may be a professional
microbiologist, a technician, chemist, engineer or plant operator. Regardless of other skills, the
supervisor and analyst should have received at least two weeks training in each parameter from a
federal or state agency or from a university.
To assist the newanalyst, Part II has been prepared as a basic discussion on laboratory operations
and for general guidance to permit use of the manual by those required to do microbiological
analyses. The trained analyst will be familiar and knowledgeable of most of these techniques.
The analytical procedures in Part HI are written in a stepwise manner so that the manual can be
used both at bench level and as a reference book. Part IV emphasizes the important, but often neglect-
ed need for quality control in microbiological analyses, while Part V describes general considerations
for laboratory management.
Objectives
The objectives of This Manual are to:
* Select the best method currently available for use in the environmental monitoring,
compliance monitoring, enforcement and research activities of the Agency,
» Establish uniform application of microbiological methods so that only the best methods
are used and perpetuated, data from different laboratories or surveys can be fairly
compared and/or results can be stored in a common data bank, e.g., STORET, for later
use.
» Provide guidance on the use of these methods, their" advantages, limitations and
application to various types of water and wastes.
• Establish recognized procedures for method selection and evaluation that will form the
baseline against which othertests forthe same or new parameters can be measured.
* Emphasize the analytical quality control and management practices that should be
performed in the laboratory to assure valid data.
2 4>EPA MICROBIOLOGICAL MANUAL 1978
image:
 Criteria
The first edition of This Manual describes the parameters of health and sanitary significance.
In the future, the criteria for addition of a method to the Manual are:
• The method is required to satisfy new or changing needs of the Agency.
» The method is practical for field and laboratory use. Equipment, supplies and media are
available and the procedure provides results within reasonable time limits.
* The method offers significant advantages over current methods.
• The method has been validated by the developer or by others according to the criteria
for Comparative Testing of Methodology and Method Characterization. (See IV-C-1).
• The method criteria and characterization have been reviewed and accepted by the EPA
Steering Committee for Microbiology.
INTRODUCTION
image:
Criteria
The first edition of This Manual describes the parameters of health and sanitary significance.
In the future, the criteria for addition of a method to the Manual are:
• The method is required to satisfy new or changing needs of the Agency.
» The method is practical for field and laboratory use. Equipment, supplies and media are
available and the procedure provides results within reasonable time limits.
* The method offers significant advantages over current methods.
• The method has been validated by the developer or by others according to the criteria
for Comparative Testing of Methodology and Method Characterization. (See IV-C-1).
• The method criteria and characterization have been reviewed and accepted by the EPA
Steering Committee for Microbiology.
INTRODUCTION
image:
 PART II. GENERAL OPERATIONS
This Part describes the general procedures which are applicable to the methods of analysis for
all parameters. The Sections provide the basic background information that must be understood
whan the analytical procedures are carried out. The procedures are divided here into broad areas
of function:
Section A Sample Collection, Preservation and Storage
Section B General Laboratory Equipment, Techniques and Media
Section C Isolation and Enumeration of Bacteria
Section D Selection of Analytical Methodology
MICROBIOLOGICAL MANUAL 1978
image:
PART II. GENERAL OPERATIONS
This Part describes the general procedures which are applicable to the methods of analysis for
all parameters. The Sections provide the basic background information that must be understood
whan the analytical procedures are carried out. The procedures are divided here into broad areas
of function:
Section A Sample Collection, Preservation and Storage
Section B General Laboratory Equipment, Techniques and Media
Section C Isolation and Enumeration of Bacteria
Section D Selection of Analytical Methodology
MICROBIOLOGICAL MANUAL 1978
image:
 PART II. GENERAL OPERATIONS
Section A Sample Collection, Preservation and Storage
Collection, preservation and storage of
water samples are critical to the results of
water quality analyses. The data are only as
valid as the water sample,
A sampling program must be planned to
satisfy the objectives of the study yet remain
within the limitations of available manpower,
time and money. The survey should use the
minimum number of samples that adequately
represent the effluent or body of water from
which they are taken. The number of samples
and location of sampling sites should be deter-
mined prior to the survey and must satisfy the
requirements needed to establish water qual-
ity standard or effluent permit violations.
The microbiologist should participate in
the planning which specifies the microbiologi-
cal tests needed, the number of analyses to be
performed, and the equipment required. Con-
sideration should be given to the weather and
other local conditions prior to the formulation
of a final plan. For example, seasonal varia-
tions in water temperature and flows would be
important factors in deciding when to study
the effects of thermal pollution on bacteria.
Sample collectors must know the exact loca-
tion of the sampling sites and be fully trained
in the aseptic technique of sample collection
as well as the use of any specialized sampling
equipment. The sample collector is responsi-
ble for the recording of all pertinent informa-
tion about the sample that might be significant
in the evaluation and interpretation of the
laboratory data or that might be necessary in
potential enforcement action.
This Section is organized as follows:
1. Sample Containers
2. Sampling Techniques
Composite Sampling
Surface Sampling by Hand
Surface Sampling by
Weighted Bottle Frame
Depth Sampling
Soil Sampling
Sediment Sampling
Water Tap Sampling
3. Sample Identification and
Handling
4, Chain of Custody Procedures
5. Selection of Sampling Sites and
Frequency
Potable Water Supplies
Lakes and Impoundments
Stream Sampling
Marine and Estuarine
Sampling
Domestic and Industrial
Waste Discharges
Recreational Waters
Shellfish-Harvesting Waters
Frequency of Sampling
6. Preservation and Transit of
Samples
SAMPLING TECHNIQUES
image:
PART II. GENERAL OPERATIONS
Section A Sample Collection, Preservation and Storage
Collection, preservation and storage of
water samples are critical to the results of
water quality analyses. The data are only as
valid as the water sample,
A sampling program must be planned to
satisfy the objectives of the study yet remain
within the limitations of available manpower,
time and money. The survey should use the
minimum number of samples that adequately
represent the effluent or body of water from
which they are taken. The number of samples
and location of sampling sites should be deter-
mined prior to the survey and must satisfy the
requirements needed to establish water qual-
ity standard or effluent permit violations.
The microbiologist should participate in
the planning which specifies the microbiologi-
cal tests needed, the number of analyses to be
performed, and the equipment required. Con-
sideration should be given to the weather and
other local conditions prior to the formulation
of a final plan. For example, seasonal varia-
tions in water temperature and flows would be
important factors in deciding when to study
the effects of thermal pollution on bacteria.
Sample collectors must know the exact loca-
tion of the sampling sites and be fully trained
in the aseptic technique of sample collection
as well as the use of any specialized sampling
equipment. The sample collector is responsi-
ble for the recording of all pertinent informa-
tion about the sample that might be significant
in the evaluation and interpretation of the
laboratory data or that might be necessary in
potential enforcement action.
This Section is organized as follows:
1. Sample Containers
2. Sampling Techniques
Composite Sampling
Surface Sampling by Hand
Surface Sampling by
Weighted Bottle Frame
Depth Sampling
Soil Sampling
Sediment Sampling
Water Tap Sampling
3. Sample Identification and
Handling
4, Chain of Custody Procedures
5. Selection of Sampling Sites and
Frequency
Potable Water Supplies
Lakes and Impoundments
Stream Sampling
Marine and Estuarine
Sampling
Domestic and Industrial
Waste Discharges
Recreational Waters
Shellfish-Harvesting Waters
Frequency of Sampling
6. Preservation and Transit of
Samples
SAMPLING TECHNIQUES
image:
 1. Sample Containers
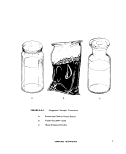
1.1 Sample Bottles: Bottles must be resis-
tant to sterilizing conditions and the solvent
action of water. Wide-mouth borosilicate glass
bottles with screw-cap or ground-glass stopper
or heat-resistant plastic bottles may be used
if they can be sterilized without producing toxic
materials {see suggested sample containers in
Figure II-A-1). Screw-caps must not produce
bacteriostatic or nutritive compounds upon
sterilization.
1.2 Selection and Cleansing of Bottles:
Sample bottles should be at least 125 ml vol-
ume for adequate sampling and for good mixing.
Bottles of 250 ml, 500 ml and 1000 ml volume
are often used for multiple analyses. Discard
bottles which have chips, cracks, and etched
surfaces. Bottle closures must be water-tight.
Before use, thoroughly cleanse bottles and
closures with detergent and hot water, fol-
lowed by a hot water rinse to remove all trace
of detergent. Then rinse them three times with
laboratory-pure water {II-B.6). A test for the
biological examination of glassware where
bacteriostatic or inhibitory residues may
be present, is described in Part 1V-A, 5.1.
1.5 Wrapping Bottles: Protect the tops
and necks of glass stoppered bottles from
contamination by covering them before sterili-
zation with aluminum foil or kraft paper.
1.6 Sterilization of Bottles: Autoclave
glass or heat-resistant plastic bottles at 121 C
for 15 minutes. Alternatively, dry glassware
may be sterilized in a hot air oven at 170 C for
not less than two hours. Ethylene oxide gas
sterilization is acceptable for plastic containers
that are not heat-resistant Sample bottles
sterilized by gas should be stored overnight
before being used to allow the last traces of
gas to dissipate. See Part il-B, 3 for steriliza-
tion procedures.
1.7 Plastic Bags: The commercially-
available bags (Whirl-pak) are a practical sub-
stitute for plastic or glass sample bottles in
sampling soil or sediment. See Figure ll-A-1.
The bags are sealed in manufacture and opened
only at time of sampling. The manufacturer
states that such bags are sterilized.
2. Sampling Techniques
1.3 Dechlorinating Agent: The agent
must be placed in the bottle when water and
wastewater samples containing residual chlo-
rine are anticipated. Add sodium thiosulfate to
the bottle before sterilization at a concentration
of 0.1 ml of a 10 percent solution for each
125 ml {4 oz.J sample volume (1). This concen-
tration will neutralize approximately 15 mg/l
of residue chlorine.
1,4 Chelating Agent: A chelating agent
should be added to sample bottles used to
collect samples suspected of containing
>0.01 mg/liter concentrations of heavy metals
such as copper, nickel or zinc, etc. Add 0.3
ml of a 15 percent solution of ethylenedia-
minetetraacetic acid (EDTA) tetrasodium salt,
for each 125 ml (4 oz.) sample volume prior to
sterilization {2, 3).
Samples are collected by hand or with a
sampling device if (1) depth samples are re-
quired or (2) the sampling site has difficult
access such as a manhole, dock, bridge or
bank adjacent to a surface water.
2,1 Chlorinated Samples: When samples,
such as treated waters, chlorinated wastewa-
ters or recreational waters, are collected, the
sample bottle must contain a dechlorinating
agent (see this Section, 1.3).
2.2 Composite Sampling: |_n no case
should a composite sample be collected for
bacteriological examination. Data from indi-
vidual samples show a range of values. A com-
posite sample will not display this range. Indi-
vidual results will give information about in-
dustrial process variations in flow and compo-
«»EPA MICROBIOLOGICAL MANUAL 1978
image:
1. Sample Containers
1.1 Sample Bottles: Bottles must be resis-
tant to sterilizing conditions and the solvent
action of water. Wide-mouth borosilicate glass
bottles with screw-cap or ground-glass stopper
or heat-resistant plastic bottles may be used
if they can be sterilized without producing toxic
materials {see suggested sample containers in
Figure II-A-1). Screw-caps must not produce
bacteriostatic or nutritive compounds upon
sterilization.
1.2 Selection and Cleansing of Bottles:
Sample bottles should be at least 125 ml vol-
ume for adequate sampling and for good mixing.
Bottles of 250 ml, 500 ml and 1000 ml volume
are often used for multiple analyses. Discard
bottles which have chips, cracks, and etched
surfaces. Bottle closures must be water-tight.
Before use, thoroughly cleanse bottles and
closures with detergent and hot water, fol-
lowed by a hot water rinse to remove all trace
of detergent. Then rinse them three times with
laboratory-pure water {II-B.6). A test for the
biological examination of glassware where
bacteriostatic or inhibitory residues may
be present, is described in Part 1V-A, 5.1.
1.5 Wrapping Bottles: Protect the tops
and necks of glass stoppered bottles from
contamination by covering them before sterili-
zation with aluminum foil or kraft paper.
1.6 Sterilization of Bottles: Autoclave
glass or heat-resistant plastic bottles at 121 C
for 15 minutes. Alternatively, dry glassware
may be sterilized in a hot air oven at 170 C for
not less than two hours. Ethylene oxide gas
sterilization is acceptable for plastic containers
that are not heat-resistant Sample bottles
sterilized by gas should be stored overnight
before being used to allow the last traces of
gas to dissipate. See Part il-B, 3 for steriliza-
tion procedures.
1.7 Plastic Bags: The commercially-
available bags (Whirl-pak) are a practical sub-
stitute for plastic or glass sample bottles in
sampling soil or sediment. See Figure ll-A-1.
The bags are sealed in manufacture and opened
only at time of sampling. The manufacturer
states that such bags are sterilized.
2. Sampling Techniques
1.3 Dechlorinating Agent: The agent
must be placed in the bottle when water and
wastewater samples containing residual chlo-
rine are anticipated. Add sodium thiosulfate to
the bottle before sterilization at a concentration
of 0.1 ml of a 10 percent solution for each
125 ml {4 oz.J sample volume (1). This concen-
tration will neutralize approximately 15 mg/l
of residue chlorine.
1,4 Chelating Agent: A chelating agent
should be added to sample bottles used to
collect samples suspected of containing
>0.01 mg/liter concentrations of heavy metals
such as copper, nickel or zinc, etc. Add 0.3
ml of a 15 percent solution of ethylenedia-
minetetraacetic acid (EDTA) tetrasodium salt,
for each 125 ml (4 oz.) sample volume prior to
sterilization {2, 3).
Samples are collected by hand or with a
sampling device if (1) depth samples are re-
quired or (2) the sampling site has difficult
access such as a manhole, dock, bridge or
bank adjacent to a surface water.
2,1 Chlorinated Samples: When samples,
such as treated waters, chlorinated wastewa-
ters or recreational waters, are collected, the
sample bottle must contain a dechlorinating
agent (see this Section, 1.3).
2.2 Composite Sampling: |_n no case
should a composite sample be collected for
bacteriological examination. Data from indi-
vidual samples show a range of values. A com-
posite sample will not display this range. Indi-
vidual results will give information about in-
dustrial process variations in flow and compo-
«»EPA MICROBIOLOGICAL MANUAL 1978
image:
 B
FIGURE ll-A-1. Suggested Sample Containers
A Screw-cap Glass or Plastic Bottle.
B Plastic Bag (Whiri-pak).
C Glass Stoppered Bottle.
SAMPLING TECHNIQUES
image:
B
FIGURE ll-A-1. Suggested Sample Containers
A Screw-cap Glass or Plastic Bottle.
B Plastic Bag (Whiri-pak).
C Glass Stoppered Bottle.
SAMPLING TECHNIQUES
image:
 sition. Also, one or more portions that make up
a composite sample may contain toxic or nutri-
tive materials and cause erroneous results.
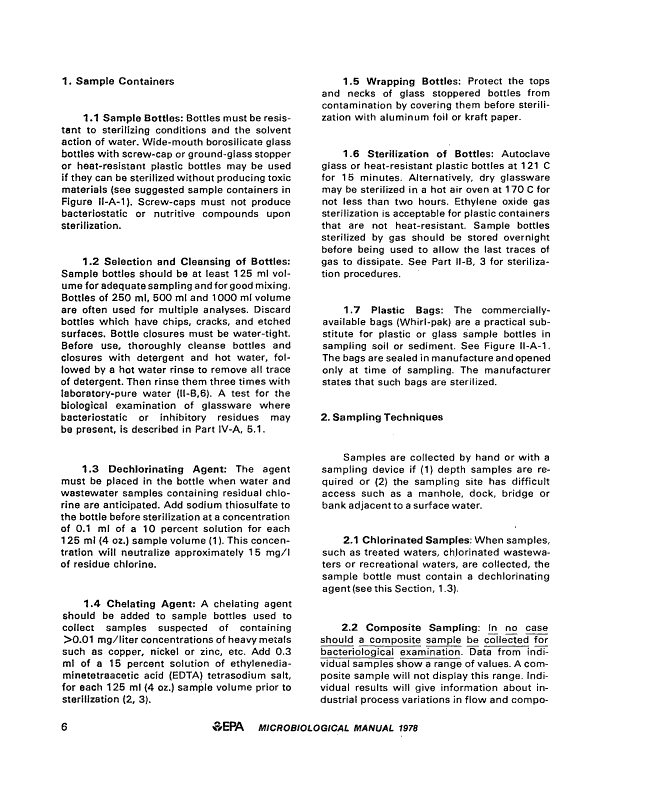
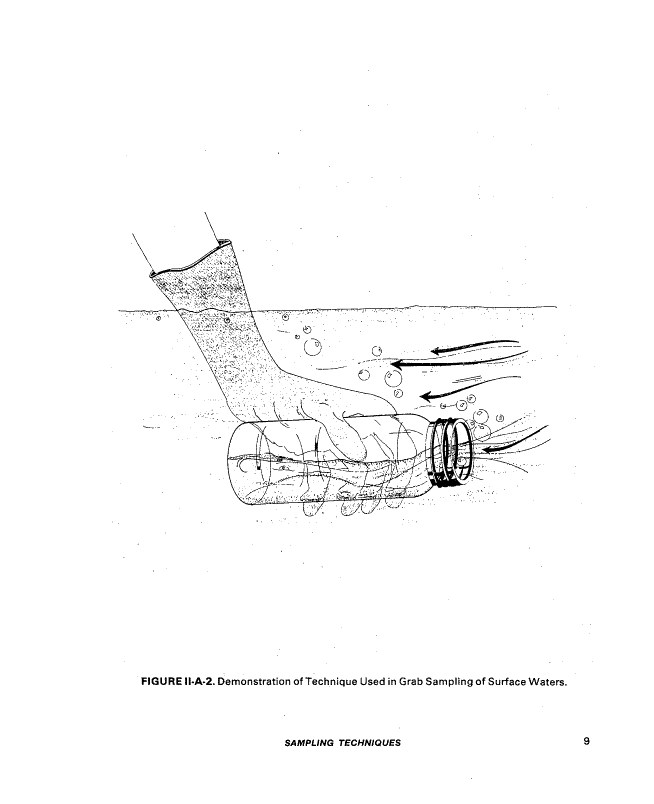
2.3 Surface Sampling by Hand: A grab
sample is obtained using a sample bottle pre-
pared as described in 1. above. Identify the
sampling site on a chain of custody tag if
required, or on the bottle label and on a field
log sheet (see 3J, Remove the bottle covering
and closure and protect from contamination.
Grasp the bottle at the base with one hand and
plunge the bottle mouth down into the water to
avoid introducing surface scum. Position the
mouth of the bottle into the current away from
the hand of the collector and away from the
side of the sampling platform or boat (see
Figure ll-A-2). The sampling depth should be
15 to 30 cm (6 to 12 inches) below the water
surface. If the water body is static, an artificial
current can be created, by moving the bottle
horizontally in the direction it is pointed and
away from the sampler. Tip the bottle slightly
upwards to allow air to exit and the bottle to
fill. After removal of the bottle from the stream,
pour out a small portion of the sample to allow
an air space of 2.5 to 5 cm (1 to 2 inches)
above each sample for proper mixing of the
sample before analyses. Tightly stopper and
label the bottle.
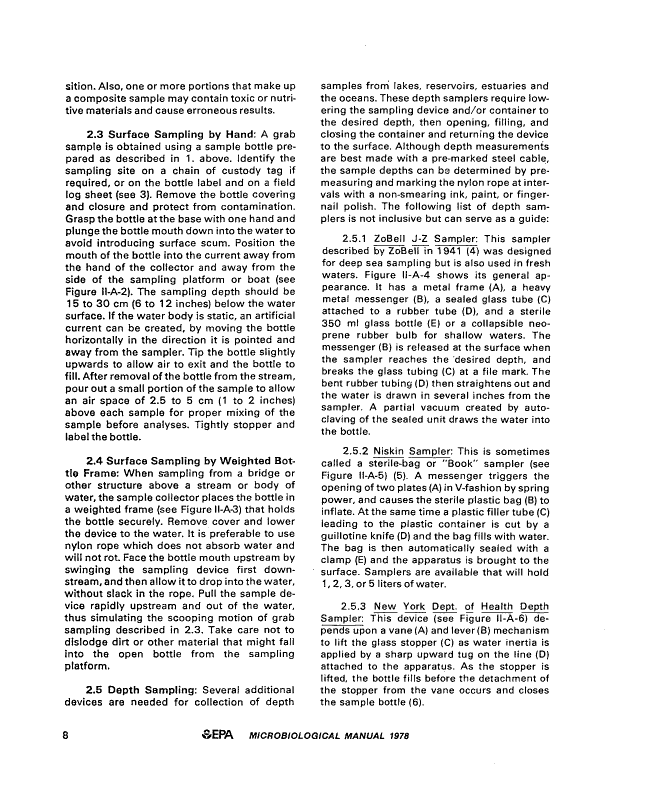
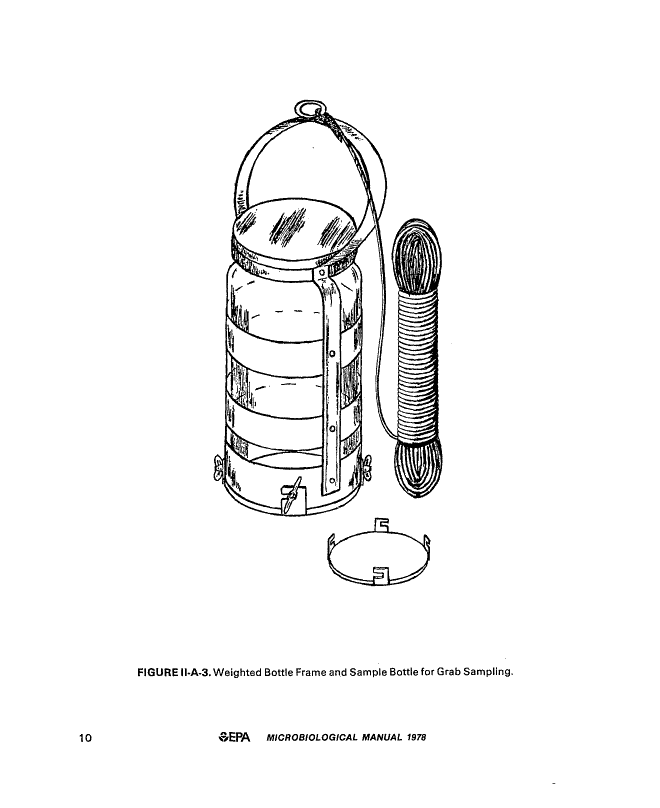
2A Surface Sampling by Weighted Bot-
tle Frame: When sampling from a bridge or
other structure above a stream or body of
water, the sample collector places the bottle in
a weighted frame (see Figure II-A-3) that holds
the bottle securely. Remove cover and lower
the device to the water. It is preferable to use
nylon rope which does not absorb water and
will not rot. Face the bottle mouth upstream by
swinging the sampling device first down-
stream, and then allow it to drop into the water,
without slack in the rope. Pull the sample de-
vice rapidly upstream and out of the water,
thus simulating the scooping motion of grab
sampling described in 2.3. Take care not to
dislodge dirt or other material that might fall
into the open bottle from the sampling
platform.
2.5 Depth Sampling: Several additional
devices are needed for collection of depth
samples from lakes, reservoirs, estuaries and
the oceans. These depth samplers require low-
ering the sampling device and/or container to
the desired depth, then opening, filling, and
closing the container and returning the device
to the surface. Although depth measurements
are best made with a pre-marked steel cable,
the sample depths can be determined by pre-
measuring and marking the nylon rope at inter-
vals with a non-smearing ink, paint, or finger-
nail polish. The following list of depth sam-
plers is not inclusive but can serve as a guide:
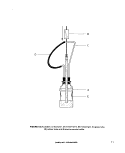
2.5.1 ZoBell J-Z Sampler: This sampler
described by ZoBell in 1941 (4) was designed
for deep sea sampling but is also used in fresh
waters. Figure ll-A-4 shows its general ap-
pearance. It has a metal frame (A), a heavy
metal messenger (B), a sealed glass tube (C)
attached to a rubber tube (D), and a sterile
350 ml glass bottle (E) or a collapsible neo-
prene rubber bulb for shallow waters. The
messenger (B) is released at the surface when
the sampler reaches the 'desired depth, and
breaks the glass tubing (C) at a file mark. The
bent rubber tubing (D) then straightens out and
the water is drawn in several inches from the
sampler. A partial vacuum created by auto-
claving of the sealed unit draws the water into
the bottle.
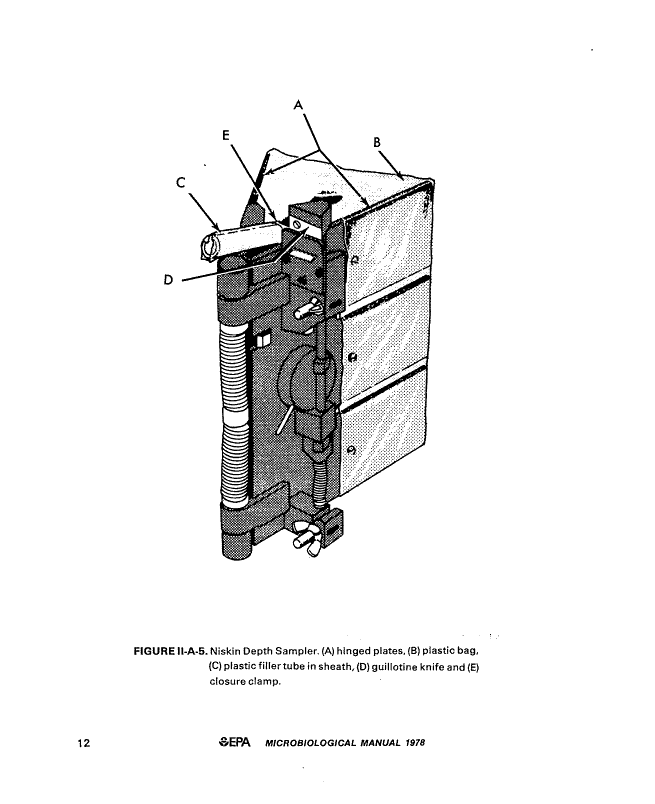
2.5.2 Niskin Sampler: This is sometimes
called a sterile-bag or "Book" sampler (see
Figure ll-A-5) (5). A messenger triggers the
opening of two plates (A) in V-fashion by spring
power, and causes the sterile plastic bag (B) to
inflate. At the same time a plastic filler tube (C)
leading to the plastic container is cut by a
guillotine knife (D) and the bag fills with water.
The bag is then automatically sealed with a
clamp (E) and the apparatus is brought to the
surface. Samplers are available that will hold
1,2,3, or 5 liters of water.
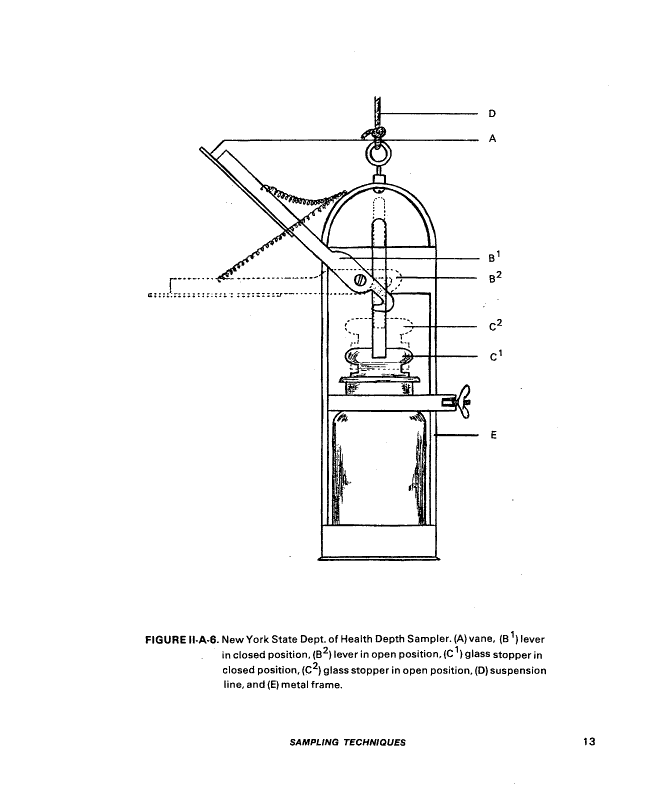
2.5.3 New York Dept. of Health Depth
Sampler: This device (see Figure ll-A-6) de-
pends upon a vane (A) and lever (B) mechanism
to lift the glass stopper (C) as water inertia is
applied by a sharp upward tug on the line (D)
attached to the apparatus. As the stopper is
lifted, the bottle fills before the detachment of
the stopper from the vane occurs and closes
the sample bottle (6).
MICROBIOLOGICAL MANUAL 1978
image:
sition. Also, one or more portions that make up
a composite sample may contain toxic or nutri-
tive materials and cause erroneous results.
2.3 Surface Sampling by Hand: A grab
sample is obtained using a sample bottle pre-
pared as described in 1. above. Identify the
sampling site on a chain of custody tag if
required, or on the bottle label and on a field
log sheet (see 3J, Remove the bottle covering
and closure and protect from contamination.
Grasp the bottle at the base with one hand and
plunge the bottle mouth down into the water to
avoid introducing surface scum. Position the
mouth of the bottle into the current away from
the hand of the collector and away from the
side of the sampling platform or boat (see
Figure ll-A-2). The sampling depth should be
15 to 30 cm (6 to 12 inches) below the water
surface. If the water body is static, an artificial
current can be created, by moving the bottle
horizontally in the direction it is pointed and
away from the sampler. Tip the bottle slightly
upwards to allow air to exit and the bottle to
fill. After removal of the bottle from the stream,
pour out a small portion of the sample to allow
an air space of 2.5 to 5 cm (1 to 2 inches)
above each sample for proper mixing of the
sample before analyses. Tightly stopper and
label the bottle.
2A Surface Sampling by Weighted Bot-
tle Frame: When sampling from a bridge or
other structure above a stream or body of
water, the sample collector places the bottle in
a weighted frame (see Figure II-A-3) that holds
the bottle securely. Remove cover and lower
the device to the water. It is preferable to use
nylon rope which does not absorb water and
will not rot. Face the bottle mouth upstream by
swinging the sampling device first down-
stream, and then allow it to drop into the water,
without slack in the rope. Pull the sample de-
vice rapidly upstream and out of the water,
thus simulating the scooping motion of grab
sampling described in 2.3. Take care not to
dislodge dirt or other material that might fall
into the open bottle from the sampling
platform.
2.5 Depth Sampling: Several additional
devices are needed for collection of depth
samples from lakes, reservoirs, estuaries and
the oceans. These depth samplers require low-
ering the sampling device and/or container to
the desired depth, then opening, filling, and
closing the container and returning the device
to the surface. Although depth measurements
are best made with a pre-marked steel cable,
the sample depths can be determined by pre-
measuring and marking the nylon rope at inter-
vals with a non-smearing ink, paint, or finger-
nail polish. The following list of depth sam-
plers is not inclusive but can serve as a guide:
2.5.1 ZoBell J-Z Sampler: This sampler
described by ZoBell in 1941 (4) was designed
for deep sea sampling but is also used in fresh
waters. Figure ll-A-4 shows its general ap-
pearance. It has a metal frame (A), a heavy
metal messenger (B), a sealed glass tube (C)
attached to a rubber tube (D), and a sterile
350 ml glass bottle (E) or a collapsible neo-
prene rubber bulb for shallow waters. The
messenger (B) is released at the surface when
the sampler reaches the 'desired depth, and
breaks the glass tubing (C) at a file mark. The
bent rubber tubing (D) then straightens out and
the water is drawn in several inches from the
sampler. A partial vacuum created by auto-
claving of the sealed unit draws the water into
the bottle.
2.5.2 Niskin Sampler: This is sometimes
called a sterile-bag or "Book" sampler (see
Figure ll-A-5) (5). A messenger triggers the
opening of two plates (A) in V-fashion by spring
power, and causes the sterile plastic bag (B) to
inflate. At the same time a plastic filler tube (C)
leading to the plastic container is cut by a
guillotine knife (D) and the bag fills with water.
The bag is then automatically sealed with a
clamp (E) and the apparatus is brought to the
surface. Samplers are available that will hold
1,2,3, or 5 liters of water.
2.5.3 New York Dept. of Health Depth
Sampler: This device (see Figure ll-A-6) de-
pends upon a vane (A) and lever (B) mechanism
to lift the glass stopper (C) as water inertia is
applied by a sharp upward tug on the line (D)
attached to the apparatus. As the stopper is
lifted, the bottle fills before the detachment of
the stopper from the vane occurs and closes
the sample bottle (6).
MICROBIOLOGICAL MANUAL 1978
image:
 FIGURE II-A-2. Demonstration of Technique Used in Grab Sampling of Surface Waters.
SAMPLING TECHNIQUES
image:
FIGURE II-A-2. Demonstration of Technique Used in Grab Sampling of Surface Waters.
SAMPLING TECHNIQUES
image:
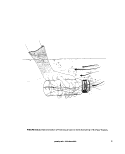 FIGURE II-A-3. Weighted Bottle Frame and Sample Bottle for Grab Sampling.
10
4>EPA MICROBIOLOGICAL MANUAL 1978
image:
FIGURE II-A-3. Weighted Bottle Frame and Sample Bottle for Grab Sampling.
10
4>EPA MICROBIOLOGICAL MANUAL 1978
image:
 D
B
A
E
FIGURE ll-A-4. Zobell J-Z Sampler. (A) metal frame, (B) messenger, (C) glass tube,
(D) rubber tube and (E) sterile sample bottle.
SAMPLING TECHNIQUES
11
image:
D
B
A
E
FIGURE ll-A-4. Zobell J-Z Sampler. (A) metal frame, (B) messenger, (C) glass tube,
(D) rubber tube and (E) sterile sample bottle.
SAMPLING TECHNIQUES
11
image:
 B
FIGURE II-A-5. Niskin Depth Sampler. (A) hinged plates, (B) plastic bag,
(C) plastic filler tube in sheath, (D) guillotine knife and (E)
closure clamp.
12
<&EPA MICROBIOLOGICAL MANUAL 1978
image:
B
FIGURE II-A-5. Niskin Depth Sampler. (A) hinged plates, (B) plastic bag,
(C) plastic filler tube in sheath, (D) guillotine knife and (E)
closure clamp.
12
<&EPA MICROBIOLOGICAL MANUAL 1978
image:
 D
A
FIGURE ll-A-6. New York State Dept. of Health Depth Sampler. (A) vane, (B1) lever
in closed position, (B2) lever in open position, (C1) glass stopper in
closed position, (C ) glass stopper in open position, (D) suspension
line, and (E) metal frame.
SAMPLING TECHNIQUES
13
image:
D
A
FIGURE ll-A-6. New York State Dept. of Health Depth Sampler. (A) vane, (B1) lever
in closed position, (B2) lever in open position, (C1) glass stopper in
closed position, (C ) glass stopper in open position, (D) suspension
line, and (E) metal frame.
SAMPLING TECHNIQUES
13
image:
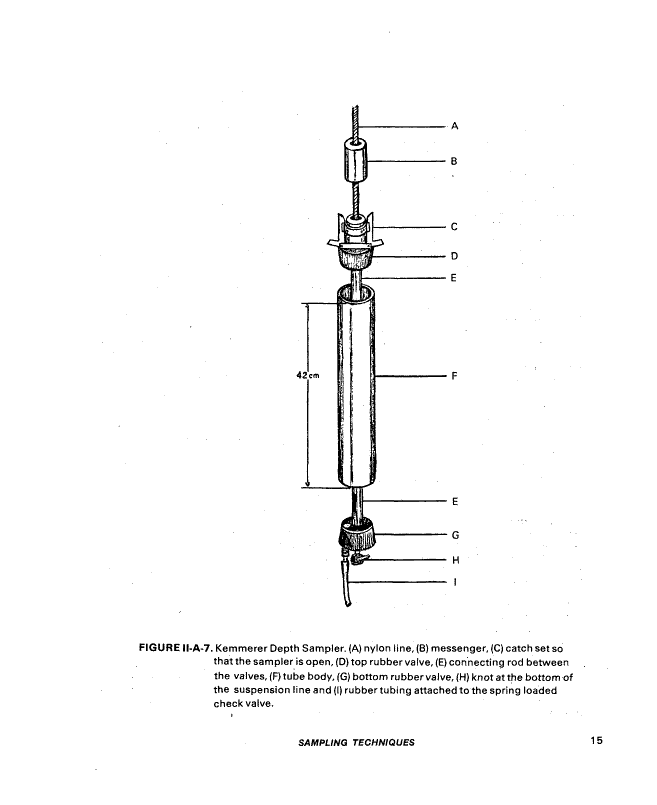
 2«5-4 Kemmerer Sampler (7): This depth
sampler (see Figure Il-A-7) has been used with-
out sterilization to collect bacteriological
water samples in high pollution areas. The
sampler consists of a cylindrical brass or plas-
tic tube (F) that contains a rubber stopper or
valve at either end (D and G). The valves are
connected to a rod (E) that passes through the
center of the cylinder. The device is lowered
into the water in the open position, and a water
sample is trapped in the cylinder when the
valves are closed by a dropped messenger (B).
The Kemmerer sampler should not be used for
collecting bacteriological samples without ob-
taining data that support its use without
sterilization.
2.6 Sediment Sampling with Van
Donsel-Geldreich Sampler (8): This device
(see Figure I1-A-8J collects sediment or mud in
sterile "Whlrl-Pak" plastic bags (A) down to 60
foot depth. The bag mouth is wrapped over
a nosepiece (B), and the bag is kept closed
during descent to the bottom by a bag clamp
bar (H). As the mud plate (D) contacts the bot-
tom, the nosepiece (B) is driven into the sedi-
ment by the weight (C) of the sampler. As the
nosepiece (B) moves downward, the bag (A)
slides through the bag clamp bar (H), opens,
and fills with sediment. The bag is sealed when
the double noose (F) tied to the bottom of the
bag is pulled, before the apparatus is returned
to the surface.
2.7 Water Tap Sampling: Make certain
that samples are not collected from spigots
that leak around their stems, or from spigots
that contain aeration devices or screens within
the faucet. For samples taken from direct water
main connections, the spigot should be flushed
for 2-3 minutes to clear the service line. For
wells equipped with hand or mechanical
pumps, pump the water to waste for five min-
utes before the sample is collected. Remove
the cap aseptically from the sample bottle. Hold
the sample bottle upright near the base while it
is being filled. Avoid splashing. Do not rinse the
bottle with the sample; fill it directly to within
2.5 cm (1 inch) from the top. Replace bottle
closure and hood covering. Caution must be
used to prevent contaminating the sample with
finger, gloves or other materials. If the well
does not have pumping machinery, collect the
sample using a weighted sterilized sample
bottle, such as described in 2.4 above, and
shown in Figure ll-A-3. Care must be taken to
avoid contaminating the sample with the sur-
face scum from the water surface.
2.8 Soil Sampling
2.8.1 Selection of the sampling site is
based on knowledge of the area and the pur-
poses of the analyses, i.e., surface sampling for
natural background, surface contamination, or
below surface sampling to monitor treatment
effect such as irrigation, or stormwater runoff.
The actual sites for sampling and the num-
ber of points to be sampled must be predeter-
mined by the survey objectives. Soil sampling
has the advantage of permitting the survey
planners to lay out a stable grid network for
sampling and resampling over a given time
period.
2.8.2 If a surface sample is desired, scrape
the top one inch of soil from a square foot area
using a sterile scoop or spoon.
If a subsurface sample is desired, use a
sterile scoop or spatula to remove the top
surface of one inch or more from a one foot
square area. Use a second sterile scoop or
spoon to take the sample.
Place samplings in a sterile one quart
screw-cap bottle until it is full. Depending on
the amount of moisture, a one quart bottle
holds 300-800 grams of soil. Label and tag
the bottle carefully and store at 4 C until
analyzed.
3. Sample Identification and Handling
3.1 Specific details on sample identifica-
tion are entered on a permanent label. Take
care in transcribing sampling information to
the label, because the enforcement action may
depend upon evidence of primary labeling.
See 4. in This Section. Labels must be clean.
14
&EPA MICROBIOLOGICAL MANUAL 1978
image:
2«5-4 Kemmerer Sampler (7): This depth
sampler (see Figure Il-A-7) has been used with-
out sterilization to collect bacteriological
water samples in high pollution areas. The
sampler consists of a cylindrical brass or plas-
tic tube (F) that contains a rubber stopper or
valve at either end (D and G). The valves are
connected to a rod (E) that passes through the
center of the cylinder. The device is lowered
into the water in the open position, and a water
sample is trapped in the cylinder when the
valves are closed by a dropped messenger (B).
The Kemmerer sampler should not be used for
collecting bacteriological samples without ob-
taining data that support its use without
sterilization.
2.6 Sediment Sampling with Van
Donsel-Geldreich Sampler (8): This device
(see Figure I1-A-8J collects sediment or mud in
sterile "Whlrl-Pak" plastic bags (A) down to 60
foot depth. The bag mouth is wrapped over
a nosepiece (B), and the bag is kept closed
during descent to the bottom by a bag clamp
bar (H). As the mud plate (D) contacts the bot-
tom, the nosepiece (B) is driven into the sedi-
ment by the weight (C) of the sampler. As the
nosepiece (B) moves downward, the bag (A)
slides through the bag clamp bar (H), opens,
and fills with sediment. The bag is sealed when
the double noose (F) tied to the bottom of the
bag is pulled, before the apparatus is returned
to the surface.
2.7 Water Tap Sampling: Make certain
that samples are not collected from spigots
that leak around their stems, or from spigots
that contain aeration devices or screens within
the faucet. For samples taken from direct water
main connections, the spigot should be flushed
for 2-3 minutes to clear the service line. For
wells equipped with hand or mechanical
pumps, pump the water to waste for five min-
utes before the sample is collected. Remove
the cap aseptically from the sample bottle. Hold
the sample bottle upright near the base while it
is being filled. Avoid splashing. Do not rinse the
bottle with the sample; fill it directly to within
2.5 cm (1 inch) from the top. Replace bottle
closure and hood covering. Caution must be
used to prevent contaminating the sample with
finger, gloves or other materials. If the well
does not have pumping machinery, collect the
sample using a weighted sterilized sample
bottle, such as described in 2.4 above, and
shown in Figure ll-A-3. Care must be taken to
avoid contaminating the sample with the sur-
face scum from the water surface.
2.8 Soil Sampling
2.8.1 Selection of the sampling site is
based on knowledge of the area and the pur-
poses of the analyses, i.e., surface sampling for
natural background, surface contamination, or
below surface sampling to monitor treatment
effect such as irrigation, or stormwater runoff.
The actual sites for sampling and the num-
ber of points to be sampled must be predeter-
mined by the survey objectives. Soil sampling
has the advantage of permitting the survey
planners to lay out a stable grid network for
sampling and resampling over a given time
period.
2.8.2 If a surface sample is desired, scrape
the top one inch of soil from a square foot area
using a sterile scoop or spoon.
If a subsurface sample is desired, use a
sterile scoop or spatula to remove the top
surface of one inch or more from a one foot
square area. Use a second sterile scoop or
spoon to take the sample.
Place samplings in a sterile one quart
screw-cap bottle until it is full. Depending on
the amount of moisture, a one quart bottle
holds 300-800 grams of soil. Label and tag
the bottle carefully and store at 4 C until
analyzed.
3. Sample Identification and Handling
3.1 Specific details on sample identifica-
tion are entered on a permanent label. Take
care in transcribing sampling information to
the label, because the enforcement action may
depend upon evidence of primary labeling.
See 4. in This Section. Labels must be clean.
14
&EPA MICROBIOLOGICAL MANUAL 1978
image:
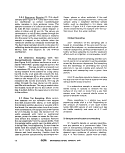 42 em
G
H
I
FIGURE ll-A-7. Kemmerer Depth Sampler. (A) nylon line, (B) messenger, (C) catch set so
that the sampler is open, (D)top rubber valve, (E) connecting rod between
the valves,(F)tube body,(G) bottom rubbervalve, (H) knot atthe bottom of
the suspension line and (I) rubber tubing attached to the spring loaded
check valve.
SAMPLING TECHNIQUES
15
image:
42 em
G
H
I
FIGURE ll-A-7. Kemmerer Depth Sampler. (A) nylon line, (B) messenger, (C) catch set so
that the sampler is open, (D)top rubber valve, (E) connecting rod between
the valves,(F)tube body,(G) bottom rubbervalve, (H) knot atthe bottom of
the suspension line and (I) rubber tubing attached to the spring loaded
check valve.
SAMPLING TECHNIQUES
15
image:
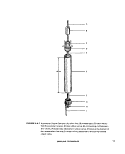 FIGURE II-A-8. Van bonsel-Geidreich Sediment Sampler. (A) sterile "Whiri-Pak" plastic
bag, (B) nose piece, (C) weight, (D) mud plate, (E) slide bar, (F) part of the
double noose, (G) attachment for the suspension line and (H) bag clamp
bar.
16
MICROBIOLOGICAL MANUAL 1978
image:
FIGURE II-A-8. Van bonsel-Geidreich Sediment Sampler. (A) sterile "Whiri-Pak" plastic
bag, (B) nose piece, (C) weight, (D) mud plate, (E) slide bar, (F) part of the
double noose, (G) attachment for the suspension line and (H) bag clamp
bar.
16
MICROBIOLOGICAL MANUAL 1978
image:
 waterproof, non-smearing and of sufficient
size for the necessary information. Label must
be securely attached to the sample bottle, but
removable when necessary. Do not accept in-
sufficiently or improperly labeled samples for
examination. A sample label showing the mini-
mum information required is pictured in Figure
ll-A-9.
3.2 Field Data Record: A field record
should be completed on each sample to record
the full details on sampling and other pertinent
remarks such as flooding, rain or extreme tem-
perature which are relevant to interpretation of
results. This record also provides a back-up
record of sample identification. One example
is shown in Figure ll-A-10.
3.3 Marking Device: A marking pen or
other device must be non-smearing if wetted,
and maintain a permanent legible mark.
3.4 Transport Container: Insulated ice
containers in which the sample can be held, are
recommended.
3.5 Storage of Samples: A refrigerator is
necessary for storage of samples at the labora-
tory. The temperature range of the refrigerator
is 1-4C.
4. Chain of Custody Procedures
4.1 General: An agency must demon-
strate the reliability of its evidence in pollution
cases by proving the.chain of possession and
custody of samples which are offered for evi-
dence or which form the basis of analytical
results introduced into evidence. It is impera-
tive that the office and laboratory prepare writ-
ten procedures to be followed whenever evi-
dence samples are collected, transferred,
stored, analyzed, or destroyed.
4.1.1 The primary objective of these pro-
cedures is to create an accurate written record
which can be used to trace the possession of
the sample from the moment of its collection
through its introduction into evidence. A sam-
ple is in custody if it is:
(a) in actual physical possession, or
(b) in view after being in physical posses-
sion, or
(c) in physical possession and locked up so
that no one could tamper with it.
4.1.2 Personnel should receive copies of
study plans and know the contents prior to the
study. A pre-study briefing shall be held to
appraise participants of the objectives, sample
locations and chain of custody procedures.
After chain of custody samples are collected, a
de-briefing is held in the field to determine
adherence to chain of custody procedures and
whether additional samples are required.
4.2 Rules for Sample Collection
4.2.1 Handle the samples as little as
possible.
4.2.2 Obtain stream and effluent samples
using standard microbiological sampling
techniques.
4.2.3 Attach sample tag or;label (Figure
II-A- 9 i to the sample container. The tag or
label should contain as a minimum: serial
number of label, location, date andtime taken,
type of sample, sequence number (first sample
of the day - sequence No. 1, second sample,
sequence No. 2, etc), analyses required and
sample collector. The tags must be filled out
legibly in waterproof ink.
4.2.4 Use a bound notebook to record
field measurements and other pertinent
information necessary to refresh the sampler's
memory if the person later becomes a witness
in an enforcment proceeding. A separate set of
field notebooks should be maintained for each
study and stored in a safe place where it can
be protected and accounted for. A sample log
sheet with a standard format should be
established to minimize field entries and
include the date, time, survey.type of samples,
volume of each sample, type of analyses,
label and sample numbers, sample location,
field measurements such as temperature,
conductivity, DO, pH, and any other pertinent
SAMPLING TECHNIQUES
17
image:
waterproof, non-smearing and of sufficient
size for the necessary information. Label must
be securely attached to the sample bottle, but
removable when necessary. Do not accept in-
sufficiently or improperly labeled samples for
examination. A sample label showing the mini-
mum information required is pictured in Figure
ll-A-9.
3.2 Field Data Record: A field record
should be completed on each sample to record
the full details on sampling and other pertinent
remarks such as flooding, rain or extreme tem-
perature which are relevant to interpretation of
results. This record also provides a back-up
record of sample identification. One example
is shown in Figure ll-A-10.
3.3 Marking Device: A marking pen or
other device must be non-smearing if wetted,
and maintain a permanent legible mark.
3.4 Transport Container: Insulated ice
containers in which the sample can be held, are
recommended.
3.5 Storage of Samples: A refrigerator is
necessary for storage of samples at the labora-
tory. The temperature range of the refrigerator
is 1-4C.
4. Chain of Custody Procedures
4.1 General: An agency must demon-
strate the reliability of its evidence in pollution
cases by proving the.chain of possession and
custody of samples which are offered for evi-
dence or which form the basis of analytical
results introduced into evidence. It is impera-
tive that the office and laboratory prepare writ-
ten procedures to be followed whenever evi-
dence samples are collected, transferred,
stored, analyzed, or destroyed.
4.1.1 The primary objective of these pro-
cedures is to create an accurate written record
which can be used to trace the possession of
the sample from the moment of its collection
through its introduction into evidence. A sam-
ple is in custody if it is:
(a) in actual physical possession, or
(b) in view after being in physical posses-
sion, or
(c) in physical possession and locked up so
that no one could tamper with it.
4.1.2 Personnel should receive copies of
study plans and know the contents prior to the
study. A pre-study briefing shall be held to
appraise participants of the objectives, sample
locations and chain of custody procedures.
After chain of custody samples are collected, a
de-briefing is held in the field to determine
adherence to chain of custody procedures and
whether additional samples are required.
4.2 Rules for Sample Collection
4.2.1 Handle the samples as little as
possible.
4.2.2 Obtain stream and effluent samples
using standard microbiological sampling
techniques.
4.2.3 Attach sample tag or;label (Figure
II-A- 9 i to the sample container. The tag or
label should contain as a minimum: serial
number of label, location, date andtime taken,
type of sample, sequence number (first sample
of the day - sequence No. 1, second sample,
sequence No. 2, etc), analyses required and
sample collector. The tags must be filled out
legibly in waterproof ink.
4.2.4 Use a bound notebook to record
field measurements and other pertinent
information necessary to refresh the sampler's
memory if the person later becomes a witness
in an enforcment proceeding. A separate set of
field notebooks should be maintained for each
study and stored in a safe place where it can
be protected and accounted for. A sample log
sheet with a standard format should be
established to minimize field entries and
include the date, time, survey.type of samples,
volume of each sample, type of analyses,
label and sample numbers, sample location,
field measurements such as temperature,
conductivity, DO, pH, and any other pertinent
SAMPLING TECHNIQUES
17
image:
 o
w
at
C3
2
<
ce
Ul
CO
EPA, NATIONAL ENFORCEMENT
Station No. Date
Station Location
BOD Metals
Solids Oil and Grease
COD D.O.
.Nutrients Bact.
Other
Samplers!
INVESTIGATIONS CENTER
Time Sequence No.
Grab
Comp.
Remarks/Preservativet
FIGURE ll-A-9. Example of a Sample Label.
s
ERIAL SHEET NO.
STATION
(
San
FIELD DATA RECORD
SAMPLE
NUMBER
DATE OF
COUJCTION
TIME (MRS)
SAMPLE
TAXIN
SAMPLE
XlCtiVtO ff IM
(*«
TEMP
•c
OTHER
REMARKS
US EPA. NEIC-Donvar
FIGURE ll-A-10. Field Data Record.
18
MICROBIOLOGICAL MANUAL 1978
image:
o
w
at
C3
2
<
ce
Ul
CO
EPA, NATIONAL ENFORCEMENT
Station No. Date
Station Location
BOD Metals
Solids Oil and Grease
COD D.O.
.Nutrients Bact.
Other
Samplers!
INVESTIGATIONS CENTER
Time Sequence No.
Grab
Comp.
Remarks/Preservativet
FIGURE ll-A-9. Example of a Sample Label.
s
ERIAL SHEET NO.
STATION
(
San
FIELD DATA RECORD
SAMPLE
NUMBER
DATE OF
COUJCTION
TIME (MRS)
SAMPLE
TAXIN
SAMPLE
XlCtiVtO ff IM
(*«
TEMP
•c
OTHER
REMARKS
US EPA. NEIC-Donvar
FIGURE ll-A-10. Field Data Record.
18
MICROBIOLOGICAL MANUAL 1978
image:
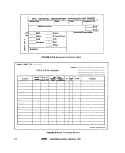 information or observation (Figure ll-A-1 1). The
entries should be signed by the sample
collector. The responsibility for preparing and
storing sample notebooks during and after a
study should be assigned to a study
coordinator, or his designated representative.
4.2.5 A field collector is responsible for
the samples collected until properly dis-
patched to the receiving laboratory or turned
over to an assigned custodian. He must assure
that each container is in his physical posses-
sion or in his view at all times, or stored in a
locked place where no one can tamper with it.
4.2.6 Color slides or photographs should
be taken of the sample location and any visible
water pollution. The signature of the photo-
grapher, time, date, and site location must be
written on the back of the photo. Such photo-
graphs should be handled according to the
established chain of custody procedures to
prevent alteration.
4.3 Transfer of Custody and Shipment
In transfer of custody procedures, each
custodian of samples must sign, record and
date the transfer. Most regulatory agencies
develop chain of custody procedures tailored
to their needs. These procedures may vary in
format and language but contain the same
essential elements. Historically, sample trans-
fer under chain of custody has been on a
sample by sample basis which is awkward and
time-consuming. However, EPA's National En-
forcement Investigation Center (NEIC), Denver
has set a precedent with its bulk transfer of
samples. Bulk transfer is speedier, reduces
paperwork and the number of sample custodi-
ans. The following description of chain of cus-
tody is essentially that of NEIC-Denver (9).
4.3.1 Samples must be accompanied by a
Chain of Custody Record which includes the
name of the study, collector's signature, sta-
tion number, station location, date, time, type
of sample, sequence number, number of con-
tainers and analyses required (Figure ll-A-12).
When turning over the possession of samples,
the transferor and transferee sign, date and
note time on the sheet. This record sheet al-
lows transfer of custody of a group of samples
in the field, to the mobile laboratory or to the
NEIC-Denver laboratory.: When a custodian
transfers a portion of the samples identified on
the sheet to the field mobile laboratory, the
individual samples must be noted in the col-
umn with the signature of the person relin-
quishing the samples. The field laboratory per-
son receiving the samples acknowledges re-
ceipt by signing in the appropriate column.
4.3.2 If a custodian has not been
assigned, the field custodian or field sampler
has the responsibility for packaging and
dispatching samples to the laboratory for
analysis. The "Dispatch" portion of the Chain
of Custody Record must be filled out, dated,
and signed.
4.3.3 Samples must be carefully packed in
shipment containers such as ice chests, to
avoid breakage. The shipping containers are
padlocked for shipment to the receiving
laboratory.
4.3.4 Packages must be accompanied by
the Chain of Custody Record showing
identification of the contents. The original
must accompany the shipment. A copy is
retained by the survey coordinator.
4.3.5 If samples are delivered to the
laboratory when appropriate personnel are not
there to receive them, the samples must be
locked in a designated area within the
laboratory so that no one can tamper with
them. This same person must return to the
laboratory, unlock the samples and deliver
custody to the appropriate custodian.
4.4 Laboratory Custody Procedures
4.4.1 The laboratory shall designate a
"sample custodian" and an alternate to act in
his absence. In addition, the laboratory shall
set aside as a "sample storage security area",
an isolated room with sufficient refrigerator
space, which can be locked or just a locked
refrigerator in smaller laboratories.
4.4.2 Samples should be handled by the
minimum possible number of persons.
SAMPLING TECHNIQUES
19
image:
information or observation (Figure ll-A-1 1). The
entries should be signed by the sample
collector. The responsibility for preparing and
storing sample notebooks during and after a
study should be assigned to a study
coordinator, or his designated representative.
4.2.5 A field collector is responsible for
the samples collected until properly dis-
patched to the receiving laboratory or turned
over to an assigned custodian. He must assure
that each container is in his physical posses-
sion or in his view at all times, or stored in a
locked place where no one can tamper with it.
4.2.6 Color slides or photographs should
be taken of the sample location and any visible
water pollution. The signature of the photo-
grapher, time, date, and site location must be
written on the back of the photo. Such photo-
graphs should be handled according to the
established chain of custody procedures to
prevent alteration.
4.3 Transfer of Custody and Shipment
In transfer of custody procedures, each
custodian of samples must sign, record and
date the transfer. Most regulatory agencies
develop chain of custody procedures tailored
to their needs. These procedures may vary in
format and language but contain the same
essential elements. Historically, sample trans-
fer under chain of custody has been on a
sample by sample basis which is awkward and
time-consuming. However, EPA's National En-
forcement Investigation Center (NEIC), Denver
has set a precedent with its bulk transfer of
samples. Bulk transfer is speedier, reduces
paperwork and the number of sample custodi-
ans. The following description of chain of cus-
tody is essentially that of NEIC-Denver (9).
4.3.1 Samples must be accompanied by a
Chain of Custody Record which includes the
name of the study, collector's signature, sta-
tion number, station location, date, time, type
of sample, sequence number, number of con-
tainers and analyses required (Figure ll-A-12).
When turning over the possession of samples,
the transferor and transferee sign, date and
note time on the sheet. This record sheet al-
lows transfer of custody of a group of samples
in the field, to the mobile laboratory or to the
NEIC-Denver laboratory.: When a custodian
transfers a portion of the samples identified on
the sheet to the field mobile laboratory, the
individual samples must be noted in the col-
umn with the signature of the person relin-
quishing the samples. The field laboratory per-
son receiving the samples acknowledges re-
ceipt by signing in the appropriate column.
4.3.2 If a custodian has not been
assigned, the field custodian or field sampler
has the responsibility for packaging and
dispatching samples to the laboratory for
analysis. The "Dispatch" portion of the Chain
of Custody Record must be filled out, dated,
and signed.
4.3.3 Samples must be carefully packed in
shipment containers such as ice chests, to
avoid breakage. The shipping containers are
padlocked for shipment to the receiving
laboratory.
4.3.4 Packages must be accompanied by
the Chain of Custody Record showing
identification of the contents. The original
must accompany the shipment. A copy is
retained by the survey coordinator.
4.3.5 If samples are delivered to the
laboratory when appropriate personnel are not
there to receive them, the samples must be
locked in a designated area within the
laboratory so that no one can tamper with
them. This same person must return to the
laboratory, unlock the samples and deliver
custody to the appropriate custodian.
4.4 Laboratory Custody Procedures
4.4.1 The laboratory shall designate a
"sample custodian" and an alternate to act in
his absence. In addition, the laboratory shall
set aside as a "sample storage security area",
an isolated room with sufficient refrigerator
space, which can be locked or just a locked
refrigerator in smaller laboratories.
4.4.2 Samples should be handled by the
minimum possible number of persons.
SAMPLING TECHNIQUES
19
image:
 o
z
fc
V,
_
S
UJ
(A
UJ
5
"?
«*
&
u.
1
yi
a:
O
Uu
£
L
C
c
c
<j
u
> 0
»
^
<*
I
VI
OS
UJ
a.
3
<
</]
U.
~J
CL
2
<
u.
O
UJ
CL.
fc
T
l
>:
3
'T
r«
r)
U
0
X
r
(
1Q1NVAD
!ON3Hd
SDINV9SO 3DVai
9«3H
S3aiDliS3d
uova
S1V13W
3SV3S3 QNV HO
Aitaiaani
VraOdilOD 1VD3J
WJ)C«nOD WiOi
.3Hni¥a3dW31
.AHAIiDnONOD
.H<1
oa
* MINIWJIIV
sanos asaNSdsns
sonos ivioi
301
OOD
aoa
siNarainN
PRESERVATIVE
M3NIV1NOD 3dAl
swniOA ivioi
STATION DESCRIPTION
°1
si
E X
w
>
ffi
o
6
111
CL
CO
3
rements
8 1
« t)
X .S
ul u.
at *
w
O)
JOB
a
£•
a
UJ
oc
3
O
U.
20
MICROBIOLOGICAL MANUAL 1979
image:
o
z
fc
V,
_
S
UJ
(A
UJ
5
"?
«*
&
u.
1
yi
a:
O
Uu
£
L
C
c
c
<j
u
> 0
»
^
<*
I
VI
OS
UJ
a.
3
<
</]
U.
~J
CL
2
<
u.
O
UJ
CL.
fc
T
l
>:
3
'T
r«
r)
U
0
X
r
(
1Q1NVAD
!ON3Hd
SDINV9SO 3DVai
9«3H
S3aiDliS3d
uova
S1V13W
3SV3S3 QNV HO
Aitaiaani
VraOdilOD 1VD3J
WJ)C«nOD WiOi
.3Hni¥a3dW31
.AHAIiDnONOD
.H<1
oa
* MINIWJIIV
sanos asaNSdsns
sonos ivioi
301
OOD
aoa
siNarainN
PRESERVATIVE
M3NIV1NOD 3dAl
swniOA ivioi
STATION DESCRIPTION
°1
si
E X
w
>
ffi
o
6
111
CL
CO
3
rements
8 1
« t)
X .S
ul u.
at *
w
O)
JOB
a
£•
a
UJ
oc
3
O
U.
20
MICROBIOLOGICAL MANUAL 1979
image:
 SERIAL SHEE
T IMC
ENVIRONMENTAL PROTECTION AGENCY
Office Of Enforcement
NATIONAL ENFORCEMENT INVESTIGATIONS CENTER
Building 53, Box 25227, Denver Federal Center
Denver, Colorado 60225
CHAIN OF CUSTODY RECORD
SURVEY
SIA1ION
NUMBER
STATION LOCATION
DATE
Relinquished by: fsignarurij
Relinquished by: is:aiaiut*i
Relinquished by: isigratuni
Relinquished by: isig"°><"»)
Dispatched by: (si8norur.) Date/
TIME
SAMPLERS: (sig™tu,*i
SAMPL8 TVpE
Water
Comp.
Crab.
Air
SEO.
NO.
NO. OF
CONTAINERS
ANALYSIS
REQUIRED
Received by: (Signoiur.j Date/Time
Received by: fsignaturej Date/Time
Received by: (s/onarure; Date/Time
Received by Mobile Laboratory for field Date/Time
analysis: tsignatu,,)
Time
Received for Laboratory by: Date/Time
Method of Shipment:
Diltribution: Orig.— Accompany Shipment
1 Copy— Survey Coordinator Field Filet
FIGURE ll-A-12. Chain of Custody Record.
SAMPLING TECHNIQUES
21
image:
SERIAL SHEE
T IMC
ENVIRONMENTAL PROTECTION AGENCY
Office Of Enforcement
NATIONAL ENFORCEMENT INVESTIGATIONS CENTER
Building 53, Box 25227, Denver Federal Center
Denver, Colorado 60225
CHAIN OF CUSTODY RECORD
SURVEY
SIA1ION
NUMBER
STATION LOCATION
DATE
Relinquished by: fsignarurij
Relinquished by: is:aiaiut*i
Relinquished by: isigratuni
Relinquished by: isig"°><"»)
Dispatched by: (si8norur.) Date/
TIME
SAMPLERS: (sig™tu,*i
SAMPL8 TVpE
Water
Comp.
Crab.
Air
SEO.
NO.
NO. OF
CONTAINERS
ANALYSIS
REQUIRED
Received by: (Signoiur.j Date/Time
Received by: fsignaturej Date/Time
Received by: (s/onarure; Date/Time
Received by Mobile Laboratory for field Date/Time
analysis: tsignatu,,)
Time
Received for Laboratory by: Date/Time
Method of Shipment:
Diltribution: Orig.— Accompany Shipment
1 Copy— Survey Coordinator Field Filet
FIGURE ll-A-12. Chain of Custody Record.
SAMPLING TECHNIQUES
21
image:
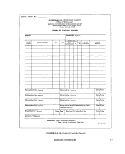 4.4.3 incoming samples shall be received
only by the custodian, who will indicate receipt
by signing the Chain of Custody Record Sheet
accompanying the samples and retaining the
sheet as a permanent record. Couriers picking
up samples at the airport, post office, etc. shall
sign jointly with the laboratory custodian.
4,4.4 Immediately upon receipt, the custo-
dian places samples in the sample room,
which will be locked at all times except when
samples are removed or replaced by the custo-
dian. To the maximum extent possible, only the
custodian should be permitted in the sample
room.
4.4.5 The custodian shall ensure that
microbiological samples are properly stored
and maintained at 1-4 C.
4.4.6 Only the custodian will distribute
samples to personnel who are to perform tests.
4.4.7 The analyst records information in
his laboratory notebook or analytical work-
sheet, describing the sample, the procedures
performed and the results of the testing. The
notes shall be dated and indicate who per-
formed the tests. The notes shall be retained
as a permanent record in the laboratory and
should include any abnormalities which oc-
curred during the testing procedure. In the
event that the person who performed the tests
is not available as a witness at time of trial,
the government may be able to introduce the
notes in evidence under the Federal Business
Records Act.
4.4.8 Standard methods of laboratory
analyses shall be used as described in the
"Guidelines Establishing Test Procedures for
Analysis of Pollutants," (10) and amendments.
If laboratory personnel deviate from standard
procedures, they should be prepared to justify
their decision during cross-examination.
4.4.9 Laboratory personnel are responsi-
ble for the care and custody of a sample once it
is handed over to them and should be pre-
pared to testify that the sample was in their
possession and view or secured in the labora-
tory at all times from the moment it was
received from the custodian until the tests
were run.
4.4.10 Once the sample testing is com-
pleted, microbiological samples can be dis-
carded but identifying tags and laboratory
record should be returned to the custodian.
Other documentation of work will also be
given to the custodian.
4.4.11 Tags and laboratory records of
tests may be destroyed only upon the order of
the Laboratory Director, who will first confer
with the Chief, Enforcement Specialist Office,
to make certain that the information is no
longer required.
5. Selection of Sampling Sites and
Frequency
These will be described for potable and
recreational waters, streams, lakes, reservoirs,
estuarine, and marine waters as well as do-
mestic and industrial wastewaters.
5.1 Potable Water Supplies
An expanded program to maintain the san-
itary quality of potable water supplies has
been recently established by the National jn-
terim Primary Drinking Water Regulations (11).
The sampling program includes examination
of water as it enters and flows throughout the
distribution system. For application of the EPA
Drinking Water Standards, the frequency of
sampling and the location of sampling points
are established jointly by the utility, the
Reporting Agency, and the Certifying
Authority. Additionally, the laboratory, the
methods of analyses, and the technical
competence of personnel must be inspected
and approved by the Reporting Agency and
the Certifying Authority.
5-1-1 Sampling Water Supplies: Figure II-
A-13 shows how reservoirs and lakes used as
water supplies are sampled: (A) at inlets, (B) at
other possible sources of pollution, (C) at the
draw-off point, (D) at quarter point intervals
around the draw-off point at about the same
depth and (E) at the reservoir outlet.
22
&EFW MICROBIOLOGICAL MANUAL 1978
image:
4.4.3 incoming samples shall be received
only by the custodian, who will indicate receipt
by signing the Chain of Custody Record Sheet
accompanying the samples and retaining the
sheet as a permanent record. Couriers picking
up samples at the airport, post office, etc. shall
sign jointly with the laboratory custodian.
4,4.4 Immediately upon receipt, the custo-
dian places samples in the sample room,
which will be locked at all times except when
samples are removed or replaced by the custo-
dian. To the maximum extent possible, only the
custodian should be permitted in the sample
room.
4.4.5 The custodian shall ensure that
microbiological samples are properly stored
and maintained at 1-4 C.
4.4.6 Only the custodian will distribute
samples to personnel who are to perform tests.
4.4.7 The analyst records information in
his laboratory notebook or analytical work-
sheet, describing the sample, the procedures
performed and the results of the testing. The
notes shall be dated and indicate who per-
formed the tests. The notes shall be retained
as a permanent record in the laboratory and
should include any abnormalities which oc-
curred during the testing procedure. In the
event that the person who performed the tests
is not available as a witness at time of trial,
the government may be able to introduce the
notes in evidence under the Federal Business
Records Act.
4.4.8 Standard methods of laboratory
analyses shall be used as described in the
"Guidelines Establishing Test Procedures for
Analysis of Pollutants," (10) and amendments.
If laboratory personnel deviate from standard
procedures, they should be prepared to justify
their decision during cross-examination.
4.4.9 Laboratory personnel are responsi-
ble for the care and custody of a sample once it
is handed over to them and should be pre-
pared to testify that the sample was in their
possession and view or secured in the labora-
tory at all times from the moment it was
received from the custodian until the tests
were run.
4.4.10 Once the sample testing is com-
pleted, microbiological samples can be dis-
carded but identifying tags and laboratory
record should be returned to the custodian.
Other documentation of work will also be
given to the custodian.
4.4.11 Tags and laboratory records of
tests may be destroyed only upon the order of
the Laboratory Director, who will first confer
with the Chief, Enforcement Specialist Office,
to make certain that the information is no
longer required.
5. Selection of Sampling Sites and
Frequency
These will be described for potable and
recreational waters, streams, lakes, reservoirs,
estuarine, and marine waters as well as do-
mestic and industrial wastewaters.
5.1 Potable Water Supplies
An expanded program to maintain the san-
itary quality of potable water supplies has
been recently established by the National jn-
terim Primary Drinking Water Regulations (11).
The sampling program includes examination
of water as it enters and flows throughout the
distribution system. For application of the EPA
Drinking Water Standards, the frequency of
sampling and the location of sampling points
are established jointly by the utility, the
Reporting Agency, and the Certifying
Authority. Additionally, the laboratory, the
methods of analyses, and the technical
competence of personnel must be inspected
and approved by the Reporting Agency and
the Certifying Authority.
5-1-1 Sampling Water Supplies: Figure II-
A-13 shows how reservoirs and lakes used as
water supplies are sampled: (A) at inlets, (B) at
other possible sources of pollution, (C) at the
draw-off point, (D) at quarter point intervals
around the draw-off point at about the same
depth and (E) at the reservoir outlet.
22
&EFW MICROBIOLOGICAL MANUAL 1978
image:
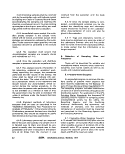 •£»
'riteS^'
FIGURE ll-A-13. Sampling a Water Supply Reservoir. (A) influent stream, (B) possible
agricultural contamination, (C) water plant intake, (D) multi-point
sampling around intake and (E) reservoir outlet.
SAMPLING TECHNIQUES
23
image:
•£»
'riteS^'
FIGURE ll-A-13. Sampling a Water Supply Reservoir. (A) influent stream, (B) possible
agricultural contamination, (C) water plant intake, (D) multi-point
sampling around intake and (E) reservoir outlet.
SAMPLING TECHNIQUES
23
image:
 5.1.2 Sampling Treatment Systems: Sam-
pling should be representative of the distribu-
tion system and include sites such as munici-
pal buildings, public schools, airports and
parks, hydrants, restaurants, theaters, gas sta-
tions, industrial plants and private residences.
A systematic coverage of such points in the
distribution system should insure the detec-
tion of contamination from breaks in water-
lines, loss of pressure or crossconnections.
The sampling program should also include
special sampling locations such as dead-end
distribution lines that are sources of bacterial
contamination (12),
5.1.3 Sample Frequency: The minimum
number of samples which must be collected
and examined each month is based upon the
population density served by the distribution
system (Table II-A-1). Samples should be col-
lected at evenly spaced time intervals through-
out the month. In the event of an unsatisfactory
sample, repetitive samples must be collected
until two consecutive samples yield satisfac-
tory quality water. Repetitive samples from any
single point or special purpose samples must
not be counted in the overall total of monthly
samples.
5.1.4 Standard Sample: The standards for
microbiological quality are based upon the
number of organisms allowable in a standard
sample. A standard sample for the membrane
filter technique is at least 100 ml. For the MPN
test, a standard sample consists of five stan-
dard portions of either 10 ml or 100 ml.
5.2 Lakes and Impoundments
Figure II-A-14 shows the range of sam-
pling points in a recreational impoundment or
Jake: (A) inlets, (B) source of pollution, (C) grid or
transect across the long axis of the water body,
(D)bathing beach and (E) outlet.
5.3 Stream Sampling
The objectives of the initial survey dictate
the location, frequency and number of sam-
ples to be collected.
5.3.1 Selection of Sampling Sites: A
typical stream sampling program includes
sampling locations upstream of the area of
concern, upstream and downstream of waste
discharges, upstream and downstream from
tributary entrances to the river and upstream
of the mouth of the tributary. For more
complex situations, where several waste
discharges are involved, sampling includes
sites upstream and downstream from the
combined discharge area and samples taken
directly from each industrial or municipal
waste discharge. Using available
bacteriological, chemical and discharge rate
data, the contribution of each pollution source
can be determined. See Figure ll-A-14 and
II-A-15.
5.3.2 Small Streams: Small streams
should be sampled at background stations
upstream of the pollution sources and at
stations downstream from pollution sources.
Additional sampling sites should be located
downstream to delineate the zones of
pollution. Avoid sampling areas where
stagnation may occur (backwater of a
tributary) and areas located near the inside
bank of a curve in the stream which may not be
representative of the main channel.
5.3.3 Large Streams and Rivers: Large
streams are usually not well mixed laterally for
long distances downstream from the pollution
sources. Sampling sites below point source
pollution should be established to provide
desired downstream travel time and dispersal
as determined by flow rate measurements.
Particular care must be taken to establish the
proper sampling points as shown in Figure II-A-
15: Sampling point (A) is the upper reach control
station, (B) monitors a non-point source of
pollution, (C) samples the waste discharge as it
enters the stream, (D) shows quarter-point
sampling below the pollution to detect chan-
neling, |D) also serves as an upstream monitor
on the tributary measured as (E), and (F) moni-
tors the downstream effect of the tributary
after mixing. Occasionally, depth samples
are necessary to determine vertical mixing
patterns.
24
MICROBIOLOGICAL MANUAL 1978
image:
5.1.2 Sampling Treatment Systems: Sam-
pling should be representative of the distribu-
tion system and include sites such as munici-
pal buildings, public schools, airports and
parks, hydrants, restaurants, theaters, gas sta-
tions, industrial plants and private residences.
A systematic coverage of such points in the
distribution system should insure the detec-
tion of contamination from breaks in water-
lines, loss of pressure or crossconnections.
The sampling program should also include
special sampling locations such as dead-end
distribution lines that are sources of bacterial
contamination (12),
5.1.3 Sample Frequency: The minimum
number of samples which must be collected
and examined each month is based upon the
population density served by the distribution
system (Table II-A-1). Samples should be col-
lected at evenly spaced time intervals through-
out the month. In the event of an unsatisfactory
sample, repetitive samples must be collected
until two consecutive samples yield satisfac-
tory quality water. Repetitive samples from any
single point or special purpose samples must
not be counted in the overall total of monthly
samples.
5.1.4 Standard Sample: The standards for
microbiological quality are based upon the
number of organisms allowable in a standard
sample. A standard sample for the membrane
filter technique is at least 100 ml. For the MPN
test, a standard sample consists of five stan-
dard portions of either 10 ml or 100 ml.
5.2 Lakes and Impoundments
Figure II-A-14 shows the range of sam-
pling points in a recreational impoundment or
Jake: (A) inlets, (B) source of pollution, (C) grid or
transect across the long axis of the water body,
(D)bathing beach and (E) outlet.
5.3 Stream Sampling
The objectives of the initial survey dictate
the location, frequency and number of sam-
ples to be collected.
5.3.1 Selection of Sampling Sites: A
typical stream sampling program includes
sampling locations upstream of the area of
concern, upstream and downstream of waste
discharges, upstream and downstream from
tributary entrances to the river and upstream
of the mouth of the tributary. For more
complex situations, where several waste
discharges are involved, sampling includes
sites upstream and downstream from the
combined discharge area and samples taken
directly from each industrial or municipal
waste discharge. Using available
bacteriological, chemical and discharge rate
data, the contribution of each pollution source
can be determined. See Figure ll-A-14 and
II-A-15.
5.3.2 Small Streams: Small streams
should be sampled at background stations
upstream of the pollution sources and at
stations downstream from pollution sources.
Additional sampling sites should be located
downstream to delineate the zones of
pollution. Avoid sampling areas where
stagnation may occur (backwater of a
tributary) and areas located near the inside
bank of a curve in the stream which may not be
representative of the main channel.
5.3.3 Large Streams and Rivers: Large
streams are usually not well mixed laterally for
long distances downstream from the pollution
sources. Sampling sites below point source
pollution should be established to provide
desired downstream travel time and dispersal
as determined by flow rate measurements.
Particular care must be taken to establish the
proper sampling points as shown in Figure II-A-
15: Sampling point (A) is the upper reach control
station, (B) monitors a non-point source of
pollution, (C) samples the waste discharge as it
enters the stream, (D) shows quarter-point
sampling below the pollution to detect chan-
neling, |D) also serves as an upstream monitor
on the tributary measured as (E), and (F) moni-
tors the downstream effect of the tributary
after mixing. Occasionally, depth samples
are necessary to determine vertical mixing
patterns.
24
MICROBIOLOGICAL MANUAL 1978
image:
 TABLE 1I-A-1
Sampling Frequency for Drinking Waters Based on Population
Population served:
25 to 1,000.
1,001 to 2,500
2,501 to 3,300
3,301 to 4,100
4,101 to 4,900
4,901 to 5,800
5,801 to 6,700
6,701 to 7,600
7,601 to 8,500
8,501 to 9,400
9,401 to 10,300
10,301 to 11,100
11,101 to 12,000
12,001 to 12,900
12,901 to 13,700
13,701 to 14,600
14,601 to 15,500
15,501 to 16,300
16,301 to 17,200
17,201 to 18,100
18,1O1 to 18.9OO
18,901 to 19,800
19,801 to 20,700
20,701 to 21.50O
21,501 to 22,300
22,301 to 23,200
23,201 to 24,000
24,001 to 24,900
24,901 to 25,000
25,001 to 28,000
28,001 to 33,000
33,001 to 37,000
37,000 to 41,000
41,001 to 46,000
46,001 to 50,000
50,001 to 54,000
54,001 to 59,000
59,001 to 64,000
64,001 to 70,000
70,001 to 76,000
76,001 to 83,000
83,001 to 90,000
Minimum number of
samples per month
1
2
3
4
5
6
7
8
9
10
1 1
12
1 3
1 4
15
16
17
18
19
20
21
22
23
24
25
26
27
28
29
30
35
40
45
50
55
60
65
70
75
80
85
90
Population served:
90,001 to 96,000
96,001 to 111,000
111,001 to 130,000
130,001 to 160,000
160,001 to 190,000
190,001 to 220,000
220,001 to 250,000
250,001 to 290,000
290,001 to 320,000
320,001 to 360,000
360,001 to 410,000
410,001 to 450,000
450,001 to 500,000
500,001 to 550,000
550,001 to 600,000
600,001 to 660,000
660,001 to 720,000
720,001 to 780,000
780,001 to 840,000
840,001 to 910,000
9 1O.OO1 to 97O.OOO
970,001 to 1,050,000
1,050,001 to 1,140,000...,
1,140,001 to 1,230,000....
1,230,001 to 1,320,000...,
1,320,001 to 1,420,000....
1,420,001 to 1,520,000....
1,520,001 to 1,630,000....
1,630,001 to 1,730,000...,
1,730,001 to 1,850,000....
1,850,001 to 1,970,000....
1,970,001 to 2,060,000....
2,060,001 to 2,270,000,.,.
2,270,001 to 2,510,000,,..
2,510,001 to 2,750,000.,..
2,750,001 to 3,020,000.,..
3,020,001 to 3,320,000....
3,320,001 to 3,620,000....
3,620,001 to 3,960,000....
3,960,001 to 4,310,000....
4,310,001 to 4,690,000...,
4,690,001 or more
Minimum number of
samples per month
95
100
110
120
130
140
150
160
170
180
190
200
210
220
230
240
250
260
270
280
29O
300
310
320
330
340
350
360
370
380
390
400
410
420
430
440
450
460
470
480
490
500
SAMPLING TECHNIQUES
25
image:
TABLE 1I-A-1
Sampling Frequency for Drinking Waters Based on Population
Population served:
25 to 1,000.
1,001 to 2,500
2,501 to 3,300
3,301 to 4,100
4,101 to 4,900
4,901 to 5,800
5,801 to 6,700
6,701 to 7,600
7,601 to 8,500
8,501 to 9,400
9,401 to 10,300
10,301 to 11,100
11,101 to 12,000
12,001 to 12,900
12,901 to 13,700
13,701 to 14,600
14,601 to 15,500
15,501 to 16,300
16,301 to 17,200
17,201 to 18,100
18,1O1 to 18.9OO
18,901 to 19,800
19,801 to 20,700
20,701 to 21.50O
21,501 to 22,300
22,301 to 23,200
23,201 to 24,000
24,001 to 24,900
24,901 to 25,000
25,001 to 28,000
28,001 to 33,000
33,001 to 37,000
37,000 to 41,000
41,001 to 46,000
46,001 to 50,000
50,001 to 54,000
54,001 to 59,000
59,001 to 64,000
64,001 to 70,000
70,001 to 76,000
76,001 to 83,000
83,001 to 90,000
Minimum number of
samples per month
1
2
3
4
5
6
7
8
9
10
1 1
12
1 3
1 4
15
16
17
18
19
20
21
22
23
24
25
26
27
28
29
30
35
40
45
50
55
60
65
70
75
80
85
90
Population served:
90,001 to 96,000
96,001 to 111,000
111,001 to 130,000
130,001 to 160,000
160,001 to 190,000
190,001 to 220,000
220,001 to 250,000
250,001 to 290,000
290,001 to 320,000
320,001 to 360,000
360,001 to 410,000
410,001 to 450,000
450,001 to 500,000
500,001 to 550,000
550,001 to 600,000
600,001 to 660,000
660,001 to 720,000
720,001 to 780,000
780,001 to 840,000
840,001 to 910,000
9 1O.OO1 to 97O.OOO
970,001 to 1,050,000
1,050,001 to 1,140,000...,
1,140,001 to 1,230,000....
1,230,001 to 1,320,000...,
1,320,001 to 1,420,000....
1,420,001 to 1,520,000....
1,520,001 to 1,630,000....
1,630,001 to 1,730,000...,
1,730,001 to 1,850,000....
1,850,001 to 1,970,000....
1,970,001 to 2,060,000....
2,060,001 to 2,270,000,.,.
2,270,001 to 2,510,000,,..
2,510,001 to 2,750,000.,..
2,750,001 to 3,020,000.,..
3,020,001 to 3,320,000....
3,320,001 to 3,620,000....
3,620,001 to 3,960,000....
3,960,001 to 4,310,000....
4,310,001 to 4,690,000...,
4,690,001 or more
Minimum number of
samples per month
95
100
110
120
130
140
150
160
170
180
190
200
210
220
230
240
250
260
270
280
29O
300
310
320
330
340
350
360
370
380
390
400
410
420
430
440
450
460
470
480
490
500
SAMPLING TECHNIQUES
25
image:
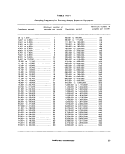 FIGURE ll-A-14. Sampling a Lake or Impoundment. (A) inlets, (B) potential source
of pollution, (B1) village, (B2) agricultural run-off, (B3) home septic
tank, (C) multi-point transect, (D) bathing beach and (E) outlet above
and below dam.
26
x>EFV\ MICROBIOLOGICAL MANUAL 1978
image:
FIGURE ll-A-14. Sampling a Lake or Impoundment. (A) inlets, (B) potential source
of pollution, (B1) village, (B2) agricultural run-off, (B3) home septic
tank, (C) multi-point transect, (D) bathing beach and (E) outlet above
and below dam.
26
x>EFV\ MICROBIOLOGICAL MANUAL 1978
image:
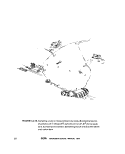 FIGURE ll-A-15. Sampling a Large Stream. (A) control station, (B) agricultural pollution,
(C) industrial discharge, (D) quarterpoint transect (E) tributary, and
(F) downstream monitoring.
SAMPLING TECHNIQUES
27
image:
FIGURE ll-A-15. Sampling a Large Stream. (A) control station, (B) agricultural pollution,
(C) industrial discharge, (D) quarterpoint transect (E) tributary, and
(F) downstream monitoring.
SAMPLING TECHNIQUES
27
image:
 5.4 Marine and Estuarine Sampling
Sampling marine and estuarine waters
requires the consideration of other factors in
addition to those usually recognized in fresh
water sampling. They include tidal cycles,
current patterns, bottom currents and counter-
currents, stratification, seasonal fluctuations,
dispersion of discharges and multi-depth
samplings.
The frequency of sampling varies with the
objectives. When a sampling program is
started, it may be necessary to sample every
hour around the clock to establish pollutional
loads and dispersion patterns. The sewage
discharges may occur continuously or
Intermittently.
When the sampling strategy for a survey is
planned, data may be available from previous
hydrological studies done by Coast Guard,
Corps of Engineers, National Oceanic and
Atmospheric Administration (NOAA), U.S.
Geological Survey, or university and private
research investigations. In a survey, float
studies and dye studies are often carried out to
determine surface and undercurrents. Initially
depth samples are taken on the bottom and at
five feet increments between surface and
bottom. A random grid pattern for selecting
sampling sites is established statistically.
5.4.1 Marine Sampling: In ocean studies,
the environmental conditions are most diverse
along the coast where shore, atmosphere and
the surf are strong influences. The shallow
coastal waters are particularly susceptible to
daily fluctuations in temperature and seasonal
changes.
Sampling during the entire tidal cycle or
during a half cycle may be required. Many
ocean studies such as sampling over the conti-
nental shelf involve huge areas and no two
areas of water are the same.
Selection of sampling sites and depths are
most critical in marine waters. In winter, cool-
ing of coastal waters can result in water layers
which approach 0 C. In summer, the shallow
waters warm much faster than the deeper
waters. Despite the higher temperature, oxy-
gen concentrations are higher in shallow than
in deeper waters due to greater water move-
ment, surf action and photosynthetic activity
from macrophytes and the plankton.
Moving from the shallow waters to the
intermediate depths, one observes a modera-
tion of these shallow water characteristics. In
the deeper waters, there is a marked stabliza-
tion of conditions. Water temperatures are
lower and more stable. There is limited turbu-
lence, little penetration of light, sparse vegeta-
tion and the ocean floor is covered with a layer
of silts and sediments.
5.4.2 Estuarine Sampling: When a survey
is made on an estuary, samples are often taken
from a boat, usually making an end to end
traverse of the estuary. Another method in-
volves taking samples throughout a tidal cycle,
every hour or two hours from a bridge or from
an anchored boat at a number of fixed points.
In a large bay or estuary where many
square miles of area are involved, a grid or
series of stations may be necessary. Two sets
of samples are usually taken from an area on a
given day, one at ebb or flood slack water, and
the other three hours earlier, or later, at the half
tidal interval. Sampling is scheduled so that
the mid-sampling time of each run coincides
with the calculated occurrence of the tidal
condition.
In locating sampling sites, one must con-
sider points at which tributary waters enter the
main stream or estuary, location of shellfish
beds and bathing beaches. The sampling sta-
tions can be adjusted as data accumulate. For
example, if a series of stations half mile apart
consistently show similar values, some of
these stations may be dropped and other sta-
tions added in areas where data shows more
variability.
Considerable stratification can occur be-
tween the salt water from the sea and the fresh
water supplied by a river. It is essential when
starting a survey of an unknown estuary to find
out whether there is any marked stratification.
This can be done by chloride determinations at
different locations and depths. It is possible for
28
MICROBIOLOGICAL MANUAL 1978
image:
5.4 Marine and Estuarine Sampling
Sampling marine and estuarine waters
requires the consideration of other factors in
addition to those usually recognized in fresh
water sampling. They include tidal cycles,
current patterns, bottom currents and counter-
currents, stratification, seasonal fluctuations,
dispersion of discharges and multi-depth
samplings.
The frequency of sampling varies with the
objectives. When a sampling program is
started, it may be necessary to sample every
hour around the clock to establish pollutional
loads and dispersion patterns. The sewage
discharges may occur continuously or
Intermittently.
When the sampling strategy for a survey is
planned, data may be available from previous
hydrological studies done by Coast Guard,
Corps of Engineers, National Oceanic and
Atmospheric Administration (NOAA), U.S.
Geological Survey, or university and private
research investigations. In a survey, float
studies and dye studies are often carried out to
determine surface and undercurrents. Initially
depth samples are taken on the bottom and at
five feet increments between surface and
bottom. A random grid pattern for selecting
sampling sites is established statistically.
5.4.1 Marine Sampling: In ocean studies,
the environmental conditions are most diverse
along the coast where shore, atmosphere and
the surf are strong influences. The shallow
coastal waters are particularly susceptible to
daily fluctuations in temperature and seasonal
changes.
Sampling during the entire tidal cycle or
during a half cycle may be required. Many
ocean studies such as sampling over the conti-
nental shelf involve huge areas and no two
areas of water are the same.
Selection of sampling sites and depths are
most critical in marine waters. In winter, cool-
ing of coastal waters can result in water layers
which approach 0 C. In summer, the shallow
waters warm much faster than the deeper
waters. Despite the higher temperature, oxy-
gen concentrations are higher in shallow than
in deeper waters due to greater water move-
ment, surf action and photosynthetic activity
from macrophytes and the plankton.
Moving from the shallow waters to the
intermediate depths, one observes a modera-
tion of these shallow water characteristics. In
the deeper waters, there is a marked stabliza-
tion of conditions. Water temperatures are
lower and more stable. There is limited turbu-
lence, little penetration of light, sparse vegeta-
tion and the ocean floor is covered with a layer
of silts and sediments.
5.4.2 Estuarine Sampling: When a survey
is made on an estuary, samples are often taken
from a boat, usually making an end to end
traverse of the estuary. Another method in-
volves taking samples throughout a tidal cycle,
every hour or two hours from a bridge or from
an anchored boat at a number of fixed points.
In a large bay or estuary where many
square miles of area are involved, a grid or
series of stations may be necessary. Two sets
of samples are usually taken from an area on a
given day, one at ebb or flood slack water, and
the other three hours earlier, or later, at the half
tidal interval. Sampling is scheduled so that
the mid-sampling time of each run coincides
with the calculated occurrence of the tidal
condition.
In locating sampling sites, one must con-
sider points at which tributary waters enter the
main stream or estuary, location of shellfish
beds and bathing beaches. The sampling sta-
tions can be adjusted as data accumulate. For
example, if a series of stations half mile apart
consistently show similar values, some of
these stations may be dropped and other sta-
tions added in areas where data shows more
variability.
Considerable stratification can occur be-
tween the salt water from the sea and the fresh
water supplied by a river. It is essential when
starting a survey of an unknown estuary to find
out whether there is any marked stratification.
This can be done by chloride determinations at
different locations and depths. It is possible for
28
MICROBIOLOGICAL MANUAL 1978
image:
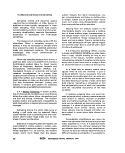 stratification to occur in one part of an estuary
and not in another.
On a.flood tide, the more dense salt water
pushing up into the less dense fresh river
water will cause an overlapping with the fresh
water flowing on top. A phenomenon called a
salt water wedge can form. As a result, stratifi-
cation occurs. If the discharge of pollution is in
the salt water layer, the contamination will be
concentrated near the bottom at the flood tide.
The flow or velocity of the fresh water will
influence the degree of stratification which
occurs. If one is sampling only at the surface, it
is possible that the data will not show the
polluted underflowing water which was con-
taminated at a point below the fresh water
river. Therefore, where stratification is sus-
pected, samples at different depths will be
needed to measure vertical distribution.
5.5 Domestic and Industrial Waste
Discharges
It is often necessary to sample secondary
and tertiary wastes from municipal waste
treatment plants and various industrial waste
treatment operations. In situations where the
plant treatment efficiency varies considerably,
grab samples are collected around the clock at
selected intervals for a three to five day period.
If it is known that the process displays little
variation, fewer samples are needed. In no
case should a composite sample be collected
for bacteriological examination. The NPDES
has established wastewater treatment plant
effluent limits for all dischargers. These are
often based on maximum and mean values. A
sufficient number of samples must be col-
lected to satisfy the permit and/or to provide
statistically sound data and give a fair repre-
sentation of the bacteriological quality of the
discharge.
5.6 Recreational Waters
5-6-1 Bathing Beaches: Sampling sites at
bathing beaches or other recreational areas
should include upstream or peripheral areas
and locations adjacent to natural drains that
would discharge stormwater, or run-off areas
draining septic wastes from restaurants, boat
marinas, or garbage collection areas (12).
Samples of bathing beach water should be
collected at locations and times of heaviest
use. Daily sampling, preferably in the after-
noon, is the optimum frequency during the
season. Weekends and holidays which are pe-
riods of highest use must be included in the
sampling program. Samples of estuarine bath-
ing waters should be obtained at high tide, ebb
tide and low tide in order to determine the
cyclic water quality and deterioration that
must be monitored during the swimming
season.
5-6.2 Swimming Pools: Swimming pool
water should be monitored at least daily dur-
ing maximum use periods, preferably at the
overflow. It is important to test swimming pool
samples for neutralization of residual chlorine
at pool side to assure that the dechlorinating
agent was effective.
6.7 Shellfish-Harvesting Waters
Water overlying shellfish-harvesting areas
should be sampled during periods of most
unfavorable hydrographic conditions, usually
at low tide after heavy precipitation. However,
shellfish beds are sometimes exposed during
low tide and must be sampled during other
tidal conditions. Procedures for sampling of
shellfish and water in shellfish growing areas
are governed by the National Shellfish Sanita-
tion Program's Manual of Operations (13).
5.8 Frequency of Sampling
The frequency of sampling depends upon
the type of pollution that is to be measured.
Cyclic pollution and its duration are measured
as frequently as practical immediately down-
stream from the source. Uniform pollution
loads are measured at greater distances down-
stream from the source and at less frequent
time intervals than cyclic pollution. Climatic
and tidal conditions must be considered. Jn
marine and estuarine sampling. A common
approach for short-term studies is to collect
samples from each site daily and advance the
sampling intervals one hour during each 24-
hour period to obtain data for a 7-10 day
study.
SAMPLING TECHNIQUES
29
image:
stratification to occur in one part of an estuary
and not in another.
On a.flood tide, the more dense salt water
pushing up into the less dense fresh river
water will cause an overlapping with the fresh
water flowing on top. A phenomenon called a
salt water wedge can form. As a result, stratifi-
cation occurs. If the discharge of pollution is in
the salt water layer, the contamination will be
concentrated near the bottom at the flood tide.
The flow or velocity of the fresh water will
influence the degree of stratification which
occurs. If one is sampling only at the surface, it
is possible that the data will not show the
polluted underflowing water which was con-
taminated at a point below the fresh water
river. Therefore, where stratification is sus-
pected, samples at different depths will be
needed to measure vertical distribution.
5.5 Domestic and Industrial Waste
Discharges
It is often necessary to sample secondary
and tertiary wastes from municipal waste
treatment plants and various industrial waste
treatment operations. In situations where the
plant treatment efficiency varies considerably,
grab samples are collected around the clock at
selected intervals for a three to five day period.
If it is known that the process displays little
variation, fewer samples are needed. In no
case should a composite sample be collected
for bacteriological examination. The NPDES
has established wastewater treatment plant
effluent limits for all dischargers. These are
often based on maximum and mean values. A
sufficient number of samples must be col-
lected to satisfy the permit and/or to provide
statistically sound data and give a fair repre-
sentation of the bacteriological quality of the
discharge.
5.6 Recreational Waters
5-6-1 Bathing Beaches: Sampling sites at
bathing beaches or other recreational areas
should include upstream or peripheral areas
and locations adjacent to natural drains that
would discharge stormwater, or run-off areas
draining septic wastes from restaurants, boat
marinas, or garbage collection areas (12).
Samples of bathing beach water should be
collected at locations and times of heaviest
use. Daily sampling, preferably in the after-
noon, is the optimum frequency during the
season. Weekends and holidays which are pe-
riods of highest use must be included in the
sampling program. Samples of estuarine bath-
ing waters should be obtained at high tide, ebb
tide and low tide in order to determine the
cyclic water quality and deterioration that
must be monitored during the swimming
season.
5-6.2 Swimming Pools: Swimming pool
water should be monitored at least daily dur-
ing maximum use periods, preferably at the
overflow. It is important to test swimming pool
samples for neutralization of residual chlorine
at pool side to assure that the dechlorinating
agent was effective.
6.7 Shellfish-Harvesting Waters
Water overlying shellfish-harvesting areas
should be sampled during periods of most
unfavorable hydrographic conditions, usually
at low tide after heavy precipitation. However,
shellfish beds are sometimes exposed during
low tide and must be sampled during other
tidal conditions. Procedures for sampling of
shellfish and water in shellfish growing areas
are governed by the National Shellfish Sanita-
tion Program's Manual of Operations (13).
5.8 Frequency of Sampling
The frequency of sampling depends upon
the type of pollution that is to be measured.
Cyclic pollution and its duration are measured
as frequently as practical immediately down-
stream from the source. Uniform pollution
loads are measured at greater distances down-
stream from the source and at less frequent
time intervals than cyclic pollution. Climatic
and tidal conditions must be considered. Jn
marine and estuarine sampling. A common
approach for short-term studies is to collect
samples from each site daily and advance the
sampling intervals one hour during each 24-
hour period to obtain data for a 7-10 day
study.
SAMPLING TECHNIQUES
29
image:
 Often the numbers of samples to be
collected are specified by NPDES permits,
drinking water regulations, or by state
requirements. Some standards require a
minimum number of samples to be collected
each month. Other standards are less explicit
and simply indicate that the geometric mean
coliform density shall not exceed a certain
level each month, with no more than 10%,
20%, etc. of samples exceeding a certain
value. Where the number of samples required
is undetermined, a sufficient number should
be collected to measure the variations in
stream conditions.
6. Preservation and Transit of Samples
The adherence to sample preservation and
holding time limits is critical to the production
of valid data. Samples exceeding these limits
should not be analyzed. The following rules
must be observed.
6.1 Storage Temperature and Handling
Conditions
Bacteriological samples should be iced or
refrigerated at a temperature of 1-4 C during
transit to the laboratory. Insulated containers
are preferable to assure proper maintenance
of storage temperature. Care should be taken
that sample bottles are not totally immersed in
water during transit or storage.
6.2 Holding Time Limitations
Although samples should be examined as
soon as possible afte'r collection, they should
not be held longer than six hours between
collection and initiation of analyses (14). This
limit is applied to fresh waters, seawaters and
shellfish-bed waters. The exception is water
supply samples mailed in from water treat-
ment systems. Current regulations permit
these samples to be held up to 30 hours.
6.2.1 Despite the establishment of a six
hour limit, sewage samples, organically-rich
wastes and marine waters are particularly
susceptible to rapid increases or die-away and
hence should be held for the shortest time
possible to minimize change.
6.2.2 Temporary Field Laboratories: In sit-
uations where it is impossible to meet the six
hour maximum holding time between collec-
tion and processing of samples, the use of
temporary field laboratories located near the
collection site should be considered.
6.2.3 Delayed Incubation Procedure: If
sampling and transit conditions require more
than six hours, and the use of field laboratories
is impossible, the delayed incubation proce-
dure for total and fecal coliforms and fecal
streptococci should be considered.
6.2.4 Public Transportation: Occasionally,
commercial forms of transit such as airlines,
buslines or couriers can be used to transport
samples contained in ice chests to the labora-
tory. These should be considered only when
storage time and temperature requirements
and the proper disposition of the samples can
be assured.
30
&EFA MICROBIOLOGICAL MANUAL 1978
image:
Often the numbers of samples to be
collected are specified by NPDES permits,
drinking water regulations, or by state
requirements. Some standards require a
minimum number of samples to be collected
each month. Other standards are less explicit
and simply indicate that the geometric mean
coliform density shall not exceed a certain
level each month, with no more than 10%,
20%, etc. of samples exceeding a certain
value. Where the number of samples required
is undetermined, a sufficient number should
be collected to measure the variations in
stream conditions.
6. Preservation and Transit of Samples
The adherence to sample preservation and
holding time limits is critical to the production
of valid data. Samples exceeding these limits
should not be analyzed. The following rules
must be observed.
6.1 Storage Temperature and Handling
Conditions
Bacteriological samples should be iced or
refrigerated at a temperature of 1-4 C during
transit to the laboratory. Insulated containers
are preferable to assure proper maintenance
of storage temperature. Care should be taken
that sample bottles are not totally immersed in
water during transit or storage.
6.2 Holding Time Limitations
Although samples should be examined as
soon as possible afte'r collection, they should
not be held longer than six hours between
collection and initiation of analyses (14). This
limit is applied to fresh waters, seawaters and
shellfish-bed waters. The exception is water
supply samples mailed in from water treat-
ment systems. Current regulations permit
these samples to be held up to 30 hours.
6.2.1 Despite the establishment of a six
hour limit, sewage samples, organically-rich
wastes and marine waters are particularly
susceptible to rapid increases or die-away and
hence should be held for the shortest time
possible to minimize change.
6.2.2 Temporary Field Laboratories: In sit-
uations where it is impossible to meet the six
hour maximum holding time between collec-
tion and processing of samples, the use of
temporary field laboratories located near the
collection site should be considered.
6.2.3 Delayed Incubation Procedure: If
sampling and transit conditions require more
than six hours, and the use of field laboratories
is impossible, the delayed incubation proce-
dure for total and fecal coliforms and fecal
streptococci should be considered.
6.2.4 Public Transportation: Occasionally,
commercial forms of transit such as airlines,
buslines or couriers can be used to transport
samples contained in ice chests to the labora-
tory. These should be considered only when
storage time and temperature requirements
and the proper disposition of the samples can
be assured.
30
&EFA MICROBIOLOGICAL MANUAL 1978
image:
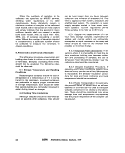 REFERENCES
1, Public Health Laboratory Service Water Subcommittee, 1953. The effect of sodium thiosulfate
on the coliform and Bacterium co//counts of non-chlorinated water samples. J. Hyg. 51:572.
2. Shipe, E. L and A. Fields, 1954. Comparison of the molecular filter technique with agar plate
counts for enumeration of Escherichia cof/'m various aqueous concentrations of zinc and copper
sulfate. Appl. Microbiol. 2:382.
3. Shipe, E. L. and A. Fields, 1956. Chelation as a method for maintaining the coliform index in water
supplies. Public Health Rep. 71:974.
4. Zobell, C. E., 1941. Apparatus for collecting water samples from different depths for bacteriologi-
cal analysis. J. Marine Research 4:173.
5. Niskin, S., 1962. Water sampler for microbiological study. Deep Sea Research 9:501.
6. Funs, G.Wolfgang, 1977. Personal Communication; Director of the Environmental Health Center,
Division of Lab and Research, New York State Health Department, Albany, New York.
7. Welch, P.S. 1948. Limnological Methods. Blakiston Company, Philadelphia, PA.
8. Van Donsel, D. J. and E. E. Geldreich, 1972. Relationships of Salmonella to fecal coliforms in
bottom sediments. Water Research 5:1079.
9. Wills, Carroll, 1975 (June). Chain of Custody Procedures, National Enforcement Investigation
Center-Denver, Colorado, U.S. EPA.
10. Guidelines Establishing Test Procedures for the Analysis of Pollutants. 40 CFR Part 136, 52780,
as amended, December 1,197 6.
11. National Interim Primary Drinking Water Regulations, 40 Code of Federal Regulations, Amend-
ments to Part 141, December 24,1975.
12. Geldreich, E. E., 1975. Handbook for Evaluating Bacteriological Water Laboratories, (2nd ed.)
U.S. Environmental Protection Agency, Municipal Environmental Research Laboratory, Cincin-
nati, Ohio. EPA-670/9-75-006.
13. Mauser, L. S. (ed.), 1965. National Shellfish Sanitation Program. Manual of Operations, Part h_
Sanitation of shellfish growing areas. U.S. Public Health Service, Washington, D.C.
14. Public Health Laboratory Service Water Subcommittee, 1953. The effect of storage on the
coliform and Bacterium coli counts of water samples. Storage for six hours at room and
refrigerator temperatures. J. Hyg. S|:559.
SAMPLING TECHNIQUES 31
image:
REFERENCES
1, Public Health Laboratory Service Water Subcommittee, 1953. The effect of sodium thiosulfate
on the coliform and Bacterium co//counts of non-chlorinated water samples. J. Hyg. 51:572.
2. Shipe, E. L and A. Fields, 1954. Comparison of the molecular filter technique with agar plate
counts for enumeration of Escherichia cof/'m various aqueous concentrations of zinc and copper
sulfate. Appl. Microbiol. 2:382.
3. Shipe, E. L. and A. Fields, 1956. Chelation as a method for maintaining the coliform index in water
supplies. Public Health Rep. 71:974.
4. Zobell, C. E., 1941. Apparatus for collecting water samples from different depths for bacteriologi-
cal analysis. J. Marine Research 4:173.
5. Niskin, S., 1962. Water sampler for microbiological study. Deep Sea Research 9:501.
6. Funs, G.Wolfgang, 1977. Personal Communication; Director of the Environmental Health Center,
Division of Lab and Research, New York State Health Department, Albany, New York.
7. Welch, P.S. 1948. Limnological Methods. Blakiston Company, Philadelphia, PA.
8. Van Donsel, D. J. and E. E. Geldreich, 1972. Relationships of Salmonella to fecal coliforms in
bottom sediments. Water Research 5:1079.
9. Wills, Carroll, 1975 (June). Chain of Custody Procedures, National Enforcement Investigation
Center-Denver, Colorado, U.S. EPA.
10. Guidelines Establishing Test Procedures for the Analysis of Pollutants. 40 CFR Part 136, 52780,
as amended, December 1,197 6.
11. National Interim Primary Drinking Water Regulations, 40 Code of Federal Regulations, Amend-
ments to Part 141, December 24,1975.
12. Geldreich, E. E., 1975. Handbook for Evaluating Bacteriological Water Laboratories, (2nd ed.)
U.S. Environmental Protection Agency, Municipal Environmental Research Laboratory, Cincin-
nati, Ohio. EPA-670/9-75-006.
13. Mauser, L. S. (ed.), 1965. National Shellfish Sanitation Program. Manual of Operations, Part h_
Sanitation of shellfish growing areas. U.S. Public Health Service, Washington, D.C.
14. Public Health Laboratory Service Water Subcommittee, 1953. The effect of storage on the
coliform and Bacterium coli counts of water samples. Storage for six hours at room and
refrigerator temperatures. J. Hyg. S|:559.
SAMPLING TECHNIQUES 31
image:
 PART II. GENERAL OPERATIONS
Section B Laboratory Equipment, Techniques and Media
Most equipment and supplies described in
This Manual are available in weH-equipped
bacteriology laboratories. Other items specific
for the membrane filter or multiple-tube dilu-
tion methods are used only in water laborator-
ies. This Section describes the required equip-
ment, media and preparation techniques used
in the laboratory or in the field. The contents
include:
1. Equipment and Supplies
2. Cleaning Glassware
3. Sterilization
4. Preparation and Use of
Culture Media
5. Media Composition
General Use Media
MF Media for Coliforms
MPN Media for Coliforms
Media for Fecal Streptococci
Media for Salmonella and
Other Enterics
Medium for Actinomycetes
6. Laboratory Pure Water
7. Dilution Water
1. Equipment and Supplies
1.1 Inoculating Needles and Loops:
Needles and loops of nichrome, platinum or
platinum-indium wire are used to transfer
microbes aseptically from one growth medium
to another. A 24-26 gauge nichrome wire is
recommended. The loop diameter should be at
least 3 mm. They are sterilized by heating to
redness in a gas flame or in an electric
incinerator. Resterilization is not required for
replicate transfers of the same bacteria or
bacteria-containing materials to a sterile
medium. Sterile, disposable hardwood
applicator sticks or plastic loops can be used
to inoculate fermentation tubes.
1.2 Plastic petri dishes (50 x 12mm) with
tight-fitting lids are preferred for MF proce-
dures because they retain humidity and are
more practical for use in plastic bags sub-
mersed in a water bath incubator. Petri dishes
(60 x 15 mm) with loose-fitting lids can be used
in incubators with controlled humidity or in
plastic boxes with tight covers, containing
moist towels.
1.3 Incubators: Incubators are constant
temperature air chambers or water baths
which provide controlled temperature environ-
ment for microbiological tests. The incubator
must control temperature within specified
tolerance limits of the tests. The air type
incubator can be water-jacketed, a dry air unit
or aluminum block equipped with thermostat-
controlled heating units that maintain 35 C ±
0.5 C. Overcrowding of incubators with plates
arid tubes must be avoided, because this will
interfere with the constancy of the desired
32
<&ERA MICROBIOLOGICAL MANUAL 1978
image:
PART II. GENERAL OPERATIONS
Section B Laboratory Equipment, Techniques and Media
Most equipment and supplies described in
This Manual are available in weH-equipped
bacteriology laboratories. Other items specific
for the membrane filter or multiple-tube dilu-
tion methods are used only in water laborator-
ies. This Section describes the required equip-
ment, media and preparation techniques used
in the laboratory or in the field. The contents
include:
1. Equipment and Supplies
2. Cleaning Glassware
3. Sterilization
4. Preparation and Use of
Culture Media
5. Media Composition
General Use Media
MF Media for Coliforms
MPN Media for Coliforms
Media for Fecal Streptococci
Media for Salmonella and
Other Enterics
Medium for Actinomycetes
6. Laboratory Pure Water
7. Dilution Water
1. Equipment and Supplies
1.1 Inoculating Needles and Loops:
Needles and loops of nichrome, platinum or
platinum-indium wire are used to transfer
microbes aseptically from one growth medium
to another. A 24-26 gauge nichrome wire is
recommended. The loop diameter should be at
least 3 mm. They are sterilized by heating to
redness in a gas flame or in an electric
incinerator. Resterilization is not required for
replicate transfers of the same bacteria or
bacteria-containing materials to a sterile
medium. Sterile, disposable hardwood
applicator sticks or plastic loops can be used
to inoculate fermentation tubes.
1.2 Plastic petri dishes (50 x 12mm) with
tight-fitting lids are preferred for MF proce-
dures because they retain humidity and are
more practical for use in plastic bags sub-
mersed in a water bath incubator. Petri dishes
(60 x 15 mm) with loose-fitting lids can be used
in incubators with controlled humidity or in
plastic boxes with tight covers, containing
moist towels.
1.3 Incubators: Incubators are constant
temperature air chambers or water baths
which provide controlled temperature environ-
ment for microbiological tests. The incubator
must control temperature within specified
tolerance limits of the tests. The air type
incubator can be water-jacketed, a dry air unit
or aluminum block equipped with thermostat-
controlled heating units that maintain 35 C ±
0.5 C. Overcrowding of incubators with plates
arid tubes must be avoided, because this will
interfere with the constancy of the desired
32
<&ERA MICROBIOLOGICAL MANUAL 1978
image:
 temperature. Water bath or aluminum block
type incubators used in fecal coliform tests
must control the incubation temperature of
44.5 C±0.2 C. Covers are required. An accurate
thermometer in the water bath monitors tem-
perature. Recording thermometers are recom-
mended for use in the water baths.
1,4 Colony Counter: A standard counting
device equivalent to the Quebec Colony Counter
that provides good visibility and magnification
of at least 1.5 diameters on a non-glare ruled
guide plate is recommended.
1.5 pH Equipment; ElectrometricpH meter
must be accurate to at least 0.1 pH unit.
1.6 Balances: For routine weighing of
media and reagents, use a single pan top loader
balance having a sensitivity of 0.1 gram at a
load of 150 grams. For weighings of less than 2
grams, use a four place analytical balance
having a sensitivity of 1 mg at a load of 10
grams.
1.7 Media Preparation Utensils: Use suit-
able non-corrosive utensils of plastic, glass,
stainless steel, or non-chipped enamel. Utensils
must be chemically clean before use to prevent
contamination of media with chemicals such as
chlorine, copper, zinc, chromium and de-
tergents.
1.8 Pipets and Graduated Cylinders
1.8.1 Pipets: Because transfer pipets are an
important element in any microbiological
method, they must be properly used. If mouth-
pipetting is practiced for non-polluted waters,
pipets should be cotton-plugged for safety.
Blow-out pipets are not to be used.
The major types of transfer pipets (non-
volumetric) used in the laboratory are based
on the method of draining:
'a) l£ Contain (TC) Pipets: Pipets calibrated
to hold or contain the exact amount specified
by the calibration. Pipet must be completely
emptied to provide the stated volume. Ex-
amples: Transfer Micro and Dual Purpose
Pipets.
fa) Jjo Deliver (TD) Pipets: Pipets designed
to release the exact calibrated amount when
the pipet tip is held vertically against the re-
ceiving vessel wall until draining stops. Exam-
ples: bacteriological, Mohr, serological, and
volumetric pipets.
To Contain and To Deliver pipets are indic-
ated by the letters TC or TD marked respec-
tively on the neck with other calibration
information.
(G) Blow-Out Pipets: These pipets are in-
tended for rapid use in serology and are emp-
tied by forceful blow-out. Because the blow-
out action always produces an aerosol such
pipets should never be used in the microbiol-
ogy laboratory. The pipets do not deliver the
calibrated amount until they are completely
emptied.
Blow-Out pipets are marked with a double
band etching or fired-in marking on the neck.
(d) Dual Purpose Pipets: A new pipet which
combines three calibrations. The pipet has an
upper graduation mark which is the To Deliver
and Blow-Out line, a lower graduation which is
the To Contain line, and carries the double
band for Blow-Out
For microbiological analyses, only bacteri-
ological, serological or Mohr pipets are recom-
mended for use i£ the To Deliver (TD) mode.
Dual purpose or serological pipets which must
be used as blow-out pipets, are not recom-
mended for microbiology because of the dan-
ger of infection through aerosol and the possi-
ble mix-up of TD, TC and blow-out type pipets
with subsequent misuse and improper
delivery.
(e) Pipet Standards/Specifications: There
are several tolerance specifications used to
characterize measuring pipets. The analyst
should be aware of these limits. When accu-
racy of measurements is critical, use only pi-
pets within the following Class A limits:
NBS Specification for Mohr Measuring Pi-
pets, Class A Volume Tolerances Circular 602
and Federal Specification NNN-P-350
EQUIPMENT, TECHNIQUES AND MEDIA
33
image:
temperature. Water bath or aluminum block
type incubators used in fecal coliform tests
must control the incubation temperature of
44.5 C±0.2 C. Covers are required. An accurate
thermometer in the water bath monitors tem-
perature. Recording thermometers are recom-
mended for use in the water baths.
1,4 Colony Counter: A standard counting
device equivalent to the Quebec Colony Counter
that provides good visibility and magnification
of at least 1.5 diameters on a non-glare ruled
guide plate is recommended.
1.5 pH Equipment; ElectrometricpH meter
must be accurate to at least 0.1 pH unit.
1.6 Balances: For routine weighing of
media and reagents, use a single pan top loader
balance having a sensitivity of 0.1 gram at a
load of 150 grams. For weighings of less than 2
grams, use a four place analytical balance
having a sensitivity of 1 mg at a load of 10
grams.
1.7 Media Preparation Utensils: Use suit-
able non-corrosive utensils of plastic, glass,
stainless steel, or non-chipped enamel. Utensils
must be chemically clean before use to prevent
contamination of media with chemicals such as
chlorine, copper, zinc, chromium and de-
tergents.
1.8 Pipets and Graduated Cylinders
1.8.1 Pipets: Because transfer pipets are an
important element in any microbiological
method, they must be properly used. If mouth-
pipetting is practiced for non-polluted waters,
pipets should be cotton-plugged for safety.
Blow-out pipets are not to be used.
The major types of transfer pipets (non-
volumetric) used in the laboratory are based
on the method of draining:
'a) l£ Contain (TC) Pipets: Pipets calibrated
to hold or contain the exact amount specified
by the calibration. Pipet must be completely
emptied to provide the stated volume. Ex-
amples: Transfer Micro and Dual Purpose
Pipets.
fa) Jjo Deliver (TD) Pipets: Pipets designed
to release the exact calibrated amount when
the pipet tip is held vertically against the re-
ceiving vessel wall until draining stops. Exam-
ples: bacteriological, Mohr, serological, and
volumetric pipets.
To Contain and To Deliver pipets are indic-
ated by the letters TC or TD marked respec-
tively on the neck with other calibration
information.
(G) Blow-Out Pipets: These pipets are in-
tended for rapid use in serology and are emp-
tied by forceful blow-out. Because the blow-
out action always produces an aerosol such
pipets should never be used in the microbiol-
ogy laboratory. The pipets do not deliver the
calibrated amount until they are completely
emptied.
Blow-Out pipets are marked with a double
band etching or fired-in marking on the neck.
(d) Dual Purpose Pipets: A new pipet which
combines three calibrations. The pipet has an
upper graduation mark which is the To Deliver
and Blow-Out line, a lower graduation which is
the To Contain line, and carries the double
band for Blow-Out
For microbiological analyses, only bacteri-
ological, serological or Mohr pipets are recom-
mended for use i£ the To Deliver (TD) mode.
Dual purpose or serological pipets which must
be used as blow-out pipets, are not recom-
mended for microbiology because of the dan-
ger of infection through aerosol and the possi-
ble mix-up of TD, TC and blow-out type pipets
with subsequent misuse and improper
delivery.
(e) Pipet Standards/Specifications: There
are several tolerance specifications used to
characterize measuring pipets. The analyst
should be aware of these limits. When accu-
racy of measurements is critical, use only pi-
pets within the following Class A limits:
NBS Specification for Mohr Measuring Pi-
pets, Class A Volume Tolerances Circular 602
and Federal Specification NNN-P-350
EQUIPMENT, TECHNIQUES AND MEDIA
33
image:
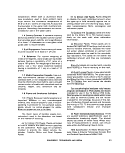 Capacity/Grad (ml)
1/10 in 1/100
2/10 in 1/100
1 in 1/100
1 in 1/10
2 In 1/10
5 In 1/10
10 in 1/10
26 In 1/10
Tolerance (ml)
±0.0025
±0.004
±0.01
±0.01
±0.01
±0.02
±0.03
±0.05
For routine use, the following tolerances
are acceptable:
APHA Specification, Bacteriological Pipets
Capacity/Grad (ml)
Tolerance (ml)
1 in 1
1,1 in 1.1, 1.0
2.2 in 2.2, 2.1
2.0, 1.0
11 in 11
±0.025
±0.025
+0.040
±0.10
USPHS Specification, Bacteriological Pipe'ts
for Water Analyses
Capacity/Grad (ml)
11 in 11, 10, 1
Tolerance (ml)
±0.06
1-8.2 Pipetting Devices: Mechanical pipet-
ting devices are recommended for all purposes.
Although several devices have recently be-
come available, some are not practical for
water analyses because they are too slow and
cumbersome. A finger-mounted safety pipet-
tor which can be fabricated in the laboratory
(1, 2) is recommended as the most efficient It
can be fitted with a mouthpiece, hand-held
bulb or attached to a vacuum pump. Figure II-B-
1 shows the finger-held model and Figure II-B-
2 shows an enlargement of the plastic ring
suction device.
1.8.3 Graduates: For normal laboratory
operations, graduates are used for measuring
volumes greater than 10 ml. When extreme
accuracy is required above 10 ml, volumetric
pipets up to 200 ml and volumetric flasks from
10 ml to 6 liters are available. The tolerances
given below are acceptable for graduates.
1.9 Pipet Container: Only aluminum,
stainless steel, pyrex glass or other non-
corrosive heat-resistant containers, either cyl-
indrical or rectangular in shape, should be
used. Pipets may be also wrapped in kraft
paper. Copper or copper alloy containers must
not be used.
1.10 Dilution (Milk Dilution) Bottles or
Tubes: Borosilicate or other non-corrosive
glass bottles with screw-caps and inert liners.
1.11 Fermentation Tubes and Vials: The
fermentation tubes should be large enough to
contain the media and inocula in no more than
half of the tube depth. There should be suffi-
cient media in the outer fermentation tube to
fill the enclosed inverted vial after sterilization
and partially submerge it
NBS Specification, Tolerance of Graduates, in ml
Volume
Demarcations
NBS Class A
NNN-C-940
Type 1 Style 1
2000
1000
500
250
100
50
20
10
5
2
1
1
+ 1.3
±0.8
±0.4
±0.26
±10.0
±5,0
±2.6
+ 1.4
±0.6
34
V>EFV\ MICROBIOLOGICAL MANUAL 1978
image:
Capacity/Grad (ml)
1/10 in 1/100
2/10 in 1/100
1 in 1/100
1 in 1/10
2 In 1/10
5 In 1/10
10 in 1/10
26 In 1/10
Tolerance (ml)
±0.0025
±0.004
±0.01
±0.01
±0.01
±0.02
±0.03
±0.05
For routine use, the following tolerances
are acceptable:
APHA Specification, Bacteriological Pipets
Capacity/Grad (ml)
Tolerance (ml)
1 in 1
1,1 in 1.1, 1.0
2.2 in 2.2, 2.1
2.0, 1.0
11 in 11
±0.025
±0.025
+0.040
±0.10
USPHS Specification, Bacteriological Pipe'ts
for Water Analyses
Capacity/Grad (ml)
11 in 11, 10, 1
Tolerance (ml)
±0.06
1-8.2 Pipetting Devices: Mechanical pipet-
ting devices are recommended for all purposes.
Although several devices have recently be-
come available, some are not practical for
water analyses because they are too slow and
cumbersome. A finger-mounted safety pipet-
tor which can be fabricated in the laboratory
(1, 2) is recommended as the most efficient It
can be fitted with a mouthpiece, hand-held
bulb or attached to a vacuum pump. Figure II-B-
1 shows the finger-held model and Figure II-B-
2 shows an enlargement of the plastic ring
suction device.
1.8.3 Graduates: For normal laboratory
operations, graduates are used for measuring
volumes greater than 10 ml. When extreme
accuracy is required above 10 ml, volumetric
pipets up to 200 ml and volumetric flasks from
10 ml to 6 liters are available. The tolerances
given below are acceptable for graduates.
1.9 Pipet Container: Only aluminum,
stainless steel, pyrex glass or other non-
corrosive heat-resistant containers, either cyl-
indrical or rectangular in shape, should be
used. Pipets may be also wrapped in kraft
paper. Copper or copper alloy containers must
not be used.
1.10 Dilution (Milk Dilution) Bottles or
Tubes: Borosilicate or other non-corrosive
glass bottles with screw-caps and inert liners.
1.11 Fermentation Tubes and Vials: The
fermentation tubes should be large enough to
contain the media and inocula in no more than
half of the tube depth. There should be suffi-
cient media in the outer fermentation tube to
fill the enclosed inverted vial after sterilization
and partially submerge it
NBS Specification, Tolerance of Graduates, in ml
Volume
Demarcations
NBS Class A
NNN-C-940
Type 1 Style 1
2000
1000
500
250
100
50
20
10
5
2
1
1
+ 1.3
±0.8
±0.4
±0.26
±10.0
±5,0
±2.6
+ 1.4
±0.6
34
V>EFV\ MICROBIOLOGICAL MANUAL 1978
image:
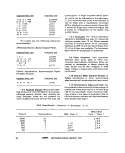 EQUJPMENT'
image:
EQUJPMENT'
image:
 1.12 Sample Bottles: Sample bottles
should be borosilicate glass or plastic, resis-
tant to sterilizing conditions and the solvent
action of water and which do not produce toxic
substances upon sterilization. Wide-mouth
ground-glass stopper or screw-cap bottles are
acceptable. Bottles equipped with screw-caps
are acceptable provided that bacteriostatic or
nutritive compounds are not produced from
caps or liners. Bottles should be at least 125
ml volume.
2. Cleaning Glassware
In microbiology, clean glassware is crucial
to insure valid results. Previously used or new
glassware must be thoroughly cleaned with a
phosphate-free laboratory detergent and hot
water, then rinsed repeatedly with hot water,
followed by at least three rinses with labora-
tory pure water. To determine whether the
detergent used contains inhibitory residues,
the test procedure for detergent suitability
should be performed each time a new type
detergent is purchased. See Part IV-A, 5.1.
3. Sterilization
Sterilization is the process that eliminates
living organisms from treated substances or
objects. Disinfection is the destruction or
removal of the infectious agents by chemical
or physical means. Usually chemical agents
are used as disinfectants (germicide and bac-
tericide are synonymous with the term, disin-
fectant). Pasteurization is a form of disinfection
used for materials which may be altered or
damaged by excessive heat. Low heat is applied
once or repeatedly to sensitive liquids to destroy
vegetative cells. Sterilization can be accom-
plished by moist heat, dry heat, incineration,
filtration, radiation or by the use of the chemical
agent, ethylene oxide. Bottles should have loos-
ened caps for penetration of steam or gas.
3.1 Moist Heat: The autoclave is used in
the laboratory for moist heat sterilization. It is
normally operated at 15 Ibs. per sq. in. steam
pressure for 15 minutes, producing a tempera-
ture inside the autoclave of 121.6 C (250F) at
sea level. Steam under pressure provides
effective sterilization since it has good penetra-
tion power and coagulates microbial proto-
plasm. The temperature in the autoclave should
be monitored. The relationship between the
pressure of steam and the temperature is
shown in Table II-B-1. The autoclave is used to
sterilize solid and liquid media, contaminated
materials, discarded cultures, glassware of all
types, filtering units, etc. Pressure cookers and
vertical autoclaves are not recommended.
3.2 Dry Heat; The hot-air oven is used to
sterilize glassware such as petri dishes, pipets,
sample bottles and flasks, hardwood applicator
sticks, and other articles, but not liquids or
materials which will evaporate or deteriorate.
Since moisture is not present in the oven, a
temperature of 165-170 C (329-338 F) is re-
quired for a 2 hour period.
3.3 Incineration: Contaminated materials
that are combustible may be disposed of by
burning. This method is also used for steriliz-
ing inoculating needles and loops, and flaming
the lips of test tubes and flasks.
3.4 Filtration. Filtration is used to sterilize
liquids that are heat-sensitive. Filters include
those composed of: asbestos-cellulose (Seitz
filter), cellulose esters (0.22/tm MF or molecu-
lar filter), unglazed porcelain (Chamberland-
Pasteur filter), or diatomaceous earth (Berkfeld
filter). Although filters are normally used
to remove bacteria, porosities small enough
.for the removal of viruses are available.
3.5 Ultraviolet Radiation: Ultraviolet light
includes radiations between 150 and 4000
Angstrom units (A.U.), but radiations less than
1800 A.U. are absorbed by atmospheric oxy-
gen. The greatest killing effect on microorga-
nisms occurs at 2600 A.U. Commercial germi-
cidal ultraviolet lamps emit primarily 2537
A.U. which has 85 percent of the germicidal
ability of 2600 A.U. Ultraviolet radiation at the
germicidal wavelength is used to sterilize labo-
ratory equipment such as membrane filter
units, inoculating rooms, bacteriological
hoods and glove boxes. See Part IV-A, 4.2, for
monitoring procedures.
3.6 Ethylene Oxide Chemical
Sterilization: Low temperature ethylene oxide
36
&ERA MICROBIOLOGICAL MANUAL 1978
image:
1.12 Sample Bottles: Sample bottles
should be borosilicate glass or plastic, resis-
tant to sterilizing conditions and the solvent
action of water and which do not produce toxic
substances upon sterilization. Wide-mouth
ground-glass stopper or screw-cap bottles are
acceptable. Bottles equipped with screw-caps
are acceptable provided that bacteriostatic or
nutritive compounds are not produced from
caps or liners. Bottles should be at least 125
ml volume.
2. Cleaning Glassware
In microbiology, clean glassware is crucial
to insure valid results. Previously used or new
glassware must be thoroughly cleaned with a
phosphate-free laboratory detergent and hot
water, then rinsed repeatedly with hot water,
followed by at least three rinses with labora-
tory pure water. To determine whether the
detergent used contains inhibitory residues,
the test procedure for detergent suitability
should be performed each time a new type
detergent is purchased. See Part IV-A, 5.1.
3. Sterilization
Sterilization is the process that eliminates
living organisms from treated substances or
objects. Disinfection is the destruction or
removal of the infectious agents by chemical
or physical means. Usually chemical agents
are used as disinfectants (germicide and bac-
tericide are synonymous with the term, disin-
fectant). Pasteurization is a form of disinfection
used for materials which may be altered or
damaged by excessive heat. Low heat is applied
once or repeatedly to sensitive liquids to destroy
vegetative cells. Sterilization can be accom-
plished by moist heat, dry heat, incineration,
filtration, radiation or by the use of the chemical
agent, ethylene oxide. Bottles should have loos-
ened caps for penetration of steam or gas.
3.1 Moist Heat: The autoclave is used in
the laboratory for moist heat sterilization. It is
normally operated at 15 Ibs. per sq. in. steam
pressure for 15 minutes, producing a tempera-
ture inside the autoclave of 121.6 C (250F) at
sea level. Steam under pressure provides
effective sterilization since it has good penetra-
tion power and coagulates microbial proto-
plasm. The temperature in the autoclave should
be monitored. The relationship between the
pressure of steam and the temperature is
shown in Table II-B-1. The autoclave is used to
sterilize solid and liquid media, contaminated
materials, discarded cultures, glassware of all
types, filtering units, etc. Pressure cookers and
vertical autoclaves are not recommended.
3.2 Dry Heat; The hot-air oven is used to
sterilize glassware such as petri dishes, pipets,
sample bottles and flasks, hardwood applicator
sticks, and other articles, but not liquids or
materials which will evaporate or deteriorate.
Since moisture is not present in the oven, a
temperature of 165-170 C (329-338 F) is re-
quired for a 2 hour period.
3.3 Incineration: Contaminated materials
that are combustible may be disposed of by
burning. This method is also used for steriliz-
ing inoculating needles and loops, and flaming
the lips of test tubes and flasks.
3.4 Filtration. Filtration is used to sterilize
liquids that are heat-sensitive. Filters include
those composed of: asbestos-cellulose (Seitz
filter), cellulose esters (0.22/tm MF or molecu-
lar filter), unglazed porcelain (Chamberland-
Pasteur filter), or diatomaceous earth (Berkfeld
filter). Although filters are normally used
to remove bacteria, porosities small enough
.for the removal of viruses are available.
3.5 Ultraviolet Radiation: Ultraviolet light
includes radiations between 150 and 4000
Angstrom units (A.U.), but radiations less than
1800 A.U. are absorbed by atmospheric oxy-
gen. The greatest killing effect on microorga-
nisms occurs at 2600 A.U. Commercial germi-
cidal ultraviolet lamps emit primarily 2537
A.U. which has 85 percent of the germicidal
ability of 2600 A.U. Ultraviolet radiation at the
germicidal wavelength is used to sterilize labo-
ratory equipment such as membrane filter
units, inoculating rooms, bacteriological
hoods and glove boxes. See Part IV-A, 4.2, for
monitoring procedures.
3.6 Ethylene Oxide Chemical
Sterilization: Low temperature ethylene oxide
36
&ERA MICROBIOLOGICAL MANUAL 1978
image:
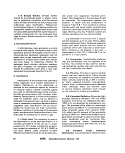 TABLE li-B-1
Relationship of Steam Pressure to Temperature in the Autoclave
Pounds of pressure of steam
per square inch
Corresponding Temperature
In Degrees*
Celsius
Fahrenheit
o
5
10
15
20
25
30
1OO.O
108.3
115.5
121.6
126.6
130.5
134.4
212
227
240
250
260
267
274
•Correct at sea level and only if all air is evacuated from the sterilizing chamber since a mixture
of steam and air at a given pressure gives a temperature that is less than that of pure steam only.
EQUIPMENT, TECHNIQUES AND MEDIA
37
image:
TABLE li-B-1
Relationship of Steam Pressure to Temperature in the Autoclave
Pounds of pressure of steam
per square inch
Corresponding Temperature
In Degrees*
Celsius
Fahrenheit
o
5
10
15
20
25
30
1OO.O
108.3
115.5
121.6
126.6
130.5
134.4
212
227
240
250
260
267
274
•Correct at sea level and only if all air is evacuated from the sterilizing chamber since a mixture
of steam and air at a given pressure gives a temperature that is less than that of pure steam only.
EQUIPMENT, TECHNIQUES AND MEDIA
37
image:
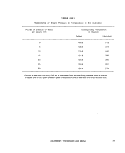 gas sterilization is used to sterilize plastics,
rubber goods, delicate instruments and other
materials that would be damaged by the high
temperature of the steam pressure autoclave.
Vent sterilized materials according to operating
instructions.
4, Preparation and Use of Culture Media
The preparation of culture media and solu-
tions is a critical aspect of water quality testing.
In many laboratories media are prepared by
nonprofessional personnel. If such personnel
are properly trained and guided, they can
perform the required tasks efficiently and
reliably. However, the supervisor should
monitor media preparation to maintain quality
control. Use commercial dehydrated media
which require only weighing and dissolving of
the powder in laboratory pure water for prepa-
ration and are much more likely to have uniform
high quality than media compounded in the
laboratory. See IV-A, 7.3-7.5 for quality control
on preparation of media.
4.1 Supplies of Dehydrated Media: The
laboratory worker should keep a record of the
lot numbers of commercial media in use. The
data of receipt of media and the date of open-
ing should be recorded in the quality control
log. It is suggested that supplies of dehydrated
media be purchased for anticipated use over
the next year. Whenever practical, one-quarter
pound bottles should be purchased to insure
minimal exposure of contents to atmosphere.
When a new lot number of medium is used, the
contents should be tested for expected per-
formance characteristics {see Part IV-A for
details). Stocks of dehydrated media should be
stored in a cool, dry place away from sunlight.
4.2 Rehydration of Media: In this Manual,
dry ingredients are added to 1 liter (1000 ml)
of laboratory pure water. However, liquids
such as ethanol are added to graduate and
bought up to volume with laboratory pure
water. Care must be taken to completely dis-
solve and mix the ingredients before dispensing
the medium into bottles, tubes or flasks. If
heat is necessary, it must be applied with cau-
tion and for the shortest possible time. Direct
heat, boiling water bath and flowing steam are
used selectively according to the type and
volume of medium as described below:
4,2.1 MF Broths and Agars: Small volumes
of broth are rehydrated in a boiling water bath
for 5 minutes, Agars and larger volumes of
broth require direct heating to the first bubble
of boil. Such heating must be applied with
stirring and constant attention until agar is
dissolved.
4.2.2 Other Broths: Some heat may be
required to dissolve the ingredients prior to
autoclaving. Heat can be applied by flame or
waterbath.
4.2.3 Other Agars: Heat is required for
complete solution. For large volumes, direct
heat will effect solution more rapidly but must
be applied with stirring and constant attention
to prevent scorching.
4.3 Sterilization: Media must be dissolved
before autoclaving, to insure timing for com-
plete sterilization. The specific recommenda-
tions for sterilization are described in subsec-
tion 5, Composition of Media, in This Section.
The following general recommendations
can be made:
Group
Sterilization
MF and Salmonella
Media
Heat to boiling only
Media Containing
Blood
Autoclave, cool,
then add blood
Litmus Milk and
Other Milk-con-
taining Media
115 C for 20
minutes
{10 Ibs. pressure)
Most Carbohydrate-
Containing Media
for Fermentation
Reactions such as
Phenol Red Broth,
Triple Sugar Iron
Agar
118 C for 15
minutes
(12 Ibs. pressure)
or
121 C for 12 minutes
38
MICROBIOLOGICAL MANUAL 1978
image:
gas sterilization is used to sterilize plastics,
rubber goods, delicate instruments and other
materials that would be damaged by the high
temperature of the steam pressure autoclave.
Vent sterilized materials according to operating
instructions.
4, Preparation and Use of Culture Media
The preparation of culture media and solu-
tions is a critical aspect of water quality testing.
In many laboratories media are prepared by
nonprofessional personnel. If such personnel
are properly trained and guided, they can
perform the required tasks efficiently and
reliably. However, the supervisor should
monitor media preparation to maintain quality
control. Use commercial dehydrated media
which require only weighing and dissolving of
the powder in laboratory pure water for prepa-
ration and are much more likely to have uniform
high quality than media compounded in the
laboratory. See IV-A, 7.3-7.5 for quality control
on preparation of media.
4.1 Supplies of Dehydrated Media: The
laboratory worker should keep a record of the
lot numbers of commercial media in use. The
data of receipt of media and the date of open-
ing should be recorded in the quality control
log. It is suggested that supplies of dehydrated
media be purchased for anticipated use over
the next year. Whenever practical, one-quarter
pound bottles should be purchased to insure
minimal exposure of contents to atmosphere.
When a new lot number of medium is used, the
contents should be tested for expected per-
formance characteristics {see Part IV-A for
details). Stocks of dehydrated media should be
stored in a cool, dry place away from sunlight.
4.2 Rehydration of Media: In this Manual,
dry ingredients are added to 1 liter (1000 ml)
of laboratory pure water. However, liquids
such as ethanol are added to graduate and
bought up to volume with laboratory pure
water. Care must be taken to completely dis-
solve and mix the ingredients before dispensing
the medium into bottles, tubes or flasks. If
heat is necessary, it must be applied with cau-
tion and for the shortest possible time. Direct
heat, boiling water bath and flowing steam are
used selectively according to the type and
volume of medium as described below:
4,2.1 MF Broths and Agars: Small volumes
of broth are rehydrated in a boiling water bath
for 5 minutes, Agars and larger volumes of
broth require direct heating to the first bubble
of boil. Such heating must be applied with
stirring and constant attention until agar is
dissolved.
4.2.2 Other Broths: Some heat may be
required to dissolve the ingredients prior to
autoclaving. Heat can be applied by flame or
waterbath.
4.2.3 Other Agars: Heat is required for
complete solution. For large volumes, direct
heat will effect solution more rapidly but must
be applied with stirring and constant attention
to prevent scorching.
4.3 Sterilization: Media must be dissolved
before autoclaving, to insure timing for com-
plete sterilization. The specific recommenda-
tions for sterilization are described in subsec-
tion 5, Composition of Media, in This Section.
The following general recommendations
can be made:
Group
Sterilization
MF and Salmonella
Media
Heat to boiling only
Media Containing
Blood
Autoclave, cool,
then add blood
Litmus Milk and
Other Milk-con-
taining Media
115 C for 20
minutes
{10 Ibs. pressure)
Most Carbohydrate-
Containing Media
for Fermentation
Reactions such as
Phenol Red Broth,
Triple Sugar Iron
Agar
118 C for 15
minutes
(12 Ibs. pressure)
or
121 C for 12 minutes
38
MICROBIOLOGICAL MANUAL 1978
image:
 MPN, some Salmonella
Media and General
Use Media such as
Trypticase Soy Broth
and Agar, Nutrient
Broth and Agar
121 Cfor
12-15 minutes
(15 Ibs. pressure)
As soon as the autoclave pressure has
fallen to zero, the sterilized media should be
removed from the autoclave for cooling before
use or storage. Refrigerated media should be
allowed to come to room temperature before
use. Incubate MPN tubed media overnight and
discard tubes showing bubbles. Media that
have been poured into petri dishes should be
used on the day of preparation or refrigerated.
Water loss from evaporation can be prevented
by storing plates in plastic bags. Plates should
be stored inverted. See Part IV-A, 7.9 for stor-
age limits.
Autoclaves should be inspected routinely
to insure proper functioning of pressure
gauges and .thermometers. The use of com-
mercially available temperature indicator de-
vices within the sterilizer (heat-resistant spore
preparations, chemically-impregnated tapes,
vials containing chemicals, etc.) is recom-
mended to insure sterility (see Part IV-A for
details).
5. Composition of Media
The formulas for media used in this Man-
ual and for other more commonly-used media
are given in detail in this Section. Normally,
these media should not be prepared from basic
ingredients when suitable commercial media
are available.
The catalogue numbers cited are those for
y* Ib. size if available, from the two U.S. manu-
facturers whose media were used in most of
the method development work. This listing is
not restrictive; other sources can be utilized if
the user confirms that the formulas are the
same as those cited here and that the media
produce comparable results.
Culture media used for the examination of
water and wastewaters are described sepa-
rately for:
5.1 General Use Media
5.2 MF Media for Coliforms
5.3 MPN Media for Coliforms
5.4 Media for Fecal Streptococci
5.5 Media for Sa/moneffaand
Other Enterics
5.6 Medium for Actinomycetes
5.1 General Use Media
Nutrient Agar (Difco 0001-02, BBL
11471)
Use: This medium is used to cultivate pure
culture isolates for subsequent gram stain and
other examinations and for general cultivation
of microorganisms that are not fastidious.
Composition:
Peptone
Beef Extract
Agar
Final pH: 6.8 ±.1
5.0
3.0
15.O
Preparation: Add 23 grams of nutrient
agar per liter of laboratory pure water and
mix well. Heat in boiling water bath to dissolve
the agar completely. Dispense in screw-cap
tubes, bottles or flasks and sterilize for 15
minutes at 121 C (15 Ibs. pressure). Remove
tubes and slant.
5-1 -2 Nutrient Broth (Difco 0003-02, BBL
11478)
Use: General laboratory use for the cultiva-
tion of non-fastidious microorganisms.
Composition:
Peptone
Beef Extract
Final pH: 6.8±.1
5.0 g
3.0 g
EQUIPMENT, TECHNIQUES AND MEDIA
39
image:
MPN, some Salmonella
Media and General
Use Media such as
Trypticase Soy Broth
and Agar, Nutrient
Broth and Agar
121 Cfor
12-15 minutes
(15 Ibs. pressure)
As soon as the autoclave pressure has
fallen to zero, the sterilized media should be
removed from the autoclave for cooling before
use or storage. Refrigerated media should be
allowed to come to room temperature before
use. Incubate MPN tubed media overnight and
discard tubes showing bubbles. Media that
have been poured into petri dishes should be
used on the day of preparation or refrigerated.
Water loss from evaporation can be prevented
by storing plates in plastic bags. Plates should
be stored inverted. See Part IV-A, 7.9 for stor-
age limits.
Autoclaves should be inspected routinely
to insure proper functioning of pressure
gauges and .thermometers. The use of com-
mercially available temperature indicator de-
vices within the sterilizer (heat-resistant spore
preparations, chemically-impregnated tapes,
vials containing chemicals, etc.) is recom-
mended to insure sterility (see Part IV-A for
details).
5. Composition of Media
The formulas for media used in this Man-
ual and for other more commonly-used media
are given in detail in this Section. Normally,
these media should not be prepared from basic
ingredients when suitable commercial media
are available.
The catalogue numbers cited are those for
y* Ib. size if available, from the two U.S. manu-
facturers whose media were used in most of
the method development work. This listing is
not restrictive; other sources can be utilized if
the user confirms that the formulas are the
same as those cited here and that the media
produce comparable results.
Culture media used for the examination of
water and wastewaters are described sepa-
rately for:
5.1 General Use Media
5.2 MF Media for Coliforms
5.3 MPN Media for Coliforms
5.4 Media for Fecal Streptococci
5.5 Media for Sa/moneffaand
Other Enterics
5.6 Medium for Actinomycetes
5.1 General Use Media
Nutrient Agar (Difco 0001-02, BBL
11471)
Use: This medium is used to cultivate pure
culture isolates for subsequent gram stain and
other examinations and for general cultivation
of microorganisms that are not fastidious.
Composition:
Peptone
Beef Extract
Agar
Final pH: 6.8 ±.1
5.0
3.0
15.O
Preparation: Add 23 grams of nutrient
agar per liter of laboratory pure water and
mix well. Heat in boiling water bath to dissolve
the agar completely. Dispense in screw-cap
tubes, bottles or flasks and sterilize for 15
minutes at 121 C (15 Ibs. pressure). Remove
tubes and slant.
5-1 -2 Nutrient Broth (Difco 0003-02, BBL
11478)
Use: General laboratory use for the cultiva-
tion of non-fastidious microorganisms.
Composition:
Peptone
Beef Extract
Final pH: 6.8±.1
5.0 g
3.0 g
EQUIPMENT, TECHNIQUES AND MEDIA
39
image:
 Preparation: Add 8 grams of nutrient broth
per liter of laboratory pure water and warm to
dissolve the medium completely. Dispense in
containers and sterilize for 15 minutes at 121
C(15 Ibs. pressure).
5.1.3 Trypticase Soy Agar (BBL 11042)
Tryptic Soy Agar(Difco 036902)
Use: A general purpose medium for the
cultivation of fastidious microorganisms. An
excellent blood agar is prepared by adding
sheep blood.
Composition:
Trypticase Peptone or
Tryptone
Phytone Peptone or
Soytone
Sodium Chloride
Agar
FinalpH:7.3 ±.2
15.0 g
5.0
5.0
15.0
Preparation: Add 40 grams of TS agar per
liter of laboratory pure water and mix well.
Heat in a boiling water bath to dissolve agar
completely. Dispense into tubes, bottles or
flasks and sterilize for 15 minutes at 121 C (15
Ibs. pressure).
For blood agar, cool the sterile, melted
agar to 45-46 C and add aseptically 5 ml of
sterile defibrinated sheep blood for each 100
ml of agar. Mix flask of agar by swirling and
dispense into petri dishes. Blood from other
species may be used for particular purposes.
5.1.4 Tryptic Soy Broth (Difco 0370-02
Trypticase Soy Broth (BBL 11767)
Use: A general purpose medium for the
cultivation of fastidious microorganisms.
Composition:
Tryptone or Trypticase
Peptone
Soytone or Phytone
Peptone
Sodium Chloride
17.0 g
3.0 g
5.0 g
Dextrose 2.5 g
Dipotassium Phosphate 2.5 g
Final pH: 7.3 ±,2
Preparation: Add 30 grams of TS broth per
liter of laboratory pure water. Warm the broth
and mix gently to dissolve the medium com-
pletely. Dispense and sterilize for 15 minutes
to 121 C (15 Ibs. pressure).
5-'1-5 Standard Methods Agar (BBL
11637) Plate Count Agar (Difco 0479-02)
(Tryptone Glucose Yeast Agar)
Use: Standard Plate Counts in water and in
general pour plate procedures.
Composition
Tryptone or Trypticase
Peptone 5.0 g
Yeast Extract 2.5 g
Dextrose 1.0 g
Agar 15.0 g
Final pH: 7.0 ±.2
Preparation: Add 23.5 grams of tryptone
glucose yeast agar per liter of laboratory pure
water. Mix well and heat in boiling water bath
to dissolve agar completely. Dispense into
screw-cap tubes, flasks or bottles and sterilize
for 15 minutes at 121 C (15 Ibs. pressure).
5-1-6 Phenol Red Broth Base (Difco
0092-02, BBL 11505)
Use: Phenol red broth base with the addi-
tion of carbohydrates is used in fermentation
studies of microorganisms because its pH
range of 6.9-8.5 indicates slight changes
toward acidity. Although 0.5-1.0%
carbohydrates have been used, the 1.0 per-
cent level is recommended to prevent reversal
of the reactions.
40
«»EPA MICROBIOLOGICAL MANUAL 1978
image:
Preparation: Add 8 grams of nutrient broth
per liter of laboratory pure water and warm to
dissolve the medium completely. Dispense in
containers and sterilize for 15 minutes at 121
C(15 Ibs. pressure).
5.1.3 Trypticase Soy Agar (BBL 11042)
Tryptic Soy Agar(Difco 036902)
Use: A general purpose medium for the
cultivation of fastidious microorganisms. An
excellent blood agar is prepared by adding
sheep blood.
Composition:
Trypticase Peptone or
Tryptone
Phytone Peptone or
Soytone
Sodium Chloride
Agar
FinalpH:7.3 ±.2
15.0 g
5.0
5.0
15.0
Preparation: Add 40 grams of TS agar per
liter of laboratory pure water and mix well.
Heat in a boiling water bath to dissolve agar
completely. Dispense into tubes, bottles or
flasks and sterilize for 15 minutes at 121 C (15
Ibs. pressure).
For blood agar, cool the sterile, melted
agar to 45-46 C and add aseptically 5 ml of
sterile defibrinated sheep blood for each 100
ml of agar. Mix flask of agar by swirling and
dispense into petri dishes. Blood from other
species may be used for particular purposes.
5.1.4 Tryptic Soy Broth (Difco 0370-02
Trypticase Soy Broth (BBL 11767)
Use: A general purpose medium for the
cultivation of fastidious microorganisms.
Composition:
Tryptone or Trypticase
Peptone
Soytone or Phytone
Peptone
Sodium Chloride
17.0 g
3.0 g
5.0 g
Dextrose 2.5 g
Dipotassium Phosphate 2.5 g
Final pH: 7.3 ±,2
Preparation: Add 30 grams of TS broth per
liter of laboratory pure water. Warm the broth
and mix gently to dissolve the medium com-
pletely. Dispense and sterilize for 15 minutes
to 121 C (15 Ibs. pressure).
5-'1-5 Standard Methods Agar (BBL
11637) Plate Count Agar (Difco 0479-02)
(Tryptone Glucose Yeast Agar)
Use: Standard Plate Counts in water and in
general pour plate procedures.
Composition
Tryptone or Trypticase
Peptone 5.0 g
Yeast Extract 2.5 g
Dextrose 1.0 g
Agar 15.0 g
Final pH: 7.0 ±.2
Preparation: Add 23.5 grams of tryptone
glucose yeast agar per liter of laboratory pure
water. Mix well and heat in boiling water bath
to dissolve agar completely. Dispense into
screw-cap tubes, flasks or bottles and sterilize
for 15 minutes at 121 C (15 Ibs. pressure).
5-1-6 Phenol Red Broth Base (Difco
0092-02, BBL 11505)
Use: Phenol red broth base with the addi-
tion of carbohydrates is used in fermentation
studies of microorganisms because its pH
range of 6.9-8.5 indicates slight changes
toward acidity. Although 0.5-1.0%
carbohydrates have been used, the 1.0 per-
cent level is recommended to prevent reversal
of the reactions.
40
«»EPA MICROBIOLOGICAL MANUAL 1978
image:
 Composition:
Dif co (0092-02)
Beef Extract
Proteose Peptone No. 3
Sodium Chloride
Phenol Red
BBL (11505)
Trypticase Peptone
Sodium Chloride
Phenol Red
Final pH: 7.4+ .2
1.0
10.0
5.0
0.018
10.0
5.0
0.018
Preparation: Add 15-16 grams (de-
pending on manufacturer) of phenol red broth
base per liter of laboratory pure water. Mix
well to dissolve. To this solution, add 10 grams
of test carbohydrate if heat-stable. Mix to com-
plete solution. Distribute the medium in fer-
mentation tubes and sterilize not more than 15
minutes at 118 C (12 Ibs. pressure). Heat-
sensitive carbohydrates or alcohols are filter-
sterilized and added to the sterile medium
tubes. Check pH and adjust if necessary with
0.1 N NaOH after addition and solution of the
carbohydrate.
5-1-7 purPle Broth Base (Difco 0227-02,
BBL 11558)
Use: For preparation of carbohydrate broths
in fermentation studies, for the cultural identi-
fication of pure cultures of microorganisms,
particularly the fecal streptococci. Although
0.5-1.0 percent carbohydrate has been used,
1.0 percent is recommended rather than 0.5
percent to prevent reversal of the reaction.
BBL product does not contain beef extract.
Composition:
Proteose Peptone No. 3
or Peptone
Beef Extract
Sodium Chloride
Brom Cresol Purple
Final pH: 6.8 ±.2
10.0
1.0
5.0
0.015
Preparation: Add 15-16 grams (depending
on manufacturer) of purple broth base per liter
of laboratory pure water and mix to dissolve.
Add 10 grams of the test carbohydrate and dis-
solve. Dispense in screw-cap fermentation
tubes and sterilize for not more than 15 minutes
§! Hi C (12 Ibs. pressure).
Ten percent solutions of the following car-
bohydrates are prepared for differentiation of
fecal streptococci.
L-Arabinose (Difco 0159, BBL 11960}
Raffinose (Difco 0174, BBL 12060)
D-SorbitoI (Difco 0179)
Glycerol (Difco 0282)
Lactose (Difco 0156,BBL11881)
Inositol(Difco0164)
L-Sorbose (Merck 7760)
Sterilize heat-labile carbohydrates and
alcohols by passage through a sterile 0.22 ,um
membrane filtration unit. The carbohydrates
made up as 10% solutions are sterilized and
added to the sterile base medium at a 1%
concentration, wt/unit volume. Check pH and
adjust if necessary with 0.1 N NaOH after
addition of carbohydrate. Careful use of asep-
tic techniques is necessary to prevent contami-
nation. As a QC check for contamination, incu-
bate the prepared tubes for 24 hours at 35 C.
10
5.1.8 Purple Broth Base with Sorbose, pH
(Medium may not be commercially
available).
Use: To determine the presence of Group
Q Streptococci.
Composition:
Same as purple broth base but add 1 %
sorbose and adjust pH to 10.0.
Final pH: 10.0+ .2
Preparation: Prepare and sterilize purple
broth base as in 5.1.7. Add sufficient volume
of a 10% filter-sterilized solution of sorbose to
produce a 1 % final concentration of sorbose.
Adjust pH to 10.0 with sterile 38% sodium
phosphate solution (Na3P04 • 12 H20).
EQUIPMENT, TECHNIQUES AND MEDIA
41
image:
Composition:
Dif co (0092-02)
Beef Extract
Proteose Peptone No. 3
Sodium Chloride
Phenol Red
BBL (11505)
Trypticase Peptone
Sodium Chloride
Phenol Red
Final pH: 7.4+ .2
1.0
10.0
5.0
0.018
10.0
5.0
0.018
Preparation: Add 15-16 grams (de-
pending on manufacturer) of phenol red broth
base per liter of laboratory pure water. Mix
well to dissolve. To this solution, add 10 grams
of test carbohydrate if heat-stable. Mix to com-
plete solution. Distribute the medium in fer-
mentation tubes and sterilize not more than 15
minutes at 118 C (12 Ibs. pressure). Heat-
sensitive carbohydrates or alcohols are filter-
sterilized and added to the sterile medium
tubes. Check pH and adjust if necessary with
0.1 N NaOH after addition and solution of the
carbohydrate.
5-1-7 purPle Broth Base (Difco 0227-02,
BBL 11558)
Use: For preparation of carbohydrate broths
in fermentation studies, for the cultural identi-
fication of pure cultures of microorganisms,
particularly the fecal streptococci. Although
0.5-1.0 percent carbohydrate has been used,
1.0 percent is recommended rather than 0.5
percent to prevent reversal of the reaction.
BBL product does not contain beef extract.
Composition:
Proteose Peptone No. 3
or Peptone
Beef Extract
Sodium Chloride
Brom Cresol Purple
Final pH: 6.8 ±.2
10.0
1.0
5.0
0.015
Preparation: Add 15-16 grams (depending
on manufacturer) of purple broth base per liter
of laboratory pure water and mix to dissolve.
Add 10 grams of the test carbohydrate and dis-
solve. Dispense in screw-cap fermentation
tubes and sterilize for not more than 15 minutes
§! Hi C (12 Ibs. pressure).
Ten percent solutions of the following car-
bohydrates are prepared for differentiation of
fecal streptococci.
L-Arabinose (Difco 0159, BBL 11960}
Raffinose (Difco 0174, BBL 12060)
D-SorbitoI (Difco 0179)
Glycerol (Difco 0282)
Lactose (Difco 0156,BBL11881)
Inositol(Difco0164)
L-Sorbose (Merck 7760)
Sterilize heat-labile carbohydrates and
alcohols by passage through a sterile 0.22 ,um
membrane filtration unit. The carbohydrates
made up as 10% solutions are sterilized and
added to the sterile base medium at a 1%
concentration, wt/unit volume. Check pH and
adjust if necessary with 0.1 N NaOH after
addition of carbohydrate. Careful use of asep-
tic techniques is necessary to prevent contami-
nation. As a QC check for contamination, incu-
bate the prepared tubes for 24 hours at 35 C.
10
5.1.8 Purple Broth Base with Sorbose, pH
(Medium may not be commercially
available).
Use: To determine the presence of Group
Q Streptococci.
Composition:
Same as purple broth base but add 1 %
sorbose and adjust pH to 10.0.
Final pH: 10.0+ .2
Preparation: Prepare and sterilize purple
broth base as in 5.1.7. Add sufficient volume
of a 10% filter-sterilized solution of sorbose to
produce a 1 % final concentration of sorbose.
Adjust pH to 10.0 with sterile 38% sodium
phosphate solution (Na3P04 • 12 H20).
EQUIPMENT, TECHNIQUES AND MEDIA
41
image:
 5.1.9 IMViC Test Media
Use: Differentiation of the coliform group
based on indole production from tryptophane
broth, acid production in a glucose broth indic-
ated by methyl red color change, formation of
acetoin (actylmethylcarbinol) in salt peptone
glucose broth and use of citrate as the sole
carbon source.
(a) Tryptone 1% (Difco 0123-02) Trypto-
phane Broth (BBL 11920)
Use: For the detection of indole as a by-
product of the metabolism of tryptophane and
for the identification of bacteria.
Composition:
Tryptone or Trypticase
Peptone
Final pH: 7.2 ±.2
10.0 g
Preparation: Add 10 grams of Tryptone or
Trypticase to 900 ml of laboratory pure water
and heat with mixing until dissolved. Bring
solution to 1000 ml in a graduate or flask.
Dispense in five ml volume tubes and sterilize
for 15 minutes at 121 C (15 Ibs. pressure).
(b) MR-VP Broth (Buffered Glucose) (BBL
11382, Difco 0016-02)
Use: For the performance of the Methyl
Red and Voges-Proskauer Tests in differentia-
tion of the coliform group.
Composition:
Buffered Peptone or
Polypeptone
Dextrose
Dipotassium Phosphate
Final pH: 6.9 ± .2
7.0
5.0
5.0
Preparation: Add 17 grams of MR-VP me-
dium to 1 liter of laboratory pure water. Mix to
dissolve. Dispense 10 ml volumes into tubes
and sterilize for 15 minutes at 121 C (15 Ibs.
pressure).
(c) Simmons Citrate Agar (BBL 11619,
Difco 0091-02)
Use: Differentiation of gram-negative en-
teric bacteria on the basis of citrate utilization.
Composition:
Magnesium Sulfate 0.2 g
Monoammonium Phosphate 1.0 g
Dipotassium Phosphate 1.0 g
Sodium Citrate 2.0 g
Sodium Chloride 5.0 g
Brom Thymol Blue 0.08 g
Agar 15.0 g
Final pH: 6.8 ±.2
Preparation: Add 24.2 grams of Simmons
Citrate agar per liter of laboratory pure water.
Heat in boiling water bath with mixing for
complete solution. Dispense into screw-cap
tubes and sterilize for 15 minutes at 121 C
(15 Ibs. pressure). Cool tubes as slants.
5.1.10 Motility Test Medium (Edwards and
Ewing)(BBL 11435)
Use: Detection of motility of gram-negative
enteric bacteria.
Composition:
Beef Extract
Peptone
Sodium Chloride
Agar
Final pH: 7.3 ±,2
3.0 g
10.0 g
5.0 g
4.0 g
Preparation: Add 22 grams of dry medium
to 1 liter of laboratory pure water. Add 0.05
grams of triphenyl tetrazolium chloride/liter.
Heat with mixing to boil for 1 minute. Dispense
10 ml volumes into tubes and sterilize for 15
minutes at 121 C (15 Ibs. pressure).
5.2 MF Media for Coliforms
Prepare heat-sensitive broths in sterile
flasks.
42
MICROBIOLOGICAL MANUAL 1978
image:
5.1.9 IMViC Test Media
Use: Differentiation of the coliform group
based on indole production from tryptophane
broth, acid production in a glucose broth indic-
ated by methyl red color change, formation of
acetoin (actylmethylcarbinol) in salt peptone
glucose broth and use of citrate as the sole
carbon source.
(a) Tryptone 1% (Difco 0123-02) Trypto-
phane Broth (BBL 11920)
Use: For the detection of indole as a by-
product of the metabolism of tryptophane and
for the identification of bacteria.
Composition:
Tryptone or Trypticase
Peptone
Final pH: 7.2 ±.2
10.0 g
Preparation: Add 10 grams of Tryptone or
Trypticase to 900 ml of laboratory pure water
and heat with mixing until dissolved. Bring
solution to 1000 ml in a graduate or flask.
Dispense in five ml volume tubes and sterilize
for 15 minutes at 121 C (15 Ibs. pressure).
(b) MR-VP Broth (Buffered Glucose) (BBL
11382, Difco 0016-02)
Use: For the performance of the Methyl
Red and Voges-Proskauer Tests in differentia-
tion of the coliform group.
Composition:
Buffered Peptone or
Polypeptone
Dextrose
Dipotassium Phosphate
Final pH: 6.9 ± .2
7.0
5.0
5.0
Preparation: Add 17 grams of MR-VP me-
dium to 1 liter of laboratory pure water. Mix to
dissolve. Dispense 10 ml volumes into tubes
and sterilize for 15 minutes at 121 C (15 Ibs.
pressure).
(c) Simmons Citrate Agar (BBL 11619,
Difco 0091-02)
Use: Differentiation of gram-negative en-
teric bacteria on the basis of citrate utilization.
Composition:
Magnesium Sulfate 0.2 g
Monoammonium Phosphate 1.0 g
Dipotassium Phosphate 1.0 g
Sodium Citrate 2.0 g
Sodium Chloride 5.0 g
Brom Thymol Blue 0.08 g
Agar 15.0 g
Final pH: 6.8 ±.2
Preparation: Add 24.2 grams of Simmons
Citrate agar per liter of laboratory pure water.
Heat in boiling water bath with mixing for
complete solution. Dispense into screw-cap
tubes and sterilize for 15 minutes at 121 C
(15 Ibs. pressure). Cool tubes as slants.
5.1.10 Motility Test Medium (Edwards and
Ewing)(BBL 11435)
Use: Detection of motility of gram-negative
enteric bacteria.
Composition:
Beef Extract
Peptone
Sodium Chloride
Agar
Final pH: 7.3 ±,2
3.0 g
10.0 g
5.0 g
4.0 g
Preparation: Add 22 grams of dry medium
to 1 liter of laboratory pure water. Add 0.05
grams of triphenyl tetrazolium chloride/liter.
Heat with mixing to boil for 1 minute. Dispense
10 ml volumes into tubes and sterilize for 15
minutes at 121 C (15 Ibs. pressure).
5.2 MF Media for Coliforms
Prepare heat-sensitive broths in sterile
flasks.
42
MICROBIOLOGICAL MANUAL 1978
image:
 5.2.1 M-FC Broth Base (Difco 0883-02)
M-FC Broth (BBL 11364)
Use: Detection and enumeration of fecal
coliform microorganisms by the membrane fil-
ter procedure.
Composition:
Tryptose or Biosate
Peptone 10.0 g
Proteose Peptone No. 3
or Polypeptone 5.0 g
Yeast Extract 3.0 g
Sodium Chloride 5.0 g
Lactose 12.5 g
Bile Salts No. 3 or
Bile Salts Mixture 1.5 g
Aniline Blue 0.1 g
Final pH: 7,4 ± .2
Preparation:
Rosolic Acid
Dissolve 1 gram of rosolic acid in 1OO ml
of 0.2 N sodium hydroxide to make a rosolic
acid solution. Note: The quality of present sup-
plies is quite variable. Performance of new
batches should be compared against previous
batch before it is exhausted.
Autoclaving will decompose rosolic acid
reagent. Stock solutions should be stored in
the dark at 4 C. Discard after 2 weeks or sooner
if the color changes from dark red to muddy
brown. The rosolic acid may be omitted from
testing samples with stressed organisms and
low background count.
M-FC Broth
Add 37 grams of M-FC medium to 1 liter of
laboratory pure water containing 10 ml of the
rosolic acid solution. Heat in a boiling water
bath to dissolve before use. Store the prepared
medium at 4 C in a refrigerator. Discard unused
medium after 96 hours.
M-FC Agar
Prepare by adding 15 grams of agar per
liter of M-FC broth. Heat in boiling water bath
to solution then cool to about 45 C and add to
50 mm diameter glass or plastic petri dishes to
a minimal agar depth of 2-3 mm. Allow to
solidify. Protect the prepared medium from
light. It can be stored at 4 C for up to 2 weeks.
Caution: Do not autoclave M-FC Broth or
Agar.
5-2-2 M-Coliform Broth (BBL 11119) M-
Endo Broth MF (Difco 0749-02)
Use: A selective and differential medium
for enumeration of members of the coliform
group by the membranefiltertechnique.
Composition:
Tryptose or Polypeptone
Thiopeptone or Thiotone
Casitone or Trypticase
Yeast Extract
Lactose
Sodium Chloride
Dipotassium Hydrogen
Phosphate
Potassium Dihydrogen
Phosphate
Sodium Lauryl Sulfate
Sodium Desoxycholate
Sodium Sulfite
Basic Fuchsin
Final pH: 7.2+ .2
10.0
5.0
5.0
1.5
12.5
5.0
g
g
g
g
g
4.375 g
1.375
0.050
0.1
2.1
1.05
Preparation: Add 48 grams of M-Endo
medium to 1 liter of laboratory pure water
containing 20 ml of 95% ethanol. Denatured
alcohol should not be used. Heat in boiling
water bath for solution. Store prepared medium
in the dark at 4 C. Discard the unused medium
after 96 hours.
Prepare M-Endo agar by adding 15 grams
of agar per liter of M-Endo medium. Heat to
boiling, cool to about 45 C and dispense into
glass or plastic petri dishes to provide minimal
agar depth of 2-3 mm and allow to solidify.
Protect prepared medium from light. It can be
stored at 4 C for up to 2 weeks.
EQUIPMENT, TECHNIQUES AND MEDIA
43
image:
5.2.1 M-FC Broth Base (Difco 0883-02)
M-FC Broth (BBL 11364)
Use: Detection and enumeration of fecal
coliform microorganisms by the membrane fil-
ter procedure.
Composition:
Tryptose or Biosate
Peptone 10.0 g
Proteose Peptone No. 3
or Polypeptone 5.0 g
Yeast Extract 3.0 g
Sodium Chloride 5.0 g
Lactose 12.5 g
Bile Salts No. 3 or
Bile Salts Mixture 1.5 g
Aniline Blue 0.1 g
Final pH: 7,4 ± .2
Preparation:
Rosolic Acid
Dissolve 1 gram of rosolic acid in 1OO ml
of 0.2 N sodium hydroxide to make a rosolic
acid solution. Note: The quality of present sup-
plies is quite variable. Performance of new
batches should be compared against previous
batch before it is exhausted.
Autoclaving will decompose rosolic acid
reagent. Stock solutions should be stored in
the dark at 4 C. Discard after 2 weeks or sooner
if the color changes from dark red to muddy
brown. The rosolic acid may be omitted from
testing samples with stressed organisms and
low background count.
M-FC Broth
Add 37 grams of M-FC medium to 1 liter of
laboratory pure water containing 10 ml of the
rosolic acid solution. Heat in a boiling water
bath to dissolve before use. Store the prepared
medium at 4 C in a refrigerator. Discard unused
medium after 96 hours.
M-FC Agar
Prepare by adding 15 grams of agar per
liter of M-FC broth. Heat in boiling water bath
to solution then cool to about 45 C and add to
50 mm diameter glass or plastic petri dishes to
a minimal agar depth of 2-3 mm. Allow to
solidify. Protect the prepared medium from
light. It can be stored at 4 C for up to 2 weeks.
Caution: Do not autoclave M-FC Broth or
Agar.
5-2-2 M-Coliform Broth (BBL 11119) M-
Endo Broth MF (Difco 0749-02)
Use: A selective and differential medium
for enumeration of members of the coliform
group by the membranefiltertechnique.
Composition:
Tryptose or Polypeptone
Thiopeptone or Thiotone
Casitone or Trypticase
Yeast Extract
Lactose
Sodium Chloride
Dipotassium Hydrogen
Phosphate
Potassium Dihydrogen
Phosphate
Sodium Lauryl Sulfate
Sodium Desoxycholate
Sodium Sulfite
Basic Fuchsin
Final pH: 7.2+ .2
10.0
5.0
5.0
1.5
12.5
5.0
g
g
g
g
g
4.375 g
1.375
0.050
0.1
2.1
1.05
Preparation: Add 48 grams of M-Endo
medium to 1 liter of laboratory pure water
containing 20 ml of 95% ethanol. Denatured
alcohol should not be used. Heat in boiling
water bath for solution. Store prepared medium
in the dark at 4 C. Discard the unused medium
after 96 hours.
Prepare M-Endo agar by adding 15 grams
of agar per liter of M-Endo medium. Heat to
boiling, cool to about 45 C and dispense into
glass or plastic petri dishes to provide minimal
agar depth of 2-3 mm and allow to solidify.
Protect prepared medium from light. It can be
stored at 4 C for up to 2 weeks.
EQUIPMENT, TECHNIQUES AND MEDIA
43
image:
 5.2,3 M-Endo Holding Medium
Composition:
Use: Holding Medium in the delayed incu-
bation total eoliform procedure.
Composition:
Same as M-Endo Broth but add 0.384
grams of sodium benzoate per 100 ml.
Preparation:
Prepare M-Endo Broth as described in
5,2.2 and add 3.2 ml of a 12% solution of
sodium benzoate per 100 ml of medium. Add
cycloheximide If needed.
Sodium Benzoate Solution
Final pH: 7.2 ± .2
Dissolve 12 grams of sodium benzoate in
about 85 ml of laboratory pure water, then
bring to 100 ml final volume. Sterilize by auto-
claving or filtration. Discard the solution after
6 months.
Cycloheximide Solution (Optional)
Cycloheximide is used for samples that
have shown problems of overgrowth with
fungi. Prepare an aqueous solution containing
1.25 grams of cycloheximide/100 ml of labora-
tory pure water. Store solution in refrigerator.
Discard and remake after 6 months. Add 4 ml
of the aqueous solution of cycloheximide per
100 ml of M-Endo Holding Medium.
Caution: Cycloheximide is a powerful skin
irritant that should be handled with care. See
Manufacturer's Directions (Actidione, Upjohn,
Kalamazoo, Ml).
5.2.4 M-Endo Agar LES (Difco 0736-02,
BBL11203)
Use: Determination of total conforms us-
ing a two-step membrane filter technique with
lauryl tryptose broth as the preliminary
enrichment.
Yeast Extract 1.2 g
Casitone or Trypticase Peptone 3.7 g
Thiopeptone or Thiotone 3.7 g
Tryptose or Biosate Peptone 7.5 g
Lactose 9.4 g
Dipotassium Hydrogen
Phosphate 3.3 g
Potassium Dihydrogen
Phosphate 1.0
Sodium Chloride 3.7
Sodium Desoxycholate 0.1
Sodium Lauryl Sulfate 0.05
Sodium Sulfite 1.6
Basic Fuchsin 0.8
Agar 14-15.0
Final pH: 7.2 ±.2
Preparation: Add 50 or 51 grams, depend-
ing on manufacturer, of agar per liter of labora-
tory pure water to which has been added 20 ml
of 95% ethanol. Heat in boiling water bath
to dissolve completely. Cool to about 45 C
and dispense into 60 mm glass or plastic petri
dishes to provide a minimal agar depth of 2-3
mm. Allow to solidify. If larger dishes are used,
dispense sufficient agar to give equivalent
depth. Protect prepared medium from light. It
can be stored at 4 C for up to 2 weeks.
Caution: Do not autoclave.
5.2.5 M-Coliform Holding Broth (Difco
0842-02) (LES Holding Medium)
Use: Holding medium in the delayed-
incubation total eoliform procedure.
Composition:
Tryptone or Trypticase
Peptone
M-Endo Broth MF
Dipotassium Hydrogen
Phosphate
Sodium Benzoate
Sulfanilamide
Paraminobenzoic Acid
Cycloheximide
3.0
3.0
3.0 g
1.0 g
1.0 g
1.2 g
0.5 g
44
«-EPA MICROBIOLOGICAL MANUAL 1978
image:
5.2,3 M-Endo Holding Medium
Composition:
Use: Holding Medium in the delayed incu-
bation total eoliform procedure.
Composition:
Same as M-Endo Broth but add 0.384
grams of sodium benzoate per 100 ml.
Preparation:
Prepare M-Endo Broth as described in
5,2.2 and add 3.2 ml of a 12% solution of
sodium benzoate per 100 ml of medium. Add
cycloheximide If needed.
Sodium Benzoate Solution
Final pH: 7.2 ± .2
Dissolve 12 grams of sodium benzoate in
about 85 ml of laboratory pure water, then
bring to 100 ml final volume. Sterilize by auto-
claving or filtration. Discard the solution after
6 months.
Cycloheximide Solution (Optional)
Cycloheximide is used for samples that
have shown problems of overgrowth with
fungi. Prepare an aqueous solution containing
1.25 grams of cycloheximide/100 ml of labora-
tory pure water. Store solution in refrigerator.
Discard and remake after 6 months. Add 4 ml
of the aqueous solution of cycloheximide per
100 ml of M-Endo Holding Medium.
Caution: Cycloheximide is a powerful skin
irritant that should be handled with care. See
Manufacturer's Directions (Actidione, Upjohn,
Kalamazoo, Ml).
5.2.4 M-Endo Agar LES (Difco 0736-02,
BBL11203)
Use: Determination of total conforms us-
ing a two-step membrane filter technique with
lauryl tryptose broth as the preliminary
enrichment.
Yeast Extract 1.2 g
Casitone or Trypticase Peptone 3.7 g
Thiopeptone or Thiotone 3.7 g
Tryptose or Biosate Peptone 7.5 g
Lactose 9.4 g
Dipotassium Hydrogen
Phosphate 3.3 g
Potassium Dihydrogen
Phosphate 1.0
Sodium Chloride 3.7
Sodium Desoxycholate 0.1
Sodium Lauryl Sulfate 0.05
Sodium Sulfite 1.6
Basic Fuchsin 0.8
Agar 14-15.0
Final pH: 7.2 ±.2
Preparation: Add 50 or 51 grams, depend-
ing on manufacturer, of agar per liter of labora-
tory pure water to which has been added 20 ml
of 95% ethanol. Heat in boiling water bath
to dissolve completely. Cool to about 45 C
and dispense into 60 mm glass or plastic petri
dishes to provide a minimal agar depth of 2-3
mm. Allow to solidify. If larger dishes are used,
dispense sufficient agar to give equivalent
depth. Protect prepared medium from light. It
can be stored at 4 C for up to 2 weeks.
Caution: Do not autoclave.
5.2.5 M-Coliform Holding Broth (Difco
0842-02) (LES Holding Medium)
Use: Holding medium in the delayed-
incubation total eoliform procedure.
Composition:
Tryptone or Trypticase
Peptone
M-Endo Broth MF
Dipotassium Hydrogen
Phosphate
Sodium Benzoate
Sulfanilamide
Paraminobenzoic Acid
Cycloheximide
3.0
3.0
3.0 g
1.0 g
1.0 g
1.2 g
0.5 g
44
«-EPA MICROBIOLOGICAL MANUAL 1978
image:
 Final pH: 7.1 ±.2
Preparation: Add 12.7 grams per liter of
laboratory pure water and mix to dissolve. Do
not heat to dissolve medium.
5.2.6 M-VFC Holding Medium (3)
Use: Holding medium in the delayed incu-
bation test for fecal coliform microorganisms.
Composition:
Casitone, Vitamin Free
Sodium Benzoate
Sulfanilamide
Final pH: 6.7 ±.2
0.2
4.0
0.5
Preparation: Add 4.7 grams of medium
per liter of laboratory pure water containing
10 ml of 95% ethanol. Denatured alcohol
should not be used. Heat slightly to dissolve
ingredients, then sterilize by membrane filtra-
tion (0.22 urn). Store prepared medium at 4 C.
Discard after 1 month.
5.3 MPN Media for Coliforms
5.3.1 Lauryl Sulfate Broth (BBL 11338)
Lauryl Tryptose Broth (Difco 0241 -02)
Use: Primary medium for the Presumptive
Test for the tola I coliform group.
Composition:
Tryptose or Trypticase
Peptone
Lactose
Dipotassium Hydrogen
Phosphate
Potassium Dihydrogen
Phosphate
Sodium Chloride
Sodium Lauryl Sulfate
Final pH: 6.8 ±.2
20.0
5.0
9
9
2.75 g
2.75
5.0
0.1
Preparation: Add 35.6 grams of the me-
dium to 1 liter of laboratory pure water and mix
to dissolve. Dispense 10 ml volumes in fer-
mentation tubes (150 x 20 mm tubes contain-
ing 75 x 10 mm tubes) for testing 1 ml or less
of samples. For testing 10ml volumes of sam-
ples, add 71.2 grams of the medium per liter of
laboratory pure water and mix to dissolve. Dis-
pense in 10 ml amounts in fermentation tubes
(1 50 x 25 mm tubes containing 75x10 mm
tubes). Sterilize for 15 minutes at 121 C (15
Ibs. pressure). The concentration of the me-
dium should vary with the size of the sample
according to the table below.
Compensation in Lauryl Tryptose Broth
for Diluting Effects of Samples
LIB Medium
/Tube in ml
10
10
20
Sample Size
/Dilution
in ml
0.1 to 1.0
10
10
Medium
Concen-
tration
1x
2x
1.5x
Dehydrated
LIB in
grams/liter
35.6
71.2
53.4
5.3.2 Brilliant Green Bile 2% (Difco
0007-02) Brilliant Green Bile Broth 2% (BBL
11079)
Use: Recommended for the confirmation
of MPN Presumptive Tests for members of the
coliform group.
Composition:
Peptone
Lactose
Oxgall or Bile
Brilliant Green
Final Ph: 7.2+ .2
10.0
10.0
20.0
0.33
Preparation: Add 40 grams of brilliant
green bile broth to 1 liter of laboratory pure
water. Dispense 10 ml volumes of the broth in
fermentation tubes (1 50 x 20 mm tubes con-
taining 75 x 10 mm tubes). Sterilize for 15
minutes at 121 C(15 Ibs. pressure).
EQUIPMENT, TECHNIQUES AND MEDIA
45
image:
Final pH: 7.1 ±.2
Preparation: Add 12.7 grams per liter of
laboratory pure water and mix to dissolve. Do
not heat to dissolve medium.
5.2.6 M-VFC Holding Medium (3)
Use: Holding medium in the delayed incu-
bation test for fecal coliform microorganisms.
Composition:
Casitone, Vitamin Free
Sodium Benzoate
Sulfanilamide
Final pH: 6.7 ±.2
0.2
4.0
0.5
Preparation: Add 4.7 grams of medium
per liter of laboratory pure water containing
10 ml of 95% ethanol. Denatured alcohol
should not be used. Heat slightly to dissolve
ingredients, then sterilize by membrane filtra-
tion (0.22 urn). Store prepared medium at 4 C.
Discard after 1 month.
5.3 MPN Media for Coliforms
5.3.1 Lauryl Sulfate Broth (BBL 11338)
Lauryl Tryptose Broth (Difco 0241 -02)
Use: Primary medium for the Presumptive
Test for the tola I coliform group.
Composition:
Tryptose or Trypticase
Peptone
Lactose
Dipotassium Hydrogen
Phosphate
Potassium Dihydrogen
Phosphate
Sodium Chloride
Sodium Lauryl Sulfate
Final pH: 6.8 ±.2
20.0
5.0
9
9
2.75 g
2.75
5.0
0.1
Preparation: Add 35.6 grams of the me-
dium to 1 liter of laboratory pure water and mix
to dissolve. Dispense 10 ml volumes in fer-
mentation tubes (150 x 20 mm tubes contain-
ing 75 x 10 mm tubes) for testing 1 ml or less
of samples. For testing 10ml volumes of sam-
ples, add 71.2 grams of the medium per liter of
laboratory pure water and mix to dissolve. Dis-
pense in 10 ml amounts in fermentation tubes
(1 50 x 25 mm tubes containing 75x10 mm
tubes). Sterilize for 15 minutes at 121 C (15
Ibs. pressure). The concentration of the me-
dium should vary with the size of the sample
according to the table below.
Compensation in Lauryl Tryptose Broth
for Diluting Effects of Samples
LIB Medium
/Tube in ml
10
10
20
Sample Size
/Dilution
in ml
0.1 to 1.0
10
10
Medium
Concen-
tration
1x
2x
1.5x
Dehydrated
LIB in
grams/liter
35.6
71.2
53.4
5.3.2 Brilliant Green Bile 2% (Difco
0007-02) Brilliant Green Bile Broth 2% (BBL
11079)
Use: Recommended for the confirmation
of MPN Presumptive Tests for members of the
coliform group.
Composition:
Peptone
Lactose
Oxgall or Bile
Brilliant Green
Final Ph: 7.2+ .2
10.0
10.0
20.0
0.33
Preparation: Add 40 grams of brilliant
green bile broth to 1 liter of laboratory pure
water. Dispense 10 ml volumes of the broth in
fermentation tubes (1 50 x 20 mm tubes con-
taining 75 x 10 mm tubes). Sterilize for 15
minutes at 121 C(15 Ibs. pressure).
EQUIPMENT, TECHNIQUES AND MEDIA
45
image:
 5.3.3 Levine's Eosin Methylene Blue Agar
(Difco 0005-02, BBL 11220)
Use: Isolation of coliform-like colonies as a
preliminary to total coliform Completed Test
Procedure.
Composition:
Peptone
Lactose
Dlpotassium Phosphate
Agar
Eosin Y
Methylene Blue
Final pH: 7.1 ±.2
10.0
10.0
2.0
15.0
0.4
0.065
Preparation: Add 37.5 grams of Levine's
E.M.B. agar to 1 liter of laboratory pure water
and heat in a boiling water bath until dissolved
completely. Dispense into tubes, flasks or bot-
tles and sterilize for 15 minutes at 121 C (15
Ibs. pressure). A flocculant precipitate may
form after autoclaving. Resuspend the precipi-
tate by gently shaking the flask prior to pour-
ing the medium into sterile petri dishes.
5.3.4 EC Medium (Difco 0314-02) EC Broth
(BBL 11187)
Use: Detection and enumeration of fecal
coliform bacteria.
Composition:
Tryptose or Trypticase
Peptone 20.0 g
Lactose 5.0 g
Bile Salts No. 3 or
Bile Salts Mixture 1.5 g
Dlpotassium Phosphate 4.0 g
Monopotassium Phosphate 1.5 g
Sodium Chloride 5.0 g
Final pH: 6.9 ±.2
Preparation: Add 37 grams of EC medium
to 1 liter of laboratory pure water. Dispense
into fermentation tubes (150 X 20 mm tubes
containing 75X10 mm tubes). Sterilize for 15
minutes at 121 C (15 Ibs. pressure).
10.0
10.0
5.0
10.0
20.0
1.0
0.4
0.015
20.0
g
g
g
g
g
g
g
g
g
5.4 Media for Fecal Streptococci
5.4.1 KF Streptococcus Agar (Difco
0496-02) KF Streptococcal Agar (BBL 11313)
Use: Selective cultivation and enumera-
tion of fecal streptococci by direct plating or
the membranefiltertechnique.
Composition:
Proteose Peptone No. 3
or Polypeptone
Yeast Extract
Sodium Chloride
Sodium Glycerophosphate
Maltose
Lactose
Sodium Azide
Brom Cresol Purple
(in Difco medium only)
Agar
Final pH: 7.2 ±.2
Preparation: Add 76.4 grams of the me-
dium per liter of laboratory pure water. Dis-
solve by heating in a boiling water bath with
agitation. Heat in boiling water bath for 5
minutes after solution is complete. Caution: Do
not autoclave. Cool to 60 C and add 1 ml of a
filter-sterilized 1 % aqueous solution of 2, 3, 5-
triphenyl tetrazolium chloride per 100 ml of
agar. If necessary, adjust pH to 7.2 with 10%
Na2CO3. Do not hold the completed medium
(with indicator) at 44-46 C for more than 4
hours before use. Store prepared medium
(without indicator) in the dark for up to 30 days
at 4 C. TTC solution is light-sensitive. It should
be stored in the refrigerator and protected
from light.
5.4.2 Azide Dextrose Broth (Difco 0837-02,
BBL 11000)
Use: Primary inoculation medium for Fecal
Streptococci Presumptive Test.
Composition:
Beef Extract
Tryptose or Polypeptone
4.5 g
15.0 g
46
S»EB\ MICROBIOLOGICAL MANUAL 1978
image:
5.3.3 Levine's Eosin Methylene Blue Agar
(Difco 0005-02, BBL 11220)
Use: Isolation of coliform-like colonies as a
preliminary to total coliform Completed Test
Procedure.
Composition:
Peptone
Lactose
Dlpotassium Phosphate
Agar
Eosin Y
Methylene Blue
Final pH: 7.1 ±.2
10.0
10.0
2.0
15.0
0.4
0.065
Preparation: Add 37.5 grams of Levine's
E.M.B. agar to 1 liter of laboratory pure water
and heat in a boiling water bath until dissolved
completely. Dispense into tubes, flasks or bot-
tles and sterilize for 15 minutes at 121 C (15
Ibs. pressure). A flocculant precipitate may
form after autoclaving. Resuspend the precipi-
tate by gently shaking the flask prior to pour-
ing the medium into sterile petri dishes.
5.3.4 EC Medium (Difco 0314-02) EC Broth
(BBL 11187)
Use: Detection and enumeration of fecal
coliform bacteria.
Composition:
Tryptose or Trypticase
Peptone 20.0 g
Lactose 5.0 g
Bile Salts No. 3 or
Bile Salts Mixture 1.5 g
Dlpotassium Phosphate 4.0 g
Monopotassium Phosphate 1.5 g
Sodium Chloride 5.0 g
Final pH: 6.9 ±.2
Preparation: Add 37 grams of EC medium
to 1 liter of laboratory pure water. Dispense
into fermentation tubes (150 X 20 mm tubes
containing 75X10 mm tubes). Sterilize for 15
minutes at 121 C (15 Ibs. pressure).
10.0
10.0
5.0
10.0
20.0
1.0
0.4
0.015
20.0
g
g
g
g
g
g
g
g
g
5.4 Media for Fecal Streptococci
5.4.1 KF Streptococcus Agar (Difco
0496-02) KF Streptococcal Agar (BBL 11313)
Use: Selective cultivation and enumera-
tion of fecal streptococci by direct plating or
the membranefiltertechnique.
Composition:
Proteose Peptone No. 3
or Polypeptone
Yeast Extract
Sodium Chloride
Sodium Glycerophosphate
Maltose
Lactose
Sodium Azide
Brom Cresol Purple
(in Difco medium only)
Agar
Final pH: 7.2 ±.2
Preparation: Add 76.4 grams of the me-
dium per liter of laboratory pure water. Dis-
solve by heating in a boiling water bath with
agitation. Heat in boiling water bath for 5
minutes after solution is complete. Caution: Do
not autoclave. Cool to 60 C and add 1 ml of a
filter-sterilized 1 % aqueous solution of 2, 3, 5-
triphenyl tetrazolium chloride per 100 ml of
agar. If necessary, adjust pH to 7.2 with 10%
Na2CO3. Do not hold the completed medium
(with indicator) at 44-46 C for more than 4
hours before use. Store prepared medium
(without indicator) in the dark for up to 30 days
at 4 C. TTC solution is light-sensitive. It should
be stored in the refrigerator and protected
from light.
5.4.2 Azide Dextrose Broth (Difco 0837-02,
BBL 11000)
Use: Primary inoculation medium for Fecal
Streptococci Presumptive Test.
Composition:
Beef Extract
Tryptose or Polypeptone
4.5 g
15.0 g
46
S»EB\ MICROBIOLOGICAL MANUAL 1978
image:
 7.5
7.5
0.2
Dextrose
Sodium Chloride
Sodium Azide
Final pH: 7.2+ .2
Preparation; Add 34.7 grams of azide dex-
trose broth to 1 liter of laboratory pure water.
Dissolve and dispense into tubes without inner
vials. Note: Azide dextrose broth should be
Ibs.
sterilized at 1 18 C for
Prepare the
15
minutes (1 2
multiple
pressure). Prepare the medium in
strength for larger inocula to preserve the cor-
rect concentration of ingredients. For exam-
ple, if 10 ml of inoculum is to be added to 10
ml of medium, the medium should be prepared
double strength.
5.4.3 Ethyl Violet Azide Broth (BBL 11 226)
EVA Broth (Difco 0606-02)
Use: Confirmed
streptococci.
Composition:
Tryptose or Biosate Peptone
Dextrose
Dipotassium Phosphate
Monopotassium Phosphate
Sodium Chloride
Sodium Azide
Ethyl Violet
Final pH: 7.0+ .2
Test for fecal
20.0
5.0
2.7
2.7
5.0
0.4
9
g
g
g
g
g
0.83 mg
Preparation: Add 35.8 grams of the me-
dium to 1 liter of laboratory pure water. Dis-
solve and dispense in 10 ml amounts into
tubes. Sterilize for 15 minutes at 121 C(15 Ibs.
pressure).
5.4.4 PSE Agar (Pfizer Selective Entero-
coccus Agar) 224B, formerly from Pfizer Diag-
nostics Division. Now available from Grand
Island Biological Company (GIBCO), 3175 Sta-
ley Road, Grand Island, NY 14072.
Use: Isolation of fecal streptococci.
Composition:
Pfizer Peptone C
Pfizer Peptone B
Pfizer Yeast Extract
Pfizer Bile
Sodium Chloride
Esculin
Sodium Citrate
Ferric Ammonium Citrate
Sodium Azide
Agar
Final pH: 7.1 +.2
17.0
3.0
5.0
10.0
5.2
1.0
1.0
0.5
0.25
15.0
Preparation: Add 58 grams of PSE agar to
1 liter of laboratory pure water. Heat in a boil-
ing water bath to complete solution. Dispense
into tubes or flasks and sterilize for 15 minutes
at 121 C (15 Ibs. pressure).
5.4.5 Brain Heart Infusion Broth (BHI)
(Difco 0037-02, BBL 1 1058)
Use: For separation of enterococcus group
organisms from S. bovis and S. equinus by
testing for growth at 10 C and 45 C. For
general cultivation of fastidious micro^
organisms.
Composition:
Calf Brain Infusion
Beef Heart Infusion
Peptone
Sodium Chloride
Disodium Phosphate
Dextrose
Final pH: 7.4+ .2
200.0
250.0
10.0
5.0
2.5
2.0
Preparation: Dissolve 37 grams of brain
heart infusion broth in 1 liter of laboratory pure
water. Dispense in 8-10 ml volumes in screw-
cap tubes and sterilize for 1 5 minutes at 1 21 C
(15 Ibs. pressure). If the medium is not used the
same day as prepared and sterilized, heat at
100 C for several minutes to remove absorbed
oxygen, and cool quickly without agitation,
justpriorto inoculation.
5.4.6 Brain Heart Infusion Agar (Difco
0418-02, BBL 11064)
EQUIPMENT, TECHNIQUES AND MEDIA
47
image:
7.5
7.5
0.2
Dextrose
Sodium Chloride
Sodium Azide
Final pH: 7.2+ .2
Preparation; Add 34.7 grams of azide dex-
trose broth to 1 liter of laboratory pure water.
Dissolve and dispense into tubes without inner
vials. Note: Azide dextrose broth should be
Ibs.
sterilized at 1 18 C for
Prepare the
15
minutes (1 2
multiple
pressure). Prepare the medium in
strength for larger inocula to preserve the cor-
rect concentration of ingredients. For exam-
ple, if 10 ml of inoculum is to be added to 10
ml of medium, the medium should be prepared
double strength.
5.4.3 Ethyl Violet Azide Broth (BBL 11 226)
EVA Broth (Difco 0606-02)
Use: Confirmed
streptococci.
Composition:
Tryptose or Biosate Peptone
Dextrose
Dipotassium Phosphate
Monopotassium Phosphate
Sodium Chloride
Sodium Azide
Ethyl Violet
Final pH: 7.0+ .2
Test for fecal
20.0
5.0
2.7
2.7
5.0
0.4
9
g
g
g
g
g
0.83 mg
Preparation: Add 35.8 grams of the me-
dium to 1 liter of laboratory pure water. Dis-
solve and dispense in 10 ml amounts into
tubes. Sterilize for 15 minutes at 121 C(15 Ibs.
pressure).
5.4.4 PSE Agar (Pfizer Selective Entero-
coccus Agar) 224B, formerly from Pfizer Diag-
nostics Division. Now available from Grand
Island Biological Company (GIBCO), 3175 Sta-
ley Road, Grand Island, NY 14072.
Use: Isolation of fecal streptococci.
Composition:
Pfizer Peptone C
Pfizer Peptone B
Pfizer Yeast Extract
Pfizer Bile
Sodium Chloride
Esculin
Sodium Citrate
Ferric Ammonium Citrate
Sodium Azide
Agar
Final pH: 7.1 +.2
17.0
3.0
5.0
10.0
5.2
1.0
1.0
0.5
0.25
15.0
Preparation: Add 58 grams of PSE agar to
1 liter of laboratory pure water. Heat in a boil-
ing water bath to complete solution. Dispense
into tubes or flasks and sterilize for 15 minutes
at 121 C (15 Ibs. pressure).
5.4.5 Brain Heart Infusion Broth (BHI)
(Difco 0037-02, BBL 1 1058)
Use: For separation of enterococcus group
organisms from S. bovis and S. equinus by
testing for growth at 10 C and 45 C. For
general cultivation of fastidious micro^
organisms.
Composition:
Calf Brain Infusion
Beef Heart Infusion
Peptone
Sodium Chloride
Disodium Phosphate
Dextrose
Final pH: 7.4+ .2
200.0
250.0
10.0
5.0
2.5
2.0
Preparation: Dissolve 37 grams of brain
heart infusion broth in 1 liter of laboratory pure
water. Dispense in 8-10 ml volumes in screw-
cap tubes and sterilize for 1 5 minutes at 1 21 C
(15 Ibs. pressure). If the medium is not used the
same day as prepared and sterilized, heat at
100 C for several minutes to remove absorbed
oxygen, and cool quickly without agitation,
justpriorto inoculation.
5.4.6 Brain Heart Infusion Agar (Difco
0418-02, BBL 11064)
EQUIPMENT, TECHNIQUES AND MEDIA
47
image:
 Use: Cultivation of streptococci isolates or
other fastidious bacteria.
Composition: Brain heart infusion agar
contains the same components as BHI broth
(see 5.4.5 above) with the addition of 15.0
grams agar.
Preparation: Heat in boiling water bath
until dissolved. Dispense 10-12 ml of medium
in screw-cap test tubes and slant after steriliza-
tion. Sterilize for 15 minutes at 121 C{15 Ibs.
pressure).
Final pH:7.4 ±.2
5.4.7 Brain Heart Infusion (BHI) Broth with
6.5% NaCI
Use: Identification of fecal streptococci.
Composition: Brain heart infusion broth
with 6.5% NaCI is the same as BHI broth in
5.4.5 above with addition of 60.0 grams NaCI
per liter of medium.
Since most commercially available dehy-
drated media already contain sodium chloride,
this amount is taken into consideration for
determining the final NaCI percentage above.
5.4.8 Brain Heart Infusion Broth (BHI), pH
9.6
Use: Identification of fecal streptococci.
Composition: Same as for BHI broth above
in 5.4.5 with addition of sterile 38% sodium
phosphate solution (Na3P04«12 H20) to
produce a final pH of 9.6.
5.4.9 Brain Heart Infusion Broth with 40%
Bile
Use: Verification of fecal streptococci.
Composition: Same as for BHI broth above
in 5.4.5 with addition of 40 ml of sterile 10%
oxgall to 60 ml of basic medium or 668 ml to
each liter of medium.
Final pH: 7.4 ± ,2
Preparation of Medium: Add 37 grams of
BHI broth to 1 liter of laboratory pure water
and heat gently with agitation to dissolve. Dis-
pense 60 ml amounts of the medium into
screw-cap flasks. Sterilize for 15 minutes at
121 C (15 Ibs. pressure).
Preparation of 10% oxgall: Add 10 grams
of oxgall per 100 ml of laboratory pure water.
After dissolving and mixing, filter-sterilize the
solution.
Preparation of Final Medium: Cool the BHI
broth and add 40 ml of the sterile 10% oxgall
solution to each 60 ml of sterile, cool BHI
broth, resulting in a 40% bile concentration.
Dispense as needed aseptically in 10 ml vol-
umes into sterile culture tubes.
5.4.10 Starch Agar
(Medium may not be commercially
available).
Use: Starch hydrolysis tests for separation
and confirmation of fecal streptoccal species.
Composition:
Peptone
Yeast Extract
Sodium Chloride
Starch (Soluble)
Agar
Final pH: 6.8 ±.2
10.0
5.0
5.0
2.0
15.0
Preparation: Add 37 grams of starch agar
in 1 liter of cold laboratory pure water. Heat to
boiling to dissolve and dispense into tubes,
flasks or bottles. Sterilize for 15 minutes at
121 C (15 Ibs. pressure). Cool medium after
sterilization and pour into petri dishes. Allow to
solidify.
5.4.11 Starch Liquid Medium
(Medium may not be commercially
available).
Use: Starch hydrolysis for speciation of
fecal streptococci.
48
MICROBIOLOGICAL MANUAL 1978
image:
Use: Cultivation of streptococci isolates or
other fastidious bacteria.
Composition: Brain heart infusion agar
contains the same components as BHI broth
(see 5.4.5 above) with the addition of 15.0
grams agar.
Preparation: Heat in boiling water bath
until dissolved. Dispense 10-12 ml of medium
in screw-cap test tubes and slant after steriliza-
tion. Sterilize for 15 minutes at 121 C{15 Ibs.
pressure).
Final pH:7.4 ±.2
5.4.7 Brain Heart Infusion (BHI) Broth with
6.5% NaCI
Use: Identification of fecal streptococci.
Composition: Brain heart infusion broth
with 6.5% NaCI is the same as BHI broth in
5.4.5 above with addition of 60.0 grams NaCI
per liter of medium.
Since most commercially available dehy-
drated media already contain sodium chloride,
this amount is taken into consideration for
determining the final NaCI percentage above.
5.4.8 Brain Heart Infusion Broth (BHI), pH
9.6
Use: Identification of fecal streptococci.
Composition: Same as for BHI broth above
in 5.4.5 with addition of sterile 38% sodium
phosphate solution (Na3P04«12 H20) to
produce a final pH of 9.6.
5.4.9 Brain Heart Infusion Broth with 40%
Bile
Use: Verification of fecal streptococci.
Composition: Same as for BHI broth above
in 5.4.5 with addition of 40 ml of sterile 10%
oxgall to 60 ml of basic medium or 668 ml to
each liter of medium.
Final pH: 7.4 ± ,2
Preparation of Medium: Add 37 grams of
BHI broth to 1 liter of laboratory pure water
and heat gently with agitation to dissolve. Dis-
pense 60 ml amounts of the medium into
screw-cap flasks. Sterilize for 15 minutes at
121 C (15 Ibs. pressure).
Preparation of 10% oxgall: Add 10 grams
of oxgall per 100 ml of laboratory pure water.
After dissolving and mixing, filter-sterilize the
solution.
Preparation of Final Medium: Cool the BHI
broth and add 40 ml of the sterile 10% oxgall
solution to each 60 ml of sterile, cool BHI
broth, resulting in a 40% bile concentration.
Dispense as needed aseptically in 10 ml vol-
umes into sterile culture tubes.
5.4.10 Starch Agar
(Medium may not be commercially
available).
Use: Starch hydrolysis tests for separation
and confirmation of fecal streptoccal species.
Composition:
Peptone
Yeast Extract
Sodium Chloride
Starch (Soluble)
Agar
Final pH: 6.8 ±.2
10.0
5.0
5.0
2.0
15.0
Preparation: Add 37 grams of starch agar
in 1 liter of cold laboratory pure water. Heat to
boiling to dissolve and dispense into tubes,
flasks or bottles. Sterilize for 15 minutes at
121 C (15 Ibs. pressure). Cool medium after
sterilization and pour into petri dishes. Allow to
solidify.
5.4.11 Starch Liquid Medium
(Medium may not be commercially
available).
Use: Starch hydrolysis for speciation of
fecal streptococci.
48
MICROBIOLOGICAL MANUAL 1978
image:
 Composition:
Tryptone or Trypticase
Peptone
Yeast Extract
Dipotassium Phosphate
Glucose
Starch (Soluble)
Final pH: 6.8 ±.2
10.0
3.0
2.0
0.5
5.0
Preparation: Add 30.5 grams of dry ingre-
dients to 1 liter of laboratory pure water and
heat to boiling. Dispense into tubes and steril-
ize for 15 minutes at 121 C (15 Ibs. pressure).
5.4.12 Nutrient Gelatin (BBL 11481, Difco
0011 -02)
Use: Detection of gelatin liquefaction for
identification of the fecal streptococci and
other microorganisms.
Composition:
Peptone
Beef Extract
Gelatin
Final pH: 6.8 + .2
5.0 g
3.0 g
120.0 g
Preparation: Add 128 grams of nutrient
gelatin to 1 liter of cold laboratory pure water
and warm to about 50 C to dissolve the me-
dium. Dispense 5 ml in screw-cap test tubes
and sterilize for 15 minutes at 121 C (15 Ibs.
pressure). Store tubes in refrigerator until use.
5-4.13 L'tmus Milk (Difco 0107-02, BBL
11343}
Use: To separate and identify fecal strep-
tococci and generally to determine the action
of bacteria on milk.
Composition:
Skim Milk
Litmus
Final pH: 6.8 ± .2
100.0
0.75
Preparation: Add 100 grams of litmus milk
to 1 liter of laboratory pure water and warm to
about 50 C to dissolve the medium. Dispense
10 ml volumes into screw-cap tubes and steril-
ize for 20 minutes at 115 C (10 Ibs. pressure).
Do not overheat. Control pressure and time
carefully since overheating or prolonged heat-
ing during sterilization can caramelize the milk
sugar.
5.4.14 Skim Milk with 0.1% Methylene
Blue
Use: Identification of fecal streptococci by
reduction of methylene blue.
Composition:
Skim Milk Powder
Methylene Blue Powder
Final pH: 6.4+ .2
100.0g
1.0g
Preparation: Add 100 grams of skim milk
powder and 1 gram of methylene blue to 1 liter
of distilled water, and warm to 50 C to dissolve
the medium. Dispense 10 ml volumes into
screw-cap tubes and sterilize for 20 minutes
at 115 C (10 Ibs. pressure). Do not overheat.
Prolonged heating or overheating during sterili-
zation results in caramelization of the milk
sugar.
5.4.15 Brain Heart Infusion Agar with
0.04% Potassium Tellurite
Use: Identification of fecal streptococci by
tellurite reduction.
Composition:
Calf Brain Infusion
Beef Heart Infusion
Proteose Peptone
Dextrose
Sodium Chloride
Disodium Phosphate
Agar
Final pH: 7,4 ±.2
200.0
250.0
10.0
2.0
5.0
2.5
15.0
EQUIPMENT, TECHNIQUES AND MEDIA
49
image:
Composition:
Tryptone or Trypticase
Peptone
Yeast Extract
Dipotassium Phosphate
Glucose
Starch (Soluble)
Final pH: 6.8 ±.2
10.0
3.0
2.0
0.5
5.0
Preparation: Add 30.5 grams of dry ingre-
dients to 1 liter of laboratory pure water and
heat to boiling. Dispense into tubes and steril-
ize for 15 minutes at 121 C (15 Ibs. pressure).
5.4.12 Nutrient Gelatin (BBL 11481, Difco
0011 -02)
Use: Detection of gelatin liquefaction for
identification of the fecal streptococci and
other microorganisms.
Composition:
Peptone
Beef Extract
Gelatin
Final pH: 6.8 + .2
5.0 g
3.0 g
120.0 g
Preparation: Add 128 grams of nutrient
gelatin to 1 liter of cold laboratory pure water
and warm to about 50 C to dissolve the me-
dium. Dispense 5 ml in screw-cap test tubes
and sterilize for 15 minutes at 121 C (15 Ibs.
pressure). Store tubes in refrigerator until use.
5-4.13 L'tmus Milk (Difco 0107-02, BBL
11343}
Use: To separate and identify fecal strep-
tococci and generally to determine the action
of bacteria on milk.
Composition:
Skim Milk
Litmus
Final pH: 6.8 ± .2
100.0
0.75
Preparation: Add 100 grams of litmus milk
to 1 liter of laboratory pure water and warm to
about 50 C to dissolve the medium. Dispense
10 ml volumes into screw-cap tubes and steril-
ize for 20 minutes at 115 C (10 Ibs. pressure).
Do not overheat. Control pressure and time
carefully since overheating or prolonged heat-
ing during sterilization can caramelize the milk
sugar.
5.4.14 Skim Milk with 0.1% Methylene
Blue
Use: Identification of fecal streptococci by
reduction of methylene blue.
Composition:
Skim Milk Powder
Methylene Blue Powder
Final pH: 6.4+ .2
100.0g
1.0g
Preparation: Add 100 grams of skim milk
powder and 1 gram of methylene blue to 1 liter
of distilled water, and warm to 50 C to dissolve
the medium. Dispense 10 ml volumes into
screw-cap tubes and sterilize for 20 minutes
at 115 C (10 Ibs. pressure). Do not overheat.
Prolonged heating or overheating during sterili-
zation results in caramelization of the milk
sugar.
5.4.15 Brain Heart Infusion Agar with
0.04% Potassium Tellurite
Use: Identification of fecal streptococci by
tellurite reduction.
Composition:
Calf Brain Infusion
Beef Heart Infusion
Proteose Peptone
Dextrose
Sodium Chloride
Disodium Phosphate
Agar
Final pH: 7,4 ±.2
200.0
250.0
10.0
2.0
5.0
2.5
15.0
EQUIPMENT, TECHNIQUES AND MEDIA
49
image:
 Preparation: Add 52 grams of brain heart
infusion agar to 1 liter of cold laboratory pure
water. Heat in a boiling water bath to dissolve
the agar and dispense 100 ml volumes in
screw-cap flasks and sterilize for 15 minutes at
121 C{15 Ibs. pressure). Cool to 50 C and add
1 ml of sterile warm (50 C) 4% potassium
tellurite to each 100 ml flask of brain heart
infusion agar. This should produce a final po-
tassium tellurite concentration of 0.04%. Dis-
pense melted sterile medium into sterile petri
dishes.
5.4.16 Blood Agar with 0.04% Potassium
Tellurite
Use: Identification of fecal streptococci by
tellurite reduction.
Composition:
Evans Peptone 10.0 g
Sodium Chloride 5.0 g
Meat Extract (Lab Lemco) 10.0 g
Yeast Extract 3.0 g
Agar 15.0 g
Final pH: 7.2 ±.2
Preparation: Add 43 grams of blood agar
base to 1 liter of laboratory pure water. Heat
in a boiling water bath to dissolve the agar and
dispense 100 ml volumes in screw-cap flasks,
sterilize for 15 minutes at 121 C (15 Ibs. pres-
sure) and cool to 44-46 C. Aseptically add 10%
sterile defibrinated horse blood to the medium.
The mixture is heated at 70 C for 10 minutes,
then cooled to 45 C, A filter-sterilized 4.0%
solution of potassium tellurite is added asep-
tically to give a final concentration of 0.04%.
Dispense the completed medium into petri
dishes,
5-4.17 Tetrazolium Glucose (TG) Agar or
2, 3, Sjrriphenyl Tetrazolium Chloride (TTC
Agar) (Medium may not be commercially
available).
Use: Identification of fecal streptococci by
tetrazolium reduction.
Composition:
Peptone
Beef Extract
Sodium Chloride
Agar
Final pH: 7.0-7.3
5.0 g
14.0 g
Preparation of 50% Glucose Solution:
Weigh out 50 grams of reagent grade glucose.
Add to 50 ml laboratory pure water in a 100 ml
volumetric flask. Dissolve glucose and bring
up to volume. Filter-sterilize solution and store
in a screw-cap flask.
Preparation of 1% TTC Solution: Weigh
out 1 gram of 2, 3, 5 triphenyl tetrazolium
chloride. Add to 50 ml laboratory pure water in
a 100 ml volumetric flask. Dissolve and bring
up to volume. Filter-sterilize solution and store
in a screw-cap flask.
Preparation of Final Medium: Add 39
grams of TG agar to 1 liter of cold laboratory
pure water and heat in a boiling water bath to
dissolve the agar. Sterilize for 15 minutes at
121 C (15 Ibs. pressure) and cool to about 50
C. To 970 ml of liquid TG agar, aseptically add
20 ml of 50% glucose solution and 10 ml of
1 % TTC solution. Mix well and pour into sterile
petri dishes.
5.4.18 Blood Agar Base (Optional - 10%
• Blood) (Difco 0045-02, BBL 11036)
Use: Identification of hemolytic properties
of fecal streptococci.
Composition:
BBL 11036
10.0
10.0
Beef Heart Infusion
Tryptose or Thiotone
(Peptone)
Sodium Chloride
Agar
Difco 0045-02
Beef Heart Infusion
Tryptose or Thiotone
(Peptone)
Sodium Chloride
Agar
Final pH: 7.4 ± .2
375.0 g
10.0
5.0
15.0
500.0 g
10.0
5.0
15.0
50
•SERA MICROBIOLOGICAL MANUAL 1978
image:
Preparation: Add 52 grams of brain heart
infusion agar to 1 liter of cold laboratory pure
water. Heat in a boiling water bath to dissolve
the agar and dispense 100 ml volumes in
screw-cap flasks and sterilize for 15 minutes at
121 C{15 Ibs. pressure). Cool to 50 C and add
1 ml of sterile warm (50 C) 4% potassium
tellurite to each 100 ml flask of brain heart
infusion agar. This should produce a final po-
tassium tellurite concentration of 0.04%. Dis-
pense melted sterile medium into sterile petri
dishes.
5.4.16 Blood Agar with 0.04% Potassium
Tellurite
Use: Identification of fecal streptococci by
tellurite reduction.
Composition:
Evans Peptone 10.0 g
Sodium Chloride 5.0 g
Meat Extract (Lab Lemco) 10.0 g
Yeast Extract 3.0 g
Agar 15.0 g
Final pH: 7.2 ±.2
Preparation: Add 43 grams of blood agar
base to 1 liter of laboratory pure water. Heat
in a boiling water bath to dissolve the agar and
dispense 100 ml volumes in screw-cap flasks,
sterilize for 15 minutes at 121 C (15 Ibs. pres-
sure) and cool to 44-46 C. Aseptically add 10%
sterile defibrinated horse blood to the medium.
The mixture is heated at 70 C for 10 minutes,
then cooled to 45 C, A filter-sterilized 4.0%
solution of potassium tellurite is added asep-
tically to give a final concentration of 0.04%.
Dispense the completed medium into petri
dishes,
5-4.17 Tetrazolium Glucose (TG) Agar or
2, 3, Sjrriphenyl Tetrazolium Chloride (TTC
Agar) (Medium may not be commercially
available).
Use: Identification of fecal streptococci by
tetrazolium reduction.
Composition:
Peptone
Beef Extract
Sodium Chloride
Agar
Final pH: 7.0-7.3
5.0 g
14.0 g
Preparation of 50% Glucose Solution:
Weigh out 50 grams of reagent grade glucose.
Add to 50 ml laboratory pure water in a 100 ml
volumetric flask. Dissolve glucose and bring
up to volume. Filter-sterilize solution and store
in a screw-cap flask.
Preparation of 1% TTC Solution: Weigh
out 1 gram of 2, 3, 5 triphenyl tetrazolium
chloride. Add to 50 ml laboratory pure water in
a 100 ml volumetric flask. Dissolve and bring
up to volume. Filter-sterilize solution and store
in a screw-cap flask.
Preparation of Final Medium: Add 39
grams of TG agar to 1 liter of cold laboratory
pure water and heat in a boiling water bath to
dissolve the agar. Sterilize for 15 minutes at
121 C (15 Ibs. pressure) and cool to about 50
C. To 970 ml of liquid TG agar, aseptically add
20 ml of 50% glucose solution and 10 ml of
1 % TTC solution. Mix well and pour into sterile
petri dishes.
5.4.18 Blood Agar Base (Optional - 10%
• Blood) (Difco 0045-02, BBL 11036)
Use: Identification of hemolytic properties
of fecal streptococci.
Composition:
BBL 11036
10.0
10.0
Beef Heart Infusion
Tryptose or Thiotone
(Peptone)
Sodium Chloride
Agar
Difco 0045-02
Beef Heart Infusion
Tryptose or Thiotone
(Peptone)
Sodium Chloride
Agar
Final pH: 7.4 ± .2
375.0 g
10.0
5.0
15.0
500.0 g
10.0
5.0
15.0
50
•SERA MICROBIOLOGICAL MANUAL 1978
image:
 Preparation: Add 40 grams of blood agar
base to 1 liter of cold laboratory pure water.
Heat in a boiling water bath to dissolve the
agar. Dispense in 90 ml volumes into screw-
cap flask. Sterilize for 15 minutes at 121 C (15
Ibs. pressure). Store at 4 C for later use. When
ready to use, heat/cool the blood agar base to
45-50 C and add 10% by volume of fresh
sterile defibrinated horse blood. Mix and pour
into sterile petri dishes.
5.5 Media for Salmonella
5.5.1 Selenite F Broth (BBL 11607, Difco
0275-02)
Use: Primary enrichment of salmonellae.
Composition:
Tryptone or Polypeptone 5.0 g
Lactose 4.0 g
Disodium Hydrogen Phosphate 10.0 g
Sodium Selenite 4.0 g
Final pH:7.0±.2
Preparation: Add 23 grams of selenite
broth to 1 liter of laboratory pure water. Mix
and warm gently until dissolved. Dispense in
tubes to a depth of 6 cm and expose to flowing
steam for 15 minutes. Avoid excessive heat-
ing. Do not autoclave. Sterilization is unneces-
sary if broth is used immediately.
5.5.2 Tetrathionate Broth Base (Difco
0104-02, BBL 11706)
Use: Primary enrichment of salmonellae.
Composition:
Proteose Peptone or
Polypeptone
Bile Salts
Calcium Carbonate
Sodium Thiosulfate
Final pH: 7.8 ± .2
5.0 g
1.0 g
10.0 g
30.0 g
Preparation: Add 46 grams of tetrathion-
ate broth base to 1 liter of laboratory pure
water and heat to boiling. Cool to less than 45
C and add 20 ml of iodine solution." Mix and
dispense in 10 ml volumes into screw-cap
tubes. Do not heat after the addition of the
iodine. Do not autoclave. The tetrathionate
broth base without iodine may be stored for
later use. The complete medium (with iodine)
should be used on the day it is prepared.
"The iodine-iodide solution is prepared by dis-
solving 6 grams iodine crystals and 5 grams
potassium iodide in 20 ml of distilled water.
5.5.3 Dulcitol Selenite Broth
(Medium may not be commercially
available).
Use: Primary enrichment of salmonellae.
Composition:
Proteose Peptone
Yeast Extract
Dulcitol
Sodium Selenite
Disodium Hydrogen
Phosphate
Potassium Dihydrogen
Phosphate
Final pH: 6.9 ±.2
4.0
1.5
4.0
5.0
9
g
g
g
1.25 g
1.25 g
Preparation: Add 16.5 grams of dulcitol
selenite broth to 1 liter of laboratory pure
water and heat carefully to dissolve ingredi-
ents. Do not boH. The prepared medium should
be buff-colored. Dispense into screw-cap
tubes to a depth of 6 cm. Do not autoclave.
5.5.4 Tetrathionate Brilliant Green Broth
Use: Primary enrichment for salmonellae.
Composition: Same as tetrathionate broth
base (5.5.2) with addition of 0.01 gram of
brilliant green per liter.
EQUIPMENT, TECHNIQUES AND MEDIA
51
image:
Preparation: Add 40 grams of blood agar
base to 1 liter of cold laboratory pure water.
Heat in a boiling water bath to dissolve the
agar. Dispense in 90 ml volumes into screw-
cap flask. Sterilize for 15 minutes at 121 C (15
Ibs. pressure). Store at 4 C for later use. When
ready to use, heat/cool the blood agar base to
45-50 C and add 10% by volume of fresh
sterile defibrinated horse blood. Mix and pour
into sterile petri dishes.
5.5 Media for Salmonella
5.5.1 Selenite F Broth (BBL 11607, Difco
0275-02)
Use: Primary enrichment of salmonellae.
Composition:
Tryptone or Polypeptone 5.0 g
Lactose 4.0 g
Disodium Hydrogen Phosphate 10.0 g
Sodium Selenite 4.0 g
Final pH:7.0±.2
Preparation: Add 23 grams of selenite
broth to 1 liter of laboratory pure water. Mix
and warm gently until dissolved. Dispense in
tubes to a depth of 6 cm and expose to flowing
steam for 15 minutes. Avoid excessive heat-
ing. Do not autoclave. Sterilization is unneces-
sary if broth is used immediately.
5.5.2 Tetrathionate Broth Base (Difco
0104-02, BBL 11706)
Use: Primary enrichment of salmonellae.
Composition:
Proteose Peptone or
Polypeptone
Bile Salts
Calcium Carbonate
Sodium Thiosulfate
Final pH: 7.8 ± .2
5.0 g
1.0 g
10.0 g
30.0 g
Preparation: Add 46 grams of tetrathion-
ate broth base to 1 liter of laboratory pure
water and heat to boiling. Cool to less than 45
C and add 20 ml of iodine solution." Mix and
dispense in 10 ml volumes into screw-cap
tubes. Do not heat after the addition of the
iodine. Do not autoclave. The tetrathionate
broth base without iodine may be stored for
later use. The complete medium (with iodine)
should be used on the day it is prepared.
"The iodine-iodide solution is prepared by dis-
solving 6 grams iodine crystals and 5 grams
potassium iodide in 20 ml of distilled water.
5.5.3 Dulcitol Selenite Broth
(Medium may not be commercially
available).
Use: Primary enrichment of salmonellae.
Composition:
Proteose Peptone
Yeast Extract
Dulcitol
Sodium Selenite
Disodium Hydrogen
Phosphate
Potassium Dihydrogen
Phosphate
Final pH: 6.9 ±.2
4.0
1.5
4.0
5.0
9
g
g
g
1.25 g
1.25 g
Preparation: Add 16.5 grams of dulcitol
selenite broth to 1 liter of laboratory pure
water and heat carefully to dissolve ingredi-
ents. Do not boH. The prepared medium should
be buff-colored. Dispense into screw-cap
tubes to a depth of 6 cm. Do not autoclave.
5.5.4 Tetrathionate Brilliant Green Broth
Use: Primary enrichment for salmonellae.
Composition: Same as tetrathionate broth
base (5.5.2) with addition of 0.01 gram of
brilliant green per liter.
EQUIPMENT, TECHNIQUES AND MEDIA
51
image:
 5.5.5 Brilliant Green Agar (BBL 11072,
Difco 0285-02)
Use: As a primary plating medium for the
isolation of salmonellae.
Phenol Red
Agar
Final pH: 7.4 ±.2
0.08
15.0
Composition:
Yeast Extract
Polypeptone or Proteose
Peptone
Sodium Chloride
Lactose
Saccharose (Sucrose)
Phenol Red
Brilliant Green
Agar
Final pH: 6.9 ±.2
3.0
10.0
5.0
10.0
10.0
0.08
0.0125
20.0
Preparation: Add 58 grams of brilliant
green agar to 1 liter of cold laboratory pure
water and heat to boiling. Dispense in screw-
cap flasks and sterilize for 15 minutes at 121 C
(15 Ibs. pressure). Pour into sterile petri dishes.
Warning: A longer period of sterilization
will reduce the selectivity of the medium.
5.5.6 Xylose Lysine Brilliant Green (XLBG)
Agar
Use: Salmonella Differentiation.
Composition of XL Agar Base:
BBL11836
Xylose
L-Lysine
Lactose
Saccharose (Sucrose)
Sodium Chloride
Yeast Extract
Phenol Red
Agar
Difco 0555-02
Xylose
L-Lysine
Lactose
Saccharose (Sucrose)
Sodium Chloride
Yeast Extract
3.5
5.0
7.5
7.5
5.0
3.0
0.08
13.5
3.75
5.0
7.5
7.5
5.0
3.0
g
g
g
g
g
g
g
g
g
g
g
g
g
g
Preparation: Add 45 or 47 grams of XL
agar base to 1 liter of cold laboratory pure
water. Heat in a boiling water bath to dissolve
the agar. Prior to sterilization, add 1.25 ml of
1% aqueous brilliant green. Sterilize for 15
minutes at 121 C (15 Ibs. pressure). Cool the
sterilized medium to about 45-50 C and add
20 ml of a solution containing 34% sodium
thiosulfate and 4% ferric ammonium citrate.
Pour into sterile petri dishes.
5.5.7 Xylose Lysine Desoxycholate (XLD)
Agar
Use: Differentiation of Salmonella.
Composition:
BBL 11837
Xylose
L-Lysine
Lactose
Saccharose (Sucrose)
Sodium Chloride
Yeast Extract
Phenol Red
Agar
Sodium Desoxycholate
Sodium Thiosulfate
Ferric Ammonium Citrate
Difco 0788-02
Xylose
L-Lysine
Lactose
Saccharose (Sucrose)
Sodium Chloride
Yeast Extract
Phenol Red
Agar
Sodium Desoxycholate
Sodium Thiosulfate
Ferric Ammonium Citrate
Final pH: 7.4 ±.2
3.5
5.0
7.5
7.5
5.0
3.0
0.08
13.5
2.5
6.8
0.8
3.75
5.0
7.5
7.5
5.0
3.0
0.08
15.0
2.5
6.8
0.8
g
g
g
g
g
g
g
g
g
g
g
g
g
g
g
g
g
g
g
g
g
g
52
O-ERA MICROBIOLOGICAL MANUAL 1978
image:
5.5.5 Brilliant Green Agar (BBL 11072,
Difco 0285-02)
Use: As a primary plating medium for the
isolation of salmonellae.
Phenol Red
Agar
Final pH: 7.4 ±.2
0.08
15.0
Composition:
Yeast Extract
Polypeptone or Proteose
Peptone
Sodium Chloride
Lactose
Saccharose (Sucrose)
Phenol Red
Brilliant Green
Agar
Final pH: 6.9 ±.2
3.0
10.0
5.0
10.0
10.0
0.08
0.0125
20.0
Preparation: Add 58 grams of brilliant
green agar to 1 liter of cold laboratory pure
water and heat to boiling. Dispense in screw-
cap flasks and sterilize for 15 minutes at 121 C
(15 Ibs. pressure). Pour into sterile petri dishes.
Warning: A longer period of sterilization
will reduce the selectivity of the medium.
5.5.6 Xylose Lysine Brilliant Green (XLBG)
Agar
Use: Salmonella Differentiation.
Composition of XL Agar Base:
BBL11836
Xylose
L-Lysine
Lactose
Saccharose (Sucrose)
Sodium Chloride
Yeast Extract
Phenol Red
Agar
Difco 0555-02
Xylose
L-Lysine
Lactose
Saccharose (Sucrose)
Sodium Chloride
Yeast Extract
3.5
5.0
7.5
7.5
5.0
3.0
0.08
13.5
3.75
5.0
7.5
7.5
5.0
3.0
g
g
g
g
g
g
g
g
g
g
g
g
g
g
Preparation: Add 45 or 47 grams of XL
agar base to 1 liter of cold laboratory pure
water. Heat in a boiling water bath to dissolve
the agar. Prior to sterilization, add 1.25 ml of
1% aqueous brilliant green. Sterilize for 15
minutes at 121 C (15 Ibs. pressure). Cool the
sterilized medium to about 45-50 C and add
20 ml of a solution containing 34% sodium
thiosulfate and 4% ferric ammonium citrate.
Pour into sterile petri dishes.
5.5.7 Xylose Lysine Desoxycholate (XLD)
Agar
Use: Differentiation of Salmonella.
Composition:
BBL 11837
Xylose
L-Lysine
Lactose
Saccharose (Sucrose)
Sodium Chloride
Yeast Extract
Phenol Red
Agar
Sodium Desoxycholate
Sodium Thiosulfate
Ferric Ammonium Citrate
Difco 0788-02
Xylose
L-Lysine
Lactose
Saccharose (Sucrose)
Sodium Chloride
Yeast Extract
Phenol Red
Agar
Sodium Desoxycholate
Sodium Thiosulfate
Ferric Ammonium Citrate
Final pH: 7.4 ±.2
3.5
5.0
7.5
7.5
5.0
3.0
0.08
13.5
2.5
6.8
0.8
3.75
5.0
7.5
7.5
5.0
3.0
0.08
15.0
2.5
6.8
0.8
g
g
g
g
g
g
g
g
g
g
g
g
g
g
g
g
g
g
g
g
g
g
52
O-ERA MICROBIOLOGICAL MANUAL 1978
image:
 Preparation: Add 55 or 57 grams of XLD
agar in 1 liter of cold laboratory pure water,
heat to boiling with mixing. Do not overheat
and do not autoclave. Pour into sterile petri
dishes.
Note: Taylor and Schelhart report better
recoveries by using XL Agar Base (BBL 11835
or Difco 9555), see 5.5.6, and adding sepa-
rately, sterile solutions of the last three ingredi-
ents (4).
5.5.8 Bismuth Sulfite Agar (Difco
0073-02, BBL 11030)
Use: Differentiation of salmonellae, espe-
cially S. typhosa.
Composition:
Polypeptone or Proteose
Peptone
Beef Extract
Dextrose
Disodium Hydrogen
Phosphate
Ferrous Sulfate
Bismuth Sulfite Indicator
Brilliant Green
Agar
Final pH: 7.6+ .2
Preparation: Add 52 grams of bismuth sul-
fite agar to 1 liter of cold laboratory pure water
and heat to boiling. Do not autoclave or over-
heat. Twirl the flask prior to pouring plates to
evenly dispense the characteristic precipitate.
Use the plated medium on the day prepared.
5.5.9 Triple Sugar Iron (TSI) Agar
Use: Differentiation of gram negative en-
terics by their differing ability to ferment dex-
trose, lactose and sucrose and ability to
produce hydrogen sulfide.
Composition:
Difco 0265-02
10.0
5.0
5.0
4.0
0.3
8.0
0.025
20.0
g
g
g
g
g
g
g
g
Yeast Extract
Peptone
Proteose Peptone
Lactose
Saccharose (Sucrose)
Dextrose
Ferrous Sulfate
Sodium Chloride
Sodium Thiosulfate
Agar
Phenol Red
BBL 11748
Peptone
Lactose
Saccharose (Sucrose)
Dextrose
Ferrous Sulfate
Sodium Chloride
Sodium Thiosulfate
Agar
Phenol Red
Final pH: 7.3+ .2
3.0
15.0
5.0
10.0
10.0
1.0
0.2
5.0
0.3
12.0
0.024
20.0
10.0
10.0
1.0
0.2
5.0
0.2
13.0
0.025
Preparation: Add 65 grams or 59.4 grams,
depending on manufacturer, of triple sugar
iron agar to 1 liter of cold laboratory pure
water and heat in a boiling water bath to dis-
solve the agar. Dispense into screw-cap tubes
and sterilize for 1 5 minutes at 1 1 8 C (1 2 Ibs.
pressure). Slant tubes for a generous butt.
Inoculated TSI slants must be incubated with
loosened caps to prevent complete blackening
of the medium from I-^S.
5.5.10 Lysine Iron Agar
Use: Differentiation of Proteus, Citrobacter
and Shigella from Salmonella based on deami-
nation of lysine and hydrogen sulfide produc-
tion. Salmonella cultures produce large
amounts of hydrogen sulfide and lysine decar-
boxylase.
Composition:
Difco 0849-02
Beef Extract
3.0
g Peptone
5.0 g
EQUIPMENT, TECHNIQUES AND MEDIA
53
image:
Preparation: Add 55 or 57 grams of XLD
agar in 1 liter of cold laboratory pure water,
heat to boiling with mixing. Do not overheat
and do not autoclave. Pour into sterile petri
dishes.
Note: Taylor and Schelhart report better
recoveries by using XL Agar Base (BBL 11835
or Difco 9555), see 5.5.6, and adding sepa-
rately, sterile solutions of the last three ingredi-
ents (4).
5.5.8 Bismuth Sulfite Agar (Difco
0073-02, BBL 11030)
Use: Differentiation of salmonellae, espe-
cially S. typhosa.
Composition:
Polypeptone or Proteose
Peptone
Beef Extract
Dextrose
Disodium Hydrogen
Phosphate
Ferrous Sulfate
Bismuth Sulfite Indicator
Brilliant Green
Agar
Final pH: 7.6+ .2
Preparation: Add 52 grams of bismuth sul-
fite agar to 1 liter of cold laboratory pure water
and heat to boiling. Do not autoclave or over-
heat. Twirl the flask prior to pouring plates to
evenly dispense the characteristic precipitate.
Use the plated medium on the day prepared.
5.5.9 Triple Sugar Iron (TSI) Agar
Use: Differentiation of gram negative en-
terics by their differing ability to ferment dex-
trose, lactose and sucrose and ability to
produce hydrogen sulfide.
Composition:
Difco 0265-02
10.0
5.0
5.0
4.0
0.3
8.0
0.025
20.0
g
g
g
g
g
g
g
g
Yeast Extract
Peptone
Proteose Peptone
Lactose
Saccharose (Sucrose)
Dextrose
Ferrous Sulfate
Sodium Chloride
Sodium Thiosulfate
Agar
Phenol Red
BBL 11748
Peptone
Lactose
Saccharose (Sucrose)
Dextrose
Ferrous Sulfate
Sodium Chloride
Sodium Thiosulfate
Agar
Phenol Red
Final pH: 7.3+ .2
3.0
15.0
5.0
10.0
10.0
1.0
0.2
5.0
0.3
12.0
0.024
20.0
10.0
10.0
1.0
0.2
5.0
0.2
13.0
0.025
Preparation: Add 65 grams or 59.4 grams,
depending on manufacturer, of triple sugar
iron agar to 1 liter of cold laboratory pure
water and heat in a boiling water bath to dis-
solve the agar. Dispense into screw-cap tubes
and sterilize for 1 5 minutes at 1 1 8 C (1 2 Ibs.
pressure). Slant tubes for a generous butt.
Inoculated TSI slants must be incubated with
loosened caps to prevent complete blackening
of the medium from I-^S.
5.5.10 Lysine Iron Agar
Use: Differentiation of Proteus, Citrobacter
and Shigella from Salmonella based on deami-
nation of lysine and hydrogen sulfide produc-
tion. Salmonella cultures produce large
amounts of hydrogen sulfide and lysine decar-
boxylase.
Composition:
Difco 0849-02
Beef Extract
3.0
g Peptone
5.0 g
EQUIPMENT, TECHNIQUES AND MEDIA
53
image:
 Yeast Extract
Dextrose
L-Lysine
Ferric Ammonium Citrate
Sodium Thiosulfate
Brom Cresol Purple
Agar
BBL 11362
Peptone
Yeast Extract
Dextrose
L-Lysine
Ferric Ammonium Citrate
Sodium Thiosulfate
Brom Cresol Purple
Agar
FinalpH: 6.7 ±.2
3.0
1.0
10.0
0.5
0.04
0.02
15.0
5.0
3.0
1.0
10.0
0.5
0.04
0.02
13.5
Preparation: Add 34.5 or 33 grams, de-
pending on manufacturer, of lysine iron agarto
1 liter of laboratory pure water. Heat in a
boiling water bath to dissolve the agar. Dis-
pense in 4 ml amounts in screw-cap tubes and
sterilize for 12 minutes at 121 C (15 Ibs.
pressure). Cool to give a deep butt and short
slant. Inoculated LIA slants must be incubated
with loosened caps.
5.5.11 Urea Agar Base (BBL 11794, Difco
0283-02)
Use: To differentiate enteric microorga-
nisms, especially Proteus sp. on basis of
urease activity.
Composition:
Peptone 1.0 g
Dextrose 1.0 g
Sodium Chloride 5.0 g
Monopotassium Phosphate 2.0 g
Urea 20.0 g
Phenol Red 0.012 g
Final pH: 6.8 ± .2
Preparation: Add 29 grams of urea agar
base to 100 ml of laboratory pure water. Dis-
solve and filter-sterilize. Add 15 grams of agar
to 900 ml laboratory pure water and boil to
dissolve. Sterilize for 15 minutes at 121 C (15
Ibs.pressure). Cool to 50-55 C and add asepti-
cally 100 ml of filter-sterilized urea agar base.
Mix and dispense in sterile tubes. Slant tubes
to form a 2 cm butt and 3 cm slant and cool.
Urea Agar Base 10X Concentrate (Difco
0284-60)
Use: Same as urea agar base, for prepara-
tion of small volumes of urea agar.
Composition: A filter-sterilized 10X solu-
tion of urea agar base, 10 ml volumes in tubes.
Refrigerate to store.
Preparation: Add 1.5 grams of agar to 90
ml of laboratory pure water and dissolve by
boiling. Sterilize for 1 5 minutes at 121 C (1 5
Ibs. pressure). Cool the agar to 50-55 C and
aseptically add a 10 ml tube urea agar base
concentrate. Mix agar and concentrate. Dis-
pense aseptically into sterile tubes and slant.
5.5.12 Phenylalanine Agar (BBL 11536,
Difco 0745-02)
Use: Differential tube medium for the sep-
aration of members of the Proteus and Provi-
dencia genera from other members of the En-
terobacteriaceae based on deaminase activity.
Composition:
Yeast Extract
DL-Phenylalanine
Disodium Phosphate
Sodium Chloride
Agar
Final pH: 7.3+ .2
3.0
2.0
1.0
5.0
12.0
Preparation: Add 23 grams of phenylala-
nine agar to 1 liter of cold laboratory pure
water. Heat in a boiling water bath to dissolve
the agar. Dispense in screw-cap tubes and
sterilize in the autoclave for 15 minutes at 121
C (15 Jbs. pressure). Slant and cool tubes.
54
MICROBIOLOGICAL MANUAL 1978
image:
Yeast Extract
Dextrose
L-Lysine
Ferric Ammonium Citrate
Sodium Thiosulfate
Brom Cresol Purple
Agar
BBL 11362
Peptone
Yeast Extract
Dextrose
L-Lysine
Ferric Ammonium Citrate
Sodium Thiosulfate
Brom Cresol Purple
Agar
FinalpH: 6.7 ±.2
3.0
1.0
10.0
0.5
0.04
0.02
15.0
5.0
3.0
1.0
10.0
0.5
0.04
0.02
13.5
Preparation: Add 34.5 or 33 grams, de-
pending on manufacturer, of lysine iron agarto
1 liter of laboratory pure water. Heat in a
boiling water bath to dissolve the agar. Dis-
pense in 4 ml amounts in screw-cap tubes and
sterilize for 12 minutes at 121 C (15 Ibs.
pressure). Cool to give a deep butt and short
slant. Inoculated LIA slants must be incubated
with loosened caps.
5.5.11 Urea Agar Base (BBL 11794, Difco
0283-02)
Use: To differentiate enteric microorga-
nisms, especially Proteus sp. on basis of
urease activity.
Composition:
Peptone 1.0 g
Dextrose 1.0 g
Sodium Chloride 5.0 g
Monopotassium Phosphate 2.0 g
Urea 20.0 g
Phenol Red 0.012 g
Final pH: 6.8 ± .2
Preparation: Add 29 grams of urea agar
base to 100 ml of laboratory pure water. Dis-
solve and filter-sterilize. Add 15 grams of agar
to 900 ml laboratory pure water and boil to
dissolve. Sterilize for 15 minutes at 121 C (15
Ibs.pressure). Cool to 50-55 C and add asepti-
cally 100 ml of filter-sterilized urea agar base.
Mix and dispense in sterile tubes. Slant tubes
to form a 2 cm butt and 3 cm slant and cool.
Urea Agar Base 10X Concentrate (Difco
0284-60)
Use: Same as urea agar base, for prepara-
tion of small volumes of urea agar.
Composition: A filter-sterilized 10X solu-
tion of urea agar base, 10 ml volumes in tubes.
Refrigerate to store.
Preparation: Add 1.5 grams of agar to 90
ml of laboratory pure water and dissolve by
boiling. Sterilize for 1 5 minutes at 121 C (1 5
Ibs. pressure). Cool the agar to 50-55 C and
aseptically add a 10 ml tube urea agar base
concentrate. Mix agar and concentrate. Dis-
pense aseptically into sterile tubes and slant.
5.5.12 Phenylalanine Agar (BBL 11536,
Difco 0745-02)
Use: Differential tube medium for the sep-
aration of members of the Proteus and Provi-
dencia genera from other members of the En-
terobacteriaceae based on deaminase activity.
Composition:
Yeast Extract
DL-Phenylalanine
Disodium Phosphate
Sodium Chloride
Agar
Final pH: 7.3+ .2
3.0
2.0
1.0
5.0
12.0
Preparation: Add 23 grams of phenylala-
nine agar to 1 liter of cold laboratory pure
water. Heat in a boiling water bath to dissolve
the agar. Dispense in screw-cap tubes and
sterilize in the autoclave for 15 minutes at 121
C (15 Jbs. pressure). Slant and cool tubes.
54
MICROBIOLOGICAL MANUAL 1978
image:
 5.5.13 Malonate Broth (Modified) (BBL
11398, Difco 0569-02)
Use: Differentiation of enteric organisms
based on utilization of malonate. Described by
Leifson and modified by Ewing, the medium is
used in differentiation of Salmonella.
Composition:
Yeast Extract
Ammonium Sulfate
Dipotassium Phosphate
Monopotassium Phosphate
Sodium Chloride
Sodium Malonate
Dextrose
Brom Thymol Blue
Final pH: 6.7+ .2
1.0
2.0
0.6
0.4
2.0
3.0
0.25
0.025
Preparation: Dissolve 9.3 grams in 1 liter
of laboratory pure water. Dispense into tubes
and sterilize for 15 minutes at 121 C (15 Ibs.
pressure).
5.5.14 Decarboxylase Medium Base (Difco
0872-02, BBL 11429)
Use: Differentiation of microorganisms
based on decarboxylase activity in presence of
L-lysine HCI, L-arginine HCI, L-ornithine HCI,
glutamic acid or other amino acids.
Composition:
Peptone
Yeast Extract
Dextrose
Brom Cresol Purple
Final pH: 6.5+ .2
5.0 g
3.0 g
1.0 g
0.02 g
Preparation: Add 9 grams of base to 1 liter
of cold laboratory pure water and warm to
dissolve completely. Add 5 grams L-lysine,
L-ornithine, L-arginine or other L-amino acids
as desired per liter of medium and warm to
dissolve completely. When D/L amino acids are
used add 10 g rather than 5 g. If ornithine HCI
is used, adjust pH with 10 N NaOH. (About 2.1
ml required for 1 liter of medium containing 5
grams of ornithine HCI). Lysine or arginine do
not require pH adjustment. Dispense in 5 ml
volumes into screw-cap tubes and sterilize for
15 minutes at 121 C (15 Ibs. pressure). The
proper pH for the complete medium (6.5) is
indicated by purple color of broth.
5.5.15 MotilityTest Medium (BBL 11435)
Use. Recommended for detection of motil-
ity of gram-negative enteric bacilli.
Composition:
Beef Extract
Peptone
Sodium Chloride
Agar
Final pH: 7.3+ .2
3.0 g
10.0 g
5.0 g
4.0 g
Preparation: Add 22 grams of motility test
medium to 1 liter of cold laboratory pure water
and heat in a boiling water bath to dissolve the
agar. Dispense in tubes and sterilize for 15
minutes at 121 C (15 Ibs. pressure).
To aid in recognizing motility, add 0.05
grams of triphenyl tetrazolium chloride/liter
after sterilization.
5.5.16 Motility Sulfide Medium (Difco
0450-17)
Use: Determination of motility and the
production of hydrogen sulfide from l-cystine.
Composition:
Beef Extract 3.0 g
Peptone No. 3 10.0 g
L-Cystine 0.2 g
Ferrous Ammonium Citrate 0.2 g
Sodium Citrate 2.0 g
Sodium Chloride 5.0 g
Gelatin 80.0 g
Agar 4.0 g
Final pH: 7.3 ±.2
Preparation: Add 104 grams of Motility
Sulfide Medium to 1 liter of cold laboratory
pure water. After wetting powder, heat care-
fully to boiling on a hot plate to dissolve com-
pletely. Dispense in 4 ml amounts in tubes, cap
EQUIPMENT, TECHNIQUES AND MEDIA
55
image:
5.5.13 Malonate Broth (Modified) (BBL
11398, Difco 0569-02)
Use: Differentiation of enteric organisms
based on utilization of malonate. Described by
Leifson and modified by Ewing, the medium is
used in differentiation of Salmonella.
Composition:
Yeast Extract
Ammonium Sulfate
Dipotassium Phosphate
Monopotassium Phosphate
Sodium Chloride
Sodium Malonate
Dextrose
Brom Thymol Blue
Final pH: 6.7+ .2
1.0
2.0
0.6
0.4
2.0
3.0
0.25
0.025
Preparation: Dissolve 9.3 grams in 1 liter
of laboratory pure water. Dispense into tubes
and sterilize for 15 minutes at 121 C (15 Ibs.
pressure).
5.5.14 Decarboxylase Medium Base (Difco
0872-02, BBL 11429)
Use: Differentiation of microorganisms
based on decarboxylase activity in presence of
L-lysine HCI, L-arginine HCI, L-ornithine HCI,
glutamic acid or other amino acids.
Composition:
Peptone
Yeast Extract
Dextrose
Brom Cresol Purple
Final pH: 6.5+ .2
5.0 g
3.0 g
1.0 g
0.02 g
Preparation: Add 9 grams of base to 1 liter
of cold laboratory pure water and warm to
dissolve completely. Add 5 grams L-lysine,
L-ornithine, L-arginine or other L-amino acids
as desired per liter of medium and warm to
dissolve completely. When D/L amino acids are
used add 10 g rather than 5 g. If ornithine HCI
is used, adjust pH with 10 N NaOH. (About 2.1
ml required for 1 liter of medium containing 5
grams of ornithine HCI). Lysine or arginine do
not require pH adjustment. Dispense in 5 ml
volumes into screw-cap tubes and sterilize for
15 minutes at 121 C (15 Ibs. pressure). The
proper pH for the complete medium (6.5) is
indicated by purple color of broth.
5.5.15 MotilityTest Medium (BBL 11435)
Use. Recommended for detection of motil-
ity of gram-negative enteric bacilli.
Composition:
Beef Extract
Peptone
Sodium Chloride
Agar
Final pH: 7.3+ .2
3.0 g
10.0 g
5.0 g
4.0 g
Preparation: Add 22 grams of motility test
medium to 1 liter of cold laboratory pure water
and heat in a boiling water bath to dissolve the
agar. Dispense in tubes and sterilize for 15
minutes at 121 C (15 Ibs. pressure).
To aid in recognizing motility, add 0.05
grams of triphenyl tetrazolium chloride/liter
after sterilization.
5.5.16 Motility Sulfide Medium (Difco
0450-17)
Use: Determination of motility and the
production of hydrogen sulfide from l-cystine.
Composition:
Beef Extract 3.0 g
Peptone No. 3 10.0 g
L-Cystine 0.2 g
Ferrous Ammonium Citrate 0.2 g
Sodium Citrate 2.0 g
Sodium Chloride 5.0 g
Gelatin 80.0 g
Agar 4.0 g
Final pH: 7.3 ±.2
Preparation: Add 104 grams of Motility
Sulfide Medium to 1 liter of cold laboratory
pure water. After wetting powder, heat care-
fully to boiling on a hot plate to dissolve com-
pletely. Dispense in 4 ml amounts in tubes, cap
EQUIPMENT, TECHNIQUES AND MEDIA
55
image:
 loosely and sterilize for 15 minutes at 117 C
(10 Ibs. pressure).
5.5.1 7 H Broth (Difco 0451 -02)
Use: Preparation of H agglutinating anti-
gens of members of genus, Salmonella.
Composition:
BBL 11288
Thiotone (peptone)
Beef Extract
Dextrose
Sodium Chloride
Dipotassium Phosphate
Difco 0451-02
Thiotone (Peptone)
Tryptone
Beef Extract
Dextrose
Sodium Chloride
Dipotassium Phosphate
Final pH:7.2 ±.2
10.0 g
3.0 g
1.0 g
5.0 g
2.5 g
5.0
5.0
3.0
1.0
5.0
2.5
Preparation: Add 21.5 grams of H broth to
1 liter of laboratory pure water, mix well and
dissolve by warming. Dispense 5 ml amounts
In screw-cap test tubes. Sterilize for 15
minutes at 121 C (15 Ibs. pressure).
5.6 Medium for Actinomycetes
Starch-Casein Agar
(Medium may not be commercially
available).
Use: Isolation of actinomycetes from
water or soil.
Composition:
Soluble Starch (or
Glycerol)
Casein (Vitamin-free)
Sodium Nitrate
10.0
0.3
2.0
g
g
g
Sodium Chloride 2.0 g
Dipotassium Phosphate 2.0 g
Magnesium Sulfate»7 H20 0.05 g
Calcium Carbonate 0.02 g
Iron Sulfate»7 H20 0.01 g
Agar 15.0 g
Final pH: 7.0-7.2
Preparation: Weigh out ingredients and
add in turn to 1 liter of laboratory pure water in
a two liter flask. Dissolve ingredients using
gentle heat. Add the agar last and place in a
boiling water bath. Heat and stir occasionally
until dissolved. Dispense 250 ml volumes in
500 ml screw-cap flasks and 17 ml volumes in
screw-cap tubes. Sterilize for 15 minutes at
121 C (15 Ibs. pressure).
6. Laboratory Pure Water
.Distilled or deionized water free of nutri-
tive and toxic materials is required for prepa-
ration of media and dilution/rinse water.
6.1 Distilled Water Systems: Water dis-
tillation units can produce good grades of pure
water. Stills are dependable and long-lived if
maintained and cleaned properly. Use of sof-
tened water as the source water increases the
interval between cleanings of the still. Stills
characteristically produce a good grade of
water which gradually deteriorates as corro-
sion, leaching and fouling set in. There is no
sudden loss of water quality unless a structural
failure occurs. Stills are efficient in removing
dissolved chemicals but not dissolved gases.
Fresh laboratory pure water may contain chlo-
rine and ammonia. On storage, ammonia will
increase and CO2 will appear from air contami-
nation. Distilled water systems should be
monitored continuously for conductance and
analyzed monthly for chlorine, ammonia and
standard plate count and at least annually for
trace metals. See Table IV-A-3.
6.2 Deionized Water Systems: Deioniza-
tion systems produce a good grade of pure
water and can produce an ultrapure water
when combined with filtration and activated
carbon in a recirculating system.
56
MICROBIOLOGICAL MANUAL 1978
image:
loosely and sterilize for 15 minutes at 117 C
(10 Ibs. pressure).
5.5.1 7 H Broth (Difco 0451 -02)
Use: Preparation of H agglutinating anti-
gens of members of genus, Salmonella.
Composition:
BBL 11288
Thiotone (peptone)
Beef Extract
Dextrose
Sodium Chloride
Dipotassium Phosphate
Difco 0451-02
Thiotone (Peptone)
Tryptone
Beef Extract
Dextrose
Sodium Chloride
Dipotassium Phosphate
Final pH:7.2 ±.2
10.0 g
3.0 g
1.0 g
5.0 g
2.5 g
5.0
5.0
3.0
1.0
5.0
2.5
Preparation: Add 21.5 grams of H broth to
1 liter of laboratory pure water, mix well and
dissolve by warming. Dispense 5 ml amounts
In screw-cap test tubes. Sterilize for 15
minutes at 121 C (15 Ibs. pressure).
5.6 Medium for Actinomycetes
Starch-Casein Agar
(Medium may not be commercially
available).
Use: Isolation of actinomycetes from
water or soil.
Composition:
Soluble Starch (or
Glycerol)
Casein (Vitamin-free)
Sodium Nitrate
10.0
0.3
2.0
g
g
g
Sodium Chloride 2.0 g
Dipotassium Phosphate 2.0 g
Magnesium Sulfate»7 H20 0.05 g
Calcium Carbonate 0.02 g
Iron Sulfate»7 H20 0.01 g
Agar 15.0 g
Final pH: 7.0-7.2
Preparation: Weigh out ingredients and
add in turn to 1 liter of laboratory pure water in
a two liter flask. Dissolve ingredients using
gentle heat. Add the agar last and place in a
boiling water bath. Heat and stir occasionally
until dissolved. Dispense 250 ml volumes in
500 ml screw-cap flasks and 17 ml volumes in
screw-cap tubes. Sterilize for 15 minutes at
121 C (15 Ibs. pressure).
6. Laboratory Pure Water
.Distilled or deionized water free of nutri-
tive and toxic materials is required for prepa-
ration of media and dilution/rinse water.
6.1 Distilled Water Systems: Water dis-
tillation units can produce good grades of pure
water. Stills are dependable and long-lived if
maintained and cleaned properly. Use of sof-
tened water as the source water increases the
interval between cleanings of the still. Stills
characteristically produce a good grade of
water which gradually deteriorates as corro-
sion, leaching and fouling set in. There is no
sudden loss of water quality unless a structural
failure occurs. Stills are efficient in removing
dissolved chemicals but not dissolved gases.
Fresh laboratory pure water may contain chlo-
rine and ammonia. On storage, ammonia will
increase and CO2 will appear from air contami-
nation. Distilled water systems should be
monitored continuously for conductance and
analyzed monthly for chlorine, ammonia and
standard plate count and at least annually for
trace metals. See Table IV-A-3.
6.2 Deionized Water Systems: Deioniza-
tion systems produce a good grade of pure
water and can produce an ultrapure water
when combined with filtration and activated
carbon in a recirculating system.
56
MICROBIOLOGICAL MANUAL 1978
image:
 In contrast to distilled water systems,
deionization systems do not gradually deterio-
rate. Rather, they continue to produce the
same quality water for a long period of time
until the resins and/or carbon are exhausted,
whereupon the quality deteriorates quickly.
Deioriized water systems should be monitored
continually with a conductance meter and
analyzed monthly for ammonia/amines, total
organic carbon, specific organic pollutants and
Standard Plate Count and at least annually for
metals. Amines may elute from the resin.
Organic carbon results from organic chemicals
in the water or from bacterial growth in the
columns. Use of a 0.22 ^urn final filter is recom-
mended to remove bacterial contamination.
See Table IV-A-3.
Avoid the sudden loss of good quality
water by continuously monitoring perfor-
mance of the system, anticipating the remain-
ing life of cartridges and replacing them be-
fore failure occurs.
6.3 Quality Control
Pure water systems should be monitored
carefully as a part of the intralaboratory QC
program. The water quality should meet the
standards set in this Manual, Part IV-A, 5.2-5.4,
7. Dilution Water
Dilution water is used to reduce the num-
ber of microbial cells/unit volume of sample so
thatthe density of cells is low enough to permit
enumeration or manipulation by the technique
of choice: pour-plate, spread plate, MF or MPN.
The ideal dilution water is neutral in effect.
It maintains bacterial populations without
stimulating cell growth and reproduction,
damaging cells or reducing their ability to sur-
vive, grow or reproduce. Its basic purpose is to
simulate the chemical conditions of the natural
environment which are favorable to cell
stability.
Microbiologists have tried different ap-
proaches to obtain an ideal diluent Some
workers have copied the natural environment
by use of sterile fresh or marine waters as
diluents, but these are non-standard. Other
workers have used tap waters with the same
lack of uniformity and an added potential for
toxicity. Certainly for comparability of microbi-
ological data the dilution water must be uni-
form between laboratories. The chemical ele-
ments and compounds required in natural con-
ditions to insure a balance of cell solutes and
maintain cell turgidity must be reproduced in
the laboratory.
Inorganic constituents such as sodium,
potassium, magnesium, phosphate, chloride
and sulfate, and soluble organics such as pep-
tone are used in synthetic dilution waters. pH
is usually held to a near-neutral reaction. Two
standard dilution waters are:
7.1 Phosphate Buffered Dilution Water
7.1.1 Stock Phosphate Buffer Solution
Potassium Dihydrogen
Phosphate (KH2P04)
Laboratory Pure Water
34.0 g
500 ml
Adjust the pH of the solution to 7.2 with 1
N NaOH and bring volume to 10OO ml with
laboratory pure water. Sterilize by filtration or
autoclave for 15 minutes at 121 C (15 Ibs.
pressure).
7.1.2 Storage of Stock Solution: After
sterilization of the stock solution store in the
refrigerator until used. Handle aseptically. If
evidence of mold or other contamination ap-
pears, the stock solution should be discarded
and a fresh solution prepared.
7.1.3 Working Solution
Stock Phosphate Buffer 1.25ml
MgCl2 Solution (38 g/liter) 5 ml
Laboratory Pure Water 1000 ml
Final pH: 7.2 10.1
7.2 Peptone Dilution Water
Composition:
Peptone 1.0 g
EQUIPMENT, TECHNIQUES AND MEDIA
57
image:
In contrast to distilled water systems,
deionization systems do not gradually deterio-
rate. Rather, they continue to produce the
same quality water for a long period of time
until the resins and/or carbon are exhausted,
whereupon the quality deteriorates quickly.
Deioriized water systems should be monitored
continually with a conductance meter and
analyzed monthly for ammonia/amines, total
organic carbon, specific organic pollutants and
Standard Plate Count and at least annually for
metals. Amines may elute from the resin.
Organic carbon results from organic chemicals
in the water or from bacterial growth in the
columns. Use of a 0.22 ^urn final filter is recom-
mended to remove bacterial contamination.
See Table IV-A-3.
Avoid the sudden loss of good quality
water by continuously monitoring perfor-
mance of the system, anticipating the remain-
ing life of cartridges and replacing them be-
fore failure occurs.
6.3 Quality Control
Pure water systems should be monitored
carefully as a part of the intralaboratory QC
program. The water quality should meet the
standards set in this Manual, Part IV-A, 5.2-5.4,
7. Dilution Water
Dilution water is used to reduce the num-
ber of microbial cells/unit volume of sample so
thatthe density of cells is low enough to permit
enumeration or manipulation by the technique
of choice: pour-plate, spread plate, MF or MPN.
The ideal dilution water is neutral in effect.
It maintains bacterial populations without
stimulating cell growth and reproduction,
damaging cells or reducing their ability to sur-
vive, grow or reproduce. Its basic purpose is to
simulate the chemical conditions of the natural
environment which are favorable to cell
stability.
Microbiologists have tried different ap-
proaches to obtain an ideal diluent Some
workers have copied the natural environment
by use of sterile fresh or marine waters as
diluents, but these are non-standard. Other
workers have used tap waters with the same
lack of uniformity and an added potential for
toxicity. Certainly for comparability of microbi-
ological data the dilution water must be uni-
form between laboratories. The chemical ele-
ments and compounds required in natural con-
ditions to insure a balance of cell solutes and
maintain cell turgidity must be reproduced in
the laboratory.
Inorganic constituents such as sodium,
potassium, magnesium, phosphate, chloride
and sulfate, and soluble organics such as pep-
tone are used in synthetic dilution waters. pH
is usually held to a near-neutral reaction. Two
standard dilution waters are:
7.1 Phosphate Buffered Dilution Water
7.1.1 Stock Phosphate Buffer Solution
Potassium Dihydrogen
Phosphate (KH2P04)
Laboratory Pure Water
34.0 g
500 ml
Adjust the pH of the solution to 7.2 with 1
N NaOH and bring volume to 10OO ml with
laboratory pure water. Sterilize by filtration or
autoclave for 15 minutes at 121 C (15 Ibs.
pressure).
7.1.2 Storage of Stock Solution: After
sterilization of the stock solution store in the
refrigerator until used. Handle aseptically. If
evidence of mold or other contamination ap-
pears, the stock solution should be discarded
and a fresh solution prepared.
7.1.3 Working Solution
Stock Phosphate Buffer 1.25ml
MgCl2 Solution (38 g/liter) 5 ml
Laboratory Pure Water 1000 ml
Final pH: 7.2 10.1
7.2 Peptone Dilution Water
Composition:
Peptone 1.0 g
EQUIPMENT, TECHNIQUES AND MEDIA
57
image:
 Laboratory Pure Water
Final pH: 7.0 ±0.1
1000 ml
7.3 Preparation of Dilution and Rinse
Water
Dispense 102 ml volumes of phosphate
buffer or peptone dilution water into borosili-
cate glass, screw-cap dilution bottles scribed
at 99 ml. Loosen screw-caps on bottles and
sterilize at 121 C for 15 minutes (15 Ibs.
pressure). Final volumes after sterilization
should be 99 ±2 ml. Cool and separate bottles
outside of the 99 ml ±2 ml limit. Tighten screw-
caps after sterilization and store in a cool
place.
Prepare dilution water for rinsing in iOO
ml or larger volumes and autoclave for 30
minutes or more. Bottles or flasks must be
separated sufficiently in the autoclave to per-
mit easy access for steam.
REFERENCES
1. Songer, J. R., J. F. Sullivan and J. W. Monroe, 1971. Safe, convenient pipetting device. Appl.
Microbiol. 21:1097.
2. Songer, J. R., D. T. Braymen and R. G. Mathis, 1975. Safe, convenient pipetting station. Appl.
Microbiol. 30:887.
3. Taylor, R., R. Bordner and P. Scarpino, 1973. Delayed incubation membrane-filter test for fecal
coliforrns. Appl. Microbiol. 25:363.
4. Taylor, W. I., 1965. Isolation of Shigellae. I. Xylose lysine agars; new media for isolation of enteric
pathogens. Ann. J. Clin. Path. 14:471.
GENERAL REFERENCES
Difco Laboratories. General Conditions Pertaining to the Cultivation of Microorganisms; and. Preparation
of Media from Dehydrated Culture Media. Difco Manual. 9th Edition. Difco Laboratories, Detroit, Ml. p. 16
(1953).
Baltimore Biological Laboratories. General Suggestions for Use of Media: Dehydrated-Prepared. BBL
Manual of Products and Laboratory Procedures. 5th Edition, BBL, Division of Becton-Dickinson and Co.,
Cockeysville, MD. p. 88 (1968).
Geldreich, E. E., 1975. Handbook for Evaluating Water Laboratories (2nd Edition). EPA-670/9-75-006,
U.S. Environmental Protection Agency, Cincinnati, OH p. 83.
American Public Health Association, 1976. Standard Methods for the Examination of Water and
Wastewater{14th Edition). American Public Health Association, Inc. p. 892.
58
£EPA MICROBIOLOGICAL MANUAL 1978
image:
Laboratory Pure Water
Final pH: 7.0 ±0.1
1000 ml
7.3 Preparation of Dilution and Rinse
Water
Dispense 102 ml volumes of phosphate
buffer or peptone dilution water into borosili-
cate glass, screw-cap dilution bottles scribed
at 99 ml. Loosen screw-caps on bottles and
sterilize at 121 C for 15 minutes (15 Ibs.
pressure). Final volumes after sterilization
should be 99 ±2 ml. Cool and separate bottles
outside of the 99 ml ±2 ml limit. Tighten screw-
caps after sterilization and store in a cool
place.
Prepare dilution water for rinsing in iOO
ml or larger volumes and autoclave for 30
minutes or more. Bottles or flasks must be
separated sufficiently in the autoclave to per-
mit easy access for steam.
REFERENCES
1. Songer, J. R., J. F. Sullivan and J. W. Monroe, 1971. Safe, convenient pipetting device. Appl.
Microbiol. 21:1097.
2. Songer, J. R., D. T. Braymen and R. G. Mathis, 1975. Safe, convenient pipetting station. Appl.
Microbiol. 30:887.
3. Taylor, R., R. Bordner and P. Scarpino, 1973. Delayed incubation membrane-filter test for fecal
coliforrns. Appl. Microbiol. 25:363.
4. Taylor, W. I., 1965. Isolation of Shigellae. I. Xylose lysine agars; new media for isolation of enteric
pathogens. Ann. J. Clin. Path. 14:471.
GENERAL REFERENCES
Difco Laboratories. General Conditions Pertaining to the Cultivation of Microorganisms; and. Preparation
of Media from Dehydrated Culture Media. Difco Manual. 9th Edition. Difco Laboratories, Detroit, Ml. p. 16
(1953).
Baltimore Biological Laboratories. General Suggestions for Use of Media: Dehydrated-Prepared. BBL
Manual of Products and Laboratory Procedures. 5th Edition, BBL, Division of Becton-Dickinson and Co.,
Cockeysville, MD. p. 88 (1968).
Geldreich, E. E., 1975. Handbook for Evaluating Water Laboratories (2nd Edition). EPA-670/9-75-006,
U.S. Environmental Protection Agency, Cincinnati, OH p. 83.
American Public Health Association, 1976. Standard Methods for the Examination of Water and
Wastewater{14th Edition). American Public Health Association, Inc. p. 892.
58
£EPA MICROBIOLOGICAL MANUAL 1978
image:
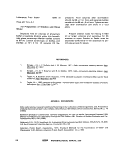 PART II. GENERAL OPERATIONS
Section C Techniques for Isolation and Enumeration of Bacteria of
Sanitary Significance
This Section describes the fundamental
laboratory procedures needed for
microbiological analyses of water and
wastewater. Although experienced
microbiologists and technicians may not
require the depth of information and the
degree of detail given in this Section, it is
provided to serve the technical personnel who
are new to environmental microbiology. The
procedures included are:
1. Preparation for Analyses
2. Streak Plate, Pour Plate and
Spread Plate Methods
3. Membrane Filtration Method
4. Most Probable Number Method
5. Staining Procedures
6. Shipment of Cultures
The specific details unique to tests are
described in separate Sections of Part III:
Standard Plate Count, Total Coliform, Fecal
Coliform, Fecal Streptococci, Salmonella and
Actinomycetes. Refer to Part IV, A & C for de-
tails of quality control on these analyses.
1. Preparation for Analyses
1.1 Preparation of Data Sheets
Select a standard format for bench sheet
or card and use to record pertinent data:
sample identification, sampling conditions,
chlorine residual, temperature, pH, sampling
site, station number, date and time of
collection, sample collector, required chain of
custody information, data and time received
and analyzed, time elapsed from sample
collection, analyses performed, sample
volume(s), analyst, and laboratory
identification numbers. (See Figures ll-C-1, 2
and 3).
1.2 Disinfection of Work Area
Wipe the work area before and after use
with laboratory-strength disinfectant and allow
surface to dry before use. See Table V-C-3.
Keep a covered container of iodophor or
quaternary ammonium disinfectant available
for emergency use. Phenolics are acceptable if
analyses for these compounds are not per-
formed as part of laboratory work.
1.3 Pretreatment of Samples
Prior to dilution of samples for analyses,
the analyst should examine the sample for free
chlorine residual and possible uneven distribu-
tion of microorganisms.
ISOLATION AND ENUMERATION
59
image:
PART II. GENERAL OPERATIONS
Section C Techniques for Isolation and Enumeration of Bacteria of
Sanitary Significance
This Section describes the fundamental
laboratory procedures needed for
microbiological analyses of water and
wastewater. Although experienced
microbiologists and technicians may not
require the depth of information and the
degree of detail given in this Section, it is
provided to serve the technical personnel who
are new to environmental microbiology. The
procedures included are:
1. Preparation for Analyses
2. Streak Plate, Pour Plate and
Spread Plate Methods
3. Membrane Filtration Method
4. Most Probable Number Method
5. Staining Procedures
6. Shipment of Cultures
The specific details unique to tests are
described in separate Sections of Part III:
Standard Plate Count, Total Coliform, Fecal
Coliform, Fecal Streptococci, Salmonella and
Actinomycetes. Refer to Part IV, A & C for de-
tails of quality control on these analyses.
1. Preparation for Analyses
1.1 Preparation of Data Sheets
Select a standard format for bench sheet
or card and use to record pertinent data:
sample identification, sampling conditions,
chlorine residual, temperature, pH, sampling
site, station number, date and time of
collection, sample collector, required chain of
custody information, data and time received
and analyzed, time elapsed from sample
collection, analyses performed, sample
volume(s), analyst, and laboratory
identification numbers. (See Figures ll-C-1, 2
and 3).
1.2 Disinfection of Work Area
Wipe the work area before and after use
with laboratory-strength disinfectant and allow
surface to dry before use. See Table V-C-3.
Keep a covered container of iodophor or
quaternary ammonium disinfectant available
for emergency use. Phenolics are acceptable if
analyses for these compounds are not per-
formed as part of laboratory work.
1.3 Pretreatment of Samples
Prior to dilution of samples for analyses,
the analyst should examine the sample for free
chlorine residual and possible uneven distribu-
tion of microorganisms.
ISOLATION AND ENUMERATION
59
image:
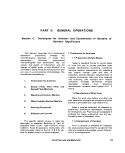 EPA-209 (Clnl
(R*v- 4-78)
PHOJ
SAMP
SAMP
COLL
VOL.
Rirnir
MICROBIOLOGY LABORATORY RECORD
UEUBRANE FILTER ANALYSIS
fr.t' NO-
LE SOURCI
UNO nATFr TIME: FILTRATION DATE: TIME:
ECTOR:
TEMP: nH:
COUNT
COUNT/100 ml
k«!
VOL.
R,ma
COUNT
COUNT/100 ml
rk«:
ANALYST:
VOL.
Ramai
COUNT
COUNT/100 ml
bn:
FIGURE ll-C-1. Microbiological Bench Card for MF Analyses.
MICROBIOLOGY I
COLIFORM K
Sa.ppit • nn*»
.ABOI
iPN /
Time
1ATORY RE
WALYSIS
s
CORD
ST River
Tid« Rain pai» 24 Hr>. D«p»h Wa»«rT»mp. 'C Secchi Disc.
(XVition
Cdifwrn Pr«». LST 24Hra.
48 Mrs.
CoKform Conf. BGLB 48 Hr..
Fical Cdlfortn EC 24Hrj.
MPN/IOOml
AFO, Region III, USEPA
FIGURE ll-C-2. Bench Card for MPN Analyses.
60
MICROBIOLOGICAL MANUAL 1978
image:
EPA-209 (Clnl
(R*v- 4-78)
PHOJ
SAMP
SAMP
COLL
VOL.
Rirnir
MICROBIOLOGY LABORATORY RECORD
UEUBRANE FILTER ANALYSIS
fr.t' NO-
LE SOURCI
UNO nATFr TIME: FILTRATION DATE: TIME:
ECTOR:
TEMP: nH:
COUNT
COUNT/100 ml
k«!
VOL.
R,ma
COUNT
COUNT/100 ml
rk«:
ANALYST:
VOL.
Ramai
COUNT
COUNT/100 ml
bn:
FIGURE ll-C-1. Microbiological Bench Card for MF Analyses.
MICROBIOLOGY I
COLIFORM K
Sa.ppit • nn*»
.ABOI
iPN /
Time
1ATORY RE
WALYSIS
s
CORD
ST River
Tid« Rain pai» 24 Hr>. D«p»h Wa»«rT»mp. 'C Secchi Disc.
(XVition
Cdifwrn Pr«». LST 24Hra.
48 Mrs.
CoKform Conf. BGLB 48 Hr..
Fical Cdlfortn EC 24Hrj.
MPN/IOOml
AFO, Region III, USEPA
FIGURE ll-C-2. Bench Card for MPN Analyses.
60
MICROBIOLOGICAL MANUAL 1978
image:
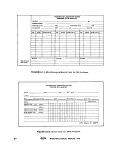 BACTERIAL INDICATOR ORGANISMS OF POLLUTION
STATION.
.BENCH NO
LOCATION.
DATE
HOURS SAD NO.
COLLECTED .
EXAMINED .
ANALYST
M P N
DiL.
ml.
10
1 fl-
ic-
i fl-
ic-
CONF1RME
FECAL CO
PRESUMPTIVE
LTB
35'C
24 hrs. •
... ,„
AS hrs.
CONFIRMED
B.G.L.B.
35'C
24 hn.
D MPN ... . . . . .
LIFORM MPN . . .
48 hrs.
EC
44.5'C
24 hrs.
PER 100 ML.
PER 100 ML.
MEMBRANE FILTER
VOLUME
FILTERED
COLONY
COUNT
TOTAL
COLIFORMS
FECAL
COLIFORMS
ORGANISMS PER 100 ML.
cprai s
SALMONS
ISOLATIO
SEROTYPE
tsi
REMARKS:
SERL, Region IV. US EPA
FIGURE II-C-3. Combined Microbiological Bench Card
ISOLATION AND ENUMERATION
61
image:
BACTERIAL INDICATOR ORGANISMS OF POLLUTION
STATION.
.BENCH NO
LOCATION.
DATE
HOURS SAD NO.
COLLECTED .
EXAMINED .
ANALYST
M P N
DiL.
ml.
10
1 fl-
ic-
i fl-
ic-
CONF1RME
FECAL CO
PRESUMPTIVE
LTB
35'C
24 hrs. •
... ,„
AS hrs.
CONFIRMED
B.G.L.B.
35'C
24 hn.
D MPN ... . . . . .
LIFORM MPN . . .
48 hrs.
EC
44.5'C
24 hrs.
PER 100 ML.
PER 100 ML.
MEMBRANE FILTER
VOLUME
FILTERED
COLONY
COUNT
TOTAL
COLIFORMS
FECAL
COLIFORMS
ORGANISMS PER 100 ML.
cprai s
SALMONS
ISOLATIO
SEROTYPE
tsi
REMARKS:
SERL, Region IV. US EPA
FIGURE II-C-3. Combined Microbiological Bench Card
ISOLATION AND ENUMERATION
61
image:
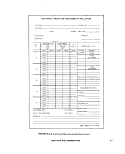 1.3.1 Water Samples with High Solids
1.4 Dilution of Samples
(a) Blending of sediments, primary efflu-
ents, sludge and highly turbid waters is essen-
tial for representative subsampling.
(b) Blend the entire water sample contain-
ing particulates in a Waring-type blender. Use
only autoclavable pyrex glass, stainless steel
or plastic blender containers with safety screw
covers to prevent release of aerosols.
(c) Limit blending to no more than 30 sec-
onds at about 5000 RPM to avoid overheating
or shearing damage.
(d) Dilute sediments or soils containing
limited amounts of water at a 1:1, 1:2 ratio or
more with dilution water to ensure good blend-
ing action and to reduce heat generation. Use
of a large blender container rather than smaller
units also reduces heat,
1.3.2 Dry Solid Samples
(a) Mix sample thoroughly and weigh 50
grams aliquot in a tared weighing pan. Dry at
105-110 C to constant weight. The final weight
is used in calculating numbers of organisms/
gram dry solids.
(b) Prepare the initial dilution by weighing
out a second aliquot of 11 grams of original
sample. Add to a 99 ml volume of buffered dilu-
tion water for a 1:10 dilution and blend sample
aseptically in a Waring-type blender at 5000
rpm for 30 seconds. Use only a pyrex glass,
stainless steel or plastic blender container with
safety screw lid to prevent release of aerosols.
(c) Transfer an 11 ml sample of the 1:10
dilution to a second dilution bottle containing
99 ml buffered dilution water and shake vigor-
ously about 25 times. Repeat this process until
the desired dilution is reached.
1.3.3 Analytical Method
Although high solids samples with low
microbial densities may require MPN or pour
plate procedures, high density samples such as
polluted soils, sludges and feces are diluted so
that the MF method is applicable.
1.4.1 Necessity for Dilutions: Dilutions of
the original sample of water, wastewater or
other material are often necessary to reduce
the number of bacterial cells to measureable
levels or to isolate single cells for purification
and identification (see Part II-B, 7 for details on
dilution water).
1.4.2 Serial Dilutions: A known quantity of
the sample (usually 1.0 ml, but other volumes
can be used) is transferred through a series of
known volumes (e.g., 9 or 99 ml) of dilution
water. This procedure is repeated until the
desired bacterial density is reached. After dilu-
tion of the sample, the bacteria are enumer-
ated using the membrane filtration, pour plate,
streak plate, or the most probable number
technique.
For ease of calculation and preparation,
serial dilutions are usually prepared in suc-
ceeding ten-fold volumes called decimal dilu-
tions. The decimal dilution procedure is shown
in Figure ll-C-4.
1.4.3 Special Dilutions for Membrane Fil-
tration Procedures: The normally accepted lim-
its for colonies per plate in membrane filtration
methods (20-60, 20-80 or 20-100) require
that decimal dilution series be modified to
assume an MF plate count within the accepted
limit.
The recommended method for obtaining
counts within these limits is to filter dilution
volumes of the decimal series which have a
factor of 3, 4 or 5 among them (see Table ll-C-1
for details).
1.4.4 Filtration Volumes for Membrane
Filter Analyses: For sample volumes of 1 -10 ml,
add 20 ml of dilution water to the funnel before
adding sample, to evenly disperse cells.
1.4.5 Preparation of Dilutions: Shake
sample bottle vigorously (about 25 times in 7
seconds) to evenly distribute the bacteria.
Take care to secure the screw-cap and prevent
leakage during shaking.
62
&ERA MICROBIOLOGICAL MANUAL 1978
image:
1.3.1 Water Samples with High Solids
1.4 Dilution of Samples
(a) Blending of sediments, primary efflu-
ents, sludge and highly turbid waters is essen-
tial for representative subsampling.
(b) Blend the entire water sample contain-
ing particulates in a Waring-type blender. Use
only autoclavable pyrex glass, stainless steel
or plastic blender containers with safety screw
covers to prevent release of aerosols.
(c) Limit blending to no more than 30 sec-
onds at about 5000 RPM to avoid overheating
or shearing damage.
(d) Dilute sediments or soils containing
limited amounts of water at a 1:1, 1:2 ratio or
more with dilution water to ensure good blend-
ing action and to reduce heat generation. Use
of a large blender container rather than smaller
units also reduces heat,
1.3.2 Dry Solid Samples
(a) Mix sample thoroughly and weigh 50
grams aliquot in a tared weighing pan. Dry at
105-110 C to constant weight. The final weight
is used in calculating numbers of organisms/
gram dry solids.
(b) Prepare the initial dilution by weighing
out a second aliquot of 11 grams of original
sample. Add to a 99 ml volume of buffered dilu-
tion water for a 1:10 dilution and blend sample
aseptically in a Waring-type blender at 5000
rpm for 30 seconds. Use only a pyrex glass,
stainless steel or plastic blender container with
safety screw lid to prevent release of aerosols.
(c) Transfer an 11 ml sample of the 1:10
dilution to a second dilution bottle containing
99 ml buffered dilution water and shake vigor-
ously about 25 times. Repeat this process until
the desired dilution is reached.
1.3.3 Analytical Method
Although high solids samples with low
microbial densities may require MPN or pour
plate procedures, high density samples such as
polluted soils, sludges and feces are diluted so
that the MF method is applicable.
1.4.1 Necessity for Dilutions: Dilutions of
the original sample of water, wastewater or
other material are often necessary to reduce
the number of bacterial cells to measureable
levels or to isolate single cells for purification
and identification (see Part II-B, 7 for details on
dilution water).
1.4.2 Serial Dilutions: A known quantity of
the sample (usually 1.0 ml, but other volumes
can be used) is transferred through a series of
known volumes (e.g., 9 or 99 ml) of dilution
water. This procedure is repeated until the
desired bacterial density is reached. After dilu-
tion of the sample, the bacteria are enumer-
ated using the membrane filtration, pour plate,
streak plate, or the most probable number
technique.
For ease of calculation and preparation,
serial dilutions are usually prepared in suc-
ceeding ten-fold volumes called decimal dilu-
tions. The decimal dilution procedure is shown
in Figure ll-C-4.
1.4.3 Special Dilutions for Membrane Fil-
tration Procedures: The normally accepted lim-
its for colonies per plate in membrane filtration
methods (20-60, 20-80 or 20-100) require
that decimal dilution series be modified to
assume an MF plate count within the accepted
limit.
The recommended method for obtaining
counts within these limits is to filter dilution
volumes of the decimal series which have a
factor of 3, 4 or 5 among them (see Table ll-C-1
for details).
1.4.4 Filtration Volumes for Membrane
Filter Analyses: For sample volumes of 1 -10 ml,
add 20 ml of dilution water to the funnel before
adding sample, to evenly disperse cells.
1.4.5 Preparation of Dilutions: Shake
sample bottle vigorously (about 25 times in 7
seconds) to evenly distribute the bacteria.
Take care to secure the screw-cap and prevent
leakage during shaking.
62
&ERA MICROBIOLOGICAL MANUAL 1978
image:
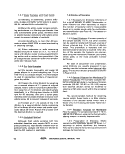 W
Q
r~
Ik
3
O
O
C.
1
3
O
WATER
SAMPLE
-1 ml-
DEUVERY VOLUME: 10 ml 1 ml 0.1 ml
DILUTION A
10-2
DILUTION B
10
-4
99 ml
BLANK
99 ml
BLANK
1 ml 0.1 ml
1 ml 0.1 ml
VOLUME OF
ORIGINAL SAMPLE
IN TUBE/PLATE 10 ml
10-5 ml
a>
CO
FIGURE ll-C-4. Preparation of Decimal Dilution.
image:
W
Q
r~
Ik
3
O
O
C.
1
3
O
WATER
SAMPLE
-1 ml-
DEUVERY VOLUME: 10 ml 1 ml 0.1 ml
DILUTION A
10-2
DILUTION B
10
-4
99 ml
BLANK
99 ml
BLANK
1 ml 0.1 ml
1 ml 0.1 ml
VOLUME OF
ORIGINAL SAMPLE
IN TUBE/PLATE 10 ml
10-5 ml
a>
CO
FIGURE ll-C-4. Preparation of Decimal Dilution.
image:
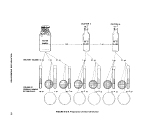 TABLE II-C-1
Recommended Filtration Volumes of Samples in MF Analyses
MF Count Range 20-60
MF Count Range 20-80
MF Count Range 20-100
Sample vol., ml added as: Sample vol., ml added as: Sample vol., ml added as:
.01
.03
.1
.3
1.0
3
1O
30
1 ml of 10"2
3 ml of 10~2
1 ml of 10"1
3 ml of 10~1
1 ml sample
3 ml sample
10 ml sample
30 ml sample
.04
.16
.5
2.0
8.0
30
4 ml of 10~2
1.5 ml of 10~1
5 ml of 10~1
2 ml sample
8 ml sample
30 ml sample
.01
.05
.25
1.25
6
30
1 ml of 10~2
5 ml of 10~2
2.5 of 10"1
1.25 ml sample
6 ml sample
30 ml sample
64
-SEPA MICROBIOLOGICAL MANUAL 1978
image:
TABLE II-C-1
Recommended Filtration Volumes of Samples in MF Analyses
MF Count Range 20-60
MF Count Range 20-80
MF Count Range 20-100
Sample vol., ml added as: Sample vol., ml added as: Sample vol., ml added as:
.01
.03
.1
.3
1.0
3
1O
30
1 ml of 10"2
3 ml of 10~2
1 ml of 10"1
3 ml of 10~1
1 ml sample
3 ml sample
10 ml sample
30 ml sample
.04
.16
.5
2.0
8.0
30
4 ml of 10~2
1.5 ml of 10~1
5 ml of 10~1
2 ml sample
8 ml sample
30 ml sample
.01
.05
.25
1.25
6
30
1 ml of 10~2
5 ml of 10~2
2.5 of 10"1
1.25 ml sample
6 ml sample
30 ml sample
64
-SEPA MICROBIOLOGICAL MANUAL 1978
image:
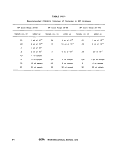 (a) Withdraw 1.0 ml or 0.1 ml of original
sample to test samples directly for a 1 x 10°
ml and 1 x 10~1 ml volumes, respectively.
(b) Transfer a second 1.0 ml volume to a
99 ml dilution water bottle (Dilution A). Shake
sample vigorously about 25 times and with-
draw 1.0 ml or 0.1 ml of diluted sample for
testing of 1 x 10~2 andil X'10~3iml sample
volumes. The.resultant dilution is calculated as
follows:
Volume of Sample
Volume of Dilution Blank
+ Volume of Sample
Dilution
Ratio
or.
1.0 mi
99.0 + 1.0 ml
or 10~2 (Dilution A)
1
100
(c) When 1.0 ml is transferred from dilu-
tion bottle A to a second dilution bottle (B), the
dilution ratio for bottle B dilution shown in
Figure ll-C-4 is the product of the individual
dilutions as follows:
A x B = Final or Total Dilution Ratio
or
100
x
1
100
10,000
Volumes of 0.1 ml can be tested directly from
each serial dilution to provide intermediate
dilutions.
(d) Alternatively, if an initial sample vol-
ume of 1 1 ml is transferred into the first 99 ml
volume dilution blank, an intermediate dilution
can be obtained with the added precision re-
sulting from measurements of 1 ml volumes
serially as opposed to the measurement of 0.1
ml volumes in(c).
(e) Different dilutions can be obtained by
varying sample and dilution preparations. For
example, if 2.0 ml of the sample is transferred
to a 98.0 ml dilution blank, the final dilution
ratio is calculated as follows:
2.0 ml
98.0 + 2.0 ml
100
1
50
(f) If 0.5 ml is added to a dilution blank
containing 99.5 ml of buffer, the dilution ratio
is calculated as follows:
0.5 ml
99.5 + 0.5 ml
0.5
100
1
200
(g) Varying the final volume tested will also
permit modification of dilutions without
increasing the number of dilution bottles as
follows:
A 1:200 dilution can be obtained by test-
ing 0.5 ml of a 1:100 dilution.
A 1:500 dilution can be obtained by test-
ing 2 ml of a 1:1 000 dilution.
1.4.6 Prompt Use of Dilutions: The poten-
tial toxicity of phosphate dilution water and
the stimulatory effect of peptone dilution
water increase rapidly with time. Therefore,
dilutions of samples should be tested as soon
as possible after make-up and should be held
no longerthan 30 minutes after preparation.
2. Streak, Pour and Spread Plate Methods
2.1 Summary: There are three plate dilu-
tion techniques commonly used for isolating
and/or enumerating single colonies of bacteria:
the streak plate, pour plate and spread plate
procedures. These techniques described herein
use solid or melted agar plating media to dilute
out the microorganisms so that individual
species or cells can be selected or counted from
mixed cultures. Because colonies can originate
from more than one cell, results may be report-
ed as colony-forming-units (CPUs).
2.1.1 Streak Plate Method: To obtain a
pure culture the analyst dilutes and isolates
bacteria from a mixed culture by drawing a
small amount of the bacterial growth lightly
across the surface of an agar plate in a pattern
with an inoculating needle or loop.
ISOLATION AND ENUMERATION
65
image:
(a) Withdraw 1.0 ml or 0.1 ml of original
sample to test samples directly for a 1 x 10°
ml and 1 x 10~1 ml volumes, respectively.
(b) Transfer a second 1.0 ml volume to a
99 ml dilution water bottle (Dilution A). Shake
sample vigorously about 25 times and with-
draw 1.0 ml or 0.1 ml of diluted sample for
testing of 1 x 10~2 andil X'10~3iml sample
volumes. The.resultant dilution is calculated as
follows:
Volume of Sample
Volume of Dilution Blank
+ Volume of Sample
Dilution
Ratio
or.
1.0 mi
99.0 + 1.0 ml
or 10~2 (Dilution A)
1
100
(c) When 1.0 ml is transferred from dilu-
tion bottle A to a second dilution bottle (B), the
dilution ratio for bottle B dilution shown in
Figure ll-C-4 is the product of the individual
dilutions as follows:
A x B = Final or Total Dilution Ratio
or
100
x
1
100
10,000
Volumes of 0.1 ml can be tested directly from
each serial dilution to provide intermediate
dilutions.
(d) Alternatively, if an initial sample vol-
ume of 1 1 ml is transferred into the first 99 ml
volume dilution blank, an intermediate dilution
can be obtained with the added precision re-
sulting from measurements of 1 ml volumes
serially as opposed to the measurement of 0.1
ml volumes in(c).
(e) Different dilutions can be obtained by
varying sample and dilution preparations. For
example, if 2.0 ml of the sample is transferred
to a 98.0 ml dilution blank, the final dilution
ratio is calculated as follows:
2.0 ml
98.0 + 2.0 ml
100
1
50
(f) If 0.5 ml is added to a dilution blank
containing 99.5 ml of buffer, the dilution ratio
is calculated as follows:
0.5 ml
99.5 + 0.5 ml
0.5
100
1
200
(g) Varying the final volume tested will also
permit modification of dilutions without
increasing the number of dilution bottles as
follows:
A 1:200 dilution can be obtained by test-
ing 0.5 ml of a 1:100 dilution.
A 1:500 dilution can be obtained by test-
ing 2 ml of a 1:1 000 dilution.
1.4.6 Prompt Use of Dilutions: The poten-
tial toxicity of phosphate dilution water and
the stimulatory effect of peptone dilution
water increase rapidly with time. Therefore,
dilutions of samples should be tested as soon
as possible after make-up and should be held
no longerthan 30 minutes after preparation.
2. Streak, Pour and Spread Plate Methods
2.1 Summary: There are three plate dilu-
tion techniques commonly used for isolating
and/or enumerating single colonies of bacteria:
the streak plate, pour plate and spread plate
procedures. These techniques described herein
use solid or melted agar plating media to dilute
out the microorganisms so that individual
species or cells can be selected or counted from
mixed cultures. Because colonies can originate
from more than one cell, results may be report-
ed as colony-forming-units (CPUs).
2.1.1 Streak Plate Method: To obtain a
pure culture the analyst dilutes and isolates
bacteria from a mixed culture by drawing a
small amount of the bacterial growth lightly
across the surface of an agar plate in a pattern
with an inoculating needle or loop.
ISOLATION AND ENUMERATION
65
image:
 In one suggested pattern, the plate is
streaked in parallel lines over half of the sur-
face, rotated a quarter turn, streaked again,
rotated another quarter turn and streaked
once more. The inoculum is progressively di-
luted with each successive streak, and eventu-
ally single cells are deposited on the agar
surface. After suitable incubation, single iso-
lated colonies develop in the path of the
streak, (see Figure ll-C-5).
2.1.2 Pour Plate Method: The analyst di-
lutes apd isolates cells in a bacterial suspen-
sion by consecutively transferring a portion of
the original sample through a series of dilution
water blanks. After an appropriate series of
dilutions, the original bacterial population is
diluted out to a countable level, as described in
1.4. Aliquots of the diluted sample are added
to sterile petri dishes and mixed with melted
agar. After the agar solidifies, the plates are
inverted and incubated for a predetermined
time. Surface or subsurface colonies will de-
velop in some of the agar plates. These colo-
nies can be counted to provide a quantitative
value for the bacterial density of the original
sample, or they can be picked for further quali-
tative study.
2.1.3 Spread Plate Method: The analyst
isolates bacterial cells by delivering a small
volume of a diluted sample onto a solid agar
plate and spreading the inoculum by use of a
sterile glass rod bent at an angle of about 120°.
The Inoculum is spread uniformly by holding
the stick at a set angle on the agar and rotating
the agar plate or rotating the stick until the
Inoculum is distributed evenly.
2.2 Scope and Application
2.2.1 Streak and pour plate methods pro-
vide the means to separate individual bacteria
so that each cell will develop into an isolated
colony in or on a solid medium. The methods
can isolate specific bacteria by the use of se-
lective or differential media.
The streak plate is only qualitative but the
pour plate procedure can be used to quantitate
bacteria present in a sample as in the Standard
Plate Count Method (see Part III-A), The spread
plate method provides a quantitative method
for aerobic surface growth of cultures against
which other surface growth methods such as
the MF technique can be compared.
2.2.2 Because the volumes tested with the
spread plate technique are limited to
0.1-0.5 ml, the sample must be diluted to con-
tain at least 40-2000 cells/ml in order to have
a counting range of 20-200.
2.2.3 In the pour plate technique, test vol-
umes are limited to 0.1-2 ml per 100 ml petri
dish so the sample must be diluted to contain
60-3000 cells/ml to have a 30-300 counting
range.
2.3 Apparatus and Materials
2.3.1 Incubator set at 35 ± 0.5 C.
2.3.2 Water bath set at 44-46 C for tem-
pering agar.
2.3.3 Colony Counter, Quebec darkfield
model or equivalent.
2.3.4 Hand tally or electronic counting
device.
2.3.5 Thermometer which has been
checked against a National Bureau of
Standards-Certified Thermometer or one of
equivalent accuracy.
2.3.6 Inoculating needle and loop.
2.3.7 Pipet containers of stainless steel,
aluminum or pyrex for glass pipets.
2.3.8 Petri dish containers of stainless
steel, aluminum or pyrex glass for glass petri
dishes.
2.3.9 Glass spreader rods.
2.3.10 Sterile T.D. bacteriological or Mohr
pipets, glass or plastic of appropriate volume.
2.3.11 Sterile 100 mm x 15 mm petri
dishes, glass or plastic.
66
MICROBIOLOGICAL MANUAL 1978
image:
In one suggested pattern, the plate is
streaked in parallel lines over half of the sur-
face, rotated a quarter turn, streaked again,
rotated another quarter turn and streaked
once more. The inoculum is progressively di-
luted with each successive streak, and eventu-
ally single cells are deposited on the agar
surface. After suitable incubation, single iso-
lated colonies develop in the path of the
streak, (see Figure ll-C-5).
2.1.2 Pour Plate Method: The analyst di-
lutes apd isolates cells in a bacterial suspen-
sion by consecutively transferring a portion of
the original sample through a series of dilution
water blanks. After an appropriate series of
dilutions, the original bacterial population is
diluted out to a countable level, as described in
1.4. Aliquots of the diluted sample are added
to sterile petri dishes and mixed with melted
agar. After the agar solidifies, the plates are
inverted and incubated for a predetermined
time. Surface or subsurface colonies will de-
velop in some of the agar plates. These colo-
nies can be counted to provide a quantitative
value for the bacterial density of the original
sample, or they can be picked for further quali-
tative study.
2.1.3 Spread Plate Method: The analyst
isolates bacterial cells by delivering a small
volume of a diluted sample onto a solid agar
plate and spreading the inoculum by use of a
sterile glass rod bent at an angle of about 120°.
The Inoculum is spread uniformly by holding
the stick at a set angle on the agar and rotating
the agar plate or rotating the stick until the
Inoculum is distributed evenly.
2.2 Scope and Application
2.2.1 Streak and pour plate methods pro-
vide the means to separate individual bacteria
so that each cell will develop into an isolated
colony in or on a solid medium. The methods
can isolate specific bacteria by the use of se-
lective or differential media.
The streak plate is only qualitative but the
pour plate procedure can be used to quantitate
bacteria present in a sample as in the Standard
Plate Count Method (see Part III-A), The spread
plate method provides a quantitative method
for aerobic surface growth of cultures against
which other surface growth methods such as
the MF technique can be compared.
2.2.2 Because the volumes tested with the
spread plate technique are limited to
0.1-0.5 ml, the sample must be diluted to con-
tain at least 40-2000 cells/ml in order to have
a counting range of 20-200.
2.2.3 In the pour plate technique, test vol-
umes are limited to 0.1-2 ml per 100 ml petri
dish so the sample must be diluted to contain
60-3000 cells/ml to have a 30-300 counting
range.
2.3 Apparatus and Materials
2.3.1 Incubator set at 35 ± 0.5 C.
2.3.2 Water bath set at 44-46 C for tem-
pering agar.
2.3.3 Colony Counter, Quebec darkfield
model or equivalent.
2.3.4 Hand tally or electronic counting
device.
2.3.5 Thermometer which has been
checked against a National Bureau of
Standards-Certified Thermometer or one of
equivalent accuracy.
2.3.6 Inoculating needle and loop.
2.3.7 Pipet containers of stainless steel,
aluminum or pyrex for glass pipets.
2.3.8 Petri dish containers of stainless
steel, aluminum or pyrex glass for glass petri
dishes.
2.3.9 Glass spreader rods.
2.3.10 Sterile T.D. bacteriological or Mohr
pipets, glass or plastic of appropriate volume.
2.3.11 Sterile 100 mm x 15 mm petri
dishes, glass or plastic.
66
MICROBIOLOGICAL MANUAL 1978
image:
 STEP 1
STEP 2
STEP 3
FIGURE II-C-5. Suggested Pattern for Preparing a Streak Plate,
ISOLATION AND ENUMERATION
67
image:
STEP 1
STEP 2
STEP 3
FIGURE II-C-5. Suggested Pattern for Preparing a Streak Plate,
ISOLATION AND ENUMERATION
67
image:
 2.3.12 Dilution (milk dilution) bottles, py-
rex, marked at 99 ml volume, screw-cap with
neoprene rubber liner.
2.3.13 Bunsen/Fishertype burner or elec-
tric incinerator.
2.4 Media
2.4.1 Sterile agar medium dispensed in
bulk quantities in screwcapped bottles or
flasks.
2.4.2 Sterile dilution water in bottles con-
taining 99 ± 2 ml volumes.
2.5 Streak Plate Procedures
2.5.1 Melt the nonselective agar, such as
nutrient agar or Trypticase soy agar, temper at
44-46 C, and add about 15 ml agar to each
sterile petri dish. Allow to harden and dry for
bast results in streaking.
2.5.2 Bend an inoculation needle or loop
at an angle about 1 cm from the needle tip to
prevent cutting of the agar during streaking.
Sterilize the needle by heating it to redness in
a flame, and air-cool.
2.5.3 Remove screw cap and pick a small
amount of growth from an isolated colony or
from a mass of growth.
2.5.4 Draw the needle containing the
bacteria back and forth across the surface of a
previously-poured and hardened agar plate in
a specific pattern, such as shown in Figure II-C-
5. Streak 1/3-1/2 of the agar surface. Flame
and cool needle after each step and inoculate
plate further by drawing the needle across the
area previously streaked.
2.5.5 Rotate the plate one quarter turn
clockwise as each step is completed to make
the streaking easier. Streaking patterns other
than the model shown in Figure ll-C-5 can be
used; the objective is simply to deposit fewer
and fewer cells along the streak until single
cells are deposited on the agar surface. After
incubation, these cells will develop into well-
separated pure colonies of bacteria, each theo-
retically arising from a single bacterium.
2.5.6 After streaking, incubate the petri
dishes at 35 C for 24 hours (or other appropri-
ate conditions) in an inverted position to pre-
vent condensation of water on the agar sur-
face. Moisture interferes with development of
isolated colonies by spreading bacterial
growth over the agar surface.
2.5.7 For further purification, examine
plates after incubation for single, well-isolated
colonies. Pick typical colonies using a sterile
inoculating needle, suspend cells in dilution
water, and restreak on an agar plate, repeating
steps 2.5.2-2.5.6. Isolated, single colonies
from a plate containing like colonies may be
considered to be pure.
2.5.8 Streaking may also be done on se-
lective media, such as Endo or EMB agars or on
selective/differential media e.g.} in Salmonella
testing.
2.6 Pour Plate Procedure
2.6.1 Shake the sample bottle vigorously
about 25 times to disperse the bacteria. Dur-
ing shaking, close cap tightly to prevent leak-
age of sample and the danger of
contamination.
2.6.2 Using a 1.1 ml bacteriological pipet,
prepare the initial dilution by pipeting 1 ml of
the sample into a 99 ml dilution water blank.
This initial dilution represents a 10~2 dilution
(see this Section, 1.4, Dilution of Samples).
2.6.3 Using the same pipet transfer 0.1
and 1.0 ml from the undiluted sample to two
separate petri dishes.
2.6.4 Shake the 1:100 dilution bottle
vigorously again and pipet 0.1 and 1.0 ml of
the 1:100 dilution into two petri dishes using
another sterile 1.1 ml pipet.
2.6.5 Pour aseptically 12-15 ml of the
melted agar medium cooled to 44-46 C into
each petri dish. Mix agar and inoculum by
rotation, being careful to prevent spillover of
68
MICROBIOLOGICAL MANUAL 1978
image:
2.3.12 Dilution (milk dilution) bottles, py-
rex, marked at 99 ml volume, screw-cap with
neoprene rubber liner.
2.3.13 Bunsen/Fishertype burner or elec-
tric incinerator.
2.4 Media
2.4.1 Sterile agar medium dispensed in
bulk quantities in screwcapped bottles or
flasks.
2.4.2 Sterile dilution water in bottles con-
taining 99 ± 2 ml volumes.
2.5 Streak Plate Procedures
2.5.1 Melt the nonselective agar, such as
nutrient agar or Trypticase soy agar, temper at
44-46 C, and add about 15 ml agar to each
sterile petri dish. Allow to harden and dry for
bast results in streaking.
2.5.2 Bend an inoculation needle or loop
at an angle about 1 cm from the needle tip to
prevent cutting of the agar during streaking.
Sterilize the needle by heating it to redness in
a flame, and air-cool.
2.5.3 Remove screw cap and pick a small
amount of growth from an isolated colony or
from a mass of growth.
2.5.4 Draw the needle containing the
bacteria back and forth across the surface of a
previously-poured and hardened agar plate in
a specific pattern, such as shown in Figure II-C-
5. Streak 1/3-1/2 of the agar surface. Flame
and cool needle after each step and inoculate
plate further by drawing the needle across the
area previously streaked.
2.5.5 Rotate the plate one quarter turn
clockwise as each step is completed to make
the streaking easier. Streaking patterns other
than the model shown in Figure ll-C-5 can be
used; the objective is simply to deposit fewer
and fewer cells along the streak until single
cells are deposited on the agar surface. After
incubation, these cells will develop into well-
separated pure colonies of bacteria, each theo-
retically arising from a single bacterium.
2.5.6 After streaking, incubate the petri
dishes at 35 C for 24 hours (or other appropri-
ate conditions) in an inverted position to pre-
vent condensation of water on the agar sur-
face. Moisture interferes with development of
isolated colonies by spreading bacterial
growth over the agar surface.
2.5.7 For further purification, examine
plates after incubation for single, well-isolated
colonies. Pick typical colonies using a sterile
inoculating needle, suspend cells in dilution
water, and restreak on an agar plate, repeating
steps 2.5.2-2.5.6. Isolated, single colonies
from a plate containing like colonies may be
considered to be pure.
2.5.8 Streaking may also be done on se-
lective media, such as Endo or EMB agars or on
selective/differential media e.g.} in Salmonella
testing.
2.6 Pour Plate Procedure
2.6.1 Shake the sample bottle vigorously
about 25 times to disperse the bacteria. Dur-
ing shaking, close cap tightly to prevent leak-
age of sample and the danger of
contamination.
2.6.2 Using a 1.1 ml bacteriological pipet,
prepare the initial dilution by pipeting 1 ml of
the sample into a 99 ml dilution water blank.
This initial dilution represents a 10~2 dilution
(see this Section, 1.4, Dilution of Samples).
2.6.3 Using the same pipet transfer 0.1
and 1.0 ml from the undiluted sample to two
separate petri dishes.
2.6.4 Shake the 1:100 dilution bottle
vigorously again and pipet 0.1 and 1.0 ml of
the 1:100 dilution into two petri dishes using
another sterile 1.1 ml pipet.
2.6.5 Pour aseptically 12-15 ml of the
melted agar medium cooled to 44-46 C into
each petri dish. Mix agar and inoculum by
rotation, being careful to prevent spillover of
68
MICROBIOLOGICAL MANUAL 1978
image:
 agar. One recommended technique uses a se-
quence of five rotations to the left, five to the
right and five forward and backward. Allow the
agar to solidify on a level surface.
2.6.6 Invert the dishes and incubate at the
specific temperature and time. After incuba-
tion, well-isolated surface and subsurface colo-
nies should develop in some of the plates.
2.6.7 When the pour plate technique is
used quantitatively, count plates containing
between 30 and 300 colonies. This is the
technique used in the Standard Plate Count
Method described in Part III-A. Pour plate
counts are reported as the count per ml.
Count/ml =
Sum of Plate Counts
Total Volume of Sample in ml
2.7 Spread Plate Procedure
2.7.1 Prepare the appropriate melted
agar. Pour about 15 ml of the melted agar into
each 100 mm petri dish. Keep covers opened
slightly until agars have hardened and mois-
ture or condensation have evaporated. Close
dishes and store in refrigerator. Warm at room
temperature before use.
2.7.2 Prepare a series of dilutions based
upon the estimated concentration of bacteria
so that 0.1-0.5 ml of inoculum will give a
20-200 count (equivalent to a 40-2000
count/ml in the diluted sample). The dilutions
should bracket the estimated density of
bacteria. The analyst must remember that if
only 0.1 ml volume is tested, it must be plated
on the agar plate marked with the next higher
dilution; for example, 0.1 ml of the 10~~1
dilution onto the surface of the plate marked
10~2. Inoculate agar plates.
2.7.3 Remove the glass spreader from al-
cohol and flame. Cool for 15 seconds. Test
glass rod on edge of agar to verify safe temper-
ature before use. This step can be simplified by
making and sterilizing a number of glass
spreaders.
2.7,4 Place cool glass spreader on agar
surface next to inoculum. Position spreader so
that the tip forms a radius from the center to
the plate edge. Holding spreader motionless,
rotate plate several revolutions, or hold plate
and move the spreader in a series of sweeping
arcs. The purpose is to spread the inoculum
uniformly over the entire surf ace of the agar.
2.7.5 Lift the glass spreader from the agar
and place in alcohol solution. Cover plate par-
tially, leaving open slightly to evaporate excess
moisture for 15-30 minutes.
2.7.6 When agar surfaces are dry, close
dishes, invert them and incubate as required
for the specific test.
2.7.7 After incubation at the proper time
and temperature, isolated surface colonies
should develop in one or more dilutions within
the acceptable counting range of 20-200 col-
lonies. The maximum recommended number of
colonies/spread plate is fewer than for other
plate techniques because surface colonies are
larger than subsurface colonies and crowding
can result at lower count levels.
2.7.8 Count the colonies by normal tech-
niques and report on a count/ml or count/100
ml basis dependent on the use of the data.
2.8 Reporting Results
^•8- 1 Significant Figures: To prevent false
precision in the reporting of counts, the plate
counts must be limited to the digit(s) known
definitely plus one digit which is in doubt.
These combined digits are termed the Signifi-
cant Figures (S.F.).
(a) For example, if an analyst reports a
plate count of 124 to three significant figures
he is indicating that he is certain of the first
two digits, 1 and 2, but is uncertain whether
the last digit is 3, 4 or 5. If the analyst were
reporting that same number to two significant
figures, he would report the first figures, 1, as
certain, the second figure, 2, as uncertain, and
the third figure, 4, as unknown. Hence he
would report it as 120, inserting the zero only
as a spacer. Large counts of 1200, 12,000 and
ISOLATION AND ENUMERATION
69
image:
agar. One recommended technique uses a se-
quence of five rotations to the left, five to the
right and five forward and backward. Allow the
agar to solidify on a level surface.
2.6.6 Invert the dishes and incubate at the
specific temperature and time. After incuba-
tion, well-isolated surface and subsurface colo-
nies should develop in some of the plates.
2.6.7 When the pour plate technique is
used quantitatively, count plates containing
between 30 and 300 colonies. This is the
technique used in the Standard Plate Count
Method described in Part III-A. Pour plate
counts are reported as the count per ml.
Count/ml =
Sum of Plate Counts
Total Volume of Sample in ml
2.7 Spread Plate Procedure
2.7.1 Prepare the appropriate melted
agar. Pour about 15 ml of the melted agar into
each 100 mm petri dish. Keep covers opened
slightly until agars have hardened and mois-
ture or condensation have evaporated. Close
dishes and store in refrigerator. Warm at room
temperature before use.
2.7.2 Prepare a series of dilutions based
upon the estimated concentration of bacteria
so that 0.1-0.5 ml of inoculum will give a
20-200 count (equivalent to a 40-2000
count/ml in the diluted sample). The dilutions
should bracket the estimated density of
bacteria. The analyst must remember that if
only 0.1 ml volume is tested, it must be plated
on the agar plate marked with the next higher
dilution; for example, 0.1 ml of the 10~~1
dilution onto the surface of the plate marked
10~2. Inoculate agar plates.
2.7.3 Remove the glass spreader from al-
cohol and flame. Cool for 15 seconds. Test
glass rod on edge of agar to verify safe temper-
ature before use. This step can be simplified by
making and sterilizing a number of glass
spreaders.
2.7,4 Place cool glass spreader on agar
surface next to inoculum. Position spreader so
that the tip forms a radius from the center to
the plate edge. Holding spreader motionless,
rotate plate several revolutions, or hold plate
and move the spreader in a series of sweeping
arcs. The purpose is to spread the inoculum
uniformly over the entire surf ace of the agar.
2.7.5 Lift the glass spreader from the agar
and place in alcohol solution. Cover plate par-
tially, leaving open slightly to evaporate excess
moisture for 15-30 minutes.
2.7.6 When agar surfaces are dry, close
dishes, invert them and incubate as required
for the specific test.
2.7.7 After incubation at the proper time
and temperature, isolated surface colonies
should develop in one or more dilutions within
the acceptable counting range of 20-200 col-
lonies. The maximum recommended number of
colonies/spread plate is fewer than for other
plate techniques because surface colonies are
larger than subsurface colonies and crowding
can result at lower count levels.
2.7.8 Count the colonies by normal tech-
niques and report on a count/ml or count/100
ml basis dependent on the use of the data.
2.8 Reporting Results
^•8- 1 Significant Figures: To prevent false
precision in the reporting of counts, the plate
counts must be limited to the digit(s) known
definitely plus one digit which is in doubt.
These combined digits are termed the Signifi-
cant Figures (S.F.).
(a) For example, if an analyst reports a
plate count of 124 to three significant figures
he is indicating that he is certain of the first
two digits, 1 and 2, but is uncertain whether
the last digit is 3, 4 or 5. If the analyst were
reporting that same number to two significant
figures, he would report the first figures, 1, as
certain, the second figure, 2, as uncertain, and
the third figure, 4, as unknown. Hence he
would report it as 120, inserting the zero only
as a spacer. Large counts of 1200, 12,000 and
ISOLATION AND ENUMERATION
69
image:
 12,000,000 only contain two significant fig-
ures. Of course, zeros can be significant in
counts of 10,60,105, etc.
(b) In plate count and MF methods, the
number of significant digits which can be re-
ported are dictated by the' method itself as
follows: within the acceptable counting range
of the method itself, i.e., 20-60, 20-80,
20-100 or 30-300 the actual number of colo-
nies observed is the best estimate of the true
density. The number of significant figures are
equal to the number of colonies.
TABLE ll-C-2
Number of Significant •
Figures (S.F.) Reported
Actual
Colony
Count
Pour Plate/
Spread Plate
Method
Membrane
Filtration
Method
1-9 1 S.F.
10-99 2 S.F.
100 - 300 3 S.F.
1 S.F.
2 S.F.
2.8.2 Rounding Off Counts: Since plate
counts must be limited to the number of signifi-
cant figures obtainable by the method, the
non-zero number which is not significant
should be treated by the standard scientific
convention:
(a) If the insignificant digit is less than five,
replace it with a zero, e.g., 3530 becomes
3500.
(b) If the insignificant digit is five, round
the preceding significant digit to the nearest
even number, e.g., with two S.F., 3450 be-
comes 3400, and 3550 becomes 3600.
(c) If the insignificant digit is greater than
five, drop the digit and increase the preceding
significant number by one, e.g., 3480 be-
comes 3500.
3. Membrane Filtration Method
3.1 Summary: The membrane filter
method provides a direct count of bacterial
colonies on the surface of the filter. The
sample is filtered as soon as possible after
collection. After the sample is filtered, the
membrane filter is placed on a nutrient
medium formulated to encourage growth of
the bacteria for which the.test is designed and
toouppressthegrowthofothermicroorganisms.
After incubation under the specified
conditions, the bacteria retained on the
surface of the membrane develop into visible
colonies. The medium and the temperature of
incubation influence the kinds and
appearance of bacteria that develop. Two-step
enrichment and delayed incubation MF
procedures can also be used. The two-step
procedure involves an acclimation period on
another medium before the selective growth
step.
3.2 Scope and Application
Membrane filter methods are preferred
over MPN or other techniques, where applica-
ble because of the following advantages.
3.2.1 Advantages
(a) One of the primary advantages of this
method is its speed. Definitive results for total
and fecal coliforms can be obtained in 22-26
hours, whereas 48-96 hours are required for
the multiple-tube fermentation method.
(b) Considerably larger, more representa-
tive water samples can be examined than with
the. MPN. With waters of low bacterial densi-
ties such as finished waters, larger sample
aliquots can be used to enhance the reliability
of the results.
(c) The precision is greater with the MF than
the multiple-tube technique becausetheformer
makes a direct count of colonies/unit volume.
(d)The method represents savings in time,
labor, space, supplies and equipment.
(e) Because of its portability, this proce-
dure is also very practical for field studies.
70
SERA MICROBIOLOGICAL MANUAL 1978
image:
12,000,000 only contain two significant fig-
ures. Of course, zeros can be significant in
counts of 10,60,105, etc.
(b) In plate count and MF methods, the
number of significant digits which can be re-
ported are dictated by the' method itself as
follows: within the acceptable counting range
of the method itself, i.e., 20-60, 20-80,
20-100 or 30-300 the actual number of colo-
nies observed is the best estimate of the true
density. The number of significant figures are
equal to the number of colonies.
TABLE ll-C-2
Number of Significant •
Figures (S.F.) Reported
Actual
Colony
Count
Pour Plate/
Spread Plate
Method
Membrane
Filtration
Method
1-9 1 S.F.
10-99 2 S.F.
100 - 300 3 S.F.
1 S.F.
2 S.F.
2.8.2 Rounding Off Counts: Since plate
counts must be limited to the number of signifi-
cant figures obtainable by the method, the
non-zero number which is not significant
should be treated by the standard scientific
convention:
(a) If the insignificant digit is less than five,
replace it with a zero, e.g., 3530 becomes
3500.
(b) If the insignificant digit is five, round
the preceding significant digit to the nearest
even number, e.g., with two S.F., 3450 be-
comes 3400, and 3550 becomes 3600.
(c) If the insignificant digit is greater than
five, drop the digit and increase the preceding
significant number by one, e.g., 3480 be-
comes 3500.
3. Membrane Filtration Method
3.1 Summary: The membrane filter
method provides a direct count of bacterial
colonies on the surface of the filter. The
sample is filtered as soon as possible after
collection. After the sample is filtered, the
membrane filter is placed on a nutrient
medium formulated to encourage growth of
the bacteria for which the.test is designed and
toouppressthegrowthofothermicroorganisms.
After incubation under the specified
conditions, the bacteria retained on the
surface of the membrane develop into visible
colonies. The medium and the temperature of
incubation influence the kinds and
appearance of bacteria that develop. Two-step
enrichment and delayed incubation MF
procedures can also be used. The two-step
procedure involves an acclimation period on
another medium before the selective growth
step.
3.2 Scope and Application
Membrane filter methods are preferred
over MPN or other techniques, where applica-
ble because of the following advantages.
3.2.1 Advantages
(a) One of the primary advantages of this
method is its speed. Definitive results for total
and fecal coliforms can be obtained in 22-26
hours, whereas 48-96 hours are required for
the multiple-tube fermentation method.
(b) Considerably larger, more representa-
tive water samples can be examined than with
the. MPN. With waters of low bacterial densi-
ties such as finished waters, larger sample
aliquots can be used to enhance the reliability
of the results.
(c) The precision is greater with the MF than
the multiple-tube technique becausetheformer
makes a direct count of colonies/unit volume.
(d)The method represents savings in time,
labor, space, supplies and equipment.
(e) Because of its portability, this proce-
dure is also very practical for field studies.
70
SERA MICROBIOLOGICAL MANUAL 1978
image:
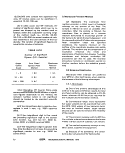 3.2.2 Limitations: Although the majority of
water samples can be tested by membrane
filtration, there are limitations with certain
samples and some problems with membrane
filters themselves.
(a) Some samples contain large quantities
of colloidal materials or suspended solids such
as iron, manganese or alum floes or clay (1).
Other samples may contain algae. These
substances can clog the filter pores and
prevent filtration or can cause the
development of spreading bacterial colonies.
When the bacterial counts of such samples are
high, a smaller volume or a higher sample
dilution can be used to minimize the effect of
sample turbidity. The membrane filter method
may be used with samples containing turbidity
by filtration of several smaller replicate sample
volumes and compositing the results.
However, with waters of high turbidity and low
bacterial count, the membrane filter method
may not be applicable. In the latter situation
the multiple-tube procedure should be used.
(b) Large non-specific populations may
mask the appearance of indicators on selective
media such as M-Endo MF medium (4).
(c) Industrial wastewaters may contain
zinc, copper, or other heavy metallic com-
pounds (2) which adsorb onto the membrane
surface and interfere with subsequent bacterial
development (1, 2, 3).
(d) MF analyses require preparation of
MPN tubed media for verification.
(e) Inhibition may result in seawater or
from toxic materials such as chlorine or
phenols.
(f) Indicator organisms stressed in the en-
vironment may be poorly recovered (5).
3.3 Apparatus and Materials
3.3.1 Incubator set at 35 ± O.5 C for total
coliform-test (Part III-B) and fecal streptococci
test (Part III-D).
3.3.2 Water bath or other type of incuba-
tors such as the aluminum heat sink incubator,
or equivalent, set at 44.5 ± 0.2 C for fecal
coliform test (Part ill-C).
3.3.3 Stereoscopic microscope, with mag-
nification of 10-15 X, wide-field type.
3.3.4 A microscope lamp producing dif-
fuse light from cool, white fluorescent lamps
adjusted to give maximum color or sheen
appearance.
3.3.5 Hand tally.
3.3.6 Pipet container of stainless steel,
aluminum or pyrex glass for glass pipets.
3.3.7 Graduated cylinders covered with
aluminum foil or kraft paper and sterilized.
3.3.8 Membrane filtration units (filter base
and funnel), glass, plastic or stainless steel, see
Figure ll-C-6. These are wrapped with alumi-
num foil or kraft paper and sterilized. See Fig-
ure ll-C-7 for an exploded view of a stainless
steel MF assembly and filter.
3.3.9 Ultraviolet sterilizer for the filter fun-
nel is optional (6).
3.3.10 Line vacuum, electric vacuum
pump or aspirator is used as a vacuum source.
in an emergency or in the field, a hand pump or
a syringe can be used. Such vacuum-
producing devices should be equipped with a
check valve to prevent the return flow of air.
3.3.11 Vacuum filter flask, usually 1 liter,
with appropriate tubing. Filter manifolds to
hold a number of filter bases are optional.
3.3.12 Safety trap flask placed between
the filter flask and the vacuum source.
3.3.13 Forceps, straight or curved, with
smooth tips to permit easy handling of filters
without damage.
3.3.14 Alcohol, ethanol or methanol, in
small wide mouthed vials, for sterilizing
forceps.
ISOLATION AND ENUMERATION
71
image:
3.2.2 Limitations: Although the majority of
water samples can be tested by membrane
filtration, there are limitations with certain
samples and some problems with membrane
filters themselves.
(a) Some samples contain large quantities
of colloidal materials or suspended solids such
as iron, manganese or alum floes or clay (1).
Other samples may contain algae. These
substances can clog the filter pores and
prevent filtration or can cause the
development of spreading bacterial colonies.
When the bacterial counts of such samples are
high, a smaller volume or a higher sample
dilution can be used to minimize the effect of
sample turbidity. The membrane filter method
may be used with samples containing turbidity
by filtration of several smaller replicate sample
volumes and compositing the results.
However, with waters of high turbidity and low
bacterial count, the membrane filter method
may not be applicable. In the latter situation
the multiple-tube procedure should be used.
(b) Large non-specific populations may
mask the appearance of indicators on selective
media such as M-Endo MF medium (4).
(c) Industrial wastewaters may contain
zinc, copper, or other heavy metallic com-
pounds (2) which adsorb onto the membrane
surface and interfere with subsequent bacterial
development (1, 2, 3).
(d) MF analyses require preparation of
MPN tubed media for verification.
(e) Inhibition may result in seawater or
from toxic materials such as chlorine or
phenols.
(f) Indicator organisms stressed in the en-
vironment may be poorly recovered (5).
3.3 Apparatus and Materials
3.3.1 Incubator set at 35 ± O.5 C for total
coliform-test (Part III-B) and fecal streptococci
test (Part III-D).
3.3.2 Water bath or other type of incuba-
tors such as the aluminum heat sink incubator,
or equivalent, set at 44.5 ± 0.2 C for fecal
coliform test (Part ill-C).
3.3.3 Stereoscopic microscope, with mag-
nification of 10-15 X, wide-field type.
3.3.4 A microscope lamp producing dif-
fuse light from cool, white fluorescent lamps
adjusted to give maximum color or sheen
appearance.
3.3.5 Hand tally.
3.3.6 Pipet container of stainless steel,
aluminum or pyrex glass for glass pipets.
3.3.7 Graduated cylinders covered with
aluminum foil or kraft paper and sterilized.
3.3.8 Membrane filtration units (filter base
and funnel), glass, plastic or stainless steel, see
Figure ll-C-6. These are wrapped with alumi-
num foil or kraft paper and sterilized. See Fig-
ure ll-C-7 for an exploded view of a stainless
steel MF assembly and filter.
3.3.9 Ultraviolet sterilizer for the filter fun-
nel is optional (6).
3.3.10 Line vacuum, electric vacuum
pump or aspirator is used as a vacuum source.
in an emergency or in the field, a hand pump or
a syringe can be used. Such vacuum-
producing devices should be equipped with a
check valve to prevent the return flow of air.
3.3.11 Vacuum filter flask, usually 1 liter,
with appropriate tubing. Filter manifolds to
hold a number of filter bases are optional.
3.3.12 Safety trap flask placed between
the filter flask and the vacuum source.
3.3.13 Forceps, straight or curved, with
smooth tips to permit easy handling of filters
without damage.
3.3.14 Alcohol, ethanol or methanol, in
small wide mouthed vials, for sterilizing
forceps.
ISOLATION AND ENUMERATION
71
image:
 FIGURE ll-C-6. Membrane Filtration Units Made by Various Manufacturers
for Detection of Bacteria in Aqueous Suspensions.
72
•&EFA MICROBIOLOGICAL MANUAL 1978
image:
FIGURE ll-C-6. Membrane Filtration Units Made by Various Manufacturers
for Detection of Bacteria in Aqueous Suspensions.
72
•&EFA MICROBIOLOGICAL MANUAL 1978
image:
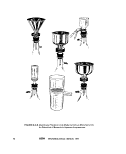 Funnel
Locking King
Membrane Pilfer
Membrane Filter
Support Screen
Filter Base with
Bayonet Joint
Stopper
FIGURE ll-C-7. Exploded View of a Stainless Steel Membrane Filtration Unit.
ISOLATION AND ENUMERATION
73
image:
Funnel
Locking King
Membrane Pilfer
Membrane Filter
Support Screen
Filter Base with
Bayonet Joint
Stopper
FIGURE ll-C-7. Exploded View of a Stainless Steel Membrane Filtration Unit.
ISOLATION AND ENUMERATION
73
image:
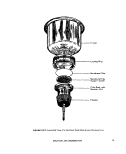 3.3.15 Bunsen or Fisher type burner or
electric incinerator unit.
3.3,16 Sterile T.D. bacteriological or Mohr
pipets, glass or plastic, of appropriate volume.
3.3.17 Sterile petri dishes, 50 x 12 mm,
with tight-fitting lids and 60 x 15 mm, with
loose-fitting lids glass or plastic.
3.3.18 Dilution bottles (milk dilution)
pyrex, marked at 99 ml, screw-cap with
neoprene liners.
3.3.19 Membrane filters, white, grid
marked, 47 mm diameter, with 0.45 um ± .02
um pore size or other pore size recommended
by the manufacturer for water analyses.
3.3.20 Absorbent pads of cellulosic
paper, 47 mm diameter. The paper should be
of high quality and free of sulfites or other
substances that could inhibit bacterial growth.
3.3.21 Waterproof plastic bags.
3.3.22 Inoculation loops, at least 3 mm
diameter, or needles, nichrome or platinum
wire, 26 B&S gauge, in suitable holder. Dispos-
able applicator sticks or plastic loops as alter-
natives to inoculation loops.
3.3.23 Media: Media required for a spe-
cific test should be prepared in pre-sterilized
erlenmeyer flasks with metal caps, aluminum
foil covers, or screw caps.
3.3.24 Dilution Water
(a) Sterile buffered or peptone dilution
water dispensed in 99 j^ 2 ml amounts in
screw-capped dilution bottles.
(b) Sterile dilution water prepared in larger
volumes for wetting membranes before addi-
tion of the sample and for rinsing the funnel
after sample filtration.
3.4 Procedure
3.4.1 Prepare the required media as out-
lined in Part II-B. If the medium is an agar, cool
to room temperature. Use sterile forceps for
manipulation of absorbent pads and mem-
brane filters, contacting the outer edges only,
to avoid touching the filtering area or damag-
ing the membrane filter surface. Sterilize for-
ceps by immersing the tips in ethanol and
flaming. Place absorbent pad in bottom of 50
or 6O mm petri dish. Add 1.8-2.0 ml broth to
the sterile absorbent pad. Saturate but do not
flood the pad. Tip the petri dish to drain off
excess, if agar medium is used, add about 5-6
ml (to a depth of 2-3 mm) in the petri dish.
3.4.2 Arrange petri dishes in rows accord-
ing to the dilution series. Mark each dish to
identify the sample, volume or dilution to be
filtered.
3.4.3 Using sterile forceps, place a mem-
brane filter, grid-side up, on the porous plate of
the filter base.
3.4.4 Attach the funnel to the base of the
filter unit, taking care not to damage or dis-
lodge the filter. The membrane filter is now
fitted between the funnel and the base.
3.4.5 Shake the sample container vigor-
ously about 25 times.
3.4.6 Prepare at least three sample incre-
ments according to 1,4.3, in this Section.
Measure the desired volume of sample into the
funnel with the vacuum turned off. To measure
the sample accurately and to obtain good distri-
bution of colonies on the filter surface, the
following methods are recommended:
(a) Sample volumes of 20 ml or more:
Measure the sample in a sterile graduated cyl-
inder and pour it into the funnel. Rinse the
graduate twice with sterile dilution water, and
add the rinse water to the funnel. For potable
waters, 100 ml volumes may be measured
directly in a precalibrated funnel.
(b) Sample volumes of 10-20 ml: Measure
the sample with a sterile 10 ml or 20 ml pipet
into the funnel.
(c) Sample volumes of < 10 ml: Pour about
10 ml of sterile dilution water into the funnel
and add the sample to the sterile water using
appropriate sterile pipet.
74
MICROBIOLOGICAL MANUAL 1978
image:
3.3.15 Bunsen or Fisher type burner or
electric incinerator unit.
3.3,16 Sterile T.D. bacteriological or Mohr
pipets, glass or plastic, of appropriate volume.
3.3.17 Sterile petri dishes, 50 x 12 mm,
with tight-fitting lids and 60 x 15 mm, with
loose-fitting lids glass or plastic.
3.3.18 Dilution bottles (milk dilution)
pyrex, marked at 99 ml, screw-cap with
neoprene liners.
3.3.19 Membrane filters, white, grid
marked, 47 mm diameter, with 0.45 um ± .02
um pore size or other pore size recommended
by the manufacturer for water analyses.
3.3.20 Absorbent pads of cellulosic
paper, 47 mm diameter. The paper should be
of high quality and free of sulfites or other
substances that could inhibit bacterial growth.
3.3.21 Waterproof plastic bags.
3.3.22 Inoculation loops, at least 3 mm
diameter, or needles, nichrome or platinum
wire, 26 B&S gauge, in suitable holder. Dispos-
able applicator sticks or plastic loops as alter-
natives to inoculation loops.
3.3.23 Media: Media required for a spe-
cific test should be prepared in pre-sterilized
erlenmeyer flasks with metal caps, aluminum
foil covers, or screw caps.
3.3.24 Dilution Water
(a) Sterile buffered or peptone dilution
water dispensed in 99 j^ 2 ml amounts in
screw-capped dilution bottles.
(b) Sterile dilution water prepared in larger
volumes for wetting membranes before addi-
tion of the sample and for rinsing the funnel
after sample filtration.
3.4 Procedure
3.4.1 Prepare the required media as out-
lined in Part II-B. If the medium is an agar, cool
to room temperature. Use sterile forceps for
manipulation of absorbent pads and mem-
brane filters, contacting the outer edges only,
to avoid touching the filtering area or damag-
ing the membrane filter surface. Sterilize for-
ceps by immersing the tips in ethanol and
flaming. Place absorbent pad in bottom of 50
or 6O mm petri dish. Add 1.8-2.0 ml broth to
the sterile absorbent pad. Saturate but do not
flood the pad. Tip the petri dish to drain off
excess, if agar medium is used, add about 5-6
ml (to a depth of 2-3 mm) in the petri dish.
3.4.2 Arrange petri dishes in rows accord-
ing to the dilution series. Mark each dish to
identify the sample, volume or dilution to be
filtered.
3.4.3 Using sterile forceps, place a mem-
brane filter, grid-side up, on the porous plate of
the filter base.
3.4.4 Attach the funnel to the base of the
filter unit, taking care not to damage or dis-
lodge the filter. The membrane filter is now
fitted between the funnel and the base.
3.4.5 Shake the sample container vigor-
ously about 25 times.
3.4.6 Prepare at least three sample incre-
ments according to 1,4.3, in this Section.
Measure the desired volume of sample into the
funnel with the vacuum turned off. To measure
the sample accurately and to obtain good distri-
bution of colonies on the filter surface, the
following methods are recommended:
(a) Sample volumes of 20 ml or more:
Measure the sample in a sterile graduated cyl-
inder and pour it into the funnel. Rinse the
graduate twice with sterile dilution water, and
add the rinse water to the funnel. For potable
waters, 100 ml volumes may be measured
directly in a precalibrated funnel.
(b) Sample volumes of 10-20 ml: Measure
the sample with a sterile 10 ml or 20 ml pipet
into the funnel.
(c) Sample volumes of < 10 ml: Pour about
10 ml of sterile dilution water into the funnel
and add the sample to the sterile water using
appropriate sterile pipet.
74
MICROBIOLOGICAL MANUAL 1978
image:
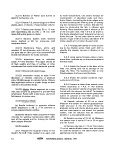 (d) Sample volumes of less than 0.1 ml:
Prepare appropriate dilutions in sterile dilution
water and proceed as applicable in steps (b) or
(c) above.
(e) The time elapsing between preparation
of sample dilutions and filtration should be
minimal and never more than 30 minutes.
3.4.7 Turn on the vacuum to filter the
sample. Leave the vacuum on and rinse down
the funnel walls at least twice with 20-30 ml of
sterile dilution water. Turn off vacuum.
3.4.8 Remove the funnel from the base of
the filter unit. An ultraviolet sterilizer unit can
be used to hold and sterilize the funnel be-
tween filtrations. At least 2 minutes exposure
time is required for funnel decontamination
(6). Protect eyes from UV irradiation with
glasses, goggles, or an enclosed UV chamber
(7).
3.4.9 Holding the membrane filter at its
edge with a sterilized forceps gently lift and
place the filter grid-side up in the culture dish.
Slide the filter onto the absorbent pad or agar,
using a rolling action to avoid trapping air
bubbles between the membrane filter and the
underlying pad or agar. Reseat the membrane
if non-wetted areas occur due to air bubbles.
3.4.10 Invert the petri dishes and incubate
at the appropriate temperature in an atmo-
sphere with close to 100% relative humidity
for the required time.
3.5 Counting Colonies: The grid lines are
used in counting the colonies.
3.5.1 Count the colonies for the parameter
of interest following a preset plan such as
shown in Figure ll-C-8. Some colonies will be in
contact with grid lines. A suggested procedure
to reduce error in counting these colonies is
shown in Figure ll-C-9. Count the colonies in
the squares indicated by the arrows.
3.5.2 The fluorescent lamp should be
nearly perpendicular to the membrane filter.
Count colonies individually, even if they are in
contact with each other. The technician must
learn to recognize the difference between two
or more colonies which have grown into con-
tact with each other and single, irregularly
shaped colonies which sometimes develop on
membrane filters. The latter colonies are usu-
ally associated with a fiber or paniculate ma-
terial and the colonies conform to the shape
and size of the fiber or particulates. Colonies
which have grown together almost invariably
show a very fine line of contact.
3.6 Calculation of Results: Select the
membrane filter with the number of colonies in
the acceptable range and calculate count per
100 ml according to the general formula:
count per 100 ml =
No. colonies counted
Volume of sample filtered, in ml
X 100
3.6.1 Counts Within the Acceptable Limits
(a) The acceptable range of colonies which
is countable on a membrane is a function of
the parameter as shown in Table ll-C-3.
(b) Assume that filtration of volumes of 50,
15, 5, 1.5, and 0.5 ml produced colony counts
of 200, 110,40, 10, 5, respectively.
(c) An analyst would not actually count the
colonies on all filters. By inspection he would
select the membrane filter(s) with 20-80 coli-
form colonies and then limit his actual count-
ing to such membranes.
(d) After selecting the best membrane
filter for counting, in this case the MF with a 40
colony count, the analyst counts colonies
according to the counting procedures in 3.6
and applies the general formula as follows:
Colonies per 100 ml =
40
5
X 100 = 800
ISOLATION AND ENUMERATION
75
image:
(d) Sample volumes of less than 0.1 ml:
Prepare appropriate dilutions in sterile dilution
water and proceed as applicable in steps (b) or
(c) above.
(e) The time elapsing between preparation
of sample dilutions and filtration should be
minimal and never more than 30 minutes.
3.4.7 Turn on the vacuum to filter the
sample. Leave the vacuum on and rinse down
the funnel walls at least twice with 20-30 ml of
sterile dilution water. Turn off vacuum.
3.4.8 Remove the funnel from the base of
the filter unit. An ultraviolet sterilizer unit can
be used to hold and sterilize the funnel be-
tween filtrations. At least 2 minutes exposure
time is required for funnel decontamination
(6). Protect eyes from UV irradiation with
glasses, goggles, or an enclosed UV chamber
(7).
3.4.9 Holding the membrane filter at its
edge with a sterilized forceps gently lift and
place the filter grid-side up in the culture dish.
Slide the filter onto the absorbent pad or agar,
using a rolling action to avoid trapping air
bubbles between the membrane filter and the
underlying pad or agar. Reseat the membrane
if non-wetted areas occur due to air bubbles.
3.4.10 Invert the petri dishes and incubate
at the appropriate temperature in an atmo-
sphere with close to 100% relative humidity
for the required time.
3.5 Counting Colonies: The grid lines are
used in counting the colonies.
3.5.1 Count the colonies for the parameter
of interest following a preset plan such as
shown in Figure ll-C-8. Some colonies will be in
contact with grid lines. A suggested procedure
to reduce error in counting these colonies is
shown in Figure ll-C-9. Count the colonies in
the squares indicated by the arrows.
3.5.2 The fluorescent lamp should be
nearly perpendicular to the membrane filter.
Count colonies individually, even if they are in
contact with each other. The technician must
learn to recognize the difference between two
or more colonies which have grown into con-
tact with each other and single, irregularly
shaped colonies which sometimes develop on
membrane filters. The latter colonies are usu-
ally associated with a fiber or paniculate ma-
terial and the colonies conform to the shape
and size of the fiber or particulates. Colonies
which have grown together almost invariably
show a very fine line of contact.
3.6 Calculation of Results: Select the
membrane filter with the number of colonies in
the acceptable range and calculate count per
100 ml according to the general formula:
count per 100 ml =
No. colonies counted
Volume of sample filtered, in ml
X 100
3.6.1 Counts Within the Acceptable Limits
(a) The acceptable range of colonies which
is countable on a membrane is a function of
the parameter as shown in Table ll-C-3.
(b) Assume that filtration of volumes of 50,
15, 5, 1.5, and 0.5 ml produced colony counts
of 200, 110,40, 10, 5, respectively.
(c) An analyst would not actually count the
colonies on all filters. By inspection he would
select the membrane filter(s) with 20-80 coli-
form colonies and then limit his actual count-
ing to such membranes.
(d) After selecting the best membrane
filter for counting, in this case the MF with a 40
colony count, the analyst counts colonies
according to the counting procedures in 3.6
and applies the general formula as follows:
Colonies per 100 ml =
40
5
X 100 = 800
ISOLATION AND ENUMERATION
75
image:
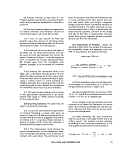 FIGURE ll-C-8, Colony-Counting Pathway, (The inner circle indicates the
effective filtering area, dashed line indicates the pathway.)
FIGURE ll-C-9. Enlarged Portion of Grid-Marked Square of Filter.
(Colonies are counted in squares indicated by the arrow.)
76
MICROBIOLOGICAL MANUAL 1978
image:
FIGURE ll-C-8, Colony-Counting Pathway, (The inner circle indicates the
effective filtering area, dashed line indicates the pathway.)
FIGURE ll-C-9. Enlarged Portion of Grid-Marked Square of Filter.
(Colonies are counted in squares indicated by the arrow.)
76
MICROBIOLOGICAL MANUAL 1978
image:
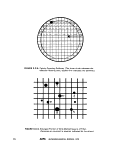 TABLE II-C-3
Acceptable Limits*
Parameters
Lower
Upper
Remarks
Total coliform bacteria
Fecal coliform bacteria
Fecal streptococci
20 (0 for potable waters)
20
20
80
60
100
Limit, 200 colonies
of all types
Colony counts < or > the limits cited above must be identified as outside of this range.
3.6.2 More Than One Acceptable Count
(a) If there are acceptable counts on repli-
cate plates, carry counts independently to final
reporting units, then calculate the arithmetic
mean of these counts to obtain the final re-
ported value.
For example, 1 ml volumes produce coli-
form counts of 26 and 36 or counts of 2600
and 3600/100 mi:
2600 + 3600
= 3100
and value
3100/100 ml
(b) If more than one dilution, indepen-
dently carry counts to final reporting units,
then average for final reported value.
For example, assume that volumes of 0.3,
0.1, 0.03 and 0.01 ml produced coliform colony
counts of TNTC (Too Numerous To Count), 75,
30 and 8, respectively. In this example, two
volumes, 0.1 and 0.03 produce colonies in
the acceptable counting range.
Independently carry each MF count to a
count per 100 ml:
— x 100 = 75,000/100 ml
0.1
30
0.03
Then calculate the arithmetic mean of these
counts to obtain the final reported value:
75,000 + 100.000
Report as: 88,000/100 ml.
3.6.3 If All MF Counts are Below the Lower
Limit, Select the Most Nea
Acceptable
Count (for non-potable waters)
For example, assume a count in which
sample volumes of 1,0.3 and .01 ml produced
colony counts of 14,3, and 0, respectively.
Here, no colony count falls within recom-
mended limits. Calculate on the basis of the
most nearly acceptable plate count, 14, and
report with a qualifying remark:
— x 100 = 1400
Report as: Estimated Count, 1400 per 100
X 100 =100,000/100 ml
ml.
3.6.4 If Counts from All Membranes are
Zero, Calculate Using Count from Largest Fil-
tration Volume
For example, sample volumes of 25, 10,
and 2 ml produced colony counts of 0, 0, and
0, respectively, and no actual calculation is
possible, even as an estimated report. Calcu-
late the number of colonies per 100 ml that
would have been reported if there had been
one colony on the filter representing the larg-
est filtration volume, thus:
J_ x 100 = 4
25
ISOLATION AND ENUMERATION
77
image:
TABLE II-C-3
Acceptable Limits*
Parameters
Lower
Upper
Remarks
Total coliform bacteria
Fecal coliform bacteria
Fecal streptococci
20 (0 for potable waters)
20
20
80
60
100
Limit, 200 colonies
of all types
Colony counts < or > the limits cited above must be identified as outside of this range.
3.6.2 More Than One Acceptable Count
(a) If there are acceptable counts on repli-
cate plates, carry counts independently to final
reporting units, then calculate the arithmetic
mean of these counts to obtain the final re-
ported value.
For example, 1 ml volumes produce coli-
form counts of 26 and 36 or counts of 2600
and 3600/100 mi:
2600 + 3600
= 3100
and value
3100/100 ml
(b) If more than one dilution, indepen-
dently carry counts to final reporting units,
then average for final reported value.
For example, assume that volumes of 0.3,
0.1, 0.03 and 0.01 ml produced coliform colony
counts of TNTC (Too Numerous To Count), 75,
30 and 8, respectively. In this example, two
volumes, 0.1 and 0.03 produce colonies in
the acceptable counting range.
Independently carry each MF count to a
count per 100 ml:
— x 100 = 75,000/100 ml
0.1
30
0.03
Then calculate the arithmetic mean of these
counts to obtain the final reported value:
75,000 + 100.000
Report as: 88,000/100 ml.
3.6.3 If All MF Counts are Below the Lower
Limit, Select the Most Nea
Acceptable
Count (for non-potable waters)
For example, assume a count in which
sample volumes of 1,0.3 and .01 ml produced
colony counts of 14,3, and 0, respectively.
Here, no colony count falls within recom-
mended limits. Calculate on the basis of the
most nearly acceptable plate count, 14, and
report with a qualifying remark:
— x 100 = 1400
Report as: Estimated Count, 1400 per 100
X 100 =100,000/100 ml
ml.
3.6.4 If Counts from All Membranes are
Zero, Calculate Using Count from Largest Fil-
tration Volume
For example, sample volumes of 25, 10,
and 2 ml produced colony counts of 0, 0, and
0, respectively, and no actual calculation is
possible, even as an estimated report. Calcu-
late the number of colonies per 100 ml that
would have been reported if there had been
one colony on the filter representing the larg-
est filtration volume, thus:
J_ x 100 = 4
25
ISOLATION AND ENUMERATION
77
image:
 Report as: < (Less than) 4 colonies per
100 ml.
3.6.5 if All Membrane Counts are Above
the Upper Limit, Calculate Count with Smallest
Volume Filtered
For example, assume that the volumes 1,
0.3, and 0.01 m! produced colony counts of
TNTC, 150, and 110 colonies. Since all colony
counts are above the recommended limit, use
the colony count from the smallest sample
volume filtered and estimate the count as:
X 100 = 1,100,000
Estimated Count
1,100,000 per 100 ml.
3.6.6 If Colonies are Too Numerous To
Count, Use Upper Limit Count with Smallest
Filtration Volume
Assume in Example 3.6.5 that the volumes
1.0, 0.3, and 0.01 ml, al[ produced too many
colonies to show separated colonies, and that
the laboratory bench record showed TNTC (Too
Numerous to Count).
Use 80 colonies (Upper Limit Count for
Total Coliform) as the basis of calculation with
the smallest filtration volume, thus:
80
0.01
X 100 = 800,000
Report as: > (Greater Than) 8000,000 per
100 mj.
3.6.7 If there is no result because of con-
fluency, lab accident, etc. Report as: No Result
and specify reason.
3.6.8 Reporting Results: Report bacterial
densities per 100 ml of sample. See Figure II-
C-1 and ll-C-3 for examples of forms for
reporting results,
3.7 Verification: A verified membrane fil-
ter test establishes the validity of colony differ-
entiation on a selective medium and provides
support evidence of colony interpretation.
3.7,1 A percent verification can be deter-
mined for any colony validation test:
No. of colonies meeting verification test
No. of colonies subjected to verification
X 100 = Percent verification
3.7.2 Verification is required for all posi-
tive samples from potable waters,
3.7.3 Verification is also recommended
for establishing quality control in research for
use with new test waters, new procedures or
new technicians, for identifying unusual col-
ony types and as support for data used in legal
actions.
3.7.4 The worker is cautioned not to apply
the percentage of verification determined for
one sample to other samples.
3.7.5 The careful worker may also pick
non-typical colonies and follow the verification
procedure to determine that false negative col-
onies do not occur.
3.8 Significant Figures: See 2.8.1.
3.9 Repeatability and Reproducibility of
Counts: Analysts should be able to duplicate
their own colony counts on the same mem-
brane within 5% and the counts of other ana-
lysts within 10%. Failure to agree within these
limits should trigger a review of procedures.
4. Most Probable Number (MPN) Method
4.1 Summary: The Most Probable Num-
ber procedure estimates the number of spe-
cific organisms in water and wastewater by
the use of probability tables.
Decimal dilutions of samples are inocu-
lated in series into liquid tube media. Positive
tests are indicated by growth and/or fermenta-
tive gas production. Bacterial densities are
based on combinations of positive and nega^
78
MICROBIOLOGICAL MANUAL 1978
image:
Report as: < (Less than) 4 colonies per
100 ml.
3.6.5 if All Membrane Counts are Above
the Upper Limit, Calculate Count with Smallest
Volume Filtered
For example, assume that the volumes 1,
0.3, and 0.01 m! produced colony counts of
TNTC, 150, and 110 colonies. Since all colony
counts are above the recommended limit, use
the colony count from the smallest sample
volume filtered and estimate the count as:
X 100 = 1,100,000
Estimated Count
1,100,000 per 100 ml.
3.6.6 If Colonies are Too Numerous To
Count, Use Upper Limit Count with Smallest
Filtration Volume
Assume in Example 3.6.5 that the volumes
1.0, 0.3, and 0.01 ml, al[ produced too many
colonies to show separated colonies, and that
the laboratory bench record showed TNTC (Too
Numerous to Count).
Use 80 colonies (Upper Limit Count for
Total Coliform) as the basis of calculation with
the smallest filtration volume, thus:
80
0.01
X 100 = 800,000
Report as: > (Greater Than) 8000,000 per
100 mj.
3.6.7 If there is no result because of con-
fluency, lab accident, etc. Report as: No Result
and specify reason.
3.6.8 Reporting Results: Report bacterial
densities per 100 ml of sample. See Figure II-
C-1 and ll-C-3 for examples of forms for
reporting results,
3.7 Verification: A verified membrane fil-
ter test establishes the validity of colony differ-
entiation on a selective medium and provides
support evidence of colony interpretation.
3.7,1 A percent verification can be deter-
mined for any colony validation test:
No. of colonies meeting verification test
No. of colonies subjected to verification
X 100 = Percent verification
3.7.2 Verification is required for all posi-
tive samples from potable waters,
3.7.3 Verification is also recommended
for establishing quality control in research for
use with new test waters, new procedures or
new technicians, for identifying unusual col-
ony types and as support for data used in legal
actions.
3.7.4 The worker is cautioned not to apply
the percentage of verification determined for
one sample to other samples.
3.7.5 The careful worker may also pick
non-typical colonies and follow the verification
procedure to determine that false negative col-
onies do not occur.
3.8 Significant Figures: See 2.8.1.
3.9 Repeatability and Reproducibility of
Counts: Analysts should be able to duplicate
their own colony counts on the same mem-
brane within 5% and the counts of other ana-
lysts within 10%. Failure to agree within these
limits should trigger a review of procedures.
4. Most Probable Number (MPN) Method
4.1 Summary: The Most Probable Num-
ber procedure estimates the number of spe-
cific organisms in water and wastewater by
the use of probability tables.
Decimal dilutions of samples are inocu-
lated in series into liquid tube media. Positive
tests are indicated by growth and/or fermenta-
tive gas production. Bacterial densities are
based on combinations of positive and nega^
78
MICROBIOLOGICAL MANUAL 1978
image:
 tive tube results read from the MPN table. The
MPN procedure may be carried to three stages
of completion:
4-1-1 The Presumptive Test provides a
preliminary estimate of bacterial density
based on enrichment in minimally-restrictive
tube media. The results of this test are never
used without further analyses,
4.1.2 The Confirmed Test, the second
stage of the MPN, is the usual extent of testing.
Growth from each positive Presumptive Test
tube is inoculated into a more selective inhibi-
tory medium. The tubes are incubated at the
prescribed temperature and time, the positive
reactions noted and counts calculated from
the MPN table.
4.1.3 The Completed Test is the third
stage of the MPN used for total coliform
analyses only. Positive tubes from the
Confirmed Test are submitted to additional
tests to verify the identification of the isolated
microorganisms. Although the Completed Test
provides the greatest reliability, the amount of
time and the workload restrict its use to
periodic substantiation of Confirmed Test
results, to other QC checks on methodology
and analysts, and to research.
4.2 Scope and Application
4.2.1 Advantages: The MPN procedure
has the advantages inherent in liquid nutrient
media.
(a) The Presumptive and Confirmed Tests
require only observing and recording of
gas/no gas for conforms and growth/no
growth for fecal streptococci. The tests require
minimal experience, training or interpretation
by the analyst.
(b) Water samples with high turbidity or
large numbers of algae have no apparent dele-
terious effect on the tube reactions.
(c) If a toxic substance is present in the
sample, the resultant 1:10 or 1:100 dilution of
that sample in the liquid broth may reduce the
toxicity to the point of no effect.
(d) The MPN may be the only method appli-
cable to problem sample materials such as
bottom sludges, muds, soils and sediments
(with blending).
4.2.2 Limitations: The MPN procedure has
disadvantages:
(a) This method is ordinarily limited to a
maximum sample volume of 10 mi per tube, but
100 ml portions are used in shellfish waters.
(b) The time required for the test may be as
long as 96 hours for a Confirmed Test result.
(c) The MPN tables are probability calcula-
tions and inherently have poor precision and
contain a 23% bias at the 5 tube, three dilution
levels normally used.
(d) The man-hour requirements to prepare
glassware and media and to perform the tests
are significant.
(e) Relatively large amounts of bench space,
incubator space and tube/rack storage space
are required.
(f) The procedure does not lend itself to
field work. As compliance monitoring of water
quality and effluent standards becomes a major
legal requirement, the time, precision and
equipment limitations cited in (b), {c), (d) and(e)
above are more serious for the large number of
field analyses which will be required.
(g) Background organisms or toxic con-
stituents in 10 ml volumes of marine water can
interfere and be undetected.
4.2.3 The minimum MPN test that is ac-
ceptable for water and wastewater analyses is_.
the Confirmed Test because of the high proba-
bility of false positive reactions in the Pre-
sumptive Test.
ISOLATION AND ENUMERATION
79
image:
tive tube results read from the MPN table. The
MPN procedure may be carried to three stages
of completion:
4-1-1 The Presumptive Test provides a
preliminary estimate of bacterial density
based on enrichment in minimally-restrictive
tube media. The results of this test are never
used without further analyses,
4.1.2 The Confirmed Test, the second
stage of the MPN, is the usual extent of testing.
Growth from each positive Presumptive Test
tube is inoculated into a more selective inhibi-
tory medium. The tubes are incubated at the
prescribed temperature and time, the positive
reactions noted and counts calculated from
the MPN table.
4.1.3 The Completed Test is the third
stage of the MPN used for total coliform
analyses only. Positive tubes from the
Confirmed Test are submitted to additional
tests to verify the identification of the isolated
microorganisms. Although the Completed Test
provides the greatest reliability, the amount of
time and the workload restrict its use to
periodic substantiation of Confirmed Test
results, to other QC checks on methodology
and analysts, and to research.
4.2 Scope and Application
4.2.1 Advantages: The MPN procedure
has the advantages inherent in liquid nutrient
media.
(a) The Presumptive and Confirmed Tests
require only observing and recording of
gas/no gas for conforms and growth/no
growth for fecal streptococci. The tests require
minimal experience, training or interpretation
by the analyst.
(b) Water samples with high turbidity or
large numbers of algae have no apparent dele-
terious effect on the tube reactions.
(c) If a toxic substance is present in the
sample, the resultant 1:10 or 1:100 dilution of
that sample in the liquid broth may reduce the
toxicity to the point of no effect.
(d) The MPN may be the only method appli-
cable to problem sample materials such as
bottom sludges, muds, soils and sediments
(with blending).
4.2.2 Limitations: The MPN procedure has
disadvantages:
(a) This method is ordinarily limited to a
maximum sample volume of 10 mi per tube, but
100 ml portions are used in shellfish waters.
(b) The time required for the test may be as
long as 96 hours for a Confirmed Test result.
(c) The MPN tables are probability calcula-
tions and inherently have poor precision and
contain a 23% bias at the 5 tube, three dilution
levels normally used.
(d) The man-hour requirements to prepare
glassware and media and to perform the tests
are significant.
(e) Relatively large amounts of bench space,
incubator space and tube/rack storage space
are required.
(f) The procedure does not lend itself to
field work. As compliance monitoring of water
quality and effluent standards becomes a major
legal requirement, the time, precision and
equipment limitations cited in (b), {c), (d) and(e)
above are more serious for the large number of
field analyses which will be required.
(g) Background organisms or toxic con-
stituents in 10 ml volumes of marine water can
interfere and be undetected.
4.2.3 The minimum MPN test that is ac-
ceptable for water and wastewater analyses is_.
the Confirmed Test because of the high proba-
bility of false positive reactions in the Pre-
sumptive Test.
ISOLATION AND ENUMERATION
79
image:
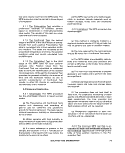 4.3 Apparatus and Materials
4.3.1 Water bath or air incubator set at 35
j; 0.5 C for total coliform and fecal strepto-
cocci tests. Water bath at 44.5 ± 0.2 for fecal
coliform test
4.3.2 Pipet containers of stainless steel,
aluminum or pyrex glass for glass pipets.
4.3.3 Inoculation loops, 3 mm diameter,
and needle of nichrome or platinum wire, 26
B&S gauge, in suitable holder.
4.3.4 Disposable applicator sticks or plas-
tic loops as alternatives to inoculation loops in
4.3.3 above.
4.3.6 Compound microscope, oil immer-
sion, 1000X-
4.3.6 Culture tube racks, 10x5 open-
ings; each opening to accept 25 mm diameter
tubes.
4.3.7 Gas burner, Bunsen/Fisher types or
electric incinerator unit.
4.3.8 Sterile T.D. bacteriological or Mohr
pipets, glass or plastic, of appropriate sizes.
4.3.9 Dilution bottles (milk dilution), pyrex
glass, marked at 99 ml volume, screw cap with
neoprene liner.
4.3.10 Pyrex culture test tubes 150 x 25
or 150 X 20 mm containing inverted fermen-
tation vials, 75 x 10 mm and proper closures.
4.3.11 Gram stain solutions (optional).
See This Section 5.3.
(a) Hucker's Crystal Violet Solution (stain).
(b) Lugol's Iodine Solution (mordant).
(c) Acetone Alcohol (decolorizer).
(d)Safranin Solution (counterstain).
4.3.12 Glass microscope slides, 2.5 x 7.6
cm(1 X 3 inches).
4.4 Media: Appropriate media dispensed
in test tubes or in fermentation test tubes. See
Part IIB. for specific media.
4.5 Dilution Water: Sterile 99 ± 2 ml
volumes in screw-cap pyrex glass bottles. See
Partll-B,7.
4.6 Presumptive Test
4.6.1 Shake the sample or dilution con-
tainer vigorously about 25 times.
4.6.2 To perform the Presumptive Test,
arrange a series of three or more rows of
culture tubes containing the test medium in a
rack, providing for five replicates in each row.
Use five rows for samples of unknown density.
Inoculate each successive row with decreas-
ing decimal dilutions of the sample. For exam-
ple, in testing polluted waters for total coli-
forms, the initial sample inoculations might be
0.1,0.01,0.001,0.0001,0.00001 ml of origi-
nal sample into successive rows each contain-
ing five replicate volumes. This series of sam-
ple volumes would yield determinate results
from test waters containing up to 16,000,000
organisms per 100 ml by use of the MPN
tables.
When removing sample aliquots or dilu-
tions for further inoculations, do not insert the
pipet tip more than 2.5 cm (1 inch) below the
surface of the sample.
4.6.3 Incubate tubes for 24±2 hours at 35 C.
A positive presumptive test is gas production
for the coliforms or growth for fecal strepto-
cocci. After 24 hours incubation, examine the
tubes for gas formation and/or growth. Inocu-
late positive tubes into Confirmed Test media.
If there is no gas or growth reincubate these
negative tubes for an additional 24 hours.
4.6.4 If the Presumptive tubes are negative
after 48 ± 3 hours, discard tubes. If the Pre-
sumptive tubes are positive, the cultures are
verified in the Confirmed Test. Record the
negative and positive results.
80
&ERA MICROBIOLOGICAL MANUAL 1978
image:
4.3 Apparatus and Materials
4.3.1 Water bath or air incubator set at 35
j; 0.5 C for total coliform and fecal strepto-
cocci tests. Water bath at 44.5 ± 0.2 for fecal
coliform test
4.3.2 Pipet containers of stainless steel,
aluminum or pyrex glass for glass pipets.
4.3.3 Inoculation loops, 3 mm diameter,
and needle of nichrome or platinum wire, 26
B&S gauge, in suitable holder.
4.3.4 Disposable applicator sticks or plas-
tic loops as alternatives to inoculation loops in
4.3.3 above.
4.3.6 Compound microscope, oil immer-
sion, 1000X-
4.3.6 Culture tube racks, 10x5 open-
ings; each opening to accept 25 mm diameter
tubes.
4.3.7 Gas burner, Bunsen/Fisher types or
electric incinerator unit.
4.3.8 Sterile T.D. bacteriological or Mohr
pipets, glass or plastic, of appropriate sizes.
4.3.9 Dilution bottles (milk dilution), pyrex
glass, marked at 99 ml volume, screw cap with
neoprene liner.
4.3.10 Pyrex culture test tubes 150 x 25
or 150 X 20 mm containing inverted fermen-
tation vials, 75 x 10 mm and proper closures.
4.3.11 Gram stain solutions (optional).
See This Section 5.3.
(a) Hucker's Crystal Violet Solution (stain).
(b) Lugol's Iodine Solution (mordant).
(c) Acetone Alcohol (decolorizer).
(d)Safranin Solution (counterstain).
4.3.12 Glass microscope slides, 2.5 x 7.6
cm(1 X 3 inches).
4.4 Media: Appropriate media dispensed
in test tubes or in fermentation test tubes. See
Part IIB. for specific media.
4.5 Dilution Water: Sterile 99 ± 2 ml
volumes in screw-cap pyrex glass bottles. See
Partll-B,7.
4.6 Presumptive Test
4.6.1 Shake the sample or dilution con-
tainer vigorously about 25 times.
4.6.2 To perform the Presumptive Test,
arrange a series of three or more rows of
culture tubes containing the test medium in a
rack, providing for five replicates in each row.
Use five rows for samples of unknown density.
Inoculate each successive row with decreas-
ing decimal dilutions of the sample. For exam-
ple, in testing polluted waters for total coli-
forms, the initial sample inoculations might be
0.1,0.01,0.001,0.0001,0.00001 ml of origi-
nal sample into successive rows each contain-
ing five replicate volumes. This series of sam-
ple volumes would yield determinate results
from test waters containing up to 16,000,000
organisms per 100 ml by use of the MPN
tables.
When removing sample aliquots or dilu-
tions for further inoculations, do not insert the
pipet tip more than 2.5 cm (1 inch) below the
surface of the sample.
4.6.3 Incubate tubes for 24±2 hours at 35 C.
A positive presumptive test is gas production
for the coliforms or growth for fecal strepto-
cocci. After 24 hours incubation, examine the
tubes for gas formation and/or growth. Inocu-
late positive tubes into Confirmed Test media.
If there is no gas or growth reincubate these
negative tubes for an additional 24 hours.
4.6.4 If the Presumptive tubes are negative
after 48 ± 3 hours, discard tubes. If the Pre-
sumptive tubes are positive, the cultures are
verified in the Confirmed Test. Record the
negative and positive results.
80
&ERA MICROBIOLOGICAL MANUAL 1978
image:
 4.7 Confirmed Test
4.7.1 The Confirmed Test is performed by
verifying positive tubes from the Presumptive
Test at 24 and 48 hours. If Presumptive tubes
are positive at 24 hours, confirm them at that
time.
4.7.2 A positive test is indicated by gas
production for the coliform bacteria or growth
for fecal streptococci. After 24 ± 2 hours incu-
bation, examine the tubes for gas formation
and/or growth. If there is no gas/growth, rein-
cubate these negative tubes for a second 24
hours.
4.7.3 After 48 hours ± 3 hours examine
tubes for gas and/or growth, record positive
and negative results. Discard negative tubes.
Retain positive tubes if the test is to be carried
to completion for total coliform tests.
4.7.4 The fecal coliform MPN test is per-
formed by inoculating EC Broth tubes with
growth from all positive Presumptive tubes and
incubating them at the elevated temperature of
44.5 C for 24 hours. Gas production is the posi-
tive reaction.
4.7.5 Passage of positive Presumptive cul-
tures through the ConfirmedTestcompletesthe
MPN series for fecal streptococci and fecal
coliform bacteria.
4.7.6 In routine practice, most sample ex-
aminations for total coliform are terminated at
the end of the Confirmed Test. However, for
quality control, at least five percent of the Con-
firmed Test samples (and a minimum of one
sample per test run) should be carried through
the Completed Test.
4.8 Completed Test for Total Coliform
MPN
Positjve Confirmed Test cultures may be
subjected to final Completed Test identification
through application of further culture tests,
as follows:
,4.8.1 Streak Levine'sEMB agar plates from
each positive confirmatory tube and incubate at
35 C for 24 hours. Pick typical coliform colonies
(or atypical colonies if no typical colonies are
present), inoculate into lauryl tryptose fermen-
tation tubes and incubate at 35 C for 24-48
hours. The formation of gas in any amount in
the fermentation tubes constitutes a positive
Completed Test for total conforms.
Typical colonies show a golden green
metallic sheen or reddish purple color with
nucleation.
Atypical colonies are red, pink or colorless,
unnucleated and mucoid.
4.8.2 Optional Gram Stain Procedure
The gram stain test has been used in the
Completed MPN Test for demonstrating gram
negative, nonsporeforming rods from isolated
colonies. Although the gram stain procedure is
proposed for revision of the 15th edition of
Standard Methods, it provides a final check on
results and remains useful for evaluating ques-
tionable colony types.
After incubation of the EMB agar plates for
24 hours at 35 C (in 4.8.1) pick at least two
typical colonies (or atypicals if no typical colo-
nies are present) and inoculate onto nutrient
agar slants. Incubate for 24 hours at 35 C, and
proceed as in 5, this Section.
4.9 Calculation of MPN Value
The calculated density of the Confirmed or
Completed Test may be obtained from the MPN
table based on the number of positive tubes
and reactions in each dilution.
4.9.1 Table ll-C-4 illustrates the MPN indi-
ces and 95% Confidence Limits for general use.
4.9.2 Table ll-C-5 shows the MPN indices
and limits for potable water testing.
4.9.3 Three dilutions are necessary to
formulate the MPN code. For example in Table
ll-C-4 if five 10 ml, five 1.0 ml, and five 0.1 ml
portions are used as inocula and positive results
are observed in five of the 10 ml inocula,
three of the 1.0 inocula, and none of the 0.1
ISOLATION AND ENUMERATION
81
image:
4.7 Confirmed Test
4.7.1 The Confirmed Test is performed by
verifying positive tubes from the Presumptive
Test at 24 and 48 hours. If Presumptive tubes
are positive at 24 hours, confirm them at that
time.
4.7.2 A positive test is indicated by gas
production for the coliform bacteria or growth
for fecal streptococci. After 24 ± 2 hours incu-
bation, examine the tubes for gas formation
and/or growth. If there is no gas/growth, rein-
cubate these negative tubes for a second 24
hours.
4.7.3 After 48 hours ± 3 hours examine
tubes for gas and/or growth, record positive
and negative results. Discard negative tubes.
Retain positive tubes if the test is to be carried
to completion for total coliform tests.
4.7.4 The fecal coliform MPN test is per-
formed by inoculating EC Broth tubes with
growth from all positive Presumptive tubes and
incubating them at the elevated temperature of
44.5 C for 24 hours. Gas production is the posi-
tive reaction.
4.7.5 Passage of positive Presumptive cul-
tures through the ConfirmedTestcompletesthe
MPN series for fecal streptococci and fecal
coliform bacteria.
4.7.6 In routine practice, most sample ex-
aminations for total coliform are terminated at
the end of the Confirmed Test. However, for
quality control, at least five percent of the Con-
firmed Test samples (and a minimum of one
sample per test run) should be carried through
the Completed Test.
4.8 Completed Test for Total Coliform
MPN
Positjve Confirmed Test cultures may be
subjected to final Completed Test identification
through application of further culture tests,
as follows:
,4.8.1 Streak Levine'sEMB agar plates from
each positive confirmatory tube and incubate at
35 C for 24 hours. Pick typical coliform colonies
(or atypical colonies if no typical colonies are
present), inoculate into lauryl tryptose fermen-
tation tubes and incubate at 35 C for 24-48
hours. The formation of gas in any amount in
the fermentation tubes constitutes a positive
Completed Test for total conforms.
Typical colonies show a golden green
metallic sheen or reddish purple color with
nucleation.
Atypical colonies are red, pink or colorless,
unnucleated and mucoid.
4.8.2 Optional Gram Stain Procedure
The gram stain test has been used in the
Completed MPN Test for demonstrating gram
negative, nonsporeforming rods from isolated
colonies. Although the gram stain procedure is
proposed for revision of the 15th edition of
Standard Methods, it provides a final check on
results and remains useful for evaluating ques-
tionable colony types.
After incubation of the EMB agar plates for
24 hours at 35 C (in 4.8.1) pick at least two
typical colonies (or atypicals if no typical colo-
nies are present) and inoculate onto nutrient
agar slants. Incubate for 24 hours at 35 C, and
proceed as in 5, this Section.
4.9 Calculation of MPN Value
The calculated density of the Confirmed or
Completed Test may be obtained from the MPN
table based on the number of positive tubes
and reactions in each dilution.
4.9.1 Table ll-C-4 illustrates the MPN indi-
ces and 95% Confidence Limits for general use.
4.9.2 Table ll-C-5 shows the MPN indices
and limits for potable water testing.
4.9.3 Three dilutions are necessary to
formulate the MPN code. For example in Table
ll-C-4 if five 10 ml, five 1.0 ml, and five 0.1 ml
portions are used as inocula and positive results
are observed in five of the 10 ml inocula,
three of the 1.0 inocula, and none of the 0.1
ISOLATION AND ENUMERATION
81
image:
 00
TABLE II4M
Most Probable Number Index and 95% Confidence Limits for Five Tube, Three Dilution Series (8,9)
No. of Tubes Giving
Positive Reaction out of
5 of 10
ml Each
0
0
0
0
1
1
1
1
1
2
2
2
2
2
2
3
3
3
3
3
3
3
4
4
4
4
4
4
5 of 1
ml Each
0
0
1
2
0
0
1
1
2
0
0
1
1
2
3
0
0
1
1
2
' 2
3
0
0
1
1
1
2
5 of 0. 1
ml Each
0
1
0
0
0
1
0
1
0
0
1
0
1
0
0
0
1
0
1
0
1
0
0
1
0
1
2
0
MPN
Index
per
100ml
<2
2
2
4
2
4
4
6
6
5
7
7
9
9
12
8
11
11
14
14
17
17
13
17
17
21
26
22
95% Confidence
Limits
Lower
<0.5
<0.5
<0.5
<0,5
<0.5
<0.5
<0.5
<0,5
<0.5
1
1
2
2
3
1
2
2
4
4
5
5
3
5
5
7
9
7
Upper
7
7
11
7
11
11
15
15
13
17
17
21
21
28
19
25
25
34
34
46
4§
31
46
46
63
78
67
No. of Tubes Giving
Positive Reaction out of
5 of 10
ml Each
4
4
4
4
5
5
5
5
5
5
5
5
5
5
5
5
5
5
5
5
5
5
5
5
5
5
5
5
5 of 1
ml Each
2
3
3
4
0
0
0
1
1
1
2
2
2
3
3
3
3
4
4
4
4
4
5
5
5
5
5
5
6 Of 0. 1
ml Each
1
0
1
0
0
1
2
0
1
2
0
1
2
0
1
2
3
0
1
2
3
4
0
1
2
3
4
5
MPN
Index
per
100ml
26
27
33
34
23
31
43
33
46
63
49
70
94
79
110
140
180
130
170
220
280
350
240
350
540
920
1600
>_2400
95% Confidence
Limits
Lower
9
9
11
12
7
11
15
11
16
21
17
23
28
25
31
37
44
35
43
57
90
120
68
120
180
300
640
Upper
78
80
93
93
70;
89
110
93
120
150
130
170
220
190
250
340
500
300
490
700
850
1,000
750
1,000
1,400
3,200
5,800
image:
00
TABLE II4M
Most Probable Number Index and 95% Confidence Limits for Five Tube, Three Dilution Series (8,9)
No. of Tubes Giving
Positive Reaction out of
5 of 10
ml Each
0
0
0
0
1
1
1
1
1
2
2
2
2
2
2
3
3
3
3
3
3
3
4
4
4
4
4
4
5 of 1
ml Each
0
0
1
2
0
0
1
1
2
0
0
1
1
2
3
0
0
1
1
2
' 2
3
0
0
1
1
1
2
5 of 0. 1
ml Each
0
1
0
0
0
1
0
1
0
0
1
0
1
0
0
0
1
0
1
0
1
0
0
1
0
1
2
0
MPN
Index
per
100ml
<2
2
2
4
2
4
4
6
6
5
7
7
9
9
12
8
11
11
14
14
17
17
13
17
17
21
26
22
95% Confidence
Limits
Lower
<0.5
<0.5
<0.5
<0,5
<0.5
<0.5
<0.5
<0,5
<0.5
1
1
2
2
3
1
2
2
4
4
5
5
3
5
5
7
9
7
Upper
7
7
11
7
11
11
15
15
13
17
17
21
21
28
19
25
25
34
34
46
4§
31
46
46
63
78
67
No. of Tubes Giving
Positive Reaction out of
5 of 10
ml Each
4
4
4
4
5
5
5
5
5
5
5
5
5
5
5
5
5
5
5
5
5
5
5
5
5
5
5
5
5 of 1
ml Each
2
3
3
4
0
0
0
1
1
1
2
2
2
3
3
3
3
4
4
4
4
4
5
5
5
5
5
5
6 Of 0. 1
ml Each
1
0
1
0
0
1
2
0
1
2
0
1
2
0
1
2
3
0
1
2
3
4
0
1
2
3
4
5
MPN
Index
per
100ml
26
27
33
34
23
31
43
33
46
63
49
70
94
79
110
140
180
130
170
220
280
350
240
350
540
920
1600
>_2400
95% Confidence
Limits
Lower
9
9
11
12
7
11
15
11
16
21
17
23
28
25
31
37
44
35
43
57
90
120
68
120
180
300
640
Upper
78
80
93
93
70;
89
110
93
120
150
130
170
220
190
250
340
500
300
490
700
850
1,000
750
1,000
1,400
3,200
5,800
image:
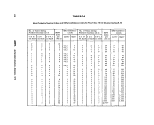 TABLE li-C-S
Most Probable Number Index and 95% Confidence Limits for Testing Potable Waters
Number of Positive Tubes
from five 10 ml Portions
MPN
Index/100 ml
95% Confidence Limits
Lower
Upper
0
1
2
3
4
5
<2.2
2.2
5.1
9.2
16.
0
0.1
0.5
1.6
3.3
8.0
6.0
12.6
19.2
29.4
52.9
Infinite
ISOLATION AND ENUMERATION
83
image:
TABLE li-C-S
Most Probable Number Index and 95% Confidence Limits for Testing Potable Waters
Number of Positive Tubes
from five 10 ml Portions
MPN
Index/100 ml
95% Confidence Limits
Lower
Upper
0
1
2
3
4
5
<2.2
2.2
5.1
9.2
16.
0
0.1
0.5
1.6
3.3
8.0
6.0
12.6
19.2
29.4
52.9
Infinite
ISOLATION AND ENUMERATION
83
image:
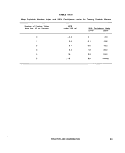 ml inocula, the coded results of the test are
5-3-0. The code is located in the MPN Table,
and the MPN index of 79 per 100 ml is
recorded.
4,9.4 When the series of decimal dilutions
is other than 10, 1.0 and 0.1 ml, select the
MPN value from Table ll-C-4 and calculate
according to the following formula:
MPN (From Table) x
10
Largest Quantity Tested
MPN/100 ml
As an example, five out of five 0.01 ml
portions, two out of five 0.001 ml portions,
and zero out of five 0.0001 ml portions from a
sample of water, gave positive reactions. From
the code 5-2-0 in MPN Table (Table ll-C-4), the
MPN index 49 is adjusted for dilutions:
49 {From Table) X
10
0.01
= 49,000
The final corrected MPN Value =
49,000/100 ml.
4.9.5 If more than the above three sample
volumes are inoculated, the three significant
dilutions must be determined. The significant
dilutions are selected using the following
rules:
(a) Only three dilutions are used in the
code for calculating an MPN value.
(b) To obtain the proper three dilutions,
select the smallest sample volume giving all
positive results and the two succeeding lesser
sample volumes. See Table II-C-6, Test land 2.
(c) If less than three dilutions show posi-
tive tubes, select the three highest sample
volumes which will include the dilutions with
the positive tubes. See Table II-C-6, Test 3.
(d) If there are positive tubes in the dilu-
tions higher than these dilutions selected, pos-
itive results are moved up from these dilutions
sample volume to increase the positive tubes
in the highest dilution selected. See Table II-C-
6, Test 4.
(e) There should be no negative results in
higher sample volumes than those chosen.
However, if negative tubes are present, e.g.,
4/5, 5/5, 3/5 and 0/5 the highest sample vol-
ume with all positive tubes must be used along
with the next two lower sample volumes. See
Table II-C-6, Test 5.
(f) If all tubes are positive, choose the three
highest dilutions. See Table II-C-6, Test 6.
(g) If all tubes are negative, choose the
three lowest dilutions. See Table II-C-6, Test 7.
(h) If positive tubes skip a dilution, select
the highest dilution with positive tubes and the
two lower dilutions. See Table II-C-6, Test 8.
(i)lf only the middle dilution is positive,
select this dilution and one higher and
lower dilution. See Table II-C-6, Test 9.
4.9.6 A number of theoretically possible
combinations of positive tube results are omit-
ted in Table ll-C-4 because the probability of
their occurrence is less than 1 %. If such un-
likely tube combinations occur in more than
1 % of samples, review the laboratory proce-
dures for errors and note sample types. Collect
fresh samples for analyses.
4.9.7 The MPN can also be computed for
each sample based upon the number of
positive and negative Presumptive, Confirmed
or Completed Tests, and the total number of
milliliters tested (10). MPN/100 ml =
No. of Positive Tubes
100
(No. of ml in Negative Tubes) X
(No, of rnl in All Tubes)
Example: From a sample of water, five out
of five 10 ml portions, two out of five 1.0 rnl
portions, and zero out of five 0.1 ml portions
84
MICROBIOLOGICAL MANUAL 1378
image:
ml inocula, the coded results of the test are
5-3-0. The code is located in the MPN Table,
and the MPN index of 79 per 100 ml is
recorded.
4,9.4 When the series of decimal dilutions
is other than 10, 1.0 and 0.1 ml, select the
MPN value from Table ll-C-4 and calculate
according to the following formula:
MPN (From Table) x
10
Largest Quantity Tested
MPN/100 ml
As an example, five out of five 0.01 ml
portions, two out of five 0.001 ml portions,
and zero out of five 0.0001 ml portions from a
sample of water, gave positive reactions. From
the code 5-2-0 in MPN Table (Table ll-C-4), the
MPN index 49 is adjusted for dilutions:
49 {From Table) X
10
0.01
= 49,000
The final corrected MPN Value =
49,000/100 ml.
4.9.5 If more than the above three sample
volumes are inoculated, the three significant
dilutions must be determined. The significant
dilutions are selected using the following
rules:
(a) Only three dilutions are used in the
code for calculating an MPN value.
(b) To obtain the proper three dilutions,
select the smallest sample volume giving all
positive results and the two succeeding lesser
sample volumes. See Table II-C-6, Test land 2.
(c) If less than three dilutions show posi-
tive tubes, select the three highest sample
volumes which will include the dilutions with
the positive tubes. See Table II-C-6, Test 3.
(d) If there are positive tubes in the dilu-
tions higher than these dilutions selected, pos-
itive results are moved up from these dilutions
sample volume to increase the positive tubes
in the highest dilution selected. See Table II-C-
6, Test 4.
(e) There should be no negative results in
higher sample volumes than those chosen.
However, if negative tubes are present, e.g.,
4/5, 5/5, 3/5 and 0/5 the highest sample vol-
ume with all positive tubes must be used along
with the next two lower sample volumes. See
Table II-C-6, Test 5.
(f) If all tubes are positive, choose the three
highest dilutions. See Table II-C-6, Test 6.
(g) If all tubes are negative, choose the
three lowest dilutions. See Table II-C-6, Test 7.
(h) If positive tubes skip a dilution, select
the highest dilution with positive tubes and the
two lower dilutions. See Table II-C-6, Test 8.
(i)lf only the middle dilution is positive,
select this dilution and one higher and
lower dilution. See Table II-C-6, Test 9.
4.9.6 A number of theoretically possible
combinations of positive tube results are omit-
ted in Table ll-C-4 because the probability of
their occurrence is less than 1 %. If such un-
likely tube combinations occur in more than
1 % of samples, review the laboratory proce-
dures for errors and note sample types. Collect
fresh samples for analyses.
4.9.7 The MPN can also be computed for
each sample based upon the number of
positive and negative Presumptive, Confirmed
or Completed Tests, and the total number of
milliliters tested (10). MPN/100 ml =
No. of Positive Tubes
100
(No. of ml in Negative Tubes) X
(No, of rnl in All Tubes)
Example: From a sample of water, five out
of five 10 ml portions, two out of five 1.0 rnl
portions, and zero out of five 0.1 ml portions
84
MICROBIOLOGICAL MANUAL 1378
image:
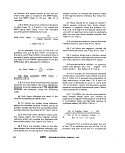 TABLE Il-C-fi
Selection of Coded Results, Five Tube Series
Test
1
2
3
4
5
6
7
8
3
Positive
10 1.0
5' 3
5 5
4
5 5
4 5_
5
0
4_
O_
Tubes/ml
0.1 0
0
4
1
4
3_
5
0
0_
J_
Sample
.01
0
0
0
1
0_
5_
0
2_
0_
Volume
0.001
0
0
0
1
0
5
0
0
0
0.0001
0
0
0
0
5
0
0
0
Code
5-3-0
5-4-0
4-1-0
5-4-2
5-3-0
5-5-5
0-0-0
4-0-2
0-1-0
'Underlines indicate positive tube series selected for code.
ISOLATION AND ENUMERATION
85
image:
TABLE Il-C-fi
Selection of Coded Results, Five Tube Series
Test
1
2
3
4
5
6
7
8
3
Positive
10 1.0
5' 3
5 5
4
5 5
4 5_
5
0
4_
O_
Tubes/ml
0.1 0
0
4
1
4
3_
5
0
0_
J_
Sample
.01
0
0
0
1
0_
5_
0
2_
0_
Volume
0.001
0
0
0
1
0
5
0
0
0
0.0001
0
0
0
0
5
0
0
0
Code
5-3-0
5-4-0
4-1-0
5-4-2
5-3-0
5-5-5
0-0-0
4-0-2
0-1-0
'Underlines indicate positive tube series selected for code.
ISOLATION AND ENUMERATION
85
image:
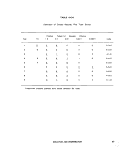 gave positive results. Therefore, MPN/100 ml
7 X 100
(55.5)
= 50.22
or
MPN/100 ml = 50
4.10 Reporting Results: Report the MPN
value for water samples on the basis of 100 ml
of sample. Report the MPN values of solid type
samples on the basis of 1 gram of dry weight
sample.
Examples of bench forms are shown in
Figuresll-C-1,2and3.
4.11 Precision and Accuracy
4.11.1 The precision of the MPN value
increases proportionately with the number of
replicates tested.
4.11.2 Multiple-tube values are generally
high because MPN tables include a 23% posi-
tive bias.
4.11.3 MPN numbers represent only a sta-
tistical estimate of the true bacterial density in
the sample. The 95% Confidence Limits for
each MPN value included in the Tables ll-C-4
and 5 show the limited precision of these
estimates.
5.1.3 Air-dry the smear and fix by quickly
passing the slide several times through a por-
tion of the flame.
5.2 Gram Stain
Gram staining is a general test for charac-
terization of bacteria and for examination of
culture purity.
5.2.1 Prepare and fix a bacterial smear as
in 5.1. For quality control, prepare a separate
smear of known gram positive cocci and gram
negative rods.
5.2.2 Flood the smear with ammonium
oxalate-crystal violet stain for one minute.
5.2.3 Wash the slide in a gentle stream of
tap or pure water and flood with Lugol's iodine
solution (mordant). Allow it to remain for one
minute.
5.2.4 Wash the slide in water and blot dry.
5. Staining Procedures
5.1 Preparation of Bacterial Smears
5.1.1 Place a small drop of laboratory pure
water on a clean slide.
5.1.2 Using a sterilized inoculating nee-
dle, pick a small amount of growth from the
agar slant. Mix the bacteria with the drop of
water on the slide and spread evenly over an
area the size of a quarter. Use loop for broth
cultures.
5.2.5 Decolorize with acetone alcohol,
either by adding it dropwise on the tilted slide
until the blue color stops flowing from the
smear, or by gently agitating the slide up and
down in a beaker containing the alcohol wash
for about 30 seconds.
5.2.6 Flood the smear with the safranin
counterstain for 10 seconds. Wash and air-dry.
86
MICROBIOLOGICAL MANUAL 1978
image:
gave positive results. Therefore, MPN/100 ml
7 X 100
(55.5)
= 50.22
or
MPN/100 ml = 50
4.10 Reporting Results: Report the MPN
value for water samples on the basis of 100 ml
of sample. Report the MPN values of solid type
samples on the basis of 1 gram of dry weight
sample.
Examples of bench forms are shown in
Figuresll-C-1,2and3.
4.11 Precision and Accuracy
4.11.1 The precision of the MPN value
increases proportionately with the number of
replicates tested.
4.11.2 Multiple-tube values are generally
high because MPN tables include a 23% posi-
tive bias.
4.11.3 MPN numbers represent only a sta-
tistical estimate of the true bacterial density in
the sample. The 95% Confidence Limits for
each MPN value included in the Tables ll-C-4
and 5 show the limited precision of these
estimates.
5.1.3 Air-dry the smear and fix by quickly
passing the slide several times through a por-
tion of the flame.
5.2 Gram Stain
Gram staining is a general test for charac-
terization of bacteria and for examination of
culture purity.
5.2.1 Prepare and fix a bacterial smear as
in 5.1. For quality control, prepare a separate
smear of known gram positive cocci and gram
negative rods.
5.2.2 Flood the smear with ammonium
oxalate-crystal violet stain for one minute.
5.2.3 Wash the slide in a gentle stream of
tap or pure water and flood with Lugol's iodine
solution (mordant). Allow it to remain for one
minute.
5.2.4 Wash the slide in water and blot dry.
5. Staining Procedures
5.1 Preparation of Bacterial Smears
5.1.1 Place a small drop of laboratory pure
water on a clean slide.
5.1.2 Using a sterilized inoculating nee-
dle, pick a small amount of growth from the
agar slant. Mix the bacteria with the drop of
water on the slide and spread evenly over an
area the size of a quarter. Use loop for broth
cultures.
5.2.5 Decolorize with acetone alcohol,
either by adding it dropwise on the tilted slide
until the blue color stops flowing from the
smear, or by gently agitating the slide up and
down in a beaker containing the alcohol wash
for about 30 seconds.
5.2.6 Flood the smear with the safranin
counterstain for 10 seconds. Wash and air-dry.
86
MICROBIOLOGICAL MANUAL 1978
image:
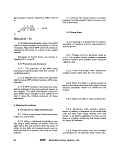 5.2.7 Examine under the oil immersion
objective. Gram positive cells retain the crystal
violet stain and are blue in color. Gram negative
cells are decolorized by the acetone alcohol so
that they accept the safranin counterstain and
appear pink to red.
5.3 Stain Solutions
Only those stains and dyes which are certi-
fied by the National Biological Stain Commis-
sion should be used.
5.3.1 Loeffler's Methylene Blue
(a) Methylene Blue-ethyl alcohol solution.
(1) Dissolve 0.3 grams of methylene blue
(90% dye content) in 30 ml of 95% ethyl alcohol
(Solution A).
(2) Dissolve 0.01 grams of potassium
hydroxide in 100 ml of laboratory pure water
(Solution B).
(3) Mix solution A and B.
5.3.2 Solutions for Gram Staining
(a) Ammonium oxalate-crystal violet
solution:
(1) Dissolve 2 grams crystal violet (approxi-
mately 85% dye content) in 20 ml of 95%
ethyl alcohol (Solution A).
(2) Dissolve 0.8 grams ammonium oxalate
in 80 ml laboratory pure water (Solution B).
(3) Mix Solutions A and B.
(4) Filter through cheesecloth or coarse
filter paper.
(5) Problems with the gram stain tech-
nique are frequently traceable to the
ammonium oxalate-crystal violet solution. In
the event that decolorization is insufficient, the
amount of crystal violet in the solution can be
reduced to as little as 10% of the
recommended amount.
(b) Lugol's iodine: Dissolve 1 gram iodine
crystals and 2 grams potassium iodide in
about 5 ml of pure water. After crystals are in
solution, add sufficient laboratory pure water
to bring the final solution to a volume of 300
ml.
(c) Acetone-Alcohol: Combine fifty
volumes of acetone and 95% ethyl alcohol.
ml
(d) Safranin: Dissolve 2.5 grams of safra-
nin in 100 ml of 95% ethyl alcohol. Store as a
stock solution. For working solution, add 10 ml
of stock to 100 ml of laboratory pure water,
mix and store.
6. Shipment of Cultures
6.1 Confirmation or further identification
to serotype may be required if the bacteriologi-
cal data are to be used for specific needs such
as enforcement cases, epidemiological stud-
ies, tracing sources of pollution or scientific
publication. The selected cultures should be
sent to an official typing center or state health
laboratory with pertinent information for the
confirmatory identification. This service is usu-
ally available if the cultures are of public health
significance, but permission should be ob-
tained from the reference laboratory before
sending cultures.
Observe the following instructions:
6.1.1 Send only pure cultures.
6.1.2 Provide a culture with discernable
growth on brain heart infusion agar, blood
agar base or nutrient agar stab in a screw-cap
tube or vial sealed with a cork soaked in hot
paraffin. Triple sugar iron agar or other sugar-
containing agars should not be used.
6.1.3 Complete the reference laboratory
form which requires information on the source
of the culture, tests completed, results
obtained and identification of the originating
laboratory. Include form with cultures, but on
outside of secondary container.
ISOLATION AND ENUMERATION
87
image:
5.2.7 Examine under the oil immersion
objective. Gram positive cells retain the crystal
violet stain and are blue in color. Gram negative
cells are decolorized by the acetone alcohol so
that they accept the safranin counterstain and
appear pink to red.
5.3 Stain Solutions
Only those stains and dyes which are certi-
fied by the National Biological Stain Commis-
sion should be used.
5.3.1 Loeffler's Methylene Blue
(a) Methylene Blue-ethyl alcohol solution.
(1) Dissolve 0.3 grams of methylene blue
(90% dye content) in 30 ml of 95% ethyl alcohol
(Solution A).
(2) Dissolve 0.01 grams of potassium
hydroxide in 100 ml of laboratory pure water
(Solution B).
(3) Mix solution A and B.
5.3.2 Solutions for Gram Staining
(a) Ammonium oxalate-crystal violet
solution:
(1) Dissolve 2 grams crystal violet (approxi-
mately 85% dye content) in 20 ml of 95%
ethyl alcohol (Solution A).
(2) Dissolve 0.8 grams ammonium oxalate
in 80 ml laboratory pure water (Solution B).
(3) Mix Solutions A and B.
(4) Filter through cheesecloth or coarse
filter paper.
(5) Problems with the gram stain tech-
nique are frequently traceable to the
ammonium oxalate-crystal violet solution. In
the event that decolorization is insufficient, the
amount of crystal violet in the solution can be
reduced to as little as 10% of the
recommended amount.
(b) Lugol's iodine: Dissolve 1 gram iodine
crystals and 2 grams potassium iodide in
about 5 ml of pure water. After crystals are in
solution, add sufficient laboratory pure water
to bring the final solution to a volume of 300
ml.
(c) Acetone-Alcohol: Combine fifty
volumes of acetone and 95% ethyl alcohol.
ml
(d) Safranin: Dissolve 2.5 grams of safra-
nin in 100 ml of 95% ethyl alcohol. Store as a
stock solution. For working solution, add 10 ml
of stock to 100 ml of laboratory pure water,
mix and store.
6. Shipment of Cultures
6.1 Confirmation or further identification
to serotype may be required if the bacteriologi-
cal data are to be used for specific needs such
as enforcement cases, epidemiological stud-
ies, tracing sources of pollution or scientific
publication. The selected cultures should be
sent to an official typing center or state health
laboratory with pertinent information for the
confirmatory identification. This service is usu-
ally available if the cultures are of public health
significance, but permission should be ob-
tained from the reference laboratory before
sending cultures.
Observe the following instructions:
6.1.1 Send only pure cultures.
6.1.2 Provide a culture with discernable
growth on brain heart infusion agar, blood
agar base or nutrient agar stab in a screw-cap
tube or vial sealed with a cork soaked in hot
paraffin. Triple sugar iron agar or other sugar-
containing agars should not be used.
6.1.3 Complete the reference laboratory
form which requires information on the source
of the culture, tests completed, results
obtained and identification of the originating
laboratory. Include form with cultures, but on
outside of secondary container.
ISOLATION AND ENUMERATION
87
image:
 6.2 Shipping Regulations for Cultures:
Transportation (DOT) regulations apply to sur-
face and air transportation, but shipment of
cultures beyond 100-200 miles is only practi-
cal by air. Air freight service is limited in many
areas, hence passenger-carrying aircraft must
be used for safe and quick service. Strict ship-
ping regulations are imposed on such passen-
ger service shipments (11), Packaging and la-
beling of the cultures must conform with cur-
rent federal shipping regulations for etiologi-
cai agents described in: 49 CFR 173.387 (12)
and 42 CFR 72.25 (c) (13). The requirements in
6.2.1-6.2.8 that follow are also shown in Fig-
ure li-C-10.
6.2.1 Place each culture in a securely
closed, watertight PRIMARY CONTAINER
(screw-cap test tube or vial) and seal the cap
with tape.
6.2.2 Wrap the PRIMARY CONTAINER
with sufficient absorbent material (paper
towel, tissue, etc.) to absorb the entire con-
tents should breakage or leakage occur.
6.2.3 Place the wrapped, sealed,
PRIMARY CONTAINER in a durable, watertight
SECONDARY CONTAINER (screw-cap metal
mailing tube or sealed metal can). Screw-cap
metal mailing tubes should be sealed with
tape. Several PRIMARY CONTAINERS of
cultures, each individually wrapped in
absorbent material, may be placed in the
SECONDARY CONTAINER provided that the
total aggregate volume does not exceed 50
ml. (NOTE: Multiple secondary containers of
cultures, which individually meet the
packaging requirements for shipment of 50 ml
or less, can be overpacked in a single outer
shipping container, provided that the total
aggregate volume does not exceed 4000 ml).
6.2.4 Data forms, letters and other infor-
mation identifying or describing the cultures
should be placed around the outside of the
SECONDARY CONTAINER. DO NOT ENCLOSE
WITHIN THE SECONDARY CONTAINER.
6.2.5 Place the SECONDARY CONTAINER
and information form in an OUTER MAILING
TUBE OR BOX.
6.2.6 Place an address label and
ETIOLOGIC AGENT/MICROBIOLOGICAL CUL-
TURES label on the outer mailing tube or box.
6.2.7 Individual primary containers of
greater than 50 ml of culture material require
special packaging and cannot be transported
on passenger-carrying aircraft.
6.2.8 International shipments must also
conform to the added regulations: US Post
Office Publication 51, Air Cargo Restricted Art-
icles Tariff 6-D and DOT Regulations 49 CFR,
Section 173.
88
&EPA MICROBIOLOGICAL MANUAL 1978
image:
6.2 Shipping Regulations for Cultures:
Transportation (DOT) regulations apply to sur-
face and air transportation, but shipment of
cultures beyond 100-200 miles is only practi-
cal by air. Air freight service is limited in many
areas, hence passenger-carrying aircraft must
be used for safe and quick service. Strict ship-
ping regulations are imposed on such passen-
ger service shipments (11), Packaging and la-
beling of the cultures must conform with cur-
rent federal shipping regulations for etiologi-
cai agents described in: 49 CFR 173.387 (12)
and 42 CFR 72.25 (c) (13). The requirements in
6.2.1-6.2.8 that follow are also shown in Fig-
ure li-C-10.
6.2.1 Place each culture in a securely
closed, watertight PRIMARY CONTAINER
(screw-cap test tube or vial) and seal the cap
with tape.
6.2.2 Wrap the PRIMARY CONTAINER
with sufficient absorbent material (paper
towel, tissue, etc.) to absorb the entire con-
tents should breakage or leakage occur.
6.2.3 Place the wrapped, sealed,
PRIMARY CONTAINER in a durable, watertight
SECONDARY CONTAINER (screw-cap metal
mailing tube or sealed metal can). Screw-cap
metal mailing tubes should be sealed with
tape. Several PRIMARY CONTAINERS of
cultures, each individually wrapped in
absorbent material, may be placed in the
SECONDARY CONTAINER provided that the
total aggregate volume does not exceed 50
ml. (NOTE: Multiple secondary containers of
cultures, which individually meet the
packaging requirements for shipment of 50 ml
or less, can be overpacked in a single outer
shipping container, provided that the total
aggregate volume does not exceed 4000 ml).
6.2.4 Data forms, letters and other infor-
mation identifying or describing the cultures
should be placed around the outside of the
SECONDARY CONTAINER. DO NOT ENCLOSE
WITHIN THE SECONDARY CONTAINER.
6.2.5 Place the SECONDARY CONTAINER
and information form in an OUTER MAILING
TUBE OR BOX.
6.2.6 Place an address label and
ETIOLOGIC AGENT/MICROBIOLOGICAL CUL-
TURES label on the outer mailing tube or box.
6.2.7 Individual primary containers of
greater than 50 ml of culture material require
special packaging and cannot be transported
on passenger-carrying aircraft.
6.2.8 International shipments must also
conform to the added regulations: US Post
Office Publication 51, Air Cargo Restricted Art-
icles Tariff 6-D and DOT Regulations 49 CFR,
Section 173.
88
&EPA MICROBIOLOGICAL MANUAL 1978
image:
 CO
O
1
b.
O
2
o
PART 1
PRIMARY
CONTAINER
CULTURE
(SCREW-CAP)
ABSORBENT
PACKING
MATERIAL
CAP
SECONDARY
CONTAINER
CAP
SHIPPING
CONTAINER
EA
LABEL
ADDRESS
LABEL
CULTURE
INFORMATION
PART 3
PART 2
ET10LOGICAL AGENTS
MICROBIOLOGICAL
MATERIALS C
IN CASE OF DAMAGE
OR LEAKAGE
NOTIFY DIRECTOR, CDC
ATLANTA. GA
404-633-5313
WATERPROOF
TAPE
ABSORBENT
PACKING
MATERIAL
MICROBIOLOGICAL MATERIALS
PACKAGING CONFORMS
WITH STANDARDS IN 49
CFR 173.387, AND
42CFR72.25
CROSS SECTION
OF PROPER PACKING
00
CO
FIGURE ll-C-10. Packaging and Labelling of Microbiological Cultures for Shipment.
image:
CO
O
1
b.
O
2
o
PART 1
PRIMARY
CONTAINER
CULTURE
(SCREW-CAP)
ABSORBENT
PACKING
MATERIAL
CAP
SECONDARY
CONTAINER
CAP
SHIPPING
CONTAINER
EA
LABEL
ADDRESS
LABEL
CULTURE
INFORMATION
PART 3
PART 2
ET10LOGICAL AGENTS
MICROBIOLOGICAL
MATERIALS C
IN CASE OF DAMAGE
OR LEAKAGE
NOTIFY DIRECTOR, CDC
ATLANTA. GA
404-633-5313
WATERPROOF
TAPE
ABSORBENT
PACKING
MATERIAL
MICROBIOLOGICAL MATERIALS
PACKAGING CONFORMS
WITH STANDARDS IN 49
CFR 173.387, AND
42CFR72.25
CROSS SECTION
OF PROPER PACKING
00
CO
FIGURE ll-C-10. Packaging and Labelling of Microbiological Cultures for Shipment.
image:
 REFERENCES
1. Clark, H. F., P. W. Kablerand E. E. Geldreich, 1957. Advantages and limitations of the membrane
filter procedures. Water Sewage Works 104:385.
2. Ships, E. L and A. Fields, 1954. A comparison of the molecular filter technique with agar plate
count for enumeration of Escherichia coli. Appl. Microbiol. 2^382.
3. Snipe, E. L. and G. M. Cameron, 1954. A comparison of the membrane filter with the most
probable number method for coliform determinations from several waters. Appj. Microbiol. 2:85.
4. Geldreich, E. E., H. L. Jeter and J. A. Winter, 1967, Technical considerations in applying the
membrane filter procedure. Health Laboratory Science 4:113.
5. Proceedings of the Symposium on the Recovery of Indicator Organisms Employing Membrane
Filters. Jan 20-21,1975. Environmental Monitoring and Support Laboratory, U.S. Environmental
Protection Agency, Cincinnati, OH 45268. (1977).
6. Rhines, C. E. and W. P. Cheevers, 1965. Decontamination of membrane filter holders by
ultraviolet light. J. Am. Waterworks Association 57:500.
7. Manning, H., 1975. AQC Newsletter #26, July 1975. U.S. Environmental Protection Agency,
Environmental Monitoring and Support Laboratory, Cincinnati, OH 45268. p. 15.
8. Swaroop, S., 1938. Numerical estimation of B. coli by dilution method. Indian J. Med. Research
26:353. • ~
9, Swaroop, S., 1951. The range of variation of the most probable number of organisms estimated
by the dilution method. Indian J. Med. Research 39:107.
10. Thomas, H. A., Jr., 1942. Bacterial densities from fermentation tubes. J. Am. Water Works
Association 34:572.
11. Morbidity and Mortality Report, 1975. Center for Disease Control, Public Health Service,
USDHEW, Atlanta, GA 24:49.
12, Title 49, Code of Federal Regulations <CFR), Part 173.
13, Interstate Quarantine, regulations of the shipment of etiologic agents. Title 42, Code of Federal
Regulations, (CFR), Part 72, Section 25.
90 <8>Efik MICROBIOLOGICAL MANUAL 1978
image:
REFERENCES
1. Clark, H. F., P. W. Kablerand E. E. Geldreich, 1957. Advantages and limitations of the membrane
filter procedures. Water Sewage Works 104:385.
2. Ships, E. L and A. Fields, 1954. A comparison of the molecular filter technique with agar plate
count for enumeration of Escherichia coli. Appl. Microbiol. 2^382.
3. Snipe, E. L. and G. M. Cameron, 1954. A comparison of the membrane filter with the most
probable number method for coliform determinations from several waters. Appj. Microbiol. 2:85.
4. Geldreich, E. E., H. L. Jeter and J. A. Winter, 1967, Technical considerations in applying the
membrane filter procedure. Health Laboratory Science 4:113.
5. Proceedings of the Symposium on the Recovery of Indicator Organisms Employing Membrane
Filters. Jan 20-21,1975. Environmental Monitoring and Support Laboratory, U.S. Environmental
Protection Agency, Cincinnati, OH 45268. (1977).
6. Rhines, C. E. and W. P. Cheevers, 1965. Decontamination of membrane filter holders by
ultraviolet light. J. Am. Waterworks Association 57:500.
7. Manning, H., 1975. AQC Newsletter #26, July 1975. U.S. Environmental Protection Agency,
Environmental Monitoring and Support Laboratory, Cincinnati, OH 45268. p. 15.
8. Swaroop, S., 1938. Numerical estimation of B. coli by dilution method. Indian J. Med. Research
26:353. • ~
9, Swaroop, S., 1951. The range of variation of the most probable number of organisms estimated
by the dilution method. Indian J. Med. Research 39:107.
10. Thomas, H. A., Jr., 1942. Bacterial densities from fermentation tubes. J. Am. Water Works
Association 34:572.
11. Morbidity and Mortality Report, 1975. Center for Disease Control, Public Health Service,
USDHEW, Atlanta, GA 24:49.
12, Title 49, Code of Federal Regulations <CFR), Part 173.
13, Interstate Quarantine, regulations of the shipment of etiologic agents. Title 42, Code of Federal
Regulations, (CFR), Part 72, Section 25.
90 <8>Efik MICROBIOLOGICAL MANUAL 1978
image:
 PART II. GENERAL OPERATIONS
Section D Selection of Analytical Methods
This Section discusses the selection of
methods for monitoring water and wastewater
in response to the Laws, the microbiological
standards that have been established, and the
criteria that have been recommended to en-
force the laws. The major problems that have
developed in.the application of the methods
9re identified and solutions are given where
they are available.
1. Methodology
1.1 National Interim Primary
Drinking Water Regu-
lations '
1.2 NPDES Guidelines
1.3 Marine Sanitation Regu-
lations
1.4 Water Quality Standards
1.5 Water Quality Criteria
1.6 Alternate Test Procedures
2. Problems in Application
2.1 Stressed Microorganisms
2.2 Incomplete Recovery/
Suppression
2.3 Interference by Turbidity
2.4 Analysis of Ground Water
2.5 Field Problems
2.6 Method Modifications
and Kits
2.7 Changes in Membrane
Filters and Methodology
2.8 Klebsiella'm Industrial
Wastes
3. Recommendations for Methods
in Waters and Wastewaters
1. Methodology
Test procedures have .been specified and
published in Federal Register for drinking
water, wastewater discharges (NPDES) and
vessel discharges.
1.1 National Interim Primary Drinking
Water Regulations
Although the National Interim Primary
Drinking Water Regulations (Title 40 CFR Part
141) state that the total coliform analyses can
be performed by the membrane filter or MPN
procedures, the MF procedure is preferred
because large volumes of samples can be
analyzed in a much shorter time, a critical
factor for potable water. Samples containing
excessive noncoliform populations or turbidity
must be analyzed by the MPN technique.
These regulations specify the testing of
sample sizes of 100 ml for the MF technique
and the testing of five replicate 10 or 100 ml
volumes for the MPN procedure. The law
directs that the samples be taken at points
representative of the distribution system.
The minimal schedules for the frequency
of sampling are based on population and
the required response is given for positive
test results. A detailed description of the
proposed criteria for interim certifi-
cation of microbiology laboratories under
METHOD SELECTION
91
image:
PART II. GENERAL OPERATIONS
Section D Selection of Analytical Methods
This Section discusses the selection of
methods for monitoring water and wastewater
in response to the Laws, the microbiological
standards that have been established, and the
criteria that have been recommended to en-
force the laws. The major problems that have
developed in.the application of the methods
9re identified and solutions are given where
they are available.
1. Methodology
1.1 National Interim Primary
Drinking Water Regu-
lations '
1.2 NPDES Guidelines
1.3 Marine Sanitation Regu-
lations
1.4 Water Quality Standards
1.5 Water Quality Criteria
1.6 Alternate Test Procedures
2. Problems in Application
2.1 Stressed Microorganisms
2.2 Incomplete Recovery/
Suppression
2.3 Interference by Turbidity
2.4 Analysis of Ground Water
2.5 Field Problems
2.6 Method Modifications
and Kits
2.7 Changes in Membrane
Filters and Methodology
2.8 Klebsiella'm Industrial
Wastes
3. Recommendations for Methods
in Waters and Wastewaters
1. Methodology
Test procedures have .been specified and
published in Federal Register for drinking
water, wastewater discharges (NPDES) and
vessel discharges.
1.1 National Interim Primary Drinking
Water Regulations
Although the National Interim Primary
Drinking Water Regulations (Title 40 CFR Part
141) state that the total coliform analyses can
be performed by the membrane filter or MPN
procedures, the MF procedure is preferred
because large volumes of samples can be
analyzed in a much shorter time, a critical
factor for potable water. Samples containing
excessive noncoliform populations or turbidity
must be analyzed by the MPN technique.
These regulations specify the testing of
sample sizes of 100 ml for the MF technique
and the testing of five replicate 10 or 100 ml
volumes for the MPN procedure. The law
directs that the samples be taken at points
representative of the distribution system.
The minimal schedules for the frequency
of sampling are based on population and
the required response is given for positive
test results. A detailed description of the
proposed criteria for interim certifi-
cation of microbiology laboratories under
METHOD SELECTION
91
image:
 the Safe Drinking Water Act is given in
Appendix B,
1.2 National Pollution Discharge
Elimination System (NPDES) Guidelines
The NPDES established guidelines for
analysis of pollutants under PL 92-500,
Section 304 (g). The parameters and methods
are described in 40 CFR Part 136, as amended
(40 Code of Federal Regulations, Protection of
the Environment ch. 1 - Environmental
Protection Agency, Part 136, Guidelines
Establishing Test Procedures for the Analysis
of Pollutants). The method must be specified
and MPNs must be five tube, five dilution. See
Table H-D-1.
1.3 Marine Sanitation Regulations
The regulations for marine sanitation
devices (40 CFR Part 140) established
performance standards and specified the
analytical methods as those promulgated in
40 CFR Part 136, cited in 1.2 above.
1.4 Water Quality Standards
Water quality standards (limits) have been
established by law for drinking water and
certain sewage and industrial effluents. These
standards and the reference sources are listed
in Table ll-D-2. A standard must be specified in
the NPDES permitto be enforceable.
1.5 Water Quality Criteria
Water quality criteria have been
recommended by the EPA for certain types of
water classified according to use. These
criteria are listed in Table ll-D-3.
1.6 Alternate Test Procedures
The amendments to 304 (g) also provide
procedures for approval of alternate methods.
National approval for test methods is obtained
by application to EPA through EMSL-
Cincinnati while case by case approval is
obtained by application through the EPA
Regional Offices (40 CFR 136.4).
2. Problems in Application
Although the methods described in this
Manual are judged the best available, there are
difficulties in the application of methods in
different geographical areas, in certain wastes
and in some potable and surface waters. Addi-
tional problems can stem from the indiscrimi-
nate use of new and simplified equipment,
supplies or media that have been proposed for
use in these procedures.
2.1 Stressed Microorganisms
Some water and wastewater samples con-
tain microorganisms which should reproduce
but do not under the conditions of test. These
organisms have been described as injured or
stressed cells. The stress may be caused by
temperature changes or chemical treatment
such as chlorine or toxic wastes (1).
Stressed organisms are particularly
important in environmental measurements
because tests for bacterial indicators or
pathogens can give negative responses, then
recover later and multiply to produce
dangerous conditions. Subsections 2.1.1 and
2.1.2 describe efforts to recover stressed
microorganisms.
2.1-1 Ambient Temperature Effects
Extreme ambient temperatures stress
microorganisms and reduce recovery of
microbiological indicators. For example, in
Alaska and other extremely cold areas, the
severe change from cold stream temperature
to 44.5 C temperature of incubation reduces
recovery of fecal conforms. The two-step MF
test for fecal coliforms increases recoveries by
use of a 2-hour acclimation on an enrichment
medium at 35 C before normal incubation at
44.5 C.
In contrast, water samples from natural
waters at high temperatures may include large
numbers of non-coliform organisms which in-
terfere with sheen production on MF's and
with positive gas production in MPN analyses.
An improved MF medium that provides greater
selectivity is desirable but may not be possible
without sacrificing recovery.
92
MICROBIOLOGICAL MANUAL 1978
image:
the Safe Drinking Water Act is given in
Appendix B,
1.2 National Pollution Discharge
Elimination System (NPDES) Guidelines
The NPDES established guidelines for
analysis of pollutants under PL 92-500,
Section 304 (g). The parameters and methods
are described in 40 CFR Part 136, as amended
(40 Code of Federal Regulations, Protection of
the Environment ch. 1 - Environmental
Protection Agency, Part 136, Guidelines
Establishing Test Procedures for the Analysis
of Pollutants). The method must be specified
and MPNs must be five tube, five dilution. See
Table H-D-1.
1.3 Marine Sanitation Regulations
The regulations for marine sanitation
devices (40 CFR Part 140) established
performance standards and specified the
analytical methods as those promulgated in
40 CFR Part 136, cited in 1.2 above.
1.4 Water Quality Standards
Water quality standards (limits) have been
established by law for drinking water and
certain sewage and industrial effluents. These
standards and the reference sources are listed
in Table ll-D-2. A standard must be specified in
the NPDES permitto be enforceable.
1.5 Water Quality Criteria
Water quality criteria have been
recommended by the EPA for certain types of
water classified according to use. These
criteria are listed in Table ll-D-3.
1.6 Alternate Test Procedures
The amendments to 304 (g) also provide
procedures for approval of alternate methods.
National approval for test methods is obtained
by application to EPA through EMSL-
Cincinnati while case by case approval is
obtained by application through the EPA
Regional Offices (40 CFR 136.4).
2. Problems in Application
Although the methods described in this
Manual are judged the best available, there are
difficulties in the application of methods in
different geographical areas, in certain wastes
and in some potable and surface waters. Addi-
tional problems can stem from the indiscrimi-
nate use of new and simplified equipment,
supplies or media that have been proposed for
use in these procedures.
2.1 Stressed Microorganisms
Some water and wastewater samples con-
tain microorganisms which should reproduce
but do not under the conditions of test. These
organisms have been described as injured or
stressed cells. The stress may be caused by
temperature changes or chemical treatment
such as chlorine or toxic wastes (1).
Stressed organisms are particularly
important in environmental measurements
because tests for bacterial indicators or
pathogens can give negative responses, then
recover later and multiply to produce
dangerous conditions. Subsections 2.1.1 and
2.1.2 describe efforts to recover stressed
microorganisms.
2.1-1 Ambient Temperature Effects
Extreme ambient temperatures stress
microorganisms and reduce recovery of
microbiological indicators. For example, in
Alaska and other extremely cold areas, the
severe change from cold stream temperature
to 44.5 C temperature of incubation reduces
recovery of fecal conforms. The two-step MF
test for fecal coliforms increases recoveries by
use of a 2-hour acclimation on an enrichment
medium at 35 C before normal incubation at
44.5 C.
In contrast, water samples from natural
waters at high temperatures may include large
numbers of non-coliform organisms which in-
terfere with sheen production on MF's and
with positive gas production in MPN analyses.
An improved MF medium that provides greater
selectivity is desirable but may not be possible
without sacrificing recovery.
92
MICROBIOLOGICAL MANUAL 1978
image:
 TABLE H-D-1
Approved Test Procedures for the Analysis of Pollutants (40 CFR 136)
Parameter per 100 ml
Fecal
Coliforms
Fecal Conforms in
presence of chlorine
Total
Total
Coliforms
Coliforms in
presence of Chlorine
Fecal
Streptococci
Method
MPN
MF
MPN
MF
MPN
MF
MPN
MF
MPN
MF
Plate Count
Reference and Page No.
SM1 USGS2 This Manual
922
937
922
928, 937
916
928
916
933
943
944
947
Part III
45 Part III
Part III
Part III
Part III
35 Part III
Part III
Part III
Part III
50 Part III
Part III
C, 5
C, 2
C, 5
C, 2
B, 4
B, 2
B, 4
B, 2
D, 4
D, 2
D, 5
Standard Methods for the Examination of Water and Wastewater, 14th Edition, (1975).
Slack, K. V., etal. Methods for Collection and Analysis of Aquatic Biological and
Microbiological Samples. USGS Techniques of Water Resources Inv., Book 5, eh. A4 (1973).
Since the MF technique usually yields low and variable recovery from chlorinated
wastewaters, the MPN method will be required to resolve any controversies.
METHOD SELECTION
93
image:
TABLE H-D-1
Approved Test Procedures for the Analysis of Pollutants (40 CFR 136)
Parameter per 100 ml
Fecal
Coliforms
Fecal Conforms in
presence of chlorine
Total
Total
Coliforms
Coliforms in
presence of Chlorine
Fecal
Streptococci
Method
MPN
MF
MPN
MF
MPN
MF
MPN
MF
MPN
MF
Plate Count
Reference and Page No.
SM1 USGS2 This Manual
922
937
922
928, 937
916
928
916
933
943
944
947
Part III
45 Part III
Part III
Part III
Part III
35 Part III
Part III
Part III
Part III
50 Part III
Part III
C, 5
C, 2
C, 5
C, 2
B, 4
B, 2
B, 4
B, 2
D, 4
D, 2
D, 5
Standard Methods for the Examination of Water and Wastewater, 14th Edition, (1975).
Slack, K. V., etal. Methods for Collection and Analysis of Aquatic Biological and
Microbiological Samples. USGS Techniques of Water Resources Inv., Book 5, eh. A4 (1973).
Since the MF technique usually yields low and variable recovery from chlorinated
wastewaters, the MPN method will be required to resolve any controversies.
METHOD SELECTION
93
image:
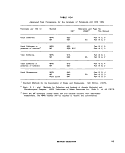 Vegetables
Textiles
Effluents from Marine
Sanitation Devices with
TABLE ll-D-2
Water Quality Standards
Water or
Wastawater
Potable Water
Chlorinated Effluents
2* Treatment Wastes
Selected Industrial Wastes
Leather and Tanning
Feed Lots
Meat Products
Beet Sugar
Canned Fruits and
Microbiological
Standards
Coliforms/100 ml
Total Fecal
<5 —
— 200-400
— 200-400
— 200-400
— 400
— 400
— 400
— 400
— 400
Reference
Source
PL 93-523
PL 92-500
40 CFR Part 133
PL 92-500
40 CFR Part 425
40 CFR Part 412
40 CFR Part 432
40 CFR Part 409
40 CFR Part 407
400
40 CFR Part 410
Discharges
Type I
Type II
— 1000
— . 200
40 CFR Part 140
and Amendments
40 CFR Part 140
and Amendments
94
<&ER& MICROBIOLOGICAL MANUAL 1978
image:
Vegetables
Textiles
Effluents from Marine
Sanitation Devices with
TABLE ll-D-2
Water Quality Standards
Water or
Wastawater
Potable Water
Chlorinated Effluents
2* Treatment Wastes
Selected Industrial Wastes
Leather and Tanning
Feed Lots
Meat Products
Beet Sugar
Canned Fruits and
Microbiological
Standards
Coliforms/100 ml
Total Fecal
<5 —
— 200-400
— 200-400
— 200-400
— 400
— 400
— 400
— 400
— 400
Reference
Source
PL 93-523
PL 92-500
40 CFR Part 133
PL 92-500
40 CFR Part 425
40 CFR Part 412
40 CFR Part 432
40 CFR Part 409
40 CFR Part 407
400
40 CFR Part 410
Discharges
Type I
Type II
— 1000
— . 200
40 CFR Part 140
and Amendments
40 CFR Part 140
and Amendments
94
<&ER& MICROBIOLOGICAL MANUAL 1978
image:
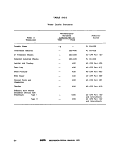 TABLE ll-D-3
Water Quality Criteria
Water or
Wastewater
Public Water Supply
Recreational Water:
Primary Contact
General Contact
Agricultural Water
Shellfish-Raising Waters
.Statistical
Measure
log X
log X/30 days
maximum/30 days,
in 10% of Samples
log X/30 days
maximum/30 days,
in 10% of Samples
monthly X
Daily Median
Highest 10% of
Daily Values
Microbiological Criteria
Coliforms/ 100 mi
Total Fecal
20000 2666""
200
400
1000
,., 2000
5000 1000
70 14
230 43
Reference
Source
A
B
B
B
B
B
C & D ..
A Water Quality Criteria, EPA. March, 1973. Superintendent of Documents, U.S. Government Printing
Office, Washington, DC 20402.
B Water Quality Criteria, FWPCA, April 1,1968. Superintendent of Documents, U.S. Government Printing
Office, Washington, DC 20402.
C National Shellfish Sanitation Program Manual of Operation. U.S. Dept. of. HEW; 1965. Public Health
Service Publ. No. 33, Superintendent of Documents, U.S. Government Printing Office, Washington, DC
20402. .
D Quality Criteria for Water, July 1976, O.W.H.M., US EPA.
METHOD SELECTION
95
image:
TABLE ll-D-3
Water Quality Criteria
Water or
Wastewater
Public Water Supply
Recreational Water:
Primary Contact
General Contact
Agricultural Water
Shellfish-Raising Waters
.Statistical
Measure
log X
log X/30 days
maximum/30 days,
in 10% of Samples
log X/30 days
maximum/30 days,
in 10% of Samples
monthly X
Daily Median
Highest 10% of
Daily Values
Microbiological Criteria
Coliforms/ 100 mi
Total Fecal
20000 2666""
200
400
1000
,., 2000
5000 1000
70 14
230 43
Reference
Source
A
B
B
B
B
B
C & D ..
A Water Quality Criteria, EPA. March, 1973. Superintendent of Documents, U.S. Government Printing
Office, Washington, DC 20402.
B Water Quality Criteria, FWPCA, April 1,1968. Superintendent of Documents, U.S. Government Printing
Office, Washington, DC 20402.
C National Shellfish Sanitation Program Manual of Operation. U.S. Dept. of. HEW; 1965. Public Health
Service Publ. No. 33, Superintendent of Documents, U.S. Government Printing Office, Washington, DC
20402. .
D Quality Criteria for Water, July 1976, O.W.H.M., US EPA.
METHOD SELECTION
95
image:
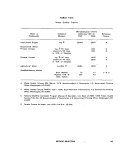 2,1.2 Chlorinated Effluents and Toxic
Wastes
Although thiosulfate is added to all
samples suspected of containing chlorine, to
neutralize its toxic effects, the membrane filter
procedure yields poor recovery of conforms
from chlorinated effluents as compared to
MPN recovery (1-6). A recent amendment to
40 CFR 136 added Coliform bacteria (Fecal) in
the presence of chlorine, as a specific
parameter and recommended analysis by the
MF or MPN techniques (7). A qualifying state-
ment appended to the method in 40 CFR Part
136 requires the five tube, five dilution MPN
and states: "Since the membrane filter
technique usually yields low and variable
recovery from chlorinated wastewaters, the
MPN method will be required to resolve any
controversies." Therefore, the MPN procedure
should be used in analysis of chlorinated
effluents where the data may be challenged by
legal or enforcement actions. The MF may be
used currently for self-monitoring situations.
{See Table ll-D-1).
Proposed changes in MF materials and
procedures include new membrane filter for-
mulations, an agar overlay technique, modified
media and twostep methods (1), Present modi-
fications of the MF method have not produced
recoveries of fecal conforms from chlorinated
effluents equivalent to MPN recoveries. Thor-
ough evaluation and approval of proposed pro-
cedures by EPA are required before changes
will be acceptable.
Certain types of wastes show recovery
problems for total and fecal coliforms:
1. Primary and Chlorinated-Primary
Waste Effluents.
2. Chlorinated-Secondary and Chlor-
inated-Tertiary Waste Effluents.
3. Industrial wastes containing toxic
metals or phenols.
When turbidity and low recovery prevent
the application of the MF technique to coliform
analyses of primary and secondary effluents or
industrial wastes containing toxic materials,
the MPN procedure is required. However, the
two-step MF procedure for total coliforms
described in this Manual and in Standard
Methods is acceptable for toxic wastes.
If the MF procedure is applied to
chlorinated or toxic samples, the laboratory
should require data from at least 10 samples
collected over 1 week of plant processing (but,
not less than 5 calendar days) to show
comparability of the MFtothe MPN technique.
See Part IV-C, 3 for details.
2.2 Incomplete Recovery/Suppression
When coliforms are present in low num-
bers in drinking -water, high levels of non^
coliforms can suppress growth or mask detec-
tion. This problem may appear as a mass of
confluent growth on a membrane filter or as
spots of sheen in this confluent growth. In the
MPN procedure, presumptive tubes may show
heavy growth with no gas bubbles, dilution
skips or unusual tube combinations. When
these negative presumptive tubes are trans-
ferred to BGLB, they confirm in this more re-
strictive medium, indicating that the coliform
gas production in the Presumptive Test was
suppressed by non-coliforms.
2.3 Interference by Turbidity
The tendency of bacteria to clump and
adhere to particles can produce inaccurate
results in the analysis of water samples. The
National Interim Primary Drinking Water Regu-
lations (NIPDWR) specify one turbidity unit as
the primary maximum allowable level but per-
mit up to five turbidity units if this level does
not interfere with disinfection or microbiologi-
cal analyses. Turbidity can interfere with filtra-
tion by causing a clumping of indicators or
clogging of pores. The turbidity as organic
solids can also provide nutrients for bacterial
growth and subsequently produce higher
counts. The type of particles variably affects
the filtration rate; for example, clay, silt or
organic debris clog more easily than sand.
Background organisms may also be imbedded
96
V>EPA MICROBIOLOGICAL MANUAL 1978
image:
2,1.2 Chlorinated Effluents and Toxic
Wastes
Although thiosulfate is added to all
samples suspected of containing chlorine, to
neutralize its toxic effects, the membrane filter
procedure yields poor recovery of conforms
from chlorinated effluents as compared to
MPN recovery (1-6). A recent amendment to
40 CFR 136 added Coliform bacteria (Fecal) in
the presence of chlorine, as a specific
parameter and recommended analysis by the
MF or MPN techniques (7). A qualifying state-
ment appended to the method in 40 CFR Part
136 requires the five tube, five dilution MPN
and states: "Since the membrane filter
technique usually yields low and variable
recovery from chlorinated wastewaters, the
MPN method will be required to resolve any
controversies." Therefore, the MPN procedure
should be used in analysis of chlorinated
effluents where the data may be challenged by
legal or enforcement actions. The MF may be
used currently for self-monitoring situations.
{See Table ll-D-1).
Proposed changes in MF materials and
procedures include new membrane filter for-
mulations, an agar overlay technique, modified
media and twostep methods (1), Present modi-
fications of the MF method have not produced
recoveries of fecal conforms from chlorinated
effluents equivalent to MPN recoveries. Thor-
ough evaluation and approval of proposed pro-
cedures by EPA are required before changes
will be acceptable.
Certain types of wastes show recovery
problems for total and fecal coliforms:
1. Primary and Chlorinated-Primary
Waste Effluents.
2. Chlorinated-Secondary and Chlor-
inated-Tertiary Waste Effluents.
3. Industrial wastes containing toxic
metals or phenols.
When turbidity and low recovery prevent
the application of the MF technique to coliform
analyses of primary and secondary effluents or
industrial wastes containing toxic materials,
the MPN procedure is required. However, the
two-step MF procedure for total coliforms
described in this Manual and in Standard
Methods is acceptable for toxic wastes.
If the MF procedure is applied to
chlorinated or toxic samples, the laboratory
should require data from at least 10 samples
collected over 1 week of plant processing (but,
not less than 5 calendar days) to show
comparability of the MFtothe MPN technique.
See Part IV-C, 3 for details.
2.2 Incomplete Recovery/Suppression
When coliforms are present in low num-
bers in drinking -water, high levels of non^
coliforms can suppress growth or mask detec-
tion. This problem may appear as a mass of
confluent growth on a membrane filter or as
spots of sheen in this confluent growth. In the
MPN procedure, presumptive tubes may show
heavy growth with no gas bubbles, dilution
skips or unusual tube combinations. When
these negative presumptive tubes are trans-
ferred to BGLB, they confirm in this more re-
strictive medium, indicating that the coliform
gas production in the Presumptive Test was
suppressed by non-coliforms.
2.3 Interference by Turbidity
The tendency of bacteria to clump and
adhere to particles can produce inaccurate
results in the analysis of water samples. The
National Interim Primary Drinking Water Regu-
lations (NIPDWR) specify one turbidity unit as
the primary maximum allowable level but per-
mit up to five turbidity units if this level does
not interfere with disinfection or microbiologi-
cal analyses. Turbidity can interfere with filtra-
tion by causing a clumping of indicators or
clogging of pores. The turbidity as organic
solids can also provide nutrients for bacterial
growth and subsequently produce higher
counts. The type of particles variably affects
the filtration rate; for example, clay, silt or
organic debris clog more easily than sand.
Background organisms may also be imbedded
96
V>EPA MICROBIOLOGICAL MANUAL 1978
image:
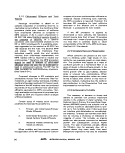 in the particles and interfere with the coliform
detection.
2.4 Analysis of Ground Water
Although total coliforms are a valid mea-
sure of pollution, their use as indicators in
analyzing ground waters and rural community
supplies may not sufficiently describe the
water quality. For example, ground waters fre-
quently contain high total counts of bacteria
with no coliforms. Such waters pass Interim
Drinking Water Regulations buttechnical judg-
ment must conclude these are not acceptable
as potable waters.
2.5 Field Problems
Assurance of data validity demands sam-
ple analyses within the shortest time interval
after collection. This need requires field ana-
lyses using either a mobile laboratory or field
kit equipment. Since a mobile laboratory may
not be available for a survey, it is likely that at
least a part of the analyses will need to be
completed in an onsite facility. If the analyses
can be done using membrane filtration tech-
niques, field kits such as Millipore's Water
Laboratory and MF Portable Incubator (heat
sink) are particularly helpful for rapid set-up
and analyses of limited samples. However, if
large numbers of samples are tested per day or
the survey covers more than a few days, the
heat-sink incubator is Impractical because of
limited capacity and high cost. In such surveys,
a mobile laboratory utilizing water-jacketed in-
cubators is more practical.
2.6 Method Modifications and Kits
Commercial manufacturers continue to of-
fer proprietary kits and method modifications
to speed or simplify the procedures used in
coliform and fecal coliform analyses, primarily
for field use. Most of these units have not been
demonstrated to produce results comparable
to the official procedures. If not tested to the
satisfaction of EPA, such method modifica-
tions and kits cannot be used for establishing
total or fecal coliform numbers for permits
under NPDES or for total coliform numbers
under the Safe Drinking Water Act. The proce-
dure required for acceptance of an alternative
procedure is described in 40 CFR Parts 136.4
and 136.5, as amended.
2.7 Changes in Membrane Filters and
Methodology
There is an expected pattern of changes
in materials and methodology used in the
manufacture of membrane filters. The changes
may or may not be announced by the manu-
facturer. Therefore, it is important for the
laboratory to monitor membrane performance
as described in Section A of Quality Control
in this Manual.
These changes include modification of
formulations and the replacement of the
0.45 Mm pore MF by a 0.7 Mm retention pore
MF for improved recovery. Tests by independ-
ent investigators show that several MF's give
comparable recovery (5, 6, 8, 9), however,
enrichment or two-temperature incubations
are needed before recoveries approach the
MPN values (See 2.1.2 in this Section).
This discussion of problems with new
methodology and membrane materials should
not be interpreted as indicating that EPA dis-
courages new developments. Rather EPA en-
courages the MF supply industry to test and
examine procedures, to innovate and to re-
search. The membrane filter manufacturers
should be commended and encouraged to
continue their efforts toward solving problems
and improving materials and techniques in
water microbiology.
2.8 Klebsiella\n Industrial Wastes
Ktebsiella bacteria (part of the coliform
group) multiply in certain industrial wastes, are
not differentiated from fecal coliforms by MF
and MPN procedures and consequently are
included in the results. These recoveries have
been reported in textile, paper and pulp mills
and other wastes. Objections have been raised
to the application of fecal coliform standards
METHOD SELECTION
97
image:
in the particles and interfere with the coliform
detection.
2.4 Analysis of Ground Water
Although total coliforms are a valid mea-
sure of pollution, their use as indicators in
analyzing ground waters and rural community
supplies may not sufficiently describe the
water quality. For example, ground waters fre-
quently contain high total counts of bacteria
with no coliforms. Such waters pass Interim
Drinking Water Regulations buttechnical judg-
ment must conclude these are not acceptable
as potable waters.
2.5 Field Problems
Assurance of data validity demands sam-
ple analyses within the shortest time interval
after collection. This need requires field ana-
lyses using either a mobile laboratory or field
kit equipment. Since a mobile laboratory may
not be available for a survey, it is likely that at
least a part of the analyses will need to be
completed in an onsite facility. If the analyses
can be done using membrane filtration tech-
niques, field kits such as Millipore's Water
Laboratory and MF Portable Incubator (heat
sink) are particularly helpful for rapid set-up
and analyses of limited samples. However, if
large numbers of samples are tested per day or
the survey covers more than a few days, the
heat-sink incubator is Impractical because of
limited capacity and high cost. In such surveys,
a mobile laboratory utilizing water-jacketed in-
cubators is more practical.
2.6 Method Modifications and Kits
Commercial manufacturers continue to of-
fer proprietary kits and method modifications
to speed or simplify the procedures used in
coliform and fecal coliform analyses, primarily
for field use. Most of these units have not been
demonstrated to produce results comparable
to the official procedures. If not tested to the
satisfaction of EPA, such method modifica-
tions and kits cannot be used for establishing
total or fecal coliform numbers for permits
under NPDES or for total coliform numbers
under the Safe Drinking Water Act. The proce-
dure required for acceptance of an alternative
procedure is described in 40 CFR Parts 136.4
and 136.5, as amended.
2.7 Changes in Membrane Filters and
Methodology
There is an expected pattern of changes
in materials and methodology used in the
manufacture of membrane filters. The changes
may or may not be announced by the manu-
facturer. Therefore, it is important for the
laboratory to monitor membrane performance
as described in Section A of Quality Control
in this Manual.
These changes include modification of
formulations and the replacement of the
0.45 Mm pore MF by a 0.7 Mm retention pore
MF for improved recovery. Tests by independ-
ent investigators show that several MF's give
comparable recovery (5, 6, 8, 9), however,
enrichment or two-temperature incubations
are needed before recoveries approach the
MPN values (See 2.1.2 in this Section).
This discussion of problems with new
methodology and membrane materials should
not be interpreted as indicating that EPA dis-
courages new developments. Rather EPA en-
courages the MF supply industry to test and
examine procedures, to innovate and to re-
search. The membrane filter manufacturers
should be commended and encouraged to
continue their efforts toward solving problems
and improving materials and techniques in
water microbiology.
2.8 Klebsiella\n Industrial Wastes
Ktebsiella bacteria (part of the coliform
group) multiply in certain industrial wastes, are
not differentiated from fecal coliforms by MF
and MPN procedures and consequently are
included in the results. These recoveries have
been reported in textile, paper and pulp mills
and other wastes. Objections have been raised
to the application of fecal coliform standards
METHOD SELECTION
97
image:
 TABLE ll-D-4
Selection of Methods for Problem Samples
Problem Area
Treated Industrial Wastes
(non-chlorinated, non-toxic)
Low Solids Wastes
Parameter Chosen
Fecal Coliform
Method of Choice
Shellfish-harvesting waters
Marine & Estuarine Waters
Total boliform
Fecal Coliform
Total Coliform
Fecal Coliform
MPN' "
MPN'
MF/MPN
MF/MPN
MF
Toxic Industrial Wastes
(metals, phenolics) and
High Solids Wastes
Fecal Coliform
MPN or alternate
procedure, tested
and approved"
Primary and Chlorinated-
Primary Municipal/Industrial
Effluent
Total Coliform
Fecal Coliform
MPN or alternate
procedure, tested
,and approved"
MPN or alternate
procedure, tested
and approved"
Chlorinated-Secondary Effluent
Total Coliform
Fecal Coliform
Two-Step MF
MPN or alternate
procedure, tested
and approved"
*MPN recommended to conform with the MPN method specified for examination of
shellfish. . '.."'
"Requires proof of comparability under. EPA's specified test regime that the alternate
procedure (MF, streak plate, etc.) is valid. See This Manual, IV-C, 3.
98
&EPA MICROBIOLOGICAL MANUAL 1978
image:
TABLE ll-D-4
Selection of Methods for Problem Samples
Problem Area
Treated Industrial Wastes
(non-chlorinated, non-toxic)
Low Solids Wastes
Parameter Chosen
Fecal Coliform
Method of Choice
Shellfish-harvesting waters
Marine & Estuarine Waters
Total boliform
Fecal Coliform
Total Coliform
Fecal Coliform
MPN' "
MPN'
MF/MPN
MF/MPN
MF
Toxic Industrial Wastes
(metals, phenolics) and
High Solids Wastes
Fecal Coliform
MPN or alternate
procedure, tested
and approved"
Primary and Chlorinated-
Primary Municipal/Industrial
Effluent
Total Coliform
Fecal Coliform
MPN or alternate
procedure, tested
,and approved"
MPN or alternate
procedure, tested
and approved"
Chlorinated-Secondary Effluent
Total Coliform
Fecal Coliform
Two-Step MF
MPN or alternate
procedure, tested
and approved"
*MPN recommended to conform with the MPN method specified for examination of
shellfish. . '.."'
"Requires proof of comparability under. EPA's specified test regime that the alternate
procedure (MF, streak plate, etc.) is valid. See This Manual, IV-C, 3.
98
&EPA MICROBIOLOGICAL MANUAL 1978
image:
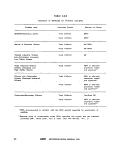 to these wastes because Klebsiella originate
from other than sanitary sources. However,
EPA does consider large numbers of Kleb-
siella, Aeromonas and other noncoliforms as
indicators of organic pollution. Further, these
organisms do occur in low densities in human
and animal wastes.
3. Recommendations for Methods in Waters
and Wastewaters
The amended Federal Water Pollution
Control Act, the Marine Protection, Research
and Sanctuaries Act and the Safe Drinking
Water Act require recommendations on analyt-
ical methodology. Generally, the membrane
filter methods are preferred over MPN and
other techniques, where proven applicable.
In Table ll-D-4, problem samples are
identified and the analytical method recom-
mended for parameters of choice.
REFERENCES
1. Bordner, R. H,, C, F. Frith and J. A. Winter, eds., 1977. Proceedings of the Symposium on
Recovery of Indicator Organisms Employing Membrane Filters, U.S. Environmental Protection
Agency, EPA-600.19-77-024, EMSL-Cincinnati, Cincinnati, OH 45268.
2. Lin, S. D., 1973. Evaluation of coliform tests for chlorinated secondary effluents. JWPCF, 45:3:498.
3. Greene, R. A., R. H. Bordner and P. V. Scarpino, 1974. Applicability of the membrane filter and
most probable number coliform procedures to chlorinated wastewaters. Paper G87 given at
74th Annual Meeting of the American Society for Microbiology, May 12-17, 1974, Chicago, IL.
4. Rose, R; E., E. E. Geldreich and W. Litsky, 1975. Improved membrane filter method for fecal
coliform analysis, Appl. Microbiol. 29:4:532.
5. Lin, S. D., 1976. Evaluation of Millipore HA and HC membrane filters for the enumeration of
indicator bacteria. Appl. Environ. Microbiol. 32:300.
6. Green, 8. L., E. Clausen and W. Litsky, 1975. Comparison of the new Millipore HC with
conventional membrane filters for the enumeration of fecal coliform bacteria. Appl. Microbiol.
30:697.
7. Guidelines for Establishing Test Procedures, 40 Code of Federal Regulations (CFR) Part 136,
Published in Federal Register, 40, 52780, Dec. 1, 1976.
8. Tobin, R. S. and 8. J. Dutka, 1977. Comparison of the surface structure, metal binding, and fecal
coliform recoveries of nine membrane filters. Appl. Environ. Microbiol. 34:69.
9. Lin, S. D., 1977. Comparison of membranes for fecal coliform recovery in chlorinated effluents.
JWPCF, 49:2255.
METHOD SELECTION
99
image:
to these wastes because Klebsiella originate
from other than sanitary sources. However,
EPA does consider large numbers of Kleb-
siella, Aeromonas and other noncoliforms as
indicators of organic pollution. Further, these
organisms do occur in low densities in human
and animal wastes.
3. Recommendations for Methods in Waters
and Wastewaters
The amended Federal Water Pollution
Control Act, the Marine Protection, Research
and Sanctuaries Act and the Safe Drinking
Water Act require recommendations on analyt-
ical methodology. Generally, the membrane
filter methods are preferred over MPN and
other techniques, where proven applicable.
In Table ll-D-4, problem samples are
identified and the analytical method recom-
mended for parameters of choice.
REFERENCES
1. Bordner, R. H,, C, F. Frith and J. A. Winter, eds., 1977. Proceedings of the Symposium on
Recovery of Indicator Organisms Employing Membrane Filters, U.S. Environmental Protection
Agency, EPA-600.19-77-024, EMSL-Cincinnati, Cincinnati, OH 45268.
2. Lin, S. D., 1973. Evaluation of coliform tests for chlorinated secondary effluents. JWPCF, 45:3:498.
3. Greene, R. A., R. H. Bordner and P. V. Scarpino, 1974. Applicability of the membrane filter and
most probable number coliform procedures to chlorinated wastewaters. Paper G87 given at
74th Annual Meeting of the American Society for Microbiology, May 12-17, 1974, Chicago, IL.
4. Rose, R; E., E. E. Geldreich and W. Litsky, 1975. Improved membrane filter method for fecal
coliform analysis, Appl. Microbiol. 29:4:532.
5. Lin, S. D., 1976. Evaluation of Millipore HA and HC membrane filters for the enumeration of
indicator bacteria. Appl. Environ. Microbiol. 32:300.
6. Green, 8. L., E. Clausen and W. Litsky, 1975. Comparison of the new Millipore HC with
conventional membrane filters for the enumeration of fecal coliform bacteria. Appl. Microbiol.
30:697.
7. Guidelines for Establishing Test Procedures, 40 Code of Federal Regulations (CFR) Part 136,
Published in Federal Register, 40, 52780, Dec. 1, 1976.
8. Tobin, R. S. and 8. J. Dutka, 1977. Comparison of the surface structure, metal binding, and fecal
coliform recoveries of nine membrane filters. Appl. Environ. Microbiol. 34:69.
9. Lin, S. D., 1977. Comparison of membranes for fecal coliform recovery in chlorinated effluents.
JWPCF, 49:2255.
METHOD SELECTION
99
image:
 PART III. ANALYTICAL METHODOLOGY
Part 111 of the manual describes the specific analytical procedures selected in response to the
parameters required under PL 92-500 and 93-523 (see Part V-D, Legal Considerations) and to
related parameters for indicators and pathogens which.supplementthe required information. New
parameters and new methodology will be added as proven in actual usage. The methods are
presented in Sections as follows:
Section A Standard Plate Count
Section B Total Coliforms
Section C Fecal Coliforms
Section D Fecal Streptococci
Section E Salmonella
Section F Actinomycetes
100 <&ER& MICROBIOLOGICAL MANUAL 1978
image:
PART III. ANALYTICAL METHODOLOGY
Part 111 of the manual describes the specific analytical procedures selected in response to the
parameters required under PL 92-500 and 93-523 (see Part V-D, Legal Considerations) and to
related parameters for indicators and pathogens which.supplementthe required information. New
parameters and new methodology will be added as proven in actual usage. The methods are
presented in Sections as follows:
Section A Standard Plate Count
Section B Total Coliforms
Section C Fecal Coliforms
Section D Fecal Streptococci
Section E Salmonella
Section F Actinomycetes
100 <&ER& MICROBIOLOGICAL MANUAL 1978
image:
 PART III. ANALYTICAL METHODOLOGY
Section A Standard Plate Count
1. Summary of Method
The Standard Plate Count (SPC) Method is
a direct quantitative measurement of the via-
ble aerobic and facultative anaerobic bacteria
in a water environment, capable of growth on
the selected plating medium. An aliquot of the
water sample or its dilution is pipetted into a
sterile glass or plastic petri dish and a liquified,
tempered agar medium added. The plate is
rotated to evenly distribute the bacteria. Each
colony that develops on or in the agar medium
originates theoretically from one bacterial cell.
Although no one set of plate count conditions
can enumerate all organisms present, the
Standard Plate Count Method provides the uni-
form technique required for comparative test-
ing and for monitoring water quality in se-
lected situations.
2. Scope and Application (1 -6)
This simple technique is a useful tool for
determining the bacterial density of potable
waters and for quality control studies of water
treatment processes. The Standard Plate
Count provides a method for monitoring
changes in the bacteriological quality of fin-
ished water throughout a distribution system,
thus giving an indication of the effectiveness
of chlorine in the system as well as the possi-
ble existence of cross-connections, sediment
accumulations and other problems within the
distribution lines. Jots.', bacterial densities
greater than 500-1000 organisms per ml may
indicate coliform suppression or desensitiza-
tion of quantitative tests for coliforms (1-3).
The procedure may also be used to monitor
quality changes in bottled water or emergency
water supplies.
2.1 Theoretically, each bacterium present
in a sample multiplies into a visible colony of
millions of bacteria. However, no standard
plate count or any other total count procedure
yields the true number because not all viable
bacterial cells in the water sample can repro-
duce under a single set of cultural conditions
imposed in the test. The number and types of
bacteria that develop are influenced by the
time and temperature of incubation, the pH of
the medium, the level of oxygen, the presence
of specific nutrients in the growth medium,
competition among cells for nutrients, anti-
biosis, predation, etc.
2.2 This procedure does not allow the
more fastidious aerobes or obligate anaerobes
to develop. Also, ba'cteria of possible impor-
tance in water such as Crenothrix, Sphaeroti-
lus, and the actinomycetes will not develop
within the incubation period specified for pota-
ble water analysis.
2.3 Clumps of organisms in the water sam-
ple which are not broken up by shaking result
in underestimates of bacterial density, since
an aggregate of cells will appear as one colony
on the growth medium.
STANDARD PLATE COUNT
101
image:
PART III. ANALYTICAL METHODOLOGY
Section A Standard Plate Count
1. Summary of Method
The Standard Plate Count (SPC) Method is
a direct quantitative measurement of the via-
ble aerobic and facultative anaerobic bacteria
in a water environment, capable of growth on
the selected plating medium. An aliquot of the
water sample or its dilution is pipetted into a
sterile glass or plastic petri dish and a liquified,
tempered agar medium added. The plate is
rotated to evenly distribute the bacteria. Each
colony that develops on or in the agar medium
originates theoretically from one bacterial cell.
Although no one set of plate count conditions
can enumerate all organisms present, the
Standard Plate Count Method provides the uni-
form technique required for comparative test-
ing and for monitoring water quality in se-
lected situations.
2. Scope and Application (1 -6)
This simple technique is a useful tool for
determining the bacterial density of potable
waters and for quality control studies of water
treatment processes. The Standard Plate
Count provides a method for monitoring
changes in the bacteriological quality of fin-
ished water throughout a distribution system,
thus giving an indication of the effectiveness
of chlorine in the system as well as the possi-
ble existence of cross-connections, sediment
accumulations and other problems within the
distribution lines. Jots.', bacterial densities
greater than 500-1000 organisms per ml may
indicate coliform suppression or desensitiza-
tion of quantitative tests for coliforms (1-3).
The procedure may also be used to monitor
quality changes in bottled water or emergency
water supplies.
2.1 Theoretically, each bacterium present
in a sample multiplies into a visible colony of
millions of bacteria. However, no standard
plate count or any other total count procedure
yields the true number because not all viable
bacterial cells in the water sample can repro-
duce under a single set of cultural conditions
imposed in the test. The number and types of
bacteria that develop are influenced by the
time and temperature of incubation, the pH of
the medium, the level of oxygen, the presence
of specific nutrients in the growth medium,
competition among cells for nutrients, anti-
biosis, predation, etc.
2.2 This procedure does not allow the
more fastidious aerobes or obligate anaerobes
to develop. Also, ba'cteria of possible impor-
tance in water such as Crenothrix, Sphaeroti-
lus, and the actinomycetes will not develop
within the incubation period specified for pota-
ble water analysis.
2.3 Clumps of organisms in the water sam-
ple which are not broken up by shaking result
in underestimates of bacterial density, since
an aggregate of cells will appear as one colony
on the growth medium.
STANDARD PLATE COUNT
101
image:
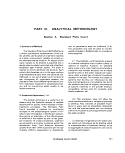 3. Apparatus and Materials
5. Procedure
3.1 Incubator that maintains a stable 35
±0.5 C. Temperature is checked against an
NBS certified thermometer or one of equivalent
accuracy.
3.2 Water bath for tempering agar set at
44-4 6 C.
3.3 Colony Counter, Quebec darkfield
model or equivalent.
3.4 Hand tally or electronic counting de-
vice {optional).
3.5 Pipet containers of stainless steel, alu-
minum or pyrex glass for glass pipets.
3.6 Petrl dish containers of stainless steel
or aluminum for glass petri dishes.
3.7 Thermometer certified by National
Bureau of Standards or one of equivalent
accuracy, with calibration chart.
3.8 Sterile TD (To Deliver) bacteriological
or Mohr pipets, glass or plastic of appropriate
volumes, see Part ll-B, 1.8.1.
3.9 Sterile 100 mm x 15 mm petri dishes,
glass or plastic.
3.10 Dilution bottles (milk dilution), pyrex
glass, marked at 99 ml volume, screw cap with
neoprene rubber liner.
3.11 Bunsen/Fisher gas burner or electric
Incinerator.
4. Media
4.1 Sterile Plate Count Agar (Tryptone Glu-
cose Yeast Agar) dispensed in tubes (15 to 20
ml per tube) or in bulk quantities in screw cap
flasks or dilution bottles. See Part II-B, 5.1.5.
4.2 Sterile buffered dilution water, 99 ± 2
ml volumes, in screwcapped dilution bottles.
See Part II-B, 7.
5.1 Dilution of Sample (See Part il-C, 1.4
for details)
5.1.1 The sample is diluted to obtain final
plate counts of 30-300 colonies. In this range,
the plate counts are *he most accurate and
precise possible. Sir^v the microbiai popula-
tion in the original water sample is not known
beforehand, a series of dilutions must be pre-
pared and plated to obtain a plate count within
this range.
•5.1.2 For most potable water samples,
countable plates can be obtained by plating 1
and 0.1 ml of the undiluted sample, and 1 ml of
the 1:100 sample dilution (see Figure lll-A-1).
Higher dilutions may be necessary with some
potable waters.
5.1.3 Shake the sample vigorously about
25 times.
5.1:4 Prepare an initial 1:100 dilution by
pipetting 1 ml of the sample into a 99 ml
dilution water blank using a sterile 1 ml pipet
(see Figure lll-A-1).
5.1.5 The 1:100 dilution bottle is vigor-
ously shaken and further dilutions made by
pipetting aliquots (usually 1 ml) into additional
dilution blanks. A new sterile pipet must be
used for each transfer and each dilution must
be thoroughly shaken before removing an ali-
quot for subsequent dilution.
5.1.6 When an aliquot is removed, the
pipet tip should not be inserted more than 2.5
cm (1 inch) below the surface of the liquid.
5.2 Preparation of Agar
5.2.1 Melt prepared plate count agar (tryp-
tone glucose yeast agar) by heating in boiling
water or by flowing steam in an autoclave at
100 C. Do not allow the medium to remain at
these high temperatures beyond the time nec-
essary to melt it. Prepared agar should be
melted once only.
5.2.2 Place melted agar in a tempering
water bath maintained at a temperature of
44-46 C. Do not hold agar at this temperature
102
MICROBIOLOGICAL MANUAL 1978
image:
3. Apparatus and Materials
5. Procedure
3.1 Incubator that maintains a stable 35
±0.5 C. Temperature is checked against an
NBS certified thermometer or one of equivalent
accuracy.
3.2 Water bath for tempering agar set at
44-4 6 C.
3.3 Colony Counter, Quebec darkfield
model or equivalent.
3.4 Hand tally or electronic counting de-
vice {optional).
3.5 Pipet containers of stainless steel, alu-
minum or pyrex glass for glass pipets.
3.6 Petrl dish containers of stainless steel
or aluminum for glass petri dishes.
3.7 Thermometer certified by National
Bureau of Standards or one of equivalent
accuracy, with calibration chart.
3.8 Sterile TD (To Deliver) bacteriological
or Mohr pipets, glass or plastic of appropriate
volumes, see Part ll-B, 1.8.1.
3.9 Sterile 100 mm x 15 mm petri dishes,
glass or plastic.
3.10 Dilution bottles (milk dilution), pyrex
glass, marked at 99 ml volume, screw cap with
neoprene rubber liner.
3.11 Bunsen/Fisher gas burner or electric
Incinerator.
4. Media
4.1 Sterile Plate Count Agar (Tryptone Glu-
cose Yeast Agar) dispensed in tubes (15 to 20
ml per tube) or in bulk quantities in screw cap
flasks or dilution bottles. See Part II-B, 5.1.5.
4.2 Sterile buffered dilution water, 99 ± 2
ml volumes, in screwcapped dilution bottles.
See Part II-B, 7.
5.1 Dilution of Sample (See Part il-C, 1.4
for details)
5.1.1 The sample is diluted to obtain final
plate counts of 30-300 colonies. In this range,
the plate counts are *he most accurate and
precise possible. Sir^v the microbiai popula-
tion in the original water sample is not known
beforehand, a series of dilutions must be pre-
pared and plated to obtain a plate count within
this range.
•5.1.2 For most potable water samples,
countable plates can be obtained by plating 1
and 0.1 ml of the undiluted sample, and 1 ml of
the 1:100 sample dilution (see Figure lll-A-1).
Higher dilutions may be necessary with some
potable waters.
5.1.3 Shake the sample vigorously about
25 times.
5.1:4 Prepare an initial 1:100 dilution by
pipetting 1 ml of the sample into a 99 ml
dilution water blank using a sterile 1 ml pipet
(see Figure lll-A-1).
5.1.5 The 1:100 dilution bottle is vigor-
ously shaken and further dilutions made by
pipetting aliquots (usually 1 ml) into additional
dilution blanks. A new sterile pipet must be
used for each transfer and each dilution must
be thoroughly shaken before removing an ali-
quot for subsequent dilution.
5.1.6 When an aliquot is removed, the
pipet tip should not be inserted more than 2.5
cm (1 inch) below the surface of the liquid.
5.2 Preparation of Agar
5.2.1 Melt prepared plate count agar (tryp-
tone glucose yeast agar) by heating in boiling
water or by flowing steam in an autoclave at
100 C. Do not allow the medium to remain at
these high temperatures beyond the time nec-
essary to melt it. Prepared agar should be
melted once only.
5.2.2 Place melted agar in a tempering
water bath maintained at a temperature of
44-46 C. Do not hold agar at this temperature
102
MICROBIOLOGICAL MANUAL 1978
image:
 FIGURE lll-A-1. Typical Dilution Series for Standard Plate Count
STANDARD PLATE COUNT
103
image:
FIGURE lll-A-1. Typical Dilution Series for Standard Plate Count
STANDARD PLATE COUNT
103
image:
 longer than three hours because precipitates
may form which confuse the counting of colo-
nies. Maintain a thermometer immersed in a
separate bottle or flask in the water bath to
monitor the temperature.
5.3 Preparation for Plating
5.3.1 Prepare at least duplicate plates for
each sample or dilution tested. Mark and ar-
range plates in a reasonable order for use.
Prepare a bench sheet or card, including sam-
ple identity, dilutions, date and other relevant
information.
5.3.2 Aseptically pipet an aliquot from the
appropriate dilution into the bottom of each
petri dish. Use a separate sterile pipet to trans-
fer an aliquot to each set of petri dishes for
each sample or sample dilution used. Vigor-
ously shake the undiluted sample and dilution
containers before each transfer is made.
5.3.3 Pipet sample or sample dilution into
marked petri dish. After delivery, touch the tip
once to a dry spot in the dish.
5.3.4 To minimize bacterial density
changes in the samples, do not prepare any
more samples than can be diluted and plated
within 20-25 minutes.
5.4 Pouring Agar Plates
5.4.1 Use the thermometer in the control
bottle in the tempering bath to check the tem-
perature of the plating medium before
pouring.
5.4.2 Add not less than 12 ml (usually
12-15"ml) of the melted and cooled (44-46 C)
agar medium to each petri dish containing an
aliquot of the sample or its dilution. Mix the
inoculated medium carefully to prevent spill-
ing. Avoid splashing the inside of the cover.
One recommended technique rotates plate
five times to left, five times to the right and five
times in a back and forth motion.
5.4.3 Pipet a one m! volume of sterile
dilution water into a petri dish, add agar, mix
and incubate with test plates. This control
plate will check the sterility of pipets, agar,
dilution water and petri dishes. See Part IV-C,
1.3.
5.5 Incubation of Plated Samples
5.5.1 After agar plates have hardened on a
level surface (usually within 10 minutes), invert
the plates and immediately incubate at 35 C.
5.5.2 Incubate tests on all water samples
except bottled water at 35 ± 0.5 C for 48 ± 3
hours. Incubate the tests on bottled water at
35 .± 0.5 C for 72 ± 4 hours. The longer
incubation is required to recover organisms in
bottled water with longer generation times.
5.5.3 Stacks of plates should be at least
2.5 cm from adjacent stacks, the top or sides
of the incubator. Do not stack plates more than
four high. These precautions allow proper
circulation of air to maintain uniform tempera-
ture throughout the incubator and speed
equilibration.
5.6 Counting and Recording Colonies:
After the required incubation period, examine
plates and select those with 30-300 colonies.
Count these plates immediately. A Quebec-
type colony counter equipped with a guide
plate, appropriate magnification and light is
recommended for use with a hand tally.
5.6.1 Electronic-assist devices are avail-
able which register colony counts with a sens-
ing probe and automatically tabulate the total
plate count.
Fully-automatic colony counters are avail-
able which count all colonies (particles) larger
than a preset threshold-size. These counters
scan and provide digital register and a visual
image of the plate for further examination and
recounting with different threshold if so
desired.
Because the accuracy of automatic cen-
ters varies with the size and number of colo-
nies per plate, the analyst should periodically
compare its results with manual counts.
104
oEPA MICROBIOLOGICAL MANUAL 1978
image:
longer than three hours because precipitates
may form which confuse the counting of colo-
nies. Maintain a thermometer immersed in a
separate bottle or flask in the water bath to
monitor the temperature.
5.3 Preparation for Plating
5.3.1 Prepare at least duplicate plates for
each sample or dilution tested. Mark and ar-
range plates in a reasonable order for use.
Prepare a bench sheet or card, including sam-
ple identity, dilutions, date and other relevant
information.
5.3.2 Aseptically pipet an aliquot from the
appropriate dilution into the bottom of each
petri dish. Use a separate sterile pipet to trans-
fer an aliquot to each set of petri dishes for
each sample or sample dilution used. Vigor-
ously shake the undiluted sample and dilution
containers before each transfer is made.
5.3.3 Pipet sample or sample dilution into
marked petri dish. After delivery, touch the tip
once to a dry spot in the dish.
5.3.4 To minimize bacterial density
changes in the samples, do not prepare any
more samples than can be diluted and plated
within 20-25 minutes.
5.4 Pouring Agar Plates
5.4.1 Use the thermometer in the control
bottle in the tempering bath to check the tem-
perature of the plating medium before
pouring.
5.4.2 Add not less than 12 ml (usually
12-15"ml) of the melted and cooled (44-46 C)
agar medium to each petri dish containing an
aliquot of the sample or its dilution. Mix the
inoculated medium carefully to prevent spill-
ing. Avoid splashing the inside of the cover.
One recommended technique rotates plate
five times to left, five times to the right and five
times in a back and forth motion.
5.4.3 Pipet a one m! volume of sterile
dilution water into a petri dish, add agar, mix
and incubate with test plates. This control
plate will check the sterility of pipets, agar,
dilution water and petri dishes. See Part IV-C,
1.3.
5.5 Incubation of Plated Samples
5.5.1 After agar plates have hardened on a
level surface (usually within 10 minutes), invert
the plates and immediately incubate at 35 C.
5.5.2 Incubate tests on all water samples
except bottled water at 35 ± 0.5 C for 48 ± 3
hours. Incubate the tests on bottled water at
35 .± 0.5 C for 72 ± 4 hours. The longer
incubation is required to recover organisms in
bottled water with longer generation times.
5.5.3 Stacks of plates should be at least
2.5 cm from adjacent stacks, the top or sides
of the incubator. Do not stack plates more than
four high. These precautions allow proper
circulation of air to maintain uniform tempera-
ture throughout the incubator and speed
equilibration.
5.6 Counting and Recording Colonies:
After the required incubation period, examine
plates and select those with 30-300 colonies.
Count these plates immediately. A Quebec-
type colony counter equipped with a guide
plate, appropriate magnification and light is
recommended for use with a hand tally.
5.6.1 Electronic-assist devices are avail-
able which register colony counts with a sens-
ing probe and automatically tabulate the total
plate count.
Fully-automatic colony counters are avail-
able which count all colonies (particles) larger
than a preset threshold-size. These counters
scan and provide digital register and a visual
image of the plate for further examination and
recounting with different threshold if so
desired.
Because the accuracy of automatic cen-
ters varies with the size and number of colo-
nies per plate, the analyst should periodically
compare its results with manual counts.
104
oEPA MICROBIOLOGICAL MANUAL 1978
image:
 5.6.2 The following rules should be used
to report the Standard Plate Count:
^ p|ates with 30 to 300 Colonies: Count
all colonies and divide by the volume tested (in
ml). If replicate plates from one dilution are
countable (30-300), sum the counts of colo-
nies on all plates and divide by the volumes
tested (in mi) as follows:
Sum of Colonies
Sum of Volumes Tested, ml
= S.P. Count/ml
Record the dilutions used, the number of
colonies on each plate and report as the Stan-
dard Plate Count per milliliter.
If two or more consecutive dilutions are
countable, independently carry each calcula-
tion of plate count to a final count per ml, then
calculate the mean of these counts/ml for the
reported value.
For example, if 280 and 34 colonies are
counted in the 1:100 and 1:1000 dilutions of a
water sample, the calculation is:
= 28,000/ml
= 34,000/ml
28000 + 34000
Reporting Value =
f_
= 31000 SPC/mi
(b) All Plates with Fewer than 30 Colonies:
If there are less than 30 colonies on all plates,
record the actual number of colonies on the
lowest dilution plated and report the count as:
Estimated Standard Plate Count per milliliter.
For example, if volumes of 0.1,0.01 and 0.001
ml were plated and produced counts of 22, 2
and 0 colonies respectively, the colony count
of 22 from the largest sample volume (0.1 ml)
would be selected, calculated and reported as
follows:
Plate Count
Volume Plate
22
0.1
Count reported: Estimated Standard Plate
Count, 220/ml.
(c) If 1 ml volumes of original sample
produce counts < 30, actual counts are
reported.
(d) Plate with No Colonies: If all plates from
dilutions tested show no colonies, report the
count as < 1 times the lowest dilution plated.
For example, if 0.1, 0.01 and 0.001 ml vol-
umes of sample were tested with no visible
colonies developing, the lowest dilution, 0,1
ml would be used to calculate a less than (<)
count as follows:
1
Volume Tested
1
"o~T
= < 10
Count reported: Standard Plate Count,
^ Al1 Plates Greater than 300 Colonies:
When counts per plate in the highest dilution
exceed 300 colonies, compute the count by
multiplying the mean count by the dilution
used and report as a greater than ( > ), Standard
Plate Count per milliliter. For example, if
duplicate 1.0, 0.1 and 0.01 volumes of sample
were tested with average counts of > 500,
> 500 and 340 developing in the dilutions, the
count would be calculated as follows:
Plate Count
Volume Tested
= 34,000
220
or count reported as: Standard Plate Count,
> 34,000/ml.
5.6.3 Count Estimations on Crowded
Plates: The square divisions of the grid on the
Quebec or similar colony counter can be used
to estimate the numbers of bacteria per plate.
With less than 10 colonies per sq cm count the
colonies in 13 squares with representative
distribution of colonies. Select 7 consecutive
horizontal squares and 6 consecutive vertical
STANDARD PLATE COUNT
105
image:
5.6.2 The following rules should be used
to report the Standard Plate Count:
^ p|ates with 30 to 300 Colonies: Count
all colonies and divide by the volume tested (in
ml). If replicate plates from one dilution are
countable (30-300), sum the counts of colo-
nies on all plates and divide by the volumes
tested (in mi) as follows:
Sum of Colonies
Sum of Volumes Tested, ml
= S.P. Count/ml
Record the dilutions used, the number of
colonies on each plate and report as the Stan-
dard Plate Count per milliliter.
If two or more consecutive dilutions are
countable, independently carry each calcula-
tion of plate count to a final count per ml, then
calculate the mean of these counts/ml for the
reported value.
For example, if 280 and 34 colonies are
counted in the 1:100 and 1:1000 dilutions of a
water sample, the calculation is:
= 28,000/ml
= 34,000/ml
28000 + 34000
Reporting Value =
f_
= 31000 SPC/mi
(b) All Plates with Fewer than 30 Colonies:
If there are less than 30 colonies on all plates,
record the actual number of colonies on the
lowest dilution plated and report the count as:
Estimated Standard Plate Count per milliliter.
For example, if volumes of 0.1,0.01 and 0.001
ml were plated and produced counts of 22, 2
and 0 colonies respectively, the colony count
of 22 from the largest sample volume (0.1 ml)
would be selected, calculated and reported as
follows:
Plate Count
Volume Plate
22
0.1
Count reported: Estimated Standard Plate
Count, 220/ml.
(c) If 1 ml volumes of original sample
produce counts < 30, actual counts are
reported.
(d) Plate with No Colonies: If all plates from
dilutions tested show no colonies, report the
count as < 1 times the lowest dilution plated.
For example, if 0.1, 0.01 and 0.001 ml vol-
umes of sample were tested with no visible
colonies developing, the lowest dilution, 0,1
ml would be used to calculate a less than (<)
count as follows:
1
Volume Tested
1
"o~T
= < 10
Count reported: Standard Plate Count,
^ Al1 Plates Greater than 300 Colonies:
When counts per plate in the highest dilution
exceed 300 colonies, compute the count by
multiplying the mean count by the dilution
used and report as a greater than ( > ), Standard
Plate Count per milliliter. For example, if
duplicate 1.0, 0.1 and 0.01 volumes of sample
were tested with average counts of > 500,
> 500 and 340 developing in the dilutions, the
count would be calculated as follows:
Plate Count
Volume Tested
= 34,000
220
or count reported as: Standard Plate Count,
> 34,000/ml.
5.6.3 Count Estimations on Crowded
Plates: The square divisions of the grid on the
Quebec or similar colony counter can be used
to estimate the numbers of bacteria per plate.
With less than 10 colonies per sq cm count the
colonies in 13 squares with representative
distribution of colonies. Select 7 consecutive
horizontal squares and 6 consecutive vertical
STANDARD PLATE COUNT
105
image:
 squares for counting. Sum the colonies in
these 13 sq cm, and multiply by 5 to estimate
the colonies per plate for glass plates (area of
65 sq cm) or multiply by 4.32 for plastic plates
(area of 57 sq cm). With more than 10 colonies
per sq cm, count 4 representative squares,
average the count per sq cm, multiply by the
number of sq cm/plate (usually 65 for glass
plates and 57 for plastic plates) to estimate the
colonies per plate. Then multiply by the
reciprocal of the dilution to determine the
count/rnl. When bacterial counts on crowded
plates are greater than 100 colonies per sq
cm, report the result as Estimated Standard
Plate Count greater than (>) 6,500 times the
highest dilution plated.
5.6,4 Spreaders: Plates containing
spreading colonies must be so reported on the
data sheet. If spreaders exceed one-half of the
total plate area, the plate is not used. Report as:
No results, spreaders.
Colonies can be counted on
representative portions of plates if spreading
colonies constitute less than one-half of the
total plate area, and the colonies are well-
distributed in the remaining portion of the
plate.
(a) Count each chain of colonies as a single
colony.
(b) Count each spreader colony that
develops as a film of growth between the agar
and the petri dish bottom as one colony.
(c) Countthe growth that develops in a film
of water at the edge or over the surface of the
agar as one colony.
(d) Adjust count for entire plate and report
as: Estimated Standard Plate Count/ml.
5.6.5 Remarks ori Data Sheet: Any
unusual occurrences such as missed dilutions,
loss of plates through breakage,
contamination of equipment, materials, media,
or the laboratory environment, as shown by
sterility control plates, must be noted on the
data sheet. Report as: Lab Accident, etc.
6. Reporting Results
Report Standard Plate Count or Estimated
Standard Plate Count as colonies per ml, not
per 100ml.
Standard Plate Counts should be rounded
to the number of significant figures (S.F.)
obtainable in the procedure: 1 S.F. for 0-9
actual plate counts, 2 S.F. for 10-99 actual
plate counts and 3 S.F. for 100-300 actual
plate counts. See Part II-C, 2.8.1 of this
manual.
7. Precision and Accuracy
7.1 Prescott et an[ (7) reported that the
standard deviation of individual counts from
30-300 will vary from 0-30 percent. This
plating error was 10% for plate counts within
the 100-300 range. A dilution error of about
3% for each dilution stage is incurred in
addition to the plating error. Large variations
can be expected from high density samples
such as sewage for which several dilutions are
necessary.
7.2 Laboratory personnel should be able
to duplicate their plate count values on the
same plate within 5%, and the counts of others
within 10%. If analysts'counts do not agree,
review counting procedures for analyst error.
106
MICROBIOLOGICAL MANUAL 1978
image:
squares for counting. Sum the colonies in
these 13 sq cm, and multiply by 5 to estimate
the colonies per plate for glass plates (area of
65 sq cm) or multiply by 4.32 for plastic plates
(area of 57 sq cm). With more than 10 colonies
per sq cm, count 4 representative squares,
average the count per sq cm, multiply by the
number of sq cm/plate (usually 65 for glass
plates and 57 for plastic plates) to estimate the
colonies per plate. Then multiply by the
reciprocal of the dilution to determine the
count/rnl. When bacterial counts on crowded
plates are greater than 100 colonies per sq
cm, report the result as Estimated Standard
Plate Count greater than (>) 6,500 times the
highest dilution plated.
5.6,4 Spreaders: Plates containing
spreading colonies must be so reported on the
data sheet. If spreaders exceed one-half of the
total plate area, the plate is not used. Report as:
No results, spreaders.
Colonies can be counted on
representative portions of plates if spreading
colonies constitute less than one-half of the
total plate area, and the colonies are well-
distributed in the remaining portion of the
plate.
(a) Count each chain of colonies as a single
colony.
(b) Count each spreader colony that
develops as a film of growth between the agar
and the petri dish bottom as one colony.
(c) Countthe growth that develops in a film
of water at the edge or over the surface of the
agar as one colony.
(d) Adjust count for entire plate and report
as: Estimated Standard Plate Count/ml.
5.6.5 Remarks ori Data Sheet: Any
unusual occurrences such as missed dilutions,
loss of plates through breakage,
contamination of equipment, materials, media,
or the laboratory environment, as shown by
sterility control plates, must be noted on the
data sheet. Report as: Lab Accident, etc.
6. Reporting Results
Report Standard Plate Count or Estimated
Standard Plate Count as colonies per ml, not
per 100ml.
Standard Plate Counts should be rounded
to the number of significant figures (S.F.)
obtainable in the procedure: 1 S.F. for 0-9
actual plate counts, 2 S.F. for 10-99 actual
plate counts and 3 S.F. for 100-300 actual
plate counts. See Part II-C, 2.8.1 of this
manual.
7. Precision and Accuracy
7.1 Prescott et an[ (7) reported that the
standard deviation of individual counts from
30-300 will vary from 0-30 percent. This
plating error was 10% for plate counts within
the 100-300 range. A dilution error of about
3% for each dilution stage is incurred in
addition to the plating error. Large variations
can be expected from high density samples
such as sewage for which several dilutions are
necessary.
7.2 Laboratory personnel should be able
to duplicate their plate count values on the
same plate within 5%, and the counts of others
within 10%. If analysts'counts do not agree,
review counting procedures for analyst error.
106
MICROBIOLOGICAL MANUAL 1978
image:
 REFERENCES
1. Geldreich, E. E,, H, D. Nash, D. J, Reasoner and R. H. Taylor, 1972. The necessity of controlling
bacterial populations in potable waters: Community Water Supply, J. Amer. Water Works Assoc.
64:596. • • • .
2. Geldreich, E. E., H. D. Nash, D. J. Reasoner and R. H. Taylor, 1975. The necessity of controlling
bacterial populations in potable waters: Bottled Water and Emergency Water Supplies. J. Amer.
Waterworks Assoc. 67:117. .
3, Geldreich, E. E., 1973. Is the total count necessary? 1st AWWA Technology Conference
Proceedings, Amer. Waterworks Assoc. VII-1, Cincinnati, Ohio.
4. Clark, D. S., 1971. Studies on the surface plate method of counting bacteria. Can. J. Microbiol.
•V7:943 ' ' < "> . . ''
5. Klein, D. A, and S. Wu, 1974. Stress: a factor to be considered in heterotrophic microorganism
enumeration from aquatic environments. Appl. Microbiol. 27:429.
6. Van Soestbergen, A. A. and C; H. Lee, 1969. Pour plates or streak plates? Appl. Microbiol.
1^8:1092.
7. Prescott, S. C,. C-E. A. Winslow, and M. H. McCrady, 1946. Water Bacteriology. (6th ed.) John
Wiley and Sons, Inc., p. 46-50. '
STANDARD PLATE COUNT 107
image:
REFERENCES
1. Geldreich, E. E,, H, D. Nash, D. J, Reasoner and R. H. Taylor, 1972. The necessity of controlling
bacterial populations in potable waters: Community Water Supply, J. Amer. Water Works Assoc.
64:596. • • • .
2. Geldreich, E. E., H. D. Nash, D. J. Reasoner and R. H. Taylor, 1975. The necessity of controlling
bacterial populations in potable waters: Bottled Water and Emergency Water Supplies. J. Amer.
Waterworks Assoc. 67:117. .
3, Geldreich, E. E., 1973. Is the total count necessary? 1st AWWA Technology Conference
Proceedings, Amer. Waterworks Assoc. VII-1, Cincinnati, Ohio.
4. Clark, D. S., 1971. Studies on the surface plate method of counting bacteria. Can. J. Microbiol.
•V7:943 ' ' < "> . . ''
5. Klein, D. A, and S. Wu, 1974. Stress: a factor to be considered in heterotrophic microorganism
enumeration from aquatic environments. Appl. Microbiol. 27:429.
6. Van Soestbergen, A. A. and C; H. Lee, 1969. Pour plates or streak plates? Appl. Microbiol.
1^8:1092.
7. Prescott, S. C,. C-E. A. Winslow, and M. H. McCrady, 1946. Water Bacteriology. (6th ed.) John
Wiley and Sons, Inc., p. 46-50. '
STANDARD PLATE COUNT 107
image:
 PART III. ANALYTICAL METHODOLOGY
Section B Total Coliform Methods
This section describes the enumerative
techniques for total coliform bacteria in water
and wastewater. The method chosen depends
upon the characteristics of the sample. The
Section is divided as follows:
Definition of the Coliform
Group
Single-Step, Two-Step
and Delayed-lncubation
Membrane Filter (MF)
Methods
2. Single-Step, Two-Step and Delayed-
lncubation Membrane Filter Methods
2,1 Summary: An appropriate volume of a
water sample or its dilution is passed through
a membrane filter that retains the bacteria
present in the sample.
In the single-step procedure the filter retaining
the microorganisms is placed on M-Endo agar,
LES M-Endo agar or on an absorbent pad satu-
rated with M-Endo broth Jn a petri dish. The
test is incubated at 35 C for 24 hours.
3. Verification
4. Most Probable Number
(MPN) Method
Differentiation of the
Coliform Group by Further
Biochemical Tests
1. Definition of the Coliform Group
The cotiform or total coliform group
includes ail of the aerobic and facultative an-
aerobic, gram-negative, nonspore-formlng,
rod-shaped bacteria that ferment lactose in
24-48 hours at 35 C. The definition includes
the genera: Escherichia, Citrobacter, Entero-
bactar, and Klebsietla.
In the two-step enrichment procedure the filter
retaining the microorganisms is placed on an
absorbent pad saturated with lauryl tryptose
(lauryl sulfate) broth. After incubation for 2
hours at 35 C, the filter is transferred to an
absorbent pad saturated with M-Endo broth,
M-Endo agar, or LES M-Endo agar, and incu-
bated for an additional 20-22 hours at 35 C.
The sheen colonies are counted under low
magnification and the numbers of total coli-
forms are reported per 100 ml of original
sample.
In the delayed-incubation procedure, the
filter retaining the microorganisms is placed
on an absorbent pad saturated with M-Endo
preservative medium in a tight-lidded petri
dish and transported from field site to the
laboratory. In the laboratory, the filter is trans-
ferred to M-Endo growth medium and incu-
bated at 35 C for 24 hours. Sheen colonies are
counted as total coliforms per 100 ml.
108
•SEPA MICROBIOLOGICAL MANUAL 1978
image:
PART III. ANALYTICAL METHODOLOGY
Section B Total Coliform Methods
This section describes the enumerative
techniques for total coliform bacteria in water
and wastewater. The method chosen depends
upon the characteristics of the sample. The
Section is divided as follows:
Definition of the Coliform
Group
Single-Step, Two-Step
and Delayed-lncubation
Membrane Filter (MF)
Methods
2. Single-Step, Two-Step and Delayed-
lncubation Membrane Filter Methods
2,1 Summary: An appropriate volume of a
water sample or its dilution is passed through
a membrane filter that retains the bacteria
present in the sample.
In the single-step procedure the filter retaining
the microorganisms is placed on M-Endo agar,
LES M-Endo agar or on an absorbent pad satu-
rated with M-Endo broth Jn a petri dish. The
test is incubated at 35 C for 24 hours.
3. Verification
4. Most Probable Number
(MPN) Method
Differentiation of the
Coliform Group by Further
Biochemical Tests
1. Definition of the Coliform Group
The cotiform or total coliform group
includes ail of the aerobic and facultative an-
aerobic, gram-negative, nonspore-formlng,
rod-shaped bacteria that ferment lactose in
24-48 hours at 35 C. The definition includes
the genera: Escherichia, Citrobacter, Entero-
bactar, and Klebsietla.
In the two-step enrichment procedure the filter
retaining the microorganisms is placed on an
absorbent pad saturated with lauryl tryptose
(lauryl sulfate) broth. After incubation for 2
hours at 35 C, the filter is transferred to an
absorbent pad saturated with M-Endo broth,
M-Endo agar, or LES M-Endo agar, and incu-
bated for an additional 20-22 hours at 35 C.
The sheen colonies are counted under low
magnification and the numbers of total coli-
forms are reported per 100 ml of original
sample.
In the delayed-incubation procedure, the
filter retaining the microorganisms is placed
on an absorbent pad saturated with M-Endo
preservative medium in a tight-lidded petri
dish and transported from field site to the
laboratory. In the laboratory, the filter is trans-
ferred to M-Endo growth medium and incu-
bated at 35 C for 24 hours. Sheen colonies are
counted as total coliforms per 100 ml.
108
•SEPA MICROBIOLOGICAL MANUAL 1978
image:
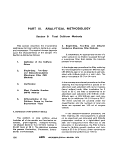 2,2 Scope and Application; The total coli-
form test can be used for any type of water or
wastewater, but since the development of the
fecal coliform procedure there has been in-
creasing use of this more specific test as an
indicator of fecal pollution. However, the total
coliform test remains the primary indicator of
bacteriological quality for potable water, distri-
bution system waters, and public water sup-
plies because a broader measure of pollution
is desired for these waters. It is also a useful
measure in shellfish-raising waters.
Although the majority of water and waste-
water samples can be examined for total coli-
forms by the single-step MF procedure,
coliforms may be suppressed by high back-
ground organisms, and potable water samples
may require the two-step method.
If the membrane filtration method is used
to measure total coliforms in chlorinated
secondary or tertiary sewage effluents the
two-step enrichment procedure is required.
However, it may be necessary to use the MPN
method because of high solids in the wastes or
toxicity from an industrial waste (see Part II-D,
this Manual).
The delayed-incubation MF method is
useful in survey monitoring or emergency
situations when the single step coliform test
cannot be performed at the sample site, or
when time and temperature limits for sample
storage cannot be met. The method eliminates
field processing and equipment needs. Also,
examination at a central laboratory permits
confirmation and biochemical identification of
the organisms as necessary. Consistent results
have been obtained with this method using
water samples from a variety of sources (1, 2).
The applicability of this method for a specific
water source must be determined in
preliminary studies .by comparison with the
standard MF method.
2.3 Apparatus and Materials
2,3.1 Water jacket, air, or heat sink incu-
bator that maintains 35 + 0.5 C. Temperature
is checked against an NBS certified thermom-
eter or equivalent. Incubator must have
humidity control if loose-lidded pertri dishes
are used. See Part II-B, 1.2.
2.3.2 A binocular (dissection) microscope,
with magnification of 10 or 15x, and a day-
light type fluorescent lamp angled to give max-
imum sheen appearance.
2.3.3 Hand tally.
2.3.4 Pipet container of stainless steel,
aluminum or pyrex glass for glass pipets.
2.3.5 Sterile 50-100 ml graduated cylin-
ders covered with aluminum foil or kraft paper,
2.3.6 Sterile, unassembled membrane fil-
tration units (filter base and funnel), glass, plas-
tic or stainless steel, wrapped with aluminum
foil or kraft paper. Portable field filtration units
are available.
2.3.7 Vacuum source.
2.3.8 Vacuum filter flask with appropriate
tubing. Filter manifolds which hold a number
of filter bases can also be used.
2.3.9 Ultraviolet sterilizer for MF filtration
units (optional).
2.3.10 Safety trap flask between the filter
flask and the vacuum source.
2.3.11 Forceps with smooth tips.
2.3.12 Methanoiorethanol, 95%, in small
vial, for flaming forceps.
2.3.13 Bunsen/Fisher burner or electric
incinerator.
2.3.14 Sterile TD bacteriological or Mohr
pipets, glass or plastic, of appropriate size.
2.3.15 Sterile petri dishes with tight-
fitting lids, 50x12 mm or loose-fitting lids 60
X 15 mm, glass or plastic.
TOTAL COLIFORMS
109
image:
2,2 Scope and Application; The total coli-
form test can be used for any type of water or
wastewater, but since the development of the
fecal coliform procedure there has been in-
creasing use of this more specific test as an
indicator of fecal pollution. However, the total
coliform test remains the primary indicator of
bacteriological quality for potable water, distri-
bution system waters, and public water sup-
plies because a broader measure of pollution
is desired for these waters. It is also a useful
measure in shellfish-raising waters.
Although the majority of water and waste-
water samples can be examined for total coli-
forms by the single-step MF procedure,
coliforms may be suppressed by high back-
ground organisms, and potable water samples
may require the two-step method.
If the membrane filtration method is used
to measure total coliforms in chlorinated
secondary or tertiary sewage effluents the
two-step enrichment procedure is required.
However, it may be necessary to use the MPN
method because of high solids in the wastes or
toxicity from an industrial waste (see Part II-D,
this Manual).
The delayed-incubation MF method is
useful in survey monitoring or emergency
situations when the single step coliform test
cannot be performed at the sample site, or
when time and temperature limits for sample
storage cannot be met. The method eliminates
field processing and equipment needs. Also,
examination at a central laboratory permits
confirmation and biochemical identification of
the organisms as necessary. Consistent results
have been obtained with this method using
water samples from a variety of sources (1, 2).
The applicability of this method for a specific
water source must be determined in
preliminary studies .by comparison with the
standard MF method.
2.3 Apparatus and Materials
2,3.1 Water jacket, air, or heat sink incu-
bator that maintains 35 + 0.5 C. Temperature
is checked against an NBS certified thermom-
eter or equivalent. Incubator must have
humidity control if loose-lidded pertri dishes
are used. See Part II-B, 1.2.
2.3.2 A binocular (dissection) microscope,
with magnification of 10 or 15x, and a day-
light type fluorescent lamp angled to give max-
imum sheen appearance.
2.3.3 Hand tally.
2.3.4 Pipet container of stainless steel,
aluminum or pyrex glass for glass pipets.
2.3.5 Sterile 50-100 ml graduated cylin-
ders covered with aluminum foil or kraft paper,
2.3.6 Sterile, unassembled membrane fil-
tration units (filter base and funnel), glass, plas-
tic or stainless steel, wrapped with aluminum
foil or kraft paper. Portable field filtration units
are available.
2.3.7 Vacuum source.
2.3.8 Vacuum filter flask with appropriate
tubing. Filter manifolds which hold a number
of filter bases can also be used.
2.3.9 Ultraviolet sterilizer for MF filtration
units (optional).
2.3.10 Safety trap flask between the filter
flask and the vacuum source.
2.3.11 Forceps with smooth tips.
2.3.12 Methanoiorethanol, 95%, in small
vial, for flaming forceps.
2.3.13 Bunsen/Fisher burner or electric
incinerator.
2.3.14 Sterile TD bacteriological or Mohr
pipets, glass or plastic, of appropriate size.
2.3.15 Sterile petri dishes with tight-
fitting lids, 50x12 mm or loose-fitting lids 60
X 15 mm, glass or plastic.
TOTAL COLIFORMS
109
image:
 2.3.16 Dilution bottles (milk dilution), py-
rex, marked at 99 ml volume, screw cap with
neoprene rubber liner.
2.3.17 Membrane filters, white, grid-
marked, 47 mm diameter, with 0.45 pm ±
0.02 pm pore size, or other pore size, as recom-
mended by manufacturer for water analyses.
2.3.18 Absorbent pads.
2.3,19 Inoculation loops, at least 3 mm
diameter, or needles, nichrome or platinum
wire, 26 B&S gauge, in suitable holder.
2.3.20 Disposable applicator sticks or
plastic loops as alternatives to inoculation
loops.
2.3.21 Shipping tubes, labels, and packing
materials for mailing delayed incubation
plates.
2.4 Media: Media are prepared in pre-
sterilized erlenmeyer flasks with metal caps,
aluminum foil covers, or screw caps.
2.4.1 M-Endo broth or agar (See Part II-B,
5.2.2).
2.4.2 LES M-Endo agar (See Part ll-B,
5.2.4).
2.4.3 Lauryl tryptose broth (See Part II-B,
5.3.1).
2.4.4 Brilliant green lactose bile broth
(See Part II-B, 5.3.2).
2.4.5 M-Endo holding medium (See Part II-
B, 5.2.3).
2.4,6 Sodium benzoate, U.S.P., for use in
the delayed incubation procedure (See Part II-
B, 5.2.3),
2.4.7 Cycloheximide (Actidione - Upjohn,
Kalamazoo, Ml) for use as antifungal agent in
delayed incubation procedure (See Part II-B,
5.2.3).
2.5 Diiution Water (See Part Il-B, 7 for
preparation).
2.5.1 Sterile dilution water dispensed in
99 i 2 ml amounts in screw-capped dilution
bottles.
2.5.2 Sterile dilution water prepared in 1
liter or larger volumes for wetting membranes
before addition of small sample volumes and
for rinsing the funnel after sample filtration.
2.6 Procedure: Refer to the general proce-
dure in Part II-C for more complete details.
2.6.1 Single-Step Procedure
(a) Prepare the M-Endo broth, M-Endo agar
or LES M-Endo agar as-directed in Part II-B.
(b) Place one sterile absorbent pad in the
bottom half of each petri dish. Pipet 1.8-2.0 ml
M-Endo broth onto the pad to saturate it. Pour
off excess broth. Alternatively, pipet 5-6 ml of
melted agar into each dish (2-3 mm) and allow
to harden before use. Mark dishes and bench
forms with sample identities and volumes.
(c) Place a sterile membrane filter on the
filter base, grid-side up and attach the funnel to
the base of the filter unit; the membrane filter
is now held between the funnel and the base,
(d) Shake the sample bottle vigorously
about 25 times and measure the desired vol-
ume of sample into the funnel. Select sample
volumes based on previous knowledge to
produce membrane filters with 20-80 coli-
form colonies. See Table ll-C-1. If sample vol-
ume is < 10 ml, add 10 ml of sterile dilution
water to the filter before adding sample.
It is desirable to filter the largest possible
sample volumes for greatest accuracy. How-
ever, if past analyses of specific samples have
resulted in confluent growth, "too numerous to
count" membranes, or lack of sheen from
excessive turbidity, additional samples should
be collected and filtration volumes adjusted to
provide isolated colonies from smaller volumes.
See 2.7.2 in this Section for details on adjusting
sample volumes for potable waters.
110
MICROBIOLOGICAL MANUAL 1978
image:
2.3.16 Dilution bottles (milk dilution), py-
rex, marked at 99 ml volume, screw cap with
neoprene rubber liner.
2.3.17 Membrane filters, white, grid-
marked, 47 mm diameter, with 0.45 pm ±
0.02 pm pore size, or other pore size, as recom-
mended by manufacturer for water analyses.
2.3.18 Absorbent pads.
2.3,19 Inoculation loops, at least 3 mm
diameter, or needles, nichrome or platinum
wire, 26 B&S gauge, in suitable holder.
2.3.20 Disposable applicator sticks or
plastic loops as alternatives to inoculation
loops.
2.3.21 Shipping tubes, labels, and packing
materials for mailing delayed incubation
plates.
2.4 Media: Media are prepared in pre-
sterilized erlenmeyer flasks with metal caps,
aluminum foil covers, or screw caps.
2.4.1 M-Endo broth or agar (See Part II-B,
5.2.2).
2.4.2 LES M-Endo agar (See Part ll-B,
5.2.4).
2.4.3 Lauryl tryptose broth (See Part II-B,
5.3.1).
2.4.4 Brilliant green lactose bile broth
(See Part II-B, 5.3.2).
2.4.5 M-Endo holding medium (See Part II-
B, 5.2.3).
2.4,6 Sodium benzoate, U.S.P., for use in
the delayed incubation procedure (See Part II-
B, 5.2.3),
2.4.7 Cycloheximide (Actidione - Upjohn,
Kalamazoo, Ml) for use as antifungal agent in
delayed incubation procedure (See Part II-B,
5.2.3).
2.5 Diiution Water (See Part Il-B, 7 for
preparation).
2.5.1 Sterile dilution water dispensed in
99 i 2 ml amounts in screw-capped dilution
bottles.
2.5.2 Sterile dilution water prepared in 1
liter or larger volumes for wetting membranes
before addition of small sample volumes and
for rinsing the funnel after sample filtration.
2.6 Procedure: Refer to the general proce-
dure in Part II-C for more complete details.
2.6.1 Single-Step Procedure
(a) Prepare the M-Endo broth, M-Endo agar
or LES M-Endo agar as-directed in Part II-B.
(b) Place one sterile absorbent pad in the
bottom half of each petri dish. Pipet 1.8-2.0 ml
M-Endo broth onto the pad to saturate it. Pour
off excess broth. Alternatively, pipet 5-6 ml of
melted agar into each dish (2-3 mm) and allow
to harden before use. Mark dishes and bench
forms with sample identities and volumes.
(c) Place a sterile membrane filter on the
filter base, grid-side up and attach the funnel to
the base of the filter unit; the membrane filter
is now held between the funnel and the base,
(d) Shake the sample bottle vigorously
about 25 times and measure the desired vol-
ume of sample into the funnel. Select sample
volumes based on previous knowledge to
produce membrane filters with 20-80 coli-
form colonies. See Table ll-C-1. If sample vol-
ume is < 10 ml, add 10 ml of sterile dilution
water to the filter before adding sample.
It is desirable to filter the largest possible
sample volumes for greatest accuracy. How-
ever, if past analyses of specific samples have
resulted in confluent growth, "too numerous to
count" membranes, or lack of sheen from
excessive turbidity, additional samples should
be collected and filtration volumes adjusted to
provide isolated colonies from smaller volumes.
See 2.7.2 in this Section for details on adjusting
sample volumes for potable waters.
110
MICROBIOLOGICAL MANUAL 1978
image:
 The suggested method for measuring
sample volumes is described in Part II-C, 3.4.6.
(e) Filter sample and rinse the sides of the
funnel at least twice with 20-30 ml of sterile
dilution water. Turn off the vacuum and re-
move the funnel from the filter base. Asepti-
cally remove the membrane filter from the
filter base and place grid-side up on the agar or
pad.
(f) Filter samples in order of increasing
sample volume, filter potable waters first
(g) If M-Endo broth is used, place the filter
on an absorbent pad saturated with the broth.
Reseat the membrane, if air bubbles occur, as
evidenced by non-wetted areas on the mem-
brane. Invert dish and incubate for 24 ± 2
hours at 35 + 0.5 C in an atmosphere with
near saturated humidity.
(h) If M-Endo agar or LES M-Endo agar is
used, place the inoculated filter directly on the
agar surface. Reseat the membrane if bubbles
occur. Invert the dish and incubate for 24^2
hours at 35 -j- 0.5 C in an atmosphere with
near saturated humidity.
(i) If tight-lidded dishes are used, there is
no requirement for near-saturated humidity.
(j) After incubation remove the dishes from
the incubator and examine for sheen colonies.
(k) Proceed to 2.7 for Counting and
Recording Colonies.
2.6.2 Two-Step Enrichment Procedure
(a) Place a sterile absorbent pad in the top
of each petri dish.
(b) Prepare lauryl tryptose broth as di-
rected in Part 11-8. Pipet 1.8-2,0 ml lauryl tryp-
tose broth onto the pad to saturate it. Pour off
excess broth.
(e) Place a sterile membrane filter on the
filter holder, grid-side up and attach the funnel
to the base of the filter unit; the membrane.
filter is now held between the funnel and the
base.
(d) Shake the sample bottle vigorously
about 25 times to obtain uniform distribution
of bacteria. Select sample volumes based on
previous knowledge to produce membrane fil-
ters with 20-80 coliform colonies. See Table
II-C-1. If sample volume is < 10ml, add 10ml
of sterile dilution water to filter before adding
sample.
(e) Filter samples in order of increasing
sample volume, rinsing with sterile buffered
dilution water between filtrations. The me-
thods of measurement and dispensation of the
sample into the funnel are given in Part ll-C,
3.4.6.
(f) Turn on the vacuum to filter the sample
through the membrane, rinse the sides of the
funnel at least twice with 20-30 ml of sterile
dilution water. Turn off vacuum and remove
funnel from base.
(g) Remove the membrane filter asepti-
cally from the filter base and place grid-side up
on the pad in the top of the petri dish. Reseat
MF if air bubbles are observed.
(h) Incubate the filter in the petri dish with-
out inverting for 1 1/2 - 2 hours at 35 ± 0.5 C
in an atmosphere of near saturated humidity.
This completes the first step in the Two-Step
Enrichment Procedure.
(i) Prepare M-Endo broth, M-Endo agar, or
LES M-Endo agar as directed in Part II-B.
If M-Endo broth is used, place a new sterile
absorbent pad in the bottom half of the dish
and saturate with 1.8-2.0 ml of the M-Endo
broth. Transfer the filter to the new pad. Reseat
MF if air bubbles are observed. Remove the
used pad and discard.
If M-Endo or LES M-Endo agar is used,
pour 5-6 ml of agar into the bottom of each
petri dish and allow to solidfy. The agar me-
dium can be refrigerated for up to two weeks.
TOTAL COLIPORMS
111
image:
The suggested method for measuring
sample volumes is described in Part II-C, 3.4.6.
(e) Filter sample and rinse the sides of the
funnel at least twice with 20-30 ml of sterile
dilution water. Turn off the vacuum and re-
move the funnel from the filter base. Asepti-
cally remove the membrane filter from the
filter base and place grid-side up on the agar or
pad.
(f) Filter samples in order of increasing
sample volume, filter potable waters first
(g) If M-Endo broth is used, place the filter
on an absorbent pad saturated with the broth.
Reseat the membrane, if air bubbles occur, as
evidenced by non-wetted areas on the mem-
brane. Invert dish and incubate for 24 ± 2
hours at 35 + 0.5 C in an atmosphere with
near saturated humidity.
(h) If M-Endo agar or LES M-Endo agar is
used, place the inoculated filter directly on the
agar surface. Reseat the membrane if bubbles
occur. Invert the dish and incubate for 24^2
hours at 35 -j- 0.5 C in an atmosphere with
near saturated humidity.
(i) If tight-lidded dishes are used, there is
no requirement for near-saturated humidity.
(j) After incubation remove the dishes from
the incubator and examine for sheen colonies.
(k) Proceed to 2.7 for Counting and
Recording Colonies.
2.6.2 Two-Step Enrichment Procedure
(a) Place a sterile absorbent pad in the top
of each petri dish.
(b) Prepare lauryl tryptose broth as di-
rected in Part 11-8. Pipet 1.8-2,0 ml lauryl tryp-
tose broth onto the pad to saturate it. Pour off
excess broth.
(e) Place a sterile membrane filter on the
filter holder, grid-side up and attach the funnel
to the base of the filter unit; the membrane.
filter is now held between the funnel and the
base.
(d) Shake the sample bottle vigorously
about 25 times to obtain uniform distribution
of bacteria. Select sample volumes based on
previous knowledge to produce membrane fil-
ters with 20-80 coliform colonies. See Table
II-C-1. If sample volume is < 10ml, add 10ml
of sterile dilution water to filter before adding
sample.
(e) Filter samples in order of increasing
sample volume, rinsing with sterile buffered
dilution water between filtrations. The me-
thods of measurement and dispensation of the
sample into the funnel are given in Part ll-C,
3.4.6.
(f) Turn on the vacuum to filter the sample
through the membrane, rinse the sides of the
funnel at least twice with 20-30 ml of sterile
dilution water. Turn off vacuum and remove
funnel from base.
(g) Remove the membrane filter asepti-
cally from the filter base and place grid-side up
on the pad in the top of the petri dish. Reseat
MF if air bubbles are observed.
(h) Incubate the filter in the petri dish with-
out inverting for 1 1/2 - 2 hours at 35 ± 0.5 C
in an atmosphere of near saturated humidity.
This completes the first step in the Two-Step
Enrichment Procedure.
(i) Prepare M-Endo broth, M-Endo agar, or
LES M-Endo agar as directed in Part II-B.
If M-Endo broth is used, place a new sterile
absorbent pad in the bottom half of the dish
and saturate with 1.8-2.0 ml of the M-Endo
broth. Transfer the filter to the new pad. Reseat
MF if air bubbles are observed. Remove the
used pad and discard.
If M-Endo or LES M-Endo agar is used,
pour 5-6 ml of agar into the bottom of each
petri dish and allow to solidfy. The agar me-
dium can be refrigerated for up to two weeks.
TOTAL COLIPORMS
111
image:
 (j) Transfer the filter from the lauryl tryp-
tose broth onto the Endo medium. Reseat if air
bubbles are observed.
(k) Incubate dishes in an inverted position
for an additional 20-22 hours at 35 + 0.5 C.
This completes the second step in the Two-
Step Enrichment Procedure.
{!•) Proceed
Recording.
to 2.7 Counting and
2.6.3 Delayed Incubation Procedure
{a} Prepare the M-Endo Holding Medium or
LES Holding Medium as outlined in Part II-B,
5.2.3 or 5.2.5. Saturate the sterile absorbent
pads with about 2.0 ml of holding broth. Pour
off excess broth. Mark dishes and bench forms
with sample identity and volumes.
(b) Using sterile forceps place a mem-
brane filter on the filter base grid side up,
(c) Attach the funnel to the base of the
filter unit; the membrane filter is now held
between the funnel and base.
(d) Shake the sample vigorously about 25
times and measure into the funnel with the
vacuum off. If the sample is < 10 ml, add 10
ml of sterile dilution water to the membrane
filter before adding the sample.
(1) Select sample volumes based on previ-
ous knowledge to produce counts of 20-80
coliform colonies. See Table ll-C-1.
(2) Follow the methods for sample mea-
surement and dispensation given in Part II-C,
3.4.6
(e) Filter the sample through the mem-
brane and rinse the sides of the funnel walls at
least twice with 20-30 ml of sterile dilution
water.
(f) Turn off the vacuum and remove the
funnel from the base of the filter unit.
(g) Aseptically remove the membrane filter
from the filter base and place grid side up on
an absorbent pad saturated with M-Endo Hold-
ing Medium or LES Holding Medium.
(h) Place the culture dish in shipping con-
tainer and send to the examining laboratory.
Coliform bacteria can be held on the holding
medium for up to 72 hours with little effect on
the final counts. The holding period should be
kept to a minimum.
(i) At the examining laboratory remove the
membrane from the holding medium, place it
in another dish containing M-Endo broth or
agar medium, and complete testing for coli-
forms as described above under 2.6.1.
2.7 Counting and Recording Colonies:
After incubation, count colonies on those
membrane filters containing 20-80 golden-
green metallic surface sheen colonies and less
than 200 total bacterial colonies. A binocular
(dissection) microscope with a magnification
of 10 or 15x is recommended. Count the
colonies according to the general directions
given in Part II-C, 3.5.
2.7.1 The following general rules are used
in calculating the total coliform count per 100
ml of sample. Specific rules for analysis and
counting of water supply samples are given in
2.7.2.
(a) Countable Membranes with 20-80
Sheen Colonies, and Less Than 200 Total Bac-
terial Colonies: Select the plate counts to be
used according to the rules given in Part II-C,
3.6, and calculate the final value using the
formula.
Total Coliforms/100 ml:
No. of Total Coliform Colonies Counted
Volume in ml of Sample Filtered
X 100
(b) Counts Greater Than the Upper Limit of
80 Colonies: All colony counts are above the
recommended limits. For example, sample vol-
umes of 1, 0.3, and 0.01 ml are filtered to
112
MICROBIOLOGICAL MANUAL 1978
image:
(j) Transfer the filter from the lauryl tryp-
tose broth onto the Endo medium. Reseat if air
bubbles are observed.
(k) Incubate dishes in an inverted position
for an additional 20-22 hours at 35 + 0.5 C.
This completes the second step in the Two-
Step Enrichment Procedure.
{!•) Proceed
Recording.
to 2.7 Counting and
2.6.3 Delayed Incubation Procedure
{a} Prepare the M-Endo Holding Medium or
LES Holding Medium as outlined in Part II-B,
5.2.3 or 5.2.5. Saturate the sterile absorbent
pads with about 2.0 ml of holding broth. Pour
off excess broth. Mark dishes and bench forms
with sample identity and volumes.
(b) Using sterile forceps place a mem-
brane filter on the filter base grid side up,
(c) Attach the funnel to the base of the
filter unit; the membrane filter is now held
between the funnel and base.
(d) Shake the sample vigorously about 25
times and measure into the funnel with the
vacuum off. If the sample is < 10 ml, add 10
ml of sterile dilution water to the membrane
filter before adding the sample.
(1) Select sample volumes based on previ-
ous knowledge to produce counts of 20-80
coliform colonies. See Table ll-C-1.
(2) Follow the methods for sample mea-
surement and dispensation given in Part II-C,
3.4.6
(e) Filter the sample through the mem-
brane and rinse the sides of the funnel walls at
least twice with 20-30 ml of sterile dilution
water.
(f) Turn off the vacuum and remove the
funnel from the base of the filter unit.
(g) Aseptically remove the membrane filter
from the filter base and place grid side up on
an absorbent pad saturated with M-Endo Hold-
ing Medium or LES Holding Medium.
(h) Place the culture dish in shipping con-
tainer and send to the examining laboratory.
Coliform bacteria can be held on the holding
medium for up to 72 hours with little effect on
the final counts. The holding period should be
kept to a minimum.
(i) At the examining laboratory remove the
membrane from the holding medium, place it
in another dish containing M-Endo broth or
agar medium, and complete testing for coli-
forms as described above under 2.6.1.
2.7 Counting and Recording Colonies:
After incubation, count colonies on those
membrane filters containing 20-80 golden-
green metallic surface sheen colonies and less
than 200 total bacterial colonies. A binocular
(dissection) microscope with a magnification
of 10 or 15x is recommended. Count the
colonies according to the general directions
given in Part II-C, 3.5.
2.7.1 The following general rules are used
in calculating the total coliform count per 100
ml of sample. Specific rules for analysis and
counting of water supply samples are given in
2.7.2.
(a) Countable Membranes with 20-80
Sheen Colonies, and Less Than 200 Total Bac-
terial Colonies: Select the plate counts to be
used according to the rules given in Part II-C,
3.6, and calculate the final value using the
formula.
Total Coliforms/100 ml:
No. of Total Coliform Colonies Counted
Volume in ml of Sample Filtered
X 100
(b) Counts Greater Than the Upper Limit of
80 Colonies: All colony counts are above the
recommended limits. For example, sample vol-
umes of 1, 0.3, and 0.01 ml are filtered to
112
MICROBIOLOGICAL MANUAL 1978
image:
 produce total coliform colony counts of TNC,
150, and 110 colonies.
Use the count from the smallest filtration
volume and report as a greater than
count/100 ml. In the example above:
110
0.01
X 100 = 1,100,000
or > 1,100,000 coliforms/100 ml,
W Membranes with More Than 200 Total
Colonies (Coliforms plus Non-coliforms).
(1) Estimate sheen colonies if possible,
calculate total coliform density as in (a) above.
Report as: Estimated Count/100 ml.
(2) If estimate of sheen colonies is not
possible, report count as Too Numerous to
Count (TNTC).
(d) Membranes with Confluent Growth
Report as: Confluent Growth and specify
the presence or absence of sheen.
2.7.2 Special Rules for Potable Waters
(a) Countable Membranes with 0-80 Sheen
Colonies, and Less than 200 Total Colonies
Count the sheen colonies per volume filter-
ed. Calculate and report the number of Total
Coliforms/100 ml.
(b) Uncountable Membranes for Potable
Water Samples
If 100 ml portions of potable water sam-
ples cannot be tested because of high back-
ground counts or confluency, multiple volumes
of less than 100 ml can be filtered. For example,
if 60 colonies appear on the surface of one
m,embrane through which a 50 ml portion of
the sample was passed, and 50 colonies on
a second membrane through which a second
50 ml portion of the sample was passed, the
colonies are totaled and reported as 110 total
coliforms per 100 ml.
If filtration of multiple volumes of less than
100 ml still results in confluency or high back-
ground count, the coliforms may be present
but suppressed. These samples should be ana-
lyzed by the MPN Test. This MPN check should
be made on at least one sample for each prob-
lem water once every three months.
(c) Membranes with Confluent Growth
For potable water samples, confluence
requires resampling and retesting.
(d) Verification. Because unsatisfactory
samples from public water supplies containing
5 or more coliform colonies must be verified,
at least 5 colonies need to be verified for each
positive sample. Reported counts are adjusted
based on verification.
(e) Quality control procedures are speci-
fied by EPA under the law, and described in
Appendix C in this Manual.
2-7.3 Reporting Results: Report total coli-
form densities per 100 ml of sample. See
Figure ll-C-3 for an example of a bench form for
reporting results. A discussion on significant
figures is given in Part II-C, 2,8.
2,8 Precision and Accuracy: There are
no established precision and accuracy data
available at this time.
3. Verification
Verification of total coliform colonies from
M-Endo type media validates sheen as evi-
dence of coliforms. Verification of representa-
tive numbers of colonies may be required in
evidence gathering or for quality control pro-
cedures. The verification procedure follows:
3.1 Using a sterile inoculating needle, pick
growth from the centers of at least 10 well-
isolated sheen colonies (5 sheen colonies per
plate for potable waters). Inoculate each into a
tube of lauryl tryptose broth and incubate 24-48
hours at 35 C ± 0.5 C. Do not transfer exclu-
sively into brilliant green bile lactose broth.
However, colonies may be transferred to LTB
and BGLB simultaneously.
TOTAL COLIFORMS
113
image:
produce total coliform colony counts of TNC,
150, and 110 colonies.
Use the count from the smallest filtration
volume and report as a greater than
count/100 ml. In the example above:
110
0.01
X 100 = 1,100,000
or > 1,100,000 coliforms/100 ml,
W Membranes with More Than 200 Total
Colonies (Coliforms plus Non-coliforms).
(1) Estimate sheen colonies if possible,
calculate total coliform density as in (a) above.
Report as: Estimated Count/100 ml.
(2) If estimate of sheen colonies is not
possible, report count as Too Numerous to
Count (TNTC).
(d) Membranes with Confluent Growth
Report as: Confluent Growth and specify
the presence or absence of sheen.
2.7.2 Special Rules for Potable Waters
(a) Countable Membranes with 0-80 Sheen
Colonies, and Less than 200 Total Colonies
Count the sheen colonies per volume filter-
ed. Calculate and report the number of Total
Coliforms/100 ml.
(b) Uncountable Membranes for Potable
Water Samples
If 100 ml portions of potable water sam-
ples cannot be tested because of high back-
ground counts or confluency, multiple volumes
of less than 100 ml can be filtered. For example,
if 60 colonies appear on the surface of one
m,embrane through which a 50 ml portion of
the sample was passed, and 50 colonies on
a second membrane through which a second
50 ml portion of the sample was passed, the
colonies are totaled and reported as 110 total
coliforms per 100 ml.
If filtration of multiple volumes of less than
100 ml still results in confluency or high back-
ground count, the coliforms may be present
but suppressed. These samples should be ana-
lyzed by the MPN Test. This MPN check should
be made on at least one sample for each prob-
lem water once every three months.
(c) Membranes with Confluent Growth
For potable water samples, confluence
requires resampling and retesting.
(d) Verification. Because unsatisfactory
samples from public water supplies containing
5 or more coliform colonies must be verified,
at least 5 colonies need to be verified for each
positive sample. Reported counts are adjusted
based on verification.
(e) Quality control procedures are speci-
fied by EPA under the law, and described in
Appendix C in this Manual.
2-7.3 Reporting Results: Report total coli-
form densities per 100 ml of sample. See
Figure ll-C-3 for an example of a bench form for
reporting results. A discussion on significant
figures is given in Part II-C, 2,8.
2,8 Precision and Accuracy: There are
no established precision and accuracy data
available at this time.
3. Verification
Verification of total coliform colonies from
M-Endo type media validates sheen as evi-
dence of coliforms. Verification of representa-
tive numbers of colonies may be required in
evidence gathering or for quality control pro-
cedures. The verification procedure follows:
3.1 Using a sterile inoculating needle, pick
growth from the centers of at least 10 well-
isolated sheen colonies (5 sheen colonies per
plate for potable waters). Inoculate each into a
tube of lauryl tryptose broth and incubate 24-48
hours at 35 C ± 0.5 C. Do not transfer exclu-
sively into brilliant green bile lactose broth.
However, colonies may be transferred to LTB
and BGLB simultaneously.
TOTAL COLIFORMS
113
image:
 3,2 At the 24 and 48 hour readings, con-
firm gas-positive lauryl tryptose broth tubes by
inoculating a loopful of growth into brilliant
green lactose bile broth and incubate for
24-48 hours at 35 ± 0.5 C. Cultures that are
positive in BGLB are interpreted as verified
coliform colonies (see Figure ill-B-1).
3.3 If questionable sheen occurs, the
worker should also verify these colonies.
4. Most Probable Number (MPN) Method
4.1 Summary: This method detects and
estimates the total coliforms in water samples
by the multiple fermentation tube technique.
The method has three stages: the Presumptive,
the Confirmed, and the Completed Tests. In
the Presumptive Test, a series of lauryl tryp-
tose broth fermentation tubes are inoculated
with decimal dilutions of the sample. The for-
mation of gas at 35 C within 48 hours consti-
tutes a positive Presumptive Test for members
of the total coliform group. However, the MPN
must be carried through the Confirmed Test
for valid results. In this test, inocula from posi-
tive Presumptive tubes are transferred to tubes
of brilliant green lactose bile {BGLB) broth. The
BGLB medium contains selective and inhib-
itlve agents to suppress the growth of all non-
coliform organisms. Gas production after incu-
bation for 24 or 48 hours a,t 35 C constitutes a
positive Confirmed Test and is the point at
which most MPN tests are terminated. The
Completed Test begins with streaking inocu-
lum from the positive BGLB tubes onto EMB
plates and incubating the plates for 24 hours
at 35 C. Typical and atypical colonies are
transferred into lauryl tryptose broth fermenta-
tion tubes and onto nutrient agar slants. Gas
formation in the fermentation tubes and pres-
ence of gram-negative rods constitute a posi-
tive Completed Test fortotalcoliforms. See
Figure III-B-2, The MPN perl 00 ml is calculated
from the MPN table based upon the Con-
firmed or Completed test results.
4.2 Scope and Application
4,2.1 Advantages: The MPN procedure is
a tube-dilution method using a nutrient-rich
medium, which is less sensitive to toxicity and
supports the growth of environmentally-
stressed organisms. The method is applicable
to the examination of total coliforms in chlori-
nated primary effluents and under other
stressed conditions. The multiple-tube proce-
dure is also better suited forthe examination of
turbid samples, muds, sediments, or sludges
because particulates do not interfere visibly
with the test.
4.2.2 Limitations: Certain non-coliform
bacteria may suppress coliforms or act syner-
gistically to ferment lauryl tryptose broth and
yield false positive results. A significant num-
ber of false positive results can also occur in
the brilliant green bile broth when chlorinated
primary effluents are tested, especially when
stormwater is mixed with the sewage (3). False
negatives may occur with waters containing
nitrates (4). False positives are more common
in sediments.
4.3 Apparatus and Materials
4.3.1 Water bath or air incubator set at 35
± 0.5 C.
4.3.2 Pipet containers of stainless steel,
aluminum, or pyrex glass for glass pipets.
4.3.3 Inoculation loops, at least 3 mm
diameter and needles of nichrome or platinum
wire, 26 B & S gauge, in suitable holders.
4.3.4 Disposable sterile applicator sticks
or plastic loops as alternatives to inoculating
loops.
4.3.5 Compound microscope, oil
immersion.
4.3.6 Bunsen/Fisher burner or electric in-
cinerator unit.
4.3.7 Sterile TD Mohr or bacteriological
pipets, glass or plastic, of appropriate size.
114
MICROBIOLOGICAL MANUAL 1978
image:
3,2 At the 24 and 48 hour readings, con-
firm gas-positive lauryl tryptose broth tubes by
inoculating a loopful of growth into brilliant
green lactose bile broth and incubate for
24-48 hours at 35 ± 0.5 C. Cultures that are
positive in BGLB are interpreted as verified
coliform colonies (see Figure ill-B-1).
3.3 If questionable sheen occurs, the
worker should also verify these colonies.
4. Most Probable Number (MPN) Method
4.1 Summary: This method detects and
estimates the total coliforms in water samples
by the multiple fermentation tube technique.
The method has three stages: the Presumptive,
the Confirmed, and the Completed Tests. In
the Presumptive Test, a series of lauryl tryp-
tose broth fermentation tubes are inoculated
with decimal dilutions of the sample. The for-
mation of gas at 35 C within 48 hours consti-
tutes a positive Presumptive Test for members
of the total coliform group. However, the MPN
must be carried through the Confirmed Test
for valid results. In this test, inocula from posi-
tive Presumptive tubes are transferred to tubes
of brilliant green lactose bile {BGLB) broth. The
BGLB medium contains selective and inhib-
itlve agents to suppress the growth of all non-
coliform organisms. Gas production after incu-
bation for 24 or 48 hours a,t 35 C constitutes a
positive Confirmed Test and is the point at
which most MPN tests are terminated. The
Completed Test begins with streaking inocu-
lum from the positive BGLB tubes onto EMB
plates and incubating the plates for 24 hours
at 35 C. Typical and atypical colonies are
transferred into lauryl tryptose broth fermenta-
tion tubes and onto nutrient agar slants. Gas
formation in the fermentation tubes and pres-
ence of gram-negative rods constitute a posi-
tive Completed Test fortotalcoliforms. See
Figure III-B-2, The MPN perl 00 ml is calculated
from the MPN table based upon the Con-
firmed or Completed test results.
4.2 Scope and Application
4,2.1 Advantages: The MPN procedure is
a tube-dilution method using a nutrient-rich
medium, which is less sensitive to toxicity and
supports the growth of environmentally-
stressed organisms. The method is applicable
to the examination of total coliforms in chlori-
nated primary effluents and under other
stressed conditions. The multiple-tube proce-
dure is also better suited forthe examination of
turbid samples, muds, sediments, or sludges
because particulates do not interfere visibly
with the test.
4.2.2 Limitations: Certain non-coliform
bacteria may suppress coliforms or act syner-
gistically to ferment lauryl tryptose broth and
yield false positive results. A significant num-
ber of false positive results can also occur in
the brilliant green bile broth when chlorinated
primary effluents are tested, especially when
stormwater is mixed with the sewage (3). False
negatives may occur with waters containing
nitrates (4). False positives are more common
in sediments.
4.3 Apparatus and Materials
4.3.1 Water bath or air incubator set at 35
± 0.5 C.
4.3.2 Pipet containers of stainless steel,
aluminum, or pyrex glass for glass pipets.
4.3.3 Inoculation loops, at least 3 mm
diameter and needles of nichrome or platinum
wire, 26 B & S gauge, in suitable holders.
4.3.4 Disposable sterile applicator sticks
or plastic loops as alternatives to inoculating
loops.
4.3.5 Compound microscope, oil
immersion.
4.3.6 Bunsen/Fisher burner or electric in-
cinerator unit.
4.3.7 Sterile TD Mohr or bacteriological
pipets, glass or plastic, of appropriate size.
114
MICROBIOLOGICAL MANUAL 1978
image:
 Pick 10 sheen colonies
from each sample
Lauryl Tryptose Broth
24 hours at 3BC
Gas
Gas-
Reincubate
24 hours at 35 C
Gas +
Gas-
Negative
Test
Brilliant Green Lactose Bile Broth
24 hours at SBC
Gas +
Verified
Coliform
Colony
Gas-
Reincubate
24 hours at 35 C
Gas
Gas-
Verified
Coliform
Colony
Negative
Test
FIGURE II l-B-1. Verification of Total Coliform Colonies on the Membrane Filter
TOTAL COLIFORMS
115
image:
Pick 10 sheen colonies
from each sample
Lauryl Tryptose Broth
24 hours at 3BC
Gas
Gas-
Reincubate
24 hours at 35 C
Gas +
Gas-
Negative
Test
Brilliant Green Lactose Bile Broth
24 hours at SBC
Gas +
Verified
Coliform
Colony
Gas-
Reincubate
24 hours at 35 C
Gas
Gas-
Verified
Coliform
Colony
Negative
Test
FIGURE II l-B-1. Verification of Total Coliform Colonies on the Membrane Filter
TOTAL COLIFORMS
115
image:
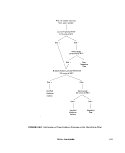 to
5
3
(A
Ul
K
0.
»-
V
uu
£
Gt
o
o
Sample
Lauryl Tryptose Broth
35 ± 0.5 C
Gas -
48 hr
Negative Test
Brilliant Green Lactose Bile Broth
35 ± 0.5 C
Gas -
Negative Test
Eosin Methylene Blue Agar
24hrat3i±0,5C
I
(_
Nutrient Agar Slant
24hrat35±0.5C
Lauryl Tryptose Broth Tube
24-48 hr at 35 ± 0.5 C
a.
O
O
Gram 4-
Sporeforrners
Negative
Test
Gram
Nonspore-forming
Conforms
Present
Gas +
Conforms
Present
Gas -
Negative
Test
FIGURE lll-B-2. Flow Chart for the Total Coliform MPN Test
116
MICROBIOLOGICAL MANUAL 1978
image:
to
5
3
(A
Ul
K
0.
»-
V
uu
£
Gt
o
o
Sample
Lauryl Tryptose Broth
35 ± 0.5 C
Gas -
48 hr
Negative Test
Brilliant Green Lactose Bile Broth
35 ± 0.5 C
Gas -
Negative Test
Eosin Methylene Blue Agar
24hrat3i±0,5C
I
(_
Nutrient Agar Slant
24hrat35±0.5C
Lauryl Tryptose Broth Tube
24-48 hr at 35 ± 0.5 C
a.
O
O
Gram 4-
Sporeforrners
Negative
Test
Gram
Nonspore-forming
Conforms
Present
Gas +
Conforms
Present
Gas -
Negative
Test
FIGURE lll-B-2. Flow Chart for the Total Coliform MPN Test
116
MICROBIOLOGICAL MANUAL 1978
image:
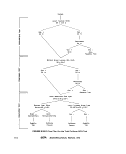 4.3.8 Pyrex culture tubes, 150 x 25 mm
or 1 50 X 20 mm, containing inverted fermen-
tation vials, 75 X 10 mm with caps.
4.3.9 Culture tube racks to hold fifty, 25
mm diametertubes.
4.3.10 Dilution bottles (milk dilution) py-
rex glass, 99 ml volume, screw cap with neo-
prene rubber liners.
4.4 Media
4.4.1 Presumptive Test: Lauryl tryptose
broth. See Part II-B, 5.3.1 . Lactose broth is not
used because of false positive reactions.
4.4.2 Confirmed Test: Brilliant green bile
broth. (See Part II-B, 5.3.2).
4.4.3 Completed Test:
(a) Eosin methylene blue agar (see Part II-B,
5.3.3).
(b) Nutrient agar or plate count agar slants
(see Part II-B, 5.1.1 and 5.1.5).
4.5 Dilution Water: Sterile dilution water
dispensed in 99 + 2 ml amounts preferably in
screw-capped bottles. (See Part II-B, 7).
4.6 Procedure: Part II-C describes the gen-
eral MPN procedure in detail.
4.6.1 Prepare the media for Presumptive,
Confirmed or Completed Tests selected. (See
Part II-B, 5.3).
4.6.2 Presumptive Test (See Figure lll-B-2):
To begin the Presumptive Test, arrange fer-
mentation tubes of lauryl tryptose broth in
rows cf 5 tubes each in the tube rack. Select
sample volumes and clearly label each bank of
tubes to identify the sample and volume
inoculated.
(a) For potable waters, five portions of 10
ml each or five portions of 100 ml each are
used.
(b) For relatively-unpolluted waters the
sample volumes for the five rows might be
100, 10, 1,0.1 and 0.01 ml, respectively; the
latter two volumes delivered as dilutions of
original sample.
(c) For known polluted waters the initial
sample inoculations might be 0.1, 0.01,
0.001, 0.0001, and 0.00001 ml of original
sample delivered as dilutions into successive
rows each containing five replicate volumes.
This series of sample volumes will yield deter-
minate results from a low of 200 to a high of
16,000,000 organisms per 100 ml.
(d) Shake the sample and dilutions vigor-
ously about 25 times. Inoculate each 5-tube
row with replicate sample volumes in increas-
ing decimal dilutions and incubate at 35 C ±
0.5 C.
(e) After 24 + 2 hours incubation at 35 C,
gently agitate the tubes in the rack and exam-
ine the tubes for gas. Any amount of gas
constitutes a positive test. If there is no gas
production in the tubes, reincubate for an
additional 24 hours and reexamine for gas.
Positive Presumption tubes are submitted
directly to the Confirmed Test. Results are
recorded on laboratory bench forms.
(f) If a laboratory using the MPN test on
water supplies finds frequent numbers of Pre-
sumptive test tubes with heavy growth but no
gas, these negative tubes should be submitted
to the Confirmed Test to check for suppression
of coliforms.
(g) If The Presumptive Test tubes are gas-
negative after 48 + 3 hours, they are dis-
carded and the results recorded as negative
Presumptive Tests. Positive Presumptive tubes
are verified by the Confirmed Test.
(h) If the fecal colifrom test is to be run,
(Part III-C), the analyst can inoculate growth
from positive Presumptive Test tubes into EC
medium at the same time as he inoculates the
Confirmed Test Medium.
4.6.3 Confirmed Test (See Figure lll-B-2)
(a) Carefully shake each positive Presump-
tive tube. With a sterile 3 mm loop or a sterile
TOTAL COLIFORMS
117
image:
4.3.8 Pyrex culture tubes, 150 x 25 mm
or 1 50 X 20 mm, containing inverted fermen-
tation vials, 75 X 10 mm with caps.
4.3.9 Culture tube racks to hold fifty, 25
mm diametertubes.
4.3.10 Dilution bottles (milk dilution) py-
rex glass, 99 ml volume, screw cap with neo-
prene rubber liners.
4.4 Media
4.4.1 Presumptive Test: Lauryl tryptose
broth. See Part II-B, 5.3.1 . Lactose broth is not
used because of false positive reactions.
4.4.2 Confirmed Test: Brilliant green bile
broth. (See Part II-B, 5.3.2).
4.4.3 Completed Test:
(a) Eosin methylene blue agar (see Part II-B,
5.3.3).
(b) Nutrient agar or plate count agar slants
(see Part II-B, 5.1.1 and 5.1.5).
4.5 Dilution Water: Sterile dilution water
dispensed in 99 + 2 ml amounts preferably in
screw-capped bottles. (See Part II-B, 7).
4.6 Procedure: Part II-C describes the gen-
eral MPN procedure in detail.
4.6.1 Prepare the media for Presumptive,
Confirmed or Completed Tests selected. (See
Part II-B, 5.3).
4.6.2 Presumptive Test (See Figure lll-B-2):
To begin the Presumptive Test, arrange fer-
mentation tubes of lauryl tryptose broth in
rows cf 5 tubes each in the tube rack. Select
sample volumes and clearly label each bank of
tubes to identify the sample and volume
inoculated.
(a) For potable waters, five portions of 10
ml each or five portions of 100 ml each are
used.
(b) For relatively-unpolluted waters the
sample volumes for the five rows might be
100, 10, 1,0.1 and 0.01 ml, respectively; the
latter two volumes delivered as dilutions of
original sample.
(c) For known polluted waters the initial
sample inoculations might be 0.1, 0.01,
0.001, 0.0001, and 0.00001 ml of original
sample delivered as dilutions into successive
rows each containing five replicate volumes.
This series of sample volumes will yield deter-
minate results from a low of 200 to a high of
16,000,000 organisms per 100 ml.
(d) Shake the sample and dilutions vigor-
ously about 25 times. Inoculate each 5-tube
row with replicate sample volumes in increas-
ing decimal dilutions and incubate at 35 C ±
0.5 C.
(e) After 24 + 2 hours incubation at 35 C,
gently agitate the tubes in the rack and exam-
ine the tubes for gas. Any amount of gas
constitutes a positive test. If there is no gas
production in the tubes, reincubate for an
additional 24 hours and reexamine for gas.
Positive Presumption tubes are submitted
directly to the Confirmed Test. Results are
recorded on laboratory bench forms.
(f) If a laboratory using the MPN test on
water supplies finds frequent numbers of Pre-
sumptive test tubes with heavy growth but no
gas, these negative tubes should be submitted
to the Confirmed Test to check for suppression
of coliforms.
(g) If The Presumptive Test tubes are gas-
negative after 48 + 3 hours, they are dis-
carded and the results recorded as negative
Presumptive Tests. Positive Presumptive tubes
are verified by the Confirmed Test.
(h) If the fecal colifrom test is to be run,
(Part III-C), the analyst can inoculate growth
from positive Presumptive Test tubes into EC
medium at the same time as he inoculates the
Confirmed Test Medium.
4.6.3 Confirmed Test (See Figure lll-B-2)
(a) Carefully shake each positive Presump-
tive tube. With a sterile 3 mm loop or a sterile
TOTAL COLIFORMS
117
image:
 applicator stick, transfer growth from each
tube to BGLB. Gently agitate the tubes to mix
the inoculum and incubate at 35 +_ 0.5 C.
(b) After 24+2 hours incubation at 35 C
examine the tubes for gas. Any amount of gas in
BGLB constitutes a positive Confirmed Test.
If there is no gas production in the tubes
{negative test) reincubate tubes for an addi-
tional 24 hours. Record the gas-positive and
gas-negative tubes. Hold the positive tubes for
the Completed Test if required for quality con-
trol or for checks on questionable reactions.
{e) After 48 +_ 3 hours reexamine the
Confirmed Test Tubes. Record the positive and
negative tube results. Discard the negative
tubes and hold the positive tubes for the Com-
pleted Test if required as in (b) above.
(d) In routine practice most sample ana-
lyses are terminated at the end of the Con-
firmed Test. However, the Confirmed Test data
should be verified by carrying 5% of Confirmed
Tests with a minimum of one sample per test
run through the Completed Test.
(e) For certification of water supply labora-
tories, the MPN test is carried to completion
{except for gram stain) on 10 percent of positive
confirmed samples and at least one sample
quarterly.
4,6.4 Completed Test (See Figure lll-B-2)
Positive Confirmed Test cultures may be
subjected to final Completed Test identifica-
tion through application of further biochemical
and culture tests, as follows:
(a) Streak one or more EMB agar plates
from each positive BGLB tube. Incubate the
plates at 35 +_ 0.5 C for 24 + 2 hours.
(b) Transfer one or more well-isolated typi-
cal colonies {nucleated with or without a metal-
lic sheen) to Iduryl tryptose broth fermentation
tubes and to nutrient or plate count agar
slants. Incubate the slants for 24 +j 2 or 48 ±
3 hours at 35 +_ 0.5 C. If no typical colonies are
present, pick and inoculate at least two atypi-
cal (pink, mucoid and unnucleated) colonies
into lauryl tryptose fermentation tubes and
incubate tubes for up to 48 +j 3 hours.
(c) The formation of gas in any amount in
the fermentation tubes and presence of gram
negative'rods constitute a positive Completed
Test for total coliforms,
4.6.5 Special Considerations for Potable
Waters
Sample Size- For potable waters the stan-
dard sample shall be five times the standard
portion which is either 10 milliliters or 100
mifliliters as described in 40 CFR 141 (5).
• Confirmation - If a laboratory using the
MPN test on water supplies finds frequent
numbers of Presumptive test tubes with heavy
growth but no gas, these negative tubes
should be submitted to the Confirmed Test to
check for suppression of coliforms.
Completion — In water supply laboratories,
10% of all samples and at least one sample
quarterly must be carried to completion but
no gram stain of cultures is required.
4.7 Calculations: The results of the Con-
firmed or Completed Test may be obtained
from the MPN table based on the number of
positive tubes in each dilution. See Part II-C,
4.9 for details on calculation of MPN results.
4.7.1 Table II-C-4 illustrates the MPN in-
dex and 95% Confidence Limits for combina-
tions of positive and negative results when five
10 rnl, five 1.0 ml, and five 0.1 ml volumes of
sample are tested.
4,7.2 Table ll-C-5 provides the MPN indi-
ces and limits for the five tube, single volumes
used for potable water supplies.
4.7.3 When the series of decimal dilutions
is other than those in the tables select the MPN
value from Table II-C-4 and calculate accord-
ing to the following formula:
MPN (From Table) X
10
Largest Volume Tested
= MPN/100 ml
118
SERA, MICROBIOLOGICAL MANUAL 1978
image:
applicator stick, transfer growth from each
tube to BGLB. Gently agitate the tubes to mix
the inoculum and incubate at 35 +_ 0.5 C.
(b) After 24+2 hours incubation at 35 C
examine the tubes for gas. Any amount of gas in
BGLB constitutes a positive Confirmed Test.
If there is no gas production in the tubes
{negative test) reincubate tubes for an addi-
tional 24 hours. Record the gas-positive and
gas-negative tubes. Hold the positive tubes for
the Completed Test if required for quality con-
trol or for checks on questionable reactions.
{e) After 48 +_ 3 hours reexamine the
Confirmed Test Tubes. Record the positive and
negative tube results. Discard the negative
tubes and hold the positive tubes for the Com-
pleted Test if required as in (b) above.
(d) In routine practice most sample ana-
lyses are terminated at the end of the Con-
firmed Test. However, the Confirmed Test data
should be verified by carrying 5% of Confirmed
Tests with a minimum of one sample per test
run through the Completed Test.
(e) For certification of water supply labora-
tories, the MPN test is carried to completion
{except for gram stain) on 10 percent of positive
confirmed samples and at least one sample
quarterly.
4,6.4 Completed Test (See Figure lll-B-2)
Positive Confirmed Test cultures may be
subjected to final Completed Test identifica-
tion through application of further biochemical
and culture tests, as follows:
(a) Streak one or more EMB agar plates
from each positive BGLB tube. Incubate the
plates at 35 +_ 0.5 C for 24 + 2 hours.
(b) Transfer one or more well-isolated typi-
cal colonies {nucleated with or without a metal-
lic sheen) to Iduryl tryptose broth fermentation
tubes and to nutrient or plate count agar
slants. Incubate the slants for 24 +j 2 or 48 ±
3 hours at 35 +_ 0.5 C. If no typical colonies are
present, pick and inoculate at least two atypi-
cal (pink, mucoid and unnucleated) colonies
into lauryl tryptose fermentation tubes and
incubate tubes for up to 48 +j 3 hours.
(c) The formation of gas in any amount in
the fermentation tubes and presence of gram
negative'rods constitute a positive Completed
Test for total coliforms,
4.6.5 Special Considerations for Potable
Waters
Sample Size- For potable waters the stan-
dard sample shall be five times the standard
portion which is either 10 milliliters or 100
mifliliters as described in 40 CFR 141 (5).
• Confirmation - If a laboratory using the
MPN test on water supplies finds frequent
numbers of Presumptive test tubes with heavy
growth but no gas, these negative tubes
should be submitted to the Confirmed Test to
check for suppression of coliforms.
Completion — In water supply laboratories,
10% of all samples and at least one sample
quarterly must be carried to completion but
no gram stain of cultures is required.
4.7 Calculations: The results of the Con-
firmed or Completed Test may be obtained
from the MPN table based on the number of
positive tubes in each dilution. See Part II-C,
4.9 for details on calculation of MPN results.
4.7.1 Table II-C-4 illustrates the MPN in-
dex and 95% Confidence Limits for combina-
tions of positive and negative results when five
10 rnl, five 1.0 ml, and five 0.1 ml volumes of
sample are tested.
4,7.2 Table ll-C-5 provides the MPN indi-
ces and limits for the five tube, single volumes
used for potable water supplies.
4.7.3 When the series of decimal dilutions
is other than those in the tables select the MPN
value from Table II-C-4 and calculate accord-
ing to the following formula:
MPN (From Table) X
10
Largest Volume Tested
= MPN/100 ml
118
SERA, MICROBIOLOGICAL MANUAL 1978
image:
 4.8 Reporting Results: Report the MPN
values per 100 ml of sample. See an example
of a reportform in Figures IIl-D-2 and lll-D-3.
4.9 Precision and Accuracy: The preci-
sion of the MPN value increases .with in-
creased numbers of replicates tested. A five
tube, five dilution MPN is recommended for
natural and waste waters. Only a five tube,
single volume series is required for potable
waters.
5. Differentiation of the Coliform Group by
by Further Biochemical Tests
5.1 Summary: The differentiation of the
members of the colifprm group into genera and
species is based on additional biochemical and
cultural tests (see Table lll-B-1). These tests
require specific training for valid results.
5.2 Apparatus and Materials
5.2.1 Incubator set at 35 ± 0.5 C.
5.2.2 Pipet containers of stainless steel,
aluminum or pyrex glass for glass pipets.
5.2.3 Inoculation loop, 3 mm diameter
and needle.
5.2.4 Bunsen/Fisher type burner or elec-
tric incinerator.
5.2.5 Sterile TD Mohr and bacteriological
pipets, glass or plastic, of appropriate volumes.
5.2.6 Graduates, 25 - 500 ml.
5.2.7 Test tubes, 100 x 13 mm or 1 50 x
20 mm with caps, in racks.
5.2.8 Reagents
(a) Indole Test Reagent: Dissolve 5 grams
para-dimethylamino benzaldehyde in 75 ml
isoamyl (or normal amyl) alcohol, ACS grade,
and slowly add 25 ml cone HCI. The reagent
should be yellow and have a pH below 6.0. If
the final reagent is dark in color it should be
discarded.
Some brands are not satisfactory and oth-
ers become unsatisfactory after aging. Both
amyl alcohol and benzaldehyde compound
should be purchased in as small amounts as
will be consistent with the volume of work
anticipated. Store the reagent in the dark in a
brown bottle with a glass stopper.
(b) Methyl Red Test Reagent: Dissolve 0.1
gram methyl red in 300 ml of 95% ethyl alco-
hol and dilute to 500 ml with distilled water.
(c) Voges-ProskauerTest Reagents
(1) Naphthol solution: Dissolve 5 grams
purified alphanaphthol (melting point 92.5 C
or higher) in 100 ml absolute ethyl alcohol.
This solution must be freshly prepared each
day.
(2) Potassium hydroxide solution: Dissolve
40 grams KOH in 100 ml distilled water.
(d) Oxidase Test Reagents
(1) Reagent A: Weigh out 1 gram alpha-
napthol and dissolve in 100 ml of 95%
ethanol.
(2) Reagent B: Weigh out 1 gram para-
aminodimethylaniline HCI (or oxylate) and
dissolve in 100 ml of distilled water. Prepare
frequently and store in refrigerator.
5.3 Media
5.3.1 Tryptophane broth for demonstrat-
ing indole production in the Indole Test. (See
Part II-B, 5.1.9 (a) for preparation).
5.3.2 MR-VP broth (buffered glucose) to
demonstrate acid production by methyl red
color change in the Methyl Red Test and to
demonstrate acetyl methyl carbinol
production in the Voges-Proskauer test. (See
Part II-B, 5.1.9 (b)for preparation).
5.3.3 Simmon's Citrate Agar to demon-
strate utilization of citrate as a sole source of
carbon. (See Part II-B, 5.1.9 (c) for preparation).
TOTAL COLIFORMS
119
image:
4.8 Reporting Results: Report the MPN
values per 100 ml of sample. See an example
of a reportform in Figures IIl-D-2 and lll-D-3.
4.9 Precision and Accuracy: The preci-
sion of the MPN value increases .with in-
creased numbers of replicates tested. A five
tube, five dilution MPN is recommended for
natural and waste waters. Only a five tube,
single volume series is required for potable
waters.
5. Differentiation of the Coliform Group by
by Further Biochemical Tests
5.1 Summary: The differentiation of the
members of the colifprm group into genera and
species is based on additional biochemical and
cultural tests (see Table lll-B-1). These tests
require specific training for valid results.
5.2 Apparatus and Materials
5.2.1 Incubator set at 35 ± 0.5 C.
5.2.2 Pipet containers of stainless steel,
aluminum or pyrex glass for glass pipets.
5.2.3 Inoculation loop, 3 mm diameter
and needle.
5.2.4 Bunsen/Fisher type burner or elec-
tric incinerator.
5.2.5 Sterile TD Mohr and bacteriological
pipets, glass or plastic, of appropriate volumes.
5.2.6 Graduates, 25 - 500 ml.
5.2.7 Test tubes, 100 x 13 mm or 1 50 x
20 mm with caps, in racks.
5.2.8 Reagents
(a) Indole Test Reagent: Dissolve 5 grams
para-dimethylamino benzaldehyde in 75 ml
isoamyl (or normal amyl) alcohol, ACS grade,
and slowly add 25 ml cone HCI. The reagent
should be yellow and have a pH below 6.0. If
the final reagent is dark in color it should be
discarded.
Some brands are not satisfactory and oth-
ers become unsatisfactory after aging. Both
amyl alcohol and benzaldehyde compound
should be purchased in as small amounts as
will be consistent with the volume of work
anticipated. Store the reagent in the dark in a
brown bottle with a glass stopper.
(b) Methyl Red Test Reagent: Dissolve 0.1
gram methyl red in 300 ml of 95% ethyl alco-
hol and dilute to 500 ml with distilled water.
(c) Voges-ProskauerTest Reagents
(1) Naphthol solution: Dissolve 5 grams
purified alphanaphthol (melting point 92.5 C
or higher) in 100 ml absolute ethyl alcohol.
This solution must be freshly prepared each
day.
(2) Potassium hydroxide solution: Dissolve
40 grams KOH in 100 ml distilled water.
(d) Oxidase Test Reagents
(1) Reagent A: Weigh out 1 gram alpha-
napthol and dissolve in 100 ml of 95%
ethanol.
(2) Reagent B: Weigh out 1 gram para-
aminodimethylaniline HCI (or oxylate) and
dissolve in 100 ml of distilled water. Prepare
frequently and store in refrigerator.
5.3 Media
5.3.1 Tryptophane broth for demonstrat-
ing indole production in the Indole Test. (See
Part II-B, 5.1.9 (a) for preparation).
5.3.2 MR-VP broth (buffered glucose) to
demonstrate acid production by methyl red
color change in the Methyl Red Test and to
demonstrate acetyl methyl carbinol
production in the Voges-Proskauer test. (See
Part II-B, 5.1.9 (b)for preparation).
5.3.3 Simmon's Citrate Agar to demon-
strate utilization of citrate as a sole source of
carbon. (See Part II-B, 5.1.9 (c) for preparation).
TOTAL COLIFORMS
119
image:
 to
o
TABLE Ili-B-1
Differentiation of the Coliform and Related Organisms Based
Upon Biochemical Reactions
i MICROBIOLOGICAL MANUAL 1978
Bacterium
Escherichia coli
Citrobacter freundii
Enterobacter aerogenes
Klebsiella
Pseudomonas
Tests
Methyl Voges- _, Cytochrome Ornithine Lysine Arginine
Indole Re(j Prague,. Citrate rjxidase Decarboxylase Decarboxylase Dehydroiase MotllltY
4-4---- V V V +
_+_+_ v V V +
-- + •)• - 4- 4- - ' 4-
4. _ 4- +. _ _ 4- _-
. .
Aeromonas
V = variable
>1 -
- reaction of P. aeruginosa
image:
to
o
TABLE Ili-B-1
Differentiation of the Coliform and Related Organisms Based
Upon Biochemical Reactions
i MICROBIOLOGICAL MANUAL 1978
Bacterium
Escherichia coli
Citrobacter freundii
Enterobacter aerogenes
Klebsiella
Pseudomonas
Tests
Methyl Voges- _, Cytochrome Ornithine Lysine Arginine
Indole Re(j Prague,. Citrate rjxidase Decarboxylase Decarboxylase Dehydroiase MotllltY
4-4---- V V V +
_+_+_ v V V +
-- + •)• - 4- 4- - ' 4-
4. _ 4- +. _ _ 4- _-
. .
Aeromonas
V = variable
>1 -
- reaction of P. aeruginosa
image:
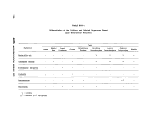 5.3,4 Nutrient agar slant for oxidase test.
(See Part II-B, 5.1.1 for preparation).
5.3.5 Decarboxylase medium base con-
taining lysine HCI, arginine HCI or ornithine
HCI to demonstrate utilization of the specific
amino acids. (See Part II-B, 5.5.14 for
preparation).
5.3.6 Motility test medium (Edwards and
Ewing). (See Section II-B, 5.1.10 for
preparation).
5.3.7 Multitest Systems (optional to Sin-
gle Test Series)
(a) API Enteric 20 (Analytab Products, Inc.).
(b) Enterotube (Roche Diagnostics).
(c) Inolex (Inolex Biomedical Division of
Wilson Pharmaceutical and Chemical Corp.).
(d) Minitek (Baltimore Biological Labora-
tories, Bioquest).
(e) Pathotec Test Strips (General Diagnos-
tics Division of Warner-Lambert Company).
(f) r/b Enteric Differential System (Diagn-
ostic Research, Inc.).
5.4 Procedure
5.4.1 Biochemical tests should always be
performed along with positive and negative
controls. See Table IV-A-5.
5.4.2 Indole Test
(a) Inoculate a pure culture into 5 ml of
tryptophane broth.
(b) Incubate the tryptophane broth at 35 +
0.5 C for 24±2 hours and mix well.
(c) Add 0.2-0.3 ml test reagent to the 24
hour culture, shake, and allow the mixture to
stand for 10 minutes. Observe and record the
results.
(d) A dark red color in the amyl alcohol
layer on top of the culture is a positive indole
test; the original color of the reagent, a nega-
tive test. An orange color may indicate the
presence of skatole and is reported as a +
reaction.
5.4.3 Methyl Red Test
(a) Inoculate a pure culture into 10 ml of
buffered glucose broth.
(b) Incubate for 5 days at 35 C.
(c) To 5 ml of the five day culture, add 5
drops of methyl red indicator.
(d) A distinct red color is positive and dis-
tinct yellow, negative. Orange color is dubious,
may indicate a mixed culture and should be
repeated.
5.4.4 Voges Proskauer Test: This procedure
detects the production of acetyl methyl carbinol
which in the presence of alphanapthol and
potassium hydroxide develops a reddish color.
(a) Use a pure culture to inoculate 10 ml of
buffered glucose broth or 5 ml of salt peptone
glucose broth or use the previously inoculated
buffered glucose broth from the Methyl Red
Test.
(b) Incubate the inoculated salt peptone
glucose broth or the buffered glucose broth at
35 +_ 0.5 C for 48 hours.
(c) Add 0.6 ml naphthol solution and 0.2
ml KOH solution to 1 ml of the 48 hour salt
peptone or buffered glucose broth culture in a
separate clean test tube. Shake vigorously for
10 seconds and allow the mixture to stand for
2-4 hours.
(d) Observe the results and record. A pink
to crimson color is a positive test. Do not read
after 4 hours. A negative test may develop a
copper orfaint brown color.
TOTAL COLIFORMS
121
image:
5.3,4 Nutrient agar slant for oxidase test.
(See Part II-B, 5.1.1 for preparation).
5.3.5 Decarboxylase medium base con-
taining lysine HCI, arginine HCI or ornithine
HCI to demonstrate utilization of the specific
amino acids. (See Part II-B, 5.5.14 for
preparation).
5.3.6 Motility test medium (Edwards and
Ewing). (See Section II-B, 5.1.10 for
preparation).
5.3.7 Multitest Systems (optional to Sin-
gle Test Series)
(a) API Enteric 20 (Analytab Products, Inc.).
(b) Enterotube (Roche Diagnostics).
(c) Inolex (Inolex Biomedical Division of
Wilson Pharmaceutical and Chemical Corp.).
(d) Minitek (Baltimore Biological Labora-
tories, Bioquest).
(e) Pathotec Test Strips (General Diagnos-
tics Division of Warner-Lambert Company).
(f) r/b Enteric Differential System (Diagn-
ostic Research, Inc.).
5.4 Procedure
5.4.1 Biochemical tests should always be
performed along with positive and negative
controls. See Table IV-A-5.
5.4.2 Indole Test
(a) Inoculate a pure culture into 5 ml of
tryptophane broth.
(b) Incubate the tryptophane broth at 35 +
0.5 C for 24±2 hours and mix well.
(c) Add 0.2-0.3 ml test reagent to the 24
hour culture, shake, and allow the mixture to
stand for 10 minutes. Observe and record the
results.
(d) A dark red color in the amyl alcohol
layer on top of the culture is a positive indole
test; the original color of the reagent, a nega-
tive test. An orange color may indicate the
presence of skatole and is reported as a +
reaction.
5.4.3 Methyl Red Test
(a) Inoculate a pure culture into 10 ml of
buffered glucose broth.
(b) Incubate for 5 days at 35 C.
(c) To 5 ml of the five day culture, add 5
drops of methyl red indicator.
(d) A distinct red color is positive and dis-
tinct yellow, negative. Orange color is dubious,
may indicate a mixed culture and should be
repeated.
5.4.4 Voges Proskauer Test: This procedure
detects the production of acetyl methyl carbinol
which in the presence of alphanapthol and
potassium hydroxide develops a reddish color.
(a) Use a pure culture to inoculate 10 ml of
buffered glucose broth or 5 ml of salt peptone
glucose broth or use the previously inoculated
buffered glucose broth from the Methyl Red
Test.
(b) Incubate the inoculated salt peptone
glucose broth or the buffered glucose broth at
35 +_ 0.5 C for 48 hours.
(c) Add 0.6 ml naphthol solution and 0.2
ml KOH solution to 1 ml of the 48 hour salt
peptone or buffered glucose broth culture in a
separate clean test tube. Shake vigorously for
10 seconds and allow the mixture to stand for
2-4 hours.
(d) Observe the results and record. A pink
to crimson color is a positive test. Do not read
after 4 hours. A negative test may develop a
copper orfaint brown color.
TOTAL COLIFORMS
121
image:
 5.4.5 Citrate Test
(a) Lightly inoculate a pure culture into a
tube of Simmon's Citrate Agar, using a needle
to stab, then streak the medium. Be careful not
to carry over any nutrient material.
(b) Incubate at 35 C for 48 hours.
(c) Examine agar tube for growth and color
change. A distinct Prussian blue color in the
presence of growth indicates a positive test;
no color change is a negative test.
5.4.6 Cytochrome Oxidase Test
(Indophenol): The cytochrome oxidase test can
be done with commercially-prepared paper
strips or on a nutrient agar slant as follows:
(a) Inoculate nutrient agar slant and incu-
bate at 35 C for 18-24 hours. Older cultures
should not be used.
(b) Add 2-3 drops of reagent A and reag-
ent B to the slant, tilt to mix and read reaction
within 2 minutes.
(c) Strong positive reaction (blue color
slant or paper strip) occurs in 30 seconds.
Ignore weak reactions that occur after 2
minutes.
5.4.7 Decarboxylase Tests (lysine, argi-
nineandornithine)
(a) The complete decarboxylase test series
requires tubes of each of the amino acids and a
control tube containing no amino acids.
(b) Inoculate each tube lightly.
(c) Add sufficient sterile mineral oil to the
broths to make 3-4 mm layers on the surface
and tighten the screw caps.
(d) Incubate for 18-24 hours at 35 C and
read. Negative reactions should be re-
incubated up to 4 days.
(e) Positive reactions ark purple and
negative reactions are yellow. Read the control
tube without amino acid first; it must be yellow
for the reactions of the other tubes to be valid.
Positive purple tubes must have growth as
evidenced by turbidity because uninoculated
tubes are also purple; nonfermenters may
remain alkaline throughout incubation.
5.4.8MotilityTest
(a) Stab-inoculate the center of the tube of
Motility Test Medium to at least half depth.
(b) Incubate tubes 24-48 hours at 35 C.
(c) Examine tubes for growth. If negative,
reincubate at room temperature for 5 more
days.
(d) Non-motile organisms grow only along
the line of inoculation. Motile organisms grow
outward from the line of inoculation and
spread throughout the medium producing a
cloudy appearance.
(e) Addition of 2, 3, 5 triphenyl tetrazolium
chloride (TTC) will aid recognition of motility.
Growth of microorganisms reduces TTC and
produces red color along the line of growth.
5.4.9 Additional Biochemical Tests: If
other biochemical tests are necessary to fur-
ther identify enteric bacteria, for example spe-
cific carbohydrate fermentation, see the Table
lll-E-5, Biochemical Characteristics of Entero-
bacteriaceae.
5.4.10 Multitest Systems: Multitest sys-
tems are available which use tubes containing
agar media that provide numerous biochemi-
cal tests, plastic units containing a series of
dehydrated media, media-impregnated discs
and reagent-impregnated paper strips. Some
of the systems use numerical codes to aid
identification. Others provide computerized
identification of bacteria. A number of inde-
pendent investigators have compared one or
more multitest systems with conventional or
traditional biochemical tests. Some of the ear-
lier systems have been improved. Most of the
recent studies report the correct identification
of high percentages of isolates. The systems
are described in Part III-E, 5.6.
122
MICROBIOLOGICAL MANUAL 1978
image:
5.4.5 Citrate Test
(a) Lightly inoculate a pure culture into a
tube of Simmon's Citrate Agar, using a needle
to stab, then streak the medium. Be careful not
to carry over any nutrient material.
(b) Incubate at 35 C for 48 hours.
(c) Examine agar tube for growth and color
change. A distinct Prussian blue color in the
presence of growth indicates a positive test;
no color change is a negative test.
5.4.6 Cytochrome Oxidase Test
(Indophenol): The cytochrome oxidase test can
be done with commercially-prepared paper
strips or on a nutrient agar slant as follows:
(a) Inoculate nutrient agar slant and incu-
bate at 35 C for 18-24 hours. Older cultures
should not be used.
(b) Add 2-3 drops of reagent A and reag-
ent B to the slant, tilt to mix and read reaction
within 2 minutes.
(c) Strong positive reaction (blue color
slant or paper strip) occurs in 30 seconds.
Ignore weak reactions that occur after 2
minutes.
5.4.7 Decarboxylase Tests (lysine, argi-
nineandornithine)
(a) The complete decarboxylase test series
requires tubes of each of the amino acids and a
control tube containing no amino acids.
(b) Inoculate each tube lightly.
(c) Add sufficient sterile mineral oil to the
broths to make 3-4 mm layers on the surface
and tighten the screw caps.
(d) Incubate for 18-24 hours at 35 C and
read. Negative reactions should be re-
incubated up to 4 days.
(e) Positive reactions ark purple and
negative reactions are yellow. Read the control
tube without amino acid first; it must be yellow
for the reactions of the other tubes to be valid.
Positive purple tubes must have growth as
evidenced by turbidity because uninoculated
tubes are also purple; nonfermenters may
remain alkaline throughout incubation.
5.4.8MotilityTest
(a) Stab-inoculate the center of the tube of
Motility Test Medium to at least half depth.
(b) Incubate tubes 24-48 hours at 35 C.
(c) Examine tubes for growth. If negative,
reincubate at room temperature for 5 more
days.
(d) Non-motile organisms grow only along
the line of inoculation. Motile organisms grow
outward from the line of inoculation and
spread throughout the medium producing a
cloudy appearance.
(e) Addition of 2, 3, 5 triphenyl tetrazolium
chloride (TTC) will aid recognition of motility.
Growth of microorganisms reduces TTC and
produces red color along the line of growth.
5.4.9 Additional Biochemical Tests: If
other biochemical tests are necessary to fur-
ther identify enteric bacteria, for example spe-
cific carbohydrate fermentation, see the Table
lll-E-5, Biochemical Characteristics of Entero-
bacteriaceae.
5.4.10 Multitest Systems: Multitest sys-
tems are available which use tubes containing
agar media that provide numerous biochemi-
cal tests, plastic units containing a series of
dehydrated media, media-impregnated discs
and reagent-impregnated paper strips. Some
of the systems use numerical codes to aid
identification. Others provide computerized
identification of bacteria. A number of inde-
pendent investigators have compared one or
more multitest systems with conventional or
traditional biochemical tests. Some of the ear-
lier systems have been improved. Most of the
recent studies report the correct identification
of high percentages of isolates. The systems
are described in Part III-E, 5.6.
122
MICROBIOLOGICAL MANUAL 1978
image:
 REFERENCES
1. Geldreich, E. E., P. W. Kabler, H. L. Jeter and H. F. Clark, 1955. A delayed incubation membrane
filter test for coliform bacteria in water. Amer. Jour. Public Health 45:1462.
2. Brezenski, F. T. and J. A. Winter, 1969. Use of the delayed incubation membrane filter test for
determining coliform bacteria in sea water. Water Res. 3:583.
3. Geldreich, E. E., 1 975. Handbook for Evaluating Water Bacteriological Laboratories (2nd ed.),
EPA-670/9-75-006. U.S. Environmental Protection Agency, Cincinnati, Ohio.
4. Tubiash, H., 1951. The Anaerogenic Effect of Nitrates and Nitrites on Gram-negative Enteric
Bacteria. Amer. Jour. Public Health 41:833.
5. National Interim Primary Drinking Water Regulations, 40 Code of Federal Regulations (CFR) Part
141.14 (b) and (c), Published in Federal Register, 40, 59566, December 24, 1975.
TOTAL COLIFORMS 123
image:
REFERENCES
1. Geldreich, E. E., P. W. Kabler, H. L. Jeter and H. F. Clark, 1955. A delayed incubation membrane
filter test for coliform bacteria in water. Amer. Jour. Public Health 45:1462.
2. Brezenski, F. T. and J. A. Winter, 1969. Use of the delayed incubation membrane filter test for
determining coliform bacteria in sea water. Water Res. 3:583.
3. Geldreich, E. E., 1 975. Handbook for Evaluating Water Bacteriological Laboratories (2nd ed.),
EPA-670/9-75-006. U.S. Environmental Protection Agency, Cincinnati, Ohio.
4. Tubiash, H., 1951. The Anaerogenic Effect of Nitrates and Nitrites on Gram-negative Enteric
Bacteria. Amer. Jour. Public Health 41:833.
5. National Interim Primary Drinking Water Regulations, 40 Code of Federal Regulations (CFR) Part
141.14 (b) and (c), Published in Federal Register, 40, 59566, December 24, 1975.
TOTAL COLIFORMS 123
image:
 PART III. ANALYTICAL METHODOLOGY
Section C Fecal Coliform Methods
The direct membrane filter (MF), the
delayed-incubation MF and the multiple-tube,
most probable number (MPN) methods can be
used to enumerate fecal conforms in water and
wastewater. For a general description of the
fundamental laboratory techniques refer to
Part II-C. The method chosen depends upon
the characteristics of the sample. The Section
ts divided as follows:
1. Definition of the Fecal Coliform
Group
2. Direct Membrane Filter (MF)
Method
3. Delayed-incubation Membrane
Filter Method
4. Verification
5. Most Probable Number (MPN)
Method
1. Definition of the Fecal Coliform Group
1,1 The fecal coliforms are part of the total
coliform group. They are defined as gram-
negative nonspore-forming rods that ferment
lactose in 24 ± 2 hours at 44.5 ±_ 0.2 C with
the production of gas in a multiple-tube proce-
dure or produce acidity with blue colonies in a
membrane filter procedure.
1.2 The major species in the fecal coliform
group is Escherichia coli, a species indicative
of fecal pollution and the possible presence of
enteric pathogens.
2. Direct Membrane Filter (MF) Method
2.1 Summary: An appropriate volume of a
water sample or its dilution is passed through
a- membrane filter that retains the bacteria
present in the sample. The filter containing the
microorganisms is placed on an absorbent pad
saturated with M-FC broth or on M-FC agar in a
petri dish. The dish is incubated at 44.5 C for
24 hours. After incubation, the typical blue
colonies are counted under low magnification
and the number of fecal coliforms is reported
per 100 ml of original sample.
2.2 Scops and Application
*
2-2-1 Advantages: The results of the MF
test are obtained in 24 hours. Up to 72 hours
are required for the multiple-tube fermentation
method. The M-FC method provides direct enu-
meration of the fecal coliform group without
enrichment or subsequent testing. Over 93%
of the blue colonies that develop in this test
using M-FC medium at the elevated tempera-
ture of 44.5 C ± 0.2 C are reported to be fecal
coliforms (1). The test is applicable to the ex-
amination of lakes and reservoirs, wells and
springs, public water supplies, natural bathihg
waters, secondary non-chlorinated effluents
from sewage treatment plants, farm ponds,
stormwater runoff, raw municipal sewage, and
feedlot runoff. The MF test has been used with
varied success in marine waters.
2-2-2 Limitations: Recent data (2, 3)
indicate that the single-step MF fecal coliform
procedure may produce lower results than
those obtained with the fecal coliform
124
MICROBIOLOGICAL MANUAL 1978
image:
PART III. ANALYTICAL METHODOLOGY
Section C Fecal Coliform Methods
The direct membrane filter (MF), the
delayed-incubation MF and the multiple-tube,
most probable number (MPN) methods can be
used to enumerate fecal conforms in water and
wastewater. For a general description of the
fundamental laboratory techniques refer to
Part II-C. The method chosen depends upon
the characteristics of the sample. The Section
ts divided as follows:
1. Definition of the Fecal Coliform
Group
2. Direct Membrane Filter (MF)
Method
3. Delayed-incubation Membrane
Filter Method
4. Verification
5. Most Probable Number (MPN)
Method
1. Definition of the Fecal Coliform Group
1,1 The fecal coliforms are part of the total
coliform group. They are defined as gram-
negative nonspore-forming rods that ferment
lactose in 24 ± 2 hours at 44.5 ±_ 0.2 C with
the production of gas in a multiple-tube proce-
dure or produce acidity with blue colonies in a
membrane filter procedure.
1.2 The major species in the fecal coliform
group is Escherichia coli, a species indicative
of fecal pollution and the possible presence of
enteric pathogens.
2. Direct Membrane Filter (MF) Method
2.1 Summary: An appropriate volume of a
water sample or its dilution is passed through
a- membrane filter that retains the bacteria
present in the sample. The filter containing the
microorganisms is placed on an absorbent pad
saturated with M-FC broth or on M-FC agar in a
petri dish. The dish is incubated at 44.5 C for
24 hours. After incubation, the typical blue
colonies are counted under low magnification
and the number of fecal coliforms is reported
per 100 ml of original sample.
2.2 Scops and Application
*
2-2-1 Advantages: The results of the MF
test are obtained in 24 hours. Up to 72 hours
are required for the multiple-tube fermentation
method. The M-FC method provides direct enu-
meration of the fecal coliform group without
enrichment or subsequent testing. Over 93%
of the blue colonies that develop in this test
using M-FC medium at the elevated tempera-
ture of 44.5 C ± 0.2 C are reported to be fecal
coliforms (1). The test is applicable to the ex-
amination of lakes and reservoirs, wells and
springs, public water supplies, natural bathihg
waters, secondary non-chlorinated effluents
from sewage treatment plants, farm ponds,
stormwater runoff, raw municipal sewage, and
feedlot runoff. The MF test has been used with
varied success in marine waters.
2-2-2 Limitations: Recent data (2, 3)
indicate that the single-step MF fecal coliform
procedure may produce lower results than
those obtained with the fecal coliform
124
MICROBIOLOGICAL MANUAL 1978
image:
 multiple-tube procedure, particularly for
chlorinated effluents. Since chlorination
stresses fecal coliforms and significantly
reduces recovery, this method should not be
used with chlorinated wastewater.
Disinfection and toxic materials such as
metals, phenols, acids or caustics also affect
recovery of fecal coliforms on the membrane
filter. Any decision to use this test for stressed
microorganisms requires parallel MF/MPN
evaluation based on the procedure described
inPartlV-C, 3.
Recently-proposed solutions to problems
of lower recovery (2, 4, 5, 6) include the use of
two-step incubation, two-step incubation over-
lay and/or enrichment techniques and modifi-
cation of membrane filter structures.
2.3 Apparatus and Materials
2.3.1 Water bath, aluminum heat sink, or
other incubator that maintains a stable 44.5 +
0.2 C. Temperature is checked against an NBS
certified thermometer or one of equivalent
accuracy.
2.3.2 Binocular (dissecting type) micro-
scope, with magnification of 10-15x and
daylight-type fluorescent lamp.
2.3.3 Hand tally.
2.3.4 Pipet containers of stainless steel,
aluminum or pyrex glass for glass pipets.
2.3.5 Graduated cylinders, covered with
aluminum foil or kraft paper before
sterilization.
2.3.6 Sterile, unassembled membrane fil-
tration units (filter base and funnel), glass, plas-
tic or stainless steel, wrapped with aluminum
foil and kraft paper.
2.3.7 Vacuum source.
2.3.8 Vacuum filter flask, with appropriate
tubing. Filter manifolds which hold a number
of filter bases can also be used.
2.3.9 Safety trap flask between the filter
flask and the vacuum source.
2.3.10 Forceps with smooth tips.
2.3.1 1 Ethanol, 95% or methanol, in small
vial, for sterilizing forceps.
2.3.12 Bunsen/Fisher burner or electric
incinerator.
2.3.13 Sterile TD bacteriological or Mohr
pipets, glass or plastic, of appropriate size.
2.3.14 Sterile petri dishes, 50 x 12 mm
plastic with tight-fitting lids.
2.3.15 Dilution bottles (milk dilution), py-
rex glass, marked at 99 ml volume, screw-cap
with neoprene rubber liner.
2.3.16 Membrane filters, white, grid
marked, 47 mm diameter, 0.45 + 0.02/xm pore
size or other pore size recommended by manu-
facturer for water analyses. The Millipore
HC MF, not the HA, is recommended.
2.3.17 Absorbent pads.
2.3.18 Water-proof plastic bags.
2.3.19 Inoculation loops, 3 mm diameter,
or needle of nichrome or platinum wire, 26
B&S gauge, in suitable holder.
2.3.20 Disposable applicator sticks or
plastic loops as alternatives to inoculation
loops.
2.3.21 Ultraviolet sterilizer for MF filtra-
tion units (optional).
2.4 Media
2.4.1 M-FC broth or agar prepared in pre-
sterilized erlenmeyer flasks (See Part II-B, 5.2.1).
2.4.2 Lauryl tryptose broth prepared in 10
ml volumes in fermentation tubes (see Part II-B,
5.3.1) for verification.
FECAL COLIFORMS
125
image:
multiple-tube procedure, particularly for
chlorinated effluents. Since chlorination
stresses fecal coliforms and significantly
reduces recovery, this method should not be
used with chlorinated wastewater.
Disinfection and toxic materials such as
metals, phenols, acids or caustics also affect
recovery of fecal coliforms on the membrane
filter. Any decision to use this test for stressed
microorganisms requires parallel MF/MPN
evaluation based on the procedure described
inPartlV-C, 3.
Recently-proposed solutions to problems
of lower recovery (2, 4, 5, 6) include the use of
two-step incubation, two-step incubation over-
lay and/or enrichment techniques and modifi-
cation of membrane filter structures.
2.3 Apparatus and Materials
2.3.1 Water bath, aluminum heat sink, or
other incubator that maintains a stable 44.5 +
0.2 C. Temperature is checked against an NBS
certified thermometer or one of equivalent
accuracy.
2.3.2 Binocular (dissecting type) micro-
scope, with magnification of 10-15x and
daylight-type fluorescent lamp.
2.3.3 Hand tally.
2.3.4 Pipet containers of stainless steel,
aluminum or pyrex glass for glass pipets.
2.3.5 Graduated cylinders, covered with
aluminum foil or kraft paper before
sterilization.
2.3.6 Sterile, unassembled membrane fil-
tration units (filter base and funnel), glass, plas-
tic or stainless steel, wrapped with aluminum
foil and kraft paper.
2.3.7 Vacuum source.
2.3.8 Vacuum filter flask, with appropriate
tubing. Filter manifolds which hold a number
of filter bases can also be used.
2.3.9 Safety trap flask between the filter
flask and the vacuum source.
2.3.10 Forceps with smooth tips.
2.3.1 1 Ethanol, 95% or methanol, in small
vial, for sterilizing forceps.
2.3.12 Bunsen/Fisher burner or electric
incinerator.
2.3.13 Sterile TD bacteriological or Mohr
pipets, glass or plastic, of appropriate size.
2.3.14 Sterile petri dishes, 50 x 12 mm
plastic with tight-fitting lids.
2.3.15 Dilution bottles (milk dilution), py-
rex glass, marked at 99 ml volume, screw-cap
with neoprene rubber liner.
2.3.16 Membrane filters, white, grid
marked, 47 mm diameter, 0.45 + 0.02/xm pore
size or other pore size recommended by manu-
facturer for water analyses. The Millipore
HC MF, not the HA, is recommended.
2.3.17 Absorbent pads.
2.3.18 Water-proof plastic bags.
2.3.19 Inoculation loops, 3 mm diameter,
or needle of nichrome or platinum wire, 26
B&S gauge, in suitable holder.
2.3.20 Disposable applicator sticks or
plastic loops as alternatives to inoculation
loops.
2.3.21 Ultraviolet sterilizer for MF filtra-
tion units (optional).
2.4 Media
2.4.1 M-FC broth or agar prepared in pre-
sterilized erlenmeyer flasks (See Part II-B, 5.2.1).
2.4.2 Lauryl tryptose broth prepared in 10
ml volumes in fermentation tubes (see Part II-B,
5.3.1) for verification.
FECAL COLIFORMS
125
image:
 2.4.3 EC medium prepared in 10 ml vol-
umes in fermentation tubes (see Part II-B,
5.3.4) for verification.
2.5 Dilution Water (See Part
preparation).
I,B, 7 for
2.5.1 Sterile buffered dilution water or
peptone water dispensed in 99+2 ml amounts
in screw-capped dilution bottles.
2.5.2 Sterile buffered water or peptone
water prepared in 500 mi or larger volumes for
wetting membranes before addition of the
sample, and for rinsing the funnel after sample
filtration.
2.6 Procedure: The general membrane fil-
ter procedure is described in detail in Part II-C.
2.6.1 Prepare the M-FC broth or agar me-
dium as outlined in Part ll-B, 5.2.1. Saturate the
sterile absorbent pads with about 2.0 ml of
broth or add 5-6 ml of M-FC agar to the bottom
of each 50 X 12 mm petri dish (to a depth of
2-3 mm). Pour off excess liquid from broth-
saturated pads. Mark dishes and bench forms
with sample identity and sample volumes,
2.6.2 Using a sterile forceps place a sterile
membrane filter on the filter base, grid side up.
Attach the funnel to the base of the filter unit;
, the membrane filter is now held between the
funnel and base.
2,6.3 Shake the sampie vigorously about
25 times and measure the sample into the
funnel with the vacuum off. If sample volume is
< 10ml, add 10 ml of sterile dilution water to
the filter before adding the sample.
2.6.4 Sample volumes for fecal coliform
enumeration in different waters and wastewa-
ters are suggested in Table lll-C-1. These vol-
umes should provide the recommended count
of 20-60 colonies on a membrane filter. Fecal
coliform levels are generally lower than total
coliform densities in the same sample; there-
fore larger volumes are sampled.
2.6.5 Do not filter less than 1,0 ml of
undiluted sample.
2.6.6 Filter the sample and rinse the sides
of the funnel walls at least twice with 20-30 ml
of sterile dilution water,
2.6.7 Turn off the vacuum and remove the
funnel from the filter base.
2.6.8 Aseptically remove the membrane
filter from the filter base. Place the filter, grid
side up, on the absorbent pad saturated with
M-FC Broth or on M-FC agar, using a rolling
motion to prevent air bubbles.
2.6.9 Incubate the petri dishes for 24 +_ 2
hours at 44.5 +_ 0.2 C in sealed waterproof
plastic bags submerged (with the petri dishes
inverted) in a waterbath, or without plastic bag
in a heat-sink incubator. MF cultures should be
placed in incubator within 30 minutes of
filtration.
2.6.10 After 24 hours remove dishes from
the incubator and examine for blue colonies.
2.7 Counting and Recording Colonies:
Select those plates with 20-60 blue (some-
times greenish-blue) colonies. Non-fecal
colonies are gray, buff or colorless and are
not counted. Pinpoint blue colonies should be
counted and confirmed. The colonies are
counted using a microscope of 10-15x and
a fluorescent lamp. Use of hand lens or other
simple optical devices of lower magnification
make difficult the identification and differentia-
tion of typical and atypical blue colonies.
2.7.1 The general counting rules are given
in Part II-C, 3.5. The following rules are used
in calculating the fecal coliform count per
100 ml of sample:
(a) Countable Membranes with 20-60
Blue Colonies. Count all blue colonies using
the formula:
No. of Fecal Coliform Colonies Counted
Volume in ml of Sample Filtered
X 100
fecal coliform
count/100 ml
126
MICROBIOLOGICAL MANUAL 1978
image:
2.4.3 EC medium prepared in 10 ml vol-
umes in fermentation tubes (see Part II-B,
5.3.4) for verification.
2.5 Dilution Water (See Part
preparation).
I,B, 7 for
2.5.1 Sterile buffered dilution water or
peptone water dispensed in 99+2 ml amounts
in screw-capped dilution bottles.
2.5.2 Sterile buffered water or peptone
water prepared in 500 mi or larger volumes for
wetting membranes before addition of the
sample, and for rinsing the funnel after sample
filtration.
2.6 Procedure: The general membrane fil-
ter procedure is described in detail in Part II-C.
2.6.1 Prepare the M-FC broth or agar me-
dium as outlined in Part ll-B, 5.2.1. Saturate the
sterile absorbent pads with about 2.0 ml of
broth or add 5-6 ml of M-FC agar to the bottom
of each 50 X 12 mm petri dish (to a depth of
2-3 mm). Pour off excess liquid from broth-
saturated pads. Mark dishes and bench forms
with sample identity and sample volumes,
2.6.2 Using a sterile forceps place a sterile
membrane filter on the filter base, grid side up.
Attach the funnel to the base of the filter unit;
, the membrane filter is now held between the
funnel and base.
2,6.3 Shake the sampie vigorously about
25 times and measure the sample into the
funnel with the vacuum off. If sample volume is
< 10ml, add 10 ml of sterile dilution water to
the filter before adding the sample.
2.6.4 Sample volumes for fecal coliform
enumeration in different waters and wastewa-
ters are suggested in Table lll-C-1. These vol-
umes should provide the recommended count
of 20-60 colonies on a membrane filter. Fecal
coliform levels are generally lower than total
coliform densities in the same sample; there-
fore larger volumes are sampled.
2.6.5 Do not filter less than 1,0 ml of
undiluted sample.
2.6.6 Filter the sample and rinse the sides
of the funnel walls at least twice with 20-30 ml
of sterile dilution water,
2.6.7 Turn off the vacuum and remove the
funnel from the filter base.
2.6.8 Aseptically remove the membrane
filter from the filter base. Place the filter, grid
side up, on the absorbent pad saturated with
M-FC Broth or on M-FC agar, using a rolling
motion to prevent air bubbles.
2.6.9 Incubate the petri dishes for 24 +_ 2
hours at 44.5 +_ 0.2 C in sealed waterproof
plastic bags submerged (with the petri dishes
inverted) in a waterbath, or without plastic bag
in a heat-sink incubator. MF cultures should be
placed in incubator within 30 minutes of
filtration.
2.6.10 After 24 hours remove dishes from
the incubator and examine for blue colonies.
2.7 Counting and Recording Colonies:
Select those plates with 20-60 blue (some-
times greenish-blue) colonies. Non-fecal
colonies are gray, buff or colorless and are
not counted. Pinpoint blue colonies should be
counted and confirmed. The colonies are
counted using a microscope of 10-15x and
a fluorescent lamp. Use of hand lens or other
simple optical devices of lower magnification
make difficult the identification and differentia-
tion of typical and atypical blue colonies.
2.7.1 The general counting rules are given
in Part II-C, 3.5. The following rules are used
in calculating the fecal coliform count per
100 ml of sample:
(a) Countable Membranes with 20-60
Blue Colonies. Count all blue colonies using
the formula:
No. of Fecal Coliform Colonies Counted
Volume in ml of Sample Filtered
X 100
fecal coliform
count/100 ml
126
MICROBIOLOGICAL MANUAL 1978
image:
 TABLE lll-C-1
Suggested Range of Sample Volumes for Fecal Coliform Tests
Using the Membrane Filter Method
FECAL COUFOFIMS
Sample Source 100 30 10 3 1
Swimming Pools X
Wells, Springs XX
Lakes, Reservoirs X X X
Water Supply Intakes XXX
Bathing Beaches - XX X
River Water X
Chlorinated Sewage Effluent X
Raw Sewage
0.3 0.1 0.03 0.01 0.003 0.001 0.0003 0.0001
X X
X X
XXX X
X X X X
X X X X X
image:
TABLE lll-C-1
Suggested Range of Sample Volumes for Fecal Coliform Tests
Using the Membrane Filter Method
FECAL COUFOFIMS
Sample Source 100 30 10 3 1
Swimming Pools X
Wells, Springs XX
Lakes, Reservoirs X X X
Water Supply Intakes XXX
Bathing Beaches - XX X
River Water X
Chlorinated Sewage Effluent X
Raw Sewage
0.3 0.1 0.03 0.01 0.003 0.001 0.0003 0.0001
X X
X X
XXX X
X X X X
X X X X X
image:
 For example, if 40 colonies are counted
after the filtration of 50 ml of sample, the
calculation is:
X 100 = 80 fecal coliforms/100 rnl.
fa) Countable Membranes With Less Than
20 Blue Colonies. Report as: Estimated
Count/100 ml and specify the reason.
(°) Membranes With No Colonies. Report
the count as: Less than (calculated value)/100
ml, based upon the largest single volume
filtered.
For example, if 10, 3 and 1 ml are filtered
and all plates show zero counts, select the
largest volume, apply the general formula and
report the count as a < (less than) value:
1
10
X 100 = 10
or < 10 fecal coliforms/100 ml.
(d) Countable Membranes With More Than
60 Blue Colonies. Calculate count from high-
est dilution and report as a > value.
(&} Uncountable Membranes With More
Than 60 Colonies. Use 60 colonies as the
basis of calculation with the smallest filtration
volume, e.g., 0.01 ml:
60
0.01
X 100 = 600,000
Report as: >
coliforms/100 mi.
600,000 fecal
2.7.2 Reporting Results. Report fecal coli-
form densities per 100 ml. See discussion on
significant figures in Part ll-C, 2.8.1.
2.8 Precision and Accuracy
2.8.1 Ninety-three percent of the blue col-
onies that develop on M-FC medium at the
elevated temperature of 44.5 ± 0.2 C were
verified as fecal coliform (1).
2.8.2 Laboratory personnel should be able
to duplicate their own colony counts on the
same plate within 5%, and the counts of other
analysts on the same plate within 10%.
3. Delayed-lncubation Membrane Filter (MF)
Method
3.1 Summary: Bacteria are retained on
0.45 um filters after passage of selected sam-
ple volumes through the filters. The filters are
placed on M-VFC broth (a minimum growth
medium) and transported from field sites to the
laboratory. In the laboratory, the filters are
transferred to the M-FC medium and incubated
at 44.5 C for 24 hours. Blue colonies are coun-
ted as fecal coliforms.
3.2 Scope and Application
3.2.1 Advantages: The delayed incubation
MF method is useful in survey monitoring or
emergency situations when the standard fecal
coliform test cannot be performed at the sam-
ple site, or when time and temperature limits
for sample storage cannot be met. The method
eliminates field processing and equipment
needs. Also, examination at a central labora-
tory permits confirmation and biochemical
identification of the organisms as necessary.
Consistent results have been obtained with
this method using water samples from a vari-
ety of sources (7).
3-2.2 Limitations: The applicability of this
method for a specific water source must be
determined in preliminary studies by compari-
son with the standard MF method. For exam-
ple, limited testing has indicated that the
delayed-incubation method is not as effective
in saline waters (7).
3.3 Apparatus and Materials
3.3.1 Water bath, aluminum heat sink, or
equivalent incubator that maintains a 44.5 ^
0.2 C temperature.
3.3.2 Binocular (dissection) microscope,
with magnification 10 or 15x, binocular,
wide-field type. A microscope lamp producing
128
«>EPA MICROBIOLOGICAL MANUAL 1978
image:
For example, if 40 colonies are counted
after the filtration of 50 ml of sample, the
calculation is:
X 100 = 80 fecal coliforms/100 rnl.
fa) Countable Membranes With Less Than
20 Blue Colonies. Report as: Estimated
Count/100 ml and specify the reason.
(°) Membranes With No Colonies. Report
the count as: Less than (calculated value)/100
ml, based upon the largest single volume
filtered.
For example, if 10, 3 and 1 ml are filtered
and all plates show zero counts, select the
largest volume, apply the general formula and
report the count as a < (less than) value:
1
10
X 100 = 10
or < 10 fecal coliforms/100 ml.
(d) Countable Membranes With More Than
60 Blue Colonies. Calculate count from high-
est dilution and report as a > value.
(&} Uncountable Membranes With More
Than 60 Colonies. Use 60 colonies as the
basis of calculation with the smallest filtration
volume, e.g., 0.01 ml:
60
0.01
X 100 = 600,000
Report as: >
coliforms/100 mi.
600,000 fecal
2.7.2 Reporting Results. Report fecal coli-
form densities per 100 ml. See discussion on
significant figures in Part ll-C, 2.8.1.
2.8 Precision and Accuracy
2.8.1 Ninety-three percent of the blue col-
onies that develop on M-FC medium at the
elevated temperature of 44.5 ± 0.2 C were
verified as fecal coliform (1).
2.8.2 Laboratory personnel should be able
to duplicate their own colony counts on the
same plate within 5%, and the counts of other
analysts on the same plate within 10%.
3. Delayed-lncubation Membrane Filter (MF)
Method
3.1 Summary: Bacteria are retained on
0.45 um filters after passage of selected sam-
ple volumes through the filters. The filters are
placed on M-VFC broth (a minimum growth
medium) and transported from field sites to the
laboratory. In the laboratory, the filters are
transferred to the M-FC medium and incubated
at 44.5 C for 24 hours. Blue colonies are coun-
ted as fecal coliforms.
3.2 Scope and Application
3.2.1 Advantages: The delayed incubation
MF method is useful in survey monitoring or
emergency situations when the standard fecal
coliform test cannot be performed at the sam-
ple site, or when time and temperature limits
for sample storage cannot be met. The method
eliminates field processing and equipment
needs. Also, examination at a central labora-
tory permits confirmation and biochemical
identification of the organisms as necessary.
Consistent results have been obtained with
this method using water samples from a vari-
ety of sources (7).
3-2.2 Limitations: The applicability of this
method for a specific water source must be
determined in preliminary studies by compari-
son with the standard MF method. For exam-
ple, limited testing has indicated that the
delayed-incubation method is not as effective
in saline waters (7).
3.3 Apparatus and Materials
3.3.1 Water bath, aluminum heat sink, or
equivalent incubator that maintains a 44.5 ^
0.2 C temperature.
3.3.2 Binocular (dissection) microscope,
with magnification 10 or 15x, binocular,
wide-field type. A microscope lamp producing
128
«>EPA MICROBIOLOGICAL MANUAL 1978
image:
 diffuse daylight from cool white fluorescent
lamps.
3.3.3 Hand tally.
3.3.4 Pipet containers of stainless steel,
aluminum or pyrex glass for glass pipets.
3.3.5 Graduated cylinders, covered with
aluminum foil or kraft paper before
sterilization.
3.3.6 Sterile unassembled membrane fil-
tration units (filter base and funnel), glass, plas-
tic or stainless steel wrapped with aluminum
foil or kraft paper.
3.3.7 Vacuum source.
3.3.8 Filter flask to hold filter base, with
appropriate tubing. Filter manifold to hold a
number of filter bases can also be used. In the
field, portable field kits are also used.
3.3.9 Safety trap flask between the filter-
ing flask and the vacuum source.
3.3.10 Forceps with smooth tip.
3.3.11 Ethanol, 95% or methanol, in small
vial, for sterilizing forceps.
3.3.12 Bunsen/Fisher type burner.
3.3.13 Sterile TD bacteriological or Mohr
pipets, glass or plastic, in appropriate volumes.
3.3.14 Sterile petri dishes, 50 x 12 mm
plastic with tight-fitting lids.
3.3.15 Dilution bottles (milk dilution), py-
rex glass, 99 ml volume, screw-caps with neo-
prene rubber liners.
3.3.16 Membrane filters, white, grid mark-
ed, 47 mm in diameter, 0.45±0.02pm pore size,
or other pore size recommended by the manu-
facturer for water analyses. The Millipore HC
MF, not the HA is recommended.
3.3.17 Shipping tubes, labels, and packing
materials for mailing delayed incubation plates.
3.3.18 Ultraviolet sterilizer for MF filtra-
tion units (optional).
3.4 Media: The following media are pre-
pared in pre-sterilized erlenmeyer flasks with
metal caps, aluminum foil covers, or screw-
caps:
3.4.1 M-VFC holding media (see Part II-B,
5.2.6).
3.4.2 M-FC broth or agar (see Part II-B,
5.2.1).
3.5 Dilution Water
3.5.1 Sterile dilution water dispensed in
99 + 2 ml volumes in screw-capped bottles.
3.5.2 Sterile dilution water prepared in
large volumes for wetting membranes before
the addition of the sample, and for rinsing the
funnel after sample filtration.
3.6 Procedure: The general membrane fil-
ter procedure is described in detail in Part II-C.
3.6.1 Prepare the M-VFC holding medium
as outlined in Part II-B, 5.2.6. Saturate the
sterile absorbent pads with about 2.0 ml of M-
VFC broth. Pour off excess broth. Mark dishes
and bench forms with sample identity and
volumes.
3.6.2 Using sterile forceps place a mem-
brane filter on the filter base grid side up.
3.6.3 Attach the funnel to the base of the
filter unit; the membrane filter is now held
between the funnel and base.
3.6.4 Shake the sample vigorously about
25 times and measure into the funnel with the
vacuum off. If the sample is < 10 ml, add 10
ml of sterile dilution water to the membrane
filter before adding the sample.
(a) Sample volumes for fecal coliform enu-
meration in different waters and wastewaters
are suggested in Table II1-C-1. These volumes
should produce membrane filters with a re-
commended count of 20-60 colonies.
FECAL COUFORMS
129
image:
diffuse daylight from cool white fluorescent
lamps.
3.3.3 Hand tally.
3.3.4 Pipet containers of stainless steel,
aluminum or pyrex glass for glass pipets.
3.3.5 Graduated cylinders, covered with
aluminum foil or kraft paper before
sterilization.
3.3.6 Sterile unassembled membrane fil-
tration units (filter base and funnel), glass, plas-
tic or stainless steel wrapped with aluminum
foil or kraft paper.
3.3.7 Vacuum source.
3.3.8 Filter flask to hold filter base, with
appropriate tubing. Filter manifold to hold a
number of filter bases can also be used. In the
field, portable field kits are also used.
3.3.9 Safety trap flask between the filter-
ing flask and the vacuum source.
3.3.10 Forceps with smooth tip.
3.3.11 Ethanol, 95% or methanol, in small
vial, for sterilizing forceps.
3.3.12 Bunsen/Fisher type burner.
3.3.13 Sterile TD bacteriological or Mohr
pipets, glass or plastic, in appropriate volumes.
3.3.14 Sterile petri dishes, 50 x 12 mm
plastic with tight-fitting lids.
3.3.15 Dilution bottles (milk dilution), py-
rex glass, 99 ml volume, screw-caps with neo-
prene rubber liners.
3.3.16 Membrane filters, white, grid mark-
ed, 47 mm in diameter, 0.45±0.02pm pore size,
or other pore size recommended by the manu-
facturer for water analyses. The Millipore HC
MF, not the HA is recommended.
3.3.17 Shipping tubes, labels, and packing
materials for mailing delayed incubation plates.
3.3.18 Ultraviolet sterilizer for MF filtra-
tion units (optional).
3.4 Media: The following media are pre-
pared in pre-sterilized erlenmeyer flasks with
metal caps, aluminum foil covers, or screw-
caps:
3.4.1 M-VFC holding media (see Part II-B,
5.2.6).
3.4.2 M-FC broth or agar (see Part II-B,
5.2.1).
3.5 Dilution Water
3.5.1 Sterile dilution water dispensed in
99 + 2 ml volumes in screw-capped bottles.
3.5.2 Sterile dilution water prepared in
large volumes for wetting membranes before
the addition of the sample, and for rinsing the
funnel after sample filtration.
3.6 Procedure: The general membrane fil-
ter procedure is described in detail in Part II-C.
3.6.1 Prepare the M-VFC holding medium
as outlined in Part II-B, 5.2.6. Saturate the
sterile absorbent pads with about 2.0 ml of M-
VFC broth. Pour off excess broth. Mark dishes
and bench forms with sample identity and
volumes.
3.6.2 Using sterile forceps place a mem-
brane filter on the filter base grid side up.
3.6.3 Attach the funnel to the base of the
filter unit; the membrane filter is now held
between the funnel and base.
3.6.4 Shake the sample vigorously about
25 times and measure into the funnel with the
vacuum off. If the sample is < 10 ml, add 10
ml of sterile dilution water to the membrane
filter before adding the sample.
(a) Sample volumes for fecal coliform enu-
meration in different waters and wastewaters
are suggested in Table II1-C-1. These volumes
should produce membrane filters with a re-
commended count of 20-60 colonies.
FECAL COUFORMS
129
image:
 (b) Follow the methods for sample mea-
surement and dispensation given in Part II-C,
3.4.6.
3.6.5 Filter the sample through the mem-
brane and rinse the sides of the funnel walls at
least twice with 20-30 ml of sterile dilution
water.
3.6.6 Turn off the vacuum and remove the
funnel from the base of the filter unit.
3.6.7 Aseptically remove the membrane
filter from the filter base and place grid side up
on an absorbent pad saturated with VFC
medium.
3.6.8 Place the culture dish in shipping
container and send to the examining labora-
tory. Fecal coliform bacteria can be held on the
VFC holding medium for up to 72 hours with
little effect on the final counts. The holding
period should be kept to a minimum.
3.6.9 At the examining laboratory remove
the membrane from the holding medium,
place it in another dish containing M-FC broth
or agar medium, and complete testing for fecal
coliforms as described above under 2.6.
4. Verification
Verification of the membrane filter test for
fecal coliforms establishes the validity of col-
ony differentiation by blue color and provides
supporting evidence of colony interpretation.
The verification procedure corresponds to the
fecal coliform MPN (EC Medium) test.
4.1 Pick from the centers of at least 10
well-isolated blue colonies. Inoculate into lauryl
tryptose broth and incubate 24-48 hours at
35 + 0.5 C.
4.2 Confirm gas-positive lauryl tryptose
broth tubes at 24 and 48 hours by inoculating
a loopful of growth into EC tubes and incubat-
ing for 24 hours at 44.5 ± 0.2 C. Cultures that
produce gas in EC tubes are interpreted as
verified fecal coliform colonies (see Figure III-
C-1).
4.3 A percent verification can be deter-
mined for any colony-validation test:
No. of colonies meeting verification test
No. of colonies subjected to verification
X 100
= Percent verification
3.7 Counting and Recording Colonies:
After the required incubation select those
plates with 20-60 blue (sometimes greenish-
blue) colonies. Gray to cream colored colonies
are not counted. Pin-point blue colonies are
not counted unless confirmed. The colonies
are enumerated using a binocular microscope
with a magnification of 10 or 15*.
Refer to 2.7.1, for rules used in reporting
the fecal coliform MF counts.
3.8 Reporting Results: Record densities
as fecal coliforms per 100 ml. Refer to Part II-C,
2.8, for discussions on the use of significant
figures and rounding off values.
Example: Twenty blue colonies on M-FC
medium were subjected to verification studies
shown in Figure lll-C-1. Eighteen of these colo-
nies proved to be fecal coliforms according to
provisions of the test:
18
Percent verification = X 100 = 90%
20
4.4 A percent verification figure can be
applied to the direct test results to determine
the verified fecal coliform count per 100 ml:
Percent verification
100
X
count per
100 ml
Verified fecal
coliform count
3.9 Precision and Accuracy: As reported
in 2.8, this Section.
Example: For a given sample, by the M-FC
test, the fecal coliform count was found to be
130
<3>ERA MICROBIOLOGICAL MANUAL 1978
image:
(b) Follow the methods for sample mea-
surement and dispensation given in Part II-C,
3.4.6.
3.6.5 Filter the sample through the mem-
brane and rinse the sides of the funnel walls at
least twice with 20-30 ml of sterile dilution
water.
3.6.6 Turn off the vacuum and remove the
funnel from the base of the filter unit.
3.6.7 Aseptically remove the membrane
filter from the filter base and place grid side up
on an absorbent pad saturated with VFC
medium.
3.6.8 Place the culture dish in shipping
container and send to the examining labora-
tory. Fecal coliform bacteria can be held on the
VFC holding medium for up to 72 hours with
little effect on the final counts. The holding
period should be kept to a minimum.
3.6.9 At the examining laboratory remove
the membrane from the holding medium,
place it in another dish containing M-FC broth
or agar medium, and complete testing for fecal
coliforms as described above under 2.6.
4. Verification
Verification of the membrane filter test for
fecal coliforms establishes the validity of col-
ony differentiation by blue color and provides
supporting evidence of colony interpretation.
The verification procedure corresponds to the
fecal coliform MPN (EC Medium) test.
4.1 Pick from the centers of at least 10
well-isolated blue colonies. Inoculate into lauryl
tryptose broth and incubate 24-48 hours at
35 + 0.5 C.
4.2 Confirm gas-positive lauryl tryptose
broth tubes at 24 and 48 hours by inoculating
a loopful of growth into EC tubes and incubat-
ing for 24 hours at 44.5 ± 0.2 C. Cultures that
produce gas in EC tubes are interpreted as
verified fecal coliform colonies (see Figure III-
C-1).
4.3 A percent verification can be deter-
mined for any colony-validation test:
No. of colonies meeting verification test
No. of colonies subjected to verification
X 100
= Percent verification
3.7 Counting and Recording Colonies:
After the required incubation select those
plates with 20-60 blue (sometimes greenish-
blue) colonies. Gray to cream colored colonies
are not counted. Pin-point blue colonies are
not counted unless confirmed. The colonies
are enumerated using a binocular microscope
with a magnification of 10 or 15*.
Refer to 2.7.1, for rules used in reporting
the fecal coliform MF counts.
3.8 Reporting Results: Record densities
as fecal coliforms per 100 ml. Refer to Part II-C,
2.8, for discussions on the use of significant
figures and rounding off values.
Example: Twenty blue colonies on M-FC
medium were subjected to verification studies
shown in Figure lll-C-1. Eighteen of these colo-
nies proved to be fecal coliforms according to
provisions of the test:
18
Percent verification = X 100 = 90%
20
4.4 A percent verification figure can be
applied to the direct test results to determine
the verified fecal coliform count per 100 ml:
Percent verification
100
X
count per
100 ml
Verified fecal
coliform count
3.9 Precision and Accuracy: As reported
in 2.8, this Section.
Example: For a given sample, by the M-FC
test, the fecal coliform count was found to be
130
<3>ERA MICROBIOLOGICAL MANUAL 1978
image:
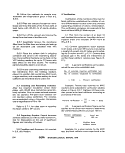 Pick 10 blue colonies
Lauryl Tryptose Broth
24 hours at 35 C
Gas +
Gas-
Reincubate
24 hours at 35 C
Gas +
EC Broth
24 hours at 44.5 C
Gas + Gas-
Verified Negative
Fecal Coliform ,-
Colony rest
Gas-
Negative
Test
FIGURE lll-C-1. Verification of Fecal Coliform Colonies on the Membrane Filter
FECAL COLIFORMS
131
image:
Pick 10 blue colonies
Lauryl Tryptose Broth
24 hours at 35 C
Gas +
Gas-
Reincubate
24 hours at 35 C
Gas +
EC Broth
24 hours at 44.5 C
Gas + Gas-
Verified Negative
Fecal Coliform ,-
Colony rest
Gas-
Negative
Test
FIGURE lll-C-1. Verification of Fecal Coliform Colonies on the Membrane Filter
FECAL COLIFORMS
131
image:
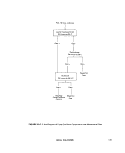 42,000 organisms per 100 ml. Supplemental
studies on selected colonies showed 92%
verification.
Verified fecal
coliform count
92
100
X 42,000 = 38,640
Rounding off = 39,000 fecal coliforms
per 100 ml
The worker is cautioned not to apply per-
centage of verification determined on one
sample to other samples.
5. Most Probable Number (MPN) Method
5.1 Summary: Culture from positive tubes
of the lauryl tryptose broth (same as presump-
tive MPN Method, Part lll-B) is inoculated into
EC Broth and incubated at 44.5 C for 24 hours
(see Figure lll-C-2). Formation of gas in any
quantity in the inverted vial is a positive reac-
tion confirming fecal coliforms. Fecal coliform
densities are calculated from the MPN table on
the basis of the positive EG tubes (8).
5.2 Apparatus and Materials
5.2.1 Incubatorthat maintains 35 ± 0.5 C.
5.2.2 Water bath or equivalent incubator
that maintains a 44.5 ^ 0.2 C temperature.
5.2.3 Pipet containers of stainless steel,
aluminum or pyrex glass for glass pipets.
5.2.4 Inoculation loop, 3 mm diameter
and needle of nichrome or platinum wire, 26 B
& S gauge, in suitable holder. Sterile applica-
tor sticks are a suitable alternative.
5.2.5 Sterile pipets T.D., Mohr or bacterio-
logical, glass or plastic, of appropriate size.
5.2.6 Dilution bottles (milk dilution), pyrex,
99 ml volume, screw-cap with neoprene liners.
5.2.7 Bunsen or Fisher-type burner or elec-
tric Incinerator unit.
5.2.8 Pyrex test tubes, 150 x 20 mm,
containing inverted fermentation vials, 75 x
10 mm, with caps.
5.2.9 Culture tube racks to hold fifty, 25
mm diameter tubes.
5.3 Media
5.3.1 Lauryl tryptose broth (same as total
coliform Presumptive Test medium) prepared
in 10 ml volumes in appropriate concentration
for sample volumes used. (Part II-B, 5.3.1).
5.3.2 EC medium prepared in 10 ml vol-
umes in fermentation tubes (Part II-B, 5.3.4).
5.4 Dilution Water: Sterile buffered or
peptone dilution water dispensed in 99 ± 2 ml
volumes in screw-capped bottles.
5.5 Procedure: Part II-C describes in detail
the general MPN procedure. See Figure lll-C-2.
5.5.1 Prepare the total coliform Presump-
tive Test medium, (lauryl tryptose broth) and
EC medium. Clearly mark each bank of tubes,
identifying the sample and the volume
inoculated.
5.5.2 Inoculate the Presumptive Test me-
dium with appropriate quantities of sample
following the Presumptive Test total coliform
procedure, (Part lll-B).
5.5.3 Gently shake the Presumptive tube.
Using a sterile inoculating loop or a sterile
wooden applicator, transfer inocula from posi-
tive Presumptive Test tubes at 24 and 48
hours to EC confirmatory tubes. Gently shake
the rack of inoculated EC tubes to insure mix-
ing of inoculum with medium.
5.5.4 Incubate inoculated EC tubes at
44.5 ± 0.2 C for 24 ± 2 hours. Tubes must be
placed in the incubator within 30 minutes after
inoculation. The water depth in the water bath
incubator must come to the top.level of the
culture medium in the tubes.
5.5.5 The presence of gas in any quantity
in the EC confirmatory fermentation tubes af-
132
<&EF9\ MICROBIOLOGICAL MANUAL 1978
image:
42,000 organisms per 100 ml. Supplemental
studies on selected colonies showed 92%
verification.
Verified fecal
coliform count
92
100
X 42,000 = 38,640
Rounding off = 39,000 fecal coliforms
per 100 ml
The worker is cautioned not to apply per-
centage of verification determined on one
sample to other samples.
5. Most Probable Number (MPN) Method
5.1 Summary: Culture from positive tubes
of the lauryl tryptose broth (same as presump-
tive MPN Method, Part lll-B) is inoculated into
EC Broth and incubated at 44.5 C for 24 hours
(see Figure lll-C-2). Formation of gas in any
quantity in the inverted vial is a positive reac-
tion confirming fecal coliforms. Fecal coliform
densities are calculated from the MPN table on
the basis of the positive EG tubes (8).
5.2 Apparatus and Materials
5.2.1 Incubatorthat maintains 35 ± 0.5 C.
5.2.2 Water bath or equivalent incubator
that maintains a 44.5 ^ 0.2 C temperature.
5.2.3 Pipet containers of stainless steel,
aluminum or pyrex glass for glass pipets.
5.2.4 Inoculation loop, 3 mm diameter
and needle of nichrome or platinum wire, 26 B
& S gauge, in suitable holder. Sterile applica-
tor sticks are a suitable alternative.
5.2.5 Sterile pipets T.D., Mohr or bacterio-
logical, glass or plastic, of appropriate size.
5.2.6 Dilution bottles (milk dilution), pyrex,
99 ml volume, screw-cap with neoprene liners.
5.2.7 Bunsen or Fisher-type burner or elec-
tric Incinerator unit.
5.2.8 Pyrex test tubes, 150 x 20 mm,
containing inverted fermentation vials, 75 x
10 mm, with caps.
5.2.9 Culture tube racks to hold fifty, 25
mm diameter tubes.
5.3 Media
5.3.1 Lauryl tryptose broth (same as total
coliform Presumptive Test medium) prepared
in 10 ml volumes in appropriate concentration
for sample volumes used. (Part II-B, 5.3.1).
5.3.2 EC medium prepared in 10 ml vol-
umes in fermentation tubes (Part II-B, 5.3.4).
5.4 Dilution Water: Sterile buffered or
peptone dilution water dispensed in 99 ± 2 ml
volumes in screw-capped bottles.
5.5 Procedure: Part II-C describes in detail
the general MPN procedure. See Figure lll-C-2.
5.5.1 Prepare the total coliform Presump-
tive Test medium, (lauryl tryptose broth) and
EC medium. Clearly mark each bank of tubes,
identifying the sample and the volume
inoculated.
5.5.2 Inoculate the Presumptive Test me-
dium with appropriate quantities of sample
following the Presumptive Test total coliform
procedure, (Part lll-B).
5.5.3 Gently shake the Presumptive tube.
Using a sterile inoculating loop or a sterile
wooden applicator, transfer inocula from posi-
tive Presumptive Test tubes at 24 and 48
hours to EC confirmatory tubes. Gently shake
the rack of inoculated EC tubes to insure mix-
ing of inoculum with medium.
5.5.4 Incubate inoculated EC tubes at
44.5 ± 0.2 C for 24 ± 2 hours. Tubes must be
placed in the incubator within 30 minutes after
inoculation. The water depth in the water bath
incubator must come to the top.level of the
culture medium in the tubes.
5.5.5 The presence of gas in any quantity
in the EC confirmatory fermentation tubes af-
132
<&EF9\ MICROBIOLOGICAL MANUAL 1978
image:
 Sample
Lauryl Tryptose Broth
35 ±0.5 C
CO
LU
D
(O
LU
BC
Q-
Gas +
24 hr
Gas-
24 hr
Reincubate
24 hr
I
Gas
Gas-
Negative
Test
Elevated Temperature Test
EC Medium at 44.5 ± 0.2 C
cc
u_
Z
o
o
Gas +
24 hr
Fecal Coliforms Present
Calculate
Fecal Coliform
MPN
Gas-
24 hr
Negative
Test
FIGURE III-C-2. Flow Chart forthe Fecal Coliform MPN Tests.
FECAL COLIFORMS
133
image:
Sample
Lauryl Tryptose Broth
35 ±0.5 C
CO
LU
D
(O
LU
BC
Q-
Gas +
24 hr
Gas-
24 hr
Reincubate
24 hr
I
Gas
Gas-
Negative
Test
Elevated Temperature Test
EC Medium at 44.5 ± 0.2 C
cc
u_
Z
o
o
Gas +
24 hr
Fecal Coliforms Present
Calculate
Fecal Coliform
MPN
Gas-
24 hr
Negative
Test
FIGURE III-C-2. Flow Chart forthe Fecal Coliform MPN Tests.
FECAL COLIFORMS
133
image:
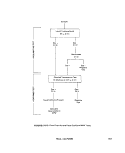 ter 24 ± 2 hours constitutes a positive test for
fecal conforms.
5.6 Calculations
5.6.1 Calculate fecal coliform densities on
the basis of the number of positive EC fermen-
tation tubes, using the table of most probable
numbers (MPN).
5.6.2 The MPN results are computed from
three dilutions that include the highest dilution
with all positive tubes and the next two higher
dilutions. For example, if five 10 ml, five 1.0 ml,
and five 0.1 ml sample portions are inoculated
initially into Presumptive Test medium, and
positive EC confirmatory results are obtained
from five of the 10 ml portions, three of the 1.0
ml portions, and none of the 0.1 ml portions,
the coded result of the test is 5-3-0. The code
is located in the MPN Table ll-C-4, and the MPN
per 100 ml is recorded. See Part II-C, 4.9 for
rules on selection of significant dilutions.
5.7 Reporting Results: Report the fecal
coliform MPN values per 100 ml of sample.
5.8 Precision and Accuracy: The preci-
sions of the MPN counts are given as confi-
dence limits in the MPN tables. Note that the
precision of the MPN value increases with
increased numbers of replicates per sample
tested.
REFERENCES
1. Geldreich, E. E, H. F. Clark, C. B. Huff, and L. C. Best, 1965. Fecal-coliform-organism medium for
the membrane filter technique. J. Amer. Water Works Assoc. 57:208.
2. Bordner, R. H., C. F. Frith and J. A. Winter, (Editors), 1977. Proceedings of the Symposium on the
Recovery of Indicator Organisms Employing Membrane Filters. U.S. Environmental Protection
Agency, Environmental Monitoring and Support Laboratory, Cincinnati, OH. (EPA-
600/9-77-024).
3, Lin, S. D., 1973. Evaluation of coliform tests for chlorinated secondary effluents. «J. Water
Pollution Control Federation 45:498.
4. Lin, S, D., 1976, Evaluation of Millipore HA and HC membrane filters for the enumeration of
indicator bacteria. Appl. Environ. Microblol. 32:300.
5. Lin, S. D.,1976. Membrane filter method for recovery of fecal conforms in chlorinated sewage
effluents. Appl. Environ. Microbiol. 32:547.
6. Green, B, L., E. M. Clausen, and W. Litsky, 1975. Two-temperature membrane filter method
for enumeration of fecal coliform bacteria from chlorinated effluents, Appl. Environ.
Microblol. 33: 1259. ~
7. Taylor, R. H., R. H. Bordner, and P. V. Scarpino, 1973. Delayed-incubation membrane-filter test for
for fecal conforms. Appl. Microbiol. 25:363.
8. Geldreich, E. E., 1966. Sanitary Significance of Fecal Coliforms in the Environment, U.S. Dept, of
the Interior, FWPCA, WP-20-3, 122 pp.
134
MICROBIOLOGICAL MANUAL 1978
image:
ter 24 ± 2 hours constitutes a positive test for
fecal conforms.
5.6 Calculations
5.6.1 Calculate fecal coliform densities on
the basis of the number of positive EC fermen-
tation tubes, using the table of most probable
numbers (MPN).
5.6.2 The MPN results are computed from
three dilutions that include the highest dilution
with all positive tubes and the next two higher
dilutions. For example, if five 10 ml, five 1.0 ml,
and five 0.1 ml sample portions are inoculated
initially into Presumptive Test medium, and
positive EC confirmatory results are obtained
from five of the 10 ml portions, three of the 1.0
ml portions, and none of the 0.1 ml portions,
the coded result of the test is 5-3-0. The code
is located in the MPN Table ll-C-4, and the MPN
per 100 ml is recorded. See Part II-C, 4.9 for
rules on selection of significant dilutions.
5.7 Reporting Results: Report the fecal
coliform MPN values per 100 ml of sample.
5.8 Precision and Accuracy: The preci-
sions of the MPN counts are given as confi-
dence limits in the MPN tables. Note that the
precision of the MPN value increases with
increased numbers of replicates per sample
tested.
REFERENCES
1. Geldreich, E. E, H. F. Clark, C. B. Huff, and L. C. Best, 1965. Fecal-coliform-organism medium for
the membrane filter technique. J. Amer. Water Works Assoc. 57:208.
2. Bordner, R. H., C. F. Frith and J. A. Winter, (Editors), 1977. Proceedings of the Symposium on the
Recovery of Indicator Organisms Employing Membrane Filters. U.S. Environmental Protection
Agency, Environmental Monitoring and Support Laboratory, Cincinnati, OH. (EPA-
600/9-77-024).
3, Lin, S. D., 1973. Evaluation of coliform tests for chlorinated secondary effluents. «J. Water
Pollution Control Federation 45:498.
4. Lin, S, D., 1976, Evaluation of Millipore HA and HC membrane filters for the enumeration of
indicator bacteria. Appl. Environ. Microblol. 32:300.
5. Lin, S. D.,1976. Membrane filter method for recovery of fecal conforms in chlorinated sewage
effluents. Appl. Environ. Microbiol. 32:547.
6. Green, B, L., E. M. Clausen, and W. Litsky, 1975. Two-temperature membrane filter method
for enumeration of fecal coliform bacteria from chlorinated effluents, Appl. Environ.
Microblol. 33: 1259. ~
7. Taylor, R. H., R. H. Bordner, and P. V. Scarpino, 1973. Delayed-incubation membrane-filter test for
for fecal conforms. Appl. Microbiol. 25:363.
8. Geldreich, E. E., 1966. Sanitary Significance of Fecal Coliforms in the Environment, U.S. Dept, of
the Interior, FWPCA, WP-20-3, 122 pp.
134
MICROBIOLOGICAL MANUAL 1978
image:
 PART III. ANALYTICAL METHODOLOGY
Section D Fecal Streptococci
The membrane filter (MF), most probable
number (MPN), and direct pour plate proce-
dures can be used to enumerate and identify
fecal streptococci in water and wastewater.
Fora general description of these fundamental
techniques refer to Part II-C. The method se-
lected depends upon the characteristics of the
sample. The Section is divided as follows:
1. The Fecal Streptococcus Group
2. Membrane Filter Method
3. Verification
4. Most Probable Number Method
5. Pour Plate Method
6. Determination of FC/FS, Ratios
7. Identification to Species
1. The Fecal Streptococcus Group
1.1 Fecal Streptococci and Lancefield's
Group D Streptococcus: The terms "Fecal
Streptococcus" and "Lancefield's Group D
Streptococcus" have been use synonymously.
When used as indicators of fecal contamina-
tion the following species and varieties are
implied: S. faecalis, S. faeca/is subsp. liquefa-
ciens, S. faecalis subsp. zymogenes, S. fae-
cium, S. bovis and S. equinus. For sanitary
analyses, media and methodology for quantifi-
cation are selective for these organisms.
1.2 Fecal Streptococcal Intermediates
and Biotypes: Current information indicates
that other streptococci belonging to Lance-
field's serological Group Q occur in the feces
of humans and other warm-blooded animals,
especially chickens. S. avium is characteristi-
cally found in the feces of chickens and occa-
sionally in the feces of man, dogs and pigs. The
Group Q antigen is found in the cell wall of
these organisms, and in addition, the Group D
antigen is located between the cell wall and
the cytoplasmic membrane where it occurs
naturally in the established Group D species.
These common antigens indicate a relation-
ship between Group D and Group Q orga-
nisms. The Group Q Streptococcci may ac-
count for the occurrence of the "intermediate
strains or biotypes" of Group D Streptococci
(1). Group Q organisms grow on media com--
monly used for the isolation and enumeration
of enterococci. Kenner ert aL (2) observed that
enterococcus biotypes occur more commonly
in the feces of fowl than of pigs, sheep, cows
and humans. Forty percent of the streptococci
isolated from the feces of fowl by Kenner et aL
were enterococcus biotypes with the rest be-
ing the enterococcus group. It is probable that
some of the biotypes they described were
Group Q Streptococci. The Group Q Strepto-
cocci, with a type species, should be consid-
ered in the Fecal Streptococcus Group.
1.3 Definition of the Fecal Streptococ-
cus Group: The term, fecal streptococci, will
be used to describe the streptococci which
indicate the sanitary quality of water and
FECAL STREPTOCOCCI
135
image:
PART III. ANALYTICAL METHODOLOGY
Section D Fecal Streptococci
The membrane filter (MF), most probable
number (MPN), and direct pour plate proce-
dures can be used to enumerate and identify
fecal streptococci in water and wastewater.
Fora general description of these fundamental
techniques refer to Part II-C. The method se-
lected depends upon the characteristics of the
sample. The Section is divided as follows:
1. The Fecal Streptococcus Group
2. Membrane Filter Method
3. Verification
4. Most Probable Number Method
5. Pour Plate Method
6. Determination of FC/FS, Ratios
7. Identification to Species
1. The Fecal Streptococcus Group
1.1 Fecal Streptococci and Lancefield's
Group D Streptococcus: The terms "Fecal
Streptococcus" and "Lancefield's Group D
Streptococcus" have been use synonymously.
When used as indicators of fecal contamina-
tion the following species and varieties are
implied: S. faecalis, S. faeca/is subsp. liquefa-
ciens, S. faecalis subsp. zymogenes, S. fae-
cium, S. bovis and S. equinus. For sanitary
analyses, media and methodology for quantifi-
cation are selective for these organisms.
1.2 Fecal Streptococcal Intermediates
and Biotypes: Current information indicates
that other streptococci belonging to Lance-
field's serological Group Q occur in the feces
of humans and other warm-blooded animals,
especially chickens. S. avium is characteristi-
cally found in the feces of chickens and occa-
sionally in the feces of man, dogs and pigs. The
Group Q antigen is found in the cell wall of
these organisms, and in addition, the Group D
antigen is located between the cell wall and
the cytoplasmic membrane where it occurs
naturally in the established Group D species.
These common antigens indicate a relation-
ship between Group D and Group Q orga-
nisms. The Group Q Streptococcci may ac-
count for the occurrence of the "intermediate
strains or biotypes" of Group D Streptococci
(1). Group Q organisms grow on media com--
monly used for the isolation and enumeration
of enterococci. Kenner ert aL (2) observed that
enterococcus biotypes occur more commonly
in the feces of fowl than of pigs, sheep, cows
and humans. Forty percent of the streptococci
isolated from the feces of fowl by Kenner et aL
were enterococcus biotypes with the rest be-
ing the enterococcus group. It is probable that
some of the biotypes they described were
Group Q Streptococci. The Group Q Strepto-
cocci, with a type species, should be consid-
ered in the Fecal Streptococcus Group.
1.3 Definition of the Fecal Streptococ-
cus Group: The term, fecal streptococci, will
be used to describe the streptococci which
indicate the sanitary quality of water and
FECAL STREPTOCOCCI
135
image:
 wastewater. The fecal streptococci group in-
cludes the serological groups D and Q.
Fecal Streptococci
W
U
" a
O 3
§ 8
-
01
S. faecalis
5. faeca//ssubsp. liquefaciens
S. faeca/issubsp, zymogenes
S1. faecium
S. bovis
S, equinus
S. avium
a.
go
a
a
1.4 Viridans Streptococci: The viridans
streptococci, primarily S. salivarius and S. mi-
tis are not considered as part of the fecal
streptococci as defined in 1.2 and 1.3. These
inhabitants of the nasopharyngeal tract have
been reported by a few workers in feces and
do grow on some fecal streptococci media.
However, their low numbers when present the
low frequency of occurrence and the limited
data available at this time concerning their
presence, have resulted in their exclusion from
the classification of fecal streptococci.
1.5 Scope and* Application: Fecal strepto-
cocci data verify fecal pollution and may pro-
vide additional information concerning the re-
cency and probable origin of pollution. In com-
bination with data on coliform bacteria, fecal
streptococci are used in sanitary evaluation as
a supplement to fecal conforms when a more
precise determination of sources of contami-
nation is necessary. The occurrence of fecal
streptococci in water indicates fecal contami-
nation by warm-blooded animals. They are not
known to multiply in the environment. Further
identification of streptococcal types present in
the sample may be obtained by biochemical
characterization. (See Figure III-D-2 "Isolation
and Identification of Fecal Streptococci").
Such information is useful for source investi-
gations. For example, S. bovis and S. equinus
are host specific and are associated with the
fecal excrement of non-human warm-blooded
animals. High numbers of these organisms are
associated with pollution from meat process-
ing plants, dairy wastes, and run-off from feed-
lots and farmlands. Because of limited survival
time outside the animal intestinal tract their
presence indicates very recent contamination
from farm animals.
2. Membrane Filter (MF) Method
2,1 Summary: A suitable volume of sam-
ple is passed through the 0.45 ym membrane
filter which retains the bacteria. The filter is
placed on KF Streptococcus agar and incu-
bated at 35 C for 48 hours. Red and pink
colonies are counted as streptococci (1,2).
2.2 Scope and Application: The mem-
brane filter technique is recommended as the
standard method for assaying fecal strepto-
cocci in fresh and marine waters and in non-
chlorinated sewage. Wastewaters from food
processing plants, slaughter houses, canner-
ies, sugar processing plants, dairy plants, feed-
lot and farmland run-off may be analyzed by
this procedure. Colonies on a membrane filter
can be transferred to biochemical media for
identification and speciation to provide infor-
mation on the source of contamination. The
general advantages and limitations of the MF
method are given in Part II-C.
2.3 Apparatus and Materials
2.3.1 Water bath, aluminum heat sink or
air incubator set at 35 ±0.5 C. Temperature
checked with an NBS thermometer or one of
equivalent accuracy.
2.3.2 Stereoscopic (dissection) micro-
scope, with magnification of 10 to 15x, pref-
erably wide field type. A microscope lamp with
diffuse light from cool, white fluorescent tubes
is recommended.
2.3.3 Hand tally.
2.3.4 Pipet containers of stainless steel,
aluminum or pyrex glass for glass pipets.
136
S»iPA MICROBIOLOGICAL MANUAL 1978
image:
wastewater. The fecal streptococci group in-
cludes the serological groups D and Q.
Fecal Streptococci
W
U
" a
O 3
§ 8
-
01
S. faecalis
5. faeca//ssubsp. liquefaciens
S. faeca/issubsp, zymogenes
S1. faecium
S. bovis
S, equinus
S. avium
a.
go
a
a
1.4 Viridans Streptococci: The viridans
streptococci, primarily S. salivarius and S. mi-
tis are not considered as part of the fecal
streptococci as defined in 1.2 and 1.3. These
inhabitants of the nasopharyngeal tract have
been reported by a few workers in feces and
do grow on some fecal streptococci media.
However, their low numbers when present the
low frequency of occurrence and the limited
data available at this time concerning their
presence, have resulted in their exclusion from
the classification of fecal streptococci.
1.5 Scope and* Application: Fecal strepto-
cocci data verify fecal pollution and may pro-
vide additional information concerning the re-
cency and probable origin of pollution. In com-
bination with data on coliform bacteria, fecal
streptococci are used in sanitary evaluation as
a supplement to fecal conforms when a more
precise determination of sources of contami-
nation is necessary. The occurrence of fecal
streptococci in water indicates fecal contami-
nation by warm-blooded animals. They are not
known to multiply in the environment. Further
identification of streptococcal types present in
the sample may be obtained by biochemical
characterization. (See Figure III-D-2 "Isolation
and Identification of Fecal Streptococci").
Such information is useful for source investi-
gations. For example, S. bovis and S. equinus
are host specific and are associated with the
fecal excrement of non-human warm-blooded
animals. High numbers of these organisms are
associated with pollution from meat process-
ing plants, dairy wastes, and run-off from feed-
lots and farmlands. Because of limited survival
time outside the animal intestinal tract their
presence indicates very recent contamination
from farm animals.
2. Membrane Filter (MF) Method
2,1 Summary: A suitable volume of sam-
ple is passed through the 0.45 ym membrane
filter which retains the bacteria. The filter is
placed on KF Streptococcus agar and incu-
bated at 35 C for 48 hours. Red and pink
colonies are counted as streptococci (1,2).
2.2 Scope and Application: The mem-
brane filter technique is recommended as the
standard method for assaying fecal strepto-
cocci in fresh and marine waters and in non-
chlorinated sewage. Wastewaters from food
processing plants, slaughter houses, canner-
ies, sugar processing plants, dairy plants, feed-
lot and farmland run-off may be analyzed by
this procedure. Colonies on a membrane filter
can be transferred to biochemical media for
identification and speciation to provide infor-
mation on the source of contamination. The
general advantages and limitations of the MF
method are given in Part II-C.
2.3 Apparatus and Materials
2.3.1 Water bath, aluminum heat sink or
air incubator set at 35 ±0.5 C. Temperature
checked with an NBS thermometer or one of
equivalent accuracy.
2.3.2 Stereoscopic (dissection) micro-
scope, with magnification of 10 to 15x, pref-
erably wide field type. A microscope lamp with
diffuse light from cool, white fluorescent tubes
is recommended.
2.3.3 Hand tally.
2.3.4 Pipet containers of stainless steel,
aluminum or pyrex glass for glass pipets.
136
S»iPA MICROBIOLOGICAL MANUAL 1978
image:
 2.3.5 Sterile graduated cylinders, covered
with aluminum foil or kraft paper.
2.3.6 Sterile, unassembled membrane fil-
tration units (filter base and funnel), glass, plas-
tic or stainless steel, wrapped with aluminum
foil or kraft pa per.
2,3.7 Vacuum source.
2.3.8 Filter suction flask to hold filter base,
with appropriate tubing. Filter manifolds that
hold a number of filter bases can also be used.
2.3.9 Safety vacuum flask.
2.3.10 Forceps, with smooth tips.
2,3.11 Ethanol, 95%, or methanol, in
small vial for sterilizing forceps.
,2.3.12 Bunsen/Fisher burner or electric
incinerator.
2.3.13 Sterile T.D. bacteriological or Mohr
pipets, glass or plastic, of appropriate size.
2,3.14 Sterile petri dishes, 50 x 12 mm
plastic or 60 x 15 mm glass or plastic.
2,3.15 Dilution bottles (milk dilution), py-
rex glass, marked at 99 ml volumes, screw-cap
with neoprene rubber liner.
2.3.16 Membrane filters, manufactured
from cellulose ester materials, white, grid
marked, 47 mm in diameter, 0.45 H^ 0.02 um
pore size or other pore size as recommended
by the manufacturer for fecal streptococci
analyses.
2.3.17 Ultraviolet sterilizer for MF filtra-
tion units (optional).
2.4 Media: KF Streptococcus agar pre-
pared as described in Part II-B, 5.4.1.
2.5 Dilution Water
2.5.1 Sterile buffered dilution water or
peptone water dispensed in 99 ± 2 ml vol-
umes in screw-capped dilution bottles.
2.5.2 Sterile buffered water or peptone
water prepared as described in Part II-B, 7, in
large volumes for wetting membranes before
the addition of the sample, and for rinsing the
funnel after filtration.
2.6 Immediate MF Procedure: The gen-
eral membrane filter procedure is described in
detail in Part II-C, 3.
2.6.1 Clearly mark each petri dish and
aseptically add 5-6 ml of the liquified agar
medium (to each dish to a depth of 2-3 mm).
2.6.2 Place a sterile membrane filter on
the filter base, grid-side up and attach the
funnel to the base of the filter unit; the mem-
brane filter is now held securely between the
funnel and base.
2.6.3 Shake the sample vigorously about
25 times and measure the sample into the
funnel with the vacuum off.
2.6.4 Filter appropriate volumes of water
sample through the sterile membrane to ob-
tain 20-100 colonies on the membrane
surface.
At least 3 sample increments should be
filtered in order of increasing volumes. Where
no background information is available, more
may be necessary. The methods of measure-
ment and dispensation of the sample into the
funnel are given in Part II-C, 3.4.6.
2.6.5 Filter the sample and rinse the sides
of the funnel at least twice with 20-30 ml of
sterile buffered dilution water. Turn off the
vacuum and remove the funnel from the filter
base.
2.6.6 Aseptically remove the membrane
from the filter base and place grid-side up on
the agar.
2.6.7 Incubate the petri dishes in the in-
verted position at 35 + 0.5 C for 48 hours.
2.6.8 After incubation, remove dishes and
examine for red to pink colonies and count.
FECAL STREPTOCOCCI
137
image:
2.3.5 Sterile graduated cylinders, covered
with aluminum foil or kraft paper.
2.3.6 Sterile, unassembled membrane fil-
tration units (filter base and funnel), glass, plas-
tic or stainless steel, wrapped with aluminum
foil or kraft pa per.
2,3.7 Vacuum source.
2.3.8 Filter suction flask to hold filter base,
with appropriate tubing. Filter manifolds that
hold a number of filter bases can also be used.
2.3.9 Safety vacuum flask.
2.3.10 Forceps, with smooth tips.
2,3.11 Ethanol, 95%, or methanol, in
small vial for sterilizing forceps.
,2.3.12 Bunsen/Fisher burner or electric
incinerator.
2.3.13 Sterile T.D. bacteriological or Mohr
pipets, glass or plastic, of appropriate size.
2,3.14 Sterile petri dishes, 50 x 12 mm
plastic or 60 x 15 mm glass or plastic.
2,3.15 Dilution bottles (milk dilution), py-
rex glass, marked at 99 ml volumes, screw-cap
with neoprene rubber liner.
2.3.16 Membrane filters, manufactured
from cellulose ester materials, white, grid
marked, 47 mm in diameter, 0.45 H^ 0.02 um
pore size or other pore size as recommended
by the manufacturer for fecal streptococci
analyses.
2.3.17 Ultraviolet sterilizer for MF filtra-
tion units (optional).
2.4 Media: KF Streptococcus agar pre-
pared as described in Part II-B, 5.4.1.
2.5 Dilution Water
2.5.1 Sterile buffered dilution water or
peptone water dispensed in 99 ± 2 ml vol-
umes in screw-capped dilution bottles.
2.5.2 Sterile buffered water or peptone
water prepared as described in Part II-B, 7, in
large volumes for wetting membranes before
the addition of the sample, and for rinsing the
funnel after filtration.
2.6 Immediate MF Procedure: The gen-
eral membrane filter procedure is described in
detail in Part II-C, 3.
2.6.1 Clearly mark each petri dish and
aseptically add 5-6 ml of the liquified agar
medium (to each dish to a depth of 2-3 mm).
2.6.2 Place a sterile membrane filter on
the filter base, grid-side up and attach the
funnel to the base of the filter unit; the mem-
brane filter is now held securely between the
funnel and base.
2.6.3 Shake the sample vigorously about
25 times and measure the sample into the
funnel with the vacuum off.
2.6.4 Filter appropriate volumes of water
sample through the sterile membrane to ob-
tain 20-100 colonies on the membrane
surface.
At least 3 sample increments should be
filtered in order of increasing volumes. Where
no background information is available, more
may be necessary. The methods of measure-
ment and dispensation of the sample into the
funnel are given in Part II-C, 3.4.6.
2.6.5 Filter the sample and rinse the sides
of the funnel at least twice with 20-30 ml of
sterile buffered dilution water. Turn off the
vacuum and remove the funnel from the filter
base.
2.6.6 Aseptically remove the membrane
from the filter base and place grid-side up on
the agar.
2.6.7 Incubate the petri dishes in the in-
verted position at 35 + 0.5 C for 48 hours.
2.6.8 After incubation, remove dishes and
examine for red to pink colonies and count.
FECAL STREPTOCOCCI
137
image:
 2.7 Counting and Recording Colonies:
Select those plates with 20-100 pink to dark
red colonies. These may range in size from
barely visible to about 2 mm in diameter. Colo-
nies of other colors are not counted. Count the
colonies as described in Part II-C, 3.5, using
low-power (10-15X) microscope equipped
with overhead illumination.
Fecal streptococcal density is reported as or-
ganisms per 100 ml. Use the general formula
to calculate fecal streptococci densities:
Fecal Streptococci/ 1 00 ml =
No, of Fecal Streptococcus Colonies Counted
Volume of Sample Filtered, ml
X 100
For example, if 40 colonies are counted
after the filtration of 50 ml of sample the
calculation is:
Fecal Streptococci/ 100 ml
50
100 = 80.
See Part ll-C, 3.6 for calculation for results.
Reporting Results: Report fecal strepto-
coccal densities per 100 ml of sample. See
discussion on significant figures in Part It-C
2.8.
2,8 Precision and Accuracy
2.8.1 Extensive precision and accuracy
data are not available, however, KF Strepto-
coccus agar has been reported to be highly
efficient in the recovery of fecal streptococci
(2, 3, 4). In the analyses of feces, sewage and
foods, KF yielded a high recovery of fecal
streptococci with a low percent (18.6) of non-
fecal streptococci.
2.8.2 Laboratory personnel should be able
to duplicate their colony counts on the same
plates within 5%, and the counts of others
within 10%.
2.9 Delayed MF Procedure: Because of
the stability of the KF agar and its extreme
selectivity for fecal streptococci, it is possible
to filter water samples at a field site, place
membranes on the KF agar medium in tight-
lidded petri dishes and hold these plates for up
to 3 days. After the holding period, plates are
incubated for 48 hours at 35 C and counted in
the normal manner. This 72 hour holding time
can be used to air mail the membranes on KF
agar to a central laboratory for incubation and
counting. (National Pollution Surveillance Sys-
tem FWPCA, data collected from geographical
locations around the Nation; and Kenner et aL,
Kansas City data.)
3. Verification
Periodically, typical colonies growing on
the membrane filter should be verified. When
a survey is initiated or a new body of water is
being sampled, it is recommended that at
least 10 typical colonies from the membrane
or agar plate used in computing the final
density be picked and transferred into BHI
broth or onto BHI agar slants. After 24-48
hours incubation, subject the cultures to a
catalase test. Catalase activity indicates the
nonstreptococci. Atypical colonies should also
be verified to determine false negative reac-
tions on the membrane filter. Final confirma-
tion of fecal streptococci is achieved by
determining growth of catalase negative
isolates in BHI broth at 45 C and in 40% bile
within two days (see Figure lll-D-1).
3,1 Apparatus and Materials
3.1.1 Incubators set at 35 ± 0.5 C and 45
± 0.5 C.
3.1.2 Inoculating needle and loop.
3.1.3 Bunsen/Fisher burner or electric
incinerator.
3.1.4 Solution of 3% hydrogen peroxide.
3.1.5 Glass microscope slides, 2.5 x 7.6
cm(1 x 3 inches).
138
&EPA. MICROBIOLOGICAL MANUAL 1978
image:
2.7 Counting and Recording Colonies:
Select those plates with 20-100 pink to dark
red colonies. These may range in size from
barely visible to about 2 mm in diameter. Colo-
nies of other colors are not counted. Count the
colonies as described in Part II-C, 3.5, using
low-power (10-15X) microscope equipped
with overhead illumination.
Fecal streptococcal density is reported as or-
ganisms per 100 ml. Use the general formula
to calculate fecal streptococci densities:
Fecal Streptococci/ 1 00 ml =
No, of Fecal Streptococcus Colonies Counted
Volume of Sample Filtered, ml
X 100
For example, if 40 colonies are counted
after the filtration of 50 ml of sample the
calculation is:
Fecal Streptococci/ 100 ml
50
100 = 80.
See Part ll-C, 3.6 for calculation for results.
Reporting Results: Report fecal strepto-
coccal densities per 100 ml of sample. See
discussion on significant figures in Part It-C
2.8.
2,8 Precision and Accuracy
2.8.1 Extensive precision and accuracy
data are not available, however, KF Strepto-
coccus agar has been reported to be highly
efficient in the recovery of fecal streptococci
(2, 3, 4). In the analyses of feces, sewage and
foods, KF yielded a high recovery of fecal
streptococci with a low percent (18.6) of non-
fecal streptococci.
2.8.2 Laboratory personnel should be able
to duplicate their colony counts on the same
plates within 5%, and the counts of others
within 10%.
2.9 Delayed MF Procedure: Because of
the stability of the KF agar and its extreme
selectivity for fecal streptococci, it is possible
to filter water samples at a field site, place
membranes on the KF agar medium in tight-
lidded petri dishes and hold these plates for up
to 3 days. After the holding period, plates are
incubated for 48 hours at 35 C and counted in
the normal manner. This 72 hour holding time
can be used to air mail the membranes on KF
agar to a central laboratory for incubation and
counting. (National Pollution Surveillance Sys-
tem FWPCA, data collected from geographical
locations around the Nation; and Kenner et aL,
Kansas City data.)
3. Verification
Periodically, typical colonies growing on
the membrane filter should be verified. When
a survey is initiated or a new body of water is
being sampled, it is recommended that at
least 10 typical colonies from the membrane
or agar plate used in computing the final
density be picked and transferred into BHI
broth or onto BHI agar slants. After 24-48
hours incubation, subject the cultures to a
catalase test. Catalase activity indicates the
nonstreptococci. Atypical colonies should also
be verified to determine false negative reac-
tions on the membrane filter. Final confirma-
tion of fecal streptococci is achieved by
determining growth of catalase negative
isolates in BHI broth at 45 C and in 40% bile
within two days (see Figure lll-D-1).
3,1 Apparatus and Materials
3.1.1 Incubators set at 35 ± 0.5 C and 45
± 0.5 C.
3.1.2 Inoculating needle and loop.
3.1.3 Bunsen/Fisher burner or electric
incinerator.
3.1.4 Solution of 3% hydrogen peroxide.
3.1.5 Glass microscope slides, 2.5 x 7.6
cm(1 x 3 inches).
138
&EPA. MICROBIOLOGICAL MANUAL 1978
image:
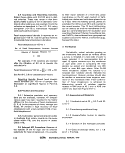 3.1.6 Media
(a) Brain heart infusion (BHI) agar. (See Part
!!-B, 5,4.6).
(b) Brain heart infusion (BHI) broth. (See
Part II-B, 5.4.5).
3.2 Procedure
3.2.1 Plates for verification should con-
tain 20-100 colonies. Pick at least 10 typical
colonies from the selected membrane or agar
plate and inoculate into a BHI agar slant and
into a BHI broth tube.
3.2.2 After 24-48 hours incubation at 35
+0.5 C, transfer a loopful of growth from the
BHI slant to a clean glass slide and add a few
drops of freshly tested 3% hydrogen peroxide
(H2O2) to the smear. If the catalase enzyme is
present, it cleaves the H202 to water and visible
oxygen gas. Bubbles constitute a positive cata-
lase test and indicate non-streptococcal spe-
cies. Confirmation need not be continued. Use
a platinum loop, not nichrome, to avoid false
positive reactions.
3.2.3 If a negative catalase reaction occurs,
transfer a loopful of growth from the BHI broth
to fresh BHI broth and BHI broth + 40% bile and
incubate at 45 C and at 35 C. Growth within two
days indicates fecal streptococcal species (see
Figure lll-D-1 and lll-D-2).
3.2.4 Further identification of streptococ-
cal types present in the sample may be ob-
tained by biochemical characterization. (See
Figure III-D-2 to ill-D-4 for identification of fecal
streptococci. Such information is useful for
investigating sources of pollution. See Part II-B
for preparation of media used in the schematic
outlines).
4. Most Probable Number Method
4.1 Summary: The multiple-tube proce-
dure estimates the number of fecal strepto-
cocci by inoculating decimal dilutions of the
sample into broth tube media. Positive tubes in
the Presumptive Test are indicated by growth
(turbidity) in azide dextrose broth after incuba-
tion at 35 C for 24-48 hours. To confirm the
presence of fecal streptococci, a portion of the
growth from each positive azide dextrose
broth tube is streaked onto PSE or equivalent
esculin-azide agar and incubated at 35 C for
24 hours (5). The presence of brownish-black
colonies with brown halos confirms fecal
streptococci. The MPN is computed on the
basis of the Confirmed Test results read from
and MPN table.
4.2 Scope and Application: This method
can be used for detection of fecal streptococci
in water, sewage or feces, but is more time-
consuming, less convenient and less direct
than the other procedures. The MPN must be
used for samples which cannot be examined
by the MF or direct plating techniques because
of turbidity, high numbers of background bac-
teria, metallic compounds, the presence of co-
agulants, the chlorination of sewage effluents
or sample volume limitations of the plating
technique.
4.3 Apparatus and Materials
4.3.1 Water bath or air incubator set at 35
± 0.5 C. Temperature checked with an NBS
thermometer or one of equivalent accuracy.
4.3.2 Pipet containers of stainless steel,
aluminum or pyrex glass for pipets.
4.3.3 Culture tube racks to hold fifty 25
mm diameter tubes.
4.3.4 Sterile T.D. bacteriological or Mohr
pipets, of appropriate sizes.
4.3.5 Dilution bottles (milk dilution), pyrex
glass, 99 ml volume, screw-capped, with neo-
prene rubber liner.
413.6 Test tubes, pyrex, culture 150 X 25
or 150 x 20 mm, with caps.
4.3.7 Inoculating loop, 3 mm diameter, in
holder or disposable applicator sticks or loops.
4.3.8 Bunsen/Fisher burners or electric
incinerator.
FECAL STREPTOCOCCI
139
image:
3.1.6 Media
(a) Brain heart infusion (BHI) agar. (See Part
!!-B, 5,4.6).
(b) Brain heart infusion (BHI) broth. (See
Part II-B, 5.4.5).
3.2 Procedure
3.2.1 Plates for verification should con-
tain 20-100 colonies. Pick at least 10 typical
colonies from the selected membrane or agar
plate and inoculate into a BHI agar slant and
into a BHI broth tube.
3.2.2 After 24-48 hours incubation at 35
+0.5 C, transfer a loopful of growth from the
BHI slant to a clean glass slide and add a few
drops of freshly tested 3% hydrogen peroxide
(H2O2) to the smear. If the catalase enzyme is
present, it cleaves the H202 to water and visible
oxygen gas. Bubbles constitute a positive cata-
lase test and indicate non-streptococcal spe-
cies. Confirmation need not be continued. Use
a platinum loop, not nichrome, to avoid false
positive reactions.
3.2.3 If a negative catalase reaction occurs,
transfer a loopful of growth from the BHI broth
to fresh BHI broth and BHI broth + 40% bile and
incubate at 45 C and at 35 C. Growth within two
days indicates fecal streptococcal species (see
Figure lll-D-1 and lll-D-2).
3.2.4 Further identification of streptococ-
cal types present in the sample may be ob-
tained by biochemical characterization. (See
Figure III-D-2 to ill-D-4 for identification of fecal
streptococci. Such information is useful for
investigating sources of pollution. See Part II-B
for preparation of media used in the schematic
outlines).
4. Most Probable Number Method
4.1 Summary: The multiple-tube proce-
dure estimates the number of fecal strepto-
cocci by inoculating decimal dilutions of the
sample into broth tube media. Positive tubes in
the Presumptive Test are indicated by growth
(turbidity) in azide dextrose broth after incuba-
tion at 35 C for 24-48 hours. To confirm the
presence of fecal streptococci, a portion of the
growth from each positive azide dextrose
broth tube is streaked onto PSE or equivalent
esculin-azide agar and incubated at 35 C for
24 hours (5). The presence of brownish-black
colonies with brown halos confirms fecal
streptococci. The MPN is computed on the
basis of the Confirmed Test results read from
and MPN table.
4.2 Scope and Application: This method
can be used for detection of fecal streptococci
in water, sewage or feces, but is more time-
consuming, less convenient and less direct
than the other procedures. The MPN must be
used for samples which cannot be examined
by the MF or direct plating techniques because
of turbidity, high numbers of background bac-
teria, metallic compounds, the presence of co-
agulants, the chlorination of sewage effluents
or sample volume limitations of the plating
technique.
4.3 Apparatus and Materials
4.3.1 Water bath or air incubator set at 35
± 0.5 C. Temperature checked with an NBS
thermometer or one of equivalent accuracy.
4.3.2 Pipet containers of stainless steel,
aluminum or pyrex glass for pipets.
4.3.3 Culture tube racks to hold fifty 25
mm diameter tubes.
4.3.4 Sterile T.D. bacteriological or Mohr
pipets, of appropriate sizes.
4.3.5 Dilution bottles (milk dilution), pyrex
glass, 99 ml volume, screw-capped, with neo-
prene rubber liner.
413.6 Test tubes, pyrex, culture 150 X 25
or 150 x 20 mm, with caps.
4.3.7 Inoculating loop, 3 mm diameter, in
holder or disposable applicator sticks or loops.
4.3.8 Bunsen/Fisher burners or electric
incinerator.
FECAL STREPTOCOCCI
139
image:
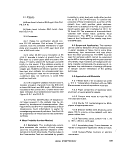 10 Colonies Typical in Appearance of
Fecal Streptococci on Isolation Media
Brain Heart Infusion Broth and Agar Slant
(24-48Hoursat35C)
Catalase Negative
Growth at 45 C
Growth in 40% Bile
Verification of Fecal Streptococci
FIGURE IH-D-1. Verification Procedure for Fecal Streptococci.
140
MICROBIOLOGICAL MANUAL 1978,
image:
10 Colonies Typical in Appearance of
Fecal Streptococci on Isolation Media
Brain Heart Infusion Broth and Agar Slant
(24-48Hoursat35C)
Catalase Negative
Growth at 45 C
Growth in 40% Bile
Verification of Fecal Streptococci
FIGURE IH-D-1. Verification Procedure for Fecal Streptococci.
140
MICROBIOLOGICAL MANUAL 1978,
image:
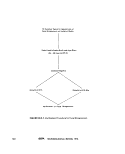 Sample
PSE Agar
(Brownish-black colony
with brown halo)
KF Agar
(pink-red colony)
Growth at 45 C and 10 C
Growth in 6.5% NaCi
and pH 9,6 BHI Broth
0.1% Methylene Blue in Milk
Reduction
Enterococcus
Group
No Reaction
Tentative
Group Q
Growth at 45 C only
Positive Starch Hydrolysis
Lactose
Fermentation
Acid only
No change
S. bovis S. eguinus
(Livestock and
Poultry Sources)
See Figures IH-D-3
and lll-D-4
FIGURE IH-D-2. Isolation and Identification of Fecal Streptococci, General Scheme
FECAL STREPTOCOCCI
141
image:
Sample
PSE Agar
(Brownish-black colony
with brown halo)
KF Agar
(pink-red colony)
Growth at 45 C and 10 C
Growth in 6.5% NaCi
and pH 9,6 BHI Broth
0.1% Methylene Blue in Milk
Reduction
Enterococcus
Group
No Reaction
Tentative
Group Q
Growth at 45 C only
Positive Starch Hydrolysis
Lactose
Fermentation
Acid only
No change
S. bovis S. eguinus
(Livestock and
Poultry Sources)
See Figures IH-D-3
and lll-D-4
FIGURE IH-D-2. Isolation and Identification of Fecal Streptococci, General Scheme
FECAL STREPTOCOCCI
141
image:
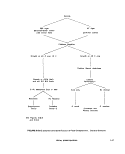 4.4 Media
4,4.1 Azide dextrose broth prepared in 10
ml volumes in test tubes without fermentation
via! (see Part Il-B, 5.4.2 for preparation). Ethyl
violet azide broth is not used because of false
positive reactions.
4.4.1 Azide dextrose broth prepared in 10
ml volumes in test tubes without fermentation
vial (see Part Il-B, 5.4.2 for preparation).
4.4.2 Pfizer Selective Enterococcus (PSE)
or equivalent esculin-azide agar in pour plates
(see Part Il-B, 5.4.4 for preparation).
4.5 Dilution Water: Sterile dilution water
dispensed in 99 ml ^ 2 ml amounts in screw-
capped bottles.
4.6 Procedure: The general MPN proce-
dure is described in detail in Part Il-C, 4.
4.6.1 Prepare the media for the .Presump-
tive Test, (azide dextrose broth) and the Con-
firmed Test, (PSE Agar plates), (see Part ll-B,
5.4,2 and 5.4.4 respectively).
4.6.2 Mark culture tubes to identify sam-
ples and sample volumes.
4.6.3 Shake the sample vigorously about
25 times.
4.6.4 Inoculate the azide dextrose broth
with appropriate sample volumes for the Pre-
sumptive Test. The number of fecal strepto-
cocci in a water polluted with municipal
wastes is generally lower than the number of
coliforms. Therefore, larger sample volumes
must be used to inoculate the MPN tubes for
fecal streptococci than for coliforms. For ex-
ample, if sample volumes of 1.0,0.1,0.01, and
0.001 ml are used for the coliform test, a
series of 10,1.0,0.1, and 0.01 ml volumes are
inoculated for the fecal streptococci test. Use
single-strength broth, 10 ml tubes for inocula
of 1.0 ml or less, and double-strength broth, 10
ml tubes for inocula of 10 ml. Sample volumes
from feedlots, meat packing plants, and storm-
water run-off with more fecal streptococci
than coliforms must be adjusted accordingly.
4.6,5 Shake the rack of inoculated culture
tubes to mix well and incubate them at 35 +
0.5 C for 48 hours + 3 hours. Examine tubes
for turbidity after 24 ± 2 hours and 48 ± 3
hours.
4.6.6 Read and record the results from
each tube. A positive Presumptive Test shows
growth consisting of turbidity in the medium or
a button of sediment at the bottom of the
culture tube, or both.
4.6.7 For the Confirmed Test, streak
growth from each positive azide dextrose
broth tube onto PSE Agar plates, making cer-
tain that the label on the plate corresponds to
the positive azide dextrose tube used,
4.6.8 Incubate the PSE Agar plates at 35
+ 0.5 C for 24 hours.
4.6.9 Read and record the results of each
plate corresponding to the positive azide dex-
trose tube. A positive Confirmed Test is evi-
denced by the presence of brownish-black col-
onies with brown halos. The number of posi-
tive confirmed azide tubes in each dilution is
used to compute the density from an MPN
table.
4.7 Calculations
4.7,1 Calculate fecal streptococci densi-
ties on the basis of the number of positive
Confirmed Tests from the PSE agar plates,
using the Table of Most Probable Numbers
(MPN) in Table ll-C-1,
4.7.2 The MPN results are computed from
3 usable Confirmed Test dilutions. For exam-
ple, if positive Confirmatory Test results are
obtained from 5 of the 10 ml portions, three of
the 1.0 ml portions, and none of the 0.1 ml
portions, the coded results of the test is 5-3-0.
The code is located in the MPN Table II-C-4,
and the MPN per 100 ml is recorded. See Part
Il-C, 4 for details.
4.8 Precision and Accuracy: The precision
of the MPN value increases with increased
numbers of replicates tested. Five tubes are
recommended for each dilution.
142
MICROBIOLOGICAL MANUAL 1978
image:
4.4 Media
4,4.1 Azide dextrose broth prepared in 10
ml volumes in test tubes without fermentation
via! (see Part Il-B, 5.4.2 for preparation). Ethyl
violet azide broth is not used because of false
positive reactions.
4.4.1 Azide dextrose broth prepared in 10
ml volumes in test tubes without fermentation
vial (see Part Il-B, 5.4.2 for preparation).
4.4.2 Pfizer Selective Enterococcus (PSE)
or equivalent esculin-azide agar in pour plates
(see Part Il-B, 5.4.4 for preparation).
4.5 Dilution Water: Sterile dilution water
dispensed in 99 ml ^ 2 ml amounts in screw-
capped bottles.
4.6 Procedure: The general MPN proce-
dure is described in detail in Part Il-C, 4.
4.6.1 Prepare the media for the .Presump-
tive Test, (azide dextrose broth) and the Con-
firmed Test, (PSE Agar plates), (see Part ll-B,
5.4,2 and 5.4.4 respectively).
4.6.2 Mark culture tubes to identify sam-
ples and sample volumes.
4.6.3 Shake the sample vigorously about
25 times.
4.6.4 Inoculate the azide dextrose broth
with appropriate sample volumes for the Pre-
sumptive Test. The number of fecal strepto-
cocci in a water polluted with municipal
wastes is generally lower than the number of
coliforms. Therefore, larger sample volumes
must be used to inoculate the MPN tubes for
fecal streptococci than for coliforms. For ex-
ample, if sample volumes of 1.0,0.1,0.01, and
0.001 ml are used for the coliform test, a
series of 10,1.0,0.1, and 0.01 ml volumes are
inoculated for the fecal streptococci test. Use
single-strength broth, 10 ml tubes for inocula
of 1.0 ml or less, and double-strength broth, 10
ml tubes for inocula of 10 ml. Sample volumes
from feedlots, meat packing plants, and storm-
water run-off with more fecal streptococci
than coliforms must be adjusted accordingly.
4.6,5 Shake the rack of inoculated culture
tubes to mix well and incubate them at 35 +
0.5 C for 48 hours + 3 hours. Examine tubes
for turbidity after 24 ± 2 hours and 48 ± 3
hours.
4.6.6 Read and record the results from
each tube. A positive Presumptive Test shows
growth consisting of turbidity in the medium or
a button of sediment at the bottom of the
culture tube, or both.
4.6.7 For the Confirmed Test, streak
growth from each positive azide dextrose
broth tube onto PSE Agar plates, making cer-
tain that the label on the plate corresponds to
the positive azide dextrose tube used,
4.6.8 Incubate the PSE Agar plates at 35
+ 0.5 C for 24 hours.
4.6.9 Read and record the results of each
plate corresponding to the positive azide dex-
trose tube. A positive Confirmed Test is evi-
denced by the presence of brownish-black col-
onies with brown halos. The number of posi-
tive confirmed azide tubes in each dilution is
used to compute the density from an MPN
table.
4.7 Calculations
4.7,1 Calculate fecal streptococci densi-
ties on the basis of the number of positive
Confirmed Tests from the PSE agar plates,
using the Table of Most Probable Numbers
(MPN) in Table ll-C-1,
4.7.2 The MPN results are computed from
3 usable Confirmed Test dilutions. For exam-
ple, if positive Confirmatory Test results are
obtained from 5 of the 10 ml portions, three of
the 1.0 ml portions, and none of the 0.1 ml
portions, the coded results of the test is 5-3-0.
The code is located in the MPN Table II-C-4,
and the MPN per 100 ml is recorded. See Part
Il-C, 4 for details.
4.8 Precision and Accuracy: The precision
of the MPN value increases with increased
numbers of replicates tested. Five tubes are
recommended for each dilution.
142
MICROBIOLOGICAL MANUAL 1978
image:
 S. Pour Plate Method
5.1 Summary: Aliquots of the water sam-
ple or diluted sample are delivered to the bot-
tom of a petri dish, and liquified Pfizer Selec-
tive Enterococcus (PSE) agar, equivalent
esculin-azide agar or KF agar is added and
thoroughly mixed with the water sample. Fecal
streptococci on PSE agar are 1 mm in diameter
and brownish-black with brown halos after
18-24 hours at 35 C. On KF agar fecal strepto-
cocci are red or pink after 48 hours at 35 C.
5.2 Scope and Application: The pour
plate method is recommended as an alternate
procedure to the MF technique when chlori-
nated sewage effluent and water samples with
high turbidity are encountered. PSE agar, the
medium of choice, has several advantages: (1)
it requires only 24 hours incubation compared
to 48 hours for other media, and (2) it exhibits
consistent recovery, regardless of sources.
With the pour plate technique, only small
volumes of sample may be analyzed. This is a
disadvantage when the fecal streptococcal
density is low and a large volume of sample
would be required for an accurate density de-
termination. Consequently, the MF technique
should be used unless the water is so turbid
that filtration is impossible.
5.3 Apparatus and Materials
5.3.1 Air incubator set at 35 ± 0.5 C.
Temperature is checked against a National
Bureau of Standards thermometer or one of
equivalent accuracy.
5.3.2 Water bath for tempering agars set
at 44-46 C.
5.3.3 Colony Counter, Quebec darkfield
model or equivalent.
5.3.4 Pipet containers of stainless steel,
aluminum or pyrex glass for glass pipets.
5.3.5 Petri dish containers for glass or
plastic petri dishes.
5.3.6 Sterile T.D. bacteriological or Mohr
pipets of appropriate sizes.
5.3.7 Sterile 100 mm
dishes, glass or plastic.
X 15 mm petri
5.3.8 Dilution bottles (milk dilution), pyrex,
99 ml volume, screw-capped, with neoprene
rubber liners.
5.3.9 Bunsen/Fisher burner or electric
incinerator.
5.3.10 Hand tally.
5.4 Media: Sterile Pfizer Selective Entero-
coccus agar (PSE), equivalent esculin-azide
agar, (Part II-B, 5.4.4) or KF Streptococcus agar
(Part II-B, 5.4.1) are prepared in pre-sterilized
erlenmeyer flasks or bottles with metal foil
covers, or screw-caps.
5.5 Dilution Water: Sterile dilution water
dispensed in 99 ± 2 ml amounts preferably in
screw-capped dilution bottles (see Part II-B, 7).
5.6 Procedure
5.6.1 Shake the sample bottle vigorously
about 25 times to disperse the bacteria. Take
care that the closure is tight to prevent leakage
of sample during shaking.
5.6.2, Dilute the sample to obtain final
plate counts between 30-300 colonies. The
number of colonies within this range gives the
most accurate estimation of the microbial pop-
ulation. Because the magnitude of the micro-
bial population in the original water sample is
not known beforehand, a range of dilutions
must be prepared and plated to obtain a plate
within this range of colony counts.
5.6.3 Transfer 0,1 and 1.0 ml from the
undiluted sample to each of 2 separate petri
dishes.
5.6.4 Prepare the initial 1:100 or 10~2
dilution by pipetting 1 ml of the sample into a
99 ml dilution water blank using a sterile 1.1
ml pipet (see Part II-C, 1.4 "Preparation of
Dilutions," and Figure ll-C-1).
FECAL STREPTOCOCCI
143
image:
S. Pour Plate Method
5.1 Summary: Aliquots of the water sam-
ple or diluted sample are delivered to the bot-
tom of a petri dish, and liquified Pfizer Selec-
tive Enterococcus (PSE) agar, equivalent
esculin-azide agar or KF agar is added and
thoroughly mixed with the water sample. Fecal
streptococci on PSE agar are 1 mm in diameter
and brownish-black with brown halos after
18-24 hours at 35 C. On KF agar fecal strepto-
cocci are red or pink after 48 hours at 35 C.
5.2 Scope and Application: The pour
plate method is recommended as an alternate
procedure to the MF technique when chlori-
nated sewage effluent and water samples with
high turbidity are encountered. PSE agar, the
medium of choice, has several advantages: (1)
it requires only 24 hours incubation compared
to 48 hours for other media, and (2) it exhibits
consistent recovery, regardless of sources.
With the pour plate technique, only small
volumes of sample may be analyzed. This is a
disadvantage when the fecal streptococcal
density is low and a large volume of sample
would be required for an accurate density de-
termination. Consequently, the MF technique
should be used unless the water is so turbid
that filtration is impossible.
5.3 Apparatus and Materials
5.3.1 Air incubator set at 35 ± 0.5 C.
Temperature is checked against a National
Bureau of Standards thermometer or one of
equivalent accuracy.
5.3.2 Water bath for tempering agars set
at 44-46 C.
5.3.3 Colony Counter, Quebec darkfield
model or equivalent.
5.3.4 Pipet containers of stainless steel,
aluminum or pyrex glass for glass pipets.
5.3.5 Petri dish containers for glass or
plastic petri dishes.
5.3.6 Sterile T.D. bacteriological or Mohr
pipets of appropriate sizes.
5.3.7 Sterile 100 mm
dishes, glass or plastic.
X 15 mm petri
5.3.8 Dilution bottles (milk dilution), pyrex,
99 ml volume, screw-capped, with neoprene
rubber liners.
5.3.9 Bunsen/Fisher burner or electric
incinerator.
5.3.10 Hand tally.
5.4 Media: Sterile Pfizer Selective Entero-
coccus agar (PSE), equivalent esculin-azide
agar, (Part II-B, 5.4.4) or KF Streptococcus agar
(Part II-B, 5.4.1) are prepared in pre-sterilized
erlenmeyer flasks or bottles with metal foil
covers, or screw-caps.
5.5 Dilution Water: Sterile dilution water
dispensed in 99 ± 2 ml amounts preferably in
screw-capped dilution bottles (see Part II-B, 7).
5.6 Procedure
5.6.1 Shake the sample bottle vigorously
about 25 times to disperse the bacteria. Take
care that the closure is tight to prevent leakage
of sample during shaking.
5.6.2, Dilute the sample to obtain final
plate counts between 30-300 colonies. The
number of colonies within this range gives the
most accurate estimation of the microbial pop-
ulation. Because the magnitude of the micro-
bial population in the original water sample is
not known beforehand, a range of dilutions
must be prepared and plated to obtain a plate
within this range of colony counts.
5.6.3 Transfer 0,1 and 1.0 ml from the
undiluted sample to each of 2 separate petri
dishes.
5.6.4 Prepare the initial 1:100 or 10~2
dilution by pipetting 1 ml of the sample into a
99 ml dilution water blank using a sterile 1.1
ml pipet (see Part II-C, 1.4 "Preparation of
Dilutions," and Figure ll-C-1).
FECAL STREPTOCOCCI
143
image:
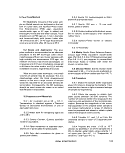 5.6.5 Vigorously shake the 1:100 dilution
bottle to obtain uniform distribution of
bacteria.
5.6.6 Pipet 0.1 and 1.0 ml of this 1:100
dilution into each of 2 separate petri dishes
using another sterile pipet.
5.6.7 Make additional dilutions as re-
quired for raw wastes or stormwater run-off
and prepare pour plates containing the dilu-
tion aliquots.
5.6.8 Prepare duplicate petri dishes for
each sample increment (Figure IH-A4). Mark
each petri dish with the number of the sample,
the dilution, the date, and any other necessary
information. Deliver the liquid into the dish,
and touch the tip once against a dry area in the
petri dish bottom while holding the pipet
vertically.
5.6.9 Pour 12-15 ml of liquified cooled
agar medium into each petri dish containing
the sample or its dilution. Mix the medium and
the sample thoroughly by gently rotating and
tilting the petri dish. Not more than 20 minutes
should elapse between dilution, plating, and
addition of the medium. Refer to Part II-C, 2.6,
for further information.
5.6.10 Allow agar to solidify as rapidly as
possible after pouring, and place the inverted
PSE plates at 35 ± 0.5 C for 18-24 hours and
KF plates at 48 ± 3 hours.
5.7 Counting and Recording Colonies
5.7.1 After the specified incubation period,
select those plates with 30-300 fecal strepto-
coccal colonies. Fecal streptococci on PSE agar
are brownish-black colonies, about 1 mm in
diameter with brown halos. On KF agar, fecal
streptococci are pink to red and of varying
sizes.
5.7.2 Count colonies in the plates with the
aid of a colony counter (10-15* magnification)
equipped with a grid.
5.7.3 Observe the following rules for re-
porting the fecal streptococcal plate counts.
(a) Plates with 30-300 Fecal Streptococ-
cal Colonies: Count all colonies for each plate
within the 30-300 range. Calculate the aver-
age count for these plates correcting for the
dilution as follows:
Sum of Colonies
Sum of Volumes tested, ml
x100 = FS/100ml
^b^ All Plates Greater than 300 Colonies:
When counts for all dilutions contain more
than 300 colonies, e.g., >500 for 1.0 ml,
>500 for 0,1 ml, and 340 for 0,01 ml; com-
pute the density by counting the plate having
nearest to 300 colonies. In this case use the
0:01 ml plate.
340
0.01
x 100 = 3,400,000
Report as: Estimated Fecal Streptococcal
Count, 3,400,000/100 ml
(c) Ml Plates with Fewer than 30 Colonies:
If all plates are less than 30 colonies, record
the actual number of colonies on the lowest
dilution plated and report the count as the
Estimated Fecal Streptococcal Plate Count
per 100 ml.
(d) Plate with No Colonies: If plates from all
dilutions show no colonies, assume a count of
one (1) colony; then divide 1 by the largest
volume filtered and report the value as a less
than {<) count. For example, if 0.1, 0.01 and
0.001 ml were filtered with no reported colo-
nies, the count would be:
1
— x 100 = < 1000
0.1
Report the count as: < 10/100 ml
(e) When all plates are crowded, it is possi-
ble to use the square divisions of the grid on
the Quebec or similar counter to estimate the
numbers of colonies on the plate. See Part III-
A, 5.6.3 for details.
^•^ Precision and Accuracy: Replicate
plate counts from the same sample deviate
144
•&EPA MICROBIOLOGICAL MANUAL 1978
image:
5.6.5 Vigorously shake the 1:100 dilution
bottle to obtain uniform distribution of
bacteria.
5.6.6 Pipet 0.1 and 1.0 ml of this 1:100
dilution into each of 2 separate petri dishes
using another sterile pipet.
5.6.7 Make additional dilutions as re-
quired for raw wastes or stormwater run-off
and prepare pour plates containing the dilu-
tion aliquots.
5.6.8 Prepare duplicate petri dishes for
each sample increment (Figure IH-A4). Mark
each petri dish with the number of the sample,
the dilution, the date, and any other necessary
information. Deliver the liquid into the dish,
and touch the tip once against a dry area in the
petri dish bottom while holding the pipet
vertically.
5.6.9 Pour 12-15 ml of liquified cooled
agar medium into each petri dish containing
the sample or its dilution. Mix the medium and
the sample thoroughly by gently rotating and
tilting the petri dish. Not more than 20 minutes
should elapse between dilution, plating, and
addition of the medium. Refer to Part II-C, 2.6,
for further information.
5.6.10 Allow agar to solidify as rapidly as
possible after pouring, and place the inverted
PSE plates at 35 ± 0.5 C for 18-24 hours and
KF plates at 48 ± 3 hours.
5.7 Counting and Recording Colonies
5.7.1 After the specified incubation period,
select those plates with 30-300 fecal strepto-
coccal colonies. Fecal streptococci on PSE agar
are brownish-black colonies, about 1 mm in
diameter with brown halos. On KF agar, fecal
streptococci are pink to red and of varying
sizes.
5.7.2 Count colonies in the plates with the
aid of a colony counter (10-15* magnification)
equipped with a grid.
5.7.3 Observe the following rules for re-
porting the fecal streptococcal plate counts.
(a) Plates with 30-300 Fecal Streptococ-
cal Colonies: Count all colonies for each plate
within the 30-300 range. Calculate the aver-
age count for these plates correcting for the
dilution as follows:
Sum of Colonies
Sum of Volumes tested, ml
x100 = FS/100ml
^b^ All Plates Greater than 300 Colonies:
When counts for all dilutions contain more
than 300 colonies, e.g., >500 for 1.0 ml,
>500 for 0,1 ml, and 340 for 0,01 ml; com-
pute the density by counting the plate having
nearest to 300 colonies. In this case use the
0:01 ml plate.
340
0.01
x 100 = 3,400,000
Report as: Estimated Fecal Streptococcal
Count, 3,400,000/100 ml
(c) Ml Plates with Fewer than 30 Colonies:
If all plates are less than 30 colonies, record
the actual number of colonies on the lowest
dilution plated and report the count as the
Estimated Fecal Streptococcal Plate Count
per 100 ml.
(d) Plate with No Colonies: If plates from all
dilutions show no colonies, assume a count of
one (1) colony; then divide 1 by the largest
volume filtered and report the value as a less
than {<) count. For example, if 0.1, 0.01 and
0.001 ml were filtered with no reported colo-
nies, the count would be:
1
— x 100 = < 1000
0.1
Report the count as: < 10/100 ml
(e) When all plates are crowded, it is possi-
ble to use the square divisions of the grid on
the Quebec or similar counter to estimate the
numbers of colonies on the plate. See Part III-
A, 5.6.3 for details.
^•^ Precision and Accuracy: Replicate
plate counts from the same sample deviate
144
•&EPA MICROBIOLOGICAL MANUAL 1978
image:
 because of errors introduced from a variety of
sources.
Prescott et al. (6) reported for the Standard
Plate Count (but applicable here) that the stan-
dard deviation of individual counts from
30-300 will vary from 0-20%. This plating
error was 10% for higher plate counts within
the 100-300 range. The authors pointed out
that a dilution error of about 3% for each
dilution stage is incurred in addition to the
plating error. Therefore, large variations can
be expected from high density samples such
as sewage from which several dilutions are
made.
Laboratory personnel should be able to
duplicate their plate count values for the same
plate within 5%, and the counts of others
within 10%.
6. Determination of Fecal Coliform/Fecal
Streptococcus Ratios (FC/FS)
The relationship of fecal coliform to fecal
streptococcus density may provide informa-
tion on the potential source(s) of contamina-
tion. Estimated per capita contributions of in-
dicator bacteria for animals were used to de-
velop FC/FS ratios (7, 8). These ratios are as
follows:
FC/FS Ratios
Man
Duck
Sheep
Chicken
Pig
Cow
Turkey
4.4
0.6
0.4
0.4
0.4
0.2
0.1
From the data, it was reasoned that ratios
greater than 4:1 were indicative of pollution
derived from domestic wastes composed of
man's body wastes. Ratios of less than 0.7
suggested that contamination originated from
livestock and poultry wastes, milk and food
processing wastes or from stormwater run-off
{non-human source). Further speciation of the
fecal streptococci provides more specific
source information. There are several precau-
tions to be observed when ratios are being
used.
(a) Bacterial densities can be altered dras-
tically wheh the pH of the sample is below 4.0
or above 9.0.
(b) Due to limited survival capability of
some of the fecal streptococci, it is essential to
sample close to the pollution source to obtain
reliable ratios. This is especially true for the
highly sensitive S. bovis and S. equinus
species.
(c) It is difficult to use ratios effectively
when mixed pollution sources are present.
(d) In marine waters, bays, estuaries, and
irrigation returns, FC/FS ratios have been of
limited value in accurately defining major pol-
lutional source's.
(e) If fecal streptococcal counts are
< 100/100 ml, ratios should not be applied.
7. Identification of Fecal Streptococci to
Species
7.1 Summary: Although the fecal st pto-
cocci are enumerated as described in the >re-
vious sections and are verified with simple
biochemical tests in Part III-D, 3 above, it is
important at times to identify the fecal strepto-
cocci to species to further verify animal and
human sources of pollution and to determine
the sanitary significance of isolates. This iden-
tification to speeies is performed using the
additional biochemical tests described to dif-
ferentiate and confirm the Group Q strepto-
cocci, the bovis-equinusGroup and the entero-
cocci. The enterococci can be separated as S.
faec/umand S. faeca/isvarteties or into groups
according to original source.
7.2 Scope and Application: The initial
biochemical test confirms that the isolates are
fecal streptococci by negative catalase reac-
tion. Group Q streptococci and enterococci are
separated from the bovis-equinus group by
positive growth at 10 and 45 C and are then
FECAL STREPTOCOCCI
145
image:
because of errors introduced from a variety of
sources.
Prescott et al. (6) reported for the Standard
Plate Count (but applicable here) that the stan-
dard deviation of individual counts from
30-300 will vary from 0-20%. This plating
error was 10% for higher plate counts within
the 100-300 range. The authors pointed out
that a dilution error of about 3% for each
dilution stage is incurred in addition to the
plating error. Therefore, large variations can
be expected from high density samples such
as sewage from which several dilutions are
made.
Laboratory personnel should be able to
duplicate their plate count values for the same
plate within 5%, and the counts of others
within 10%.
6. Determination of Fecal Coliform/Fecal
Streptococcus Ratios (FC/FS)
The relationship of fecal coliform to fecal
streptococcus density may provide informa-
tion on the potential source(s) of contamina-
tion. Estimated per capita contributions of in-
dicator bacteria for animals were used to de-
velop FC/FS ratios (7, 8). These ratios are as
follows:
FC/FS Ratios
Man
Duck
Sheep
Chicken
Pig
Cow
Turkey
4.4
0.6
0.4
0.4
0.4
0.2
0.1
From the data, it was reasoned that ratios
greater than 4:1 were indicative of pollution
derived from domestic wastes composed of
man's body wastes. Ratios of less than 0.7
suggested that contamination originated from
livestock and poultry wastes, milk and food
processing wastes or from stormwater run-off
{non-human source). Further speciation of the
fecal streptococci provides more specific
source information. There are several precau-
tions to be observed when ratios are being
used.
(a) Bacterial densities can be altered dras-
tically wheh the pH of the sample is below 4.0
or above 9.0.
(b) Due to limited survival capability of
some of the fecal streptococci, it is essential to
sample close to the pollution source to obtain
reliable ratios. This is especially true for the
highly sensitive S. bovis and S. equinus
species.
(c) It is difficult to use ratios effectively
when mixed pollution sources are present.
(d) In marine waters, bays, estuaries, and
irrigation returns, FC/FS ratios have been of
limited value in accurately defining major pol-
lutional source's.
(e) If fecal streptococcal counts are
< 100/100 ml, ratios should not be applied.
7. Identification of Fecal Streptococci to
Species
7.1 Summary: Although the fecal st pto-
cocci are enumerated as described in the >re-
vious sections and are verified with simple
biochemical tests in Part III-D, 3 above, it is
important at times to identify the fecal strepto-
cocci to species to further verify animal and
human sources of pollution and to determine
the sanitary significance of isolates. This iden-
tification to speeies is performed using the
additional biochemical tests described to dif-
ferentiate and confirm the Group Q strepto-
cocci, the bovis-equinusGroup and the entero-
cocci. The enterococci can be separated as S.
faec/umand S. faeca/isvarteties or into groups
according to original source.
7.2 Scope and Application: The initial
biochemical test confirms that the isolates are
fecal streptococci by negative catalase reac-
tion. Group Q streptococci and enterococci are
separated from the bovis-equinus group by
positive growth at 10 and 45 C and are then
FECAL STREPTOCOCCI
145
image:
 verified by growth in 6.5% NaCI and at pH 9.6.
The enteroeoeei are separated from the Group
Q streptococci by reduction of methylene blue
milk. Subsequently, the enteroeoeei are either
speciated or separated by origin using addi-
tional biochemical tests. The Streptococcus
bovis and equinus are verified by hydrolysis
of starch and separated by lactose fermenta-
tion. These tests require specific training for
valid results.
7.3 Apparatus and Materials
7.3.1 Incubators set at 10 ± 0.5 C, 35 +
0.5 C, and 45 ^ 0.5 C (water baths recom-
mended for 10 and 45 C). Temperatures
checked with a National Bureau of Standards
thermometer or one of equivalent accuracy.
7.3.2 Pipet containers of stainless steel,
aluminum or pyrex glass for glass pipets.
7.3.3 Sterile T.D. bacteriological or Mohr
pipets, of appropriate sizes.
7.3.4 Sterile petri dishes 100 x 15 mm or
60 x 15 mm, glass or plastic.
7.3,5 Dilution bottles (milk dilution), pyrex,
99 ml volume, screw cap, with neoprene rub-
ber liners.
7.3.6 Inoculation loop, 3 mm diameter, or
needle.
7.3.7 Bunsen/Fisher burner or electric
incinerator.
7.3.8 Media
(a) Brain heart infusion (BHI) broth. (Part II-
B, 5.4.i).
(b) Brain heart infusion (BHI) agar. (Part II-B,
5.4.6).
(c) Brain heart infusion (BHI) broth with
6.5% NaCI. (Part II-B, 5.4.7).
(d) Brain heart infusion (BHI) broth, pH 9.6.
(Part II-B, 5.4.8).
(e) Brain heart infusion (BHI) broth
with 40% bile. (Part II-B, 5.4.9).
(f) Starch agar plates. (Part II-B, 5.4.10).
(g) Starch liquid medium. (Part II-B,
5.4.11).
(h) Nutrient gelatin. (Part II-B, 5.4.12).
(i) Litmus milk. (Part II-B, 5.4.13).
(j) Skim milk with 0.1% methylene blue.
(Part II-B, 5.4.14).
(k) Potassium tellurite in brain heart infu-
sion. (Part It-B, 5.4.15).
(1) Potassium tellurite in blood agar
(optional). (Part II-B, 5.4.16).
(m) Tetrazolium glucose (TG) agar or 2, 3,
5-triphenyl tetrazolium chloride (TTC) agar.
(Part II-B, 5.4.17).
(n) Blood agar with 10% blood. (Part II-B,
5.4.18).
(o) 1 % D-sorbitol solution in purple broth
base. (Part II-B, 5.1.7).
(p) 1 % glycerol in purple broth base. (Part
11-6,5.1.7).
(q) 1 % L-arabinose solution in purple broth
base. (Part II-B, 5.1.7).
(r) 1 % lactose solution in purple broth
base. (Part II-B, 5.1.8).
(s) 1 % sorbose solution in purple broth
base. (Part II-B, 5.1.8).
(t) 1% sorbose solution in purple broth
base at pH 10. (Part II-B, 5.1.8).
7.4 Procedure: Follow the schematic out-
lines in Figures lll-D-2 to 4 for the identification
of fecal streptococcal species.
7.4.1 Isolation and Confirmation of Fecal
Streptococci (Figure lll-D-2)
146
SERA MICROBIOLOGICAL MANUAL 1978
image:
verified by growth in 6.5% NaCI and at pH 9.6.
The enteroeoeei are separated from the Group
Q streptococci by reduction of methylene blue
milk. Subsequently, the enteroeoeei are either
speciated or separated by origin using addi-
tional biochemical tests. The Streptococcus
bovis and equinus are verified by hydrolysis
of starch and separated by lactose fermenta-
tion. These tests require specific training for
valid results.
7.3 Apparatus and Materials
7.3.1 Incubators set at 10 ± 0.5 C, 35 +
0.5 C, and 45 ^ 0.5 C (water baths recom-
mended for 10 and 45 C). Temperatures
checked with a National Bureau of Standards
thermometer or one of equivalent accuracy.
7.3.2 Pipet containers of stainless steel,
aluminum or pyrex glass for glass pipets.
7.3.3 Sterile T.D. bacteriological or Mohr
pipets, of appropriate sizes.
7.3.4 Sterile petri dishes 100 x 15 mm or
60 x 15 mm, glass or plastic.
7.3,5 Dilution bottles (milk dilution), pyrex,
99 ml volume, screw cap, with neoprene rub-
ber liners.
7.3.6 Inoculation loop, 3 mm diameter, or
needle.
7.3.7 Bunsen/Fisher burner or electric
incinerator.
7.3.8 Media
(a) Brain heart infusion (BHI) broth. (Part II-
B, 5.4.i).
(b) Brain heart infusion (BHI) agar. (Part II-B,
5.4.6).
(c) Brain heart infusion (BHI) broth with
6.5% NaCI. (Part II-B, 5.4.7).
(d) Brain heart infusion (BHI) broth, pH 9.6.
(Part II-B, 5.4.8).
(e) Brain heart infusion (BHI) broth
with 40% bile. (Part II-B, 5.4.9).
(f) Starch agar plates. (Part II-B, 5.4.10).
(g) Starch liquid medium. (Part II-B,
5.4.11).
(h) Nutrient gelatin. (Part II-B, 5.4.12).
(i) Litmus milk. (Part II-B, 5.4.13).
(j) Skim milk with 0.1% methylene blue.
(Part II-B, 5.4.14).
(k) Potassium tellurite in brain heart infu-
sion. (Part It-B, 5.4.15).
(1) Potassium tellurite in blood agar
(optional). (Part II-B, 5.4.16).
(m) Tetrazolium glucose (TG) agar or 2, 3,
5-triphenyl tetrazolium chloride (TTC) agar.
(Part II-B, 5.4.17).
(n) Blood agar with 10% blood. (Part II-B,
5.4.18).
(o) 1 % D-sorbitol solution in purple broth
base. (Part II-B, 5.1.7).
(p) 1 % glycerol in purple broth base. (Part
11-6,5.1.7).
(q) 1 % L-arabinose solution in purple broth
base. (Part II-B, 5.1.7).
(r) 1 % lactose solution in purple broth
base. (Part II-B, 5.1.8).
(s) 1 % sorbose solution in purple broth
base. (Part II-B, 5.1.8).
(t) 1% sorbose solution in purple broth
base at pH 10. (Part II-B, 5.1.8).
7.4 Procedure: Follow the schematic out-
lines in Figures lll-D-2 to 4 for the identification
of fecal streptococcal species.
7.4.1 Isolation and Confirmation of Fecal
Streptococci (Figure lll-D-2)
146
SERA MICROBIOLOGICAL MANUAL 1978
image:
 (a) Pick colonies typical of fecal strepto-
cocci from the membranes or the pour plates,
and inoculate them onto BHI agar slants and
into BHI broth tubes.
(b) After 24-48 hours incubation at 35 +
0.5 C, transfer a loopful of growth from the BHI
slant to a clean glass slide, and add a few
drops of freshly-tested 3% hydrogen peroxide
to the smear. A positive control such as staphy-
lococcus and a negative control such as 5.
faecalis should be used for testing the 3%
H202.
(c) If the catalase enzyme is present, it
cleaves the H202 to produce water and visible
oxygen gas bubbles. The presence of bubbles
constitutes a positive catalase test that indica-
tes non-streptococcal species. Verification
need not be continued.
(d) If the catalase test is negative, a separa-
tion of the enterococcus and Q gtoup orga-
nisms from 5. bovis, and 5. equinus can be
made by testing for growth at 10 and 45 C.
7.4.2 Separation of Enterococci and
Group Q Streptococci (Figure lll-D-2)
(a) Transfer 1 drop of the growth from the
BHI broth tube from 7.4.1 to each of 2 BHI
broth tubes.
(b) Place 1 tube in a 45±0.5 C water bath
and observe for growth (as evidenced by tur-
bidity) within 2 days. Place the other tube in a
10 + 0.5 C water bath and check for growth
within 5 days. Growth at 10 and 45 C indicates
that the culture is a potential member of the
enterococcus or Q groups. On the other hand,
S. equinus and S. bovis exhibit growth at 45 C
but not at 10 C. (See 7.4.7 for these
speciations).
7.4.3 Confirmation of Enterococcus Group
(Figure lll-D-2)
This is done by testing for growth in 6.5%
NaCI and at pH 9.6 in BHI broth and observing
for reduction of 0.1% methylene blue in milk.
Positive reactions in all cases confirm the
presence of the enterococcus group. Positive
reactions in 6.5% NaCI and pH 9.6 BHI broths
and no reaction in 0.1 % methylene blue indicate
the tentative identification of group Q.
(a) Growth Test ir^ 6.5% NaCI-BHI Broth:
Transfer 1 drop of 24 hour BHI broth culture to
a tube of BHI broth containing 6.5% sodium
chloride. Incubate at 35 + 0.5 C, and check for
growth as evidenced by turbidity within a 3-7
day period. Growth is a positive test.
(b) Growth Test ir^ BHI Broth of pH 9.6:
Transfer 1 drop of the 24 hour BHI broth cul-
ture to a tube of BHI broth adjusted to pH 9.6.
Incubate at 35 + 0.5 C, and check for growth
as evidenced by turbidity at 1, 2,3, and 7 days.
Growth is a positive test.
(c) Reduction of 0.1 % Methylene Blue m^
Skim Milk: TransfeTl drop of the 24 hour BHl
broth culture to a tube of sterile skim milk
containing 0.1% methylene blue. Positive re-
duction of methylene blue is evidenced by the
color change from blue to white.
7.4.4 Separation of Enterococcus Group
by Species (Figure lll-D-3)
The enterococci can be separated into
species as described in 7.4.4 or into groups by
original source as described in 7.4.5. The
enterococcus group can be separated into
species by observing the reduction of potassium
tellurite and 2, 3, 5-triphenyl tetrazolium chlo-
ride and the fermentation of D-sorbitol and
glycerol.
(a) Streak the 24 hour BHI broth culture
onto an agar plate containing a final concen-
tration of 0.4% potassium tellurite. Invert the
plates, incubate at 35 -± 0.5 C, and observe
the plates each day for 7 days. Colonies reduc-
ing the potassium tellurite will appear black on
this medium.
(b) Streak the 24 hour BHI broth culture
onto tetrazolium glucose agar (TG). Reduction
of tetrazolium to formazin is observed after 48
hours at 35 + 0.5 C. The degrees of reduction
are indicated as follows:
FECAL STREPTOCOCCI
147
image:
(a) Pick colonies typical of fecal strepto-
cocci from the membranes or the pour plates,
and inoculate them onto BHI agar slants and
into BHI broth tubes.
(b) After 24-48 hours incubation at 35 +
0.5 C, transfer a loopful of growth from the BHI
slant to a clean glass slide, and add a few
drops of freshly-tested 3% hydrogen peroxide
to the smear. A positive control such as staphy-
lococcus and a negative control such as 5.
faecalis should be used for testing the 3%
H202.
(c) If the catalase enzyme is present, it
cleaves the H202 to produce water and visible
oxygen gas bubbles. The presence of bubbles
constitutes a positive catalase test that indica-
tes non-streptococcal species. Verification
need not be continued.
(d) If the catalase test is negative, a separa-
tion of the enterococcus and Q gtoup orga-
nisms from 5. bovis, and 5. equinus can be
made by testing for growth at 10 and 45 C.
7.4.2 Separation of Enterococci and
Group Q Streptococci (Figure lll-D-2)
(a) Transfer 1 drop of the growth from the
BHI broth tube from 7.4.1 to each of 2 BHI
broth tubes.
(b) Place 1 tube in a 45±0.5 C water bath
and observe for growth (as evidenced by tur-
bidity) within 2 days. Place the other tube in a
10 + 0.5 C water bath and check for growth
within 5 days. Growth at 10 and 45 C indicates
that the culture is a potential member of the
enterococcus or Q groups. On the other hand,
S. equinus and S. bovis exhibit growth at 45 C
but not at 10 C. (See 7.4.7 for these
speciations).
7.4.3 Confirmation of Enterococcus Group
(Figure lll-D-2)
This is done by testing for growth in 6.5%
NaCI and at pH 9.6 in BHI broth and observing
for reduction of 0.1% methylene blue in milk.
Positive reactions in all cases confirm the
presence of the enterococcus group. Positive
reactions in 6.5% NaCI and pH 9.6 BHI broths
and no reaction in 0.1 % methylene blue indicate
the tentative identification of group Q.
(a) Growth Test ir^ 6.5% NaCI-BHI Broth:
Transfer 1 drop of 24 hour BHI broth culture to
a tube of BHI broth containing 6.5% sodium
chloride. Incubate at 35 + 0.5 C, and check for
growth as evidenced by turbidity within a 3-7
day period. Growth is a positive test.
(b) Growth Test ir^ BHI Broth of pH 9.6:
Transfer 1 drop of the 24 hour BHI broth cul-
ture to a tube of BHI broth adjusted to pH 9.6.
Incubate at 35 + 0.5 C, and check for growth
as evidenced by turbidity at 1, 2,3, and 7 days.
Growth is a positive test.
(c) Reduction of 0.1 % Methylene Blue m^
Skim Milk: TransfeTl drop of the 24 hour BHl
broth culture to a tube of sterile skim milk
containing 0.1% methylene blue. Positive re-
duction of methylene blue is evidenced by the
color change from blue to white.
7.4.4 Separation of Enterococcus Group
by Species (Figure lll-D-3)
The enterococci can be separated into
species as described in 7.4.4 or into groups by
original source as described in 7.4.5. The
enterococcus group can be separated into
species by observing the reduction of potassium
tellurite and 2, 3, 5-triphenyl tetrazolium chlo-
ride and the fermentation of D-sorbitol and
glycerol.
(a) Streak the 24 hour BHI broth culture
onto an agar plate containing a final concen-
tration of 0.4% potassium tellurite. Invert the
plates, incubate at 35 -± 0.5 C, and observe
the plates each day for 7 days. Colonies reduc-
ing the potassium tellurite will appear black on
this medium.
(b) Streak the 24 hour BHI broth culture
onto tetrazolium glucose agar (TG). Reduction
of tetrazolium to formazin is observed after 48
hours at 35 + 0.5 C. The degrees of reduction
are indicated as follows:
FECAL STREPTOCOCCI
147
image:
 Enterococcus Group
Enterococcus, by Species
Redjction of KjTeOs.Tatrazoliu
and Fermentation of D-sorbitol
and Glycsrol
Enterocoeci by Origin
Se paration of Vegetation
Insect and Animal
Sources
Potitlv*
Hydrolysis
of Gelatin
Positive
S, ft tct Us
Sublp. liquadcians
Negative
Beta-Hemolyais
Negative
Fermentation
of L-Arabinose
Positive
S, fatcium
(See Figure lll-D-4)
Pojitlvo
S, ft act Us
Subsp, zymogtnas
Negative
S. faecalis
FIGURE lll-D-3. Identification of Fecal Streptococci, Separation of Enterococcus
Group by Species and by Original Source of Culture.
148
MICROBIOLOGICAL MANUAL 1978
image:
Enterococcus Group
Enterococcus, by Species
Redjction of KjTeOs.Tatrazoliu
and Fermentation of D-sorbitol
and Glycsrol
Enterocoeci by Origin
Se paration of Vegetation
Insect and Animal
Sources
Potitlv*
Hydrolysis
of Gelatin
Positive
S, ft tct Us
Sublp. liquadcians
Negative
Beta-Hemolyais
Negative
Fermentation
of L-Arabinose
Positive
S, fatcium
(See Figure lll-D-4)
Pojitlvo
S, ft act Us
Subsp, zymogtnas
Negative
S. faecalis
FIGURE lll-D-3. Identification of Fecal Streptococci, Separation of Enterococcus
Group by Species and by Original Source of Culture.
148
MICROBIOLOGICAL MANUAL 1978
image:
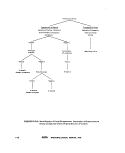 Strong Reduction (+4 to +3) = Red cen-
tered colony.
Moderate Reduction (+2) = Pink centered
colony.
Weak Reduction (+1) = Pale pink cen-
tered colony.
No reduction (0) = White colony.
(c) Transfer a small amount of growth from
each 24 hour BHI agar slant culture to sepa-
rate purple broth base tubes containing 1 % D-
sorbitol and 1% glycerol. Be careful not to
penetrate the agar slant and carry over agar to
the carbohydrate medium. Incubate the inocu-
lated carbohydrate media at 35 ± 0.5 C, and
note acid production over a 4 day incubation
period. A negative reaction in D-sorbitol or
glycerol shows that S. faecium is present. The
indicator will be unchanged (purple in color).
(d) Reduction of potassium tellurite (black
colonies), reduction of tetrazolium to formazan
on TTC agar and the fermentation of glycerol
and D-sorbitol indicate S, faeca/isand its varie-
ties. The determination of S. faecalis subspe-
cies is performed as follows:
(1) Stab-inoculate gelatin with a small
amount of growth from a 24 hour BHI agar
slant. Incubate the culture at 35 ± 0.5 C for
2-14 days, according to the rate of growth.
After incubation, place the tube in a cold water
bath or refrigerator 15-30 minutes to deter-
mine whether or not the gelatin will still solid-
ify. Uninoculated controls must be run in paral-
lel, especially when prolonged incubation peri-
ods are encountered. Liquefaction dictates S.
faecalis subsp. Hquefaciens, whereas solidifi-
cation indicates S. faecalis or S, faecalis
subsp. zymogenes. The latter 2 strains are
separated by their hemolysis reactions.
(2) The hemolytic properties of the fecal
streptococci are determined by streak or pour
plates. Melt blood agar base, cool and add
10% sheep blood. Inoculate streak plates or
prepare pour plates and incubate for 48 hours.
After incubation, read plates. Overnight refrig-
eration may enhance the hemolytic reactions.
Hemolysis is classified as 3 types:
Alpha-Hemolysis - Some streptococci par-
tially lyse red blood cells and reduce hemoglo-
bin to methemoglobin producing a discolor-
ation of the red blood cells. This appears as
greenish zones around the colonies.
Beta Hemolysis- Enzymes of fecal strepto-
cocci completely lyse red blood cells produc-
ing yellowish hue, or clear, colorless zone in
the blood agar surrounding the colony. S, fae-
calissubsp. zymogenes demonstrates beta he-
molysis of the blood.
Gamma-Hemolysis - Some streptococci
produce no hemolysis which is designated as
gamma hemolysis, S. faecalis is alpha or
gamma hemolytic.
It is important to note that upon serial
transfer of the culture in the laboratory, hemol-
ysis may be lost. This is especially true for S.
faecalis subsp. zymogenes where beta hemol-
ysis may not occur after serial transfer.
(e) Negative reactions in potassium tellur-
ite and tetrazolium media and failure to fer-
ment D-sorbitol and glycerol indicate S,
faecium.
(f) Transfer a small amount of growth from
the 24 hour BHI agar slant to a purple broth
base tube containing 1 % L-arabinose. Be care-
ful not to penetrate the agar slant surface and
carry over agar to the carbohydrate medium.
Incubate the inoculated carbohydrate medium
at 35 ± 0.5 C, and note acid production over a
4 day incubation period. If S. faecium is
present, the L-arabinose is fermented, acid will
be produced and the medium will turn yellow.
7.4.5 Separating Enterococci by Origin
(Vegetation, Insect and Animal Sources)
In contrast to the separation of entero-
cocci by species described in 7.4.4, the mem-
bers of the enterococcus group can be sepa-
rated according to original source of culture.
The starch hydrolysis tests separate the enter-
ococci originating on vegetation from those
typically found in insects and animals; the pep-
tonization of litmus milk test separates the
FECAL STREPTOCOCCI
149
image:
Strong Reduction (+4 to +3) = Red cen-
tered colony.
Moderate Reduction (+2) = Pink centered
colony.
Weak Reduction (+1) = Pale pink cen-
tered colony.
No reduction (0) = White colony.
(c) Transfer a small amount of growth from
each 24 hour BHI agar slant culture to sepa-
rate purple broth base tubes containing 1 % D-
sorbitol and 1% glycerol. Be careful not to
penetrate the agar slant and carry over agar to
the carbohydrate medium. Incubate the inocu-
lated carbohydrate media at 35 ± 0.5 C, and
note acid production over a 4 day incubation
period. A negative reaction in D-sorbitol or
glycerol shows that S. faecium is present. The
indicator will be unchanged (purple in color).
(d) Reduction of potassium tellurite (black
colonies), reduction of tetrazolium to formazan
on TTC agar and the fermentation of glycerol
and D-sorbitol indicate S, faeca/isand its varie-
ties. The determination of S. faecalis subspe-
cies is performed as follows:
(1) Stab-inoculate gelatin with a small
amount of growth from a 24 hour BHI agar
slant. Incubate the culture at 35 ± 0.5 C for
2-14 days, according to the rate of growth.
After incubation, place the tube in a cold water
bath or refrigerator 15-30 minutes to deter-
mine whether or not the gelatin will still solid-
ify. Uninoculated controls must be run in paral-
lel, especially when prolonged incubation peri-
ods are encountered. Liquefaction dictates S.
faecalis subsp. Hquefaciens, whereas solidifi-
cation indicates S. faecalis or S, faecalis
subsp. zymogenes. The latter 2 strains are
separated by their hemolysis reactions.
(2) The hemolytic properties of the fecal
streptococci are determined by streak or pour
plates. Melt blood agar base, cool and add
10% sheep blood. Inoculate streak plates or
prepare pour plates and incubate for 48 hours.
After incubation, read plates. Overnight refrig-
eration may enhance the hemolytic reactions.
Hemolysis is classified as 3 types:
Alpha-Hemolysis - Some streptococci par-
tially lyse red blood cells and reduce hemoglo-
bin to methemoglobin producing a discolor-
ation of the red blood cells. This appears as
greenish zones around the colonies.
Beta Hemolysis- Enzymes of fecal strepto-
cocci completely lyse red blood cells produc-
ing yellowish hue, or clear, colorless zone in
the blood agar surrounding the colony. S, fae-
calissubsp. zymogenes demonstrates beta he-
molysis of the blood.
Gamma-Hemolysis - Some streptococci
produce no hemolysis which is designated as
gamma hemolysis, S. faecalis is alpha or
gamma hemolytic.
It is important to note that upon serial
transfer of the culture in the laboratory, hemol-
ysis may be lost. This is especially true for S.
faecalis subsp. zymogenes where beta hemol-
ysis may not occur after serial transfer.
(e) Negative reactions in potassium tellur-
ite and tetrazolium media and failure to fer-
ment D-sorbitol and glycerol indicate S,
faecium.
(f) Transfer a small amount of growth from
the 24 hour BHI agar slant to a purple broth
base tube containing 1 % L-arabinose. Be care-
ful not to penetrate the agar slant surface and
carry over agar to the carbohydrate medium.
Incubate the inoculated carbohydrate medium
at 35 ± 0.5 C, and note acid production over a
4 day incubation period. If S. faecium is
present, the L-arabinose is fermented, acid will
be produced and the medium will turn yellow.
7.4.5 Separating Enterococci by Origin
(Vegetation, Insect and Animal Sources)
In contrast to the separation of entero-
cocci by species described in 7.4.4, the mem-
bers of the enterococcus group can be sepa-
rated according to original source of culture.
The starch hydrolysis tests separate the enter-
ococci originating on vegetation from those
typically found in insects and animals; the pep-
tonization of litmus milk test separates the
FECAL STREPTOCOCCI
149
image:
 insect-origin from warm-blooded animal-
source enterococci, as shown in Figure lll-D-4.
S. faecalis from vegetation hydrolyzes
starch while 5. faecalis subsp. liquefaciens
from insects and enterococci from warm-
blooded animals do not. The starch hydrolysis
test can be performed satisfactorily with
starch agar plates or in a liquid starch tube
medium (9).
(a) Starch Hydrolysis Plate Test
(1) Pour the starch agar medium into petri
dishes and allow to solidify. With a wax pencil
divide the bottoms of the petri dishes into 6
individual areas to allow the testing of 6
isolates.
(2) Streak each isolate from a 24 hour BHI
agar slant onto one of the areas and incubate
at 35 ± 0.5 C for 24 hours.
(3) After incubation, flood the agar me-
dium with Lugol's iodine solution (Part II-C,
5.3). Streaks showing clear hydrolytic zones
with absence of the usual blue-black color of
the starch-iodine complex in the zones sur-
rounding the colonies are considered positive.
(b) Starch Hydrolysis Tube Test
(1) The starch test may also be performed
using a liquid medium instead of starch agar
plates. Inoculate tubes of sterile liquid medium
with the test organisms. After 18 hours of
Incubation at 35 ± 0.5 C, test the tubes for
starch hydrolysis using a modification of the
iodine test (8). For this modification, 0.2 ml of
2% FeCI solution and 0.2 ml of Lugol's iodine
solution are added to 5 ml of the inoculated
medium and to 5 ml of the uninoculated me-
dium (control).
(2) Hold the tubes for 3 hours at room
temperature. Compare the inoculated tubes to
the control tube. The control tube (negative
test) maintains a violet color, but positive test
cultures hydrolyze the starch and decolorize
the medium to a reddish-violet hue.
(c) Peptonization of Milk: Peptonization in
litmus milk is used to separate 5. faecalis
subsp. liquefaciens (from insect sources) from
enterococci derived from warm-blooded ani-
mal sources.
(1) Transfer 1 drop of the isolate growing
in a 24 hour BHI broth culture to a tube of
sterile litmus milk.
(2) Incubate the tube at 35 ± 0.5 C, and
observe at 1,2,3 and 7 days.
(3) A positive peptonization includes liqui-
faction and clearing of the milk with the devel-
opment of a brownish color. Peptonization in-
dicates S. faecalis subsp. liquefaciens. Color
changes without clearing, or coagulation are
negative reactions and indicate enterococci
from warm-blooded animal sources are
present.
7.4.6 Identification
Streptococci
of Group Q
The group Q Streptococci are initially sep-
arated from the Enterococcus Group and tenta-
tively identified by growth in 6.5% NaCI in BHI
and in BHI broth at pH 9,6, but no growth in
0.1 % methylene blue in milk. See Figure III-D-
2.
Other pertinent physiological characteris-
tics of Group Q Streptococci are: fermentation
of sorbose, growth in sorbose medium at pH
10, but no growth in tellurite medium and
negative hydrolysis of starch and gelatin. The
tests may be carried out as follows:
(a) Inoculate a sorbose fermentation tube
with a small amount of growth from an isolate
on a 24 hour BHI slant. Be careful not to
penetrate the agar slant surface and carry over
agar to the carbohydrate medium. Incubate
the carbohydrate medium at 35 ± 0.5 C and
note acid production over a 4 day incubation
period. Sorbose fermentation is indicated by
acid production and change in the medium
colorfrom purple to yellow,
(b) Transfer a small amount of growth from
the 24 hour BHI slant to the 1 % sorbose me-
150
MICROBIOLOGICAL MANUAL 1978
image:
insect-origin from warm-blooded animal-
source enterococci, as shown in Figure lll-D-4.
S. faecalis from vegetation hydrolyzes
starch while 5. faecalis subsp. liquefaciens
from insects and enterococci from warm-
blooded animals do not. The starch hydrolysis
test can be performed satisfactorily with
starch agar plates or in a liquid starch tube
medium (9).
(a) Starch Hydrolysis Plate Test
(1) Pour the starch agar medium into petri
dishes and allow to solidify. With a wax pencil
divide the bottoms of the petri dishes into 6
individual areas to allow the testing of 6
isolates.
(2) Streak each isolate from a 24 hour BHI
agar slant onto one of the areas and incubate
at 35 ± 0.5 C for 24 hours.
(3) After incubation, flood the agar me-
dium with Lugol's iodine solution (Part II-C,
5.3). Streaks showing clear hydrolytic zones
with absence of the usual blue-black color of
the starch-iodine complex in the zones sur-
rounding the colonies are considered positive.
(b) Starch Hydrolysis Tube Test
(1) The starch test may also be performed
using a liquid medium instead of starch agar
plates. Inoculate tubes of sterile liquid medium
with the test organisms. After 18 hours of
Incubation at 35 ± 0.5 C, test the tubes for
starch hydrolysis using a modification of the
iodine test (8). For this modification, 0.2 ml of
2% FeCI solution and 0.2 ml of Lugol's iodine
solution are added to 5 ml of the inoculated
medium and to 5 ml of the uninoculated me-
dium (control).
(2) Hold the tubes for 3 hours at room
temperature. Compare the inoculated tubes to
the control tube. The control tube (negative
test) maintains a violet color, but positive test
cultures hydrolyze the starch and decolorize
the medium to a reddish-violet hue.
(c) Peptonization of Milk: Peptonization in
litmus milk is used to separate 5. faecalis
subsp. liquefaciens (from insect sources) from
enterococci derived from warm-blooded ani-
mal sources.
(1) Transfer 1 drop of the isolate growing
in a 24 hour BHI broth culture to a tube of
sterile litmus milk.
(2) Incubate the tube at 35 ± 0.5 C, and
observe at 1,2,3 and 7 days.
(3) A positive peptonization includes liqui-
faction and clearing of the milk with the devel-
opment of a brownish color. Peptonization in-
dicates S. faecalis subsp. liquefaciens. Color
changes without clearing, or coagulation are
negative reactions and indicate enterococci
from warm-blooded animal sources are
present.
7.4.6 Identification
Streptococci
of Group Q
The group Q Streptococci are initially sep-
arated from the Enterococcus Group and tenta-
tively identified by growth in 6.5% NaCI in BHI
and in BHI broth at pH 9,6, but no growth in
0.1 % methylene blue in milk. See Figure III-D-
2.
Other pertinent physiological characteris-
tics of Group Q Streptococci are: fermentation
of sorbose, growth in sorbose medium at pH
10, but no growth in tellurite medium and
negative hydrolysis of starch and gelatin. The
tests may be carried out as follows:
(a) Inoculate a sorbose fermentation tube
with a small amount of growth from an isolate
on a 24 hour BHI slant. Be careful not to
penetrate the agar slant surface and carry over
agar to the carbohydrate medium. Incubate
the carbohydrate medium at 35 ± 0.5 C and
note acid production over a 4 day incubation
period. Sorbose fermentation is indicated by
acid production and change in the medium
colorfrom purple to yellow,
(b) Transfer a small amount of growth from
the 24 hour BHI slant to the 1 % sorbose me-
150
MICROBIOLOGICAL MANUAL 1978
image:
 Separation of
Enterococcus Group
by Original Source,
Vegetation, Insect
and Animal Sources
Starch Hydrolysis
Positive
Negative
Peptonization of
Litmus Milk
Positive
Negative
Atypical
S. faecalis
(Vegetation sources)
S. faecalis
Subsp. liquefaciens
(Insect Sources)
Enterococci
(Warm-blooded
Animal Sources)
FIGURE lll-D-4. Identification of Fecal Streptococci, Separation of Enterococci from
Vegetation, Insect and Animal Sources.
FECAL STREPTOCOCCI
151
image:
Separation of
Enterococcus Group
by Original Source,
Vegetation, Insect
and Animal Sources
Starch Hydrolysis
Positive
Negative
Peptonization of
Litmus Milk
Positive
Negative
Atypical
S. faecalis
(Vegetation sources)
S. faecalis
Subsp. liquefaciens
(Insect Sources)
Enterococci
(Warm-blooded
Animal Sources)
FIGURE lll-D-4. Identification of Fecal Streptococci, Separation of Enterococci from
Vegetation, Insect and Animal Sources.
FECAL STREPTOCOCCI
151
image:
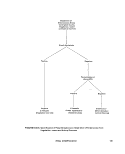 dium (described in Part II-B, 5.1.8 above) which
has been adjusted to pH 10 with sterile 38%
sodium phosphate solution (see Part II-B,
5.4.8). Incubate the inoculated medium at 35
± 0.5 C for at least 4 days. Growth indicates a
positive test.
(c) Inoculate the growth from a 24 hour
BHl slant into BHI broth containing 0.04%
potassium tellurite and incubate at 35 ± 0.5 C
for 7 days. Group Q organisms do not grow on
this medium.
(d) Stab-inoculate gelatin with a small
amount of growth from the 24 hour BHI slant.
Incubate the culture at 35 ± 0.5 C for 2-14
days, according to the rate of growth. After
incubation, place the tube in a cold water bath
or refrigerator for 15-30 minutes to determine
whether or not the gelatin will solidify. Unino-
culated control must be done in parallel, espe-
cially when prolonged incubation periods are
used.
(e) Group Q organisms do not hydrolyze
starch. Perform starch hydrolysis test as in
7.4.5 (a) or (b) above.
(0 Streptococcus avium sp. constitute
Lancefield's Group Q. Consequently, Group Q
antiserum may be used in the precipitin test to
provide further identification. However, the Q
antigen is not demonstrable in all strains.
therefore, identification in those cases will de-
pend solely on physiological characteristics.
7.4.7 Separation and Speciation of 5. bo-
vis and S. equinus
(a) 5. bovis and S. equinuswere separated
from the Enterococci and Group Q Strepto-
cocci by growth at 45 C but no growth at 10 C
(see Figure lll-D-2). 5. bow's and S. equinus can
be separated by the lactose fermentation test
in which 5. bovisproduces acid and 5. equinus
produces no change,(c)lbelow.
(b) Starch Hydrolysis Test: Perform starch
hydrolysis test as in 7.4.5 (a)or(b).
Positive starch hydrolysis test confirms 5.
bovis and S. equinus.
(c) Lactose Fermentation Test: To differen-
tiate between 5. bovis and S. equinus by lac-
tose fermentation, transfer a small amount of
growth from the 24 hour BHI agar slant to a
purple broth base tube containing 1 % lactose
and an inverted fermentation tube. Do not pen-
etrate the agar slant surface and carry over
agar to the carbohydrate medium. Incubate
the inoculated carbohydrate medium at 35 ±
0.5 C and observe the reaction over a 4 day
incubation period. 5. bovis gives an acid reac-
tion only; 5. equinus shows no change.
152
MICROBIOLOGICAL MANUAL 1978
image:
dium (described in Part II-B, 5.1.8 above) which
has been adjusted to pH 10 with sterile 38%
sodium phosphate solution (see Part II-B,
5.4.8). Incubate the inoculated medium at 35
± 0.5 C for at least 4 days. Growth indicates a
positive test.
(c) Inoculate the growth from a 24 hour
BHl slant into BHI broth containing 0.04%
potassium tellurite and incubate at 35 ± 0.5 C
for 7 days. Group Q organisms do not grow on
this medium.
(d) Stab-inoculate gelatin with a small
amount of growth from the 24 hour BHI slant.
Incubate the culture at 35 ± 0.5 C for 2-14
days, according to the rate of growth. After
incubation, place the tube in a cold water bath
or refrigerator for 15-30 minutes to determine
whether or not the gelatin will solidify. Unino-
culated control must be done in parallel, espe-
cially when prolonged incubation periods are
used.
(e) Group Q organisms do not hydrolyze
starch. Perform starch hydrolysis test as in
7.4.5 (a) or (b) above.
(0 Streptococcus avium sp. constitute
Lancefield's Group Q. Consequently, Group Q
antiserum may be used in the precipitin test to
provide further identification. However, the Q
antigen is not demonstrable in all strains.
therefore, identification in those cases will de-
pend solely on physiological characteristics.
7.4.7 Separation and Speciation of 5. bo-
vis and S. equinus
(a) 5. bovis and S. equinuswere separated
from the Enterococci and Group Q Strepto-
cocci by growth at 45 C but no growth at 10 C
(see Figure lll-D-2). 5. bow's and S. equinus can
be separated by the lactose fermentation test
in which 5. bovisproduces acid and 5. equinus
produces no change,(c)lbelow.
(b) Starch Hydrolysis Test: Perform starch
hydrolysis test as in 7.4.5 (a)or(b).
Positive starch hydrolysis test confirms 5.
bovis and S. equinus.
(c) Lactose Fermentation Test: To differen-
tiate between 5. bovis and S. equinus by lac-
tose fermentation, transfer a small amount of
growth from the 24 hour BHI agar slant to a
purple broth base tube containing 1 % lactose
and an inverted fermentation tube. Do not pen-
etrate the agar slant surface and carry over
agar to the carbohydrate medium. Incubate
the inoculated carbohydrate medium at 35 ±
0.5 C and observe the reaction over a 4 day
incubation period. 5. bovis gives an acid reac-
tion only; 5. equinus shows no change.
152
MICROBIOLOGICAL MANUAL 1978
image:
 REFERENCES
1. Nowlan, Sandra and R, H, Diebel, 1967. Group Q streptococci I. Ecology, serology, physiology
and relationship to established enterococci. J. Bacteriol. 94, (2):291.
2. Kenner, B. A., H. F. Clark and P, W. Kabler, 1960. Fecal streptococci. II. Quantification of
streptococci in feces. Am. J. Public Health. 50:1553.
3. Kenner, B. A., H. F. Clark and P. W. Kabler, 1961. Fecal streptococci. I. Cultivation and
enumeration of streptococci in surface water. Appl. Mlcrobiol. 9:15.
4, Pavlova, M. T., F. T. Brezenski and W. Litsky, 1972. Evaluation of various media for isolation,
enumeration and identification of fecal streptococci from natural sources. Health Lab. Scj. 9:289.
5. Clausen, E. M., B. L Green and W. Litsky, 1977. Fecal Streptococci: Indicators of Pollution, pp.
247-264. In: A. W. Hoadley and B. J. Dutka, Eds., Bacterial Indicators/Health Hazards Associated
with Water, ASTM STP635, American Society for Testing and Materials, Philadelphia, PA.
6. Prescott, S. C., C-E. A. Winslow and M. H. McCrady, 1946. Water Bacteriology. (6th ed.) John
Wiley and Sons, Inc., p. 46-50.
7. Geldreieh, E. E., H. F. Clark and C. B. Huff, 1964. A study of pollution indicators in a waste
stabilization pond. J. WPCF, 36 (11): 1372.
8. Geldreieh, E. E., 1976. Fecal coliform and fecal streptococcus density relationships in waste
discharges and receiving waters. Irr, CRC Critical Reviews in Environmental Control, p. 349.
9. Pavlova, M. T., W. Litsky and F. J. Francis, 1971. A comparative study of starch hydrolysis by fecal
streptococci employing plate and tube techniques. Health Lab. Sci. 8:67.
FECAL STREPTOCOCCI 153
image:
REFERENCES
1. Nowlan, Sandra and R, H, Diebel, 1967. Group Q streptococci I. Ecology, serology, physiology
and relationship to established enterococci. J. Bacteriol. 94, (2):291.
2. Kenner, B. A., H. F. Clark and P, W. Kabler, 1960. Fecal streptococci. II. Quantification of
streptococci in feces. Am. J. Public Health. 50:1553.
3. Kenner, B. A., H. F. Clark and P. W. Kabler, 1961. Fecal streptococci. I. Cultivation and
enumeration of streptococci in surface water. Appl. Mlcrobiol. 9:15.
4, Pavlova, M. T., F. T. Brezenski and W. Litsky, 1972. Evaluation of various media for isolation,
enumeration and identification of fecal streptococci from natural sources. Health Lab. Scj. 9:289.
5. Clausen, E. M., B. L Green and W. Litsky, 1977. Fecal Streptococci: Indicators of Pollution, pp.
247-264. In: A. W. Hoadley and B. J. Dutka, Eds., Bacterial Indicators/Health Hazards Associated
with Water, ASTM STP635, American Society for Testing and Materials, Philadelphia, PA.
6. Prescott, S. C., C-E. A. Winslow and M. H. McCrady, 1946. Water Bacteriology. (6th ed.) John
Wiley and Sons, Inc., p. 46-50.
7. Geldreieh, E. E., H. F. Clark and C. B. Huff, 1964. A study of pollution indicators in a waste
stabilization pond. J. WPCF, 36 (11): 1372.
8. Geldreieh, E. E., 1976. Fecal coliform and fecal streptococcus density relationships in waste
discharges and receiving waters. Irr, CRC Critical Reviews in Environmental Control, p. 349.
9. Pavlova, M. T., W. Litsky and F. J. Francis, 1971. A comparative study of starch hydrolysis by fecal
streptococci employing plate and tube techniques. Health Lab. Sci. 8:67.
FECAL STREPTOCOCCI 153
image:
 PART Hi. ANALYTICAL METHODOLOGY
Section E Salmonella
Recommended methods are presented for
recovery of Salmonella from water and waste-
water and their subsequent identification. The
methods are particularly useful for recreational
and shellfish-harvesting waters. No single
method of recovery and identification of these
organisms from waters and wastewaters is
appropriate for all sampling situations. The
method selected depends on the character-
istics of the sample and the microbiologist's
experience with the techniques. Multiple
option techniques are described for sample
concentration, enrichment, isolation and
identification. The Section is divided as
follows:
1. The Genus, Salmonella
2. Methods for Concentration of
Salmonella
3. Primary Enrichment for
Salmonella
4. Isolation of Salmonella
5, Biochemical Identification of
Salmonella
6. Serolog ica I Test f or Salmonella
7. Quantitative Techniques
8, Optional Fluorescent Antibody
Screening Technique
1. The Genus, Salmonella
1.1 Definition
The genus Salmonella is comprised of a
large number of serologically related, gram-
negative, nonspore-forming bacilli that are
0.4-0.6 urn in width * 1-3 /um in length, and
which occasionally form short filaments. They
are motile with peritrichous flagella or are non-
motile. Ordinarily salmonellae do not ferment
lactose, sucrose, malonate or salicin but do
ferment numerous carbohydrates including
glucose, inositol and dulcitol. These bacteria
are positive for lysine and ornithinedecarboxy-
lase and negative for urease and phenylalanine
deaminase. Usually they produce hydrogen
sulfide and do not liquify gelatin. All of the
known Salmonella species are pathogenic for
warm-blooded animals, including man. They
cause enteritis, (via contaminated water, food
or food products) enteric fevers and are found
in reptiles, amphibians and mammals. Edwards
and Ewing have published an authoritative
.work on the isolation and characterization of
Salmonella (1).
In Bergey's 8th edition (2), the salmonellae
have been reclassified tentatively into 4 sub-
genera containing II subdivisions. However,
the problem of Kaufman's listing of manysero-
types, and the lack of agreement as to what
constitutes the genus Salmonella or its spe-
cies, leaves the taxonomy in a fluid state.
1.2 Identification Schemes
A comprehensive scheme of the recom-
mended isolation, detection and identification
154
MICROBIOLOGICAL MANUAL 1978
image:
PART Hi. ANALYTICAL METHODOLOGY
Section E Salmonella
Recommended methods are presented for
recovery of Salmonella from water and waste-
water and their subsequent identification. The
methods are particularly useful for recreational
and shellfish-harvesting waters. No single
method of recovery and identification of these
organisms from waters and wastewaters is
appropriate for all sampling situations. The
method selected depends on the character-
istics of the sample and the microbiologist's
experience with the techniques. Multiple
option techniques are described for sample
concentration, enrichment, isolation and
identification. The Section is divided as
follows:
1. The Genus, Salmonella
2. Methods for Concentration of
Salmonella
3. Primary Enrichment for
Salmonella
4. Isolation of Salmonella
5, Biochemical Identification of
Salmonella
6. Serolog ica I Test f or Salmonella
7. Quantitative Techniques
8, Optional Fluorescent Antibody
Screening Technique
1. The Genus, Salmonella
1.1 Definition
The genus Salmonella is comprised of a
large number of serologically related, gram-
negative, nonspore-forming bacilli that are
0.4-0.6 urn in width * 1-3 /um in length, and
which occasionally form short filaments. They
are motile with peritrichous flagella or are non-
motile. Ordinarily salmonellae do not ferment
lactose, sucrose, malonate or salicin but do
ferment numerous carbohydrates including
glucose, inositol and dulcitol. These bacteria
are positive for lysine and ornithinedecarboxy-
lase and negative for urease and phenylalanine
deaminase. Usually they produce hydrogen
sulfide and do not liquify gelatin. All of the
known Salmonella species are pathogenic for
warm-blooded animals, including man. They
cause enteritis, (via contaminated water, food
or food products) enteric fevers and are found
in reptiles, amphibians and mammals. Edwards
and Ewing have published an authoritative
.work on the isolation and characterization of
Salmonella (1).
In Bergey's 8th edition (2), the salmonellae
have been reclassified tentatively into 4 sub-
genera containing II subdivisions. However,
the problem of Kaufman's listing of manysero-
types, and the lack of agreement as to what
constitutes the genus Salmonella or its spe-
cies, leaves the taxonomy in a fluid state.
1.2 Identification Schemes
A comprehensive scheme of the recom-
mended isolation, detection and identification
154
MICROBIOLOGICAL MANUAL 1978
image:
 methods is outlined in sequence in Figure III-E-
1.
When space and equipment are limited,
the number of options at each stage depicted
in Figure lll-E-1 can be reduced and salmonel-
lae isolated successfully. One such simplified
scheme is outlined in Figure ill-E-2.
The procedures outlined in these schema
are described in the following subsections
2-8.
2. Methods for Concentration of Salmonella
The initial steps for detection of salmonel-
lae in water and wastewater require concen-
tration of the organisms by one of several
methods: the gauze swab, diatomaceous
earth, the cartridge filter, or the membrane
filter technique. The volume of sample tested
is directly related to the level of pollution.
2.1 Swab Technique Modified After
Moore's Method (3)
2.1.1 Summary: In this method sterile
gauze swabs are immersed for about 5 days
just below the surface of a water or wastewa-
ter. After the exposure period during which
bacterial concentration occurs, the gauze
swabs are retrieved, placed in sterile bags,
iced and returned to the laboratory for exami-
nation. The swab, portions of the swab, or the
expressed liquid from the swab are added to
enrichment media for selective growth of sal-
monellae and suppression of coliforms and
other non-salmonellae.
2.1.2 Scope and Application
(a) Advantages: The gauze swab technique
is superior to grab sampling, because salmo-
nellae concentration occurs in the swab
permitting improved detection. Although this
technique is not quantitative, it has proved
effective in detection of low numbers of salmo-
neilae in waters and wastewater. The tech-
nique is simple and inexpensive.
{b) Limitations: This is not a quantitative
procedure, since some salmonellae may pass
through the swab, others may desorb from the
swab during the exposure period, and the
water volume sampled is unknown. It is not
possible to predict the salmonellae concentra-
tion in,the water or wastewater from the con-
centration in the swab nor does the procedure
reflect changes or cycling of salmonellae con-
centrations at the sample site.
2.1.3 Apparatus and Materials
(a) Cheesecloth roll, 23 cm wide.
(b) Paper cutter or large pair of shears.
(c) Length of 16 gauge wire.
(d) Sterile 250 ml flasks or jars', screw-cap,
containing enrichment media. Part III-E, 3,3.10.
(e) Sterile plastic bags (e.g., Whirl-pak or
heavy-duty food freezer bags),
(f) Insulated container with ice (optional).
2.1.4 Procedure
(a) Prepare a swab from a length of cheese-
cloth 180 cm long * 23 cm.wide by folding
the length 5 times to form a pad 36 cm * 23 cm.
Cut the folds at one end. From this end, cut
the pad into 5 parallel strips, 4.5 cm wide and
26 cm long, leaving an uncut top section of
10 cm (see Figure'lll-E-3).
(b) Bind the top of the gauze swab with 16
gauge wire to form a mop-head shape, with the
strips hanging free (see Figure III-E-4).
(c) Wrap swab in kraft paper and
autoclave.
(d) Place the swab just below the surface
of the water or wastewater to be examined and
secure with the wire to a solid support.
(e) Leave the swab in place for about 5
days.
SALMONELLA
155
image:
methods is outlined in sequence in Figure III-E-
1.
When space and equipment are limited,
the number of options at each stage depicted
in Figure lll-E-1 can be reduced and salmonel-
lae isolated successfully. One such simplified
scheme is outlined in Figure ill-E-2.
The procedures outlined in these schema
are described in the following subsections
2-8.
2. Methods for Concentration of Salmonella
The initial steps for detection of salmonel-
lae in water and wastewater require concen-
tration of the organisms by one of several
methods: the gauze swab, diatomaceous
earth, the cartridge filter, or the membrane
filter technique. The volume of sample tested
is directly related to the level of pollution.
2.1 Swab Technique Modified After
Moore's Method (3)
2.1.1 Summary: In this method sterile
gauze swabs are immersed for about 5 days
just below the surface of a water or wastewa-
ter. After the exposure period during which
bacterial concentration occurs, the gauze
swabs are retrieved, placed in sterile bags,
iced and returned to the laboratory for exami-
nation. The swab, portions of the swab, or the
expressed liquid from the swab are added to
enrichment media for selective growth of sal-
monellae and suppression of coliforms and
other non-salmonellae.
2.1.2 Scope and Application
(a) Advantages: The gauze swab technique
is superior to grab sampling, because salmo-
nellae concentration occurs in the swab
permitting improved detection. Although this
technique is not quantitative, it has proved
effective in detection of low numbers of salmo-
neilae in waters and wastewater. The tech-
nique is simple and inexpensive.
{b) Limitations: This is not a quantitative
procedure, since some salmonellae may pass
through the swab, others may desorb from the
swab during the exposure period, and the
water volume sampled is unknown. It is not
possible to predict the salmonellae concentra-
tion in,the water or wastewater from the con-
centration in the swab nor does the procedure
reflect changes or cycling of salmonellae con-
centrations at the sample site.
2.1.3 Apparatus and Materials
(a) Cheesecloth roll, 23 cm wide.
(b) Paper cutter or large pair of shears.
(c) Length of 16 gauge wire.
(d) Sterile 250 ml flasks or jars', screw-cap,
containing enrichment media. Part III-E, 3,3.10.
(e) Sterile plastic bags (e.g., Whirl-pak or
heavy-duty food freezer bags),
(f) Insulated container with ice (optional).
2.1.4 Procedure
(a) Prepare a swab from a length of cheese-
cloth 180 cm long * 23 cm.wide by folding
the length 5 times to form a pad 36 cm * 23 cm.
Cut the folds at one end. From this end, cut
the pad into 5 parallel strips, 4.5 cm wide and
26 cm long, leaving an uncut top section of
10 cm (see Figure'lll-E-3).
(b) Bind the top of the gauze swab with 16
gauge wire to form a mop-head shape, with the
strips hanging free (see Figure III-E-4).
(c) Wrap swab in kraft paper and
autoclave.
(d) Place the swab just below the surface
of the water or wastewater to be examined and
secure with the wire to a solid support.
(e) Leave the swab in place for about 5
days.
SALMONELLA
155
image:
 SAMPLE
CONCENTRATION OF SAMPLE
Gauze
Swab
Diatomaceous
Earth Plug
Cartridge
Filter
Membrane
Filter
ENRICHMENT
Dulclto!
Selenite
Broth
Selenite
Broth
Tetrathionate
Broth
Tetrathionate
Brilliant
Green Broth
FA Screening Option
ISOLATION PLATING
Xylose Lysine
Desoxycholate
Agar
Xylose Lysine
Brilliant
Green Agar
Brilliant
Green Agar
Bismuth
Sulfite
Agar
BIOCHEMICAL IDENTIFICATION
(Primary Screening)
Triple Sugar
Iron Agar
Urea
Agar
Lysine
Iron Agar
Cytochrome
Oxidase Test
ADDITIONAL BIOCHEMICAL IDENTIFICATION
(Minimal Biochemical Set by Single Tube or Multitest Systems)
Lysine
Decarboxylase
Broth
Tryptophane
Broth
Malonate
Broth
Phenylalanine
Deaminase
Broth
Phenol Red
Dulcitol
Broth
SEROLOGICAL VERIFICATION
Polyvalent 0
Vi
Polyvalent H
Confirmation by a
Reference Laboratory
FIGURE lll-E-1. Schemeforthe Concentration, Isolation and Identification of Salmonella.
156
MICROBIOLOGICAL MANUAL 1978
image:
SAMPLE
CONCENTRATION OF SAMPLE
Gauze
Swab
Diatomaceous
Earth Plug
Cartridge
Filter
Membrane
Filter
ENRICHMENT
Dulclto!
Selenite
Broth
Selenite
Broth
Tetrathionate
Broth
Tetrathionate
Brilliant
Green Broth
FA Screening Option
ISOLATION PLATING
Xylose Lysine
Desoxycholate
Agar
Xylose Lysine
Brilliant
Green Agar
Brilliant
Green Agar
Bismuth
Sulfite
Agar
BIOCHEMICAL IDENTIFICATION
(Primary Screening)
Triple Sugar
Iron Agar
Urea
Agar
Lysine
Iron Agar
Cytochrome
Oxidase Test
ADDITIONAL BIOCHEMICAL IDENTIFICATION
(Minimal Biochemical Set by Single Tube or Multitest Systems)
Lysine
Decarboxylase
Broth
Tryptophane
Broth
Malonate
Broth
Phenylalanine
Deaminase
Broth
Phenol Red
Dulcitol
Broth
SEROLOGICAL VERIFICATION
Polyvalent 0
Vi
Polyvalent H
Confirmation by a
Reference Laboratory
FIGURE lll-E-1. Schemeforthe Concentration, Isolation and Identification of Salmonella.
156
MICROBIOLOGICAL MANUAL 1978
image:
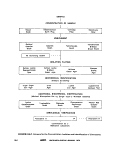 SAMPLE
CONCENTRATION OF SAMPLE
ENRICHMENT
Dulcitol
Selenite
Broth
Tetrathionate
Broth
ISOLATION PLATING
Xylose Lysine
Desoxycholate
Agar
Brilliant
Green
Agar
BIOCHEMICAL IDENTIFICATION
(Primary Screening)
Triple Sugar
Iron Agar
Urea
Agar
ADDITIONAL BIOCHEMICAL IDENTIFICATION
(Multitest System)
SEROLOGICAL VERIFICATION
Polyvalent O
FIGURE lll-E-2. Simplified Scheme for Concentration, Isolation and Identification
of Salmonella.
SALMONELLA
157
image:
SAMPLE
CONCENTRATION OF SAMPLE
ENRICHMENT
Dulcitol
Selenite
Broth
Tetrathionate
Broth
ISOLATION PLATING
Xylose Lysine
Desoxycholate
Agar
Brilliant
Green
Agar
BIOCHEMICAL IDENTIFICATION
(Primary Screening)
Triple Sugar
Iron Agar
Urea
Agar
ADDITIONAL BIOCHEMICAL IDENTIFICATION
(Multitest System)
SEROLOGICAL VERIFICATION
Polyvalent O
FIGURE lll-E-2. Simplified Scheme for Concentration, Isolation and Identification
of Salmonella.
SALMONELLA
157
image:
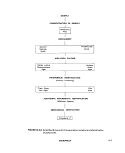 23 cm
E
o
O
e
u
U>
fO
FIGURE lll-E-3. Dimensions of the Gauze Swabs.
158
MICROBIOLOGICAL MANUAL 1978
image:
23 cm
E
o
O
e
u
U>
fO
FIGURE lll-E-3. Dimensions of the Gauze Swabs.
158
MICROBIOLOGICAL MANUAL 1978
image:
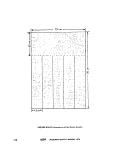 16, GAUGE WIRE
FINGERS
OF SWAB
FIGURE III-E-4. The Gauze Swab in Position.
SALMONELLA
159
image:
16, GAUGE WIRE
FINGERS
OF SWAB
FIGURE III-E-4. The Gauze Swab in Position.
SALMONELLA
159
image:
 (f) After the exposure period, retrieve the
swab and place it directly into a sterile plastic
bag (Whirl-Pale), ice and return to the labora-
tory for examination. See enrichment step
3.4.1. Alternatively, the swabs may be placed
in enrichment media and incubated on-site,
then iced and returned to the central
laboratory.
2.2 Diatomaceous Earth Technique
2.2.1 Summary: The filtering action of dia-
tomaceous earth is used to concentrate the
organisms (4). Diatomaceous earth is loosely
packed on top of an absorbent pad in the
funnel of an assembled membrane filtration
unit One to two liters of a water sample are
passed through the diatomaceous earth using
vacuum and portions of the diatomaceous
earth plug are added aseptically to enrichment
broth.
(e) Safety trap flask between the filtering
flask and the vacuum source.
(f) Sterile spatula.
(g) Forceps.
(h) Sterile graduated cylinders, 1000 ml
size, covered with aluminum foil or kraft paper.
(i) Containers for glass pipets.
0) Sterile absorbent pads of cellulosic pa-
per, 47 mm in diameter.
(k) Sterile T.D., 10 ml Mohr pipets, glass or
plastic.
(1) Rinse water, sterile phosphate buffered
water, prepared in large volumes. See Part II-B,
7 for preparation.
2.2.2 Scope and Application
2.2.4 Procedure
(a) Advantages: Although it is not enumer-
ative, this method is quantitative in the sense
that known volumes of water or wastewater
are filtered through the diatomaceous earth.
(b) Limitations: The diatomaceous earth
filter Is easily clogged with the suspended
material found in turbid waters. This slows the
filtering process but may not prevent its use.
Also salmonellae may pass through due to
improper formation of the diatomaceous filter.
^•2.3 Apparatus and Materials
(a) Diatomaceous earth (Johns-Manville's
"Celite" or equivalent).
(b) Sterile membrane filter unit (filter base
and funnel), plastic, glass or stainless steel,
wrapped with aluminum foil or kraft paper.
(c) Vacuum source.
(d) Vacuum flask, 2-liter, to hold the filter
base, with appropriate tubing. An alternative is
a commercially-available manifold.
(a) Assemble the membrane filter unit, sub-
stituting an absorbent pad for the membrane
filter.
(b) With the funnel in place, loosely pack
approximately 2.5 cm thickness of diatoma-
ceous earth on top of the absorbent pad.
(c) Add enough sterile buffered water with
a 10 ml pipet to saturate the diatomaceous
earth. Draw water through filter under vacuum
(d) Filter 1 liter or more of the sample
under vacuum. The volume of sample filtered
will depend upon the estimated amount of
pollution in the water or wastewater.
(e) Rinse the funnel at least twice after
sample filtration with 20-30 ml of the rinse
water.
(f) Remove the funnel. Add the absorbent
pad, the diatomaceous earth plug or halves
of each to flasks of selected enrichment broths,
See the enrichment step 3.4.2.
160
&EPA MICROBIOLOGICAL MANUAL 1978
image:
(f) After the exposure period, retrieve the
swab and place it directly into a sterile plastic
bag (Whirl-Pale), ice and return to the labora-
tory for examination. See enrichment step
3.4.1. Alternatively, the swabs may be placed
in enrichment media and incubated on-site,
then iced and returned to the central
laboratory.
2.2 Diatomaceous Earth Technique
2.2.1 Summary: The filtering action of dia-
tomaceous earth is used to concentrate the
organisms (4). Diatomaceous earth is loosely
packed on top of an absorbent pad in the
funnel of an assembled membrane filtration
unit One to two liters of a water sample are
passed through the diatomaceous earth using
vacuum and portions of the diatomaceous
earth plug are added aseptically to enrichment
broth.
(e) Safety trap flask between the filtering
flask and the vacuum source.
(f) Sterile spatula.
(g) Forceps.
(h) Sterile graduated cylinders, 1000 ml
size, covered with aluminum foil or kraft paper.
(i) Containers for glass pipets.
0) Sterile absorbent pads of cellulosic pa-
per, 47 mm in diameter.
(k) Sterile T.D., 10 ml Mohr pipets, glass or
plastic.
(1) Rinse water, sterile phosphate buffered
water, prepared in large volumes. See Part II-B,
7 for preparation.
2.2.2 Scope and Application
2.2.4 Procedure
(a) Advantages: Although it is not enumer-
ative, this method is quantitative in the sense
that known volumes of water or wastewater
are filtered through the diatomaceous earth.
(b) Limitations: The diatomaceous earth
filter Is easily clogged with the suspended
material found in turbid waters. This slows the
filtering process but may not prevent its use.
Also salmonellae may pass through due to
improper formation of the diatomaceous filter.
^•2.3 Apparatus and Materials
(a) Diatomaceous earth (Johns-Manville's
"Celite" or equivalent).
(b) Sterile membrane filter unit (filter base
and funnel), plastic, glass or stainless steel,
wrapped with aluminum foil or kraft paper.
(c) Vacuum source.
(d) Vacuum flask, 2-liter, to hold the filter
base, with appropriate tubing. An alternative is
a commercially-available manifold.
(a) Assemble the membrane filter unit, sub-
stituting an absorbent pad for the membrane
filter.
(b) With the funnel in place, loosely pack
approximately 2.5 cm thickness of diatoma-
ceous earth on top of the absorbent pad.
(c) Add enough sterile buffered water with
a 10 ml pipet to saturate the diatomaceous
earth. Draw water through filter under vacuum
(d) Filter 1 liter or more of the sample
under vacuum. The volume of sample filtered
will depend upon the estimated amount of
pollution in the water or wastewater.
(e) Rinse the funnel at least twice after
sample filtration with 20-30 ml of the rinse
water.
(f) Remove the funnel. Add the absorbent
pad, the diatomaceous earth plug or halves
of each to flasks of selected enrichment broths,
See the enrichment step 3.4.2.
160
&EPA MICROBIOLOGICAL MANUAL 1978
image:
 2,3 Membrane Filtration of Samples
2-3-1 Summary: The water or wastewater
sample is passed under positive pressure
through a 0.45 urn pore, 142 mm diameter
filter in a pressure filtration unit. After filtra-
tion, the membrane filter is aseptically divided
into portions that are added to enrichment
broths.
2.3.2 Scope and Application
(a) Advantages: Membrane filtration is
used when the sample volume desired is larger
than the 1-2 liters employed with the diatoma-
ceous earth technique, when the 5 day sample
period for the swab technique is not feasible,
or when the sample is not too turbid to permit
passage of the desired volume. The method is
useful for water of very low organic and panic-
ulate matter content. It is quantitative in that it
retains all cells from the filtration of a known
volume of water or wastewater.
^k) Limitations: Use of this technique is
somewhat limited because the sample may
clog pores and prevent filtration. Also, the limi-
tations of membrane filtration cited in Part II-C,
3.2.2, are applicable.
2.3.3 Apparatus and Materials
(a) Membrane filter holder, stainless steel,
142 mm, autoclavable for use in pressure fil-
tration. (Gelman Disc, Filter Holder, 11872,
Millipore SS Filter Holder, YY22 14200, or
equivalent).
(b) Dispensing pressure vessel, 10/12 liter
size. (Gelman 15108, Millipore XX67 00003,
or equivalent).
(c) Pressure pump, capable of maintaining
high pressure necessary for pressure filtration
(7 kg/cm2 maximum pressure).
(d) Forceps, with smooth tips.
(e) Sterile shears to divide membrane.
(f) Dilution water, phosphate buffered, pre-
pared in large volumes.
(g) Membrane filter, white, grid-marked,
142 mm in diameter with 0.45 + 0.02 pn
pore size.
(h) Prefilter (Millipore AP15-142-50 or
equivalent).
2.3.4 Procedure
(a) Aseptically add the sterile membrane
filter to the sterile filter holder.
(b) Add a 2-20 liter sample to the dispens-
ing pressure vessel. The sample size is limited
by the level of solids or turbidity in the sample.
(c) If sample is turbid use a prefilter ahead
of the membrane filter.
(d) Using positive pressure, force the sam-
ple through the membrane filter.
(e) After filtration, the membrane and pre-
filters are added to enrichment media. See
enrichment step 3.4.3.
2.4 Cartridge Filter Technique (5)
2.4.1 Summary: The water or wastewater
sample is drawn under negative pressure
through a filter of borosilicate glass microfi-
bers bonded with epoxyHresin. The volume
filtered may be measured. After filtration, the
filter is placed aseptically into enrichment
broth.
2.4.2 Scope and Application
(a) Advantages: Because this technique
can be used to filter 20 liters or more of sam-
ple, it is applicable to waters with low concen-
trations of organisms. It can be combined with
an MPN procedure for a quantitative estimate
of bacterial density.
(b) Limitations: The presence of high num-
bers of background organisms may make re-
covery of Salmonella very difficult by this tech-
nique. The autoclave must be sufficiently large
to hold sample reservoir containers. As with
other filtration procedures, high turbidity in the
sample lengthens filtration time.
SALMONELLA
161
image:
2,3 Membrane Filtration of Samples
2-3-1 Summary: The water or wastewater
sample is passed under positive pressure
through a 0.45 urn pore, 142 mm diameter
filter in a pressure filtration unit. After filtra-
tion, the membrane filter is aseptically divided
into portions that are added to enrichment
broths.
2.3.2 Scope and Application
(a) Advantages: Membrane filtration is
used when the sample volume desired is larger
than the 1-2 liters employed with the diatoma-
ceous earth technique, when the 5 day sample
period for the swab technique is not feasible,
or when the sample is not too turbid to permit
passage of the desired volume. The method is
useful for water of very low organic and panic-
ulate matter content. It is quantitative in that it
retains all cells from the filtration of a known
volume of water or wastewater.
^k) Limitations: Use of this technique is
somewhat limited because the sample may
clog pores and prevent filtration. Also, the limi-
tations of membrane filtration cited in Part II-C,
3.2.2, are applicable.
2.3.3 Apparatus and Materials
(a) Membrane filter holder, stainless steel,
142 mm, autoclavable for use in pressure fil-
tration. (Gelman Disc, Filter Holder, 11872,
Millipore SS Filter Holder, YY22 14200, or
equivalent).
(b) Dispensing pressure vessel, 10/12 liter
size. (Gelman 15108, Millipore XX67 00003,
or equivalent).
(c) Pressure pump, capable of maintaining
high pressure necessary for pressure filtration
(7 kg/cm2 maximum pressure).
(d) Forceps, with smooth tips.
(e) Sterile shears to divide membrane.
(f) Dilution water, phosphate buffered, pre-
pared in large volumes.
(g) Membrane filter, white, grid-marked,
142 mm in diameter with 0.45 + 0.02 pn
pore size.
(h) Prefilter (Millipore AP15-142-50 or
equivalent).
2.3.4 Procedure
(a) Aseptically add the sterile membrane
filter to the sterile filter holder.
(b) Add a 2-20 liter sample to the dispens-
ing pressure vessel. The sample size is limited
by the level of solids or turbidity in the sample.
(c) If sample is turbid use a prefilter ahead
of the membrane filter.
(d) Using positive pressure, force the sam-
ple through the membrane filter.
(e) After filtration, the membrane and pre-
filters are added to enrichment media. See
enrichment step 3.4.3.
2.4 Cartridge Filter Technique (5)
2.4.1 Summary: The water or wastewater
sample is drawn under negative pressure
through a filter of borosilicate glass microfi-
bers bonded with epoxyHresin. The volume
filtered may be measured. After filtration, the
filter is placed aseptically into enrichment
broth.
2.4.2 Scope and Application
(a) Advantages: Because this technique
can be used to filter 20 liters or more of sam-
ple, it is applicable to waters with low concen-
trations of organisms. It can be combined with
an MPN procedure for a quantitative estimate
of bacterial density.
(b) Limitations: The presence of high num-
bers of background organisms may make re-
covery of Salmonella very difficult by this tech-
nique. The autoclave must be sufficiently large
to hold sample reservoir containers. As with
other filtration procedures, high turbidity in the
sample lengthens filtration time.
SALMONELLA
161
image:
 2.4.3 Apparatus and Materials
(a) Vacuum purnp, capable of operation at
a pressure differential up to 69 kN/m2.
(b) Vacuum gauge.
(c) Water trap (heavy-walled flask or bottle,
with at least a 5-liter capacity) closed by a 2-
holed rubber stopper, with 2 short pieces of
glass tubing inserted.
(d) Glass and rubber vacuum tubing, with
shut-off valve.
(e) Optional for MPN technique: manifold,
capable of 5 simultaneous filtrations.
(f) Sterile, 20 liter, heavy-walled pyrex
glass carboy, calibrated from 1-20 liters (Corn-
Ing CWG No. 434490).
(g) Balston (Lexington, MA) type AA car-
tridge filter, 2.5 x 6.4 cm or equivalent and a
type 90 filter holder. Filters, filter holders and
tubing are wrapped and sterilized by autoclave
at 121 C for 15 minutes.
2,4.4 Procedure
(a) Connect the parts of the filtration appa-
ratus as depicted in Figure lll-E-5.
(b) Collect or transfer water sample to ster-
ile, calibrated container.
(c) Insert filter and filter holder into sample
container. Protect container from contamina-
tion by sealing glass tubing in neck of con-
tainer with sterile cotton and aluminum foil.
(d) Start vacuum pump and filter desired
volume of water. To avoid rupture of filter, the
pressure differential should not exceed 69
kN/m2.
(e) After filtering sample, aseptically re-
move filter and filter holder. Separate filter and
place in appropriate enrichment medium. See
3.4.4.
(f) Place another sterile filter in the filter
holder and repeat filtration procedure.
(g) When a new sample is to be filtered,
replace glass tubing, filter, filter holder and
sample container with new sterile units.
3. Primary Enrichment for Salmonella
Selenite and tetrathionate broths are used
for primary enrichment. The selenite may be
combined with dulcito! to improve the selectiv-
ity for salmonellae. The tetrathionate may be
used as a broth base alone or combined with
brilliant green dye which enhances its selectiv-
ity for salmonellae other than S. typhi.
3.1 Summary: After concentration of sal-
monellae, the gauze swabs, diatomaceous
earth plugs, membrane filters or cartridge fil-
ters are placed in flasks of selenite, tetrathion-
ate or other selected broth. The broth encour-
ages salmonellae to grow white inhibiting
other bacteria. Multiple flasks of the enrich-
ment broth are incubated for 3-4 days at se-
lected temperatures. After incubation, cultures
are streaked onto differential plating media for
salmonellae isolation. These differential plates
should be streaked from the enrichment media
every 24 hours over a 3-4 day period.
3.2 Scope and Application
3.2.1 Advantages: The enrichment me-
thods described provide an optimal environ-
ment for salmonellae and other enteric patho-
gens, and to some extent suppress the other
organisms that are present.
3.2.2 Limitations: Although enrichment
broths provide an optimal environment for sal-
monellae development, recovery is not quanti-
tative.
3.3 Apparatus and Materials
3.3.1 Incubators set at 35 ± 0.5 C, 41.5 ±
0.5 C, and optionally at 37 ± 0.5 and 43 ± 0.5
C.
3.3.2 Sterile shears and spatula.
3.3.3 Sterile forceps.
162
MICROBIOLOGICAL MANUAL 1978
image:
2.4.3 Apparatus and Materials
(a) Vacuum purnp, capable of operation at
a pressure differential up to 69 kN/m2.
(b) Vacuum gauge.
(c) Water trap (heavy-walled flask or bottle,
with at least a 5-liter capacity) closed by a 2-
holed rubber stopper, with 2 short pieces of
glass tubing inserted.
(d) Glass and rubber vacuum tubing, with
shut-off valve.
(e) Optional for MPN technique: manifold,
capable of 5 simultaneous filtrations.
(f) Sterile, 20 liter, heavy-walled pyrex
glass carboy, calibrated from 1-20 liters (Corn-
Ing CWG No. 434490).
(g) Balston (Lexington, MA) type AA car-
tridge filter, 2.5 x 6.4 cm or equivalent and a
type 90 filter holder. Filters, filter holders and
tubing are wrapped and sterilized by autoclave
at 121 C for 15 minutes.
2,4.4 Procedure
(a) Connect the parts of the filtration appa-
ratus as depicted in Figure lll-E-5.
(b) Collect or transfer water sample to ster-
ile, calibrated container.
(c) Insert filter and filter holder into sample
container. Protect container from contamina-
tion by sealing glass tubing in neck of con-
tainer with sterile cotton and aluminum foil.
(d) Start vacuum pump and filter desired
volume of water. To avoid rupture of filter, the
pressure differential should not exceed 69
kN/m2.
(e) After filtering sample, aseptically re-
move filter and filter holder. Separate filter and
place in appropriate enrichment medium. See
3.4.4.
(f) Place another sterile filter in the filter
holder and repeat filtration procedure.
(g) When a new sample is to be filtered,
replace glass tubing, filter, filter holder and
sample container with new sterile units.
3. Primary Enrichment for Salmonella
Selenite and tetrathionate broths are used
for primary enrichment. The selenite may be
combined with dulcito! to improve the selectiv-
ity for salmonellae. The tetrathionate may be
used as a broth base alone or combined with
brilliant green dye which enhances its selectiv-
ity for salmonellae other than S. typhi.
3.1 Summary: After concentration of sal-
monellae, the gauze swabs, diatomaceous
earth plugs, membrane filters or cartridge fil-
ters are placed in flasks of selenite, tetrathion-
ate or other selected broth. The broth encour-
ages salmonellae to grow white inhibiting
other bacteria. Multiple flasks of the enrich-
ment broth are incubated for 3-4 days at se-
lected temperatures. After incubation, cultures
are streaked onto differential plating media for
salmonellae isolation. These differential plates
should be streaked from the enrichment media
every 24 hours over a 3-4 day period.
3.2 Scope and Application
3.2.1 Advantages: The enrichment me-
thods described provide an optimal environ-
ment for salmonellae and other enteric patho-
gens, and to some extent suppress the other
organisms that are present.
3.2.2 Limitations: Although enrichment
broths provide an optimal environment for sal-
monellae development, recovery is not quanti-
tative.
3.3 Apparatus and Materials
3.3.1 Incubators set at 35 ± 0.5 C, 41.5 ±
0.5 C, and optionally at 37 ± 0.5 and 43 ± 0.5
C.
3.3.2 Sterile shears and spatula.
3.3.3 Sterile forceps.
162
MICROBIOLOGICAL MANUAL 1978
image:
 3.3.4 Sterile beakers, 500 ml size covered
with aluminum foil or kraft paper,
3.3.5 Sterile erlenmeyer flasks, 125 ml
size, to hold 50 ml of enrichment broth.
3.3.6 Bunsen, Fisher burner or electric
incinerator.
3.3,7 Sterile petri dish.
3.3.8 Sterile aluminum foil.
3.3.9 Alcohol, 95% ethanol, in a vial
3.3.10 Media
(a) Selenite broth (Difco 0275, BBL
11608, or equivalent), (See Part II-B, 5.5,1).
(b) Tetrathionate broth (Difco 0104, BBL
11706, or equivalent). (See Part II-B, 5.5.2).
(c) Dulcitol selenite broth (see Part II-B,
5.5.3).
(d) Tetrathionate brilliant green broth
(same as (b) above with the addition of 0.01
gram of brilliant green per liter of medium).
(See Part II-B, 5,5.4).
3.4 Procedures for Enrichment
Select at least two enrichment media,
preferably one selenite and one tetrathionate
type, for each sample, The actual choice of
medium is based on the experience of the
analyst.
Selenite and tetrathionate enrichment
broths are useful for all Salmonella including
S. typhi. Although the addition of brilliant
green to tetrathionate broth base increases its
selectivity for salmonellae, it inhibits the recov-
ery of S, typhi. It is reported that tetrathionate
broth is toxic to salmonellae at a temperature
of 43 C (6). Dulcitol selenite medium may not
completely recover S. typhi, S. cholerae-suis,
S. enteritidis bioserotypes Paratyphi A and
Pullorum, from some samples because these
species ferment dulcitol slowly (7).
3.4.1 The Gauze Swab: Squeeze the gauze
swab in the plastic bag to express the liquid
from the swab into a sterile 500 ml beaker.
After this, the entire swab or portions of it may
be placed directly into the enrichment broth
using sterile forceps and shears to divide the
swab if necessary into the number of portions
required for the enrichment media to be used.
For example, 2 enrichment media incubated at
2 temperatures, 35 C and 43 C, would require
4 portions. The pieces of swab and measured
volumes of the liquid can be apportioned into
125 ml flasks containing 50 ml of enrichment
broth made double strength to compensate for
the dilution effect of liquid.
3-4.2 The Diatomaceous Earth Plug: Re-
move the diatomaceous earth plug from the
membrane filtration funnel by carefully tap-
ping the funnel on a sheet of sterile metal foil.
Tap the sides of the funnel and shake it gently
to dislodge the plug. Transfer the entire plug to
an enrichment broth or divide the plug into
halves using a sterile spatula. Add one half of
the plug to each 125 ml flask of medium used.
Inoculate at least 2 media in flasks containing
50 ml of sterile single-strength broth. Incubate
at 2 temperatures. Halve the absorbent pad
with sterile shears, and add a portion to each
of the previously inoculated flasks.
3.4.3 The Membrane'Filter: Remove the
membrane filter aseptically from the filter base
with sterile forceps, and hold over the bottom
of a sterile petri dish. Cut the membrane in
quarters with the sterile shears, and let the
quarters fall grid-side up into the petri dish
bottom. Insert aseptically each quarter of a
membrane filter into a 125 ml flask containing
50 ml of single-strength medium.
3-4.4 The Cartridge Filter: Remove the car-
tridge filter from the holder aseptically and
place in the selected enrichment medium.
More than I filter may be used in succession on
a single sample and placed in the same culture
medium. Repeat for the second enrichment
medium.
3.4.5 After inoculation in 3.4.1, 3.4.2,
3.4.3 or 3.4.4, incubate enrichment flasks at
35 C, 41.5 C and other selected temperatures
SALMONELLA
163
image:
3.3.4 Sterile beakers, 500 ml size covered
with aluminum foil or kraft paper,
3.3.5 Sterile erlenmeyer flasks, 125 ml
size, to hold 50 ml of enrichment broth.
3.3.6 Bunsen, Fisher burner or electric
incinerator.
3.3,7 Sterile petri dish.
3.3.8 Sterile aluminum foil.
3.3.9 Alcohol, 95% ethanol, in a vial
3.3.10 Media
(a) Selenite broth (Difco 0275, BBL
11608, or equivalent), (See Part II-B, 5.5,1).
(b) Tetrathionate broth (Difco 0104, BBL
11706, or equivalent). (See Part II-B, 5.5.2).
(c) Dulcitol selenite broth (see Part II-B,
5.5.3).
(d) Tetrathionate brilliant green broth
(same as (b) above with the addition of 0.01
gram of brilliant green per liter of medium).
(See Part II-B, 5,5.4).
3.4 Procedures for Enrichment
Select at least two enrichment media,
preferably one selenite and one tetrathionate
type, for each sample, The actual choice of
medium is based on the experience of the
analyst.
Selenite and tetrathionate enrichment
broths are useful for all Salmonella including
S. typhi. Although the addition of brilliant
green to tetrathionate broth base increases its
selectivity for salmonellae, it inhibits the recov-
ery of S, typhi. It is reported that tetrathionate
broth is toxic to salmonellae at a temperature
of 43 C (6). Dulcitol selenite medium may not
completely recover S. typhi, S. cholerae-suis,
S. enteritidis bioserotypes Paratyphi A and
Pullorum, from some samples because these
species ferment dulcitol slowly (7).
3.4.1 The Gauze Swab: Squeeze the gauze
swab in the plastic bag to express the liquid
from the swab into a sterile 500 ml beaker.
After this, the entire swab or portions of it may
be placed directly into the enrichment broth
using sterile forceps and shears to divide the
swab if necessary into the number of portions
required for the enrichment media to be used.
For example, 2 enrichment media incubated at
2 temperatures, 35 C and 43 C, would require
4 portions. The pieces of swab and measured
volumes of the liquid can be apportioned into
125 ml flasks containing 50 ml of enrichment
broth made double strength to compensate for
the dilution effect of liquid.
3-4.2 The Diatomaceous Earth Plug: Re-
move the diatomaceous earth plug from the
membrane filtration funnel by carefully tap-
ping the funnel on a sheet of sterile metal foil.
Tap the sides of the funnel and shake it gently
to dislodge the plug. Transfer the entire plug to
an enrichment broth or divide the plug into
halves using a sterile spatula. Add one half of
the plug to each 125 ml flask of medium used.
Inoculate at least 2 media in flasks containing
50 ml of sterile single-strength broth. Incubate
at 2 temperatures. Halve the absorbent pad
with sterile shears, and add a portion to each
of the previously inoculated flasks.
3.4.3 The Membrane'Filter: Remove the
membrane filter aseptically from the filter base
with sterile forceps, and hold over the bottom
of a sterile petri dish. Cut the membrane in
quarters with the sterile shears, and let the
quarters fall grid-side up into the petri dish
bottom. Insert aseptically each quarter of a
membrane filter into a 125 ml flask containing
50 ml of single-strength medium.
3-4.4 The Cartridge Filter: Remove the car-
tridge filter from the holder aseptically and
place in the selected enrichment medium.
More than I filter may be used in succession on
a single sample and placed in the same culture
medium. Repeat for the second enrichment
medium.
3.4.5 After inoculation in 3.4.1, 3.4.2,
3.4.3 or 3.4.4, incubate enrichment flasks at
35 C, 41.5 C and other selected temperatures
SALMONELLA
163
image:
 for at least 24 hours. However, some salmonel-
lae are slow-growing and recovery may be
increased by incubating for successive 24-
hour periods up to 96 hours before streaking
on isolation agars,
3.4.6 If a sample must be collected in an
area some distance from the central laboratory
responsible for Salmonella identifications, the
scheme can be interrupted at different points.
First, the samples can be concentrated, iced
and transported back to the central laboratory.
Second, the samples can be concentrated,
placed in enrichment media, incubated at the
selected temperature for 18-24 hours at a field
laboratory then iced and transported to the
central laboratory.
3.5 Incubation Temperature as a Selec-
tion Technique for Salmonellae
3.5,1 Historically 37 C has been used for
the isolation of enteric microorganisms be-
cause it Is representative of the gut tempera-
ture of humans and other warm-blooded
animals. This temperature was considered
optimal for the detection and isolation of
these enterics.
3.5.2 Some workers have used 35 C in
place of 37 C because the latter temperature is
close to the upper tolerance limit for the group
and might prevent the growth of some desired
species. This inhibitory effect would be most
significant if the 37 C temperature were not
well-controlled and might be exceeded by 2-3 C.
Consequently, double temperatures of 35 C and
37 C came into common usage (1, 8) for isola-
tion and identification of Enterobacteriaceae.
3.5.3 Because the large populations of
normal gut microorganisms interfere with the
Isolation of pathogens such as Salmonella
from humans and other warm-blooded ani-
mals, temperatures above 37 C were proposed
to reduce the background microorganisms.
3.5.4 The 43 C temperature was proposed
as an aid to the isolation of Salmonella, partic-
ularly from various heavily contaminated ma-
terials (9, 10). The 41.5 C temperature has
been recommended by others for the detec-
tion and isolation of Salmonella from water
(11, 12, 13),
3.5.5 Although investigators have used
different elevated temperatures, the results
are inconclusive for a single incubation tem-
perature. The general conclusion of most stud-
ies on comparison of recoveries of salmonel-
lae at different incubation temperatures is that
a greater number of isolates and more species
are isolated at 41-43 C than at 35-37 C (9,
14-19). This manual recommends two temper-
atures in enrichment and isolation procedures
for Salmonella, 35 C and 41.5 C.
Optional Fluorescent Antibody Screening
Technique
The FA technique is a rapid screening me-
thod that can be used after primary enrich-
ment but it is tentative and optional. The de-
tailed procedure Is described in Part III-E, 8
following the conventional methods for detec-
tion and identification of Salmonella,
4. Isolation of Salmonella
4.1 Summary: The organisms that de-
velop in the primary enrichment broth media
are isolated and differentiated on solid media.
The enriched cultures are streaked every 24
hours for 3-4 days onto the surface of XLD,
BG, XLBG and bismuth sulfite media. After
incubation, the plates are examined for typical
colonies of salmonellae which are picked and
characterized biochemically and serologically.
4.2 Scope and Application
4.2.1 Advantages: Pure cultures of Salmo-
nella can be isolated by the careful selection
and use of plating media and incubation tem-
peratures. Brilliant green agar is favored for
the development and identification of salmo-
nellae except for S. typhi and a few other
species whereas bismuth sulfite agar allows
the growth of most Salmonella including S.
typhi.
4.2.2 Limitations: Bacteria other than sal-
monellae may compete with the salmonellae
164
©EPA MICROBIOLOGICAL MANUAL 1978
image:
for at least 24 hours. However, some salmonel-
lae are slow-growing and recovery may be
increased by incubating for successive 24-
hour periods up to 96 hours before streaking
on isolation agars,
3.4.6 If a sample must be collected in an
area some distance from the central laboratory
responsible for Salmonella identifications, the
scheme can be interrupted at different points.
First, the samples can be concentrated, iced
and transported back to the central laboratory.
Second, the samples can be concentrated,
placed in enrichment media, incubated at the
selected temperature for 18-24 hours at a field
laboratory then iced and transported to the
central laboratory.
3.5 Incubation Temperature as a Selec-
tion Technique for Salmonellae
3.5,1 Historically 37 C has been used for
the isolation of enteric microorganisms be-
cause it Is representative of the gut tempera-
ture of humans and other warm-blooded
animals. This temperature was considered
optimal for the detection and isolation of
these enterics.
3.5.2 Some workers have used 35 C in
place of 37 C because the latter temperature is
close to the upper tolerance limit for the group
and might prevent the growth of some desired
species. This inhibitory effect would be most
significant if the 37 C temperature were not
well-controlled and might be exceeded by 2-3 C.
Consequently, double temperatures of 35 C and
37 C came into common usage (1, 8) for isola-
tion and identification of Enterobacteriaceae.
3.5.3 Because the large populations of
normal gut microorganisms interfere with the
Isolation of pathogens such as Salmonella
from humans and other warm-blooded ani-
mals, temperatures above 37 C were proposed
to reduce the background microorganisms.
3.5.4 The 43 C temperature was proposed
as an aid to the isolation of Salmonella, partic-
ularly from various heavily contaminated ma-
terials (9, 10). The 41.5 C temperature has
been recommended by others for the detec-
tion and isolation of Salmonella from water
(11, 12, 13),
3.5.5 Although investigators have used
different elevated temperatures, the results
are inconclusive for a single incubation tem-
perature. The general conclusion of most stud-
ies on comparison of recoveries of salmonel-
lae at different incubation temperatures is that
a greater number of isolates and more species
are isolated at 41-43 C than at 35-37 C (9,
14-19). This manual recommends two temper-
atures in enrichment and isolation procedures
for Salmonella, 35 C and 41.5 C.
Optional Fluorescent Antibody Screening
Technique
The FA technique is a rapid screening me-
thod that can be used after primary enrich-
ment but it is tentative and optional. The de-
tailed procedure Is described in Part III-E, 8
following the conventional methods for detec-
tion and identification of Salmonella,
4. Isolation of Salmonella
4.1 Summary: The organisms that de-
velop in the primary enrichment broth media
are isolated and differentiated on solid media.
The enriched cultures are streaked every 24
hours for 3-4 days onto the surface of XLD,
BG, XLBG and bismuth sulfite media. After
incubation, the plates are examined for typical
colonies of salmonellae which are picked and
characterized biochemically and serologically.
4.2 Scope and Application
4.2.1 Advantages: Pure cultures of Salmo-
nella can be isolated by the careful selection
and use of plating media and incubation tem-
peratures. Brilliant green agar is favored for
the development and identification of salmo-
nellae except for S. typhi and a few other
species whereas bismuth sulfite agar allows
the growth of most Salmonella including S.
typhi.
4.2.2 Limitations: Bacteria other than sal-
monellae may compete with the salmonellae
164
©EPA MICROBIOLOGICAL MANUAL 1978
image:
 on the secondary differential media, thus inter-
fering with their isolation and identification.
The use of brilliant green agar at an elevated
temperature of 41.5 C reduces the number of
interfering organisms, but also inhibits devel-
opment of some serotypes of Salmonella.
4.3 Apparatus and Materials
4.3.1 incubators set at 35 ± 0.5 C, 41.5 ±
0.5 C, and optionally at 37 ± 0.5 C and 43 ±
0.5 C.
4.3.2 Water bath set at 44-46 C for tem-
pering agar.
4.3.3 Petri dish canisters for glass petri
dishes.
4.3.4 Thermometer certified by National
Bureau of Standards or one of equivalent
accuracy.
4.3.5 Inoculating needle and 3 mm loop.
4.3.6 Colony Counter, Quebec darkfield
model orequivalent.
4.3.7 Bunsen/Fisher burner, or electric
incinerator.
4.3.8 Sterile 100 mm x 15 mm petri
dishes, glass or plastic.
4.3.9 Sterile phosphate buffered or
peptone dilution water in bottles, 99 ± 2 ml
volumes (see Part II-B, 7 for preparation).
4.4 Media: The following agar media are
dispensed in bulk quantities in screw-capped
bottles or flasks. (See Part II-B, 4 for
preparation).
4.4.1 Xylose lysine desoxycholate (XLD)
agar(see Part II-B, 5.5.7).
4.4.2 Brilliant green (BG) agar (see Part II-
8,5.5.5).
4.4.3 Xylose lysine brilliant green (XLBG)
agar (see Part II-B; 5.5.6).
4.4.4 Bismuth sulfite agar (see Part II-B,
5.5.8).
4.S Procedure
4.5.1 Prepare two selected media {XLD,
BG, XLBG or bismuth sulfite agars) in petri
dishes. As a minimum xylose lysine desoxy-
cholate (XLD) and brilliant green (BG) or xylose
lysine brilliant green (XLBG) agars are recom-
mended. Bismuth sulfite agar permits the pre-
sumptive detection of S. typhi and/or S.
enteriditis.
4.5.2 Streak the surface of a previously
poured and solidified agar with a loopful of the
enrichment culture.
4.5.3 Duplicate plates should be streaked
from each enrichment culture every 24 hours
for 3-4 days.
4.5.4 Inoculate duplicate plates from each
enrichment culture and incubate, one each, at
35 C and 41.5 C (and optionally at 37 C and 43
C). Incubate the XLD and XLBG plates for 24
hours, and the BG agar and bismuth sulfite
agar plates for 48 hours.
4.5.5 After incubation, examine plates for
colony appearance. Table lll-E-1 describes the
appearance of colonies on XLD, XLBG, BG and
bismuth sulfite agars. The salmonellae colo-
nies on BG agar are pinkish white with a red
background. Lactose fermenters will form
greenish colonies or other colorations. Occa-
sionally, slow lactose fermenters such as Pro-
teus, Citrobacter, Pseudomonas and Aeromo-
nas mimic Salmonella.
4.5.6 Pick growth from the centers of well-
isolated colonies that have the characteristic
appearance of salmonellae, and streak onto
the screening media described in This Section,
5.4.1 and 5.5.1. Isolated, single colonies from
a plate where all colonies appear alike may be
assumed to be pure. At least 2 colonies of each
type suspected to be Salmonella should be
picked.
4.5.7 The suspected colonies of Salmo-
nella should now be characterized by the sin-
SALMONELLA
165
image:
on the secondary differential media, thus inter-
fering with their isolation and identification.
The use of brilliant green agar at an elevated
temperature of 41.5 C reduces the number of
interfering organisms, but also inhibits devel-
opment of some serotypes of Salmonella.
4.3 Apparatus and Materials
4.3.1 incubators set at 35 ± 0.5 C, 41.5 ±
0.5 C, and optionally at 37 ± 0.5 C and 43 ±
0.5 C.
4.3.2 Water bath set at 44-46 C for tem-
pering agar.
4.3.3 Petri dish canisters for glass petri
dishes.
4.3.4 Thermometer certified by National
Bureau of Standards or one of equivalent
accuracy.
4.3.5 Inoculating needle and 3 mm loop.
4.3.6 Colony Counter, Quebec darkfield
model orequivalent.
4.3.7 Bunsen/Fisher burner, or electric
incinerator.
4.3.8 Sterile 100 mm x 15 mm petri
dishes, glass or plastic.
4.3.9 Sterile phosphate buffered or
peptone dilution water in bottles, 99 ± 2 ml
volumes (see Part II-B, 7 for preparation).
4.4 Media: The following agar media are
dispensed in bulk quantities in screw-capped
bottles or flasks. (See Part II-B, 4 for
preparation).
4.4.1 Xylose lysine desoxycholate (XLD)
agar(see Part II-B, 5.5.7).
4.4.2 Brilliant green (BG) agar (see Part II-
8,5.5.5).
4.4.3 Xylose lysine brilliant green (XLBG)
agar (see Part II-B; 5.5.6).
4.4.4 Bismuth sulfite agar (see Part II-B,
5.5.8).
4.S Procedure
4.5.1 Prepare two selected media {XLD,
BG, XLBG or bismuth sulfite agars) in petri
dishes. As a minimum xylose lysine desoxy-
cholate (XLD) and brilliant green (BG) or xylose
lysine brilliant green (XLBG) agars are recom-
mended. Bismuth sulfite agar permits the pre-
sumptive detection of S. typhi and/or S.
enteriditis.
4.5.2 Streak the surface of a previously
poured and solidified agar with a loopful of the
enrichment culture.
4.5.3 Duplicate plates should be streaked
from each enrichment culture every 24 hours
for 3-4 days.
4.5.4 Inoculate duplicate plates from each
enrichment culture and incubate, one each, at
35 C and 41.5 C (and optionally at 37 C and 43
C). Incubate the XLD and XLBG plates for 24
hours, and the BG agar and bismuth sulfite
agar plates for 48 hours.
4.5.5 After incubation, examine plates for
colony appearance. Table lll-E-1 describes the
appearance of colonies on XLD, XLBG, BG and
bismuth sulfite agars. The salmonellae colo-
nies on BG agar are pinkish white with a red
background. Lactose fermenters will form
greenish colonies or other colorations. Occa-
sionally, slow lactose fermenters such as Pro-
teus, Citrobacter, Pseudomonas and Aeromo-
nas mimic Salmonella.
4.5.6 Pick growth from the centers of well-
isolated colonies that have the characteristic
appearance of salmonellae, and streak onto
the screening media described in This Section,
5.4.1 and 5.5.1. Isolated, single colonies from
a plate where all colonies appear alike may be
assumed to be pure. At least 2 colonies of each
type suspected to be Salmonella should be
picked.
4.5.7 The suspected colonies of Salmo-
nella should now be characterized by the sin-
SALMONELLA
165
image:
 TABLE III-E-1
Colonial Appearance of Salmonella and Other Enterics on Isolation Media
Colony Appearance
Salmonella
Other Enterics
1, Bismuth Sulfite Agar
Round jet black colonies
with or without sheen
5. typhi
S. enteritidis ser
Enteritidis
S, enteritidis ser
Schottmuelleri
Flat or slightly raised
green colonies
S. enteritidis ser
Typhimurium
S. enteritidis bioser
Paratyphyi
5. choleraa-suis
Proteus spp.
2. Brilliant Green Agar
Slightly pink-white,
opaque colonies surrounded
by brilliant red medium
Salmonella spp
Yellow-green colonies
surrounded by yellow-green
zone
Escherichia, Klebsiella,
Proteus spp. (lactose or
sucrose fermenters)
3. XLD or XLBG Agar
Red, black centered colonies
Red colonies
Yellow colonies
Salmonella spp.
Shigella spp.
Escherichia spp.
and biotypes
Citrobacter spp.
Klebsiella spp.
Enterobacter spp.
Proteus spp.
166
MICROBIOLOGICAL MANUAL 1978
image:
TABLE III-E-1
Colonial Appearance of Salmonella and Other Enterics on Isolation Media
Colony Appearance
Salmonella
Other Enterics
1, Bismuth Sulfite Agar
Round jet black colonies
with or without sheen
5. typhi
S. enteritidis ser
Enteritidis
S, enteritidis ser
Schottmuelleri
Flat or slightly raised
green colonies
S. enteritidis ser
Typhimurium
S. enteritidis bioser
Paratyphyi
5. choleraa-suis
Proteus spp.
2. Brilliant Green Agar
Slightly pink-white,
opaque colonies surrounded
by brilliant red medium
Salmonella spp
Yellow-green colonies
surrounded by yellow-green
zone
Escherichia, Klebsiella,
Proteus spp. (lactose or
sucrose fermenters)
3. XLD or XLBG Agar
Red, black centered colonies
Red colonies
Yellow colonies
Salmonella spp.
Shigella spp.
Escherichia spp.
and biotypes
Citrobacter spp.
Klebsiella spp.
Enterobacter spp.
Proteus spp.
166
MICROBIOLOGICAL MANUAL 1978
image:
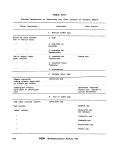 gle biochemical tests or muititests in Partlll-E,
5.6. An 0-1 bacteriophage screening test may
also be used on the isolate for a rapid (4-5
hours) determination of the tentative identifi-
cation of Salmonella, Results must be verified
(20,21).
5. Biochemical Identification of Salmonella
5,1 Summary: Salmonellae can be identi-
fied to genus by determining their reactions in a
series of biochemical tests. These tests can be
made in single tube media or in commercial
multitest systems. This Section offers the mini-
mal required set of tests, a series of additional,
optional tests and a brief description of available
multitest systems. These tests require specific
training for valid results.
5.2 Scope and Application
5.2.1 Advantages: The biochemical reac-
tions characterize the Salmonella-like isolate,
permit a separation from closely related bacte-
ria, and provide presumptive identification as
Salmonella. Confirmed identification requires
additional serological tests.
The multitest systems have a number of
advantages over single tube media prepared
in the laboratory:
(a) The different .designs of these systems
permit the user to select tests to fit his needs,
facilities and budget.
(b) The multitest systems may be used with
confidence in the laboratory or in field situa-
tions as rapid and convenient screening me-
thods for cultures suspected to be Salmonella.
Large numbers of cultures can be examined in
a relatively short time; and those tentatively
identified as Salmonella can then be held for
later serological confirmation.
(c) These systems offer the advantages of
minimal space requirements, immediate avail-
ability, and economy when compared with the
preparation and use of tubed media. They are
ideally suited to field work and to small labora-
tories that do not routinely perform these iden-
tification tests.
(d) The systems offer these same advan-
tages for the identification and differentation of
other enteric bacteria such as E. cofi, Klebsiella,
Enterobacter, Citrobacter and Shigella.
5.2.2 Limitations: Whether accomplished
by individual tube or multitest methods, bio-
chemical identification of large numbers of
cultures is expensive and time-consuming. It
should not be attempted independently with-
out previous training and experience in read-
ing reactions and interpreting results.
5.3 Apparatus and Materials
5.3.1 Incubator set at 35 ±0.5 C.
5.3.2 Bunsen/Fisher burner, or electric
incinerator.
5.3.3 Inoculating needle and loop.
5.3.4 Culture tubes, 100 * 13 or 150 x
20 mm.
5.3.5 Fermentation tubes, 75 X 1Omm.
5.3.6 Closures to fit culture tubes.
5.3.7 Thermometer certified by National
Bureau of Standards, or one of equivalent
accuracy.
5.4 Media
6.4.1 Screening Media
(a) Triple Sugar Iron Agar (TSI) (Difco
0265, BBL 1 1749). See Part II-B, 5.5.9.
(b) Lysine Iron Agar (LIA) (Difco 0849, BBL
11363). See Part II-B, 5.5.10.
(c) Motility Sulfide Medium (Difco 0450).
See Part II-B, 5.5.16,
(d) Urea Agar Base Concentrate (Difco
0284). See Part II-B, 5.5.11.
SALMONELLA
167
image:
gle biochemical tests or muititests in Partlll-E,
5.6. An 0-1 bacteriophage screening test may
also be used on the isolate for a rapid (4-5
hours) determination of the tentative identifi-
cation of Salmonella, Results must be verified
(20,21).
5. Biochemical Identification of Salmonella
5,1 Summary: Salmonellae can be identi-
fied to genus by determining their reactions in a
series of biochemical tests. These tests can be
made in single tube media or in commercial
multitest systems. This Section offers the mini-
mal required set of tests, a series of additional,
optional tests and a brief description of available
multitest systems. These tests require specific
training for valid results.
5.2 Scope and Application
5.2.1 Advantages: The biochemical reac-
tions characterize the Salmonella-like isolate,
permit a separation from closely related bacte-
ria, and provide presumptive identification as
Salmonella. Confirmed identification requires
additional serological tests.
The multitest systems have a number of
advantages over single tube media prepared
in the laboratory:
(a) The different .designs of these systems
permit the user to select tests to fit his needs,
facilities and budget.
(b) The multitest systems may be used with
confidence in the laboratory or in field situa-
tions as rapid and convenient screening me-
thods for cultures suspected to be Salmonella.
Large numbers of cultures can be examined in
a relatively short time; and those tentatively
identified as Salmonella can then be held for
later serological confirmation.
(c) These systems offer the advantages of
minimal space requirements, immediate avail-
ability, and economy when compared with the
preparation and use of tubed media. They are
ideally suited to field work and to small labora-
tories that do not routinely perform these iden-
tification tests.
(d) The systems offer these same advan-
tages for the identification and differentation of
other enteric bacteria such as E. cofi, Klebsiella,
Enterobacter, Citrobacter and Shigella.
5.2.2 Limitations: Whether accomplished
by individual tube or multitest methods, bio-
chemical identification of large numbers of
cultures is expensive and time-consuming. It
should not be attempted independently with-
out previous training and experience in read-
ing reactions and interpreting results.
5.3 Apparatus and Materials
5.3.1 Incubator set at 35 ±0.5 C.
5.3.2 Bunsen/Fisher burner, or electric
incinerator.
5.3.3 Inoculating needle and loop.
5.3.4 Culture tubes, 100 * 13 or 150 x
20 mm.
5.3.5 Fermentation tubes, 75 X 1Omm.
5.3.6 Closures to fit culture tubes.
5.3.7 Thermometer certified by National
Bureau of Standards, or one of equivalent
accuracy.
5.4 Media
6.4.1 Screening Media
(a) Triple Sugar Iron Agar (TSI) (Difco
0265, BBL 1 1749). See Part II-B, 5.5.9.
(b) Lysine Iron Agar (LIA) (Difco 0849, BBL
11363). See Part II-B, 5.5.10.
(c) Motility Sulfide Medium (Difco 0450).
See Part II-B, 5.5.16,
(d) Urea Agar Base Concentrate (Difco
0284). See Part II-B, 5.5.11.
SALMONELLA
167
image:
 (e) Cytochrome Oxidase Test Reagents
5.4.3 Optional Biochemical Tests
Reagent A. Weigh out 1 gram alpha-
napthol and dissolve in 100 ml of 95%
ethanol.
Reagent B. Weigh out 1 gram of para-
aminodimethylaniline HCI (or oxylate) and dis-
solve in 100 ml of laboratory pure water. Pre-
pare frequently and store in refrigerator.
5.4.2 Minimal Biochemical Set
(a) Phenylalanine Agar {Difco 0745, BBL
11537). See Part 11-8,5.6.12.
(b) Ferric chloride reagent: Prepare a 10%
solution (w/v) of ferric chloride in laboratory
pure water. Store in a brown bottle in the
refrigerator.
(c) Indole test (tryptophane broth). See Part'
11-8,6.1.9.
(1) Tryptone (Difco 0123).
(2)Tryptiease(BBL 11921).
(3) Indole Test Reagent: Dissolve 5 grams
paradimethylamino benzaldehyde in 75 ml iso-
amyl or normal amyl alcohol, ACS grade.
Slowly add 25 ml cone HCI. The reagent
should be yellow and have a pH below 6.0; if
the final reagent Js dark in color it should be
discarded. Examine the reagent carefully dur-
ing preparation because some brands are not
satisfactory after aging. Both amyl alcohol and
benzaldehyde should be purchased in a small
amount consistent with the volume of work
anticipated. Refrigerate the reagent in a glass-
stoppered bottle.
There has been some difficulty in obtain-
ing amyl alcohol. If this problem occurs, Gillies
describes an alternate paper strip test for in-
dole production (22).
(d)Malonate Broth, Modified (Difco 0569,
BBL 11436). See Part II-B, 5.5.13.
(a) Carbohydrate Utilization
Purple Broth Base (Difco 0092, BBL
11506). See Part II-B, 5.1.7 containing:
Duicitol(Difco0162),
Lactose (Difco 015 6), or
lnositol(Difco0164)
(b) Decarboxylase Activity
Decarboxylase Medium Base (Difco
0872). See Part II-B, 5.5.14 containing:
Lysine HCI (Difco 0705),
Arginine HCi (Difco 0583), or
Ornithine HCI (Difco 0293)
(c) ONPG Reagents
(1) Monosodium Phosphate Solution
Dissolve 6.9 grams NaH2Po4.HOH in 45
ml of laboratory pure water. Add 3 ml of 30%
NaOH and adjust pH to 7.0. Bring to 50 ml with
laboratory pure water and store in refrigerator.
(2) ONPG Solution
Dissolve 80 grams of o-nitrophenyl-6-D-
galactopyranoside (ONPG) in 15 ml pure water
at 37 C. Add 5 ml of 1 M NaH2PO4 from (1)
above. This 0.75 M solution of ONPG should
be colorless. Store in a refrigerator. A portion
of the buffered solution sufficient for the num-
ber of tests to be done should be warmed to 37
C before use,
5.4.4 Multitest Systems (optional to Sin-
gle Test Series)
(a) API Enteric 20 (Analytab Products, Inc.).
(b) Enterotube (Roche Diagnostics).
(c) Inolex (Inolex Biomedical Division of
Wilson Pharmaceutical and Chemical Corp.)
(d) Minitek (Baltimore Biological Labora-
tories, Bioquest).
168
MICROBIOLOGICAL MANUAL 1978
image:
(e) Cytochrome Oxidase Test Reagents
5.4.3 Optional Biochemical Tests
Reagent A. Weigh out 1 gram alpha-
napthol and dissolve in 100 ml of 95%
ethanol.
Reagent B. Weigh out 1 gram of para-
aminodimethylaniline HCI (or oxylate) and dis-
solve in 100 ml of laboratory pure water. Pre-
pare frequently and store in refrigerator.
5.4.2 Minimal Biochemical Set
(a) Phenylalanine Agar {Difco 0745, BBL
11537). See Part 11-8,5.6.12.
(b) Ferric chloride reagent: Prepare a 10%
solution (w/v) of ferric chloride in laboratory
pure water. Store in a brown bottle in the
refrigerator.
(c) Indole test (tryptophane broth). See Part'
11-8,6.1.9.
(1) Tryptone (Difco 0123).
(2)Tryptiease(BBL 11921).
(3) Indole Test Reagent: Dissolve 5 grams
paradimethylamino benzaldehyde in 75 ml iso-
amyl or normal amyl alcohol, ACS grade.
Slowly add 25 ml cone HCI. The reagent
should be yellow and have a pH below 6.0; if
the final reagent Js dark in color it should be
discarded. Examine the reagent carefully dur-
ing preparation because some brands are not
satisfactory after aging. Both amyl alcohol and
benzaldehyde should be purchased in a small
amount consistent with the volume of work
anticipated. Refrigerate the reagent in a glass-
stoppered bottle.
There has been some difficulty in obtain-
ing amyl alcohol. If this problem occurs, Gillies
describes an alternate paper strip test for in-
dole production (22).
(d)Malonate Broth, Modified (Difco 0569,
BBL 11436). See Part II-B, 5.5.13.
(a) Carbohydrate Utilization
Purple Broth Base (Difco 0092, BBL
11506). See Part II-B, 5.1.7 containing:
Duicitol(Difco0162),
Lactose (Difco 015 6), or
lnositol(Difco0164)
(b) Decarboxylase Activity
Decarboxylase Medium Base (Difco
0872). See Part II-B, 5.5.14 containing:
Lysine HCI (Difco 0705),
Arginine HCi (Difco 0583), or
Ornithine HCI (Difco 0293)
(c) ONPG Reagents
(1) Monosodium Phosphate Solution
Dissolve 6.9 grams NaH2Po4.HOH in 45
ml of laboratory pure water. Add 3 ml of 30%
NaOH and adjust pH to 7.0. Bring to 50 ml with
laboratory pure water and store in refrigerator.
(2) ONPG Solution
Dissolve 80 grams of o-nitrophenyl-6-D-
galactopyranoside (ONPG) in 15 ml pure water
at 37 C. Add 5 ml of 1 M NaH2PO4 from (1)
above. This 0.75 M solution of ONPG should
be colorless. Store in a refrigerator. A portion
of the buffered solution sufficient for the num-
ber of tests to be done should be warmed to 37
C before use,
5.4.4 Multitest Systems (optional to Sin-
gle Test Series)
(a) API Enteric 20 (Analytab Products, Inc.).
(b) Enterotube (Roche Diagnostics).
(c) Inolex (Inolex Biomedical Division of
Wilson Pharmaceutical and Chemical Corp.)
(d) Minitek (Baltimore Biological Labora-
tories, Bioquest).
168
MICROBIOLOGICAL MANUAL 1978
image:
 (e) Pathotec Test Strips (General Diagnos-
tics Division of Warner-Lambert Company).
(f) r/b Enteric Differential System
(Diagnostic Research, inc.)
5.5 Procedures: Since cultures are found
which react atypically, an isolate should not be
eliminated because of a single anomalous re-
action, rather the biochemical reactions
should be considered as a group. For example,
LIA tubes not showing H2S production, but
having alkaline slants and alkaline butts may
be atypical S. typhi. These tubes should be
retained for further characterization.
Further, to insure that the media are yield-
ing proper reactions, the analyst is urged to
incorporate both positive and negative control
cultures into Single Test and Multitest
Procedures.
5.5.1 Screening Tests: Pick growth from
the center of a single isolated colony on a
selective plating medium and inoculate into
the primary screening medium.
Fermentation tube reaction code for TSI
and LIAAgars:
Report slant/butt where K, A and N
indicate alkaline, acid and neutral reactions
respectively; G, g indicate large and small
amounts of gas production, respectively; and
H2S 1+ to 4+ indicate levels of blackening
due to hydrogen sulfide production. For
example, K/Ag is an alkaline slant and an acid
butt with a small amount of gas.
* (a) Triple Sugar Iron Agar
(1) Inoculate by stabbing the butt and
streaking the slant.
(2) Incubate at 35 C for 18-24 hours with
cap loose.
(3) Read and record reactions. Color of
slant or butt is yellow for an acid reaction or
red for an alkaline reading. Gas production is
evidenced by bubbles in the medium, and H2S
production by blackening of the medium.
(4) Typical reactions:
Salmonella: K/Ag with H2S, 1 + to 4+.
S. typhi: K/A with H2S, trace to 1 +.
Citrobacter: K/Ag or A/Ag with H2S, 1 +
to3 + .
(5) Atypical reactions: TSI tubes showing
alkaline slants and acid butts without H2S
production should be inoculated into Motility
Sulfide Medium to verify the negative H2S
reaction. If still H2S negative, perform serolog-
ical testing to confirm an atypical Salmonella.
• (b) Lysine Iron Agar
(1) Inoculate by stabbing the butt twice
and streaking the slant.
(2) Incubate for 18-24 hours, and if nega-
tive for an additional 24 hours, at 35 C.
(3) Read and record reactions. The slant or
butt is yellow from an acid reaction and
blue/purple for an alkaline reading. Gas
production is evidenced by bubbles in the me-
dium and H2S production by blackening of the
medium along the stab line. Proteus has a
distinctive red slant caused by oxidative deam-
ination and a yellow butt.
(4) Typical reactions:
Salmonella: K/K or K/N with H2S +(-).
S. typhi: K/K with H2S -(+).
Citrobacter: K/A with H2S - or +.
Proteus; R(red)/A with H2S-{+).
* (c) Urea Agar (Christensen)
(1) Inoculate slant only, using a heavy
inoculum.
(2) Incubate for 18-24 hours at 35 C with
cap loose. A positive reaction for Proteus may
be recorded in 2-4 hours, but all negative tests
at 2-4 hours must be held for 18-24 hours.
(3) Reactions are red for urease positive
and yellow for urease negative. Salmonella
give negative urease reactions. Cultures of
SALMONELLA
169
image:
(e) Pathotec Test Strips (General Diagnos-
tics Division of Warner-Lambert Company).
(f) r/b Enteric Differential System
(Diagnostic Research, inc.)
5.5 Procedures: Since cultures are found
which react atypically, an isolate should not be
eliminated because of a single anomalous re-
action, rather the biochemical reactions
should be considered as a group. For example,
LIA tubes not showing H2S production, but
having alkaline slants and alkaline butts may
be atypical S. typhi. These tubes should be
retained for further characterization.
Further, to insure that the media are yield-
ing proper reactions, the analyst is urged to
incorporate both positive and negative control
cultures into Single Test and Multitest
Procedures.
5.5.1 Screening Tests: Pick growth from
the center of a single isolated colony on a
selective plating medium and inoculate into
the primary screening medium.
Fermentation tube reaction code for TSI
and LIAAgars:
Report slant/butt where K, A and N
indicate alkaline, acid and neutral reactions
respectively; G, g indicate large and small
amounts of gas production, respectively; and
H2S 1+ to 4+ indicate levels of blackening
due to hydrogen sulfide production. For
example, K/Ag is an alkaline slant and an acid
butt with a small amount of gas.
* (a) Triple Sugar Iron Agar
(1) Inoculate by stabbing the butt and
streaking the slant.
(2) Incubate at 35 C for 18-24 hours with
cap loose.
(3) Read and record reactions. Color of
slant or butt is yellow for an acid reaction or
red for an alkaline reading. Gas production is
evidenced by bubbles in the medium, and H2S
production by blackening of the medium.
(4) Typical reactions:
Salmonella: K/Ag with H2S, 1 + to 4+.
S. typhi: K/A with H2S, trace to 1 +.
Citrobacter: K/Ag or A/Ag with H2S, 1 +
to3 + .
(5) Atypical reactions: TSI tubes showing
alkaline slants and acid butts without H2S
production should be inoculated into Motility
Sulfide Medium to verify the negative H2S
reaction. If still H2S negative, perform serolog-
ical testing to confirm an atypical Salmonella.
• (b) Lysine Iron Agar
(1) Inoculate by stabbing the butt twice
and streaking the slant.
(2) Incubate for 18-24 hours, and if nega-
tive for an additional 24 hours, at 35 C.
(3) Read and record reactions. The slant or
butt is yellow from an acid reaction and
blue/purple for an alkaline reading. Gas
production is evidenced by bubbles in the me-
dium and H2S production by blackening of the
medium along the stab line. Proteus has a
distinctive red slant caused by oxidative deam-
ination and a yellow butt.
(4) Typical reactions:
Salmonella: K/K or K/N with H2S +(-).
S. typhi: K/K with H2S -(+).
Citrobacter: K/A with H2S - or +.
Proteus; R(red)/A with H2S-{+).
* (c) Urea Agar (Christensen)
(1) Inoculate slant only, using a heavy
inoculum.
(2) Incubate for 18-24 hours at 35 C with
cap loose. A positive reaction for Proteus may
be recorded in 2-4 hours, but all negative tests
at 2-4 hours must be held for 18-24 hours.
(3) Reactions are red for urease positive
and yellow for urease negative. Salmonella
give negative urease reactions. Cultures of
SALMONELLA
169
image:
 Citrobacter may yield weak delayed positive
reactions at 18-24 hours.
* (d)CytochromeOxidaseTest
The cytochrome (indophenol) oxidase test
can be done with prepared paper strips or the
following test on a nutrient agar slant:
(1) Inoculate nutrient agar slant and incu-
bate at 35 C for 18-24 hours. Older cultures
should not be used.
(2) Prepare reagents as in 5.4.1 (e).
(3) Add 2-3 drops of reagent A and reag-
ent B to the slant, tilt to mix and read reaction
within two minutes.
(4) A strong positive reaction (blue color
slant or paper strip) occurs in 30 seconds.
Ignore weak reactions that occur after two
minutes. Pseudomonads, aeromonads and
vibrios are positive. Salmonella is negative.
5.5.2 Minimal Biochemical Set: After read-
ing the TSI reaction, use growth from the slant
to inoculate the minimal biochemical set (in
5.4.3 above) with a straight wire needle. Suffi-
cient culture to inoculate all of the minimal
biochemical media is provided by one applica-
tion of the tip of the needle to the TSI growth.
» (a)PhenylalanineAgar
(1) Inoculate surface of slant heavily.
(2) Incubate for 18-24 hours at 35 C with
cap loose. A positive reaction for Proteus may
be recorded in 4 hours but negative tests must
be held for 18-24 hours.
(3) Test for phenylalanine deaminase by
allowing 4-5 drops of a 10% solution of ferric
chloride to run down over the growth on the
slant.
(4) A dark green color on the agar slant
and in the fluid is a positive reaction. A yellow
or brown color is negative. Salmonella and
Citrobacter give negative reactions.
* (b)lndoleTest
(1) Inoculate the tryptophane broth lightly
from the TSI agarslant culture.
(2) Incubate the broth at 35 + 0.5 C for 24
± 2 hours, with cap loose.
(3) Add 0.2-0.3 ml indole test reagent to
the culture, shake and allow the mixture to
stand for 10 minutes.
(4) Observe and record the results.
(5) A dark red color in the amyl alcohol
layer on top of the culture is a positive indole
test; the original yellow color of the reagent is
a negative test.
(6) With rare exceptions, Salmonella and
Citrobacter are indole-negative,
» (c) M a Ion ate B roth Test
(1) Inoculate from the 18-24 hours TSI
agar slant culture.
(2) Incubate for 48 hours at 35 C. Observe
tubes after 24 and 48 hours. Positive reactions
are indicated by a change in color of the me-
dium from green to a deep blue. Lots of malo-
nate medium should be checked with positive
and negative cultures.
(3) Salmonella arizonae and some strains
of Citrobacter utilize malonate. Other Salmo-
nella do not.
• (d) Fermentation of Dulcitol in Phenol Red
Broth Base
(1) Inoculate the Dulcitol broth lightly us-
ing a 24-hour culture.
(2) Incubate at 35 C and examine daily for
7 days.
i
(3) A positive reaction is production of acid
with yellow color.
(4) Most salmonellae and some Citrobac-
ter utilize dulcitol. Some that do not use it or
170
MICROBIOLOGICAL MANUAL 1978
image:
Citrobacter may yield weak delayed positive
reactions at 18-24 hours.
* (d)CytochromeOxidaseTest
The cytochrome (indophenol) oxidase test
can be done with prepared paper strips or the
following test on a nutrient agar slant:
(1) Inoculate nutrient agar slant and incu-
bate at 35 C for 18-24 hours. Older cultures
should not be used.
(2) Prepare reagents as in 5.4.1 (e).
(3) Add 2-3 drops of reagent A and reag-
ent B to the slant, tilt to mix and read reaction
within two minutes.
(4) A strong positive reaction (blue color
slant or paper strip) occurs in 30 seconds.
Ignore weak reactions that occur after two
minutes. Pseudomonads, aeromonads and
vibrios are positive. Salmonella is negative.
5.5.2 Minimal Biochemical Set: After read-
ing the TSI reaction, use growth from the slant
to inoculate the minimal biochemical set (in
5.4.3 above) with a straight wire needle. Suffi-
cient culture to inoculate all of the minimal
biochemical media is provided by one applica-
tion of the tip of the needle to the TSI growth.
» (a)PhenylalanineAgar
(1) Inoculate surface of slant heavily.
(2) Incubate for 18-24 hours at 35 C with
cap loose. A positive reaction for Proteus may
be recorded in 4 hours but negative tests must
be held for 18-24 hours.
(3) Test for phenylalanine deaminase by
allowing 4-5 drops of a 10% solution of ferric
chloride to run down over the growth on the
slant.
(4) A dark green color on the agar slant
and in the fluid is a positive reaction. A yellow
or brown color is negative. Salmonella and
Citrobacter give negative reactions.
* (b)lndoleTest
(1) Inoculate the tryptophane broth lightly
from the TSI agarslant culture.
(2) Incubate the broth at 35 + 0.5 C for 24
± 2 hours, with cap loose.
(3) Add 0.2-0.3 ml indole test reagent to
the culture, shake and allow the mixture to
stand for 10 minutes.
(4) Observe and record the results.
(5) A dark red color in the amyl alcohol
layer on top of the culture is a positive indole
test; the original yellow color of the reagent is
a negative test.
(6) With rare exceptions, Salmonella and
Citrobacter are indole-negative,
» (c) M a Ion ate B roth Test
(1) Inoculate from the 18-24 hours TSI
agar slant culture.
(2) Incubate for 48 hours at 35 C. Observe
tubes after 24 and 48 hours. Positive reactions
are indicated by a change in color of the me-
dium from green to a deep blue. Lots of malo-
nate medium should be checked with positive
and negative cultures.
(3) Salmonella arizonae and some strains
of Citrobacter utilize malonate. Other Salmo-
nella do not.
• (d) Fermentation of Dulcitol in Phenol Red
Broth Base
(1) Inoculate the Dulcitol broth lightly us-
ing a 24-hour culture.
(2) Incubate at 35 C and examine daily for
7 days.
i
(3) A positive reaction is production of acid
with yellow color.
(4) Most salmonellae and some Citrobac-
ter utilize dulcitol. Some that do not use it or
170
MICROBIOLOGICAL MANUAL 1978
image:
 use it slowly include: S. typhi, S. cholerae-suis,
S, enteritidis bioser Paratyphi A and Pullorum,
and S. enterf/cf/sserTyphimurum.
5.5.3 Optional Biochemical Tests: If the
minimal set of biochemical tests has not satis-
factorily identified cultures as Salmonella, or
variable reactions have been observed, pro-
ceed with the following optional tests.
• (a) Fermentation of Lactose in Phenol Red
Broth and Inositol in Phenol Red Broth
(1} Inoculate the broth lightly using a 24-
hour culture.
(2) Incubate at 35 C and examine daily for
7 days.
(3) A positive reaction is production of acid
and yellow color with or without gas
production.
(4) Salmonella do not utilize lactose, but
some strains of Citrobacterdo.
Some Salmonella do utilize inositol.
• (b) Decarboxylase tests (lysine, arginine
and ornithine)
(1) The complete decarboxylase test series
requires tubes of each of the amino acids and a
control tube containing no amino acids.
(2) Inoculate each tube lightly.
(3) Add sufficient sterile mineral oil to the
broth to make 3-4 mm layer on the surface
and tighten the screw cap.
(4) Incubate for 18-24 hours at 35 C.
Negative reactions should be reincubated up
to 4 days.
(5) Positive reactions are deep purple and
negative reactions, remain yellow. Read the
control tube without amino acid first; it must
be yellow for the reactions of the other tubes ta
be valid. Positive purple tubes must have
growth as evidence by turbidity because
uninoculated tubes are also purple, nonfer-
menters may remain alkaline throughout
incubation.
(6) Salmonella are positive for lysine; posi-
tive or delayed positive for arginine; and posi-
tive for ornithine. S. typhi and bioser Gallina-
rum are negative for ornithine. Cltrobacterand
bioser Paratyphi A are negative for lysine.
Strains are variable for arginine and ornithine.
• (c) Gelatin Liquefaction
(1) Inoculate nutrient gelatin tube by
stabbing.
(2) Incubate at 35 C for 5 days.
(3) Cool tubes to 20 C and inspect. Failure
to solidify is a positive reaction.
(4) All Group I Enterobacteriaceae are
negative, except for S. arizonae which shows a
delayed positive reaction (see Table lll-E-5),
« (d) ONPG Test,
galoctopyranoside (23)
o-nitrophenyl-3-D-
(1) Emulsify a large loopful of growth from
each culture in 0.25 ml of physiological saline
in a 10 x 75 mm fermentation tube.
(2) Add one drop of toluene to each tube
and shake well. Let tubes stand for 5 minutes
in 35 C water bath.
(3) Add 0.25 ml of buffered O.75 M ONPG
solution to each tube (see 5:4.3, (c) (1)) and
incubate again in 35 C water bath.
(4) Read tubes at ¥2,. 1 and 24 hours. A
positive result is development of yellow color.
Lactose fermenters have P galactosidase so
Citrobacter are positive and most Salmonella
negative.
» (e> Motility Test: A test for motility is used
in serology but is not recommended in the
biochemical reactions because:
(1) Most members of the family Enterobac-
teriaceae are motile, so the test would not add
much to a characterization of the isolate.
SALMONELLA
171
image:
use it slowly include: S. typhi, S. cholerae-suis,
S, enteritidis bioser Paratyphi A and Pullorum,
and S. enterf/cf/sserTyphimurum.
5.5.3 Optional Biochemical Tests: If the
minimal set of biochemical tests has not satis-
factorily identified cultures as Salmonella, or
variable reactions have been observed, pro-
ceed with the following optional tests.
• (a) Fermentation of Lactose in Phenol Red
Broth and Inositol in Phenol Red Broth
(1} Inoculate the broth lightly using a 24-
hour culture.
(2) Incubate at 35 C and examine daily for
7 days.
(3) A positive reaction is production of acid
and yellow color with or without gas
production.
(4) Salmonella do not utilize lactose, but
some strains of Citrobacterdo.
Some Salmonella do utilize inositol.
• (b) Decarboxylase tests (lysine, arginine
and ornithine)
(1) The complete decarboxylase test series
requires tubes of each of the amino acids and a
control tube containing no amino acids.
(2) Inoculate each tube lightly.
(3) Add sufficient sterile mineral oil to the
broth to make 3-4 mm layer on the surface
and tighten the screw cap.
(4) Incubate for 18-24 hours at 35 C.
Negative reactions should be reincubated up
to 4 days.
(5) Positive reactions are deep purple and
negative reactions, remain yellow. Read the
control tube without amino acid first; it must
be yellow for the reactions of the other tubes ta
be valid. Positive purple tubes must have
growth as evidence by turbidity because
uninoculated tubes are also purple, nonfer-
menters may remain alkaline throughout
incubation.
(6) Salmonella are positive for lysine; posi-
tive or delayed positive for arginine; and posi-
tive for ornithine. S. typhi and bioser Gallina-
rum are negative for ornithine. Cltrobacterand
bioser Paratyphi A are negative for lysine.
Strains are variable for arginine and ornithine.
• (c) Gelatin Liquefaction
(1) Inoculate nutrient gelatin tube by
stabbing.
(2) Incubate at 35 C for 5 days.
(3) Cool tubes to 20 C and inspect. Failure
to solidify is a positive reaction.
(4) All Group I Enterobacteriaceae are
negative, except for S. arizonae which shows a
delayed positive reaction (see Table lll-E-5),
« (d) ONPG Test,
galoctopyranoside (23)
o-nitrophenyl-3-D-
(1) Emulsify a large loopful of growth from
each culture in 0.25 ml of physiological saline
in a 10 x 75 mm fermentation tube.
(2) Add one drop of toluene to each tube
and shake well. Let tubes stand for 5 minutes
in 35 C water bath.
(3) Add 0.25 ml of buffered O.75 M ONPG
solution to each tube (see 5:4.3, (c) (1)) and
incubate again in 35 C water bath.
(4) Read tubes at ¥2,. 1 and 24 hours. A
positive result is development of yellow color.
Lactose fermenters have P galactosidase so
Citrobacter are positive and most Salmonella
negative.
» (e> Motility Test: A test for motility is used
in serology but is not recommended in the
biochemical reactions because:
(1) Most members of the family Enterobac-
teriaceae are motile, so the test would not add
much to a characterization of the isolate.
SALMONELLA
171
image:
 (2) A negative test cannot be considered
conclusive until the culture is passed once or
twice through a motility or broth medium and
the isolate retested.
5.6 Multitest Systems: Multitest systems
are available which use tubes containing pre-
pared agar media, plastic units containing de-
hydrated media, media-impregnated discs and
reagent-impregnated paper strips. Some of
the systems use numerical codes to aid identi-
fication of bacteria. Others provide computer-
ized identification of bacteria. A number of
independent investigators have compared one
or more multitest systems with conventional
biochemical tests. Some of the earlier systems
have been improved. Most of the recent stud-
ies report the correct identification of high
percentages of isolates (24-29).
5.6.1 The following systems for the identi-
fication of Enterobacteriaceae are commer-
cially available. These have been quality tested
by the manufacturers and others and can be
used with confidence.
<a) API Enteric 20 consists of 20 small
chambers (called cupules) in a plastic strip,
each containing dehydrated medium. An iso-
lated colony is used to prepare a cell suspen-
sion to inoculate the media. The inoculated
media are incubated for 18 hours at 35 C in a
special plastic chamber. A numerical identifi-
cation system based on thousands of reaction
combinations is available. The identification
system is updated periodically. Computer serv-
ices may be obtained which are more compre-
hensive and accurate than the manual system
(27,28).
(b) Improved Enterotube with 8 compart-
ments of agar media in a single plastic tube
provides tests for 11 biochemical reactions.
The media are inoculated by touching one end
of a wire to an isolated colony and drawing the
wire containing the inoculum through the me-
dia. The Enterotube is incubated for 18-24
hours at 35 C. A manual numerical identifica-
tion aid, ENCISE, is part of the system.
(c) The Inolex system (formerly Auxotab) is
comprised of a test card unit containing 10
reagent-filled capillary chambers. A single iso-
lated colony is picked into broth and cultured
for 3Vz hours at 35 C. After incubation, the
broth tube is centrifuged, the cells resus-
pended in water and inoculated into each cap-
illary chamber on the card. Each card is incu-
bated for 3 hours at 35 C in its own plastic
container. Isolates can be identified in 7 hours
unless additional tests are required. A numeri-
cal binary code named Var-ident is part of the
system.
(d)The r/b Enteric Differential System con-
sists of 4 Beckford tubes, 2 basic and 2 ex-
pander tubes. The 4 tubes contain agar media
and are constricted to form upper and lower
compartments which provide 14 biochemical
reactions. The tubes are stabbed, streaked and
incubated at 35 C for 24 hours. A color chart of
typical tube reactions is provided for
identification.
(e) The Pathotec Test Strips are individual
biochemical paper strips impregnated with
reagents that test for enzymes or end products
characteristic of certain bacteria. A cell sus-
pension prepared from isolated colonies is
used as the inoculum to demonstrate the bio-
chemical reactions. An incubation period of 4
hours at 35 C may be required for the cell
suspension. The earlier Rapid I-D System has
been discontinued. A new identification sys-
tem for enterics is planned for marketing in
1978-1979.
(f) The Minitek Microorganism Differentia-
tion System consists of 10 impregnated discs
that test for 12 biochemical reactions. A single
colony suspended in special broth serves as
the inoculum. The 10 basic discs are part of 34
discs and 37 reactions offered to identify aero-
bic and anaerobic bacteria. The inoculated
discs are contained in a plastic tray within a
humidor and incubated at 35 C for 18-24
hours. Accessory equipment required to proc-
ess the discs includes plastic inoculum plates,
a 10-disc dispenser, a special pipetter, pipet
tips, a pipet tips organizer, an incubation humi-
dor, a color comparator card set and inoculum
broth. The system stresses the biochemical
options and flexibility of the system. A flow
diagram is provided for identifications.
172
MICROBIOLOGICAL MANUAL 1978
image:
(2) A negative test cannot be considered
conclusive until the culture is passed once or
twice through a motility or broth medium and
the isolate retested.
5.6 Multitest Systems: Multitest systems
are available which use tubes containing pre-
pared agar media, plastic units containing de-
hydrated media, media-impregnated discs and
reagent-impregnated paper strips. Some of
the systems use numerical codes to aid identi-
fication of bacteria. Others provide computer-
ized identification of bacteria. A number of
independent investigators have compared one
or more multitest systems with conventional
biochemical tests. Some of the earlier systems
have been improved. Most of the recent stud-
ies report the correct identification of high
percentages of isolates (24-29).
5.6.1 The following systems for the identi-
fication of Enterobacteriaceae are commer-
cially available. These have been quality tested
by the manufacturers and others and can be
used with confidence.
<a) API Enteric 20 consists of 20 small
chambers (called cupules) in a plastic strip,
each containing dehydrated medium. An iso-
lated colony is used to prepare a cell suspen-
sion to inoculate the media. The inoculated
media are incubated for 18 hours at 35 C in a
special plastic chamber. A numerical identifi-
cation system based on thousands of reaction
combinations is available. The identification
system is updated periodically. Computer serv-
ices may be obtained which are more compre-
hensive and accurate than the manual system
(27,28).
(b) Improved Enterotube with 8 compart-
ments of agar media in a single plastic tube
provides tests for 11 biochemical reactions.
The media are inoculated by touching one end
of a wire to an isolated colony and drawing the
wire containing the inoculum through the me-
dia. The Enterotube is incubated for 18-24
hours at 35 C. A manual numerical identifica-
tion aid, ENCISE, is part of the system.
(c) The Inolex system (formerly Auxotab) is
comprised of a test card unit containing 10
reagent-filled capillary chambers. A single iso-
lated colony is picked into broth and cultured
for 3Vz hours at 35 C. After incubation, the
broth tube is centrifuged, the cells resus-
pended in water and inoculated into each cap-
illary chamber on the card. Each card is incu-
bated for 3 hours at 35 C in its own plastic
container. Isolates can be identified in 7 hours
unless additional tests are required. A numeri-
cal binary code named Var-ident is part of the
system.
(d)The r/b Enteric Differential System con-
sists of 4 Beckford tubes, 2 basic and 2 ex-
pander tubes. The 4 tubes contain agar media
and are constricted to form upper and lower
compartments which provide 14 biochemical
reactions. The tubes are stabbed, streaked and
incubated at 35 C for 24 hours. A color chart of
typical tube reactions is provided for
identification.
(e) The Pathotec Test Strips are individual
biochemical paper strips impregnated with
reagents that test for enzymes or end products
characteristic of certain bacteria. A cell sus-
pension prepared from isolated colonies is
used as the inoculum to demonstrate the bio-
chemical reactions. An incubation period of 4
hours at 35 C may be required for the cell
suspension. The earlier Rapid I-D System has
been discontinued. A new identification sys-
tem for enterics is planned for marketing in
1978-1979.
(f) The Minitek Microorganism Differentia-
tion System consists of 10 impregnated discs
that test for 12 biochemical reactions. A single
colony suspended in special broth serves as
the inoculum. The 10 basic discs are part of 34
discs and 37 reactions offered to identify aero-
bic and anaerobic bacteria. The inoculated
discs are contained in a plastic tray within a
humidor and incubated at 35 C for 18-24
hours. Accessory equipment required to proc-
ess the discs includes plastic inoculum plates,
a 10-disc dispenser, a special pipetter, pipet
tips, a pipet tips organizer, an incubation humi-
dor, a color comparator card set and inoculum
broth. The system stresses the biochemical
options and flexibility of the system. A flow
diagram is provided for identifications.
172
MICROBIOLOGICAL MANUAL 1978
image:
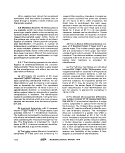 5.6.2 Factors for Selection: The 6 multi-
test systems briefly described above were
designed for the biochemical identification of
members of the family, Enterobacteriaceae.
Most of the isolates suspected as Salmonella
could be identified by any of the multitest
systems. Some of the factors that should be
considered in selecting a multitest system are:
(a) Biochemical Reactions h^ the Multitest
System: Since analysts working with Salmo-
nella develop a series of tests that yield good
results forthem, they should consider a system
which fits their preferred test pattern.
(b) Need to Identify Atypical Salmonella:
Because it is important for the laboratory to
identify typical and atypical Sa/mone/fairom a
series of samples, systems that use numerical
identification should be selected (API, Entero-
tube, and Inolex). Further, systems containing
the most tests have a better chance for identifi-
cation of typical and atypical Salmonella. Only
one system, API, requires no additional tests.
(c) Multitests: The production rate and the
time span required to identify typical
Salmonella vanes with the system as shown in
Table lll-E-2.
(d) Refrigerated Storage: Refrigerated
space is required for some systems. This can
be a problem in purchase of a large supply.
Table lll-E-3 shows the reported shelf-life of the
multitest systems, with and without
refrigeration.
(e) Purchase of Special Equipment: Some
of the test systems contain all materials and
equipment necessary to do the analyses.
Others require purchase of special items of
equipment for full use. For example, Inolex
requires a small centrifuge; API can be sight-
read or can utilize a profile register for easy,
rapid identification of atypical and typical
strains; Minitek uses a starter kit which
includes special plates, broth, pipetter, pipet
tips, color comparator card set, incubation
humidor, pipet tips, organizer and dispenser.
(f) Safety Considerations: The probability
of laboratory-acquired infections is directly
proportional to the amount and number of
exposures to pathogens. Some multitest sys-
tems are more dangerous to handle than oth-
ers because they require more opening, clos-
ing and manipulating of the test container
which may pose added hazards to the worker.
Some systems such as Enterotube and r/b use
direct colony picks for reactions. API, Inolex,
Pathotec and Minitek require culturing and
additional handling of cell suspensions which
are greater hazards.
(g) Cost and Source of Multitest Systems:
The per unit cost of the multitests varies with
the system, as shown in Table lll-E-4.
5.7 Biochemical Characteristics of
Enterobacteriaceae: The analyst may wish to
differentiate salmonellae from the other
Enterobacteriaceae by applying additional
biochemical tests. Table lll-E-5 is a chart of
these biochemical reactions.
5.8 Serological Verification: The analyst
should understand that completion of the bio-
chemical tests does not yield identification of
Salmonella. The cultures that have been bio-
chemically confirmed should be verified
serologically.
6. Serological Testing for Salmonella
6.1 Summary: Serological typing of Sal-
monella strains is done by using slide-
agglutination for somatic (0) antigens and tube
testing for flagellar (H) antigens.
6.2 Scope and Application: Serological
testing completes the identification of Salmo-
nella. It is the only testing which identifies to
serotype and bioserotype levels. However, se-
rological testing is an expensive, complex pro-
cedure that should be carried out only by
trained personnel.
6.3 Apparatus and Materials
6.3.1 Small inverted fluorescent lamp.
6.3.2 Incubator set at 35 + 0.5 C, and a
water bath set at 50 C.
SALMONELLA
173
image:
5.6.2 Factors for Selection: The 6 multi-
test systems briefly described above were
designed for the biochemical identification of
members of the family, Enterobacteriaceae.
Most of the isolates suspected as Salmonella
could be identified by any of the multitest
systems. Some of the factors that should be
considered in selecting a multitest system are:
(a) Biochemical Reactions h^ the Multitest
System: Since analysts working with Salmo-
nella develop a series of tests that yield good
results forthem, they should consider a system
which fits their preferred test pattern.
(b) Need to Identify Atypical Salmonella:
Because it is important for the laboratory to
identify typical and atypical Sa/mone/fairom a
series of samples, systems that use numerical
identification should be selected (API, Entero-
tube, and Inolex). Further, systems containing
the most tests have a better chance for identifi-
cation of typical and atypical Salmonella. Only
one system, API, requires no additional tests.
(c) Multitests: The production rate and the
time span required to identify typical
Salmonella vanes with the system as shown in
Table lll-E-2.
(d) Refrigerated Storage: Refrigerated
space is required for some systems. This can
be a problem in purchase of a large supply.
Table lll-E-3 shows the reported shelf-life of the
multitest systems, with and without
refrigeration.
(e) Purchase of Special Equipment: Some
of the test systems contain all materials and
equipment necessary to do the analyses.
Others require purchase of special items of
equipment for full use. For example, Inolex
requires a small centrifuge; API can be sight-
read or can utilize a profile register for easy,
rapid identification of atypical and typical
strains; Minitek uses a starter kit which
includes special plates, broth, pipetter, pipet
tips, color comparator card set, incubation
humidor, pipet tips, organizer and dispenser.
(f) Safety Considerations: The probability
of laboratory-acquired infections is directly
proportional to the amount and number of
exposures to pathogens. Some multitest sys-
tems are more dangerous to handle than oth-
ers because they require more opening, clos-
ing and manipulating of the test container
which may pose added hazards to the worker.
Some systems such as Enterotube and r/b use
direct colony picks for reactions. API, Inolex,
Pathotec and Minitek require culturing and
additional handling of cell suspensions which
are greater hazards.
(g) Cost and Source of Multitest Systems:
The per unit cost of the multitests varies with
the system, as shown in Table lll-E-4.
5.7 Biochemical Characteristics of
Enterobacteriaceae: The analyst may wish to
differentiate salmonellae from the other
Enterobacteriaceae by applying additional
biochemical tests. Table lll-E-5 is a chart of
these biochemical reactions.
5.8 Serological Verification: The analyst
should understand that completion of the bio-
chemical tests does not yield identification of
Salmonella. The cultures that have been bio-
chemically confirmed should be verified
serologically.
6. Serological Testing for Salmonella
6.1 Summary: Serological typing of Sal-
monella strains is done by using slide-
agglutination for somatic (0) antigens and tube
testing for flagellar (H) antigens.
6.2 Scope and Application: Serological
testing completes the identification of Salmo-
nella. It is the only testing which identifies to
serotype and bioserotype levels. However, se-
rological testing is an expensive, complex pro-
cedure that should be carried out only by
trained personnel.
6.3 Apparatus and Materials
6.3.1 Small inverted fluorescent lamp.
6.3.2 Incubator set at 35 + 0.5 C, and a
water bath set at 50 C.
SALMONELLA
173
image:
 TABLE lll-E-2
Production Rate and Time Requirements of Multitest Systems*
Multitest
System
API
Enterotube
Inotex
r/b Diff.
Pathotec
Minitek
Analyst's Time
Per Culture in Min.
10
6
30
8
15
10
Time Span of
Test in Hours
18-22
18-24
7
24
4
18-24
Cultures
Per Day Per Analyst
80
100
10-15
80
20-30
80
'Based on experience in EMSL-Cincinnati.
TABLE lll-E-3
Reported Shelf-Life of Multitest Systems With or Without Refrigeration
System
API
Inolsx
Pathotoc
Enterotube
r/b
Minitek
Refrigeration No
Required Refrigeration*
1 2 months —
— 12 months
3 years** 12 months
7 months —
6-12 months —
2 years —
'Store in cool, dark place, ambient temperature.
"Refrigeration not required, but will extend the shelf-life.
174
<*EFV\ MICROBIOLOGICAL MANUAL 1978
image:
TABLE lll-E-2
Production Rate and Time Requirements of Multitest Systems*
Multitest
System
API
Enterotube
Inotex
r/b Diff.
Pathotec
Minitek
Analyst's Time
Per Culture in Min.
10
6
30
8
15
10
Time Span of
Test in Hours
18-22
18-24
7
24
4
18-24
Cultures
Per Day Per Analyst
80
100
10-15
80
20-30
80
'Based on experience in EMSL-Cincinnati.
TABLE lll-E-3
Reported Shelf-Life of Multitest Systems With or Without Refrigeration
System
API
Inolsx
Pathotoc
Enterotube
r/b
Minitek
Refrigeration No
Required Refrigeration*
1 2 months —
— 12 months
3 years** 12 months
7 months —
6-12 months —
2 years —
'Store in cool, dark place, ambient temperature.
"Refrigeration not required, but will extend the shelf-life.
174
<*EFV\ MICROBIOLOGICAL MANUAL 1978
image:
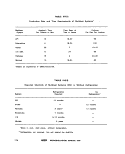 TABLE lll-E-4
Cost and Source of Multitest Systems1
Multitest
System
Cost
per Unit
Cost
per Box
Address of
Manufacturer
API Enteric 20
Inolex
r/b Enteric Differ-
ential System
Pathotec Test
Strips
Mlnitek
$2.052 $51.25 (25/box)
Improved Enterotube $2.16
$0.91
$1.90
3 tubes/
set
$0.20
$54.00 (GSA) {25/box}
$22.80 (25/box)
.$38.60 (20 sets/box)
$20.00 (100 tests/
box)
$1.803 $90.00 (50 tests/kit)
Analytab Products, Inc.
200 Express Street
Plainview, NY 11803
Roche Diagnostics
Div. of Hoffmann-La Roche, Inc.
Nutley, NJ 07110
Inolex Biomedical Division
Inolex Corporation
3 Science Road
Glenwood, IL 60425
Diagnostic Research, Inc.
25 Lumber Road
Roslyn, Long Island, NY 11576
Warner-Lambert Company
General Diagnostics Division
Morris Plains, NJ O795O
Baltimore Biological Laboratories
Cockeysville, MD 21030
1. As of October, 1977.
2. Plus $99.OO/year, if the numerical identification system. Analytical Profile
Inolex Service, is used.
3. Requires one time purchase of accessories for $94.10.
SALMONELLA
175
image:
TABLE lll-E-4
Cost and Source of Multitest Systems1
Multitest
System
Cost
per Unit
Cost
per Box
Address of
Manufacturer
API Enteric 20
Inolex
r/b Enteric Differ-
ential System
Pathotec Test
Strips
Mlnitek
$2.052 $51.25 (25/box)
Improved Enterotube $2.16
$0.91
$1.90
3 tubes/
set
$0.20
$54.00 (GSA) {25/box}
$22.80 (25/box)
.$38.60 (20 sets/box)
$20.00 (100 tests/
box)
$1.803 $90.00 (50 tests/kit)
Analytab Products, Inc.
200 Express Street
Plainview, NY 11803
Roche Diagnostics
Div. of Hoffmann-La Roche, Inc.
Nutley, NJ 07110
Inolex Biomedical Division
Inolex Corporation
3 Science Road
Glenwood, IL 60425
Diagnostic Research, Inc.
25 Lumber Road
Roslyn, Long Island, NY 11576
Warner-Lambert Company
General Diagnostics Division
Morris Plains, NJ O795O
Baltimore Biological Laboratories
Cockeysville, MD 21030
1. As of October, 1977.
2. Plus $99.OO/year, if the numerical identification system. Analytical Profile
Inolex Service, is used.
3. Requires one time purchase of accessories for $94.10.
SALMONELLA
175
image:
 TABLE lll-E-5
Biochemical Characteristics of the Enterobacteriaceae
Reaction
Catalaso
Oxidise
8-Q»!»closid«sc
Gas Irom Glucose
»I35C
KCN (growth on)
Mucate (»cid)
NiDate reduction
Carbohydrates:
(acid produclion)
AdomtcH
Arabinose
Outeitol
Esculin
Inosllol
Lactose
Maltose
Manmtol
Satlcin
Sorbilol
Sucrose
Trehalose
Xylose
Related C sources:
Ciliato
Gluconato
Malonate
cT-Tartrala
MR
VP,
Protein reactions;
Arginine
Gelatin hydrolysis
H}S Jrom TSI
Indote
Lyilno
docarboxylaie
Orntthme
Uie* hydrolysis
Glutimic icld
Phenylatanlne
Group 1
' 1
4-
_
4-
4-
-
+
4,
—
4-
d
d
_
••-or*
4-
4-
d
4-
d
4-
d
-
—
d
4-
_
d
-
-
•f
•f
d
-
_
•~
Eetwardstella
4-
-
—
4-
-
—
4-
—
—
-
-
—
_
4-
—
—
-
-
-
—
-
—
—
—
4"
—
—
-
4-
4-
4-
4-
-
—
"*
CItrobacter
+
-
4-
4-
4-
4-
+
—
4-
d
d
—
+ or x
+
4-
d
4-
d
4-
+
4-
d
4-
+
—
d
-
D
D
—
d
(*)
—
~
! Salmonella
+
-
O
4-
D
O
4-
—
4-
D
_
d
D
4-
4-
—
+
-
4-
4-
4-
—
D
D
4-
—
4-
D
4-
—
4-
4-
-
—
—
-S
1
•c
w
Da
_
d
—
-
—
+
—
d
- •
D
D
—
- D
D
-
—
-
4-
—
—
-
-
D
—
d
-
—
~
Group II
Klebsie/la
1
+
.-
4-
d
4-
d
+
d
4-
d-
4-
D
4-
+
4-
4-
4-
4-
+
d
4-
D
d
D
D
—
(d)
-
d
d
-
d
—
—
Enterobacter
+
-
4-
4-
4-
d
4-
4-
4-
-
O
D
4-
4-
4-
4-
4-
4-
4-
*
4-
4-
4-
-
-
+
D
(4-)
-
—
D
4-
(d)
~
"c
1
+
-
4-
4-
4-
-
4-
-
4-
-
-
_
-
4-
4-
-
-
- or x
4-
+
4-
4-
-
-
4-
—
-
-
—
4-
4-
-
~
Serratia
4-
-
4-
d
4-
—
4-
d
-
-
-
d
-
4-
4-
+
+
4-
d
4-
4-
—
-
D
—
4-
-
-
4-
4-
-
—
Group III
Proteus
4-
-
—
O
4-
4
D
-
-
d
O
-
D
D
d
- •
D
d.
D
4-
d
-
D
D
0
d
D
D
4-
+
Group IV
Yersinia
4-
-
4-
-
-
4
D
4-
-
D
—
—
4-
4-
D
O
D
4-
O
-
—
D
4-
—
—
-
D
D
—
D
b
_
*D * diltofonl rtactions given by different species of a genus; d = different reactions given by different strains of a species or serotype;
X » late end irregularly positive (mutative).
From Sergey's Manual of Determinative Bacteriology, Eighth Ed. (2)
176
MICROBIOLOGICAL MANUAL 1978
image:
TABLE lll-E-5
Biochemical Characteristics of the Enterobacteriaceae
Reaction
Catalaso
Oxidise
8-Q»!»closid«sc
Gas Irom Glucose
»I35C
KCN (growth on)
Mucate (»cid)
NiDate reduction
Carbohydrates:
(acid produclion)
AdomtcH
Arabinose
Outeitol
Esculin
Inosllol
Lactose
Maltose
Manmtol
Satlcin
Sorbilol
Sucrose
Trehalose
Xylose
Related C sources:
Ciliato
Gluconato
Malonate
cT-Tartrala
MR
VP,
Protein reactions;
Arginine
Gelatin hydrolysis
H}S Jrom TSI
Indote
Lyilno
docarboxylaie
Orntthme
Uie* hydrolysis
Glutimic icld
Phenylatanlne
Group 1
' 1
4-
_
4-
4-
-
+
4,
—
4-
d
d
_
••-or*
4-
4-
d
4-
d
4-
d
-
—
d
4-
_
d
-
-
•f
•f
d
-
_
•~
Eetwardstella
4-
-
—
4-
-
—
4-
—
—
-
-
—
_
4-
—
—
-
-
-
—
-
—
—
—
4"
—
—
-
4-
4-
4-
4-
-
—
"*
CItrobacter
+
-
4-
4-
4-
4-
+
—
4-
d
d
—
+ or x
+
4-
d
4-
d
4-
+
4-
d
4-
+
—
d
-
D
D
—
d
(*)
—
~
! Salmonella
+
-
O
4-
D
O
4-
—
4-
D
_
d
D
4-
4-
—
+
-
4-
4-
4-
—
D
D
4-
—
4-
D
4-
—
4-
4-
-
—
—
-S
1
•c
w
Da
_
d
—
-
—
+
—
d
- •
D
D
—
- D
D
-
—
-
4-
—
—
-
-
D
—
d
-
—
~
Group II
Klebsie/la
1
+
.-
4-
d
4-
d
+
d
4-
d-
4-
D
4-
+
4-
4-
4-
4-
+
d
4-
D
d
D
D
—
(d)
-
d
d
-
d
—
—
Enterobacter
+
-
4-
4-
4-
d
4-
4-
4-
-
O
D
4-
4-
4-
4-
4-
4-
4-
*
4-
4-
4-
-
-
+
D
(4-)
-
—
D
4-
(d)
~
"c
1
+
-
4-
4-
4-
-
4-
-
4-
-
-
_
-
4-
4-
-
-
- or x
4-
+
4-
4-
-
-
4-
—
-
-
—
4-
4-
-
~
Serratia
4-
-
4-
d
4-
—
4-
d
-
-
-
d
-
4-
4-
+
+
4-
d
4-
4-
—
-
D
—
4-
-
-
4-
4-
-
—
Group III
Proteus
4-
-
—
O
4-
4
D
-
-
d
O
-
D
D
d
- •
D
d.
D
4-
d
-
D
D
0
d
D
D
4-
+
Group IV
Yersinia
4-
-
4-
-
-
4
D
4-
-
D
—
—
4-
4-
D
O
D
4-
O
-
—
D
4-
—
—
-
D
D
—
D
b
_
*D * diltofonl rtactions given by different species of a genus; d = different reactions given by different strains of a species or serotype;
X » late end irregularly positive (mutative).
From Sergey's Manual of Determinative Bacteriology, Eighth Ed. (2)
176
MICROBIOLOGICAL MANUAL 1978
image:
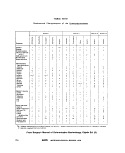 6.3.3 Bunsen/Fisher burner or electric
incinerator.
6.3.4 Inoculating loop (3 mm) and needle.
6.3.5 McFarland Barium Sulfate Standard
#10 (Difco 0691).
6.3.6 Test tubes, 150 x 25 or 150 x 20
mm and 100 x 13mm.
6.3.7 Glass microscope slides, 5.0 x 7.6
cm (2" x 3") cleaned to remove grease and oil.
6.3.8 Salmonella Q Antiserum Poly (Difco
2264, BBL 40707, Sylvana 27-108A or
equivalent).
6.3.9 Salmonella Vi Antiserum {Sylvana
27-106A, BBL 40708, Difco 2827, or
equivalent).
6.3.10 Salmonella 0 Antisera Set A-l
{Difco 2892) includes 1 vial each of Groups, A,
B, C1f C2, D, E1( Ev E2, E4, F, G, H and I; Poly A-l
and Vi.
Salmonella Grouping Serum Kit {BBL
40709) includes one vial each of Groups A, B,
C!, C2, D and E Polyvalent and Vi.
6.3.11 Salmonella H Antiserum (BBL
407-99, Difco 2406-47 or equivalent).
6.3.12 Capillary pipets with rubber bulb.
6.4 Media
6.4.1 Brain heart infusion (BHI) broth {BBL
11058, Difco 0027 or .equivalent) {Part ll-B,
5.4.5).
6.4.2 Brain heart infusion (BHI) agar slant
(BBL 11064, Difco 0418 or equivalent) (Part II-
8,5.4.6),
6.4.3 Motility medium {Difco 0869, BBL
11436, or equivalent) (Part ll-B, 5.5.16).
6.4.4 H-broth (Difco 0451, BBL 11289, or
equivalent) (Part ll-B, 5.5.17).
6.4.5 Blood agar base (without blood)
(Difco 0045-02, BBL 11036, or equivalent)
(Part ll-B, 5.4.18).
6.4.6 Nutrient agar {Difco 0001-02, BBL
11471, or equivalent) (Part II-D, 5.1.1).
6.4.7 Phenolized saline (0.6 grams phenol
in 100 ml of 0.5-0.85% NaCI solution).
6.4,8 Formalinized saline {0.6 ml formalin
in 100 ml of 0.5-0.85% NaCI solution).
6.5 Procedure: as described in Figure III-E-
1, there are serological procedures for the 3
antigen groups, O, Vi and H. However, it is
usually necessary only to test for the O and Vi
antigens for verification of the Salmonella
identification.
6.5,1 Sljde Agglutination Test for 0^
Grouping (30)
(a) Prepare a dense suspension of organ-
isms from a fresh 24 hour BHI slant in 0,5 ml
of phenolized saline solution. The suspension
should be homogeneous and at least as
concentrated as that of McFarland Barium
Sulfate Standard #10, which corresponds to
3 x 1Q9 cells/ml.
(b) Mark rectangular areas on an alcohol-
cleaned glass slide with a wax pencil. Mark
heavy continuous lines to prevent flow of sus-
pension from one section to another as shown
in the example below. For safety, it is recom-
mended that the outside perimeter be in-
scribed with a wax line to prevent flow off the
edge of the slide. Note that slide sections 1, 2
and 3 are controls and section 4 is the one
complete test:
1
O
11
11
6
9
!'
b
9
1 1
• i
1 1
o
o
H
!',
a
SALMONELLA
177
image:
6.3.3 Bunsen/Fisher burner or electric
incinerator.
6.3.4 Inoculating loop (3 mm) and needle.
6.3.5 McFarland Barium Sulfate Standard
#10 (Difco 0691).
6.3.6 Test tubes, 150 x 25 or 150 x 20
mm and 100 x 13mm.
6.3.7 Glass microscope slides, 5.0 x 7.6
cm (2" x 3") cleaned to remove grease and oil.
6.3.8 Salmonella Q Antiserum Poly (Difco
2264, BBL 40707, Sylvana 27-108A or
equivalent).
6.3.9 Salmonella Vi Antiserum {Sylvana
27-106A, BBL 40708, Difco 2827, or
equivalent).
6.3.10 Salmonella 0 Antisera Set A-l
{Difco 2892) includes 1 vial each of Groups, A,
B, C1f C2, D, E1( Ev E2, E4, F, G, H and I; Poly A-l
and Vi.
Salmonella Grouping Serum Kit {BBL
40709) includes one vial each of Groups A, B,
C!, C2, D and E Polyvalent and Vi.
6.3.11 Salmonella H Antiserum (BBL
407-99, Difco 2406-47 or equivalent).
6.3.12 Capillary pipets with rubber bulb.
6.4 Media
6.4.1 Brain heart infusion (BHI) broth {BBL
11058, Difco 0027 or .equivalent) {Part ll-B,
5.4.5).
6.4.2 Brain heart infusion (BHI) agar slant
(BBL 11064, Difco 0418 or equivalent) (Part II-
8,5.4.6),
6.4.3 Motility medium {Difco 0869, BBL
11436, or equivalent) (Part ll-B, 5.5.16).
6.4.4 H-broth (Difco 0451, BBL 11289, or
equivalent) (Part ll-B, 5.5.17).
6.4.5 Blood agar base (without blood)
(Difco 0045-02, BBL 11036, or equivalent)
(Part ll-B, 5.4.18).
6.4.6 Nutrient agar {Difco 0001-02, BBL
11471, or equivalent) (Part II-D, 5.1.1).
6.4.7 Phenolized saline (0.6 grams phenol
in 100 ml of 0.5-0.85% NaCI solution).
6.4,8 Formalinized saline {0.6 ml formalin
in 100 ml of 0.5-0.85% NaCI solution).
6.5 Procedure: as described in Figure III-E-
1, there are serological procedures for the 3
antigen groups, O, Vi and H. However, it is
usually necessary only to test for the O and Vi
antigens for verification of the Salmonella
identification.
6.5,1 Sljde Agglutination Test for 0^
Grouping (30)
(a) Prepare a dense suspension of organ-
isms from a fresh 24 hour BHI slant in 0,5 ml
of phenolized saline solution. The suspension
should be homogeneous and at least as
concentrated as that of McFarland Barium
Sulfate Standard #10, which corresponds to
3 x 1Q9 cells/ml.
(b) Mark rectangular areas on an alcohol-
cleaned glass slide with a wax pencil. Mark
heavy continuous lines to prevent flow of sus-
pension from one section to another as shown
in the example below. For safety, it is recom-
mended that the outside perimeter be in-
scribed with a wax line to prevent flow off the
edge of the slide. Note that slide sections 1, 2
and 3 are controls and section 4 is the one
complete test:
1
O
11
11
6
9
!'
b
9
1 1
• i
1 1
o
o
H
!',
a
SALMONELLA
177
image:
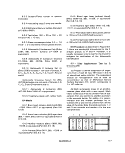 Section 1 -Add antiserum alone.
Section 2 - Combine antiserum and
0.85% Nad.
Section 3 - Combine bacterial suspension
and 0,85% NaCI.
Section 4 - Combine bacterial suspen-
sion, 0.85% NaCI and antiserum.
For large numbers of cultures, the 2x3
Inch (50 x 75 cm) glass slide can be used to
accommodate 12 or more sections per slide in
2'rows. It is recommended that only one cul-
ture be tested at one time against the series of
sera to avoid premature drying. As in the fol-
lowing example:
C2
z
tu O
K ^
isidsns
nnno
O
!'
6
9
it
11
1 1
O
0
r
1
6
O
I
1
1
6
o
i
i
6
9
f I
1 1
6
(c) Place a drop of Salmonella polyvalent 0
antiserum near the top of a rectangle and a
drop of saline near the bottom.
(d) Using a wire loop, suspend a sufficient
amount of growth from an isolated colony or a
BHI slant into the drop of saline to produce a
milky suspension.
(e) Mix the suspension with the antiserum,
using the wire loop. Make a long, narrow track
ratherthan a circular pool.
(f) Flame loop well between uses to pre-
vent cross-reactions from contamination of
sera.
(g) Mix the antigen and antiserum further
by tilting the slide back and forth until aggluti-
nation (or clumping) is apparent. If agglutina-
tion is not evident or if it is weak at the end of 1
minute, consider the reaction negative. Com-
pare reactions with controls. As a QC function,
test antisera against cultures of known reac-
tions, monthly or as indicated.
(h) If the polyvalent test is positive, test the
culture with Salmonella 0 groups A, B, C, D
and E antisera. Kits containing additional 0
group antisera are described in 6.3.
6.5.2 Slide Agglutination Test for Vi Anti-
gen (S. typhi) (30): Occasionally S. lyphTwltt be
isolated without the capsule-like Vi antigen.
The procedure described in 6.5.1 will identify
it as Salmonella, O group D, If the biochemical
reactions are characteristic of S. typhi, record
the results presumptively as S. typhi, no Vi
antigen detected and in this case, check other
colonies from same plate for Vi antigen. If Vi
antigen is present, it will block O agglutination
and the procedure described in 6.5.1 will not
identify the serogroup. If S. typn/ls suspected,
proceed as follows:
(a) To three rectangles on a glass slide,
add respectively:
(1) Polyvalent Salmonella antiserum.
(2) Group D 'SalmonellaQ antiserum.
(3) Vi antiserum.
(b) Mix with antigen as in procedure 6.5.1.
(c) Reactions and interpretation:
(1) No agglutination in any rectangle - not
a common Salmonella,
(2) Agglutination in polyvalent antiserum
only - possibly a Salmonella other than Group
D. Check antigen in other 0 groups.
(3) Agglutination in Vi antiserum only or in
Vi and weakly in polyvalent - presumptive S.
typhi.
178
MICROBIOLOGICAL MANUAL 1978
image:
Section 1 -Add antiserum alone.
Section 2 - Combine antiserum and
0.85% Nad.
Section 3 - Combine bacterial suspension
and 0,85% NaCI.
Section 4 - Combine bacterial suspen-
sion, 0.85% NaCI and antiserum.
For large numbers of cultures, the 2x3
Inch (50 x 75 cm) glass slide can be used to
accommodate 12 or more sections per slide in
2'rows. It is recommended that only one cul-
ture be tested at one time against the series of
sera to avoid premature drying. As in the fol-
lowing example:
C2
z
tu O
K ^
isidsns
nnno
O
!'
6
9
it
11
1 1
O
0
r
1
6
O
I
1
1
6
o
i
i
6
9
f I
1 1
6
(c) Place a drop of Salmonella polyvalent 0
antiserum near the top of a rectangle and a
drop of saline near the bottom.
(d) Using a wire loop, suspend a sufficient
amount of growth from an isolated colony or a
BHI slant into the drop of saline to produce a
milky suspension.
(e) Mix the suspension with the antiserum,
using the wire loop. Make a long, narrow track
ratherthan a circular pool.
(f) Flame loop well between uses to pre-
vent cross-reactions from contamination of
sera.
(g) Mix the antigen and antiserum further
by tilting the slide back and forth until aggluti-
nation (or clumping) is apparent. If agglutina-
tion is not evident or if it is weak at the end of 1
minute, consider the reaction negative. Com-
pare reactions with controls. As a QC function,
test antisera against cultures of known reac-
tions, monthly or as indicated.
(h) If the polyvalent test is positive, test the
culture with Salmonella 0 groups A, B, C, D
and E antisera. Kits containing additional 0
group antisera are described in 6.3.
6.5.2 Slide Agglutination Test for Vi Anti-
gen (S. typhi) (30): Occasionally S. lyphTwltt be
isolated without the capsule-like Vi antigen.
The procedure described in 6.5.1 will identify
it as Salmonella, O group D, If the biochemical
reactions are characteristic of S. typhi, record
the results presumptively as S. typhi, no Vi
antigen detected and in this case, check other
colonies from same plate for Vi antigen. If Vi
antigen is present, it will block O agglutination
and the procedure described in 6.5.1 will not
identify the serogroup. If S. typn/ls suspected,
proceed as follows:
(a) To three rectangles on a glass slide,
add respectively:
(1) Polyvalent Salmonella antiserum.
(2) Group D 'SalmonellaQ antiserum.
(3) Vi antiserum.
(b) Mix with antigen as in procedure 6.5.1.
(c) Reactions and interpretation:
(1) No agglutination in any rectangle - not
a common Salmonella,
(2) Agglutination in polyvalent antiserum
only - possibly a Salmonella other than Group
D. Check antigen in other 0 groups.
(3) Agglutination in Vi antiserum only or in
Vi and weakly in polyvalent - presumptive S.
typhi.
178
MICROBIOLOGICAL MANUAL 1978
image:
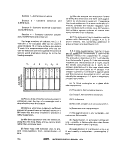 (d) Follow-up on reactions (3) immediately
above:
(1) Make a heavy suspension of antigen in
0.5 ml of phenolized saline.
(2) Heat the suspension for 1 5 minutes in a
boiling water bath.
(3) Cool and retest suspension in the
above three antisera. Include the three con-
trols as in 6.5.1 (b).
(4) Compare results of slide agglutination
obtained with live and heated antigens. S. ty-
phi will give the following reactions:
Antiserum
Antigen
Live Heated
Polyvalent Salmonella
0 group D
Vi
+ or -
6.5.3 Alternative Procedure for Salmo-
nella, Including S. typhi: Edwards & Ewing and
Douglas & Washington describe this alternate
procedure as a more rapid serological method
(1,30).
(a) Slide test the organism for agglutina-
tion in polyvalent 0, Vi, and all of the common
O group antisera at the same time. When indic-
ated, heat antigen as described in 6.5.2 (d).
(b) Interpret results as outlined in 6.5.1
and 6.5.2.
6.5.4 Tube Test for H Antigen (1): Before
tests are made for H (flagellar) antigen, test for
motility by inoculating the pure cultures into
Motility Test Medium (5.5.1 6), incubating and
reading. If the tests are negative, transfer the
cultures again through the motility medium
before performing the flagellar antigen test.
Motility medium in large diameter tubes or
small petri dishes may be inoculated on one
side and motile descendants picked on the
other side after 24 hours. The test procedure
follows:
(a) Inoculate H-broth from an 18-24 hour
pure culture and incubate 18 hours at 30 C or
with heavy inoculum in 35 C water bath for 4
hours.
(b) Dilute the 18 hour culture 1:1 with
formalinized saline and mix. Allow to stand at
room temperature for 1 hour.
(c) Pipet 0.5 ml of the formalinized culture
to small test tubes (13 x 100 mm), 1
tube/antiserum.
(d) Prepare dilution of polyvalent H antis-
era according to directions of manufacturer
(usually 1:1000). Add 0.5 ml to each tube
using a fresh pipet for each tube. Mix by pipet-
ting the solution up and down several times.
(e) Incubate tubes for 1 hour in 50 C water
bath. If the H-antigen is present,
flocculation/agglutination may occur in 5-10
minutes but wjll occur within 1 hour. The posi-
tive test is indicated by a diffused, fluffy sedi-
ment in the bottom of the tube. A negative
reaction gives a tight "button-like" group of
cells in the bottom of the tube.
6.5.5 Confirmation of Salmonellaio sero-
type by an official typing center or state health
laboratory is recommended when required for
tracing sources of contamination, for enforce-
ment or for other Agency actions. This service
is usually available if cultures are of public
health significance. See II-C, 6 for details on,
proper shipment procedures.
7. Quantitative Techniques
7.1 Summary: These quantitative me-
thods are time-consuming, but necessary
when it is desirable to determine salmonellae
densities in recreational waters, shellfish-
raising waters, stormwater run-off, wastewa-
ters and sludges.
7.1.1 Samples are concentrated if neces-
sary by the standard techniques described in
this Section.
SALMONELLA
179
image:
(d) Follow-up on reactions (3) immediately
above:
(1) Make a heavy suspension of antigen in
0.5 ml of phenolized saline.
(2) Heat the suspension for 1 5 minutes in a
boiling water bath.
(3) Cool and retest suspension in the
above three antisera. Include the three con-
trols as in 6.5.1 (b).
(4) Compare results of slide agglutination
obtained with live and heated antigens. S. ty-
phi will give the following reactions:
Antiserum
Antigen
Live Heated
Polyvalent Salmonella
0 group D
Vi
+ or -
6.5.3 Alternative Procedure for Salmo-
nella, Including S. typhi: Edwards & Ewing and
Douglas & Washington describe this alternate
procedure as a more rapid serological method
(1,30).
(a) Slide test the organism for agglutina-
tion in polyvalent 0, Vi, and all of the common
O group antisera at the same time. When indic-
ated, heat antigen as described in 6.5.2 (d).
(b) Interpret results as outlined in 6.5.1
and 6.5.2.
6.5.4 Tube Test for H Antigen (1): Before
tests are made for H (flagellar) antigen, test for
motility by inoculating the pure cultures into
Motility Test Medium (5.5.1 6), incubating and
reading. If the tests are negative, transfer the
cultures again through the motility medium
before performing the flagellar antigen test.
Motility medium in large diameter tubes or
small petri dishes may be inoculated on one
side and motile descendants picked on the
other side after 24 hours. The test procedure
follows:
(a) Inoculate H-broth from an 18-24 hour
pure culture and incubate 18 hours at 30 C or
with heavy inoculum in 35 C water bath for 4
hours.
(b) Dilute the 18 hour culture 1:1 with
formalinized saline and mix. Allow to stand at
room temperature for 1 hour.
(c) Pipet 0.5 ml of the formalinized culture
to small test tubes (13 x 100 mm), 1
tube/antiserum.
(d) Prepare dilution of polyvalent H antis-
era according to directions of manufacturer
(usually 1:1000). Add 0.5 ml to each tube
using a fresh pipet for each tube. Mix by pipet-
ting the solution up and down several times.
(e) Incubate tubes for 1 hour in 50 C water
bath. If the H-antigen is present,
flocculation/agglutination may occur in 5-10
minutes but wjll occur within 1 hour. The posi-
tive test is indicated by a diffused, fluffy sedi-
ment in the bottom of the tube. A negative
reaction gives a tight "button-like" group of
cells in the bottom of the tube.
6.5.5 Confirmation of Salmonellaio sero-
type by an official typing center or state health
laboratory is recommended when required for
tracing sources of contamination, for enforce-
ment or for other Agency actions. This service
is usually available if cultures are of public
health significance. See II-C, 6 for details on,
proper shipment procedures.
7. Quantitative Techniques
7.1 Summary: These quantitative me-
thods are time-consuming, but necessary
when it is desirable to determine salmonellae
densities in recreational waters, shellfish-
raising waters, stormwater run-off, wastewa-
ters and sludges.
7.1.1 Samples are concentrated if neces-
sary by the standard techniques described in
this Section.
SALMONELLA
179
image:
 7.1.2 Samples or sample concentrates are
Inoculated into enrichment media in the stan-
dard 5-tube, 3-dilution sequence of the MPN.
See Part II-C.
7.1.3 After incubation, each tube culture
is streaked on selective plating media.
7.1.4 Colonies reacting as Salmonella are
picked and confirmed biochemically or
serologically.
7.1.5 Based on the confirmation above,
the number of tubes confirmed as positive for
Salmonella are tabulated and the MPN index
calculated from the regular MPN table.
7.2 Concentration by MPN (15)
The need for concentration and sample
volumes required vary with the anticipated
salmonellae densities. High density samples
such as sewage may be inoculated directly as
10 ml portions into double-strength, or as 1 ml
or less portions into single strength
enrichment media in MPN tubes (15). Low
density samples may be concentrated by MF,
dlatomaceous earth, or cartridge filters before
analysis by the MPN procedure.
7.3 Concentration by Membrane Filter
or Diatomaceous Earth Filter (12,31, 32,33)
Another quantitative technique uses either
a large MF (142 mm diameter, 0.45 nm pore)
with filter aid (12) or diatomaceous earth with
a support pad. One liter or larger sample is
either mixed with 1%Celiteandfilteredthrough
an MF or is filtered through the diatomaceous
earth and pad. After filtering, the Celite/MF
or diatomaceous plug and pad are placed in
a sterile 1 pint (473 ml) blender jar containing
100 ml sterile 0.1% peptone water and blended
at about 5000 RPM for 1 minute on a Waring
blender (see Part ll-C, 1.3). Beginning with
10 ml of the homogenate, serial tenfold
dilutions (5 replicates per dilution) are inocu-
lated into enrichment media. Verification tests
are done on each positive enrichment tube
and the MPN is calculated from the number of
tubes which verify.
7.4 Concentration by Cartridge Filter (5)
The cartridge filter is particularly useful for
concentrating large sample volumes (5). The
sample is placed in a sterile, calibrated
container and measured volumes (e.g. 10, 1
and 0.1 liters) are passed through separate
filters as described in this Section, 2,4. To
speed the analyses, 5 replicate portions are
filtered simultaneously through 5 cartridge
filters using a manifold. If turbidity is a
problem, successive filters may be used. The
filters are removed aseptically and placed in
the selected enrichment media. The
concentration procedure is repeated for each
sample volume. Verification tests are done on
each enrichment culture and the MPN is
calculated from the positive verification tests.
8. Optional Fluorescent Antibody Screening
Technique
The fluorescent antibody (FA) technique
may be used as a rapid screening method for
the detection of salmonellae particularly from
large numbers of samples, after primary
enrichment cultures (18-24 hours). Because
this technique does not require pure cultures
or serological typing, positive FA results should
be confirmed by the isolation procedures
described in this Section, 4.5. If the FA test
is negative, the salmonellae detection pro-
cedure may be terminated.
8.1 Summary: An optional FA screening
technique concentrates bacteria from a water
sample in diatomaceous earth ( Celite' or
equivalent). See this Section, 2.2. The diato-
maceous earth with the entrapped bacteria is
added to enrichment broth. After incubation
of the broth, loopfuls of enrichment culture
are transferred to selective plating media
to produce spot cultures on the agar sur-
faces. After the plates are incubated for 3
hours, slide impression smears are prepared
from the micro-colonies and stained with a
Salmonella polyvalent antiserum labeled with
fluorescent dye. Fluorescent cells indicate a
positive reaction and the possible presence of
Salmonella.
180
MICROBIOLOGICAL MANUAL 1978
image:
7.1.2 Samples or sample concentrates are
Inoculated into enrichment media in the stan-
dard 5-tube, 3-dilution sequence of the MPN.
See Part II-C.
7.1.3 After incubation, each tube culture
is streaked on selective plating media.
7.1.4 Colonies reacting as Salmonella are
picked and confirmed biochemically or
serologically.
7.1.5 Based on the confirmation above,
the number of tubes confirmed as positive for
Salmonella are tabulated and the MPN index
calculated from the regular MPN table.
7.2 Concentration by MPN (15)
The need for concentration and sample
volumes required vary with the anticipated
salmonellae densities. High density samples
such as sewage may be inoculated directly as
10 ml portions into double-strength, or as 1 ml
or less portions into single strength
enrichment media in MPN tubes (15). Low
density samples may be concentrated by MF,
dlatomaceous earth, or cartridge filters before
analysis by the MPN procedure.
7.3 Concentration by Membrane Filter
or Diatomaceous Earth Filter (12,31, 32,33)
Another quantitative technique uses either
a large MF (142 mm diameter, 0.45 nm pore)
with filter aid (12) or diatomaceous earth with
a support pad. One liter or larger sample is
either mixed with 1%Celiteandfilteredthrough
an MF or is filtered through the diatomaceous
earth and pad. After filtering, the Celite/MF
or diatomaceous plug and pad are placed in
a sterile 1 pint (473 ml) blender jar containing
100 ml sterile 0.1% peptone water and blended
at about 5000 RPM for 1 minute on a Waring
blender (see Part ll-C, 1.3). Beginning with
10 ml of the homogenate, serial tenfold
dilutions (5 replicates per dilution) are inocu-
lated into enrichment media. Verification tests
are done on each positive enrichment tube
and the MPN is calculated from the number of
tubes which verify.
7.4 Concentration by Cartridge Filter (5)
The cartridge filter is particularly useful for
concentrating large sample volumes (5). The
sample is placed in a sterile, calibrated
container and measured volumes (e.g. 10, 1
and 0.1 liters) are passed through separate
filters as described in this Section, 2,4. To
speed the analyses, 5 replicate portions are
filtered simultaneously through 5 cartridge
filters using a manifold. If turbidity is a
problem, successive filters may be used. The
filters are removed aseptically and placed in
the selected enrichment media. The
concentration procedure is repeated for each
sample volume. Verification tests are done on
each enrichment culture and the MPN is
calculated from the positive verification tests.
8. Optional Fluorescent Antibody Screening
Technique
The fluorescent antibody (FA) technique
may be used as a rapid screening method for
the detection of salmonellae particularly from
large numbers of samples, after primary
enrichment cultures (18-24 hours). Because
this technique does not require pure cultures
or serological typing, positive FA results should
be confirmed by the isolation procedures
described in this Section, 4.5. If the FA test
is negative, the salmonellae detection pro-
cedure may be terminated.
8.1 Summary: An optional FA screening
technique concentrates bacteria from a water
sample in diatomaceous earth ( Celite' or
equivalent). See this Section, 2.2. The diato-
maceous earth with the entrapped bacteria is
added to enrichment broth. After incubation
of the broth, loopfuls of enrichment culture
are transferred to selective plating media
to produce spot cultures on the agar sur-
faces. After the plates are incubated for 3
hours, slide impression smears are prepared
from the micro-colonies and stained with a
Salmonella polyvalent antiserum labeled with
fluorescent dye. Fluorescent cells indicate a
positive reaction and the possible presence of
Salmonella.
180
MICROBIOLOGICAL MANUAL 1978
image:
 8.2 Scope and Application
8.2.1 Advantages: Rapid screening of
large numbers of samples for Salmonella
eliminates negative samples from further
testing.
8.2.2 Limitations: Careful interpretation of
fluorescence is critical for this technique but
difficult to attain. Positive FA results must be
confirmed by the conventional cultural
techniques described above (see Part III-E, 4, 5
and 6). The cost of equipment for fluorescence
microscopy is approximately $5,000.
8.3 Apparatus and Materials
8.3.1 Equipment
(a) Light microscope and low
autofluorescence optics suitable for UV
microscopy.
(b) Condenser, Cardioid Dark-Field, oil
immersion objective 95x, with iris diaphragm
and with a numerical aperture (N.A.) at least
0.05 less than N.A. of objective lens.
(c) Filter Systems
Heat Filters - BG22, KG-1, KG-2 or
equivalent.
Excitation Light Filters - UG1 and BG1 2 or
equivalent.
Barrier Filters - GG-9 and OG1 or
equivalent.
(d) Intense Light System: Fluorescence
illuminator with power source, voltage
regulator and mercury arc, quartz iodide or
tungsten light source.
(e) Incubator set at 35 C + 0.5 C.
8.3.2 Materials
(a) Non-drying low fluorescence immer-
sion oil.
(b) Fluorescent antibody pre-cleaned
micro slides, 2.5 X 7.6cm.
(c) Cover glasses for FA slides,. 1 6-. 19 mm
thick.
(d) FA Kirkpatrick fixative (Difco 3188, or
equivalent).
(e) Petri dishes, 100 x 15 mm, pyrex
glass.
(f) Nail polish.
(g) Phosphate buffered saline, pH 8.0. Add
10 grams of dry FA buffer (Difco 2314-33, or
equivalent) to 1 liter of fresh laboratory pure
water. Dissolve completely and adjust pH to
8.0 with NaOH.
(h) FA mounting fluid (Difco 2329-57, or
equivalent), reagent grade glycerine adjusted
to pH of 9.0-9.6.
(i) Laboratory pure water.
(j) Methanol orethanol, 95%,forsterilizing
forceps.
(k) Staining assembly consisting of jar,
cover and slide rack with handle. At least 5 are
needed: I each for fixative, ethanol and
laboratory pure water and 2 for buffered saline
rinses.
(I) FA Salmonella polyvalent conjugate is
a fluorescein conjugated anti-salmonellae
globulin (Difco 3187, 3185; Sylvana
27-1OOA, or equivalent).
When the conjugate is rehydrated, pre-
pare 0.2-0.3 ml aliquots and freeze for future
use. Rehydrated conjugates stored in the re-
frigerator are not stable. (See 8.4.5 fortitration
of conjugates).
(m) Moist chamber used to hold slides
containing conjugated-stained smears. A sim-
ple chamber consists of a culture dish bottom
(150 x 20 mm) placed over wet toweling. A
larger dish for this purpose may be prepared
by placing moist towels onto a flat tray, then
SALMONELLA
181
image:
8.2 Scope and Application
8.2.1 Advantages: Rapid screening of
large numbers of samples for Salmonella
eliminates negative samples from further
testing.
8.2.2 Limitations: Careful interpretation of
fluorescence is critical for this technique but
difficult to attain. Positive FA results must be
confirmed by the conventional cultural
techniques described above (see Part III-E, 4, 5
and 6). The cost of equipment for fluorescence
microscopy is approximately $5,000.
8.3 Apparatus and Materials
8.3.1 Equipment
(a) Light microscope and low
autofluorescence optics suitable for UV
microscopy.
(b) Condenser, Cardioid Dark-Field, oil
immersion objective 95x, with iris diaphragm
and with a numerical aperture (N.A.) at least
0.05 less than N.A. of objective lens.
(c) Filter Systems
Heat Filters - BG22, KG-1, KG-2 or
equivalent.
Excitation Light Filters - UG1 and BG1 2 or
equivalent.
Barrier Filters - GG-9 and OG1 or
equivalent.
(d) Intense Light System: Fluorescence
illuminator with power source, voltage
regulator and mercury arc, quartz iodide or
tungsten light source.
(e) Incubator set at 35 C + 0.5 C.
8.3.2 Materials
(a) Non-drying low fluorescence immer-
sion oil.
(b) Fluorescent antibody pre-cleaned
micro slides, 2.5 X 7.6cm.
(c) Cover glasses for FA slides,. 1 6-. 19 mm
thick.
(d) FA Kirkpatrick fixative (Difco 3188, or
equivalent).
(e) Petri dishes, 100 x 15 mm, pyrex
glass.
(f) Nail polish.
(g) Phosphate buffered saline, pH 8.0. Add
10 grams of dry FA buffer (Difco 2314-33, or
equivalent) to 1 liter of fresh laboratory pure
water. Dissolve completely and adjust pH to
8.0 with NaOH.
(h) FA mounting fluid (Difco 2329-57, or
equivalent), reagent grade glycerine adjusted
to pH of 9.0-9.6.
(i) Laboratory pure water.
(j) Methanol orethanol, 95%,forsterilizing
forceps.
(k) Staining assembly consisting of jar,
cover and slide rack with handle. At least 5 are
needed: I each for fixative, ethanol and
laboratory pure water and 2 for buffered saline
rinses.
(I) FA Salmonella polyvalent conjugate is
a fluorescein conjugated anti-salmonellae
globulin (Difco 3187, 3185; Sylvana
27-1OOA, or equivalent).
When the conjugate is rehydrated, pre-
pare 0.2-0.3 ml aliquots and freeze for future
use. Rehydrated conjugates stored in the re-
frigerator are not stable. (See 8.4.5 fortitration
of conjugates).
(m) Moist chamber used to hold slides
containing conjugated-stained smears. A sim-
ple chamber consists of a culture dish bottom
(150 x 20 mm) placed over wet toweling. A
larger dish for this purpose may be prepared
by placing moist towels onto a flat tray, then
SALMONELLA
181
image:
 placing the slides face-up on this surface and
covering the tray with an inverted glass baking
pan orsimilar metal pan.
8.3.3 Media
(a) Brain heart infusion (BHI) broth (Difco
0038, BBL 11059, or equivalent). See Part II-B,
5.4.5..
(b) Brilliant green agar (BG) (BBL 11073,
Difco 0285-01). See Part II-B, 5.5.5.
(c) Xylose lysine desoxycholate agar (XLD)
(BBL 11838, Difco 0788-01). See Part II-B,
5.5.7.
(d) Xylose lysine brilliant green agar
(XLBG) XL agar base (BBL 1 1836, Difco 0555).
See Part II-B, 5.5.6.
8.4 FA Staining Techniques (13, 34, 35)
8.4.1 Preparation
Collect samples and concentrate them by
cartridge filter, membrane filter or diato-
maceous earth technique as described in this
Section, 2.2, 2.3 and 2.4.
After concentration, place whole or half
plugs and pads, cartridge filters or membrane
filters into flasks of selenite broth, tetrathionate
broth, dulcitol selenite broth or tetrathionate
brilliant green broth. Incubate flasks for
18-24 hours at 35 and 41.5 C. See this
Section, 3.
8.4.2 Spot Culture Plates: After the primary
enrichment has been incubated 18-24 hours,
prepare spot culture plates on the differential
media: brilliant green (BG) agar, xylose lysine
desoxycholate (XLD) agar, and xylose lysine
brilliant green (XLBG) agar as follows:
(a) Mark the bottom of the plate to locate
the drops of inoculum then place 1 drop of
enrichment culture at 4 separate points on the
surface of each solid medium.
(b) Space the drops 6-7 cm apart on the
plate so that when an FA microscope slide is
later placed over 2 of the drops, both inocula-
tion points will be included on the slide. This is
essential, since glass slide impression smears
of the inoculated points will be made after
incubation of the plates.
(c) After the spots have been placed on the
agar surface of the differential plates, incubate
the plates at 35 C for 3 hours.
(d) Remove the plates after incubation and
make impression smears.
8.4.3 Impression Slides: Place a clean FA
1x3 inch glass slide (nonfluorescent) over 2
of the inoculated points on the agar. Press
down lightly, without moving the glass slide to
either side. Too much pressure will cause
movement of the slide and accumulation of
agar on the slide. Repeat the process for the
remaining 2 inoculation points with another
clean slide. Make impression slides for each
differential plate.
8.4.4 Fixing Slides
(a) Air dry the smears.
(b) Fix for 2 minutes in Kirkpartick's Fixa-
tive (mix 60 ml absolute ethanol, 30 ml chloro-
form, and 10 ml formalin).
(c) Rinse the slides briefly in 95% ethanol.
(d) Air dry. Do not blot.
8.4.5 Titration of Conjugates
After the slides have been fixed, stain with
Salmonella FA conjugate. However, each lot
number of conjugate must be titered before
use.
Based on the previous experience of the
analyst or other workers, the conjugate and
test components must have been proven with
water samples. Sources of polyvalent conju-
gates known to be acceptable (CDC Approved
List) are: Burroughs Wellcome & Company,
Clinical Sciences Inc., Difco Laboratories and
Sylvana Company.
182
dEPA MICROBIOLOGICAL MANUAL 1978
image:
placing the slides face-up on this surface and
covering the tray with an inverted glass baking
pan orsimilar metal pan.
8.3.3 Media
(a) Brain heart infusion (BHI) broth (Difco
0038, BBL 11059, or equivalent). See Part II-B,
5.4.5..
(b) Brilliant green agar (BG) (BBL 11073,
Difco 0285-01). See Part II-B, 5.5.5.
(c) Xylose lysine desoxycholate agar (XLD)
(BBL 11838, Difco 0788-01). See Part II-B,
5.5.7.
(d) Xylose lysine brilliant green agar
(XLBG) XL agar base (BBL 1 1836, Difco 0555).
See Part II-B, 5.5.6.
8.4 FA Staining Techniques (13, 34, 35)
8.4.1 Preparation
Collect samples and concentrate them by
cartridge filter, membrane filter or diato-
maceous earth technique as described in this
Section, 2.2, 2.3 and 2.4.
After concentration, place whole or half
plugs and pads, cartridge filters or membrane
filters into flasks of selenite broth, tetrathionate
broth, dulcitol selenite broth or tetrathionate
brilliant green broth. Incubate flasks for
18-24 hours at 35 and 41.5 C. See this
Section, 3.
8.4.2 Spot Culture Plates: After the primary
enrichment has been incubated 18-24 hours,
prepare spot culture plates on the differential
media: brilliant green (BG) agar, xylose lysine
desoxycholate (XLD) agar, and xylose lysine
brilliant green (XLBG) agar as follows:
(a) Mark the bottom of the plate to locate
the drops of inoculum then place 1 drop of
enrichment culture at 4 separate points on the
surface of each solid medium.
(b) Space the drops 6-7 cm apart on the
plate so that when an FA microscope slide is
later placed over 2 of the drops, both inocula-
tion points will be included on the slide. This is
essential, since glass slide impression smears
of the inoculated points will be made after
incubation of the plates.
(c) After the spots have been placed on the
agar surface of the differential plates, incubate
the plates at 35 C for 3 hours.
(d) Remove the plates after incubation and
make impression smears.
8.4.3 Impression Slides: Place a clean FA
1x3 inch glass slide (nonfluorescent) over 2
of the inoculated points on the agar. Press
down lightly, without moving the glass slide to
either side. Too much pressure will cause
movement of the slide and accumulation of
agar on the slide. Repeat the process for the
remaining 2 inoculation points with another
clean slide. Make impression slides for each
differential plate.
8.4.4 Fixing Slides
(a) Air dry the smears.
(b) Fix for 2 minutes in Kirkpartick's Fixa-
tive (mix 60 ml absolute ethanol, 30 ml chloro-
form, and 10 ml formalin).
(c) Rinse the slides briefly in 95% ethanol.
(d) Air dry. Do not blot.
8.4.5 Titration of Conjugates
After the slides have been fixed, stain with
Salmonella FA conjugate. However, each lot
number of conjugate must be titered before
use.
Based on the previous experience of the
analyst or other workers, the conjugate and
test components must have been proven with
water samples. Sources of polyvalent conju-
gates known to be acceptable (CDC Approved
List) are: Burroughs Wellcome & Company,
Clinical Sciences Inc., Difco Laboratories and
Sylvana Company.
182
dEPA MICROBIOLOGICAL MANUAL 1978
image:
 The Difco Bacto-FA Poly Conjugate con-
tains antibodies against the major 0, Vi and H
antigens. The Sylvana Salmonella Polyvalent
OH Globulin represents the somatic antigens
of Salmonella O groups A through S. The Difco
Panvalent conjugate is not recommended be-
cause of excessive cross-reactions.
Titer the conjugate as follows:
(a) Inoculate a known Salmonella culture
into BHI broth. Incubate at 35 C for 18-24
hours.
(b) From this broth culture, make smears
on clean FA glass slides. Prepare enough
smears for each conjugate dilution and con-
trols. Include a known 4 + Salmonella control
to be used as a reading standard. Air dry the
smears and follow the instructions for fixing
slides. Part III-E, 8.4.4.
(c) Prepare the following dilutions of the
conjugate in buffered saline: 1:2, 1:4, 1:6, 1:8
and 1:10. Most batches are effective at the 1:4
dilution.
(d) Cover a smear with one of the conju-
gate dilutions or the undiluted conjugate.
Place slides in moist chamber and proceed as
in Part III-E, 8.4.6 (b)-(f) and 8.4.7 (a)-(b). Use the
known 4 + Salmonella control as the standard.
(e) The titer of conjugate to be used is the
second highest dilution which gives 4 +
fluorescence. For example, if the conjugate
dilutions outlined above in 8.4.5 (c) above gave
fluorescence intensity ratings (in order) 4 + ,
4 + , 4+, 2 + , 1 +, the conjugate dilution to be
employed would be 1:4. This value should be
marked on the conjugate bottle. Prepare an
amount of chosen conjugate dilution sufficient
for each day's run.
8.4.6 Staining Impression Slides: After the
slides have been fixed, they are stained with
Salmonella FA conjugate.
(a) Cover each smear with one drop of the
predetermined dilutions of conjugate (Difco
FA Salmonella Polyvalent, or Sylvana Polyva-
lent OH Globulin). Include a known 4+ Salmo-
nella culture as a procedure control. Place the
slides in a moist chamber to prevent evapora-
tion of the staining reagent. Tap off excess
reagent onto paper towel.
(b) After 30 minutes, wash away the ex-
cess reagent by dipping the slides into a bath
of saline buffered at pH 7.2.
(c) Transfer the slides to a second bath of
buffered saline for 10 minutes.
(d) Replace the rinse solutions in (b) and (c)
above, after each use.
(e) Rem'ove slides, rinse in a laboratory
pure water bath and allow to drain dry. Do not
blot
(f) Place a small drop of FA mounting fluid
(Difco 2329-57) onto the smear and cover
with a coverslip. Seal the edges of the cover-
slip with nail polish. Such slides may be stored
for up to 1 year in a freezer at -70 C with
minimal loss of fluorescence.
(g) Examine the slides under a
fluorescence microscope (900-1 OOOx) fitted
with the proper filters. Use a known 4+ slide
for comparison. Read slides within 2% hours if
slides have not been sealed and stored in a
deep-freeze.
8.4.7 Interpretation of Fluorescence, Re-
porting Results
(a) Fluoresence results are recorded as
shown in the following table. The number of
fluorescing cells and the degree of
fluorescence/cell are the criteria on which
positive results are based. Smears with large
numbers of strongly fluorescent cells (3+ or
4+) are positve; weakly fluorescent cells are
negative. Smears with few fluorescent cells
should be examined carefully.
(b) Cultures giving positive FA reactions
(4+ or 3+) must be isolated on differential
plating media, confirmed by biochemical iden-
tification, and verified serologically. Cultures
displaying negative FA results may be
discarded.
SALMONELLA
183
image:
The Difco Bacto-FA Poly Conjugate con-
tains antibodies against the major 0, Vi and H
antigens. The Sylvana Salmonella Polyvalent
OH Globulin represents the somatic antigens
of Salmonella O groups A through S. The Difco
Panvalent conjugate is not recommended be-
cause of excessive cross-reactions.
Titer the conjugate as follows:
(a) Inoculate a known Salmonella culture
into BHI broth. Incubate at 35 C for 18-24
hours.
(b) From this broth culture, make smears
on clean FA glass slides. Prepare enough
smears for each conjugate dilution and con-
trols. Include a known 4 + Salmonella control
to be used as a reading standard. Air dry the
smears and follow the instructions for fixing
slides. Part III-E, 8.4.4.
(c) Prepare the following dilutions of the
conjugate in buffered saline: 1:2, 1:4, 1:6, 1:8
and 1:10. Most batches are effective at the 1:4
dilution.
(d) Cover a smear with one of the conju-
gate dilutions or the undiluted conjugate.
Place slides in moist chamber and proceed as
in Part III-E, 8.4.6 (b)-(f) and 8.4.7 (a)-(b). Use the
known 4 + Salmonella control as the standard.
(e) The titer of conjugate to be used is the
second highest dilution which gives 4 +
fluorescence. For example, if the conjugate
dilutions outlined above in 8.4.5 (c) above gave
fluorescence intensity ratings (in order) 4 + ,
4 + , 4+, 2 + , 1 +, the conjugate dilution to be
employed would be 1:4. This value should be
marked on the conjugate bottle. Prepare an
amount of chosen conjugate dilution sufficient
for each day's run.
8.4.6 Staining Impression Slides: After the
slides have been fixed, they are stained with
Salmonella FA conjugate.
(a) Cover each smear with one drop of the
predetermined dilutions of conjugate (Difco
FA Salmonella Polyvalent, or Sylvana Polyva-
lent OH Globulin). Include a known 4+ Salmo-
nella culture as a procedure control. Place the
slides in a moist chamber to prevent evapora-
tion of the staining reagent. Tap off excess
reagent onto paper towel.
(b) After 30 minutes, wash away the ex-
cess reagent by dipping the slides into a bath
of saline buffered at pH 7.2.
(c) Transfer the slides to a second bath of
buffered saline for 10 minutes.
(d) Replace the rinse solutions in (b) and (c)
above, after each use.
(e) Rem'ove slides, rinse in a laboratory
pure water bath and allow to drain dry. Do not
blot
(f) Place a small drop of FA mounting fluid
(Difco 2329-57) onto the smear and cover
with a coverslip. Seal the edges of the cover-
slip with nail polish. Such slides may be stored
for up to 1 year in a freezer at -70 C with
minimal loss of fluorescence.
(g) Examine the slides under a
fluorescence microscope (900-1 OOOx) fitted
with the proper filters. Use a known 4+ slide
for comparison. Read slides within 2% hours if
slides have not been sealed and stored in a
deep-freeze.
8.4.7 Interpretation of Fluorescence, Re-
porting Results
(a) Fluoresence results are recorded as
shown in the following table. The number of
fluorescing cells and the degree of
fluorescence/cell are the criteria on which
positive results are based. Smears with large
numbers of strongly fluorescent cells (3+ or
4+) are positve; weakly fluorescent cells are
negative. Smears with few fluorescent cells
should be examined carefully.
(b) Cultures giving positive FA reactions
(4+ or 3+) must be isolated on differential
plating media, confirmed by biochemical iden-
tification, and verified serologically. Cultures
displaying negative FA results may be
discarded.
SALMONELLA
183
image:
 Rating
Positive
Negative
Intensity
4+
3+
24-
14-
0
Description
Brilliant yellow-green fluorescence, cell sharply-outlined
Bright yellow-green fluorescence, cell sharply outlined with
dark centers
Dull yellow-green fluorescence, cells not sharply outlined
Faint green discernible in dense areas, cells not outlined
No fluorescence
REFERENCES
1. Edwards, P. R. and W. H. Ewing, 1972. Identification of Enterobacteriaceae (3rd ed}. Burgess
Publishing Co., Minneapolis, MN.
2. Buchanan, R. E. and N. E. Gibbons, 1974. Sergey's Manual of Determination Bacteriology {8th
ed). The Williams and Wilkins Company, Baltimore, MD.
3. Moore, B., 1948. The detection of paratyphoid carriers in towns by means of sewage examina-
tion. Monthly Bulletin of the Ministry of Health and the Public Health Laboratory Service (Q. Brit.)
.1:241.
4. Brezenski, F. T. and R. Russomanno, 1969. The detection and use of salmonellae in studying
polluted tidal estuaries. J. WPCP 41:725.
5. Levin, M. A., J. R. Fischer and V. J. Cabelli, 1974. Quantitative large-volume sampling technique.
Appl. Microbiol. 28:51 5.
6. McCoy, J.H., 1962. The isolation of Salmonella. J. Appj. Bacteriol. 25:213.
7. Raj, H., 1966. Enrichment medium for selection of Salmonella from fish homogenate. Appl.
Microbiol. 14:12.
8. Dunn, C. and W. J. Martin, 1971. Comparison of media for the isolation of salmonellae and
shigellae from fecal specimens. Appl. Microbiol. 22:17.
9. Harvey, R. W, S. and T. H. Price, 1968. Elevated temperature incubation of enrichment media for
the Isolation of Salmonella from heavily contaminated materials. J. Hyg. Camb. 66:377.
10. Kampelmacher, E. H. and L. M. van Norle Jansen, 1971. Reduction of Salmonella in compost in a
hog-fattening farm oxidation vat. J.Wat. Poll. Cont. Fed. 43:1541.
11. Spino, D. F., 1966. Elevated temperature technique for the isolation of Salmonella from streams.
Appl. Microbiol. 14:591.
12. Cheng, C. M., W. C. Boyle and J. M. Goepfert, 1971. Rapid, quantitative method for Salmonella
detection in polluted water. Appl. Microbiol. 21:662.
13, Cherry, W. et al., 1972. Salmonellae as an index of pollution of surface waters. Appl. Mierobiol.
24:334. ~
14. Buffer, J. R., 1971. Comparison of the isolation of salmonellae from human feces by enrichment
at 37 C and at 43 C. Zbl. Bakt. 1. Abt. 217:35.
15. Phirke, P. M., 1974. Elevated temperature technique for enumeration of salmonellae in sewage.
Indian J. Med. Res. 62:6:938.
184 <&Ef¥k MICROBIOLOGICAL MANUAL 1978
image:
Rating
Positive
Negative
Intensity
4+
3+
24-
14-
0
Description
Brilliant yellow-green fluorescence, cell sharply-outlined
Bright yellow-green fluorescence, cell sharply outlined with
dark centers
Dull yellow-green fluorescence, cells not sharply outlined
Faint green discernible in dense areas, cells not outlined
No fluorescence
REFERENCES
1. Edwards, P. R. and W. H. Ewing, 1972. Identification of Enterobacteriaceae (3rd ed}. Burgess
Publishing Co., Minneapolis, MN.
2. Buchanan, R. E. and N. E. Gibbons, 1974. Sergey's Manual of Determination Bacteriology {8th
ed). The Williams and Wilkins Company, Baltimore, MD.
3. Moore, B., 1948. The detection of paratyphoid carriers in towns by means of sewage examina-
tion. Monthly Bulletin of the Ministry of Health and the Public Health Laboratory Service (Q. Brit.)
.1:241.
4. Brezenski, F. T. and R. Russomanno, 1969. The detection and use of salmonellae in studying
polluted tidal estuaries. J. WPCP 41:725.
5. Levin, M. A., J. R. Fischer and V. J. Cabelli, 1974. Quantitative large-volume sampling technique.
Appl. Microbiol. 28:51 5.
6. McCoy, J.H., 1962. The isolation of Salmonella. J. Appj. Bacteriol. 25:213.
7. Raj, H., 1966. Enrichment medium for selection of Salmonella from fish homogenate. Appl.
Microbiol. 14:12.
8. Dunn, C. and W. J. Martin, 1971. Comparison of media for the isolation of salmonellae and
shigellae from fecal specimens. Appl. Microbiol. 22:17.
9. Harvey, R. W, S. and T. H. Price, 1968. Elevated temperature incubation of enrichment media for
the Isolation of Salmonella from heavily contaminated materials. J. Hyg. Camb. 66:377.
10. Kampelmacher, E. H. and L. M. van Norle Jansen, 1971. Reduction of Salmonella in compost in a
hog-fattening farm oxidation vat. J.Wat. Poll. Cont. Fed. 43:1541.
11. Spino, D. F., 1966. Elevated temperature technique for the isolation of Salmonella from streams.
Appl. Microbiol. 14:591.
12. Cheng, C. M., W. C. Boyle and J. M. Goepfert, 1971. Rapid, quantitative method for Salmonella
detection in polluted water. Appl. Microbiol. 21:662.
13, Cherry, W. et al., 1972. Salmonellae as an index of pollution of surface waters. Appl. Mierobiol.
24:334. ~
14. Buffer, J. R., 1971. Comparison of the isolation of salmonellae from human feces by enrichment
at 37 C and at 43 C. Zbl. Bakt. 1. Abt. 217:35.
15. Phirke, P. M., 1974. Elevated temperature technique for enumeration of salmonellae in sewage.
Indian J. Med. Res. 62:6:938.
184 <&Ef¥k MICROBIOLOGICAL MANUAL 1978
image:
 16. Harvey, R. W. and T. H. Price, 1976. Isolation of salmonellae from sewage-polluted river water
using selenite F and Muller-Kauffmann tetrathionate. J. Hyg. Cajnb. 77:333.
17. Edel, W. and E. H. Kampelmaeher, 1939. Comparative studies on Salmonella isolation in eight
European laboratories. Bull. World Health Org. 39:487.
18. Kampelmaeher, E. H. and L. M. Van Noorle Jansen, 1973. Comparative studies on isolation of
Salmonella from effluents. Zbl. Bakt. Hyg., I. Abt. Org. 157:71.
19. Vanderpost, J. M. and J. B. Bell, 1975. A bacteriological investigation of meat-packing plant
effluents in the Province of Alberta with particular emphasis on Salmonella. Environmental
Protection Service, Environment Canada, Report No. EPS 3-WP-7 6-9.
2O. Cherry, W. et aL, 1954. A simple procedure for the identification of the genus Salmonella by
means of a specific bacteriophage. J. Lab. Clin. Med. 44:51,
21. Wolkos, S., M. Schreiberand H. Baer, 1974. Identification of Salmonella with O-1 bacteriophage.
Appl. Microbiol. 28:618.
22. Gillies, R. R., 1956. An evaluation of two composite media for preliminary identification of
Shigella and Salmonella. J. Clin. Pathol. 9:368.
23. Media and Tests for Differentiation of Enterobacteriaceae, 1970. Center for Disease Control,
USDHEW, PHS, Atlanta, GA.
24. Nord, C. E., A. A. Lindberg and A. Dahlback, 1974. Evaluation of five test—kits—API, Auxotab,
Enterotube, Pathotec and r/b—for identification of Enterobacteriaceae. Med. Microbiol.
159:211.
25. Shayegani, M., M. E, Hubbard.T. Hiscottand D. McGlynn, 1975. Evaluation of the r/b and minitek
systems for identification.of Enterobacteriaceae. J. of Clin. Microbiol. Jj,6:504.
26. Tomfohrde, K. M., D. L. Rhoden, P. B. Smith and A. Balows, 1973. Evaluation of the redesigned
Enterotube—a system for the identification of Enterobacteriaceae. Appl. Microbiol. 25:301.
27. Kiehn, T. E., K. Brennan and P. D. Ellner, 1974. Evaluation of the minitek system for identification
of Enterobacteriaceae. Appl. Microbiol. 28:668.
28. Robertson, E. A. and J. D. MacLowry, 1974. Mathematical analysis of the API enteric 20 profile
register using a computer diagnostic model. Appl. Microbiol. 28:691.
29. Robertson, E. A. and J. D. MacLowry, 1975. Construction of an interpretive pattern directory for
the API 10 S kit and analysis of its diagnotstic accuracy. J. of Glin. Microbiol. W3:515.
30. Douglas, G. W. and J. A Washington, 1973. Identification of Enterobacteriaceae in the clinical
laboratory. Center for Disease Control, Public Health Service, USDHEW, Atlanta, GA.
31. Presnell, M, N. and W. H. Andrews, 1976. Use of the membrane filter and a filter aid for concen-
trating and enumerating indicator bacteria and Salmonella from estuarine waters. Water
Research 10:549.
32. Kaper, J. B., G. S. Sayler, M. M. Baldini and R. R. Colwell, 1977. Ambient-Temperature primary
nonselective enrichment for isolation of Salmonella spp. from an estuarine environment. Appl. &_
Environ. Microbiol. 33:4:829.
33. Olivieri, V. P. and S. C. Riggio, 1976. Experience on the assay of microorganisms in urban runoff,
in proceeding of workshop on microorganisms in urban stormwater, EPA-60012-76-244,
Municipal Environmental Research Laboratory, EPA, Cincinnati, OH.
34. Thomason, B. M., 1971. Rapid detection of Salmonella microcolonies by fluorescent antibody.
Appl. Microbiol. 22:1064.
35. Thomason, B. M. and J. G. Wells, 1971. Preparation and testing of polyvalent conjugates for
fluorescent-antibody detection of salmonellae. Appl. Microbiol. 22:876.
SALMONELLA 185
image:
16. Harvey, R. W. and T. H. Price, 1976. Isolation of salmonellae from sewage-polluted river water
using selenite F and Muller-Kauffmann tetrathionate. J. Hyg. Cajnb. 77:333.
17. Edel, W. and E. H. Kampelmaeher, 1939. Comparative studies on Salmonella isolation in eight
European laboratories. Bull. World Health Org. 39:487.
18. Kampelmaeher, E. H. and L. M. Van Noorle Jansen, 1973. Comparative studies on isolation of
Salmonella from effluents. Zbl. Bakt. Hyg., I. Abt. Org. 157:71.
19. Vanderpost, J. M. and J. B. Bell, 1975. A bacteriological investigation of meat-packing plant
effluents in the Province of Alberta with particular emphasis on Salmonella. Environmental
Protection Service, Environment Canada, Report No. EPS 3-WP-7 6-9.
2O. Cherry, W. et aL, 1954. A simple procedure for the identification of the genus Salmonella by
means of a specific bacteriophage. J. Lab. Clin. Med. 44:51,
21. Wolkos, S., M. Schreiberand H. Baer, 1974. Identification of Salmonella with O-1 bacteriophage.
Appl. Microbiol. 28:618.
22. Gillies, R. R., 1956. An evaluation of two composite media for preliminary identification of
Shigella and Salmonella. J. Clin. Pathol. 9:368.
23. Media and Tests for Differentiation of Enterobacteriaceae, 1970. Center for Disease Control,
USDHEW, PHS, Atlanta, GA.
24. Nord, C. E., A. A. Lindberg and A. Dahlback, 1974. Evaluation of five test—kits—API, Auxotab,
Enterotube, Pathotec and r/b—for identification of Enterobacteriaceae. Med. Microbiol.
159:211.
25. Shayegani, M., M. E, Hubbard.T. Hiscottand D. McGlynn, 1975. Evaluation of the r/b and minitek
systems for identification.of Enterobacteriaceae. J. of Clin. Microbiol. Jj,6:504.
26. Tomfohrde, K. M., D. L. Rhoden, P. B. Smith and A. Balows, 1973. Evaluation of the redesigned
Enterotube—a system for the identification of Enterobacteriaceae. Appl. Microbiol. 25:301.
27. Kiehn, T. E., K. Brennan and P. D. Ellner, 1974. Evaluation of the minitek system for identification
of Enterobacteriaceae. Appl. Microbiol. 28:668.
28. Robertson, E. A. and J. D. MacLowry, 1974. Mathematical analysis of the API enteric 20 profile
register using a computer diagnostic model. Appl. Microbiol. 28:691.
29. Robertson, E. A. and J. D. MacLowry, 1975. Construction of an interpretive pattern directory for
the API 10 S kit and analysis of its diagnotstic accuracy. J. of Glin. Microbiol. W3:515.
30. Douglas, G. W. and J. A Washington, 1973. Identification of Enterobacteriaceae in the clinical
laboratory. Center for Disease Control, Public Health Service, USDHEW, Atlanta, GA.
31. Presnell, M, N. and W. H. Andrews, 1976. Use of the membrane filter and a filter aid for concen-
trating and enumerating indicator bacteria and Salmonella from estuarine waters. Water
Research 10:549.
32. Kaper, J. B., G. S. Sayler, M. M. Baldini and R. R. Colwell, 1977. Ambient-Temperature primary
nonselective enrichment for isolation of Salmonella spp. from an estuarine environment. Appl. &_
Environ. Microbiol. 33:4:829.
33. Olivieri, V. P. and S. C. Riggio, 1976. Experience on the assay of microorganisms in urban runoff,
in proceeding of workshop on microorganisms in urban stormwater, EPA-60012-76-244,
Municipal Environmental Research Laboratory, EPA, Cincinnati, OH.
34. Thomason, B. M., 1971. Rapid detection of Salmonella microcolonies by fluorescent antibody.
Appl. Microbiol. 22:1064.
35. Thomason, B. M. and J. G. Wells, 1971. Preparation and testing of polyvalent conjugates for
fluorescent-antibody detection of salmonellae. Appl. Microbiol. 22:876.
SALMONELLA 185
image:
 PART III. ANALYTICAL METHODOLOGY
Section F Actinomycetes
1. Summary of Method
The pour-plate technique is the prinicipal
method for measuring actinomycete popula-
tions. Selective media are employed that favor
actinomycete development over fungi and
other bacteria. The mass of branching fila-
ments characteristic of this bacterial group
offers distinctive features for identification. To
facilitate identification and counting of the ac-
tinomycete colonies, plates are prepared by
the two-layer agar technique. Since only the
upper layer is inoculated, the method assures a
predominance of surface colonies.
2. Definition
2.1 The actinomycetes are a group of
microorganisms with cells ranging from
0.5-2.0 /«m diameter but normally less than
1.0 pm diameter, which usually develop as
non-septate hyphae in branching mycelial
masses. The actinomycetes are generally
saprophytic but some are parasitic or patho-
genic to plants, animals and man.
2.2 The actinomycetes are fungal in mor-
phology and in spore formation, but lack a
membrane around nuclear materials. They
have a sensitivity to bacterial antibiotics, are
susceptible to specific phage and have other
biochemical characteristics which class them
as fllamentuous, branching bacteria (1). Al-
though actinomycetes are found in water and
sediments, the greatest natural reservoir for
these organisms is the soil.
3. Scope and Application
3.1 Actinomycetes are of interest in water
treatment and waste treatment facilities be-
cause of the taste and odor problems they
cause in potable waters and fish, and the foam-
ing problems they can cause in waste treat-
ment plants.
3.2 The taste and odor problems result
from volatile products characterized by an in-
tense earthy-musty odor {2, 3). Evidence points
to 2 highly odoriferous metabolites, geosmin
and 2-methylisoborneol, as the sources of the
problem (4, 5, 6). It appears that the relative
abundance of these 2 metabolites in natural
waters is linked to an ecological factor not yet
resolved. Traces of these products can impart
a disagreeable persistent odor to a municipal
water supply, which is extremely difficult to
treat. These natural odorants, prevalent in
many parts of the world, can also affect com-
mercial fishing.
3.3 Actinomycete distribution in waters
with an earthy-musty odor shows a correlation
between actinomycete counts and odor levels,
indicating such enumeration to be a useful
parameter in measuring quality of water. The
genus of most interest is Streptomyces.
3.4 Actinomycetes have also been recog-
nized as the cause of disturbances in the oper-
ation of activated sludge wastewater treat-
ment plants where massive growths of these
186
&EPA MICROBIOLOGICAL MANUAL 1978
image:
PART III. ANALYTICAL METHODOLOGY
Section F Actinomycetes
1. Summary of Method
The pour-plate technique is the prinicipal
method for measuring actinomycete popula-
tions. Selective media are employed that favor
actinomycete development over fungi and
other bacteria. The mass of branching fila-
ments characteristic of this bacterial group
offers distinctive features for identification. To
facilitate identification and counting of the ac-
tinomycete colonies, plates are prepared by
the two-layer agar technique. Since only the
upper layer is inoculated, the method assures a
predominance of surface colonies.
2. Definition
2.1 The actinomycetes are a group of
microorganisms with cells ranging from
0.5-2.0 /«m diameter but normally less than
1.0 pm diameter, which usually develop as
non-septate hyphae in branching mycelial
masses. The actinomycetes are generally
saprophytic but some are parasitic or patho-
genic to plants, animals and man.
2.2 The actinomycetes are fungal in mor-
phology and in spore formation, but lack a
membrane around nuclear materials. They
have a sensitivity to bacterial antibiotics, are
susceptible to specific phage and have other
biochemical characteristics which class them
as fllamentuous, branching bacteria (1). Al-
though actinomycetes are found in water and
sediments, the greatest natural reservoir for
these organisms is the soil.
3. Scope and Application
3.1 Actinomycetes are of interest in water
treatment and waste treatment facilities be-
cause of the taste and odor problems they
cause in potable waters and fish, and the foam-
ing problems they can cause in waste treat-
ment plants.
3.2 The taste and odor problems result
from volatile products characterized by an in-
tense earthy-musty odor {2, 3). Evidence points
to 2 highly odoriferous metabolites, geosmin
and 2-methylisoborneol, as the sources of the
problem (4, 5, 6). It appears that the relative
abundance of these 2 metabolites in natural
waters is linked to an ecological factor not yet
resolved. Traces of these products can impart
a disagreeable persistent odor to a municipal
water supply, which is extremely difficult to
treat. These natural odorants, prevalent in
many parts of the world, can also affect com-
mercial fishing.
3.3 Actinomycete distribution in waters
with an earthy-musty odor shows a correlation
between actinomycete counts and odor levels,
indicating such enumeration to be a useful
parameter in measuring quality of water. The
genus of most interest is Streptomyces.
3.4 Actinomycetes have also been recog-
nized as the cause of disturbances in the oper-
ation of activated sludge wastewater treat-
ment plants where massive growths of these
186
&EPA MICROBIOLOGICAL MANUAL 1978
image:
 organisms can produce thick foams (7, 8). The
genus involved is Nocardia.
3.5 Because of diverse nutrient require-
ments, no single medium has been devised
that will support the growth of all actinomy-
cetes. Moreover, the culture media that have
proven useful in their isolation are not neces-
sarily the preferred media for encouraging
abundant growth. The isolation media are re-
strictive and nutritionally poor. They act by
depressing growth of other microorganisms
and by favoring a higher proportion of actino-
mycete colony development.
3.6 The pour-plate method does not indic-
ate whether the isolated colony originated
from individual spores, spore aggregates,
small mycelial fragments or a mycelial mat.
4. Apparatus and Materials
4.1 Incubator set at 28 ±0.5 C.
4.2 Water bath set at 44-46 C for temper-
ing agar.
4.3 Electric oven set at 105-110 C.
4.4 Hand tally or electronic counting de-
vice (optional).
4.5 Thermometer which has been
checked against a National Bureau of
Standards-Certified Thermometer.
4.6 Pipet containers of stainless steel, alu-
minum or pyrex glass for glass pipets.
4.7 Petri dish canister of stainless steel or
aluminum for glass dishes.
4.8 Erlenmeyer flasks, pyrex, screw-cap,
250 and 500 ml volume.
4.9 Sterile T.D., bacteriological or Mohr
pipets, glass or plastic, of appropriate size.
4.10 Sterile 100 mm x 15 mm petri
dishes, glass or plastic.
4.11 Screw-cap culture tubes, borosilicate
glass, 25 x 150mm.
4.12 Dilution bottles (milk dilution), pyrex,
marked at 99 ml, screw-cap with neoprene
rubber liner.
5. Media
5.1 Sterile starch-casein agar or equiva-
lent agar prepared in 17 ml volumes in screw-
cap tubes and in 250-300 ml volumes in 500
ml, screw-cap bottles or flasks. See Part II-B,
5.6.
5.2 Sterile buffered dilution water in bot-
tles containing 99 + 2 ml volumes. See Part II-
B,7. ,
5.3 Cycloheximide Stock Solution. Weigh
out 100 mg cycloheximide (antifungal
antibiotic), bring to 100 ml with distilled water,
pour into a screw-cap flask and mix until dis-
solved. Sterilize for 15 minutes at 121 C (15
Ibs. pressure). Cycloheximide is available as
Actfd/onefrom the Upjohn Company.
6. Sample Preparation
6.1 Water Samples
6.1.1 Fill sample bottle only 3/4 full so
that ample airspace is left in the bottle for
thorough mixing of the water sample.
6.1.2 Mix water sample by shaking vigor-
ously about 25 times. Using a pipet, transfer
11 ml immediately after mixing to a 99 ml
water blank.
6.1.3 Repeat for, desired dilutions. A dilu-
tion of 10~3 is usually sufficient for plating
water samples.
6.2 Soil Samples
6.2.1 Mix soil sample thoroughly and
weigh out a 50 gram sample in a tared weigh-
ing pan. Dry at 105-110 C to constant weight.
ACTINQMYCETES
187
image:
organisms can produce thick foams (7, 8). The
genus involved is Nocardia.
3.5 Because of diverse nutrient require-
ments, no single medium has been devised
that will support the growth of all actinomy-
cetes. Moreover, the culture media that have
proven useful in their isolation are not neces-
sarily the preferred media for encouraging
abundant growth. The isolation media are re-
strictive and nutritionally poor. They act by
depressing growth of other microorganisms
and by favoring a higher proportion of actino-
mycete colony development.
3.6 The pour-plate method does not indic-
ate whether the isolated colony originated
from individual spores, spore aggregates,
small mycelial fragments or a mycelial mat.
4. Apparatus and Materials
4.1 Incubator set at 28 ±0.5 C.
4.2 Water bath set at 44-46 C for temper-
ing agar.
4.3 Electric oven set at 105-110 C.
4.4 Hand tally or electronic counting de-
vice (optional).
4.5 Thermometer which has been
checked against a National Bureau of
Standards-Certified Thermometer.
4.6 Pipet containers of stainless steel, alu-
minum or pyrex glass for glass pipets.
4.7 Petri dish canister of stainless steel or
aluminum for glass dishes.
4.8 Erlenmeyer flasks, pyrex, screw-cap,
250 and 500 ml volume.
4.9 Sterile T.D., bacteriological or Mohr
pipets, glass or plastic, of appropriate size.
4.10 Sterile 100 mm x 15 mm petri
dishes, glass or plastic.
4.11 Screw-cap culture tubes, borosilicate
glass, 25 x 150mm.
4.12 Dilution bottles (milk dilution), pyrex,
marked at 99 ml, screw-cap with neoprene
rubber liner.
5. Media
5.1 Sterile starch-casein agar or equiva-
lent agar prepared in 17 ml volumes in screw-
cap tubes and in 250-300 ml volumes in 500
ml, screw-cap bottles or flasks. See Part II-B,
5.6.
5.2 Sterile buffered dilution water in bot-
tles containing 99 + 2 ml volumes. See Part II-
B,7. ,
5.3 Cycloheximide Stock Solution. Weigh
out 100 mg cycloheximide (antifungal
antibiotic), bring to 100 ml with distilled water,
pour into a screw-cap flask and mix until dis-
solved. Sterilize for 15 minutes at 121 C (15
Ibs. pressure). Cycloheximide is available as
Actfd/onefrom the Upjohn Company.
6. Sample Preparation
6.1 Water Samples
6.1.1 Fill sample bottle only 3/4 full so
that ample airspace is left in the bottle for
thorough mixing of the water sample.
6.1.2 Mix water sample by shaking vigor-
ously about 25 times. Using a pipet, transfer
11 ml immediately after mixing to a 99 ml
water blank.
6.1.3 Repeat for, desired dilutions. A dilu-
tion of 10~3 is usually sufficient for plating
water samples.
6.2 Soil Samples
6.2.1 Mix soil sample thoroughly and
weigh out a 50 gram sample in a tared weigh-
ing pan. Dry at 105-110 C to constant weight.
ACTINQMYCETES
187
image:
 The final weight is used in calculating numbers
of organisms/gram dry soil.
6.2.2 Prepare the initial dilution by weigh-
ing out 11 grams of soil and adding to a 99 ml
volume of buffered dilution water for a 1:10
dilution. Shake dilution bottle vigorously for 1
minute.
6.2.3 Transfer a 11 ml sample of the 1:10
dilution to a second dilution bottle containing
99 ml buffered dilution water and shake vigor-
ously about 25 times. Repeat this process until
the desired dilution is reached. Dilution of
10~3to 10~8are usually necessary for enumer-
ation of soil samples.
7. Plating Procedures
Prepare triplicate plates for each test dilu-
tion using the two-layer agar technique as
follows:
7.1 Cool flask of starch casein agar to
44-46 C and pour 15 ml layer in each petri
dish. Allow to harden.
7.2 Melt starch-casein agar in tubes and
cool to 44-46 C. Add 2 ml of sample or sample
dilution and 1 ml of cycloheximide solution.
Mix tube contents well.
7.3 Pipet immediately 5 ml of the inocu-
lated agar over the solid agar base layer in
each plate with gentle swirling to evenly dis-
tribute the inoculated agar. Each 5 ml contains
0.5 ml of the particular dilution used. This 0.5
factor must be taken into consideration in cal-
culating the final dilution.
7.4 After plates are solidified, invert and
Incubate at 28 C for approximately 7 days and
count.
8. Counting of Colonies
8.1 Select plates for counting with
30-300 colonies.
8.2 Rules for making plate counts are
giveninPartlll-A,5.6.2.
8.3 Examine plates macroscopically hold-
ing toward a light source. Actinomycete colo-
nies appear dull or chalky when covered with
aerial mycelium. The edges of the colonies are
less dense producing a halo effect. Colonies
adhere strongly to the agar and have a tough,
leathery texture. In contrast, bacterial colonies
appear shiny or opalescent with a soft texture,
adhere weakly to the agar, and show no gen-
eral distinction between the edge and the col-
ony as a whole (see Figure lll-F-1).
8.4 Actinomycete colonies can be verified
at a magnification of 100x. Because of their
filamentous growth, they typically have fuzzy
borders which contrast sharply to the smooth
borders characteristic of bacteria. (See Figures
lll-F-2and3).
8.5 Addition of cycloheximide to the isola-
tion medium suppresses development of fun-
gal colonies. If fungi do develop, they can be
differentiated from actinomycetes by their
woolly appearance and much larger cell diam-
eter. With a little experience in examining fun-
gal and actinomycete colonies, it is fairly easy
to distinguish them macroscopically.
9. Reporting Results
9.1 Calculate the actinomycete density in
water samples in counts/ml according to the
following equation:
Sum of Replicate Plate Counts
Total Volume of Original
Sample Tested, in ml
Sum of Replicate Plate Counts
No of
Replicates
X
Sample Dilution
Tested
X
Agar Plate
Dilution
Factor (See 7.3)
Actinomycete
Count/ml
188
V*EPA MICROBIOLOGICAL MANUAL 1978
image:
The final weight is used in calculating numbers
of organisms/gram dry soil.
6.2.2 Prepare the initial dilution by weigh-
ing out 11 grams of soil and adding to a 99 ml
volume of buffered dilution water for a 1:10
dilution. Shake dilution bottle vigorously for 1
minute.
6.2.3 Transfer a 11 ml sample of the 1:10
dilution to a second dilution bottle containing
99 ml buffered dilution water and shake vigor-
ously about 25 times. Repeat this process until
the desired dilution is reached. Dilution of
10~3to 10~8are usually necessary for enumer-
ation of soil samples.
7. Plating Procedures
Prepare triplicate plates for each test dilu-
tion using the two-layer agar technique as
follows:
7.1 Cool flask of starch casein agar to
44-46 C and pour 15 ml layer in each petri
dish. Allow to harden.
7.2 Melt starch-casein agar in tubes and
cool to 44-46 C. Add 2 ml of sample or sample
dilution and 1 ml of cycloheximide solution.
Mix tube contents well.
7.3 Pipet immediately 5 ml of the inocu-
lated agar over the solid agar base layer in
each plate with gentle swirling to evenly dis-
tribute the inoculated agar. Each 5 ml contains
0.5 ml of the particular dilution used. This 0.5
factor must be taken into consideration in cal-
culating the final dilution.
7.4 After plates are solidified, invert and
Incubate at 28 C for approximately 7 days and
count.
8. Counting of Colonies
8.1 Select plates for counting with
30-300 colonies.
8.2 Rules for making plate counts are
giveninPartlll-A,5.6.2.
8.3 Examine plates macroscopically hold-
ing toward a light source. Actinomycete colo-
nies appear dull or chalky when covered with
aerial mycelium. The edges of the colonies are
less dense producing a halo effect. Colonies
adhere strongly to the agar and have a tough,
leathery texture. In contrast, bacterial colonies
appear shiny or opalescent with a soft texture,
adhere weakly to the agar, and show no gen-
eral distinction between the edge and the col-
ony as a whole (see Figure lll-F-1).
8.4 Actinomycete colonies can be verified
at a magnification of 100x. Because of their
filamentous growth, they typically have fuzzy
borders which contrast sharply to the smooth
borders characteristic of bacteria. (See Figures
lll-F-2and3).
8.5 Addition of cycloheximide to the isola-
tion medium suppresses development of fun-
gal colonies. If fungi do develop, they can be
differentiated from actinomycetes by their
woolly appearance and much larger cell diam-
eter. With a little experience in examining fun-
gal and actinomycete colonies, it is fairly easy
to distinguish them macroscopically.
9. Reporting Results
9.1 Calculate the actinomycete density in
water samples in counts/ml according to the
following equation:
Sum of Replicate Plate Counts
Total Volume of Original
Sample Tested, in ml
Sum of Replicate Plate Counts
No of
Replicates
X
Sample Dilution
Tested
X
Agar Plate
Dilution
Factor (See 7.3)
Actinomycete
Count/ml
188
V*EPA MICROBIOLOGICAL MANUAL 1978
image:
 FIGURE lll-F-1. A plate containing bacterial and actinomycete colonies.
A—The dull, powdery appearance of a sporulating actinomycete colony.
B—The smooth, mucoid appearance of a bacterial colony.
ACTINOMYCETES
189
image:
FIGURE lll-F-1. A plate containing bacterial and actinomycete colonies.
A—The dull, powdery appearance of a sporulating actinomycete colony.
B—The smooth, mucoid appearance of a bacterial colony.
ACTINOMYCETES
189
image:
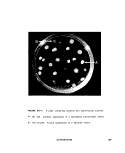 FIGURE III-F-2. An actfnotnycete colony showing the branching filaments
that cause the fuzzy appearance of its border. X 225
FIGURE Ill-F-3, A bacterial colony with its relatively-distinct, smooth
border. X 225
190
MICROBIOLOGICAL MANUAL 1978
image:
FIGURE III-F-2. An actfnotnycete colony showing the branching filaments
that cause the fuzzy appearance of its border. X 225
FIGURE Ill-F-3, A bacterial colony with its relatively-distinct, smooth
border. X 225
190
MICROBIOLOGICAL MANUAL 1978
image:
 For example, if the triplicate sample vol-
umes tested at a 1:10 dilution yielded 45, 39
and 42 actinomycete colonies, the calculation
would be:
126
3(rep) X 0.1 (dil) x 0.5 (A.P.D. factor)
126
0.15
840
Actinomycetes/ml
9.2 Correct the actinomycete counts from
soil and mud samples for water contents. See
6.2, this Section. Calculate the counts as
follows:
wt. of collected soil
wt. of dried soil
= conversion factor
conversion factor x count/gm collected
soil = count/gm dry soil
Determine count/gm collected soil by the
equation given in 9.1.
REFERENCES
1. Lechevalier, H. A. and M. P. Lechevalier, 1967. Biology of Actinomycetes. Am. Rev. Microbiol.
21_:71.
2. Adams, B. A., 1929. Cladothrixdichotoma and allied organisms as a cause of an "indeterminate"
taste in chlorinated water. Water & Water Eng. 31:327.
3. Thaysen, A. C., 1936. The origin of an earthy or muddy taint in fish. Ann. Appl. Biol. 23:99.
4. Rosen, A. S., C. I. Mashni and R. S. Safferman, 1970. Recent developments in the chemistry of
odour in water: the cause of earthy/musty odour. Water Treatment Exam. 19:106.
5. Piet, G. J., B. C. J. Zoeteman and A. J. A. Kraayeveld, 1972. Earthy-smelling substance in surface
waters of the Netherlands. Water Treatment Exam. 2Jj28 1.
6. Yurkowski, M. and J. L. Tabachek, 1974. Identification, analysis and removal of geosmin from
muddy-flavored trout. J. Fish. Res. Board Can. 31:1851.
7. Lechevalier, H. A., 1975. Actinomycetes of sewage-treatment plants. U.S. Environmental Protec-
tion Agency, Environmental Protection Technology Series, EPA-600/2-75-031, Cincinnati, OH.
8. Lechevalier, M. P. and H. A. Lechevalier, 1974. Nocardia amarae, sp. nov., an actinomycete
common in foaming activated sludge. Int. J. Syst. Bacteriol. 24:278.
ACTINOMYCETES
191
image:
For example, if the triplicate sample vol-
umes tested at a 1:10 dilution yielded 45, 39
and 42 actinomycete colonies, the calculation
would be:
126
3(rep) X 0.1 (dil) x 0.5 (A.P.D. factor)
126
0.15
840
Actinomycetes/ml
9.2 Correct the actinomycete counts from
soil and mud samples for water contents. See
6.2, this Section. Calculate the counts as
follows:
wt. of collected soil
wt. of dried soil
= conversion factor
conversion factor x count/gm collected
soil = count/gm dry soil
Determine count/gm collected soil by the
equation given in 9.1.
REFERENCES
1. Lechevalier, H. A. and M. P. Lechevalier, 1967. Biology of Actinomycetes. Am. Rev. Microbiol.
21_:71.
2. Adams, B. A., 1929. Cladothrixdichotoma and allied organisms as a cause of an "indeterminate"
taste in chlorinated water. Water & Water Eng. 31:327.
3. Thaysen, A. C., 1936. The origin of an earthy or muddy taint in fish. Ann. Appl. Biol. 23:99.
4. Rosen, A. S., C. I. Mashni and R. S. Safferman, 1970. Recent developments in the chemistry of
odour in water: the cause of earthy/musty odour. Water Treatment Exam. 19:106.
5. Piet, G. J., B. C. J. Zoeteman and A. J. A. Kraayeveld, 1972. Earthy-smelling substance in surface
waters of the Netherlands. Water Treatment Exam. 2Jj28 1.
6. Yurkowski, M. and J. L. Tabachek, 1974. Identification, analysis and removal of geosmin from
muddy-flavored trout. J. Fish. Res. Board Can. 31:1851.
7. Lechevalier, H. A., 1975. Actinomycetes of sewage-treatment plants. U.S. Environmental Protec-
tion Agency, Environmental Protection Technology Series, EPA-600/2-75-031, Cincinnati, OH.
8. Lechevalier, M. P. and H. A. Lechevalier, 1974. Nocardia amarae, sp. nov., an actinomycete
common in foaming activated sludge. Int. J. Syst. Bacteriol. 24:278.
ACTINOMYCETES
191
image:
 PART IV. QUALITY ASSURANCE
Regulatory agencies making decisions on water quality standards and wastewater discharge
limits require formal analytical quality control programs for their laboratories and program
participants to assure validity of their data. For example, water quality regulations include
provisions for quality control and testing procedures (the Safe Drinking Water Act, National Interim
Primary Drinking Water Regulations published in Federal Register, Title 40 Part 141, 59566,
December 24, 1975). Further, the Act states that analyses for maximum contaminant levels must
be conducted by laboratories approved in a formal certification program. The quality control
procedures specified in the Manual for the Interim Certification of Laboratories Involved in
Analyzing Public Drinking Water Supplies (Appendix B) are a recommended minimal program and
are not equivalent to the comprehensive system described in Part IV of this Manual.
A laboratory quality control program is the orderly application of the practices necessary to
remove or reduce the errors that occur in any laboratory operation due to personnel, equipment,
supplies, sampling procedures and the analytical methodology in use.
A quality control program must be practical, integrated and require only a reasonable amount
of time or it will be by-passed. When properly administered, a balanced, conscientiously applied
quality control program will assure the production of uniformly high quality data without inter-
fering with the primary analytical functions of the laboratory. This within-laboratory program
should be supplemented by participation of the laboratory in an interlaboratory quality control
program such as that conducted by EPA and detailed in Part V. The major considerations for quality
control are discussed under three separate Sections:
Section A Laboratory Operations
1. Sample Collection and Handling
2. Laboratory Facilities
3. Laboratory Personnel
4. Laboratory Equipment and Instrumentation
5. General Laboratory Supplies
6. Membrane Filters
7. Culture Media
Section B Statistics for Microbiology
1. Measures of Control Tendency
2. Measures of Dispersion
3. Normal Distribution
4. Poisson Distribution
5. Measures of Performance
192
&ERA MICROBIOLOGICAL MANUAL 1978
image:
PART IV. QUALITY ASSURANCE
Regulatory agencies making decisions on water quality standards and wastewater discharge
limits require formal analytical quality control programs for their laboratories and program
participants to assure validity of their data. For example, water quality regulations include
provisions for quality control and testing procedures (the Safe Drinking Water Act, National Interim
Primary Drinking Water Regulations published in Federal Register, Title 40 Part 141, 59566,
December 24, 1975). Further, the Act states that analyses for maximum contaminant levels must
be conducted by laboratories approved in a formal certification program. The quality control
procedures specified in the Manual for the Interim Certification of Laboratories Involved in
Analyzing Public Drinking Water Supplies (Appendix B) are a recommended minimal program and
are not equivalent to the comprehensive system described in Part IV of this Manual.
A laboratory quality control program is the orderly application of the practices necessary to
remove or reduce the errors that occur in any laboratory operation due to personnel, equipment,
supplies, sampling procedures and the analytical methodology in use.
A quality control program must be practical, integrated and require only a reasonable amount
of time or it will be by-passed. When properly administered, a balanced, conscientiously applied
quality control program will assure the production of uniformly high quality data without inter-
fering with the primary analytical functions of the laboratory. This within-laboratory program
should be supplemented by participation of the laboratory in an interlaboratory quality control
program such as that conducted by EPA and detailed in Part V. The major considerations for quality
control are discussed under three separate Sections:
Section A Laboratory Operations
1. Sample Collection and Handling
2. Laboratory Facilities
3. Laboratory Personnel
4. Laboratory Equipment and Instrumentation
5. General Laboratory Supplies
6. Membrane Filters
7. Culture Media
Section B Statistics for Microbiology
1. Measures of Control Tendency
2. Measures of Dispersion
3. Normal Distribution
4. Poisson Distribution
5. Measures of Performance
192
&ERA MICROBIOLOGICAL MANUAL 1978
image:
 Section C Analytical Quality Control Procedures
1. Quality Control on Routine Analyses
2. Quality Control in Compliance Monitoring
3. Comparative Testing of Methodologies
QA/LABORATORY OPERATIONS 1 93
image:
Section C Analytical Quality Control Procedures
1. Quality Control on Routine Analyses
2. Quality Control in Compliance Monitoring
3. Comparative Testing of Methodologies
QA/LABORATORY OPERATIONS 1 93
image:
 PART IV. QUALITY ASSURANCE
Section A Laboratory Operations
Section A describes the checks and moni-
toring procedures that should be performed
on materials, supplies, instrumentation and
the physical facility. These checks should be
documented completely and recorded as per-
formed. See Part V-A, 1.2 for details on this
documentation.
Sample Collection and
Handling
Laboratory Facilities
Laboratory Personnel
Laboratory Equipment and
Instrumentation
General Laboratory Supplies
Membrane Filters
2.
3.
4.
5.
6.
7.
Culture Media
1. Sample Collection and Handling
The acquisition of valid data begins with
collection of a representative water sample or
other environmental material being tested.
Samples must be maintained as closely as
possible to original condition by careful han-
dling and storage.
Sample sites and a sampling frequency
are selected to provide data representative of
the characteristics and the variability of the
water quality at that station. The most important
quality control factor in sampling is the
immediate analysis of the sample. If the sample
cannot be analyzed at once, it should be
refrigerated and analyzed within six hours.
Recommended procedures for collecting,
transporting and handling water and waste-
water samples are described separately in
Part II-A of this Manual.
2. Laboratory Facilities
2.1 Ventilation: Laboratories should be
well-ventilated and free of dust, drafts and
extreme temperature changes. Central air con-
ditioning has advantages: 1) The incoming air
is filtered, reducing contamination of the labo-
ratory and culture work. 2) The uniform tem-
perature control of air conditioning permits
stable operation of incubators. 3) With closed
windows, drafts and air currents which can
cross-contaminate surroundings and work
areas during warm weather are minimized. 4)
Low humidity reduces moisture problems with
media, chemicals, analytical balances and
other instrumentation.
2.2 Space Utilization: Ideally the areas
provided for the preparation and sterilization
of media, glassware and equipment should be
separated from the laboratory working area
but located close enough for convenience. In
public health laboratories that analyze many
194
MICROBIOLOGICAL MANUAL 1978
image:
PART IV. QUALITY ASSURANCE
Section A Laboratory Operations
Section A describes the checks and moni-
toring procedures that should be performed
on materials, supplies, instrumentation and
the physical facility. These checks should be
documented completely and recorded as per-
formed. See Part V-A, 1.2 for details on this
documentation.
Sample Collection and
Handling
Laboratory Facilities
Laboratory Personnel
Laboratory Equipment and
Instrumentation
General Laboratory Supplies
Membrane Filters
2.
3.
4.
5.
6.
7.
Culture Media
1. Sample Collection and Handling
The acquisition of valid data begins with
collection of a representative water sample or
other environmental material being tested.
Samples must be maintained as closely as
possible to original condition by careful han-
dling and storage.
Sample sites and a sampling frequency
are selected to provide data representative of
the characteristics and the variability of the
water quality at that station. The most important
quality control factor in sampling is the
immediate analysis of the sample. If the sample
cannot be analyzed at once, it should be
refrigerated and analyzed within six hours.
Recommended procedures for collecting,
transporting and handling water and waste-
water samples are described separately in
Part II-A of this Manual.
2. Laboratory Facilities
2.1 Ventilation: Laboratories should be
well-ventilated and free of dust, drafts and
extreme temperature changes. Central air con-
ditioning has advantages: 1) The incoming air
is filtered, reducing contamination of the labo-
ratory and culture work. 2) The uniform tem-
perature control of air conditioning permits
stable operation of incubators. 3) With closed
windows, drafts and air currents which can
cross-contaminate surroundings and work
areas during warm weather are minimized. 4)
Low humidity reduces moisture problems with
media, chemicals, analytical balances and
other instrumentation.
2.2 Space Utilization: Ideally the areas
provided for the preparation and sterilization
of media, glassware and equipment should be
separated from the laboratory working area
but located close enough for convenience. In
public health laboratories that analyze many
194
MICROBIOLOGICAL MANUAL 1978
image:
 different types of samples a separate work
area is desirable for water analysis. Special
work areas such as an absolute barrier or
vented laminar flow hood (see Part V-C) are
often used for dispensing and preparing sterile
media and tissue cultures, for transferring
microbial cultures or for working with
pathogenic materials. In smaller laboratories it
may be necessary to carry out these separate
activities in different sections of the same
room. However, limited facilities and restricted
work space may seriously hamper the quality
of the work and influence the validity of
results. Visitors and through traffic should be
discouraged in work areas. Through traffic can
be prevented by laboratory design.
2.3 Laboratory Bench Areas: Sufficient
clean bench space should be available for the
analyses to be performed efficiently. For rou-
tine work, 6 linear feet is the recommended
minimum work area for each analyst. Research
work or other analyses using specialized
equipment may require significantly more
space per worker. These estimates of bench
space are exclusive of work areas used for
preparatory and supporting activities. Labora-
tory lighting should be even, screened to re-
duce glare, and provide about 100 footcandle
light intensity at working surfaces.
Bench tops should be set at heights of
36-38 inches with a depth of 28-30 inches.
This height is comfortable for work in a stand-
ing or sitting position. Desk tops or sit-down
benches are set at 30-31 inches height to
accommodate microscopy, plate counting, cal-
culations and writing activities. Bench tops
should be stainless steel, epoxy plastic or
other smooth impervious material which is in-
ert, corrosion-resistant and has minimum
seams.
2.4 Walls and Floors: Walls should be
covered with waterproof paint, enamel or
other surface material that provides a smooth
finish which is easily cleaned and disinfected.
Floors should be covered with good quality
tiles or other heavy duty material which can be
maintained with skid-proof wax. Bacteriostatic
agents contained in some wall or floor finishes
increase the effectiveness of disinfection.
2.6 Monitoring for Cleanliness in Work
Areas: High standards of cleanliness should
be maintained in work areas. The laboratory
can be monitored for cleanliness by one or
more of the procedures described below.
Since these monitoring procedures cannot re-
cover all of the microorganism populations
present, absolute limits are difficult to develop.
Rather, the tests should be used regularly on a
.weekly or other basis to monitor counts In the
same work areas over time or to make compar-
isons between different work areas.
2.5.1 RODACAgar Plates (1)
Work areas and other surfaces can be
checked by RODAC plates which contain gen-
eral growth media for total counts or selective
media for conforms, enteric pathogens, strep-
tococci, staphylococci, or other microorga-
nisms cultured in the laboratory. RODAC is an
acronym for Reproducible OrganismDetection
and Counting. The RODAC dish has a test area
of about 25 cm with Quebec style grids em-
bossed in the plate. It is specifically designed
to enumerate the microbial population of flat
solid surfaces by contact techniques.
(a) Purchase RODAC plates prefilled with
desired test medium or prepare plates by fill-
ing the center well with about 16 ml of appro-
priate agar. When preparing agar in the labora-
tory, add 0.07% soy lecithin or 0.5% polysor-
bate (Tween 80) to the agar to neutralize the
effect of the disinfectant on test surfaces.
Cooling leaves a raised bed of agar about 1
mm higher than the rim of the dish, allowing
contact of the sterile agar to the test surface
for direct counts.
(b) To sample an area, remove the plastic
cover and carefully press the agar to the solid
surface being sampled. It is important that the
entire agar layer contacts the test surface. Use
a rolling motion with uniform pressure on the
back of the plate to insure complete contact
Replace the cover and incubate in an inverted
position for the appropriate time and
temperature.
(c) Count the colonies with a Quebec col-
ony counter and report as the number of colo-
MICROBIOLOGICAL MANUAL 1978
195
image:
different types of samples a separate work
area is desirable for water analysis. Special
work areas such as an absolute barrier or
vented laminar flow hood (see Part V-C) are
often used for dispensing and preparing sterile
media and tissue cultures, for transferring
microbial cultures or for working with
pathogenic materials. In smaller laboratories it
may be necessary to carry out these separate
activities in different sections of the same
room. However, limited facilities and restricted
work space may seriously hamper the quality
of the work and influence the validity of
results. Visitors and through traffic should be
discouraged in work areas. Through traffic can
be prevented by laboratory design.
2.3 Laboratory Bench Areas: Sufficient
clean bench space should be available for the
analyses to be performed efficiently. For rou-
tine work, 6 linear feet is the recommended
minimum work area for each analyst. Research
work or other analyses using specialized
equipment may require significantly more
space per worker. These estimates of bench
space are exclusive of work areas used for
preparatory and supporting activities. Labora-
tory lighting should be even, screened to re-
duce glare, and provide about 100 footcandle
light intensity at working surfaces.
Bench tops should be set at heights of
36-38 inches with a depth of 28-30 inches.
This height is comfortable for work in a stand-
ing or sitting position. Desk tops or sit-down
benches are set at 30-31 inches height to
accommodate microscopy, plate counting, cal-
culations and writing activities. Bench tops
should be stainless steel, epoxy plastic or
other smooth impervious material which is in-
ert, corrosion-resistant and has minimum
seams.
2.4 Walls and Floors: Walls should be
covered with waterproof paint, enamel or
other surface material that provides a smooth
finish which is easily cleaned and disinfected.
Floors should be covered with good quality
tiles or other heavy duty material which can be
maintained with skid-proof wax. Bacteriostatic
agents contained in some wall or floor finishes
increase the effectiveness of disinfection.
2.6 Monitoring for Cleanliness in Work
Areas: High standards of cleanliness should
be maintained in work areas. The laboratory
can be monitored for cleanliness by one or
more of the procedures described below.
Since these monitoring procedures cannot re-
cover all of the microorganism populations
present, absolute limits are difficult to develop.
Rather, the tests should be used regularly on a
.weekly or other basis to monitor counts In the
same work areas over time or to make compar-
isons between different work areas.
2.5.1 RODACAgar Plates (1)
Work areas and other surfaces can be
checked by RODAC plates which contain gen-
eral growth media for total counts or selective
media for conforms, enteric pathogens, strep-
tococci, staphylococci, or other microorga-
nisms cultured in the laboratory. RODAC is an
acronym for Reproducible OrganismDetection
and Counting. The RODAC dish has a test area
of about 25 cm with Quebec style grids em-
bossed in the plate. It is specifically designed
to enumerate the microbial population of flat
solid surfaces by contact techniques.
(a) Purchase RODAC plates prefilled with
desired test medium or prepare plates by fill-
ing the center well with about 16 ml of appro-
priate agar. When preparing agar in the labora-
tory, add 0.07% soy lecithin or 0.5% polysor-
bate (Tween 80) to the agar to neutralize the
effect of the disinfectant on test surfaces.
Cooling leaves a raised bed of agar about 1
mm higher than the rim of the dish, allowing
contact of the sterile agar to the test surface
for direct counts.
(b) To sample an area, remove the plastic
cover and carefully press the agar to the solid
surface being sampled. It is important that the
entire agar layer contacts the test surface. Use
a rolling motion with uniform pressure on the
back of the plate to insure complete contact
Replace the cover and incubate in an inverted
position for the appropriate time and
temperature.
(c) Count the colonies with a Quebec col-
ony counter and report as the number of colo-
MICROBIOLOGICAL MANUAL 1978
195
image:
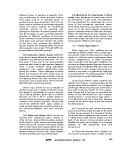 nles per RODAC plate or number of colonies
par 25 sq. cm.
2.5.2 Swab Method (1)
(a) The swab contact method can be used
to monitor the contamination of work areas
and especially those with cracks, corners,
crevices and rough surfaces. Dacron swabs
rinse out more easily than cotton ones. These
may be purchased from Econ Microbiological
Laboratory, 2716 Humboldt Avenue, South,
Minneapolis, MN. Rayon swabs are available
from Fuller Pharmaceutical Company, Minne-
apolis, MN, and Consolidated Laboratories
Inc., Chicago Heights, IL. Swabs made of cal-
cium alginate which is soluble in water, can
also be used. These are available from Consoli-
dated Laboratories, Inc., Chicago Heights, IL.
Rinse Solution Vials - Add 1.25 ml stock
phosphate buffer solution, 5 ml of 10% aque-
ous sodium thiosulfate, 4 grams Asolectin (As-
sociated Concentrates, 32-30 61st Street,
Woodside, Long Island, NY 11377) and 10
grams Tween 20 or Tween 80 (Hilltop Re-
search, Inc., Miamiville, OH 45147) to 500 ml
distilled water; heat to solution in boiling water
bath. Cool and make up to 1 liter. Dispense in
screw-capped vials in 10 ml or other volumes
and sterilize for 15 minutes at 15 Ib. pressure
(121 C). Because Asolectin is hygroscopic,
store it in a desiccator and weigh quickly.
(b) To sample an area, open a sterile swab
container, grasp the end of the stick and re-
move aseptically. Open a 10 ml vial of neutral-
izing buffer, moisten swab head, and press out
excess solution against the inside of the vial.
Hold the swab handle at a 30° angle against
the sampling area. Rub the swab head slowly
and throughly over approximately 8 sq. in. of
surface area. Repeat procedure 3 times over
the same area, turning the swab and reversing
directions. Place the swab head in the neutral-
izirjg buffer vial, rinse briefly in solution and
press out the excess liquid.
Test four more 8 sq. in. areas of surface,
rinsing the swab in solution after each swab-
bing. After the fifth area has been swabbed,
remove the excess liquid, place swab head in
vial and break or cut with a sterile scissors
leaving the swab head in the vial. Replace the
cap and store vial at 4 C or on ice until analysis.
When using alginate swabs, rinse solution
vials should contain 4.5 ml after sterilization.
Prepare a 10% solution of sodium
hexametaphosphate in appropriate vials and
steam sterilize. Follow the above swabbing
procedures but after swabbing the fifth 8 sq.
in. area, deposit the swab head in the rinse vial
and add 0.5 ml of sterile hexametaphosphate
solution.
To begin plating, shake the vial vigorously
to dislodge the bacteria from the swab. Pipet 1
ml and 0.1 ml aliquots of the rinse solution.
The 1 ml portions represent a 1:10 dilution
and the 0.1 ml portions represent a 1:100
dilution. Pour the plates with Standard Me-
thods Agar. Mix and cool to solidify and incu-
bate at 35 C for 48 hours.
(c) Count colonies and convert the value to
the number/ml which equals the count per 8
sq. in. of area.
2.5.3 Air Density Plates (1)
The number of microorganisms in the lab-
oratory air is directly proportional to the
amount and kind of activity. These organisms
affect results when the suspended cells con-
tact materials and equipment or when they
settle on exposed test materials and surfaces.
(a) The numbers and types of airborne
microorganisms can be determined by expos-
ing petri plates for a specified time at points
where inoculating, filtering, plating and trans-
fer work is done. This exposure method can be
used to monitor total bacteria or the specific
organisms being tested such as coliforms, en-
teric pathogens, streptococci, staphylococci,
yeasts or molds.
(b) Pour the petri dishes with the appropri-
ate agar and allow to harden. Store poured
plates in the refrigerator if they are not used on
the same day.
(c) Remove petri dish covers and place
dishes top side up on sterile towels. Expose the
196
QA/LABORATORY OPERATIONS
image:
nles per RODAC plate or number of colonies
par 25 sq. cm.
2.5.2 Swab Method (1)
(a) The swab contact method can be used
to monitor the contamination of work areas
and especially those with cracks, corners,
crevices and rough surfaces. Dacron swabs
rinse out more easily than cotton ones. These
may be purchased from Econ Microbiological
Laboratory, 2716 Humboldt Avenue, South,
Minneapolis, MN. Rayon swabs are available
from Fuller Pharmaceutical Company, Minne-
apolis, MN, and Consolidated Laboratories
Inc., Chicago Heights, IL. Swabs made of cal-
cium alginate which is soluble in water, can
also be used. These are available from Consoli-
dated Laboratories, Inc., Chicago Heights, IL.
Rinse Solution Vials - Add 1.25 ml stock
phosphate buffer solution, 5 ml of 10% aque-
ous sodium thiosulfate, 4 grams Asolectin (As-
sociated Concentrates, 32-30 61st Street,
Woodside, Long Island, NY 11377) and 10
grams Tween 20 or Tween 80 (Hilltop Re-
search, Inc., Miamiville, OH 45147) to 500 ml
distilled water; heat to solution in boiling water
bath. Cool and make up to 1 liter. Dispense in
screw-capped vials in 10 ml or other volumes
and sterilize for 15 minutes at 15 Ib. pressure
(121 C). Because Asolectin is hygroscopic,
store it in a desiccator and weigh quickly.
(b) To sample an area, open a sterile swab
container, grasp the end of the stick and re-
move aseptically. Open a 10 ml vial of neutral-
izing buffer, moisten swab head, and press out
excess solution against the inside of the vial.
Hold the swab handle at a 30° angle against
the sampling area. Rub the swab head slowly
and throughly over approximately 8 sq. in. of
surface area. Repeat procedure 3 times over
the same area, turning the swab and reversing
directions. Place the swab head in the neutral-
izirjg buffer vial, rinse briefly in solution and
press out the excess liquid.
Test four more 8 sq. in. areas of surface,
rinsing the swab in solution after each swab-
bing. After the fifth area has been swabbed,
remove the excess liquid, place swab head in
vial and break or cut with a sterile scissors
leaving the swab head in the vial. Replace the
cap and store vial at 4 C or on ice until analysis.
When using alginate swabs, rinse solution
vials should contain 4.5 ml after sterilization.
Prepare a 10% solution of sodium
hexametaphosphate in appropriate vials and
steam sterilize. Follow the above swabbing
procedures but after swabbing the fifth 8 sq.
in. area, deposit the swab head in the rinse vial
and add 0.5 ml of sterile hexametaphosphate
solution.
To begin plating, shake the vial vigorously
to dislodge the bacteria from the swab. Pipet 1
ml and 0.1 ml aliquots of the rinse solution.
The 1 ml portions represent a 1:10 dilution
and the 0.1 ml portions represent a 1:100
dilution. Pour the plates with Standard Me-
thods Agar. Mix and cool to solidify and incu-
bate at 35 C for 48 hours.
(c) Count colonies and convert the value to
the number/ml which equals the count per 8
sq. in. of area.
2.5.3 Air Density Plates (1)
The number of microorganisms in the lab-
oratory air is directly proportional to the
amount and kind of activity. These organisms
affect results when the suspended cells con-
tact materials and equipment or when they
settle on exposed test materials and surfaces.
(a) The numbers and types of airborne
microorganisms can be determined by expos-
ing petri plates for a specified time at points
where inoculating, filtering, plating and trans-
fer work is done. This exposure method can be
used to monitor total bacteria or the specific
organisms being tested such as coliforms, en-
teric pathogens, streptococci, staphylococci,
yeasts or molds.
(b) Pour the petri dishes with the appropri-
ate agar and allow to harden. Store poured
plates in the refrigerator if they are not used on
the same day.
(c) Remove petri dish covers and place
dishes top side up on sterile towels. Expose the
196
QA/LABORATORY OPERATIONS
image:
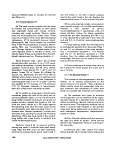 plates in selected work sites for 15 minutes
and mark them with sample site identification.
Replace covers. Incubate Standard Methods
Agar at 35 C for 48 hours and other media for
the specified time periods,
(d) Count the colonies and report the num-
ber per square foot. The number of organisms
which settle in 15 minutes of exposure on a
petri dish is equivalent to that for 1 sqt
ft./minute because the area of a standard-size
petri dish is approximately 1/15 sq. ft. The
microbial density should not normally exceed
15 colonies per sq. ft. Air density plates should
be taken weekly during peak work periods for
routine monitoring.
2.6 Laboratory Maintenance: Laboratory
benches, shelves, floors and windows should
be cleaned on a scheduled basis. Proper main-
tenance is evidenced by lack of dust and soil
build-up on shelves, in corners, etc. Floors
should be wet-mopped and treated with a dis-
infectant solution to reduce contamination of
air in the laboratory- Sweeping or dry-mopping
should not be permitted in a microbiology
laboratory. Work benches should be wiped
down with disinfectant before and after each
use and at the end of the day.
Every attempt should be made to maintain
the laboratory areas free of clutter. Laboratory
benches, space under benches, shelves and
drawers accumulate equipment materials and
supplies at a steady rate. The disorder can
interfere with laboratory operations. It can be
controlled by making a directed effort to clean
up work areas immediately after each use and
by conducting a weekly clean-up of the labora-
tory- Discard unneeded materials and store
equipment and supplies not in current use. The
most important step in maintaining an orderly
laboratory is to have ample storage space
near-by.
3. Laboratory Personnel
Microbiologists, technicians and support
personnel in the microbiology laboratory must
have training and experience appropriate to
the laboratory's analytical program. The vari-
ety and complexity of the tasks and tests per-
formed determine the professional and on-the-
job-training required.
3.1 Professional Microbiologist: The mi-
crobiologist directs and participates in the col-
lection and storage of samples, the prepara-
tion of glassware, equipment and media, the
analysis of a variety of waters and wastewa-
ters and the evaluation of procedures as re-
quired. He takes part in the quality control
program. He counts, tabulates and summa-
rizes data and prepares or helps to prepare
reports from the results. He should have at
least a BS degree in microbiology or a BS/BA
degree in biology with a minor in
microbiology.
The professional microbiologist initially
carries out routine tasks and progresses to
more difficult work as he gains experience.
When he reaches the senior level he performs
the most complex duties.
3.2 Senior Grade and Supervisory Micro-
biologists: A senior grade microbiologist per-
forms the duties described in 3.1 but carries
out a wider range of assignments and more
difficult tests. He participates in program plan-
ning and laboratory management and solves
significant microbiological problems that re-
quire a higher than bench-level skill and knowl-
edge. The experienced microbiologist consults
and advises on procedural problems and trains
personnel. He provides expert testimony,
interprets results, prepares reports and
recommends microbiological standards or
actions for regulatory programs.
The supervisory microbiologist performs
administrative functions of: planning and
directing water quality monitoring programs,
designing field surveys, advising administrative
officers on policy matters related to micro-
biology and inspecting laboratory facilities. He
is recognized for his authoritative scientific
competence.
3.3 Technicians: The technician performs
semi-professional and professional duties of
limited scope and complexity. Typically, he
assists professionals by doing the routine tests.
QA/LABORATORY OPERATIONS
197
image:
plates in selected work sites for 15 minutes
and mark them with sample site identification.
Replace covers. Incubate Standard Methods
Agar at 35 C for 48 hours and other media for
the specified time periods,
(d) Count the colonies and report the num-
ber per square foot. The number of organisms
which settle in 15 minutes of exposure on a
petri dish is equivalent to that for 1 sqt
ft./minute because the area of a standard-size
petri dish is approximately 1/15 sq. ft. The
microbial density should not normally exceed
15 colonies per sq. ft. Air density plates should
be taken weekly during peak work periods for
routine monitoring.
2.6 Laboratory Maintenance: Laboratory
benches, shelves, floors and windows should
be cleaned on a scheduled basis. Proper main-
tenance is evidenced by lack of dust and soil
build-up on shelves, in corners, etc. Floors
should be wet-mopped and treated with a dis-
infectant solution to reduce contamination of
air in the laboratory- Sweeping or dry-mopping
should not be permitted in a microbiology
laboratory. Work benches should be wiped
down with disinfectant before and after each
use and at the end of the day.
Every attempt should be made to maintain
the laboratory areas free of clutter. Laboratory
benches, space under benches, shelves and
drawers accumulate equipment materials and
supplies at a steady rate. The disorder can
interfere with laboratory operations. It can be
controlled by making a directed effort to clean
up work areas immediately after each use and
by conducting a weekly clean-up of the labora-
tory- Discard unneeded materials and store
equipment and supplies not in current use. The
most important step in maintaining an orderly
laboratory is to have ample storage space
near-by.
3. Laboratory Personnel
Microbiologists, technicians and support
personnel in the microbiology laboratory must
have training and experience appropriate to
the laboratory's analytical program. The vari-
ety and complexity of the tasks and tests per-
formed determine the professional and on-the-
job-training required.
3.1 Professional Microbiologist: The mi-
crobiologist directs and participates in the col-
lection and storage of samples, the prepara-
tion of glassware, equipment and media, the
analysis of a variety of waters and wastewa-
ters and the evaluation of procedures as re-
quired. He takes part in the quality control
program. He counts, tabulates and summa-
rizes data and prepares or helps to prepare
reports from the results. He should have at
least a BS degree in microbiology or a BS/BA
degree in biology with a minor in
microbiology.
The professional microbiologist initially
carries out routine tasks and progresses to
more difficult work as he gains experience.
When he reaches the senior level he performs
the most complex duties.
3.2 Senior Grade and Supervisory Micro-
biologists: A senior grade microbiologist per-
forms the duties described in 3.1 but carries
out a wider range of assignments and more
difficult tests. He participates in program plan-
ning and laboratory management and solves
significant microbiological problems that re-
quire a higher than bench-level skill and knowl-
edge. The experienced microbiologist consults
and advises on procedural problems and trains
personnel. He provides expert testimony,
interprets results, prepares reports and
recommends microbiological standards or
actions for regulatory programs.
The supervisory microbiologist performs
administrative functions of: planning and
directing water quality monitoring programs,
designing field surveys, advising administrative
officers on policy matters related to micro-
biology and inspecting laboratory facilities. He
is recognized for his authoritative scientific
competence.
3.3 Technicians: The technician performs
semi-professional and professional duties of
limited scope and complexity. Typically, he
assists professionals by doing the routine tests.
QA/LABORATORY OPERATIONS
197
image:
 Under supervision, he performs tasks involving
a series of steps. Technicians learn through
on-the-job instruction and by performing
standard tasks repetitively.
Technicians' tasks begin at the simplest'
level but can progress to the more, detailed
procedures performed by the professional mi-
crobiologist. However, these higher levels of
skill and knowledge are generally limited to
the specific areas in which they have received
on-the-job-training.
3.4 Support Personnel: Laboratory aides
and clerks provide the necessary support serv-
ices to the laboratory. Aides prepare glass-
ware, make media and sterilize materials. One
or, more aides are recommended for every
bench microbiologist. Clerical duties include
recording data, filing records, typing reports,
ordering supplies, maintaining inventories,
distributing mail and answering the telephone.
3.5 On-the-Job-Training and Experience:
In addition to the formal academic training, the
professional microbiologist should have
experience in aquatic or environmental
microbiology. Technical or on-the-job-training
for at least two weeks is required for each
parameter tested in water microbiology. The
formal training of the technician ranges from
high school to technical or academic training
short of a degree in microbiology. Technical
and scientific experience is often substituted
for advanced formal training.
The microbiologist and technician should
be encouraged to attend courses at centers of
expertise such as universities, commercial
manufacturers, US EPA facilities, the Center
for Disease Control (CDC) of USPHS, FDA and
other federal and state governmental agen-
cies. Courses might include fluorescent anti-
body techniques, isolation and identification
of the Enterobacteriaceae and laboratory
safety.
3.6 Laboratory Supervison: Ideally, the
laboratory should be directed by a profes-
sional microbiologist. However, in a small
laboratory where the staff consists of a single
non-professional technician, an approved con-
sultant microbiologist should be available for
guidance and assistance.
Work assignments in the laboratory
should be clearly defined. The analyst should
be trained in basic laboratory procedures and
should perform well at a given level of respon-
sibility before new assignments are made. The
supervisor should periodically review proce-
dures such as sample collecting and handling,
media and glassware preparation, sterilization,
routine testing procedures, counting, data han-
dling, and quality control techniques. Problem
areas should be identified and solved by the
staff. Improved laboratory results will be the
measure of effective personnel practice and
training.
4. Laboratory
Instrumentation
Equipment
and
Quality control of laboratory apparatus in-
cludes servicing and monitoring the operation
of incubators, waterbaths, hot-air sterilizing
ovens, autoclaves, water stills, refrigerators,
freezers, etc. Each item of equipment should
be tested to verify that it meets the manufac-
turer's claims and the user's needs for accu-
racy and precision. Maintenance should be
performed on a regular basis by a tebhnician
who is familiar with the equipment.
4.1 A summary of recommended monitor-
ing procedures for laboratory equipment is
given in Table IV-A-1.
4.2 Monitoring Procedures for UV
Lamps
4.2.1 Spread Plate Irradiation
This test should be run when a new UV
lamp is installed and rerun quarterly to mea-
sure continuing effectiveness of the UV
irradiation.
(a) Prepare 100 ml or more of plate count
agar. Pour 10-15 ml of the melted agar into
each 100 mm petri dish as needed. Keep cov-
ers opened slightly until agar has hardened
198
SEPA MICROBIOLOGICAL MANUAL 1978
image:
Under supervision, he performs tasks involving
a series of steps. Technicians learn through
on-the-job instruction and by performing
standard tasks repetitively.
Technicians' tasks begin at the simplest'
level but can progress to the more, detailed
procedures performed by the professional mi-
crobiologist. However, these higher levels of
skill and knowledge are generally limited to
the specific areas in which they have received
on-the-job-training.
3.4 Support Personnel: Laboratory aides
and clerks provide the necessary support serv-
ices to the laboratory. Aides prepare glass-
ware, make media and sterilize materials. One
or, more aides are recommended for every
bench microbiologist. Clerical duties include
recording data, filing records, typing reports,
ordering supplies, maintaining inventories,
distributing mail and answering the telephone.
3.5 On-the-Job-Training and Experience:
In addition to the formal academic training, the
professional microbiologist should have
experience in aquatic or environmental
microbiology. Technical or on-the-job-training
for at least two weeks is required for each
parameter tested in water microbiology. The
formal training of the technician ranges from
high school to technical or academic training
short of a degree in microbiology. Technical
and scientific experience is often substituted
for advanced formal training.
The microbiologist and technician should
be encouraged to attend courses at centers of
expertise such as universities, commercial
manufacturers, US EPA facilities, the Center
for Disease Control (CDC) of USPHS, FDA and
other federal and state governmental agen-
cies. Courses might include fluorescent anti-
body techniques, isolation and identification
of the Enterobacteriaceae and laboratory
safety.
3.6 Laboratory Supervison: Ideally, the
laboratory should be directed by a profes-
sional microbiologist. However, in a small
laboratory where the staff consists of a single
non-professional technician, an approved con-
sultant microbiologist should be available for
guidance and assistance.
Work assignments in the laboratory
should be clearly defined. The analyst should
be trained in basic laboratory procedures and
should perform well at a given level of respon-
sibility before new assignments are made. The
supervisor should periodically review proce-
dures such as sample collecting and handling,
media and glassware preparation, sterilization,
routine testing procedures, counting, data han-
dling, and quality control techniques. Problem
areas should be identified and solved by the
staff. Improved laboratory results will be the
measure of effective personnel practice and
training.
4. Laboratory
Instrumentation
Equipment
and
Quality control of laboratory apparatus in-
cludes servicing and monitoring the operation
of incubators, waterbaths, hot-air sterilizing
ovens, autoclaves, water stills, refrigerators,
freezers, etc. Each item of equipment should
be tested to verify that it meets the manufac-
turer's claims and the user's needs for accu-
racy and precision. Maintenance should be
performed on a regular basis by a tebhnician
who is familiar with the equipment.
4.1 A summary of recommended monitor-
ing procedures for laboratory equipment is
given in Table IV-A-1.
4.2 Monitoring Procedures for UV
Lamps
4.2.1 Spread Plate Irradiation
This test should be run when a new UV
lamp is installed and rerun quarterly to mea-
sure continuing effectiveness of the UV
irradiation.
(a) Prepare 100 ml or more of plate count
agar. Pour 10-15 ml of the melted agar into
each 100 mm petri dish as needed. Keep cov-
ers opened slightly until agar has hardened
198
SEPA MICROBIOLOGICAL MANUAL 1978
image:
 and moisture and condensation have evapo-
rated. Close dishes and store in refrigerator
until use.
(b) Prepare a series of dilutions of a coli-
form culture so that 0.5 ml of inoculum will
give a 200-250 colony count (see Geldreich
and Clark).
(c) Pipet 0.5 ml of the selected dilution to
each agar plate.
(d) Remove a glass spreader-rod from the
alcohol container and ignite by passing
through flame. Let burn completely and cool
for 15 seconds. Test glass rod on edge of agar
to verify safe temperature before use. Glass
spreaders may also be autoclaved.
(e) Place sterile, cool glass spreader on
agar surface next to inoculum. Position
spreader so that the tip forms a radius from the
center to the plate edge. Holding stick motion-
less, rotate plate several revolutions, or hold
the plate and move the stick in a series of
sweeping arcs to spread the inoculum uni-
formly over the entire surface of the agar.
(f) Lift the glass spreader from the agar and
place in disinfectant solution.
(g) Repeat the spread plate procedure with
other petri plates.
(h) With cover removed, place agar spread
plates under UV lamp at points where sterility
is desired.
(i) Place one inoculated plate under ordi-
nary laboratory lighting as a control.
(j) Expose plates for two minutes.
(k) Close plates and incubate at 35 C for
24 hours. Remove and examine for growth.
(1) Count all plates and record results.
Control plate should contain 200-250 colo-
nies. UV-irradiated plates should show 99%
reduction in the count of the control plate. If
count reduction is less than 80%, replace
lamp.
4.2.2 Measurements of UV Light Intensity
To monitor performance of UV lamps, it is
necessary to measure UV light intensity using
the UV light meter manufactured for this pur-
pose. The shortwave UV meter Model J-225 is
available from UV Products, Inc., San Gabriel,
CA 91778 for about $ 125. This instrument or
equivalent is recommended.
(a) Measure and average light intensities
of a new UV lamp at proper distances of use.
Record results in QC log, noting readings and
dates of installation.
(b) Monitor lamp intensity quarterly there-
after. Replace bulb when light is down to 80%
of original intensity.
(c) Measure and average light intensities
of replacement lamp at proper distances.
Record readings and date of installation.
5. {^eneral Laboratory Supplies
5.1 Laboratory Glassware
5.1.1 A summary of procedures for main-
tenance of glassware is given in Table IV-A-2).
5-1.2 Glassware pH Check: Traces of
some cleaning solutions are difficult to remove
completely. Before using a batch of clean
glassware, test several pieces for an alkaline
or acid residue by adding and dispersing a few
drops of bromthymol blue or other pH indica-
tor and observing the color reactions. Brom-
thymol blue is particularly advantageous for
this check because it shows color changes of
yellow to blue green to blue, in the pH range
6.5 to 7.3.
To prepare bromthymol blue indicator,
add 16 ml of 0.01 N NaOH to 0.1 gram of
bromthymol blue. Dilute to 250 ml with dis-
tilled water (0.04% solution).
5.1.3 Test Procedure for Suitability of De-
tergents Used in Washing (2)
QA/LABORATORY OPERATIONS
199
image:
and moisture and condensation have evapo-
rated. Close dishes and store in refrigerator
until use.
(b) Prepare a series of dilutions of a coli-
form culture so that 0.5 ml of inoculum will
give a 200-250 colony count (see Geldreich
and Clark).
(c) Pipet 0.5 ml of the selected dilution to
each agar plate.
(d) Remove a glass spreader-rod from the
alcohol container and ignite by passing
through flame. Let burn completely and cool
for 15 seconds. Test glass rod on edge of agar
to verify safe temperature before use. Glass
spreaders may also be autoclaved.
(e) Place sterile, cool glass spreader on
agar surface next to inoculum. Position
spreader so that the tip forms a radius from the
center to the plate edge. Holding stick motion-
less, rotate plate several revolutions, or hold
the plate and move the stick in a series of
sweeping arcs to spread the inoculum uni-
formly over the entire surface of the agar.
(f) Lift the glass spreader from the agar and
place in disinfectant solution.
(g) Repeat the spread plate procedure with
other petri plates.
(h) With cover removed, place agar spread
plates under UV lamp at points where sterility
is desired.
(i) Place one inoculated plate under ordi-
nary laboratory lighting as a control.
(j) Expose plates for two minutes.
(k) Close plates and incubate at 35 C for
24 hours. Remove and examine for growth.
(1) Count all plates and record results.
Control plate should contain 200-250 colo-
nies. UV-irradiated plates should show 99%
reduction in the count of the control plate. If
count reduction is less than 80%, replace
lamp.
4.2.2 Measurements of UV Light Intensity
To monitor performance of UV lamps, it is
necessary to measure UV light intensity using
the UV light meter manufactured for this pur-
pose. The shortwave UV meter Model J-225 is
available from UV Products, Inc., San Gabriel,
CA 91778 for about $ 125. This instrument or
equivalent is recommended.
(a) Measure and average light intensities
of a new UV lamp at proper distances of use.
Record results in QC log, noting readings and
dates of installation.
(b) Monitor lamp intensity quarterly there-
after. Replace bulb when light is down to 80%
of original intensity.
(c) Measure and average light intensities
of replacement lamp at proper distances.
Record readings and date of installation.
5. {^eneral Laboratory Supplies
5.1 Laboratory Glassware
5.1.1 A summary of procedures for main-
tenance of glassware is given in Table IV-A-2).
5-1.2 Glassware pH Check: Traces of
some cleaning solutions are difficult to remove
completely. Before using a batch of clean
glassware, test several pieces for an alkaline
or acid residue by adding and dispersing a few
drops of bromthymol blue or other pH indica-
tor and observing the color reactions. Brom-
thymol blue is particularly advantageous for
this check because it shows color changes of
yellow to blue green to blue, in the pH range
6.5 to 7.3.
To prepare bromthymol blue indicator,
add 16 ml of 0.01 N NaOH to 0.1 gram of
bromthymol blue. Dilute to 250 ml with dis-
tilled water (0.04% solution).
5.1.3 Test Procedure for Suitability of De-
tergents Used in Washing (2)
QA/LABORATORY OPERATIONS
199
image:
 (a) Wash and rinse six, 100 mm diameter
petri dishes in the usual manner. These are
Group A.
(b) After normal washing, rinse a second
group of 6 petri dishes 12 times with succes-
sive portions of non-toxic distilled water.
These are Group B.
(c) Wash 6 petri dishes with the detergent
wash water using detergent concentrations
normally employed, and dry without rinsing.
These are Group C.
(d) Sterilize dishes in the usual manner.
(e) Add the proper dilution (usually two
different dilutions are used) of a water sample
yielding 30-300 colonies to triplicate petri
dishes from each Group (A, B and C). Proceed
according to the Standard Plate Count Proce-
dure in Partlll-A.
(f) The results are interpreted as follows:
{1} Differences in bacterial counts of less
than 15% among all Groups indicate the deter-
gent has no toxicity or inhibitory effect.
(2) Differences in bacterial counts of 15%
or more between Group A and B demonstrate
that Inhibitory residues are left on glassware
after the normal washing procedure used.
(3} Disagreement in averages of less than
15% between Groups A and B, and greater
than;15% between Groups A and C indicates
that detergent used h,as inhibitory
properties which are eliminated during routine
washing.
5.1.4 Sterility Checks on Glassware
After sterilization of a load of bottles,
flasks or tubes, test items of each type for
sterility by adding to one of each aerobic or
anaerobic broth medium (e.g., lauryl tryptose
or fluid thioglycollate broth). Incubate and
check for growth.
5.2 Pure Water Quality: Pure water sys-
tems are meant to produce the best possible
water; however, the potential quality of the
water will vary with the type of system used.
The quality of water obtainable from a
pure water system differs with the system used
and its maintenance. The acceptable limits are
given in Table IV-A-3.
5.3 Water Suitability Test
5.3.1 Summary: The water suitability
procedure of Geldreich and Clark (3) is a
sensitive test for determination of toxic or
stimulatory effects of distilled or deionized
water on bacteria. It is based on the growth of
Enterobacter aerogenes in a chemically defined
medium. Reduction of 20% or more in the
bacterial population compared to a control, is
judged toxic. Increased growth greater than
300% is called stimulatory.
5.3.2 Scope and Application: The test
is recommended for periodic use and as a
special measure of water suitability. This
test called the Test for Bacteriological
Properties of Distilled water, in the 14th
edition of Standard Methods is required
annually of laboratories in the Interim Certi-
fication Program for Drinking Water Supplies.
However, the test is not easily done on
an infrequent basis because it requires: work
over a four day period to complete, an ultra-
pure control water and very pure reagents,
and absolute cleanliness of culture flasks,
petri dishes, test tubes and pipets, etc. It is
a complex method that requires skill and
experience, is very sensitive to toxicants and
cannot be related directly to routine analytical
results.
5.3.3 Apparatus and Materials
(a) Incubator set at 35 ± 0.5 C.
(b)Water bath for tempering agar set at
44-46 C.
(c) Colony counter, Quebec dark field
model or equivalent.
(d) Hand tally or electronic counting de-
vice (optional),
(e) Pipet containers of stainless steel,
aluminum or pyrex glass for glass pipets.
(f) Petri dish containers of stainless steel
or aluminum for glass petri dishes.
200
<&EPA MICROBIOLOGICAL MANUAL 1978
image:
(a) Wash and rinse six, 100 mm diameter
petri dishes in the usual manner. These are
Group A.
(b) After normal washing, rinse a second
group of 6 petri dishes 12 times with succes-
sive portions of non-toxic distilled water.
These are Group B.
(c) Wash 6 petri dishes with the detergent
wash water using detergent concentrations
normally employed, and dry without rinsing.
These are Group C.
(d) Sterilize dishes in the usual manner.
(e) Add the proper dilution (usually two
different dilutions are used) of a water sample
yielding 30-300 colonies to triplicate petri
dishes from each Group (A, B and C). Proceed
according to the Standard Plate Count Proce-
dure in Partlll-A.
(f) The results are interpreted as follows:
{1} Differences in bacterial counts of less
than 15% among all Groups indicate the deter-
gent has no toxicity or inhibitory effect.
(2) Differences in bacterial counts of 15%
or more between Group A and B demonstrate
that Inhibitory residues are left on glassware
after the normal washing procedure used.
(3} Disagreement in averages of less than
15% between Groups A and B, and greater
than;15% between Groups A and C indicates
that detergent used h,as inhibitory
properties which are eliminated during routine
washing.
5.1.4 Sterility Checks on Glassware
After sterilization of a load of bottles,
flasks or tubes, test items of each type for
sterility by adding to one of each aerobic or
anaerobic broth medium (e.g., lauryl tryptose
or fluid thioglycollate broth). Incubate and
check for growth.
5.2 Pure Water Quality: Pure water sys-
tems are meant to produce the best possible
water; however, the potential quality of the
water will vary with the type of system used.
The quality of water obtainable from a
pure water system differs with the system used
and its maintenance. The acceptable limits are
given in Table IV-A-3.
5.3 Water Suitability Test
5.3.1 Summary: The water suitability
procedure of Geldreich and Clark (3) is a
sensitive test for determination of toxic or
stimulatory effects of distilled or deionized
water on bacteria. It is based on the growth of
Enterobacter aerogenes in a chemically defined
medium. Reduction of 20% or more in the
bacterial population compared to a control, is
judged toxic. Increased growth greater than
300% is called stimulatory.
5.3.2 Scope and Application: The test
is recommended for periodic use and as a
special measure of water suitability. This
test called the Test for Bacteriological
Properties of Distilled water, in the 14th
edition of Standard Methods is required
annually of laboratories in the Interim Certi-
fication Program for Drinking Water Supplies.
However, the test is not easily done on
an infrequent basis because it requires: work
over a four day period to complete, an ultra-
pure control water and very pure reagents,
and absolute cleanliness of culture flasks,
petri dishes, test tubes and pipets, etc. It is
a complex method that requires skill and
experience, is very sensitive to toxicants and
cannot be related directly to routine analytical
results.
5.3.3 Apparatus and Materials
(a) Incubator set at 35 ± 0.5 C.
(b)Water bath for tempering agar set at
44-46 C.
(c) Colony counter, Quebec dark field
model or equivalent.
(d) Hand tally or electronic counting de-
vice (optional),
(e) Pipet containers of stainless steel,
aluminum or pyrex glass for glass pipets.
(f) Petri dish containers of stainless steel
or aluminum for glass petri dishes.
200
<&EPA MICROBIOLOGICAL MANUAL 1978
image:
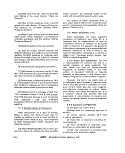 (g) Thermometer certified by National
Bureau of Standards or one of equivalent
accuracy, with calibration chart,
(h) Sterile TD (To Deliver) bacteriological
or Mohr pipets, glass or plastic of appropriate
volumes, see Part II-B, 1.8.1.
(i) Sterile 100 mm x 15 mm petri dishes,
glass or plastic.
(j) Sterile pyrex glass flasks, 100 ml,
500 ml, and 1000 ml volume.
(k) Dilution bottles (milk dilution), pyrex
glass, marked at 99 ml volume, screw cap
with neoprene rubber liner.
(I) Bunsen/Fisher gas burner or electric
incinerator.
(m) Inoculation loops, at least 3 mm
diameter, or needles, nichrome or platinum
wire, 26 B&S gauge, in suitable holder.
5.3.4 Media
(a) Sterile Plate Count Agar (Tryptone
Glucose Yeast Agar) dispensed in tubes (15
to 20 ml per tube) or in bulk quantities in
screw cap flasks or dilution bottles. See
Part II-B, 5.1.5.
(b) Sterile buffered dilution water, 99 ± 2
ml volumes, in screw capped dilution bottles.
See Part II-B, 7.
(c) Nutrient agar slants with slopes approx-
imately 6.3 cm (21/2 in) length in 125 x 16 mm
screw cap tubes.
5.3.S Reagents: Sensitivity of the test
depends on the purity of the reagents used.
Use reagents of the highest purity and
prepare them in water freshly redistilled from
a glass still.
(a) Sodium citrate solution: Dissolve
0.29 g sodium citrate, Na3CeHgO7-2H20, in
500 ml redistilled water.
(b) Ammonium sulfate solution: Dissolve
0.60 g ammonium sulfate, (NH^SO^ in
500 ml redistilled water.
(c) Salt mixture solution: Dissolve 0.26 g
magnesium sulfate, MgSCU • IHaO; 0.17 g
calcium chloride, CaCl2'2H2O; 0.23 g ferrous
sulfate, FeS04 • 7H20; and 2.50 g sodium
chloride, NaCI, in 500 ml redistilled water.
(d) Phosphate buffer solution: Stock
phosphate buffer solution, diluted 1:25 in
redistilled water, see Part II-B, 7.1 in this
Manual.
Boil reagent solution 1-2 min.to kill vege-
tative cells. Store in sterilized glass-stoppered
bottles in the dark at 5 C for several months but
test for sterility before each period of use.
Prepare the salt-mixture solution without the
ferrous sulfate for long-term storage. To use
the mixture, add an appropriate amount of the
freshly prepared and freshly boiled iron salt.
Solutions with a heavy turbidity should be
discarded and a new solution prepared. Bac-
terial contamination may cause turbidity in the
phosphate buffer solution. Discard if this
occurs.
5.3.6 Culture: Isolate a pure culture of
Enterobacter aerogenes (IMViC type —++)
from a polluted stream or sewage sample.
5.3.7 Procedure
(a) Collect 200 ml each, of the unknown
Test Water and the Control Water (laboratory
pure reference water) in sterile 500 ml screw
cap flasks. Boil for 2 minutes and cool to
room temperature.
(b) Label five, sterile 200 ml screw cap
flasks as A, B, C, D, and E. Add the Test
Water, Control Water, and reagents to each
flask as described in the following table:
Reagents
Sodium citrate solution
Ammonium sulfate solution
Salt-mixture solution
Phosphate buffer (7.3 ± 0.1)
Test Water
Control Water
Total volume
Control
Control
Water
A
2.5
2.5
2.5
1.5
21.0
30.0
Test (ml)
Unknown
Test
Water
B
2.5
2,5
2.5
1.5
21.0
30.0
Optional Tests
Nutrient
Available
C
2.5
1.5
21.0
5.0
30.0
Nitrogen
Source
D
2.5
2.5
1.5
21.0
2.5
30.0
(ml)
Carbon
Source
E
2.5
2.5
1.5
21.0
2.5
30.0
QA/LABORATORY OPERATIONS
201
image:
(g) Thermometer certified by National
Bureau of Standards or one of equivalent
accuracy, with calibration chart,
(h) Sterile TD (To Deliver) bacteriological
or Mohr pipets, glass or plastic of appropriate
volumes, see Part II-B, 1.8.1.
(i) Sterile 100 mm x 15 mm petri dishes,
glass or plastic.
(j) Sterile pyrex glass flasks, 100 ml,
500 ml, and 1000 ml volume.
(k) Dilution bottles (milk dilution), pyrex
glass, marked at 99 ml volume, screw cap
with neoprene rubber liner.
(I) Bunsen/Fisher gas burner or electric
incinerator.
(m) Inoculation loops, at least 3 mm
diameter, or needles, nichrome or platinum
wire, 26 B&S gauge, in suitable holder.
5.3.4 Media
(a) Sterile Plate Count Agar (Tryptone
Glucose Yeast Agar) dispensed in tubes (15
to 20 ml per tube) or in bulk quantities in
screw cap flasks or dilution bottles. See
Part II-B, 5.1.5.
(b) Sterile buffered dilution water, 99 ± 2
ml volumes, in screw capped dilution bottles.
See Part II-B, 7.
(c) Nutrient agar slants with slopes approx-
imately 6.3 cm (21/2 in) length in 125 x 16 mm
screw cap tubes.
5.3.S Reagents: Sensitivity of the test
depends on the purity of the reagents used.
Use reagents of the highest purity and
prepare them in water freshly redistilled from
a glass still.
(a) Sodium citrate solution: Dissolve
0.29 g sodium citrate, Na3CeHgO7-2H20, in
500 ml redistilled water.
(b) Ammonium sulfate solution: Dissolve
0.60 g ammonium sulfate, (NH^SO^ in
500 ml redistilled water.
(c) Salt mixture solution: Dissolve 0.26 g
magnesium sulfate, MgSCU • IHaO; 0.17 g
calcium chloride, CaCl2'2H2O; 0.23 g ferrous
sulfate, FeS04 • 7H20; and 2.50 g sodium
chloride, NaCI, in 500 ml redistilled water.
(d) Phosphate buffer solution: Stock
phosphate buffer solution, diluted 1:25 in
redistilled water, see Part II-B, 7.1 in this
Manual.
Boil reagent solution 1-2 min.to kill vege-
tative cells. Store in sterilized glass-stoppered
bottles in the dark at 5 C for several months but
test for sterility before each period of use.
Prepare the salt-mixture solution without the
ferrous sulfate for long-term storage. To use
the mixture, add an appropriate amount of the
freshly prepared and freshly boiled iron salt.
Solutions with a heavy turbidity should be
discarded and a new solution prepared. Bac-
terial contamination may cause turbidity in the
phosphate buffer solution. Discard if this
occurs.
5.3.6 Culture: Isolate a pure culture of
Enterobacter aerogenes (IMViC type —++)
from a polluted stream or sewage sample.
5.3.7 Procedure
(a) Collect 200 ml each, of the unknown
Test Water and the Control Water (laboratory
pure reference water) in sterile 500 ml screw
cap flasks. Boil for 2 minutes and cool to
room temperature.
(b) Label five, sterile 200 ml screw cap
flasks as A, B, C, D, and E. Add the Test
Water, Control Water, and reagents to each
flask as described in the following table:
Reagents
Sodium citrate solution
Ammonium sulfate solution
Salt-mixture solution
Phosphate buffer (7.3 ± 0.1)
Test Water
Control Water
Total volume
Control
Control
Water
A
2.5
2.5
2.5
1.5
21.0
30.0
Test (ml)
Unknown
Test
Water
B
2.5
2,5
2.5
1.5
21.0
30.0
Optional Tests
Nutrient
Available
C
2.5
1.5
21.0
5.0
30.0
Nitrogen
Source
D
2.5
2.5
1.5
21.0
2.5
30.0
(ml)
Carbon
Source
E
2.5
2.5
1.5
21.0
2.5
30.0
QA/LABORATORY OPERATIONS
201
image:
 (c) Perform a Standard Plate Count on
prepared reagents. Control Water, and Test
Water as a check on contamination.
(d) On the day before performing the
distilled-water suitability test, inoculate a
strain of E. aerogenes onto a nutrient agar
slant. Streak the entire agar surface to
develop a continuous-growth film and
incubate 18-24 hours at 35 C. To harvest
viable cells, pipet 1-2 ml sterile dilution water
from a 99 ml water blank onto the 18-24
hour culture. Emulsify the growth on the
slant by gently rubbing the bacterial film
with the pipet, being careful not to tear the
agar; then pipet the suspension back into the
original 99 ml water blank.
(a) Make a 1:100 dilution of the original
bottle into a second water blank, a further
1:100 dilution of the second bottle into a
third water blank, then 10 ml of the third
bottle into a fourth water blank, shaking
vigorously after each transfer. Pipet 1.0 ml of
the fourth dilution (1:10"8} into each of Flasks
A, B, C, D, and E. This procedure should
result in a final dilution of the organisms to
a range of 30-80 viable cells from each ml
of test solution.
(f) Variations among strains of the same
organism, different organisms, media, and
surface area of agar slopes will possibly
necessitate adjustment of the dilution pro-
cedure in order to arrive at a specific density
range between 30 and 80 viable cells. To
establish the growth range numerically for a
specific organism and medium, make a series
of plate counts from the third dilution to
determine the bacterial density. Then choose
the proper volume from this third dilution,
which, when diluted by the 30 mi in Flasks A,
B, C, D, and E, will contain 30-80 viable
cells/ml. If the procedures are standardized
as to surface area of the slant and laboratory
technic, it is possible to reproduce results on
repeated experiments with the same strain of
microorganism.
(g) Add a suspension of Enterobacter
aerogenes (IMViC type —++} of such density
that each flask will contain 30-80 cells/ml,
prepared as directed above. Cell densities
below this range result in ratios that are not
consistent, while densities above 100
cells/ml decrease sensitivity to nutrients in
the Test Water. Make an initial bacterial
count by plating triplicate 1 ml portions from
each culture flask in plate count agar. Mix
well and incubate Test A through E at 35 C
for 24+2 hours. Prepare final plate counts
from each flask, using dilutions of 1, 0.1,
0.01, 0.001, and 0.0001 ml.
5.3.8 Calculations
(a) For growth-inhibiting substances:
colony count/ml Flask B
Ratio =
colony count/ml Flask A
A ratio of 0.8 to 1.2 (inclusive) shows no
toxic substances; a ratio of less than 0.8
shows growth-inhibiting substances in the
water sample.
(b) For nitrogen and carbon sources that
promote growth:
Ratio =
colony count/ml Flask C
colony count/ml Flask A
(c) For nitrogen sources that promote
growth:
Ratio =
colony count/ml Flask D
colony count/ml Flask A
(d) For carbon sources that promote
bacterial growth:
Ratio =
colony count/ml Flask E
colony count/ml Flask A
{e) Do not calculate ratios b, c, or d when
ratio a indicates a toxic reaction. Ratios b, c,
or d, in excess of 1.2 indicate an available
source for bacterial growth.
5.3.9 Interpretation of Results
(a) The colony count from Flask A after
20-24 hours at 35 C, will depend on the
number of organisms initially planted in
Flask A and on the strain of E. aerogenes
used in the test procedures. This is the
reason the control. Flask A, must be run for
each individual series of tests. However, for
a given strain of E. aerogenes under identical
environmental conditions, the terminal count
202
©EPA MICROBIOLOGICAL MANUAL 1978
image:
(c) Perform a Standard Plate Count on
prepared reagents. Control Water, and Test
Water as a check on contamination.
(d) On the day before performing the
distilled-water suitability test, inoculate a
strain of E. aerogenes onto a nutrient agar
slant. Streak the entire agar surface to
develop a continuous-growth film and
incubate 18-24 hours at 35 C. To harvest
viable cells, pipet 1-2 ml sterile dilution water
from a 99 ml water blank onto the 18-24
hour culture. Emulsify the growth on the
slant by gently rubbing the bacterial film
with the pipet, being careful not to tear the
agar; then pipet the suspension back into the
original 99 ml water blank.
(a) Make a 1:100 dilution of the original
bottle into a second water blank, a further
1:100 dilution of the second bottle into a
third water blank, then 10 ml of the third
bottle into a fourth water blank, shaking
vigorously after each transfer. Pipet 1.0 ml of
the fourth dilution (1:10"8} into each of Flasks
A, B, C, D, and E. This procedure should
result in a final dilution of the organisms to
a range of 30-80 viable cells from each ml
of test solution.
(f) Variations among strains of the same
organism, different organisms, media, and
surface area of agar slopes will possibly
necessitate adjustment of the dilution pro-
cedure in order to arrive at a specific density
range between 30 and 80 viable cells. To
establish the growth range numerically for a
specific organism and medium, make a series
of plate counts from the third dilution to
determine the bacterial density. Then choose
the proper volume from this third dilution,
which, when diluted by the 30 mi in Flasks A,
B, C, D, and E, will contain 30-80 viable
cells/ml. If the procedures are standardized
as to surface area of the slant and laboratory
technic, it is possible to reproduce results on
repeated experiments with the same strain of
microorganism.
(g) Add a suspension of Enterobacter
aerogenes (IMViC type —++} of such density
that each flask will contain 30-80 cells/ml,
prepared as directed above. Cell densities
below this range result in ratios that are not
consistent, while densities above 100
cells/ml decrease sensitivity to nutrients in
the Test Water. Make an initial bacterial
count by plating triplicate 1 ml portions from
each culture flask in plate count agar. Mix
well and incubate Test A through E at 35 C
for 24+2 hours. Prepare final plate counts
from each flask, using dilutions of 1, 0.1,
0.01, 0.001, and 0.0001 ml.
5.3.8 Calculations
(a) For growth-inhibiting substances:
colony count/ml Flask B
Ratio =
colony count/ml Flask A
A ratio of 0.8 to 1.2 (inclusive) shows no
toxic substances; a ratio of less than 0.8
shows growth-inhibiting substances in the
water sample.
(b) For nitrogen and carbon sources that
promote growth:
Ratio =
colony count/ml Flask C
colony count/ml Flask A
(c) For nitrogen sources that promote
growth:
Ratio =
colony count/ml Flask D
colony count/ml Flask A
(d) For carbon sources that promote
bacterial growth:
Ratio =
colony count/ml Flask E
colony count/ml Flask A
{e) Do not calculate ratios b, c, or d when
ratio a indicates a toxic reaction. Ratios b, c,
or d, in excess of 1.2 indicate an available
source for bacterial growth.
5.3.9 Interpretation of Results
(a) The colony count from Flask A after
20-24 hours at 35 C, will depend on the
number of organisms initially planted in
Flask A and on the strain of E. aerogenes
used in the test procedures. This is the
reason the control. Flask A, must be run for
each individual series of tests. However, for
a given strain of E. aerogenes under identical
environmental conditions, the terminal count
202
©EPA MICROBIOLOGICAL MANUAL 1978
image:
 should be reasonably constant when the
initial plant is the same. The difference between
30 and 80 cells in the initial plant in Flask A
will produce a three-fold difference in the final
counts, providing the growth rate remains
constant. Thus, it is essential that the initial
colony counts on Flask A and Flask B be approx-
imately equal to secure accurate data.
(b) When the ratio exceeds 1.2, it may be
assumed that growth-stimulating substances
are present. However, this procedure is ex-
tremely sensitive and ratios up to 3.0 would
have little significance in actual practice.
Therefore, when the ratio is between 1.2 and
3.0, Tests C, D, and E do not appear to be
necessary except in special circumstances.
(c) Usually Flask C will be very low and
Flasks D and E will have a ratio of less than 1.2
when the ratio of Flask B to Flask A is between
0.8 and 1.2. The limiting factors of growth in
Flask A are the nitrogen and organic carbon
present. An extremely large amount of
ammonia nitrogen with no organic carbon
could increase the ratio in Flask D above 1.2, or
the absence of nitrogen with high carbon con-
centration could give ratios above 1.2 in Flask E,
with a B:A ratio between 0.8 and 1.2.
(d) A ratio below 0.8 indicates that the
water contains toxic substances, and this ratio
includes all allowable tolerances. As indicated
in the preceding paragraph, the ratio could go
as high as 3.0 from 1.2 without any undesirable
consequences.
5.4 Use Tests for Media, Membranes and
Laboratory Pure Water
The Use Test, a pragmatic approach to
evaluation of materials and supplies, uses the
routine methods of analysis to compare current
and new batches or lots. Such tests operate
on the theory that if a stimulatory or toxic effect
cannot be demonstrated in actual test use,
there is no effect.
When a new shipment or lot of culture
medium, membrane filters or a new source of
laboratory pure water is to be used, or at annual
testing period for water, conduct comparison
tests of the current lot in use (reference lot)
against the new lot (test lot) as follows:
5.4.1 Use a single batch of pure water,
glassware, membrane filters, or other needed
materials as specified to control all other vari-
ables except the one under study.
5.4.2 Use the reference lot and the test lot,
to conduct parallel pour plate or MF plate count
tests on five natural or treated water samples
according to standard procedures in this
Manual.
When comparing sources of pure water,
conduct the tests in parallel using the reference
water and test water separately for all water
purposes in the tests (dilution, rinse, media
preparation).
5.4.3 After incubation, compare the
bacterial colonies from the two lots for size
and appearance. If the colonies on the test lot
are atypical or noticeably smaller than colonies
on the reference lot plates, record the evidence
of inhibition or other problem, regardless of
ctiunt differences.
5.4.4 Count plates and calculate the indi-
vidual counts per ml or per 100 ml, as required
for final reporting values.
5.4.5 Transform the final reporting values
to logarithms.
5.4.6 Compile the log-transformed results
for the two lots in parallel columns and calculate
the + or - difference, d, between the two trans-
formed results for each sample.
5.4.7 Calculate the mean, d, and the
standard deviation sd of these differences.
5.4.8 Calculate the Student's t statistic,
using the number of samples as n:
t =
Sd/i/fT
5.4.9 Use the critical value, 2,78, selected
from a Student's t table at the .05 significance
level for five samples (4 degrees of freedom), for
comparison against the calculated value.
5.4.10 If the calculated t value does not
exceed 2.78, the lots do not produce signifi-
QA/LABORATORY OPERATIONS
203
image:
should be reasonably constant when the
initial plant is the same. The difference between
30 and 80 cells in the initial plant in Flask A
will produce a three-fold difference in the final
counts, providing the growth rate remains
constant. Thus, it is essential that the initial
colony counts on Flask A and Flask B be approx-
imately equal to secure accurate data.
(b) When the ratio exceeds 1.2, it may be
assumed that growth-stimulating substances
are present. However, this procedure is ex-
tremely sensitive and ratios up to 3.0 would
have little significance in actual practice.
Therefore, when the ratio is between 1.2 and
3.0, Tests C, D, and E do not appear to be
necessary except in special circumstances.
(c) Usually Flask C will be very low and
Flasks D and E will have a ratio of less than 1.2
when the ratio of Flask B to Flask A is between
0.8 and 1.2. The limiting factors of growth in
Flask A are the nitrogen and organic carbon
present. An extremely large amount of
ammonia nitrogen with no organic carbon
could increase the ratio in Flask D above 1.2, or
the absence of nitrogen with high carbon con-
centration could give ratios above 1.2 in Flask E,
with a B:A ratio between 0.8 and 1.2.
(d) A ratio below 0.8 indicates that the
water contains toxic substances, and this ratio
includes all allowable tolerances. As indicated
in the preceding paragraph, the ratio could go
as high as 3.0 from 1.2 without any undesirable
consequences.
5.4 Use Tests for Media, Membranes and
Laboratory Pure Water
The Use Test, a pragmatic approach to
evaluation of materials and supplies, uses the
routine methods of analysis to compare current
and new batches or lots. Such tests operate
on the theory that if a stimulatory or toxic effect
cannot be demonstrated in actual test use,
there is no effect.
When a new shipment or lot of culture
medium, membrane filters or a new source of
laboratory pure water is to be used, or at annual
testing period for water, conduct comparison
tests of the current lot in use (reference lot)
against the new lot (test lot) as follows:
5.4.1 Use a single batch of pure water,
glassware, membrane filters, or other needed
materials as specified to control all other vari-
ables except the one under study.
5.4.2 Use the reference lot and the test lot,
to conduct parallel pour plate or MF plate count
tests on five natural or treated water samples
according to standard procedures in this
Manual.
When comparing sources of pure water,
conduct the tests in parallel using the reference
water and test water separately for all water
purposes in the tests (dilution, rinse, media
preparation).
5.4.3 After incubation, compare the
bacterial colonies from the two lots for size
and appearance. If the colonies on the test lot
are atypical or noticeably smaller than colonies
on the reference lot plates, record the evidence
of inhibition or other problem, regardless of
ctiunt differences.
5.4.4 Count plates and calculate the indi-
vidual counts per ml or per 100 ml, as required
for final reporting values.
5.4.5 Transform the final reporting values
to logarithms.
5.4.6 Compile the log-transformed results
for the two lots in parallel columns and calculate
the + or - difference, d, between the two trans-
formed results for each sample.
5.4.7 Calculate the mean, d, and the
standard deviation sd of these differences.
5.4.8 Calculate the Student's t statistic,
using the number of samples as n:
t =
Sd/i/fT
5.4.9 Use the critical value, 2,78, selected
from a Student's t table at the .05 significance
level for five samples (4 degrees of freedom), for
comparison against the calculated value.
5.4.10 If the calculated t value does not
exceed 2.78, the lots do not produce signifi-
QA/LABORATORY OPERATIONS
203
image:
 cantly different results and the test lot is
acceptable.
5.4,11 if the calculated t value exceeds
2.78, the lots produce significantly different
results. If the test lot results exceed reference
lot results, the test lot is more stimulatory. If the
test lot results are less than the reference lot,
the test lot is less stimulatory.
5,4.12 If condition 5.4.3 or 5.4.11 occurs,
review test conditions, rerun the test and/or
obtain different lots for testing and use.
5.5 Reagents in General: The quality of
test reagents must be assured. They must be
correctly prepared and properly stored. The
following general rules should be followed:
5.5.1 Use ACS or AR grade chemicals that
meet ACS specifications for preparing reagents.
Impurities in uncertified or lesser grades of
chemicals may inhibit bacterial growth, provide
nutrients or fail to produce the desired reaction.
5.5.2 Date chemicals and reagents when
received and when opened for use.
5.5.3 make reagents up to volume in volu-
metric flasks. For storage, transfer to good
quality plastic (polyethylene, polypropylene or
tetrafluoroethylene) or borosilicate glass bot-
tles with polyethylene or other inert plastic
stoppers or caps.
5.5.4 Identify prepared reagents with the
generic name, the concentration, the date pre-
pared and the initials of preparer.
5.5,5 Store reagents under the conditions
recommended by the manufacturer.
5.5.6 Run positive and negative controls
with each series of cultural or biochemical
tests.
5.6 Serological Reagents
5.6.1 Evaluate serological antisera against
known antigens and compare with antisera that
have demonstrated acceptable reactivity. The
quality of commercial serological reagents is
subject to methodology changes and new
knowledge in manufacturing processes. Con-
tinuity of reagent quality depends on com-
pliance of each new reagent with minimum
specifications.
5.6.2 Repeat quality control procedures
each time that reagent batches are prepared,
regardless of the expiration date given by the
manufacturer.
5.6.3 Discard sera or antigens if contami-
nation is discovered.
5.6.4 Select another working dilution if the
level of activity has dropped.
5.7 Fluorescent Antibody Reagents
Highly specific reagents, antigens of high
purity and very specific potent antibodies are
required for fluorescent antibody techniques.
The antisera must exhibit high staining intensi-
ties. Some sera may have high titers in one type
of serological test, but demonstrate poor
staining titer and vice versa.
5.7.1 Store desiccated fluorescent anti-
body (FA) reagents at 4 C, Prepare aliquots of
the rehydrated conjugate in screw-cap glass
vials, freeze and store at -20 C until working
dilutions are prepared.
5.7.2 Test FA reagents for correct reactions
with positive and negative controls before each
use. Results of positive controls should be
within one dilution of the average titer.
5.8 Dyes/Stains: Organic chemicals are
used as selective agents (e.g., brilliant green in
brilliant green lactose bile broth), as indicators
in bacteriological media (phenol red lactose),
and as bacteriological stains (gram stain). Dyes
from any commercial supplier vary from lot to
lot in percent dye, dye complex, insolubles and
inert materials present. Because dyes for micro-
biological uses must be of proper strength and
stability to produce the correct reactions, pur-
chase only dyes which have been certified by
the Biological Stain Commission for biological
use.
5.8.1 Fluorescent Dyes: An important fac-
tor in the preparation of antisera-dye conju-
204
MICROBIOLOGICAL MANUAL 1978
image:
cantly different results and the test lot is
acceptable.
5.4,11 if the calculated t value exceeds
2.78, the lots produce significantly different
results. If the test lot results exceed reference
lot results, the test lot is more stimulatory. If the
test lot results are less than the reference lot,
the test lot is less stimulatory.
5,4.12 If condition 5.4.3 or 5.4.11 occurs,
review test conditions, rerun the test and/or
obtain different lots for testing and use.
5.5 Reagents in General: The quality of
test reagents must be assured. They must be
correctly prepared and properly stored. The
following general rules should be followed:
5.5.1 Use ACS or AR grade chemicals that
meet ACS specifications for preparing reagents.
Impurities in uncertified or lesser grades of
chemicals may inhibit bacterial growth, provide
nutrients or fail to produce the desired reaction.
5.5.2 Date chemicals and reagents when
received and when opened for use.
5.5.3 make reagents up to volume in volu-
metric flasks. For storage, transfer to good
quality plastic (polyethylene, polypropylene or
tetrafluoroethylene) or borosilicate glass bot-
tles with polyethylene or other inert plastic
stoppers or caps.
5.5.4 Identify prepared reagents with the
generic name, the concentration, the date pre-
pared and the initials of preparer.
5.5,5 Store reagents under the conditions
recommended by the manufacturer.
5.5.6 Run positive and negative controls
with each series of cultural or biochemical
tests.
5.6 Serological Reagents
5.6.1 Evaluate serological antisera against
known antigens and compare with antisera that
have demonstrated acceptable reactivity. The
quality of commercial serological reagents is
subject to methodology changes and new
knowledge in manufacturing processes. Con-
tinuity of reagent quality depends on com-
pliance of each new reagent with minimum
specifications.
5.6.2 Repeat quality control procedures
each time that reagent batches are prepared,
regardless of the expiration date given by the
manufacturer.
5.6.3 Discard sera or antigens if contami-
nation is discovered.
5.6.4 Select another working dilution if the
level of activity has dropped.
5.7 Fluorescent Antibody Reagents
Highly specific reagents, antigens of high
purity and very specific potent antibodies are
required for fluorescent antibody techniques.
The antisera must exhibit high staining intensi-
ties. Some sera may have high titers in one type
of serological test, but demonstrate poor
staining titer and vice versa.
5.7.1 Store desiccated fluorescent anti-
body (FA) reagents at 4 C, Prepare aliquots of
the rehydrated conjugate in screw-cap glass
vials, freeze and store at -20 C until working
dilutions are prepared.
5.7.2 Test FA reagents for correct reactions
with positive and negative controls before each
use. Results of positive controls should be
within one dilution of the average titer.
5.8 Dyes/Stains: Organic chemicals are
used as selective agents (e.g., brilliant green in
brilliant green lactose bile broth), as indicators
in bacteriological media (phenol red lactose),
and as bacteriological stains (gram stain). Dyes
from any commercial supplier vary from lot to
lot in percent dye, dye complex, insolubles and
inert materials present. Because dyes for micro-
biological uses must be of proper strength and
stability to produce the correct reactions, pur-
chase only dyes which have been certified by
the Biological Stain Commission for biological
use.
5.8.1 Fluorescent Dyes: An important fac-
tor in the preparation of antisera-dye conju-
204
MICROBIOLOGICAL MANUAL 1978
image:
 gates is the purity of the fluorescein dye.
Infrared studies reveal that the purity of fluor-
escein isothiocyanate (FITC) commonly used
in FA tests, ranges from 30 to 100% in com-
mercial products. Ideally 100% pure FITC
preparations are used. Dyes of less purity may
be satisfactory if the weight used to label the
protein component of the serum allows for the
impurities, and if the impurities do not increase
non-specific staining.
5.8,2 Check bacteriological stains before
use with at least one positive and one negative
control culture.
6. Membrane Filters
6.1 Government Specifications
6.1.1 The quality and performance of
membrane filters vary with the manufacturer,
type, brand, lot number and storage conditions.
Membranes considered for purchase by federal
agencies must conform to the government
specifications published in 1974 Military
Specifications (4). The detailed specifications
required of the manufacturer by the federal
government are an important advantage to
other users of membrane filters because by
meeting federal requirements, manufacturers
realize it is most efficient to make all mem-
branes to these specifications. Hence, mem-
brane filters purchased from companies selling
to federal agencies meet the federal specifi-
cations.
6.1.2 The specifications list requirements
for pore size, porosity, flow rate, diffusibility,
autoclavability, sterility, diameter, thickness,
bacterial retention and bacterial cultivation.
The gridlines must be easily visible, permanent
and not imprinted into the surface so as to
cause channelling of growth. The grid ink must
not stimulate or inhibit growth.
6.1.3 The pads must have a specified di-
ameter and thickness, limited acidity, no
waxes, sulfites, and other stimulating or inhib-
itive materials, and must absorb uniformly a
specified volume of medium.
6.2 Manufacturer's Quality Assurance
6.2.1 Some manufacturers certify that
their membranes meet stated specifications
on sterility, retention, recovery, pore size, flow
rate, pH, total acidity, phosphate and other
extractables.
6.2.2 Most manufacturers sell sterile
membranes and those packaged for steriliza-
tion by the user. Membranes may be sterilized
by autoclaving, ethylene oxide or irradiation.
6.3 User's Quality Assurance
6.3.1 In addition to the quality assurance
provided by the manufacturer, the user should
determine that the membranes perform satis-
factorily by inspecting and testing each lot he
orders. The membranes should not be mis-
shapen or the gridlines distorted after
autoclaving.
6.3.2 A membrane should allow good dif-
fusibility of medium and be completely wetted
within 15 seconds after it is placed on the
medium substrate with no dry areas indicated
by colorless or lighter-colored areas.
6.3.3 After incubation, the colonies
should be of the expected size, with defined
shape and clearly delineated edges. The color
and morphology of the colonies must be typi-
cal of those defined by the test procedure.
6.3.4 The analyst should observe that the
gridline ink does not "bleed" across the sur-
face, or restrict colony development on or ad-
jacent to the cross-hatching. Colonies should
be evenly distributed across the membrane
surface. Membranes containing sizable areas
with no colony development are questionable.
6.4 ASTM Test Procedures
Because of variable recoveries of micro-
organisms on different membrane filters, there
is a critical need for standard procedures for
evaluating membrane filters. Procedures are
being developed by Committee D-19.08.04 of
ASTM for physical, chemical and microbiologi-
cal characteristics of membrane filters. The
procedures are intended for the larger labora-
tory and the manufacturer to test new batches
QA/LABORATORY OPERATIONS
205
image:
gates is the purity of the fluorescein dye.
Infrared studies reveal that the purity of fluor-
escein isothiocyanate (FITC) commonly used
in FA tests, ranges from 30 to 100% in com-
mercial products. Ideally 100% pure FITC
preparations are used. Dyes of less purity may
be satisfactory if the weight used to label the
protein component of the serum allows for the
impurities, and if the impurities do not increase
non-specific staining.
5.8,2 Check bacteriological stains before
use with at least one positive and one negative
control culture.
6. Membrane Filters
6.1 Government Specifications
6.1.1 The quality and performance of
membrane filters vary with the manufacturer,
type, brand, lot number and storage conditions.
Membranes considered for purchase by federal
agencies must conform to the government
specifications published in 1974 Military
Specifications (4). The detailed specifications
required of the manufacturer by the federal
government are an important advantage to
other users of membrane filters because by
meeting federal requirements, manufacturers
realize it is most efficient to make all mem-
branes to these specifications. Hence, mem-
brane filters purchased from companies selling
to federal agencies meet the federal specifi-
cations.
6.1.2 The specifications list requirements
for pore size, porosity, flow rate, diffusibility,
autoclavability, sterility, diameter, thickness,
bacterial retention and bacterial cultivation.
The gridlines must be easily visible, permanent
and not imprinted into the surface so as to
cause channelling of growth. The grid ink must
not stimulate or inhibit growth.
6.1.3 The pads must have a specified di-
ameter and thickness, limited acidity, no
waxes, sulfites, and other stimulating or inhib-
itive materials, and must absorb uniformly a
specified volume of medium.
6.2 Manufacturer's Quality Assurance
6.2.1 Some manufacturers certify that
their membranes meet stated specifications
on sterility, retention, recovery, pore size, flow
rate, pH, total acidity, phosphate and other
extractables.
6.2.2 Most manufacturers sell sterile
membranes and those packaged for steriliza-
tion by the user. Membranes may be sterilized
by autoclaving, ethylene oxide or irradiation.
6.3 User's Quality Assurance
6.3.1 In addition to the quality assurance
provided by the manufacturer, the user should
determine that the membranes perform satis-
factorily by inspecting and testing each lot he
orders. The membranes should not be mis-
shapen or the gridlines distorted after
autoclaving.
6.3.2 A membrane should allow good dif-
fusibility of medium and be completely wetted
within 15 seconds after it is placed on the
medium substrate with no dry areas indicated
by colorless or lighter-colored areas.
6.3.3 After incubation, the colonies
should be of the expected size, with defined
shape and clearly delineated edges. The color
and morphology of the colonies must be typi-
cal of those defined by the test procedure.
6.3.4 The analyst should observe that the
gridline ink does not "bleed" across the sur-
face, or restrict colony development on or ad-
jacent to the cross-hatching. Colonies should
be evenly distributed across the membrane
surface. Membranes containing sizable areas
with no colony development are questionable.
6.4 ASTM Test Procedures
Because of variable recoveries of micro-
organisms on different membrane filters, there
is a critical need for standard procedures for
evaluating membrane filters. Procedures are
being developed by Committee D-19.08.04 of
ASTM for physical, chemical and microbiologi-
cal characteristics of membrane filters. The
procedures are intended for the larger labora-
tory and the manufacturer to test new batches
QA/LABORATORY OPERATIONS
205
image:
 or lots of MF's. Brief descriptions of these tests
for bacterial retention, inhibitory effects, re-
covery, extractables and flow rate follow.
6.4.1 Bacterial Retention Test
The test is based on filtration of a standard
culture through a 0.45 /urn MF into a broth.
Sterile equipment and aseptic techniques must
be used. Five randomly-selected membranes
from five randomly-selected packages should
be tested. Control membranes should be taken
from the same package as the test mem-
branes.
(a) Add 140 ml of double strength Trypti-
case soy or Tryptic soy broth to a liter vacuum
flask and attach vacuum tubing. Wrap flask in
kraft paper and sterilize.
(b) Using an 18 hour broth culture of
Serratfa marcescens, prepare a final dilution in
0.1% peptone, containing 1000 cells per
100 ml.
(c) Assemble a membrane filtration appa-
ratus using a sterile vacuum flask containing
the broth. Insert the test filter, turn on vacuum
and pour in 20 ml of sterile rinse water to set
the membrane. Filter 100 ml of the culture
suspension. Rinse funnel twice with 20 ml of
peptone water.
{d) After the filtration remove funnel and
transfer the membrane filter to a Trypticase
soy or Tryptic soy agar plate. Then aseptically
remove membrane filteration base from the
flask and insert a sterile stopper. Repeat
filtrations four more times with sterile MF
assemblies, culture flasks and membranes.
(e) Incubate agar plates and flasks for 48
hours at 35 C. Examine membranes for growth
outside of filtering areas which indicates a
leaky filtration assembly that could cause a
false positive test. Turbidity in the culture flask
indicates bacterial growth and failure of the
membrane to retain the 0.2-0.3 um sized bac-
teria, but does not indicate the numbers of
organisms passing the filter.
(f) Turbidity indicates filter failure. Repeat
the test and control procedures. •
6.4.2 Inhibitory Effects: The test for inhibi-
tory effects compares membrane filter counts
on one or more test lots of membrane filters,
with spread plate counts on Plate Count Agar
using a specific pure culture of Escherichia coli
(IMViC + H ).
(a) Prepare a dilution of the stabilized 24-
hour culture in 0.1 % peptone dilution water so
that 0.2 ml contains 30-150 viable cells. Add
about 20 ml of sterile dilution water to the
funnel before filtration.
(b) Filter five replicate sample volumes of
0.2 ml through five replicate membrane filters
of each MF test lot and place each on a plate of
Tryptic soy agar.
(c) Prepare the corresponding spread
plates in random fashion to avoid a time effect,
following a randomization table.
(d) With the same pipet, deliver five addi-
tional 0.2 ml volumes to the surface of five
plates of Tryptic soy agar. The samples are
distributed evenly over the surfaces of the
plates with sterile glass rods.
(e) Incubate the membrane filters at 44.5 C
and agar plates at 35 C for 24 hours. Count the
colonies. Compare recoveries on spread plates
and membrane filters. Acceptable filters should
recover some set percentage of the spread
plate count. This percentage should be estab-
lished by each laboratory based on previous
performance by a known acceptable lot.
6.4.3 Recovery (5): The procedure for re-
covery compares the fecal coliform counts on
test membranes to the counts on spread plates
using M-FC agar substrate. Four polluted
waters and one raw sewage sample are
analyzed.
(a) To determine sample test volumes, pre-
pare serial dilutions of each sample in 0.1%
peptone water to produce a suspension con-
taining approximately 20-60 fecal coliforms
per 0.1 ml. Hold original samples at 4 C. Deter-
mine the fecal coliform density of each of the
samples or dilutions by membrane filter or
spread plate test. Read the results after 22-24
hours incubation at 44.5 -±_ 0.2 C.
206
•SEPA MICROBIOLOGICAL MANUAL 1978
image:
or lots of MF's. Brief descriptions of these tests
for bacterial retention, inhibitory effects, re-
covery, extractables and flow rate follow.
6.4.1 Bacterial Retention Test
The test is based on filtration of a standard
culture through a 0.45 /urn MF into a broth.
Sterile equipment and aseptic techniques must
be used. Five randomly-selected membranes
from five randomly-selected packages should
be tested. Control membranes should be taken
from the same package as the test mem-
branes.
(a) Add 140 ml of double strength Trypti-
case soy or Tryptic soy broth to a liter vacuum
flask and attach vacuum tubing. Wrap flask in
kraft paper and sterilize.
(b) Using an 18 hour broth culture of
Serratfa marcescens, prepare a final dilution in
0.1% peptone, containing 1000 cells per
100 ml.
(c) Assemble a membrane filtration appa-
ratus using a sterile vacuum flask containing
the broth. Insert the test filter, turn on vacuum
and pour in 20 ml of sterile rinse water to set
the membrane. Filter 100 ml of the culture
suspension. Rinse funnel twice with 20 ml of
peptone water.
{d) After the filtration remove funnel and
transfer the membrane filter to a Trypticase
soy or Tryptic soy agar plate. Then aseptically
remove membrane filteration base from the
flask and insert a sterile stopper. Repeat
filtrations four more times with sterile MF
assemblies, culture flasks and membranes.
(e) Incubate agar plates and flasks for 48
hours at 35 C. Examine membranes for growth
outside of filtering areas which indicates a
leaky filtration assembly that could cause a
false positive test. Turbidity in the culture flask
indicates bacterial growth and failure of the
membrane to retain the 0.2-0.3 um sized bac-
teria, but does not indicate the numbers of
organisms passing the filter.
(f) Turbidity indicates filter failure. Repeat
the test and control procedures. •
6.4.2 Inhibitory Effects: The test for inhibi-
tory effects compares membrane filter counts
on one or more test lots of membrane filters,
with spread plate counts on Plate Count Agar
using a specific pure culture of Escherichia coli
(IMViC + H ).
(a) Prepare a dilution of the stabilized 24-
hour culture in 0.1 % peptone dilution water so
that 0.2 ml contains 30-150 viable cells. Add
about 20 ml of sterile dilution water to the
funnel before filtration.
(b) Filter five replicate sample volumes of
0.2 ml through five replicate membrane filters
of each MF test lot and place each on a plate of
Tryptic soy agar.
(c) Prepare the corresponding spread
plates in random fashion to avoid a time effect,
following a randomization table.
(d) With the same pipet, deliver five addi-
tional 0.2 ml volumes to the surface of five
plates of Tryptic soy agar. The samples are
distributed evenly over the surfaces of the
plates with sterile glass rods.
(e) Incubate the membrane filters at 44.5 C
and agar plates at 35 C for 24 hours. Count the
colonies. Compare recoveries on spread plates
and membrane filters. Acceptable filters should
recover some set percentage of the spread
plate count. This percentage should be estab-
lished by each laboratory based on previous
performance by a known acceptable lot.
6.4.3 Recovery (5): The procedure for re-
covery compares the fecal coliform counts on
test membranes to the counts on spread plates
using M-FC agar substrate. Four polluted
waters and one raw sewage sample are
analyzed.
(a) To determine sample test volumes, pre-
pare serial dilutions of each sample in 0.1%
peptone water to produce a suspension con-
taining approximately 20-60 fecal coliforms
per 0.1 ml. Hold original samples at 4 C. Deter-
mine the fecal coliform density of each of the
samples or dilutions by membrane filter or
spread plate test. Read the results after 22-24
hours incubation at 44.5 -±_ 0.2 C.
206
•SEPA MICROBIOLOGICAL MANUAL 1978
image:
 (b) If the fecal coliform density in the raw
water samples is less than 10 per 0.1 ml, seed
the sample with raw sewage, allow to stabilize
at 4 C for 24 hours and test as in (a). Then
proceed with the standard test procedure.
(c) Use the optimum dilutions from (a) or (b)
for the test membranes and the spread plate
controls.
(d) Perform the membrane filter tests ac-
cording to the procedure described in Part II-C,
3 of This Manual.
(e) Prior to beginning the spread plate
tests,air drythesurfaceof the M-FC agar con-
tained in 100 ml petri dishes. Aseptically de-
liver 0.1 ml of the selected sample dilution to
the agar surface and spread with a sterile bent
glass rod. Allow the sample aliquot to be com-
pletely absorbed before inverting the dish.
(f) Alternate MF tests with spread plate
controls to randomize systematic errors.
(g) Insert petri dishes into waterproof bags
or seal with waterproof tape, and submerge in
the waterbath incubator. Incubate for 22-24
hours at 44.5 + 0.2 C. Record the temperature
continuously during the incubation period. Af-
ter incubation, remove plates and examine.
(h) Count the blue colonies. If more than
one dilution was prepared, select the plates
with between 10 and 100 colonies, but prefer-
ably with 20-60 colonies. Calculate the arith-
metic mean of the five replicate fecal coliform
counts and the five replicate spread plates.
Determine percent recovery:
or suspected to have a high concentration of
pseudomonads or aeromonads, perform the
cytochrome oxidase test. As in the verification
procedure, a minimum negative oxidase test
confirmation of 80% should be achieved for
the membranes to be considered acceptable.
6.4.4 Extractables
(a) Total Extractables
(1) Dry filters for 15 minutes at 70 C then
bring to room temperature in a desiccator.
Weigh to constant weight on a four-place ana-
lytical balance.
(2) Boil filters in 100 ml of distilled water
for 20 minutes. Remove the filters and dry at
70 C for 60 minutes. Bring filters to room
temperature in a desiccator and reweigh to
constant weight. Weighings shall be to the
nearest 0.1 milligram.
Original Weight - Weight After Extraction
Original Weight
X 100 =
Percent
Extractables
(b) Specific Extractables
(1) Immerse filter in ASTM Type 1 reagent
grade water for 24 hours (6).
(2) Remove filter and assay the extract for
metals, total organics, phosphorus and
ammonia.
MF X Count
Spread Plate X Count
X 100 =
Recovery
(i) Verification: Pick 20 blue colonies from
each of 2 randomly-selected filters and 2
spread plates. If plates contain less than 20
colonies, pick all blue colonies. Verify the colo-
nies in EC media as described in Part III-C, 4 of
This Manual. To be' acceptable, 80% of the
colonies must verify. If the samples are known
6.4.5 fjow .Rate
Water flow rate shall be determined by
timing the passage of 500 ml of particle-free
distilled water through a filter at 25 C and at a
differential pressure of 70 centimeters of mer-
cury. Particle-free water for this test is produced
by passage of a high purity water through a
0.2 /im membrane filter, three times in succes-
sion, at 25C and at a differential pressure of
177 cm of mercury.
QA/LABORATORY OPERATIONS
207
image:
(b) If the fecal coliform density in the raw
water samples is less than 10 per 0.1 ml, seed
the sample with raw sewage, allow to stabilize
at 4 C for 24 hours and test as in (a). Then
proceed with the standard test procedure.
(c) Use the optimum dilutions from (a) or (b)
for the test membranes and the spread plate
controls.
(d) Perform the membrane filter tests ac-
cording to the procedure described in Part II-C,
3 of This Manual.
(e) Prior to beginning the spread plate
tests,air drythesurfaceof the M-FC agar con-
tained in 100 ml petri dishes. Aseptically de-
liver 0.1 ml of the selected sample dilution to
the agar surface and spread with a sterile bent
glass rod. Allow the sample aliquot to be com-
pletely absorbed before inverting the dish.
(f) Alternate MF tests with spread plate
controls to randomize systematic errors.
(g) Insert petri dishes into waterproof bags
or seal with waterproof tape, and submerge in
the waterbath incubator. Incubate for 22-24
hours at 44.5 + 0.2 C. Record the temperature
continuously during the incubation period. Af-
ter incubation, remove plates and examine.
(h) Count the blue colonies. If more than
one dilution was prepared, select the plates
with between 10 and 100 colonies, but prefer-
ably with 20-60 colonies. Calculate the arith-
metic mean of the five replicate fecal coliform
counts and the five replicate spread plates.
Determine percent recovery:
or suspected to have a high concentration of
pseudomonads or aeromonads, perform the
cytochrome oxidase test. As in the verification
procedure, a minimum negative oxidase test
confirmation of 80% should be achieved for
the membranes to be considered acceptable.
6.4.4 Extractables
(a) Total Extractables
(1) Dry filters for 15 minutes at 70 C then
bring to room temperature in a desiccator.
Weigh to constant weight on a four-place ana-
lytical balance.
(2) Boil filters in 100 ml of distilled water
for 20 minutes. Remove the filters and dry at
70 C for 60 minutes. Bring filters to room
temperature in a desiccator and reweigh to
constant weight. Weighings shall be to the
nearest 0.1 milligram.
Original Weight - Weight After Extraction
Original Weight
X 100 =
Percent
Extractables
(b) Specific Extractables
(1) Immerse filter in ASTM Type 1 reagent
grade water for 24 hours (6).
(2) Remove filter and assay the extract for
metals, total organics, phosphorus and
ammonia.
MF X Count
Spread Plate X Count
X 100 =
Recovery
(i) Verification: Pick 20 blue colonies from
each of 2 randomly-selected filters and 2
spread plates. If plates contain less than 20
colonies, pick all blue colonies. Verify the colo-
nies in EC media as described in Part III-C, 4 of
This Manual. To be' acceptable, 80% of the
colonies must verify. If the samples are known
6.4.5 fjow .Rate
Water flow rate shall be determined by
timing the passage of 500 ml of particle-free
distilled water through a filter at 25 C and at a
differential pressure of 70 centimeters of mer-
cury. Particle-free water for this test is produced
by passage of a high purity water through a
0.2 /im membrane filter, three times in succes-
sion, at 25C and at a differential pressure of
177 cm of mercury.
QA/LABORATORY OPERATIONS
207
image:
 60
The flow rate =
X 500 ml
EFA cm2
2
•= ml/min/cm
Where: t = experimental time in minutes for
filtering 500 ml of particle-free dis-
tilled water
and
EFA - effective filtering area of a 47 mm diam-
eter filter
An average flow rate reported by manufac-
turers for 0.45 jum pore size, 47 mm diameter
filters Is 65 ml/min/cm2.
7. Culture Media
Since even the best cultural procedure is
ineffectual if the medium is not prepared cor-
rectly, it is important to train personnel to use
the best materials and techniques in media
preparation, storage and application. Some
factors that must be considered follow;
7.1 Ordering Media
7.1.1 Order media in quantities to last up
to one year. Always use oldest stock first.
7.1.2 Whenever possible and practical,
order media in 1/4 pound multiples rather
than one pound bottles to insure sealed pro-
tection of the supply as long as possible. Most
deterioration nf media occurs after bottles are
opened.
7.1.3 Maintain an inventory record of me-
dia: the dates received, sizes, number of units,
etc. Review the inventory quarterly for neces-
sary reordering. Date each bottle when re-
ceived and when opened. Bottles should be
inspected for color changes, caking or other
indication of deterioration. Discard such bot-
tles and reorder.
7.2 Holding Time Limits for Media
Because of the myriad of environmental
conditions affecting media, and the unique
composition and sensitivities of different
media, it is impossible to establish universal
time limits for holding unopened bottles of
media. Therefore, a conservative and protec-
tive recommendation is to limit the storage of
unopened bottles of cultural media to two
years. This limit should insure good perfor-
mance of media with prop'er storage
conditions.
7.3 Preparation of Media
7.3.1 In high humidity areas, store opened
bottles of media in a large hinged-door desic-
cator. Open bottles as briefly as possible during
the weighing process and return to the desic-
cator immediately after use.
7.3.2 Discard opened bottles of media 6
months after initial use.
7.3.3 Weigh media to the nearest 0.1
gram on a single pan, top loader balance as
quickly as possible.
7,3.4 Keep balance out of drafts and away
from high humidity. Use a plastic shield around
the balance to protect from drafts.
7.3.5 Clean the balance and surrounding
area immediately after weighing media.
7.4 Solution of Media
7.4.1 Check cleanliness of glassware. Use
bromthymol blue indicator to spot-check pH of
glassware (5.1.2 in this Section).
7.4.2 Prepare media in a deionized or dis-
tilled water of proven quality. Ultra-pure water
from a recirculating deionization system is re-
commended. Measure volumes with the great-
est accuracy possible using the proper pipet or
graduate (Part II-B, 1.8).
Check the pH of media after solution and
after sterilization using a laboratory model pH
meter. Enter results in the QC record book.
The reading should be within 0.2 units of the
stated value. If not, discard batch and remake.
If the pH is still incorrect, use another bot-
tle or batch. pH differences indicate a prob-
lem of distilled water quality, deterioration of
208
V>EPA MICROBIOLOGICAL MANUAL 1978
image:
60
The flow rate =
X 500 ml
EFA cm2
2
•= ml/min/cm
Where: t = experimental time in minutes for
filtering 500 ml of particle-free dis-
tilled water
and
EFA - effective filtering area of a 47 mm diam-
eter filter
An average flow rate reported by manufac-
turers for 0.45 jum pore size, 47 mm diameter
filters Is 65 ml/min/cm2.
7. Culture Media
Since even the best cultural procedure is
ineffectual if the medium is not prepared cor-
rectly, it is important to train personnel to use
the best materials and techniques in media
preparation, storage and application. Some
factors that must be considered follow;
7.1 Ordering Media
7.1.1 Order media in quantities to last up
to one year. Always use oldest stock first.
7.1.2 Whenever possible and practical,
order media in 1/4 pound multiples rather
than one pound bottles to insure sealed pro-
tection of the supply as long as possible. Most
deterioration nf media occurs after bottles are
opened.
7.1.3 Maintain an inventory record of me-
dia: the dates received, sizes, number of units,
etc. Review the inventory quarterly for neces-
sary reordering. Date each bottle when re-
ceived and when opened. Bottles should be
inspected for color changes, caking or other
indication of deterioration. Discard such bot-
tles and reorder.
7.2 Holding Time Limits for Media
Because of the myriad of environmental
conditions affecting media, and the unique
composition and sensitivities of different
media, it is impossible to establish universal
time limits for holding unopened bottles of
media. Therefore, a conservative and protec-
tive recommendation is to limit the storage of
unopened bottles of cultural media to two
years. This limit should insure good perfor-
mance of media with prop'er storage
conditions.
7.3 Preparation of Media
7.3.1 In high humidity areas, store opened
bottles of media in a large hinged-door desic-
cator. Open bottles as briefly as possible during
the weighing process and return to the desic-
cator immediately after use.
7.3.2 Discard opened bottles of media 6
months after initial use.
7.3.3 Weigh media to the nearest 0.1
gram on a single pan, top loader balance as
quickly as possible.
7,3.4 Keep balance out of drafts and away
from high humidity. Use a plastic shield around
the balance to protect from drafts.
7.3.5 Clean the balance and surrounding
area immediately after weighing media.
7.4 Solution of Media
7.4.1 Check cleanliness of glassware. Use
bromthymol blue indicator to spot-check pH of
glassware (5.1.2 in this Section).
7.4.2 Prepare media in a deionized or dis-
tilled water of proven quality. Ultra-pure water
from a recirculating deionization system is re-
commended. Measure volumes with the great-
est accuracy possible using the proper pipet or
graduate (Part II-B, 1.8).
Check the pH of media after solution and
after sterilization using a laboratory model pH
meter. Enter results in the QC record book.
The reading should be within 0.2 units of the
stated value. If not, discard batch and remake.
If the pH is still incorrect, use another bot-
tle or batch. pH differences indicate a prob-
lem of distilled water quality, deterioration of
208
V>EPA MICROBIOLOGICAL MANUAL 1978
image:
 medium or improperly-prepared medium. The
problem must be identified and corrected. The
problem should be carefully documented in
the quality control record book and reported to
the manufacturer if the data indicate the me-
dium as the source of error.
7.4.3 Note in the QC record any unusual
color development, darkening, or precipitation
of media. Check the sterilization time and tem-
perature. If there is a drastic change in appear-
. ance, discard medium and remake it. If the
problem still exists, remake the batch using a
different lot of medium.
7.4.4 Containers for preparation of
batches of broth or agar should be twice the
volume of the medium being prepared.
7.4.5 Media should be stirred continu-
ously while being heated to avoid burning.
Agar media are particularly susceptible to
scorching and boilover. The only insurance
against scorching or boilover is use of a boiling
water bath for small batches of media or con-
stant attention while heating larger batches on
a hot plate or burner. A combination hot plate
and magnetic stirrer is recommended for solu-
tion of media.
7.4.6 Bottles, tubes or plates of prepared
media are identified and dated.
7.5 Sterilization by Autoclave
7.5.1 Media should be sterilized for the
minimal time specified by the manufacturer.
The amount of time required to sterilize a me-
dium in an autoclave will vary with the type
and volume of medium and the size and shape
of containers. See the table in Part II-B, 4.3
on sterilization.
7.5.2 Since the potential for damage to
media increases with increased exposure to
heat, the amount of lag time before the auto-
clave is at full pressure and temperature can
be a critical factor in whether media are dam-
aged. The danger from an extended heating
period is reduced with use of a double-walled
autoclave which allows the operator to main-
tain full pressure and temperature in the jacket
between loads. As soon as the autoclave is
loaded and closed, steam can be admitted to
the chamber and in a relatively short time, full
pressure and temperature are developed in the
chamber. The total exposure time for media
sterilized 15 minutes at 121 C should not
exceed 45 minutes.
7.5.3 Avoid overcrowding in an autoclave
which reduces its efficiency. Large volumes of
media should be preheated to reduce the lag
period before placing them in the autoclave.
7.5.4 Remove sterile media from the auto-
clave as soon as pressure is at zero.
7.5.5 Media must be discarded if contami-
nation is suspected. Reautoclaving is^ not
permitted.
7.5.6 A preventive maintenance contract
is recommended for autoclaves. It should in-
clude checks on the accuracy of pressure and
temperature gauges and recorders and opera-
bility of safety valve.
7.5.7 Check the effectiveness of steriliza-
tion weekly, using strips or ampuls of Bacillus
stearothermophilus spores. Commercial pack-
ages of these spores are available in ampuls of
growth-indicator media. Sterilization at 121 C
for 12-15 minutes will kill the spores. Incubate
the autoclaved cultures at 55-60 C and if
growth occurs, sterilization is inadequate.
7.6 Sterilization by Filtration
7.6.1 Non-autoclavable solutions can be
sterilized by membrane filtration. With careful
preparation of the sterile filtration and receiving
apparatus, passage of a solution through a
0.2 pm membrane filter will produce a sterile
solution.
7.6.2 The filtration and subsequent sterile
dispensations should be performed in a safety
cabinet or bio-hazard hood.
7.7 Gaseous Sterilization
Equipment, supplies or other solid or dry
materials which are sensitive to heat can be
QA/LABORATORY OPERATIONS
209
image:
medium or improperly-prepared medium. The
problem must be identified and corrected. The
problem should be carefully documented in
the quality control record book and reported to
the manufacturer if the data indicate the me-
dium as the source of error.
7.4.3 Note in the QC record any unusual
color development, darkening, or precipitation
of media. Check the sterilization time and tem-
perature. If there is a drastic change in appear-
. ance, discard medium and remake it. If the
problem still exists, remake the batch using a
different lot of medium.
7.4.4 Containers for preparation of
batches of broth or agar should be twice the
volume of the medium being prepared.
7.4.5 Media should be stirred continu-
ously while being heated to avoid burning.
Agar media are particularly susceptible to
scorching and boilover. The only insurance
against scorching or boilover is use of a boiling
water bath for small batches of media or con-
stant attention while heating larger batches on
a hot plate or burner. A combination hot plate
and magnetic stirrer is recommended for solu-
tion of media.
7.4.6 Bottles, tubes or plates of prepared
media are identified and dated.
7.5 Sterilization by Autoclave
7.5.1 Media should be sterilized for the
minimal time specified by the manufacturer.
The amount of time required to sterilize a me-
dium in an autoclave will vary with the type
and volume of medium and the size and shape
of containers. See the table in Part II-B, 4.3
on sterilization.
7.5.2 Since the potential for damage to
media increases with increased exposure to
heat, the amount of lag time before the auto-
clave is at full pressure and temperature can
be a critical factor in whether media are dam-
aged. The danger from an extended heating
period is reduced with use of a double-walled
autoclave which allows the operator to main-
tain full pressure and temperature in the jacket
between loads. As soon as the autoclave is
loaded and closed, steam can be admitted to
the chamber and in a relatively short time, full
pressure and temperature are developed in the
chamber. The total exposure time for media
sterilized 15 minutes at 121 C should not
exceed 45 minutes.
7.5.3 Avoid overcrowding in an autoclave
which reduces its efficiency. Large volumes of
media should be preheated to reduce the lag
period before placing them in the autoclave.
7.5.4 Remove sterile media from the auto-
clave as soon as pressure is at zero.
7.5.5 Media must be discarded if contami-
nation is suspected. Reautoclaving is^ not
permitted.
7.5.6 A preventive maintenance contract
is recommended for autoclaves. It should in-
clude checks on the accuracy of pressure and
temperature gauges and recorders and opera-
bility of safety valve.
7.5.7 Check the effectiveness of steriliza-
tion weekly, using strips or ampuls of Bacillus
stearothermophilus spores. Commercial pack-
ages of these spores are available in ampuls of
growth-indicator media. Sterilization at 121 C
for 12-15 minutes will kill the spores. Incubate
the autoclaved cultures at 55-60 C and if
growth occurs, sterilization is inadequate.
7.6 Sterilization by Filtration
7.6.1 Non-autoclavable solutions can be
sterilized by membrane filtration. With careful
preparation of the sterile filtration and receiving
apparatus, passage of a solution through a
0.2 pm membrane filter will produce a sterile
solution.
7.6.2 The filtration and subsequent sterile
dispensations should be performed in a safety
cabinet or bio-hazard hood.
7.7 Gaseous Sterilization
Equipment, supplies or other solid or dry
materials which are sensitive to heat can be
QA/LABORATORY OPERATIONS
209
image:
 sterilized by long exposure to ethylene oxide
gas (ETO) using available commercial equip-
ment. Check sterility with culture of B, subtilus
var. nfgerspores,
7.8 Use of Agars, Broths, and Enrich-
ment Media
7.8.1 Agars
{a) Agar plates to be used for streaking or
spread plates are kept open slightly for 15
minutes after pouring or after taking out of
refrigerated storage to evaporate free mois-
ture which would cause confluent growth on
streak plates.
(b) Agar plates used for MF and spread
plate work must be free of lumps, uneven
surfaces, pock marks, bubbles or foam which
prevent good contact between the agar and
the membrane or uniform growth on spread
plates.
(c) Melted agars should be held in a tem-
pering water bath at 44-46 C but no longer than
three hours. As a safety precaution against the
use of agars which are too hot and might kill
cells, place a bottle of agar in the same boiling
water or under the same autoclave conditions
as the agars to be used. After the agar is melted,
transfer agar to a tempering bath. Insert
thermometer in the agar bottle and use it to
determine when the temperature of the agars
is at approximately 44-46 C and safe for use
in pour plates.
7.8.2 Broths
(a) Handle sterile MPN fermentation tubes
of lauryl tryptose broth or brilliant green bile
broth carefully prior to use. Shaking can en-
trap air In the inner tubes and produce a false
positive. Examine fresh tubes before use and
discard any with a bubble,
(b) Reduced media such as thioglycollate
broth oxidize in storage. Before use, these
broths must be heated in boiling water for
20-30 minutes to reduce the medium.
7.8.3 Enrichments
(a) Bring the base medium to 44-46 C
before addition of a labile constituent.
(b) Warm enrichments such as blood or
serum to room temperature before adding to a
base medium.
(c) Once labile material is added to a me-
dium, prepare plates or tubes as soon as possi-
ble. Do not hold the batch medium in a water
bath for more than 10 minutes.
7.9 Storage of Media
7.9.1 The recommended time limits for
holding prepared media in the laboratory are:
MF broths in screw-cap
flasks at 4 C
MF agars in plates with
tight-fitting covers
at 4 C
Agar or broths in loose-
cap tubes, at 4 C
Agar or broths in screw-
cap tubes, tightly
closed, at 4 C
Agar plates (non-MF) with
loose-fitting covers, in
sealed plastic bags, at
4 C
Large volumes of agar
screw-cap flasks or
bottles tightly-closed,
at 4 C
in
96
hours
(Work Week)
Two
Weeks
One
Week
Three
Months
Two
Weeks
Three
Months
7.9.2 Store fermentation tube media in
the dark at room temperature or 4 C. If refriger-
ated, incubate overnight at room temperature
to detect false positive gas bubbles.
7.9.3 Since loss of moisture is a major
problem of storage, screw-capped tubes and
flasks are recommended. Prepoured agar
210
MICROBIOLOGICAL MANUAL 1978
image:
sterilized by long exposure to ethylene oxide
gas (ETO) using available commercial equip-
ment. Check sterility with culture of B, subtilus
var. nfgerspores,
7.8 Use of Agars, Broths, and Enrich-
ment Media
7.8.1 Agars
{a) Agar plates to be used for streaking or
spread plates are kept open slightly for 15
minutes after pouring or after taking out of
refrigerated storage to evaporate free mois-
ture which would cause confluent growth on
streak plates.
(b) Agar plates used for MF and spread
plate work must be free of lumps, uneven
surfaces, pock marks, bubbles or foam which
prevent good contact between the agar and
the membrane or uniform growth on spread
plates.
(c) Melted agars should be held in a tem-
pering water bath at 44-46 C but no longer than
three hours. As a safety precaution against the
use of agars which are too hot and might kill
cells, place a bottle of agar in the same boiling
water or under the same autoclave conditions
as the agars to be used. After the agar is melted,
transfer agar to a tempering bath. Insert
thermometer in the agar bottle and use it to
determine when the temperature of the agars
is at approximately 44-46 C and safe for use
in pour plates.
7.8.2 Broths
(a) Handle sterile MPN fermentation tubes
of lauryl tryptose broth or brilliant green bile
broth carefully prior to use. Shaking can en-
trap air In the inner tubes and produce a false
positive. Examine fresh tubes before use and
discard any with a bubble,
(b) Reduced media such as thioglycollate
broth oxidize in storage. Before use, these
broths must be heated in boiling water for
20-30 minutes to reduce the medium.
7.8.3 Enrichments
(a) Bring the base medium to 44-46 C
before addition of a labile constituent.
(b) Warm enrichments such as blood or
serum to room temperature before adding to a
base medium.
(c) Once labile material is added to a me-
dium, prepare plates or tubes as soon as possi-
ble. Do not hold the batch medium in a water
bath for more than 10 minutes.
7.9 Storage of Media
7.9.1 The recommended time limits for
holding prepared media in the laboratory are:
MF broths in screw-cap
flasks at 4 C
MF agars in plates with
tight-fitting covers
at 4 C
Agar or broths in loose-
cap tubes, at 4 C
Agar or broths in screw-
cap tubes, tightly
closed, at 4 C
Agar plates (non-MF) with
loose-fitting covers, in
sealed plastic bags, at
4 C
Large volumes of agar
screw-cap flasks or
bottles tightly-closed,
at 4 C
in
96
hours
(Work Week)
Two
Weeks
One
Week
Three
Months
Two
Weeks
Three
Months
7.9.2 Store fermentation tube media in
the dark at room temperature or 4 C. If refriger-
ated, incubate overnight at room temperature
to detect false positive gas bubbles.
7.9.3 Since loss of moisture is a major
problem of storage, screw-capped tubes and
flasks are recommended. Prepoured agar
210
MICROBIOLOGICAL MANUAL 1978
image:
 plates can be sealed in plastic bags to retain
moisture and refrigerated.
7.9.4 A simple check for loss of moisture
in broth tubes can be made by marking the
original level in several tubes of each batch
and then observing the loss of moisture over
time. If the estimated moisture loss exceeds
ten percent, discard the tubes of broth.
7.9.5 Protect media containing dyes from
light. If color changes are observed, discard
the medium.
7.9.6 Prepared sterile broths and agars
are available from commercial sources. Their
use may be advantageous when analyses are
done intermittently, when staff is not available
for such preparation work, or when cost of
their use can be balanced against other factors
of laboratory operation. However, purchase of
prepared media does not reduce the responsi-
bility of the laboratory for checking the perfor-
mance of the media, regardless of the stated
quality control practices of the manufacturer.
7.10 Quality Control of Prepared Media
7.10.1 Maintain a book with a'complete
record of each batch of medium prepared.
Include the date, the name of the medium
and lot number, amount of medium weighed
out and volume of medium prepared, the
record of sterilization, pH measurements,
pH adjustments made, special handling or
preparation techniques, e.g., use of heat-
sensitive compounds or components, and
name of preparer.
7.10.2 Incubate five percent of each batch
of medium for 2 days at 35 C and inspect for
growth.
7.10.3 Check each batch of medium when
used by inoculating 2 tubes or plates with pure
cultures of species producing positive and
negative reactions for that medium.
7.10.4 Test new batches of differential
media by inoculating with organisms of known
fermentative or other biochemical ability. Simi-
larly, enrichment and selective media are
tested for productivity of the desired microor-
ganisms and inhibition of other microorga-
nisms. Tables IV-A-4 and IV-A-5 list a group of
organisms with the broths, agars, biochemical
tests and reactions to which they can be
applied.
7.10.5 Record sterility and positive/nega-
tive performance checks in the media prepara-
tion portion of the quality control log.
QA/LABORATORY OPERATIONS
211
image:
plates can be sealed in plastic bags to retain
moisture and refrigerated.
7.9.4 A simple check for loss of moisture
in broth tubes can be made by marking the
original level in several tubes of each batch
and then observing the loss of moisture over
time. If the estimated moisture loss exceeds
ten percent, discard the tubes of broth.
7.9.5 Protect media containing dyes from
light. If color changes are observed, discard
the medium.
7.9.6 Prepared sterile broths and agars
are available from commercial sources. Their
use may be advantageous when analyses are
done intermittently, when staff is not available
for such preparation work, or when cost of
their use can be balanced against other factors
of laboratory operation. However, purchase of
prepared media does not reduce the responsi-
bility of the laboratory for checking the perfor-
mance of the media, regardless of the stated
quality control practices of the manufacturer.
7.10 Quality Control of Prepared Media
7.10.1 Maintain a book with a'complete
record of each batch of medium prepared.
Include the date, the name of the medium
and lot number, amount of medium weighed
out and volume of medium prepared, the
record of sterilization, pH measurements,
pH adjustments made, special handling or
preparation techniques, e.g., use of heat-
sensitive compounds or components, and
name of preparer.
7.10.2 Incubate five percent of each batch
of medium for 2 days at 35 C and inspect for
growth.
7.10.3 Check each batch of medium when
used by inoculating 2 tubes or plates with pure
cultures of species producing positive and
negative reactions for that medium.
7.10.4 Test new batches of differential
media by inoculating with organisms of known
fermentative or other biochemical ability. Simi-
larly, enrichment and selective media are
tested for productivity of the desired microor-
ganisms and inhibition of other microorga-
nisms. Tables IV-A-4 and IV-A-5 list a group of
organisms with the broths, agars, biochemical
tests and reactions to which they can be
applied.
7.10.5 Record sterility and positive/nega-
tive performance checks in the media prepara-
tion portion of the quality control log.
QA/LABORATORY OPERATIONS
211
image:
 TA1LE IV-A-1
Monitoring Laboratory Equipment
Item
Monitoring Procedure
1. Balance
a. An analytical balance with a sensitivity of 1 mg or less at a
10 g load should be used for weighing 2 g or less. For larger
quantities, a balance with accuracy of 50 mg at a 150 g load
should be used,
b. Check balance monthly with a set of certified class S weights.
c. Wipe balance and weights clean after each use.
d. Protect weights from laboratory atmosphere and corrosion.
e. Contract with a qualified expert for balance maintenance on an
annual basis.
2. pH Motor
a. Compensate for temperature with each use.
b. Date standard buffer solutions when first opened and check
monthly with another pH meter. Discard the buffer solution if
the pH is more than ±0.1 pH unit from the manufacturer's
stated value or if it is contaminated with microorganisms.
c. Standardize with at least one standard buffer (pH 4.0, pH 7.0,
or pH 10.0) before each use.
d. Do not re-use buffer solution.
e. Have meters inspected at least yearly as part of a maintenance
contract.
3, Water Daionlzer
a. Monitor water for conductance daily. Monitor trace metals and
other toxic or nutritive compounds monthly. See Table IV-A-3.
b. Replace cartridges as indicated by manufacturer or as indicated
by analytical results.
c. Monitor bacterial counts at exit point of unit Replace the
cartridges when standard plate count exceeds 10,000/ml.
4. Watar Still
a. Drain and clean monthly according to instructions from the
manufacturer.
b. Drain and clean distilled water reservoir quarterly.
c. Check distilled water continuously or daily using a conductance
meter. See Table IV-A-3.
d. Conduct chemical tests on water to detect toxicity or stimulation
effect. See Table IV-A-3.
e. Conduct standard plate counts monthly on stored water and
clean out reservoir if count > 10,000/ml.
212
SEPA MICROBIOLOGICAL MANUAL 1978
image:
TA1LE IV-A-1
Monitoring Laboratory Equipment
Item
Monitoring Procedure
1. Balance
a. An analytical balance with a sensitivity of 1 mg or less at a
10 g load should be used for weighing 2 g or less. For larger
quantities, a balance with accuracy of 50 mg at a 150 g load
should be used,
b. Check balance monthly with a set of certified class S weights.
c. Wipe balance and weights clean after each use.
d. Protect weights from laboratory atmosphere and corrosion.
e. Contract with a qualified expert for balance maintenance on an
annual basis.
2. pH Motor
a. Compensate for temperature with each use.
b. Date standard buffer solutions when first opened and check
monthly with another pH meter. Discard the buffer solution if
the pH is more than ±0.1 pH unit from the manufacturer's
stated value or if it is contaminated with microorganisms.
c. Standardize with at least one standard buffer (pH 4.0, pH 7.0,
or pH 10.0) before each use.
d. Do not re-use buffer solution.
e. Have meters inspected at least yearly as part of a maintenance
contract.
3, Water Daionlzer
a. Monitor water for conductance daily. Monitor trace metals and
other toxic or nutritive compounds monthly. See Table IV-A-3.
b. Replace cartridges as indicated by manufacturer or as indicated
by analytical results.
c. Monitor bacterial counts at exit point of unit Replace the
cartridges when standard plate count exceeds 10,000/ml.
4. Watar Still
a. Drain and clean monthly according to instructions from the
manufacturer.
b. Drain and clean distilled water reservoir quarterly.
c. Check distilled water continuously or daily using a conductance
meter. See Table IV-A-3.
d. Conduct chemical tests on water to detect toxicity or stimulation
effect. See Table IV-A-3.
e. Conduct standard plate counts monthly on stored water and
clean out reservoir if count > 10,000/ml.
212
SEPA MICROBIOLOGICAL MANUAL 1978
image:
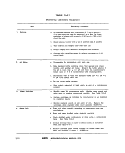 TABLE IV-A-1
(continued)
Monitoring Laboratory Equipment
Item
Monitoring Procedure
i. Dispensing Apparatus
a. Check accuracy of dispensation with an NBS class A, graduated
cylinder at the start of each volume change and periodically
throughout extended runs,
b. Lubricate moving parts according to manufacturer's instructions
or at least once per month,
c. Correct immediately any leaks, loose connections or malfunctions,
d. After dispensing each type of medium, pass a large volume of
hot distilled water through dispenser to remove traces of agar
or medium,
e. At the end of the work day, break down unit into parts, wash
well, rinse with distilled water and dry.
6. Ultraviolet
Sterilizer
a. Remove plug from outlet and clean ultraviolet lamps monthly by
wiping with a soft cloth moistened with ethanol.
b. Test ultraviolet lamps with light meter quarterly; if they emit
less than 80% of their rated initial output, replace them.
c. Perform spread plate irradiation test quarterly, see This
Section, 4,2.1.
7. Membrane Filter
Equipment
a. Check funnel support for leaks.
b. Check funnel and funnel support to make certain they are
smooth. Discard funnel if inside surfaces are scratched.
c. Clean thoroughly after each work day.
8. Spectrophotometer
a. Maintain quality control and calibration check as recommended
by the manufacturer.
b. Have inspected yearly by a factory maintenance man.
9. Centrifuge
a. Check brushes and bearings for wear every six months.
b. Check rheostat control against a tachometer at various loadings
every six months to ensure proper gravitational fields.
QA/LABORATORY OPERATIONS
213
image:
TABLE IV-A-1
(continued)
Monitoring Laboratory Equipment
Item
Monitoring Procedure
i. Dispensing Apparatus
a. Check accuracy of dispensation with an NBS class A, graduated
cylinder at the start of each volume change and periodically
throughout extended runs,
b. Lubricate moving parts according to manufacturer's instructions
or at least once per month,
c. Correct immediately any leaks, loose connections or malfunctions,
d. After dispensing each type of medium, pass a large volume of
hot distilled water through dispenser to remove traces of agar
or medium,
e. At the end of the work day, break down unit into parts, wash
well, rinse with distilled water and dry.
6. Ultraviolet
Sterilizer
a. Remove plug from outlet and clean ultraviolet lamps monthly by
wiping with a soft cloth moistened with ethanol.
b. Test ultraviolet lamps with light meter quarterly; if they emit
less than 80% of their rated initial output, replace them.
c. Perform spread plate irradiation test quarterly, see This
Section, 4,2.1.
7. Membrane Filter
Equipment
a. Check funnel support for leaks.
b. Check funnel and funnel support to make certain they are
smooth. Discard funnel if inside surfaces are scratched.
c. Clean thoroughly after each work day.
8. Spectrophotometer
a. Maintain quality control and calibration check as recommended
by the manufacturer.
b. Have inspected yearly by a factory maintenance man.
9. Centrifuge
a. Check brushes and bearings for wear every six months.
b. Check rheostat control against a tachometer at various loadings
every six months to ensure proper gravitational fields.
QA/LABORATORY OPERATIONS
213
image:
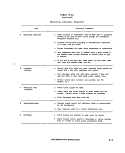 TABLE IV-A-1
(continued)
Monitoring Laboratory Equipment
Item
Monitoring Procedure
10. Microscope
a. Allow only trained technicians to use. • '
b. Appoint one laboratory worker to be responsible for the care
of the microscope.
c. Clean optics and stage after every use. Use only lens paper
for cleaning.
d. Keep covered when not in use.
e. Establish annual maintenance on contract.
f. Maintain in one location if possible.
11. Microscope,
Fluorescence
a. Allow only trained technicians to use microscope and light
source.
b. Keep a log of lamp operation time.
c. Monitor lamp with meter. See Section 4.2.2. Replace the
lamp when < 80% of original fluorescence is observed.
d. Check lamp alignment particularly if bulb has been changed.
Realign the fluorescent light source if necessary.
e.. Use known 4+ fluorescence slides as controls.
12. Safety Cabinet
(Hood)
a. Check filters monthly for plugging or obvious dirt accumulation.
Clean or replace filter as needed.
b. Check cabinet for leaks and for rate of air flow every three
months.
c. Expose blood agar plates to air flow for one hour once per
month to measure contamination.
d. Remove plug from the outlet and clean ultraviolet lamps every
two weeks by wiping with a soft cloth moistened with ethanol.
e. Test ultraviolet lamps quarterly with a light meter. If lamp
emits less then 80% of the rated output, replace lamp.
f. Perform maintenance as directed by the manufacturer.
g. Purchase and use a pressure monitor control device to measure
efficiency of air flow.
214
<&EFA MICROBIOLOGICAL MANUAL 1978
image:
TABLE IV-A-1
(continued)
Monitoring Laboratory Equipment
Item
Monitoring Procedure
10. Microscope
a. Allow only trained technicians to use. • '
b. Appoint one laboratory worker to be responsible for the care
of the microscope.
c. Clean optics and stage after every use. Use only lens paper
for cleaning.
d. Keep covered when not in use.
e. Establish annual maintenance on contract.
f. Maintain in one location if possible.
11. Microscope,
Fluorescence
a. Allow only trained technicians to use microscope and light
source.
b. Keep a log of lamp operation time.
c. Monitor lamp with meter. See Section 4.2.2. Replace the
lamp when < 80% of original fluorescence is observed.
d. Check lamp alignment particularly if bulb has been changed.
Realign the fluorescent light source if necessary.
e.. Use known 4+ fluorescence slides as controls.
12. Safety Cabinet
(Hood)
a. Check filters monthly for plugging or obvious dirt accumulation.
Clean or replace filter as needed.
b. Check cabinet for leaks and for rate of air flow every three
months.
c. Expose blood agar plates to air flow for one hour once per
month to measure contamination.
d. Remove plug from the outlet and clean ultraviolet lamps every
two weeks by wiping with a soft cloth moistened with ethanol.
e. Test ultraviolet lamps quarterly with a light meter. If lamp
emits less then 80% of the rated output, replace lamp.
f. Perform maintenance as directed by the manufacturer.
g. Purchase and use a pressure monitor control device to measure
efficiency of air flow.
214
<&EFA MICROBIOLOGICAL MANUAL 1978
image:
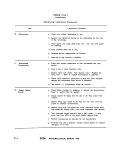 TABLE IV-A-1
(continued)
Monitoring Laboratory Equipment
Item
Monitoring Procedure
13. Thermometers and
Recording Devices
a. Check the accuracy of thermometers and temperature recording
instruments, in the monitoring range, at least annually against a
certified thermometer or one of equivalent accuracy. Thermometer
graduations should not exceed the 0.2 or 0.5 C deviation permitted
in the analytical method. Check mercury columns for breaks.
b. Record calibration checks in quality control (QC) record. Mark
NBS calibration correction on each thermometer or on the outside
of the incubator, refrigerator or freezer containing the thermometer.
c. Record daily temperature checks on charts and keep for at least
three years. A simple, one year chart is shown in Figure IV-A-1.
14. Water Bath
a. Check and record temperature daily. Bath must maintain the uniform
temperature needed for the test in use.
b. Maintain accurate thermometer completely immersed in water bath.
c. A recording thermometer and alarm system are recommended.
d. Clean monthly.
e. Use only stainless steel, rubber, plastic-coated, or other
corrosion-proof racks.
15. Refrigerator at 4 C
a. Check and record temperature daily.
b. Clean monthly.
c. Require identification and dating of all material.
d. Defrost unit and discard outdated materials in refrigerator and
freezer compartments every three months.
16. Hot Air Oven
8. Test performance with spore strips or suspensions quarterly.
b. Equip and monitor sterilization with a thermometer accurate in
160-180 C range.
17. Freezers
a. Check temperature and record daily.
b. Use of recording thermometer and alarm system recommended.
c. Require identification and dating of all materials.
d. Clean and defrost freezer every six months. Discard outdated
materials.
QA/LABORATQRY OPERATIONS
215
image:
TABLE IV-A-1
(continued)
Monitoring Laboratory Equipment
Item
Monitoring Procedure
13. Thermometers and
Recording Devices
a. Check the accuracy of thermometers and temperature recording
instruments, in the monitoring range, at least annually against a
certified thermometer or one of equivalent accuracy. Thermometer
graduations should not exceed the 0.2 or 0.5 C deviation permitted
in the analytical method. Check mercury columns for breaks.
b. Record calibration checks in quality control (QC) record. Mark
NBS calibration correction on each thermometer or on the outside
of the incubator, refrigerator or freezer containing the thermometer.
c. Record daily temperature checks on charts and keep for at least
three years. A simple, one year chart is shown in Figure IV-A-1.
14. Water Bath
a. Check and record temperature daily. Bath must maintain the uniform
temperature needed for the test in use.
b. Maintain accurate thermometer completely immersed in water bath.
c. A recording thermometer and alarm system are recommended.
d. Clean monthly.
e. Use only stainless steel, rubber, plastic-coated, or other
corrosion-proof racks.
15. Refrigerator at 4 C
a. Check and record temperature daily.
b. Clean monthly.
c. Require identification and dating of all material.
d. Defrost unit and discard outdated materials in refrigerator and
freezer compartments every three months.
16. Hot Air Oven
8. Test performance with spore strips or suspensions quarterly.
b. Equip and monitor sterilization with a thermometer accurate in
160-180 C range.
17. Freezers
a. Check temperature and record daily.
b. Use of recording thermometer and alarm system recommended.
c. Require identification and dating of all materials.
d. Clean and defrost freezer every six months. Discard outdated
materials.
QA/LABORATQRY OPERATIONS
215
image:
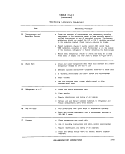 TABLE 1V-A-1
(continued)
Monitoring Laboratory Equipment
Item
Monitoring Procedure
18. Autoclave
a. Record temperature and pressure for each run. Recording
thermometer recommended.
b. Verify that autoclave maintains uniform operating temperature.
e. Check operating temperature with a min/max thermometer on a
weekly basis.
d. Test performance with spore strips or suspensions weekly. If
evidence of contamination occurs, check until the cause is
identified and eliminated.
e. Procure semi-annual preventive maintenance inspections.
19. Incubator (Air/Water-Jacket)
a. Check and record temperature daily.
b. If partially-submersible glass thermometer is used, bulb and stem
must be immersed in water to the mark on stem.
c. Measure temperatures daily on top and bottom shelves.
Periodically measure temperature on all shelves in use.
d. Expand test points proportionately for walk-in incubators,
e. Recording thermometer and alarm system are recommended.
f. Locate incubator where room temperature does not go outside
of the 16-27 C range.
216
MICROBIOLOGICAL MANUAL 1978
image:
TABLE 1V-A-1
(continued)
Monitoring Laboratory Equipment
Item
Monitoring Procedure
18. Autoclave
a. Record temperature and pressure for each run. Recording
thermometer recommended.
b. Verify that autoclave maintains uniform operating temperature.
e. Check operating temperature with a min/max thermometer on a
weekly basis.
d. Test performance with spore strips or suspensions weekly. If
evidence of contamination occurs, check until the cause is
identified and eliminated.
e. Procure semi-annual preventive maintenance inspections.
19. Incubator (Air/Water-Jacket)
a. Check and record temperature daily.
b. If partially-submersible glass thermometer is used, bulb and stem
must be immersed in water to the mark on stem.
c. Measure temperatures daily on top and bottom shelves.
Periodically measure temperature on all shelves in use.
d. Expand test points proportionately for walk-in incubators,
e. Recording thermometer and alarm system are recommended.
f. Locate incubator where room temperature does not go outside
of the 16-27 C range.
216
MICROBIOLOGICAL MANUAL 1978
image:
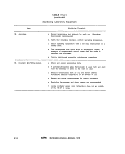 Instrument
Temperature
Room
Read daily.
Record temperature in space provided.
Date Jan. Feb.-Mar. Apr. May June Jul.Aug. Sep. Oct. Nov. Dec.Date
1
2
3
4
5
6
7
8
•9-
10
11
12
13
14
15
16
17
18
19
20
21
22
23
24
25
26
27
28
29
30
31
• 1
2
3
4
5
6
7
8
9
10
11
12
13
14
15
16
17
18
• 19- •
20
21
22
23
24
25
26
27
28
29
30
31
FIGURE IV-A-1. Equipment Operation Temperature Record.
OA/LABORATORY OPERATIONS
217
image:
Instrument
Temperature
Room
Read daily.
Record temperature in space provided.
Date Jan. Feb.-Mar. Apr. May June Jul.Aug. Sep. Oct. Nov. Dec.Date
1
2
3
4
5
6
7
8
•9-
10
11
12
13
14
15
16
17
18
19
20
21
22
23
24
25
26
27
28
29
30
31
• 1
2
3
4
5
6
7
8
9
10
11
12
13
14
15
16
17
18
• 19- •
20
21
22
23
24
25
26
27
28
29
30
31
FIGURE IV-A-1. Equipment Operation Temperature Record.
OA/LABORATORY OPERATIONS
217
image:
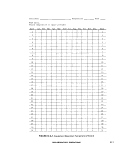 TABLE IV-A-2
Glassware Maintenance
Item
Monitoring Procedure
1, Utensils and
Containers for
Media Preparation
Use utensils and containers of non-corrosive and non-contaminating
materials such as pyrex glass, stainless, steel or
aluminum.
2. Glassware (Reusable)
a. With each use, examine glassware especially screw-capped dilution
bottles and flasks, for chipped or broken edges and etched
surfaces. Discard chipped or badly-etched glassware.
b. Inspect glassware after washing. If water beads excessively on the
cleaned surfaces, run the glassware through again.
c. Test for acid or alkaline residues by adding bromthymol blue indicator
to representative glassware items (see 5.1.2 in This Section).
d. Test for residual detergent by the test in 5.1.3, This Section.
218
MICROBIOLOGICAL MANUAL 1978
image:
TABLE IV-A-2
Glassware Maintenance
Item
Monitoring Procedure
1, Utensils and
Containers for
Media Preparation
Use utensils and containers of non-corrosive and non-contaminating
materials such as pyrex glass, stainless, steel or
aluminum.
2. Glassware (Reusable)
a. With each use, examine glassware especially screw-capped dilution
bottles and flasks, for chipped or broken edges and etched
surfaces. Discard chipped or badly-etched glassware.
b. Inspect glassware after washing. If water beads excessively on the
cleaned surfaces, run the glassware through again.
c. Test for acid or alkaline residues by adding bromthymol blue indicator
to representative glassware items (see 5.1.2 in This Section).
d. Test for residual detergent by the test in 5.1.3, This Section.
218
MICROBIOLOGICAL MANUAL 1978
image:
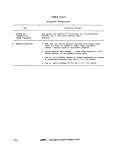 TABLE IV-A-3
Laboratory Pure Water for Bacteriological Testing
Parameter
Ideal
Monitoring
Frequency
Limit
Chemical Tests
Conductivity
PH
Total Organic
Carbon
Trace Metal, Single
Trace Metals, Total
(Od, Cr, Cu Ni, Pb, Zn)
Ammonia/Amines
Free chlorine
Continuously
or with each
use
With each use
Monthly
Monthly
Monthly
Monthly
With each use
1-2 £f mhos/cm
at 25 C
5.5-7.5
<1.0 mg/liter
<0,05 mg/liter
<1.0 mg/liter
<0.1 mg/liter
<0.1 mg/liter
Biological Tests
Standard Plate Count
Fresh Water
Stored Water
Water Suit-
ability Test
Monthly
Monthly
Yearly and when
conditions change
< 1000 bacteria/ml
< 10,000 bacteria/ml
Ratio: 0.8-3.Q
Water Use-Test
Yearly and when
conditions change
Calculated
t value
< 2.78
QA/LABORATORY OPERATIONS
219
image:
TABLE IV-A-3
Laboratory Pure Water for Bacteriological Testing
Parameter
Ideal
Monitoring
Frequency
Limit
Chemical Tests
Conductivity
PH
Total Organic
Carbon
Trace Metal, Single
Trace Metals, Total
(Od, Cr, Cu Ni, Pb, Zn)
Ammonia/Amines
Free chlorine
Continuously
or with each
use
With each use
Monthly
Monthly
Monthly
Monthly
With each use
1-2 £f mhos/cm
at 25 C
5.5-7.5
<1.0 mg/liter
<0,05 mg/liter
<1.0 mg/liter
<0.1 mg/liter
<0.1 mg/liter
Biological Tests
Standard Plate Count
Fresh Water
Stored Water
Water Suit-
ability Test
Monthly
Monthly
Yearly and when
conditions change
< 1000 bacteria/ml
< 10,000 bacteria/ml
Ratio: 0.8-3.Q
Water Use-Test
Yearly and when
conditions change
Calculated
t value
< 2.78
QA/LABORATORY OPERATIONS
219
image:
 TABLE IV-A-4
Quality Control of Media
Medium
Control Cultures
Expected Results
M-Endo MF Broth
or Agar
Escherichia coli
Enterobecter aerogenes
Achromobacter sp
Pseudomonas sp
Salmonella sp
Golden green metallic sheen
Golden green metallic sheen
Red colonies
Red colonies
Red colonies if medium overheated
M-FC Broth
or Agar
Brilliant Green Bile
Lactoie Broth
Lauryl Tryptose
Broth
E coll
K. pneumonlae
£ aerogenes
£ coli
£ aerogenes
C. freundil
Staph. aureus
£ coli
£ aerogenes
S. typhlmurlum
S. aureus
Blue colonies
Blue colonies
No growth
Growth with gas
Growth with gas
Growth with gas
No growth
Growth with gas
Growth with gas
Marked to complete inhibition
Marked to complete inhibition
Levlne's Eosln
Methylana Blua Agar
£ coli
£ aerogenes
C. freundli
Salmonella sp
Klebsiella sp
Nucleated black colonies with
golden green metallic sheen
Pink colonies with dark centers
Colorless colonies
Colorless colonies
Large brown mucoid colonies
Xylose Lysine
Deioxycholata Agar
(XLD)
Salmonella sp
Klebsiella sp
£ coli
£ aerogenes
Red colonies, to red with black centers
Yellow colonies
Yellow colonies
Yellow colonies
Bismuth Sulfito Agar
Salm. typhosa
Other Salmonella sp
Coliforms
Black colony with black or brownish-
black zone, with or without sheen
Raised green colonies
Green colonies
Brilliant Green Agar
Salmonella sp
£. coli
P. vulgarls
Pink-white opaque colonies surrounded
by brilliant red zone
Inhibition or yellow green colonies
Marked to complete inhibition or red
colonies
220
4»EF¥V MICROBIOLOGICAL MANUAL 1978
image:
TABLE IV-A-4
Quality Control of Media
Medium
Control Cultures
Expected Results
M-Endo MF Broth
or Agar
Escherichia coli
Enterobecter aerogenes
Achromobacter sp
Pseudomonas sp
Salmonella sp
Golden green metallic sheen
Golden green metallic sheen
Red colonies
Red colonies
Red colonies if medium overheated
M-FC Broth
or Agar
Brilliant Green Bile
Lactoie Broth
Lauryl Tryptose
Broth
E coll
K. pneumonlae
£ aerogenes
£ coli
£ aerogenes
C. freundil
Staph. aureus
£ coli
£ aerogenes
S. typhlmurlum
S. aureus
Blue colonies
Blue colonies
No growth
Growth with gas
Growth with gas
Growth with gas
No growth
Growth with gas
Growth with gas
Marked to complete inhibition
Marked to complete inhibition
Levlne's Eosln
Methylana Blua Agar
£ coli
£ aerogenes
C. freundli
Salmonella sp
Klebsiella sp
Nucleated black colonies with
golden green metallic sheen
Pink colonies with dark centers
Colorless colonies
Colorless colonies
Large brown mucoid colonies
Xylose Lysine
Deioxycholata Agar
(XLD)
Salmonella sp
Klebsiella sp
£ coli
£ aerogenes
Red colonies, to red with black centers
Yellow colonies
Yellow colonies
Yellow colonies
Bismuth Sulfito Agar
Salm. typhosa
Other Salmonella sp
Coliforms
Black colony with black or brownish-
black zone, with or without sheen
Raised green colonies
Green colonies
Brilliant Green Agar
Salmonella sp
£. coli
P. vulgarls
Pink-white opaque colonies surrounded
by brilliant red zone
Inhibition or yellow green colonies
Marked to complete inhibition or red
colonies
220
4»EF¥V MICROBIOLOGICAL MANUAL 1978
image:
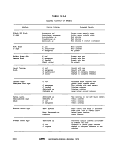 TABLE IV-A-4
(continued)
Quality Control of Media
Medium Control Cultures Expected Results
KF Streptococcus Agar Strep, faecalis Pink to red colonies
Strep, pyogones No growth
S. auraus No growth
£ coll No growth
PSE Agar S. faecalis Black colonies
£ coll No growth
S. auraus No growth
QA/LABORATORY OPERATIONS 221
image:
TABLE IV-A-4
(continued)
Quality Control of Media
Medium Control Cultures Expected Results
KF Streptococcus Agar Strep, faecalis Pink to red colonies
Strep, pyogones No growth
S. auraus No growth
£ coll No growth
PSE Agar S. faecalis Black colonies
£ coll No growth
S. auraus No growth
QA/LABORATORY OPERATIONS 221
image:
 TABLE IV-A-5
Quality Control of Biochemical Tests
Test
BH1 Broth at pH 9,6
BHI Broth with 6.5%
NaC1
Arginlne Dehydrolase
(Monitor's medium)
Lysino Decarboxylase
(Mooltar's medium}
Ornlthlne Docarbox-
ytase (Moollar's
medium}
Indolo Production
(Tryptophana Broth)
Methyl Red (Buffered
Peptone Glucose Broth)
Voges-Proskauer
(Buffered Peptone
Glucose Broth)
Citrate Utilization
(Simmons Citrate Broth)
Urease Production
(Christansen's Urea
Ag«r)
Catalase
(BHI agar slant)
Control Culture
Strep, faecalis
Strep, mltis-salivarius
S. faecalis
S. mitis-salivarius
Salm. typhlmurium
Satm. flexneri
S. typhlmurium
S. flexneri
S. typhimurium
S. flexneri
Escherichia coti
Salmonella sp
Enterobacter aorogenas
E coli
£. aerogenes
£ aaroganes
£ col/
£ aeroganes
E. coli
Proteus mirabilis
Salmonella sp
S. aureus
S. faecalis
Positive:
Negative:
Positive:
Negative:
Positive:
Negative:
Positive:
Negative:
Positive:
Negative:
Positive:
Negative:
Negative:
Positive:
Negative:
Positive:
Negative:
Positive:
Negative:
Positive:
Negative:
Positive:
Negative:
Expected Results
growth
no growth
growth
no growth
alkaline reaction
reddish violet color
yellow color
alkaline reaction
reddish violet color
acid, yellow reaction
alkaline reaction
reddish violet color
yellow color
red color
orange/yellow color
orange/yellow color
red color
no change
pink color
no color change
growth, change to
blue color
no color change,
no growth
color change, pink
to red
no color change
bubbles
no bubbles
222
MICROBIOLOGICAL MANUAL 1978
image:
TABLE IV-A-5
Quality Control of Biochemical Tests
Test
BH1 Broth at pH 9,6
BHI Broth with 6.5%
NaC1
Arginlne Dehydrolase
(Monitor's medium)
Lysino Decarboxylase
(Mooltar's medium}
Ornlthlne Docarbox-
ytase (Moollar's
medium}
Indolo Production
(Tryptophana Broth)
Methyl Red (Buffered
Peptone Glucose Broth)
Voges-Proskauer
(Buffered Peptone
Glucose Broth)
Citrate Utilization
(Simmons Citrate Broth)
Urease Production
(Christansen's Urea
Ag«r)
Catalase
(BHI agar slant)
Control Culture
Strep, faecalis
Strep, mltis-salivarius
S. faecalis
S. mitis-salivarius
Salm. typhlmurium
Satm. flexneri
S. typhlmurium
S. flexneri
S. typhimurium
S. flexneri
Escherichia coti
Salmonella sp
Enterobacter aorogenas
E coli
£. aerogenes
£ aaroganes
£ col/
£ aeroganes
E. coli
Proteus mirabilis
Salmonella sp
S. aureus
S. faecalis
Positive:
Negative:
Positive:
Negative:
Positive:
Negative:
Positive:
Negative:
Positive:
Negative:
Positive:
Negative:
Negative:
Positive:
Negative:
Positive:
Negative:
Positive:
Negative:
Positive:
Negative:
Positive:
Negative:
Expected Results
growth
no growth
growth
no growth
alkaline reaction
reddish violet color
yellow color
alkaline reaction
reddish violet color
acid, yellow reaction
alkaline reaction
reddish violet color
yellow color
red color
orange/yellow color
orange/yellow color
red color
no change
pink color
no color change
growth, change to
blue color
no color change,
no growth
color change, pink
to red
no color change
bubbles
no bubbles
222
MICROBIOLOGICAL MANUAL 1978
image:
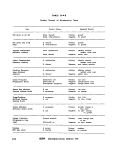 TABLE IV-A-5
(continued)
Quality Control of Biochemical Tests
Test
Control Culture
Expected Results
Cytochrome Oxidase
(Alpha-napthol and para-
amlno-dimethylaniline
oxalate)
Phenylalanine
Oeaminase
(Pfienylalanine Agar)
Malonate Utilization
(Malonate Broth)
Milk, Methytene
Blue, 0.1%
Nitrate Reduction
(Potassium Nitrate
Broth)
2, 3, 5-Triphenyl
Tftrajzotium Chloride
In TG Agar
Tel I u rite Agar
Beta-Hemolysis
in Blood Agar
Hydrogen Sulfide
(Triple Sugar
Iron Agar)
Pseudomonas aeruginosa
£ coli"
S. aureus
P. mirabilis
Salmonella sp
£ coli
K. pneumoniae
£ coli
S, faecalis
Group Q Streptococci
Strep, salivarius
P, aeruginosa
C. perfringens >
£ coli
P, aeruginosa
S. faecalis
Strep, faecium
S. faecalis
S. faecium
S. faecalis
var. zymogenes
S. faecalis
•£. coli
P. vulgaris
S. typhimurium
Positive: blue color
Negative: no change
Negative: no change
Positive: green color
Negative: no color change
Negative: no color change
' Positive: blue color change
Negative: no growth or color
change
Positive: reduction of
methylene blue
Negative: no growth
Negative: no growth
Peptonization and digestion
Acid, coagulation and gas
Positive: red color change
Negative: no color change
Positive: reduction of TTC
(red color)
Negative: no color change
Growth
No growth
Positive: lysis of red blood cells
Negative: no lysis of red blood cells
Slant Butt H2S Production
A A G
A A G +
K A G +
QA/IABORATORY OPERATIONS
223
image:
TABLE IV-A-5
(continued)
Quality Control of Biochemical Tests
Test
Control Culture
Expected Results
Cytochrome Oxidase
(Alpha-napthol and para-
amlno-dimethylaniline
oxalate)
Phenylalanine
Oeaminase
(Pfienylalanine Agar)
Malonate Utilization
(Malonate Broth)
Milk, Methytene
Blue, 0.1%
Nitrate Reduction
(Potassium Nitrate
Broth)
2, 3, 5-Triphenyl
Tftrajzotium Chloride
In TG Agar
Tel I u rite Agar
Beta-Hemolysis
in Blood Agar
Hydrogen Sulfide
(Triple Sugar
Iron Agar)
Pseudomonas aeruginosa
£ coli"
S. aureus
P. mirabilis
Salmonella sp
£ coli
K. pneumoniae
£ coli
S, faecalis
Group Q Streptococci
Strep, salivarius
P, aeruginosa
C. perfringens >
£ coli
P, aeruginosa
S. faecalis
Strep, faecium
S. faecalis
S. faecium
S. faecalis
var. zymogenes
S. faecalis
•£. coli
P. vulgaris
S. typhimurium
Positive: blue color
Negative: no change
Negative: no change
Positive: green color
Negative: no color change
Negative: no color change
' Positive: blue color change
Negative: no growth or color
change
Positive: reduction of
methylene blue
Negative: no growth
Negative: no growth
Peptonization and digestion
Acid, coagulation and gas
Positive: red color change
Negative: no color change
Positive: reduction of TTC
(red color)
Negative: no color change
Growth
No growth
Positive: lysis of red blood cells
Negative: no lysis of red blood cells
Slant Butt H2S Production
A A G
A A G +
K A G +
QA/IABORATORY OPERATIONS
223
image:
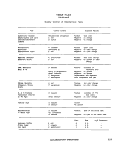 TABLE IV-A-5
(continued)
Quality Control of Biochemical Tests
Test
Lyilna
(Lytino Iron Agar)
Golatin Liquefaction
ot 20 C
(Nutrient Gelatin)
Control Culture
S. typtiimurium
S. flexneri
S. marcascens
S. faecalis
var. liquefaciens
S. faecalis
C, perfringens
E coli
Expected Results
Slant
K
K
Positive:
Positive:
Negative;
Positive:
Negative:
Butt H25
K
A
liquefaction
liquefaction
no liquefaction
liquefaction
no liquefaction
> Production
•f
*~
REFERENCES
1. American Public Health Association, 1972. Standard Methods for the Examination of Dairy
Products, (13 ed.) American Public Health Association, Inc., Washington, DC. RODACfp. 192;
Swab: pp. 43-44; and Air: p. 44.
2. American Public Health Association, 1975. Standard Methods for the Examination of Water and
Wastswater (14 ed.) American Public Health Association, Inc., Washington, DC. p. 885,
3. Geldretch, E. E. and H. F. Clark, 1965. Distilled water suitability for microbiological applications.
J. Milk and Food Tech. 28:351.
4. Military specifications for Disk, Filtering, Microporous, Hydrosol Type, 47 mm diameter 100s.
MlL-D-37005 (DSA-DM) 5 September, 1973. Directorate of Medical Materiel, Defense Personnel
Supply Center, Dept. of Defense, Philadelphia, PA.
5. Tentative method for evaluating water testing membrane filters for fecal coliform recovery.
D3508-76T. 1978 Annual Book of ASTM Standards, Part 31, p. 1127.
6. Standard specification for reagent water. D1193-77. 1978 Annual Book of ASTM Standards,
Part 31, p. 20.
224
MICROBIOLOGICAL MANUAL 19f6
image:
TABLE IV-A-5
(continued)
Quality Control of Biochemical Tests
Test
Lyilna
(Lytino Iron Agar)
Golatin Liquefaction
ot 20 C
(Nutrient Gelatin)
Control Culture
S. typtiimurium
S. flexneri
S. marcascens
S. faecalis
var. liquefaciens
S. faecalis
C, perfringens
E coli
Expected Results
Slant
K
K
Positive:
Positive:
Negative;
Positive:
Negative:
Butt H25
K
A
liquefaction
liquefaction
no liquefaction
liquefaction
no liquefaction
> Production
•f
*~
REFERENCES
1. American Public Health Association, 1972. Standard Methods for the Examination of Dairy
Products, (13 ed.) American Public Health Association, Inc., Washington, DC. RODACfp. 192;
Swab: pp. 43-44; and Air: p. 44.
2. American Public Health Association, 1975. Standard Methods for the Examination of Water and
Wastswater (14 ed.) American Public Health Association, Inc., Washington, DC. p. 885,
3. Geldretch, E. E. and H. F. Clark, 1965. Distilled water suitability for microbiological applications.
J. Milk and Food Tech. 28:351.
4. Military specifications for Disk, Filtering, Microporous, Hydrosol Type, 47 mm diameter 100s.
MlL-D-37005 (DSA-DM) 5 September, 1973. Directorate of Medical Materiel, Defense Personnel
Supply Center, Dept. of Defense, Philadelphia, PA.
5. Tentative method for evaluating water testing membrane filters for fecal coliform recovery.
D3508-76T. 1978 Annual Book of ASTM Standards, Part 31, p. 1127.
6. Standard specification for reagent water. D1193-77. 1978 Annual Book of ASTM Standards,
Part 31, p. 20.
224
MICROBIOLOGICAL MANUAL 19f6
image:
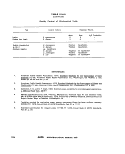 PART IV. QUALITY ASSURANCE
Section B Statistics for Microbiology
The Section is divided into five major
areas of statistical measure:
1. Measures of Central Tendency
2. Measures of Dispersion
3. Normal Distribution
4. Poisson Distribution
In this Section the computational formats
for the more commonly used measures in sta-
tistics are described. In the following discus-
sion let Xj denote a typical observed result so
that (x ^ x2,....,xn) represents a sample of n ob-
servations. A good reference bookf or further
details on these parameters is Dixon and
Massey (1).
1. Measures of Central Tendency
1.1 The Arithmetic Mean: The most com-
monly used measure of central tendency is the
arithmetic mean which is often simply called
"the mean". Denote the sample mean by X and
the population mean, of which X is an esti-
mate, by u. The computational formula is:
An example of microbiological data is shown
in Table IV-B-1.
TABLE IV-B-1
Microbiological Results, Count/100 ml
79
110
130
130
170
220
Arithmetic
Geometric
220
230
280
330
330
330
Mean, "X
Mean, Xg
Median
Mode
Standard Deviation (S)
Range
330
490
490
790
950
1100
= 372.7
= 287.8
= 305
= 330
= 293.2
= 1021
The sample mean is calculated as follows:
where . I x, = x^
4- ... Xn
X =
6709
18
= 372.7
QA/STATISTICS
225
image:
PART IV. QUALITY ASSURANCE
Section B Statistics for Microbiology
The Section is divided into five major
areas of statistical measure:
1. Measures of Central Tendency
2. Measures of Dispersion
3. Normal Distribution
4. Poisson Distribution
In this Section the computational formats
for the more commonly used measures in sta-
tistics are described. In the following discus-
sion let Xj denote a typical observed result so
that (x ^ x2,....,xn) represents a sample of n ob-
servations. A good reference bookf or further
details on these parameters is Dixon and
Massey (1).
1. Measures of Central Tendency
1.1 The Arithmetic Mean: The most com-
monly used measure of central tendency is the
arithmetic mean which is often simply called
"the mean". Denote the sample mean by X and
the population mean, of which X is an esti-
mate, by u. The computational formula is:
An example of microbiological data is shown
in Table IV-B-1.
TABLE IV-B-1
Microbiological Results, Count/100 ml
79
110
130
130
170
220
Arithmetic
Geometric
220
230
280
330
330
330
Mean, "X
Mean, Xg
Median
Mode
Standard Deviation (S)
Range
330
490
490
790
950
1100
= 372.7
= 287.8
= 305
= 330
= 293.2
= 1021
The sample mean is calculated as follows:
where . I x, = x^
4- ... Xn
X =
6709
18
= 372.7
QA/STATISTICS
225
image:
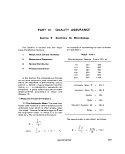 1.2 The Geometric Mean: A second mea-
sure of central tendency that is preferred for
certain distributions such as the Poisson. It will
be discussed later, in 4.3 but is defined as:
is tedious. It is relatively simple to show the
following relationship:
S =
- 1
n(n - 1)
The geometric mean of the data in Table IV-B-1
is 287.8.
1.3 The Median: Another measure of cen-
tral tendency is the median. The median is the
value such that half of the other values are
greater and half are less. To find the sample
median, the data are arranged in ascending or
descending order and the middle value is
picked. When there is an even number of ob-
servations, the average of the two middle val-
ues Is taken. For the data in Table IV-B-1, the
median is 305.
1.4 The Mode: The mode, one other mea-
sure of central tendency, is the most frequently
occurring value. In Table IV-B-1 the mode is
330, since this value occurs four times. The
population mode is the value corresponding to
the peak of the frequency distribution curve.
Frequency distributions with more than one
peak are called multimodai. In a symmetrical
frequency distribution, the mean, median, and
mode are all equal.
2. Measures of Dispersion
2.1 The Standard Deviation: Of the sev-
eral measures of dispersion, the most common
is the standard deviation. Denote the sample
standard deviation by S and the population
value by o"(of which S is an estimate), when the
computational formula is:
The derived formula is preferable because of
its adaptability to the desk calculator. The sam-
ple standard deviation of the microbiological
data in Table IV-B-1 is calculated as follows:
S =
(18) (3961541) - (6709r
_____
'71307738 - 45010681
306
' 26297057
306
= y85939 = 293.2
Confidence Limit (95% and 99%): The range
of values within which a single analysis will be
included, 95% or 99% of the time.
95% C. L =
1.96S
99% C. L = X ± 2.58S
2.2 The Variance: The sample value S2 is
referred to as the sample variance and is
merely the square of the sample standard devi-
ation. Often it is more convenient in conversa-
tion as well as computation to refer to the
variance. This should not cause confusion if
the above relationship is kept in mind.
The population variance is represented by
a2. Its formula is;
n ,
£ (X- — U)
This is the same as the formula for S
However, the computation using this formula except that the true population mean u is used
226
MICROBIOLOGICAL MANUAL 1978
image:
1.2 The Geometric Mean: A second mea-
sure of central tendency that is preferred for
certain distributions such as the Poisson. It will
be discussed later, in 4.3 but is defined as:
is tedious. It is relatively simple to show the
following relationship:
S =
- 1
n(n - 1)
The geometric mean of the data in Table IV-B-1
is 287.8.
1.3 The Median: Another measure of cen-
tral tendency is the median. The median is the
value such that half of the other values are
greater and half are less. To find the sample
median, the data are arranged in ascending or
descending order and the middle value is
picked. When there is an even number of ob-
servations, the average of the two middle val-
ues Is taken. For the data in Table IV-B-1, the
median is 305.
1.4 The Mode: The mode, one other mea-
sure of central tendency, is the most frequently
occurring value. In Table IV-B-1 the mode is
330, since this value occurs four times. The
population mode is the value corresponding to
the peak of the frequency distribution curve.
Frequency distributions with more than one
peak are called multimodai. In a symmetrical
frequency distribution, the mean, median, and
mode are all equal.
2. Measures of Dispersion
2.1 The Standard Deviation: Of the sev-
eral measures of dispersion, the most common
is the standard deviation. Denote the sample
standard deviation by S and the population
value by o"(of which S is an estimate), when the
computational formula is:
The derived formula is preferable because of
its adaptability to the desk calculator. The sam-
ple standard deviation of the microbiological
data in Table IV-B-1 is calculated as follows:
S =
(18) (3961541) - (6709r
_____
'71307738 - 45010681
306
' 26297057
306
= y85939 = 293.2
Confidence Limit (95% and 99%): The range
of values within which a single analysis will be
included, 95% or 99% of the time.
95% C. L =
1.96S
99% C. L = X ± 2.58S
2.2 The Variance: The sample value S2 is
referred to as the sample variance and is
merely the square of the sample standard devi-
ation. Often it is more convenient in conversa-
tion as well as computation to refer to the
variance. This should not cause confusion if
the above relationship is kept in mind.
The population variance is represented by
a2. Its formula is;
n ,
£ (X- — U)
This is the same as the formula for S
However, the computation using this formula except that the true population mean u is used
226
MICROBIOLOGICAL MANUAL 1978
image:
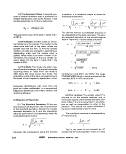 rather than its estimate X and the numerator is
divided by n instead of n - 1.
In calculating the sample variance the true
mean is not known and the estimate of the
mean from the data is used instead. Because
the sample mean is being used to calculate the
variance of the same data, only n - 1 of the
squared difference terms are independent. It
can be shown that the estimate of the variance
must be based upon the sum of independent
squared terms, thus indicating the division by
n - 1, which is called the number of degrees of
freedom (d.f.) in the sample. As a rule, in any
calculation, for every parameter that must be
estimated, one degree of freedom is lost.
2.3 The Range: The range is also used as a
measure of dispersion. It is the difference be-
tween the highest and lowest values in a set of
data.
R = max(Xj)-min{Xj)
For the data in Table IV-B-1 the range is then:
R= 1100-79= 1021
A rough estimate of S can be made by dividing
the range of the sample by the square root of n,
the numberof observations, when n.<_ 10:
R
Use of the range as a measure of dispersion is
generally limited to instances where the labor
of computing the standard deviation is
impractical.
3. The Normal Distribution
3.1 The most important theoretical distri-
bution in statistics is the familiar bell-shaped
normal distribution which is symmetric about
its peak (see Figure IV-B-1). The following as-
sumptions give rise to this distributional form:
3.1.1 Values above or below the mean are
equally likely to occur.
3.1.2 Small deviations from the mean are
extremely likely.
3.1.3 Large deviations from the mean are
extremely unlikely.
3.2 The normal distribution is completely
defined by its mean,y, and its standard devia-
tion 0 in the following manner:
3.2.1 The area under the normal curve
betweeny minus 0 and y plus 0 is 68 percent of
the total area, to the nearest 1 percent.
3.2.2 The area .under the normal curve
between y minus 20 and y plus 20 is 95 per-
cent of the area, to the nearest 1 percent.
3.2.3 The area under the normal curve
between y minus 30 and y plus 30 is 99.7
percent of the total area, to the nearest 0.1
percent.
3.3 If the frequency distribution of a sam-
ple is a good approximation to the normal
curve, these characteristics of the normal
curve can be used to develop a great deal of
information about the underlying population.
4.Non-symmetric Distribution
4.1 Asymmetry: In some investigations
one encounters distributions which are not
symmetric. For example, distributions of
bacterial counts are often characterized as
having a skewed distribution because of the
many low and a few extremely high counts. This
characteristic leads to an arithmetic mean
which is considerably larger than the median
or the geometric mean. The frequency curves of
these distributions have a long right tail, as
shown in Figure IV-8-2, and are said to display
positive skewness.
4.2 Logarithmic Transformation: For
practical and theoretical reasons, statisticians
prefer to work with symmetric distributions
like the normal curve. Therefore, it is usually
necessary to convert skewed data so that a
symmetric distribution resembling the normal
distribution results. An approximately normal
QA/STATISTICS
227
image:
rather than its estimate X and the numerator is
divided by n instead of n - 1.
In calculating the sample variance the true
mean is not known and the estimate of the
mean from the data is used instead. Because
the sample mean is being used to calculate the
variance of the same data, only n - 1 of the
squared difference terms are independent. It
can be shown that the estimate of the variance
must be based upon the sum of independent
squared terms, thus indicating the division by
n - 1, which is called the number of degrees of
freedom (d.f.) in the sample. As a rule, in any
calculation, for every parameter that must be
estimated, one degree of freedom is lost.
2.3 The Range: The range is also used as a
measure of dispersion. It is the difference be-
tween the highest and lowest values in a set of
data.
R = max(Xj)-min{Xj)
For the data in Table IV-B-1 the range is then:
R= 1100-79= 1021
A rough estimate of S can be made by dividing
the range of the sample by the square root of n,
the numberof observations, when n.<_ 10:
R
Use of the range as a measure of dispersion is
generally limited to instances where the labor
of computing the standard deviation is
impractical.
3. The Normal Distribution
3.1 The most important theoretical distri-
bution in statistics is the familiar bell-shaped
normal distribution which is symmetric about
its peak (see Figure IV-B-1). The following as-
sumptions give rise to this distributional form:
3.1.1 Values above or below the mean are
equally likely to occur.
3.1.2 Small deviations from the mean are
extremely likely.
3.1.3 Large deviations from the mean are
extremely unlikely.
3.2 The normal distribution is completely
defined by its mean,y, and its standard devia-
tion 0 in the following manner:
3.2.1 The area under the normal curve
betweeny minus 0 and y plus 0 is 68 percent of
the total area, to the nearest 1 percent.
3.2.2 The area .under the normal curve
between y minus 20 and y plus 20 is 95 per-
cent of the area, to the nearest 1 percent.
3.2.3 The area under the normal curve
between y minus 30 and y plus 30 is 99.7
percent of the total area, to the nearest 0.1
percent.
3.3 If the frequency distribution of a sam-
ple is a good approximation to the normal
curve, these characteristics of the normal
curve can be used to develop a great deal of
information about the underlying population.
4.Non-symmetric Distribution
4.1 Asymmetry: In some investigations
one encounters distributions which are not
symmetric. For example, distributions of
bacterial counts are often characterized as
having a skewed distribution because of the
many low and a few extremely high counts. This
characteristic leads to an arithmetic mean
which is considerably larger than the median
or the geometric mean. The frequency curves of
these distributions have a long right tail, as
shown in Figure IV-8-2, and are said to display
positive skewness.
4.2 Logarithmic Transformation: For
practical and theoretical reasons, statisticians
prefer to work with symmetric distributions
like the normal curve. Therefore, it is usually
necessary to convert skewed data so that a
symmetric distribution resembling the normal
distribution results. An approximately normal
QA/STATISTICS
227
image:
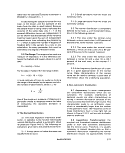 -3cr -2cr -la u +lcr +20 +3cr
QUANTITY MEASURED
FIGURE IV-B-1. Normal Distribution Curve.
228
QUANTITY MEASURED
FIGURE IV-B-2. Positively-Skewed Distribution Curve.
MICROBIOLOGICAL MANUAL 1978
image:
-3cr -2cr -la u +lcr +20 +3cr
QUANTITY MEASURED
FIGURE IV-B-1. Normal Distribution Curve.
228
QUANTITY MEASURED
FIGURE IV-B-2. Positively-Skewed Distribution Curve.
MICROBIOLOGICAL MANUAL 1978
image:
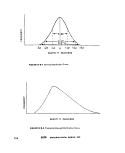 distribution can be derived from positively-
skewed distributions by expressing the original
data as logarithms. An example of conform
counts and their logarithms are shown in
Table IV-B-2, A comparison of the frequency
tables for the original data and their logs in
Tables IV-B-3 and 4, shows that the logarithms
more closely approximate a symmetric
distribution.
4.3 The Best Measure of Central Ten-
dency for Microbiological Data: Assuming
that the microbiological data has been normal-
ized through a logarithmic transformation, the
arithmetic mean is the best estimate of central
tendency. However, there is a direct relation-
ship between this mean and the geometric
mean of the original data:
= log
>y = log X
Therefore, the best measure of central tend-
ency for microbiological data is the log-
transform.
The mean of tne log MPN data in Table IV-
B-2 is:
log X =
ill'00 X"
32.737
15
= 2.1825
and the true mean of the MPN data is:
(log X) =
antilog (2.1825) = 152
REFERENCES
1. Dixon, W. J. and F. J. Massey, Jr., 1969. Introduction to Statistical Analysis, 3rd Edition, McGraw-Hill,
Inc., New York, NY.
TABLE IV-B-2
Coliform Counts and Their Logarithms
Coliform
Count/ 100 ml
MPN
11
27
36
48
80
85
120
130
138
161
317
601
760
1020
3100
log MPN
1.041
1.431
.1.556
1.681
1.903
1.929
2.080
2.114
2.134
2.207
2.501
2.779
2.881
3.009
3.491
QA/STATISTICS
229
image:
distribution can be derived from positively-
skewed distributions by expressing the original
data as logarithms. An example of conform
counts and their logarithms are shown in
Table IV-B-2, A comparison of the frequency
tables for the original data and their logs in
Tables IV-B-3 and 4, shows that the logarithms
more closely approximate a symmetric
distribution.
4.3 The Best Measure of Central Ten-
dency for Microbiological Data: Assuming
that the microbiological data has been normal-
ized through a logarithmic transformation, the
arithmetic mean is the best estimate of central
tendency. However, there is a direct relation-
ship between this mean and the geometric
mean of the original data:
= log
>y = log X
Therefore, the best measure of central tend-
ency for microbiological data is the log-
transform.
The mean of tne log MPN data in Table IV-
B-2 is:
log X =
ill'00 X"
32.737
15
= 2.1825
and the true mean of the MPN data is:
(log X) =
antilog (2.1825) = 152
REFERENCES
1. Dixon, W. J. and F. J. Massey, Jr., 1969. Introduction to Statistical Analysis, 3rd Edition, McGraw-Hill,
Inc., New York, NY.
TABLE IV-B-2
Coliform Counts and Their Logarithms
Coliform
Count/ 100 ml
MPN
11
27
36
48
80
85
120
130
138
161
317
601
760
1020
3100
log MPN
1.041
1.431
.1.556
1.681
1.903
1.929
2.080
2.114
2.134
2.207
2.501
2.779
2.881
3.009
3.491
QA/STATISTICS
229
image:
 TABLE IV-B-3
Comparison of Frequency of MPN Data
Class Interval Frequency JMPN)
0 to 400 11
400 to 800 2
800 to 1200 1
1200 to 1600 0
1600 to 2000 0
2000 to 2400 0
2400 to 2800 0
2800 to 3200 1
TABLE IV-B-4
Comparison of Frequency of Log MPN Data
Class Interval Frequency (log MPN)
1.000 to 1.300 1
1.300 to 1.600 2
1.600 to 1,900 1
1.900 to 2.200 5
2.200 to 2.500 1
2.500 to 2.800 2
2.800 to 3.100 2
3.100 to 3.400 0
3.400 to 3.700 1
230 «yERA MICROBIOLOGICAL MANUAL 1978
image:
TABLE IV-B-3
Comparison of Frequency of MPN Data
Class Interval Frequency JMPN)
0 to 400 11
400 to 800 2
800 to 1200 1
1200 to 1600 0
1600 to 2000 0
2000 to 2400 0
2400 to 2800 0
2800 to 3200 1
TABLE IV-B-4
Comparison of Frequency of Log MPN Data
Class Interval Frequency (log MPN)
1.000 to 1.300 1
1.300 to 1.600 2
1.600 to 1,900 1
1.900 to 2.200 5
2.200 to 2.500 1
2.500 to 2.800 2
2.800 to 3.100 2
3.100 to 3.400 0
3.400 to 3.700 1
230 «yERA MICROBIOLOGICAL MANUAL 1978
image:
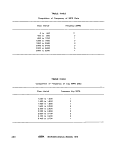 PART IV. QUALITY ASSURANCE
Section C Analytical Quality Control Procedures
The Section on Analytical Quality Control
is divided into three major areas of statistical
usage:
1. Quality Control on Routine
Analyses
2. Quality Control in Compliance
Monitoring
3. Comparative Testing of
Methodology
4. Method
Characterization
1. Quality Control on Routine Analyses
Each laboratory must establish quality
control over the microbiological analyses in
use. Fifteen percent of total analyst time
should be spent on quality control practices
discussed in this Manual,
1,1 Duplicate Analyses: Run duplicate
analyses on 10% of the known positive sam-
ples analyzed and a minimum of one per
month. The duplicates may be run as split
samples by more than one analyst.
1.2 Positive Control Samples: Test a min-
imum of one pure culture of known positive
reaction per month for each parameter tested.
1.3 Negative (Sterile) Control: Include
one negative control with each series of sam-
ples using buffered water and the medium
batch at the start of the test series and follow-
ing every tenth sample. When sterile controls
indicate contamination, data on samples af-
fected should be rejected and a request made
for immediate resampling of those waters
involved.
1.4 MF Colony Counting by More than
One Analyst: At least once per month, two or
more analysts should count the colonies on the
same membrane from a polluted water source.
Colonies on the membrane should be verified
and the analysts' counts compared to the veri-
fied count.
1.5 Check Analyses on Water Supply
Program by State Laboratories: In a local
laboratory, a minimum number of the water
supply samples should be analyzed by the
State laboratory. For example, laboratories
that are required to test less than 100 samples
per month should submit an additional 10% of
the number to the State laboratory for analysis.
Water systems with sample requirements
above 100 per month should submit an addi-
tional 2% to the State Laboratory for analysis.
1.6 Reference Sample: Laboratories
should analyze reference samples quarterly
when available for the parameters measured.
1.7 Performance Sample: Laboratories
should analyze at least one unknown perfor-
mance sample per year when available, for
parameters measured.
Q~A/'ANALYTICAL PROCEDURES
231
image:
PART IV. QUALITY ASSURANCE
Section C Analytical Quality Control Procedures
The Section on Analytical Quality Control
is divided into three major areas of statistical
usage:
1. Quality Control on Routine
Analyses
2. Quality Control in Compliance
Monitoring
3. Comparative Testing of
Methodology
4. Method
Characterization
1. Quality Control on Routine Analyses
Each laboratory must establish quality
control over the microbiological analyses in
use. Fifteen percent of total analyst time
should be spent on quality control practices
discussed in this Manual,
1,1 Duplicate Analyses: Run duplicate
analyses on 10% of the known positive sam-
ples analyzed and a minimum of one per
month. The duplicates may be run as split
samples by more than one analyst.
1.2 Positive Control Samples: Test a min-
imum of one pure culture of known positive
reaction per month for each parameter tested.
1.3 Negative (Sterile) Control: Include
one negative control with each series of sam-
ples using buffered water and the medium
batch at the start of the test series and follow-
ing every tenth sample. When sterile controls
indicate contamination, data on samples af-
fected should be rejected and a request made
for immediate resampling of those waters
involved.
1.4 MF Colony Counting by More than
One Analyst: At least once per month, two or
more analysts should count the colonies on the
same membrane from a polluted water source.
Colonies on the membrane should be verified
and the analysts' counts compared to the veri-
fied count.
1.5 Check Analyses on Water Supply
Program by State Laboratories: In a local
laboratory, a minimum number of the water
supply samples should be analyzed by the
State laboratory. For example, laboratories
that are required to test less than 100 samples
per month should submit an additional 10% of
the number to the State laboratory for analysis.
Water systems with sample requirements
above 100 per month should submit an addi-
tional 2% to the State Laboratory for analysis.
1.6 Reference Sample: Laboratories
should analyze reference samples quarterly
when available for the parameters measured.
1.7 Performance Sample: Laboratories
should analyze at least one unknown perfor-
mance sample per year when available, for
parameters measured.
Q~A/'ANALYTICAL PROCEDURES
231
image:
 1.8 MF Verification: Five percent of the
analyses performed should be verified.
1.8.1 Total Coliforms: Pick at least 10
isolated sheen colonies from each sample.
Transfer into lauryl tryptose broth. Incubate
and read. Transfer positive tubes into brilliant
green bile broth for verification of coliforms.
Since samples from public water supplies
with 5 or more sheen colonies must be verified,
at least 5 colonies are picked from each positive
potable water sample.
The laboratory should make every effort to
detect coliforms from samples with excessive
non-coliforms on the membrane filter. Any
sheen colonies appearing in mixed confluent
growth must be verified (see Part III-B).
1.8.2 Fecal Coliforms: Pick at least 10
isolated colonies containing blue to blue-green
pigment and transfer to lauryl tryptose broth.
Incubate and read. Transfer positive tubes to
EC broth where gas production verifies fecal
coliform organisms (see Part III-C).
1.8.3 Fecal Streptococci: Pick at least 10
isolated pink to red colonies from MF or pour
plates. Transfer to BHI agar or broth. After
growth, perform catalase test. If negative (pos-
sible fecal streptococci) transfer growth to BHI
and 40% bile BHI broth tubes and incubate at
45 C and 35 C respectively. Growth at both tem-
peratures verifies fecal streptococci (see
Part lll-D).
1.9 MPN Completion of Total Coliform Test
1.9.1 For routine analyses, complete the
MPN test on five percent of the positive con-
firmed samples and a minimum of one sample
per test run.
1.9.2 For potable waters, complete the
MPN test once each quarter on 10 percent of
positive confirmed samples. If insufficient pos-
itive tubes result from potable water samples,
perform the completed test on positive source
waters.
1.10 Measurement of Analyst Precision:
If the routine work of the laboratory includes
samples from different wastewaters, surface
waters, water supplies or finished waters, the
following steps should be accomplished for
each type.
Step 1
Perform duplicate analyses on the first 15
typical samples with positive responses.
Although each set of duplicates must be
run by the same analyst, all analysts per-
forming routine analyses should contrib-
ute a share of this initial data.
Step 2
Calculate the logarithms of results. If ei-
ther of a set of duplicate results is zero,
add 1 to both values before calculating the
logarithms.
Step 3
Calculate the range (R) for each pair of
transformed duplicates and the mean (R)
of these ranges.
Step 4
Thereafter, run 10% of routine samples in
duplicate. Transform the duplicates as in
Step 2 and calculate their range. If this
range is greater than 3.27 W, analyst preci-
sion is out of control and all analytical
results since the last precision check must
be discarded. The analytical problem must
be identified and resolved before doing
further analyses (1).
Step 5
In order that the criterion used in Step 4
be kept up-to-date, periodically repeat
Steps 2 and 3 using the most recent sets
of 15 duplicate results.
232
MICROBIOLOGICAL MANUAL 1978
image:
1.8 MF Verification: Five percent of the
analyses performed should be verified.
1.8.1 Total Coliforms: Pick at least 10
isolated sheen colonies from each sample.
Transfer into lauryl tryptose broth. Incubate
and read. Transfer positive tubes into brilliant
green bile broth for verification of coliforms.
Since samples from public water supplies
with 5 or more sheen colonies must be verified,
at least 5 colonies are picked from each positive
potable water sample.
The laboratory should make every effort to
detect coliforms from samples with excessive
non-coliforms on the membrane filter. Any
sheen colonies appearing in mixed confluent
growth must be verified (see Part III-B).
1.8.2 Fecal Coliforms: Pick at least 10
isolated colonies containing blue to blue-green
pigment and transfer to lauryl tryptose broth.
Incubate and read. Transfer positive tubes to
EC broth where gas production verifies fecal
coliform organisms (see Part III-C).
1.8.3 Fecal Streptococci: Pick at least 10
isolated pink to red colonies from MF or pour
plates. Transfer to BHI agar or broth. After
growth, perform catalase test. If negative (pos-
sible fecal streptococci) transfer growth to BHI
and 40% bile BHI broth tubes and incubate at
45 C and 35 C respectively. Growth at both tem-
peratures verifies fecal streptococci (see
Part lll-D).
1.9 MPN Completion of Total Coliform Test
1.9.1 For routine analyses, complete the
MPN test on five percent of the positive con-
firmed samples and a minimum of one sample
per test run.
1.9.2 For potable waters, complete the
MPN test once each quarter on 10 percent of
positive confirmed samples. If insufficient pos-
itive tubes result from potable water samples,
perform the completed test on positive source
waters.
1.10 Measurement of Analyst Precision:
If the routine work of the laboratory includes
samples from different wastewaters, surface
waters, water supplies or finished waters, the
following steps should be accomplished for
each type.
Step 1
Perform duplicate analyses on the first 15
typical samples with positive responses.
Although each set of duplicates must be
run by the same analyst, all analysts per-
forming routine analyses should contrib-
ute a share of this initial data.
Step 2
Calculate the logarithms of results. If ei-
ther of a set of duplicate results is zero,
add 1 to both values before calculating the
logarithms.
Step 3
Calculate the range (R) for each pair of
transformed duplicates and the mean (R)
of these ranges.
Step 4
Thereafter, run 10% of routine samples in
duplicate. Transform the duplicates as in
Step 2 and calculate their range. If this
range is greater than 3.27 W, analyst preci-
sion is out of control and all analytical
results since the last precision check must
be discarded. The analytical problem must
be identified and resolved before doing
further analyses (1).
Step 5
In order that the criterion used in Step 4
be kept up-to-date, periodically repeat
Steps 2 and 3 using the most recent sets
of 15 duplicate results.
232
MICROBIOLOGICAL MANUAL 1978
image:
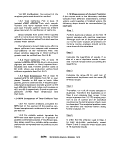 2. Quality Control in Compliance Monitoring
(National Pollution Discharge Elimination
System)
2,1 For any legal assurance of non-
compliance within a permit, analytical results
must exceed the permit limit by a statistically
significant amount. This requires allowance of
the analytical deviation known to occur at a
level equal to the permit limitation.
2.2 It is apparently common for many
monitoring agencies to judge compliance with
microbiological permit limitations based upon
one analysis each for single grab samples
taken at about the same time on 3 consecutive
days. The largest of these 3 results is then
compared to a maximum discharge limitation,
while the arithmetic mean is compared to a
daily average limitation. Judgment based
upon such a sampling program is only valid
under certain assumptions; namely that there
is no relationship between the discharge level
and the time of sampling, and that the variabil-
ity among analytical results for samples taken
simultaneously is either inconsequential or
can be properly estimated from previous data.
The first assumption is usually invalid be-
cause the discharge level is dependent upon
production or processing operations which are
not uniform, but rather follow some daily or
weekly cycle. To keep such periodic cycles
from biasing the results, the grab samples
should be taken at randomly-selected times
during the study or, if there is some knowledge
of the cycle, at times selected systematically to
define its extremes.
The second assumption is important in
order to make a compliance judgment. As
noted in 2.1, this judgment must take into
account the estimated analytical standard de-
viation at a level equal to the permit limit. If an
appropriate estimate of this standard devia-
tion is not already available then it must be
estimated during the compliance study, either
from multiple analyses of each grab sample or
from single analyses of multiple grab samples
taken simultaneously.
2.3 Whenever the analytical standard de-
viation must be estimated from the study data
the following procedure should be followed
for each major type of discharge.
Step 1
Take 3 simultaneous grab samples at each
of K (at least 3} randomly or systematically
selected sampling times which are
expected to represent the range of
discharge throughout the study period.
Step 2
. Analyze the samples and convert the re-
sults to logarithms.
Step 3
Using these logarithms, calculate the fol-
lowing statistics:
K 3
S =
X,f -
_
Xi = { I Xij)/3
j=1-
_ ' K _
X = ( Z Xj)/K
where: S = the pooled estimate of the
analytical standard deviation
Xjj = the analytical result for the jth
grab sample taken at
sampling time i,
5?i = the mean result for the 3 grab
samples taken at
sampling time \,
X = the overall mean for the K
sampling times
throughout the study
period.
QA/ANALYTICAL PROCEDURES
233
image:
2. Quality Control in Compliance Monitoring
(National Pollution Discharge Elimination
System)
2,1 For any legal assurance of non-
compliance within a permit, analytical results
must exceed the permit limit by a statistically
significant amount. This requires allowance of
the analytical deviation known to occur at a
level equal to the permit limitation.
2.2 It is apparently common for many
monitoring agencies to judge compliance with
microbiological permit limitations based upon
one analysis each for single grab samples
taken at about the same time on 3 consecutive
days. The largest of these 3 results is then
compared to a maximum discharge limitation,
while the arithmetic mean is compared to a
daily average limitation. Judgment based
upon such a sampling program is only valid
under certain assumptions; namely that there
is no relationship between the discharge level
and the time of sampling, and that the variabil-
ity among analytical results for samples taken
simultaneously is either inconsequential or
can be properly estimated from previous data.
The first assumption is usually invalid be-
cause the discharge level is dependent upon
production or processing operations which are
not uniform, but rather follow some daily or
weekly cycle. To keep such periodic cycles
from biasing the results, the grab samples
should be taken at randomly-selected times
during the study or, if there is some knowledge
of the cycle, at times selected systematically to
define its extremes.
The second assumption is important in
order to make a compliance judgment. As
noted in 2.1, this judgment must take into
account the estimated analytical standard de-
viation at a level equal to the permit limit. If an
appropriate estimate of this standard devia-
tion is not already available then it must be
estimated during the compliance study, either
from multiple analyses of each grab sample or
from single analyses of multiple grab samples
taken simultaneously.
2.3 Whenever the analytical standard de-
viation must be estimated from the study data
the following procedure should be followed
for each major type of discharge.
Step 1
Take 3 simultaneous grab samples at each
of K (at least 3} randomly or systematically
selected sampling times which are
expected to represent the range of
discharge throughout the study period.
Step 2
. Analyze the samples and convert the re-
sults to logarithms.
Step 3
Using these logarithms, calculate the fol-
lowing statistics:
K 3
S =
X,f -
_
Xi = { I Xij)/3
j=1-
_ ' K _
X = ( Z Xj)/K
where: S = the pooled estimate of the
analytical standard deviation
Xjj = the analytical result for the jth
grab sample taken at
sampling time i,
5?i = the mean result for the 3 grab
samples taken at
sampling time \,
X = the overall mean for the K
sampling times
throughout the study
period.
QA/ANALYTICAL PROCEDURES
233
image:
 Step 4
3. Comparative Testing of Methodologies
maximum discharge limitation (Dmax)
has been violated if for any sampling time
i:
Xr - t,95{2K){SA/3J > Dmax
where t gg(2K) is the Student's t value at a
95 percent confidence level and 2K de-
grees of freedom.
Step 5_
An average limitation (D) over the study
period (daily, weekly, monthly, etc.) has
been violated if:
3.1 Protocol for Testing: If a laboratory
proposes a new or modified method for accept-
ance certain minimal testing should be
completed.
3.1.1 Collect and test at least 10 samples
from each sample source or type for which the
method is intended, i.e., fresh surface water,
sewage treatment plant influent or effluent,
industrial effluents, saline water, etc. Source
waters should be chosen which are represent-
ative and which span the relevant range of
concentrations.
- t.95(2K)(SA/3T<)
2,4 If an estimate of the analytical stan-
dard deviation (S) is available that has at least
30 degrees of freedom, and if the estimate
applies to the same type of waste and was
generated from samples at a level near the
discharge limitation of the permit under study,
then Steps 1-5 can be modified as follows:
Stepl
Take one grab sample at each of K (at least
3} sampling times selected as before.
Step 2
Analyze samples and convert results to
logarithms.
Step 3
Calculate:
Step 4
Xj)/K
Dmax has been violated if Xj > Dmax + 2S
for any sampling time i.
Step 5
D has been violated if X > 15 + 2SA/IC
3.1.2 Collect the samples and perform the
analyses over 1 week of plant processing, but
not less than 5 calendar days.
3.1.3 Take an even number of aliquots (at
least 8) from each sample and simultaneously
analyze half of them using the accepted me-
thod and the other half using the proposed
alternative method. Throughout this protocol,
the analysis of aliquots from a single sample
using one method will be referred to as "repli-
cate analyses" and the resulting data will often
be referred to as "replicates."
3.2 Statistical Analyses: Compile the
data and perform the following steps for each
sample type:
Step 1: Transform the Data
Calculate the logarithms of the basic data
and use these transformed data as the
basis for all subsequent statistical
analyses.
The characteristics of microbiological
data have been discussed by many
authors. Of particular importance to this
procedure is the effect that a logarithmic
transformation has on such data (2, 3).
234
MICROBIOLOGICAL MANUAL 1978
image:
Step 4
3. Comparative Testing of Methodologies
maximum discharge limitation (Dmax)
has been violated if for any sampling time
i:
Xr - t,95{2K){SA/3J > Dmax
where t gg(2K) is the Student's t value at a
95 percent confidence level and 2K de-
grees of freedom.
Step 5_
An average limitation (D) over the study
period (daily, weekly, monthly, etc.) has
been violated if:
3.1 Protocol for Testing: If a laboratory
proposes a new or modified method for accept-
ance certain minimal testing should be
completed.
3.1.1 Collect and test at least 10 samples
from each sample source or type for which the
method is intended, i.e., fresh surface water,
sewage treatment plant influent or effluent,
industrial effluents, saline water, etc. Source
waters should be chosen which are represent-
ative and which span the relevant range of
concentrations.
- t.95(2K)(SA/3T<)
2,4 If an estimate of the analytical stan-
dard deviation (S) is available that has at least
30 degrees of freedom, and if the estimate
applies to the same type of waste and was
generated from samples at a level near the
discharge limitation of the permit under study,
then Steps 1-5 can be modified as follows:
Stepl
Take one grab sample at each of K (at least
3} sampling times selected as before.
Step 2
Analyze samples and convert results to
logarithms.
Step 3
Calculate:
Step 4
Xj)/K
Dmax has been violated if Xj > Dmax + 2S
for any sampling time i.
Step 5
D has been violated if X > 15 + 2SA/IC
3.1.2 Collect the samples and perform the
analyses over 1 week of plant processing, but
not less than 5 calendar days.
3.1.3 Take an even number of aliquots (at
least 8) from each sample and simultaneously
analyze half of them using the accepted me-
thod and the other half using the proposed
alternative method. Throughout this protocol,
the analysis of aliquots from a single sample
using one method will be referred to as "repli-
cate analyses" and the resulting data will often
be referred to as "replicates."
3.2 Statistical Analyses: Compile the
data and perform the following steps for each
sample type:
Step 1: Transform the Data
Calculate the logarithms of the basic data
and use these transformed data as the
basis for all subsequent statistical
analyses.
The characteristics of microbiological
data have been discussed by many
authors. Of particular importance to this
procedure is the effect that a logarithmic
transformation has on such data (2, 3).
234
MICROBIOLOGICAL MANUAL 1978
image:
 Specifically, a logarithmic transformation
normalizes the distribution of results from
replicate analyses of the same sample and
equalizes the within-sample standard
deviations among samples with different
microbiological densities. These
conditions are required assumptions for
many of the statistical procedures that
follow.
Step 2: Calculate the Basic Statistics
Calculate the arithmetic mean (X) and
standard deviation (S) for each set of
replicates, and tabulate the data and their
basic statistics.
Step 3: Test for Suspected Outliers
For each set of n replicates, test for outli-
ers by calculating the Extreme Studen-
tized Deviate as T = (XE - X)/S, where XE
= the maximum or minimum replicate,
whichever is farthest from X.
This is done by applying Cochran's Test (4)
as follows:
max
K = the number of samples
Sj = the standard deviation estimate from
the set
sample,
of replicates for the i
th
Smax = the largest value for Sj i =1, 2,..., K
Look up the critical C value for n-1 degrees
of freedom on each of K standard devia-
tions and a .01 significance level, i.e., C gg
(n-1, K) in Dixon and Massey (5),
If C < C gg (n-1, K), then pool the standard
deviations for the method (M) as follows:
K
Sjy. is the pooled within-sample variance
estimate for the method.
Look up the critical T value for the number
of replicates on each sample and a .01 (1
percent) significance level in Standard
D2777-72, 1975 Book of ASTM Stan-
dards, Part 31, Water, page 15. If T is
greater than the critical value, reject all
data for that sample with 99 percent conf i-
dence that XE is an outlier.
This unfortunate loss of data is necessary
because the following statistical proce-
dures have been simplified and only apply
to the unique situation where, for each of
K sample, there are exactly n replicates by
each of the two methods.
Step 4£ Test for Equality Among the
Within-Sample Standard Deviation
Estimates
For each method, test for equality of the
standard deviation estimates (S) calcu-
lated in Step 2 from the replicates for each
sample.
If C > C gg (n-1, K), then the within-sample
standard deviation of this method is not a
constant over the concentration range
represented in the data. To correct for this,
the data must be stratified, i.e., subdi-
vided, into sets of samples which have a
common standard deviation among the
results of replicate analyses by this me-
thod. Care should be taken to minimize the
number of strata to those that are required
in order to justify the development of
pooled within-sample standard deviation
estimates. If both methods require stratifi-
cation, common strata should be devel-
oped which are jointly suitable. Step 4
should be repeated to verify the proposed
stratification. Subsequently, Step 5
should be carried out for each stratum
independently. If you have any problems
with stratifying the data, please seek the
assistance of a qualified statistician/data
analyst before proceeding.
Step &_ Test for Equality of the Pooled
Within-Sample Variance Estimates
QA/ANALYTICAL PROCEDURES
235
image:
Specifically, a logarithmic transformation
normalizes the distribution of results from
replicate analyses of the same sample and
equalizes the within-sample standard
deviations among samples with different
microbiological densities. These
conditions are required assumptions for
many of the statistical procedures that
follow.
Step 2: Calculate the Basic Statistics
Calculate the arithmetic mean (X) and
standard deviation (S) for each set of
replicates, and tabulate the data and their
basic statistics.
Step 3: Test for Suspected Outliers
For each set of n replicates, test for outli-
ers by calculating the Extreme Studen-
tized Deviate as T = (XE - X)/S, where XE
= the maximum or minimum replicate,
whichever is farthest from X.
This is done by applying Cochran's Test (4)
as follows:
max
K = the number of samples
Sj = the standard deviation estimate from
the set
sample,
of replicates for the i
th
Smax = the largest value for Sj i =1, 2,..., K
Look up the critical C value for n-1 degrees
of freedom on each of K standard devia-
tions and a .01 significance level, i.e., C gg
(n-1, K) in Dixon and Massey (5),
If C < C gg (n-1, K), then pool the standard
deviations for the method (M) as follows:
K
Sjy. is the pooled within-sample variance
estimate for the method.
Look up the critical T value for the number
of replicates on each sample and a .01 (1
percent) significance level in Standard
D2777-72, 1975 Book of ASTM Stan-
dards, Part 31, Water, page 15. If T is
greater than the critical value, reject all
data for that sample with 99 percent conf i-
dence that XE is an outlier.
This unfortunate loss of data is necessary
because the following statistical proce-
dures have been simplified and only apply
to the unique situation where, for each of
K sample, there are exactly n replicates by
each of the two methods.
Step 4£ Test for Equality Among the
Within-Sample Standard Deviation
Estimates
For each method, test for equality of the
standard deviation estimates (S) calcu-
lated in Step 2 from the replicates for each
sample.
If C > C gg (n-1, K), then the within-sample
standard deviation of this method is not a
constant over the concentration range
represented in the data. To correct for this,
the data must be stratified, i.e., subdi-
vided, into sets of samples which have a
common standard deviation among the
results of replicate analyses by this me-
thod. Care should be taken to minimize the
number of strata to those that are required
in order to justify the development of
pooled within-sample standard deviation
estimates. If both methods require stratifi-
cation, common strata should be devel-
oped which are jointly suitable. Step 4
should be repeated to verify the proposed
stratification. Subsequently, Step 5
should be carried out for each stratum
independently. If you have any problems
with stratifying the data, please seek the
assistance of a qualified statistician/data
analyst before proceeding.
Step &_ Test for Equality of the Pooled
Within-Sample Variance Estimates
QA/ANALYTICAL PROCEDURES
235
image:
 Having developed a pooled within-sample
variance estimate for each method, within
common strata if necessary, test the
equality of these estimates by performing
the following Ftest:
, where
sj,
Look up the critical F value for K(n-1)
degrees of freedom for each variance and
a .05 significance level, i.e., F.g5 (K(n-1),
K(n-1)), in any standard statistical
reference. If F £ F95 (K{n-1), K(n-1)), then
the two methods produce results with
within-sample variances which are not
significantly different. If F > Fa5 (Kfn-1),
K{n-l)), then. there is a statistically
significant difference between the
variances.
Step 6£ Test for Equality of the Method
Means
Finally, calculate the difference between
the method means for each of the K sam-
ples as:
d| ** Xiuj — XM , i = 1, 2,...,K,
Using the mean (d) and standard deviation
(Sj) of these differences, calculate the Stu-
dent's statistic as:
sewage treatment effluents. Recognized prob-
lems in Method 1 include: deviation among
replicate results is considered excessive, aver-
ages show a positive bias of about 40 percent,
and the procedure is difficult and time-
consuming.
Suppose that Method 2 is quicker and
easier than Method 1. Then, if the following
statistical analysis shows the performance of
Method 2 to be at least equal to Method 1, EPA
may designate Method 2 as an alternative to
Method 1. If Method 2 offered no operational
advantage over Method 1, the statistical analy-
sis would have to show the performance of
Method 2 to be significantly superior to Me-
thod 1.
Steps 1 and 2
Transform the Data (Table IV-C-1) and Cal-
culate the Basic Statistics:
The logarithmic transformation was found
most appropriate for the data in Table IV-
C-1, see the results in Table IV-C-2.
Step 3
Test for Suspected Outliers In Table IV-C-
2.
T •—
Refer to a statistical reference for the crit-
ical Student's t value at the .05 signifi-
cance level and K-1 degrees of freedom,
i.e,t%95(K-1). Ift > t>95(K-1), then the means
for the two methods are significantly
different.
3.3 Example of the Statistical Analysis
Procedure
Statement of the Problem
Method 1 is the accepted method for de-
termining fecal coliform levels in chlorinated
Sample 2, method 2, replicate 1:
XE = 3.3711
3.3711 - 3.6773)
T =
.1738
Sample 4, method 2, replicate 1:
XE = 2.7497
[2.7497 - 2.5299I _
.1301
236
MICROBIOLOGICAL MANUAL 1978
image:
Having developed a pooled within-sample
variance estimate for each method, within
common strata if necessary, test the
equality of these estimates by performing
the following Ftest:
, where
sj,
Look up the critical F value for K(n-1)
degrees of freedom for each variance and
a .05 significance level, i.e., F.g5 (K(n-1),
K(n-1)), in any standard statistical
reference. If F £ F95 (K{n-1), K(n-1)), then
the two methods produce results with
within-sample variances which are not
significantly different. If F > Fa5 (Kfn-1),
K{n-l)), then. there is a statistically
significant difference between the
variances.
Step 6£ Test for Equality of the Method
Means
Finally, calculate the difference between
the method means for each of the K sam-
ples as:
d| ** Xiuj — XM , i = 1, 2,...,K,
Using the mean (d) and standard deviation
(Sj) of these differences, calculate the Stu-
dent's statistic as:
sewage treatment effluents. Recognized prob-
lems in Method 1 include: deviation among
replicate results is considered excessive, aver-
ages show a positive bias of about 40 percent,
and the procedure is difficult and time-
consuming.
Suppose that Method 2 is quicker and
easier than Method 1. Then, if the following
statistical analysis shows the performance of
Method 2 to be at least equal to Method 1, EPA
may designate Method 2 as an alternative to
Method 1. If Method 2 offered no operational
advantage over Method 1, the statistical analy-
sis would have to show the performance of
Method 2 to be significantly superior to Me-
thod 1.
Steps 1 and 2
Transform the Data (Table IV-C-1) and Cal-
culate the Basic Statistics:
The logarithmic transformation was found
most appropriate for the data in Table IV-
C-1, see the results in Table IV-C-2.
Step 3
Test for Suspected Outliers In Table IV-C-
2.
T •—
Refer to a statistical reference for the crit-
ical Student's t value at the .05 signifi-
cance level and K-1 degrees of freedom,
i.e,t%95(K-1). Ift > t>95(K-1), then the means
for the two methods are significantly
different.
3.3 Example of the Statistical Analysis
Procedure
Statement of the Problem
Method 1 is the accepted method for de-
termining fecal coliform levels in chlorinated
Sample 2, method 2, replicate 1:
XE = 3.3711
3.3711 - 3.6773)
T =
.1738
Sample 4, method 2, replicate 1:
XE = 2.7497
[2.7497 - 2.5299I _
.1301
236
MICROBIOLOGICAL MANUAL 1978
image:
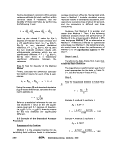 TABLE IV-C-1
Raw Sample Data from the Analysis of Chlorinated Sewage
Treatment Plant Effluents
Sample
No. Date Method
1 3/11 1
2
2 3/11 1
2
3 3/17 1
2
4 3/18 1
2
5 3/24 1
2
6 3/25 1
2
7 3/26 1
2
Replicates (XR)
in counts/ 100 ml
1850,
1200
7800,
2350,
4000,
2400,
625
562
3870,
2730,
7200,
4400,
1200,
700
1350,
, 850,
8100,
5300,
4400,
2150,
, 512,
, 350,
2330,
3930,
4400,
4000,
1000,
, 600,
1050,
650,
5900,
5650,
2650,
2050,
512,
300,
3330,
2530,
7800,
4400,
1000,
900,
1800
500,
5450
6350
3000
1600
462,
275,
3670
2200
6600
3600
1200
900,
,1150
1050
, 7150
, 5450
, 3650
, 2200
700
275
, 2530
, 1730
, 5200
, 6200
, 1600
900
2Xp Xp
7
4
34
25
17
10
2
1
15
13
31
22
6
4
,200
,250
,400
,100
,700
,400
,811
,762
,730
,120
,200
,600
,000
,000
1440
850
6880
5020
3540
2080
562
352
3146
2624
6240
4520
1200
800
SR
368
285
1163
1545
715
297
97
121
685
822
1410
996
245
141
.1
.0
.3
.8
.4
.1
.5
.1
.2
.3
.0
.0
.0
.4
QA/ANALYTICAL PROCEDURES
237
image:
TABLE IV-C-1
Raw Sample Data from the Analysis of Chlorinated Sewage
Treatment Plant Effluents
Sample
No. Date Method
1 3/11 1
2
2 3/11 1
2
3 3/17 1
2
4 3/18 1
2
5 3/24 1
2
6 3/25 1
2
7 3/26 1
2
Replicates (XR)
in counts/ 100 ml
1850,
1200
7800,
2350,
4000,
2400,
625
562
3870,
2730,
7200,
4400,
1200,
700
1350,
, 850,
8100,
5300,
4400,
2150,
, 512,
, 350,
2330,
3930,
4400,
4000,
1000,
, 600,
1050,
650,
5900,
5650,
2650,
2050,
512,
300,
3330,
2530,
7800,
4400,
1000,
900,
1800
500,
5450
6350
3000
1600
462,
275,
3670
2200
6600
3600
1200
900,
,1150
1050
, 7150
, 5450
, 3650
, 2200
700
275
, 2530
, 1730
, 5200
, 6200
, 1600
900
2Xp Xp
7
4
34
25
17
10
2
1
15
13
31
22
6
4
,200
,250
,400
,100
,700
,400
,811
,762
,730
,120
,200
,600
,000
,000
1440
850
6880
5020
3540
2080
562
352
3146
2624
6240
4520
1200
800
SR
368
285
1163
1545
715
297
97
121
685
822
1410
996
245
141
.1
.0
.3
.8
.4
.1
.5
.1
.2
.3
.0
.0
.0
.4
QA/ANALYTICAL PROCEDURES
237
image:
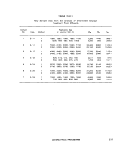 TABLE IV-C-2
Logarithmic Transformation of the Data in Table IV-C-1
Sample
No. Method
1 1
2
2 1
2
3 1
2
4 1
2
5 1
2
8 1
2
7 1
2
3
3
3
3
3
3
2
2
3
3
3
3
3
2
.2672,
.0792,
.8921,
.3711,
.6O21,
.3802,
.7959,
.7497,
.5877,
.4362,
.8573,
.6435,
.0792,
.8451,
Transformed Replicates
(X = log XR)
3.1303,
2.9294,
3.9085,
3.7243,
3.6435,
3.3324,
2.7093,
2,5441,
3.3674,
3.5944,
3.6435,
3.6021,
3.0000,
2.7782,
3
2
3
3
.0212,
.8129,
.7709,
.7520,
3.4232,
3.3118,
2
2
3
3
3
3
3
2
.7093,
.4771,
.5224,
.4031.
.8921,
.6435,
.0000,
.9542,
3.2553,
2.6990,
3.7364,
3.8028,
3.4771,
3.2041,
2.6646,
2.4393,
3.5647,
3.3424,
3.8195,
3.5563,
3.0792,
2.9542,
3.0607
3.0212
3.8543
3.7364
3.5623
3.3424
2.8451
2.4393
3.4031
3.2380
3.7160
3.7924
3.204 1
2.9542
15
14
19
18
17
16
13
12
17
17
18
18
15
14
EX
.7347
.5417
.1622
.3866
.7082
.5709
.7242
.6496
.4453
.0141
.9284
.2377
.3625
.4860
X
3.1469
3.9083
3.8324
3.6773
3.5416
3.3142
2.7448
2.5299
3.4891
3.4028
3.7857
3.6475
3.0725
2.8972
S
.1115
.1544
.0756
.1738
.0903
.0664
.0735
.1301
.0984
.1310
.1033
.0886
.0836
.08 16
238
MICROBIOLOGICAL MANUAL 1978
image:
TABLE IV-C-2
Logarithmic Transformation of the Data in Table IV-C-1
Sample
No. Method
1 1
2
2 1
2
3 1
2
4 1
2
5 1
2
8 1
2
7 1
2
3
3
3
3
3
3
2
2
3
3
3
3
3
2
.2672,
.0792,
.8921,
.3711,
.6O21,
.3802,
.7959,
.7497,
.5877,
.4362,
.8573,
.6435,
.0792,
.8451,
Transformed Replicates
(X = log XR)
3.1303,
2.9294,
3.9085,
3.7243,
3.6435,
3.3324,
2.7093,
2,5441,
3.3674,
3.5944,
3.6435,
3.6021,
3.0000,
2.7782,
3
2
3
3
.0212,
.8129,
.7709,
.7520,
3.4232,
3.3118,
2
2
3
3
3
3
3
2
.7093,
.4771,
.5224,
.4031.
.8921,
.6435,
.0000,
.9542,
3.2553,
2.6990,
3.7364,
3.8028,
3.4771,
3.2041,
2.6646,
2.4393,
3.5647,
3.3424,
3.8195,
3.5563,
3.0792,
2.9542,
3.0607
3.0212
3.8543
3.7364
3.5623
3.3424
2.8451
2.4393
3.4031
3.2380
3.7160
3.7924
3.204 1
2.9542
15
14
19
18
17
16
13
12
17
17
18
18
15
14
EX
.7347
.5417
.1622
.3866
.7082
.5709
.7242
.6496
.4453
.0141
.9284
.2377
.3625
.4860
X
3.1469
3.9083
3.8324
3.6773
3.5416
3.3142
2.7448
2.5299
3.4891
3.4028
3.7857
3.6475
3.0725
2.8972
S
.1115
.1544
.0756
.1738
.0903
.0664
.0735
.1301
.0984
.1310
.1033
.0886
.0836
.08 16
238
MICROBIOLOGICAL MANUAL 1978
image:
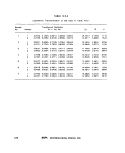 Sample 5, method 2, replicate 2;
XE = 3.5944
13.5944 - 3.40281
T = J - = 1.46
.1310
Sample 6, method 2, replicate 5:
XE = 3.7924
_ 13.7924 - 3.64751
~~ .0886 ~~
The critical T value for sets of 5 replicate
and a .01 significance level is 1.76. Since
none of the T values is greater than 1.76,
we must accept all of the suspected
values.
Step 4
Test for Equality Am.ong the Within-
Sample Standard Deviation Estimates (S)
for Each Method in Table IV-C-2:
Recall that C=
For Method 1: C = {. 115)2/.0590 = .2106
For Method 2: C = (.1738)2/.1071
= .2822
The critical Cochran statistic for 7 vari-
ances with 4 degrees of freedom each and
a .01 significance level equals .5080.
Since both the calculated C values are less
then the critical value, the within-sample
variances are equal and we can proceed to
calculated pooled variance and standard
deviation estimates for each method:
= .0084 .%
= 0153
= -0918
= 1237
Step 5
Test for Equality of the Pooled Within-
Sample Variance Estimates
= .0153/.0084 = 1.82
The critical F value at .05 significance
level, when both variance estimates have
7(4) or 28 degrees of freedom, equals
1.88. Since the critical value is not ex-
ceeded, these methods do not produce
significantly different within-sample vari-
ances. The same statement can be made
regarding within-sample standard
deviations.
Step 6
Test for Equality of the Method Means
First, for each sample, calculate the differ-
ence between the means in Table IV-C-2.
These differences (dj) are shown in Table
IV-C-3 along with their mean (3) and stan-
dard deviation (S^). Then calculate:
t = d/SdA/nj = .1765/(.0547/Vf)
= .1765/.0207 = 8.54
The critical Student's t value at a ,05 sig-
nificance level and 6 degrees of freedom
is 2.45. Since the calculated value ex-
ceeds the critical value, the methods do
produce significantly different means.
To Summarize the Results
(a) The withinTsampIe standard deviations
for these methods are not significantly differ-
ent at the .05 significance level.
(b) The mean for Method 1 is significantly
higher than the mean for Method 2 at well over
the .05 significance level.
QA/ANALYTICAL PROCEDURES
239
image:
Sample 5, method 2, replicate 2;
XE = 3.5944
13.5944 - 3.40281
T = J - = 1.46
.1310
Sample 6, method 2, replicate 5:
XE = 3.7924
_ 13.7924 - 3.64751
~~ .0886 ~~
The critical T value for sets of 5 replicate
and a .01 significance level is 1.76. Since
none of the T values is greater than 1.76,
we must accept all of the suspected
values.
Step 4
Test for Equality Am.ong the Within-
Sample Standard Deviation Estimates (S)
for Each Method in Table IV-C-2:
Recall that C=
For Method 1: C = {. 115)2/.0590 = .2106
For Method 2: C = (.1738)2/.1071
= .2822
The critical Cochran statistic for 7 vari-
ances with 4 degrees of freedom each and
a .01 significance level equals .5080.
Since both the calculated C values are less
then the critical value, the within-sample
variances are equal and we can proceed to
calculated pooled variance and standard
deviation estimates for each method:
= .0084 .%
= 0153
= -0918
= 1237
Step 5
Test for Equality of the Pooled Within-
Sample Variance Estimates
= .0153/.0084 = 1.82
The critical F value at .05 significance
level, when both variance estimates have
7(4) or 28 degrees of freedom, equals
1.88. Since the critical value is not ex-
ceeded, these methods do not produce
significantly different within-sample vari-
ances. The same statement can be made
regarding within-sample standard
deviations.
Step 6
Test for Equality of the Method Means
First, for each sample, calculate the differ-
ence between the means in Table IV-C-2.
These differences (dj) are shown in Table
IV-C-3 along with their mean (3) and stan-
dard deviation (S^). Then calculate:
t = d/SdA/nj = .1765/(.0547/Vf)
= .1765/.0207 = 8.54
The critical Student's t value at a ,05 sig-
nificance level and 6 degrees of freedom
is 2.45. Since the calculated value ex-
ceeds the critical value, the methods do
produce significantly different means.
To Summarize the Results
(a) The withinTsampIe standard deviations
for these methods are not significantly differ-
ent at the .05 significance level.
(b) The mean for Method 1 is significantly
higher than the mean for Method 2 at well over
the .05 significance level.
QA/ANALYTICAL PROCEDURES
239
image:
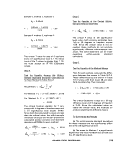 Discussion of the Results
Referring to Table 1V-C-3, it can be easily
seen that Method 1 produces the larger mean.
The difference can be calculated as:
antilog(3.3733) - antilog(3.1967)
antilog(3,1967) ,
100
100 = 50.2%
100
trary degree, for example, three orders of mag-
nitude, compared with growth and recovery on
non-selective media.
4.3 Precision is a measure of the deviation
among multiple measurements of a single
quantity. The most widely used expression of
precision is the standard deviation (a) which is
equal to the square root of the variance and
indicates the deviation of the values about the
mean.
Like accuracy, the true precision of a me-
thod must be generated in a collaborative
study among at least 15'Iaboratories.
Since Method 1 results are known to be
about 40% greater than the true value, it can
be estimated that Method 2 results are about 7
percent less than the true value. Therefore,
besides being quicker and easier. Method 2
offers comparable precision with improved ac-
curacy. Such results would qualify Method 2
for approval as an alternative to Method 1.
4. Method Characterization
The choice of a method of analysis among
several considered should be based on com-
parison of relative performance using these
measureable characteristics.
4-1 Specificity is the ability of a method to
recover the desired organisms identified by a
selective or differential characteristic and veri-
fied by additional tests. A method is judged
specific if the recovered microorganisms ver-
ify as the desired organism, and the colonies
designated as "other organisms" do not verify
as the desired organism when picked and
tested. The acceptable level of specificity for a
method cannot be set absolutely, for example
as 90%, but rather must be established for
standard procedures or for new parameters on
a best judgment basis by comparison with the
accepted methods.
4.2 Selectivity is the ability of a method to
encourage growth of the desired organism
while reducing other organisms by some arbi-
4.4 Accuracy is a measure of the close-
ness of observed values to a known true value.
The lack of available standards for comparison
of microbiological methodology has resulted
in methods with known precision, but with
limited accuracy information.
In microbiology, accuracy has been deter-
mined by applying the test method to a sus-
pension of a pure culture while independently
determining the cell number in the suspension
using a non-selective medium. Natural water
samples are tested with and without the pure
culture spike and the recovery determined by
difference. The recovery from the spiked sam-
ple is compared with the count on the non-
selective medium (assumed to be true value)
and expressed as a percent of this true value.
True accuracy of a method must be gener-
ated in a collaborative study among at least 15
laboratories using known levels of organisms.
4.5 The Section on Sanitary and Health
Effects Microbiology in the American Society
for Testing and Materials (ASTM) Committee
D-19:24 has also proposed a characteristic
called Counting Range. The Counting Range is
described as the range from the lowest num-
ber to the highest number of colonies that can
be measured on a single agar plate or mem-
brane filter, without affecting the reliability of
the method.
240
«»EPA MICROBIOLOGICAL MANUAL 1978
image:
Discussion of the Results
Referring to Table 1V-C-3, it can be easily
seen that Method 1 produces the larger mean.
The difference can be calculated as:
antilog(3.3733) - antilog(3.1967)
antilog(3,1967) ,
100
100 = 50.2%
100
trary degree, for example, three orders of mag-
nitude, compared with growth and recovery on
non-selective media.
4.3 Precision is a measure of the deviation
among multiple measurements of a single
quantity. The most widely used expression of
precision is the standard deviation (a) which is
equal to the square root of the variance and
indicates the deviation of the values about the
mean.
Like accuracy, the true precision of a me-
thod must be generated in a collaborative
study among at least 15'Iaboratories.
Since Method 1 results are known to be
about 40% greater than the true value, it can
be estimated that Method 2 results are about 7
percent less than the true value. Therefore,
besides being quicker and easier. Method 2
offers comparable precision with improved ac-
curacy. Such results would qualify Method 2
for approval as an alternative to Method 1.
4. Method Characterization
The choice of a method of analysis among
several considered should be based on com-
parison of relative performance using these
measureable characteristics.
4-1 Specificity is the ability of a method to
recover the desired organisms identified by a
selective or differential characteristic and veri-
fied by additional tests. A method is judged
specific if the recovered microorganisms ver-
ify as the desired organism, and the colonies
designated as "other organisms" do not verify
as the desired organism when picked and
tested. The acceptable level of specificity for a
method cannot be set absolutely, for example
as 90%, but rather must be established for
standard procedures or for new parameters on
a best judgment basis by comparison with the
accepted methods.
4.2 Selectivity is the ability of a method to
encourage growth of the desired organism
while reducing other organisms by some arbi-
4.4 Accuracy is a measure of the close-
ness of observed values to a known true value.
The lack of available standards for comparison
of microbiological methodology has resulted
in methods with known precision, but with
limited accuracy information.
In microbiology, accuracy has been deter-
mined by applying the test method to a sus-
pension of a pure culture while independently
determining the cell number in the suspension
using a non-selective medium. Natural water
samples are tested with and without the pure
culture spike and the recovery determined by
difference. The recovery from the spiked sam-
ple is compared with the count on the non-
selective medium (assumed to be true value)
and expressed as a percent of this true value.
True accuracy of a method must be gener-
ated in a collaborative study among at least 15
laboratories using known levels of organisms.
4.5 The Section on Sanitary and Health
Effects Microbiology in the American Society
for Testing and Materials (ASTM) Committee
D-19:24 has also proposed a characteristic
called Counting Range. The Counting Range is
described as the range from the lowest num-
ber to the highest number of colonies that can
be measured on a single agar plate or mem-
brane filter, without affecting the reliability of
the method.
240
«»EPA MICROBIOLOGICAL MANUAL 1978
image:
 TABLE IV-C-3
Analysis of Difference Between Means
Sample Mean from Table
No. Method 1{XMl)
1 3.1469
2 3.8324
3 3.5416
4 2.7448
5 3.4891
6 3,7857
7 3.0725
XM^ = 3.3733 XM,
IV-C-2 for
Method 2 (XM2)
3,9083
3.6773
3.3142
2.5299
3.4028
3.6475
2,8972
= 3.1967
Difference Between
Means, (di = X^ — Xy^)
.2386
.1551
.2274
.2149
,0863
.1382
.1753
d =. .1765 Sd = .0547
QA/ANALYTICAL PROCEDURES
241
image:
TABLE IV-C-3
Analysis of Difference Between Means
Sample Mean from Table
No. Method 1{XMl)
1 3.1469
2 3.8324
3 3.5416
4 2.7448
5 3.4891
6 3,7857
7 3.0725
XM^ = 3.3733 XM,
IV-C-2 for
Method 2 (XM2)
3,9083
3.6773
3.3142
2.5299
3.4028
3.6475
2,8972
= 3.1967
Difference Between
Means, (di = X^ — Xy^)
.2386
.1551
.2274
.2149
,0863
.1382
.1753
d =. .1765 Sd = .0547
QA/ANALYTICAL PROCEDURES
241
image:
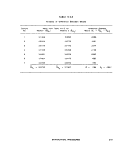 REFERENCES
1. Grant, E. L and R. S. Leavenworth, 1972. Statistical Quality Control. Fourth Edition. McGraw-Hill, Inc.,
New York, NY. p. 87.
2, Eisenhart, C. and P. W. Wilson, 1 i43. Statistical Methods and Control in Bacteriology. Bacteriological
Reviews 7:57.
3. Velz, C.'J., 1951. Graphical Approach to Statistics, Part 4: Evaluation of Bacterial Density. Water and
Sewage Works. 98:66.
4. Dlxon, W. J. and F. J. Massey, Jr., 1969. Introduction to Statistical Analyses, Third Edition. McGraw-Hill,
Inc., New York, NY. p. 310,
5. ibid. p. 537.
242 &EF¥\ MICROBIOLOGICAL MANUAL 1978
image:
REFERENCES
1. Grant, E. L and R. S. Leavenworth, 1972. Statistical Quality Control. Fourth Edition. McGraw-Hill, Inc.,
New York, NY. p. 87.
2, Eisenhart, C. and P. W. Wilson, 1 i43. Statistical Methods and Control in Bacteriology. Bacteriological
Reviews 7:57.
3. Velz, C.'J., 1951. Graphical Approach to Statistics, Part 4: Evaluation of Bacterial Density. Water and
Sewage Works. 98:66.
4. Dlxon, W. J. and F. J. Massey, Jr., 1969. Introduction to Statistical Analyses, Third Edition. McGraw-Hill,
Inc., New York, NY. p. 310,
5. ibid. p. 537.
242 &EF¥\ MICROBIOLOGICAL MANUAL 1978
image:
 PART V LABORATORY MANAGEMENT
Part V addresses those laboratory activities which supplement the analytical methodology and
are primarily the responsibility of the laboratory manager.
Section A Development of a Quality Control Program
Section B Manpower and Analytical Costs
Section C Safety
Section D Legal Considerations
MANAGEMENT OF QUALITY CONTROL 243
image:
PART V LABORATORY MANAGEMENT
Part V addresses those laboratory activities which supplement the analytical methodology and
are primarily the responsibility of the laboratory manager.
Section A Development of a Quality Control Program
Section B Manpower and Analytical Costs
Section C Safety
Section D Legal Considerations
MANAGEMENT OF QUALITY CONTROL 243
image:
 PART V. LABORATORY MANAGEMENT
Section A Development of a Quality Control Program
1. Intralaboratory Quality Control
1.1 To insure a viable quality assurance
effort, management must recognize the need
for a formal program and require its develop-
ment. Management must commit itself to the
program by setting aside 15% of the labora-
tory man-years for quality control activity. It
must meet with supervisors and staff to estab-
lish levels of responsibility for management,
supervisors and analysts. Laboratory person-
nel should participate in the planning and
structuring of the QA program.
1.2 Once the QA program is functioning,
supervisors review laboratory operations and
quality control with analysts on a frequent
(weekly) basis. Supervisors use the results of
the regular meetings with laboratory person-
nel to inform management on a regular
(monthly) basis of the status of the QA pro-
gram. These meetings are important to identify
the problems at the laboratory level and to get
the backing of management in the actions
necessary to correct problems.
2. Documentation of the Intralaboratory
Quality Control Program
Unless a record is made of the quality
control checks and procedures described in
Part IV of this Manual, there is no proof of
performance, no evidence for future reference
and for practical purposes, no quality control
program in operation. The following documen-
tation should be made and maintained.
2.1 An Operating Manual is prepared
which describes the sampling techniques, ana-
lytical methods, laboratory operations, mainte-
nance and quality control procedures. Specific
details are given on all procedures and quality
control checks made on materials, supplies,
equipment, instrumentation and facilities. The
frequency of the checks, the person responsi-
ble for each check (with necesssary back-up
assignments), the review mechanism in the QC
program to be followed, the frequency of the
review and the corrective actions to be taken
are specifed. A copy is provided to each
analyst.
2.2 A Sample Log is maintained which
records chronologically information on sam-
ple identification and origin, the necessary
chain of custody information, and analyses
performed.
2.3 A Written Record is also maintained of
all analytical QC checks: positive and negative
culture controls, sterility checks, replicate ana-
lyses by an analyst, comparative data between
analysts, use-test results of media, membrane
filters and laboratory pure water, replicate ana-
lyses done to establish precision of analysts, or
of methodology used to determine non-
compliance with bacterial limits and water
quality standards.
3. Interlaboratory Quality Control
An inter-laboratory quality control program
consists of: 1) formal collaborative method
244
MICROBIOLOGICAL MANUAL 1978
image:
PART V. LABORATORY MANAGEMENT
Section A Development of a Quality Control Program
1. Intralaboratory Quality Control
1.1 To insure a viable quality assurance
effort, management must recognize the need
for a formal program and require its develop-
ment. Management must commit itself to the
program by setting aside 15% of the labora-
tory man-years for quality control activity. It
must meet with supervisors and staff to estab-
lish levels of responsibility for management,
supervisors and analysts. Laboratory person-
nel should participate in the planning and
structuring of the QA program.
1.2 Once the QA program is functioning,
supervisors review laboratory operations and
quality control with analysts on a frequent
(weekly) basis. Supervisors use the results of
the regular meetings with laboratory person-
nel to inform management on a regular
(monthly) basis of the status of the QA pro-
gram. These meetings are important to identify
the problems at the laboratory level and to get
the backing of management in the actions
necessary to correct problems.
2. Documentation of the Intralaboratory
Quality Control Program
Unless a record is made of the quality
control checks and procedures described in
Part IV of this Manual, there is no proof of
performance, no evidence for future reference
and for practical purposes, no quality control
program in operation. The following documen-
tation should be made and maintained.
2.1 An Operating Manual is prepared
which describes the sampling techniques, ana-
lytical methods, laboratory operations, mainte-
nance and quality control procedures. Specific
details are given on all procedures and quality
control checks made on materials, supplies,
equipment, instrumentation and facilities. The
frequency of the checks, the person responsi-
ble for each check (with necesssary back-up
assignments), the review mechanism in the QC
program to be followed, the frequency of the
review and the corrective actions to be taken
are specifed. A copy is provided to each
analyst.
2.2 A Sample Log is maintained which
records chronologically information on sam-
ple identification and origin, the necessary
chain of custody information, and analyses
performed.
2.3 A Written Record is also maintained of
all analytical QC checks: positive and negative
culture controls, sterility checks, replicate ana-
lyses by an analyst, comparative data between
analysts, use-test results of media, membrane
filters and laboratory pure water, replicate ana-
lyses done to establish precision of analysts, or
of methodology used to determine non-
compliance with bacterial limits and water
quality standards.
3. Interlaboratory Quality Control
An inter-laboratory quality control program
consists of: 1) formal collaborative method
244
MICROBIOLOGICAL MANUAL 1978
image:
 studies to establish precision and accuracy of unknown samples, 5) follow up on problems
selected methodology, 2) specific minimal detected in onsite inspections and perfor-
standards for personnel, sampling and sample mance evaluations,
preservation procedures, analytical methodol-
ogy, equipment, instrumentation, facilities and
within-laboratory quality control programs, 3) EPA has established such a interlabora-
verification of acceptable standards through tory quality control program in response to
annual on-site inspections, 4) periodic perfor- the FWPCA Amendments of 1972 and the Safe
mance tests of analytical capabilities using Drinking Water Act of 1974.
MANAGEMENT OF QUALITY CONTROL 245
image:
studies to establish precision and accuracy of unknown samples, 5) follow up on problems
selected methodology, 2) specific minimal detected in onsite inspections and perfor-
standards for personnel, sampling and sample mance evaluations,
preservation procedures, analytical methodol-
ogy, equipment, instrumentation, facilities and
within-laboratory quality control programs, 3) EPA has established such a interlabora-
verification of acceptable standards through tory quality control program in response to
annual on-site inspections, 4) periodic perfor- the FWPCA Amendments of 1972 and the Safe
mance tests of analytical capabilities using Drinking Water Act of 1974.
MANAGEMENT OF QUALITY CONTROL 245
image:
 PART V. LABORATORY MANAGEMENT
Section B Manpower and Analytical Costs
Laboratories planning to begin or increase
microbiological activities have difficulty in de-
termining their added manpower, equipment
and supply needs. This Section provides esti-
mates of added costs:
1.
2.
Supplies
Time Expenditures
Specialized Equipment and
1. Time Expenditures for Microbiological
Analyses
The following estimates of time required
for membrane filter (MF) and most probable
number (MPN) tests were prepared in re-
sponse to information requests from Regional
Offices and States planning new or additional
microbiological work. The estimates are
presented as guidelines only.
The Microbiological Methods Section,
8MB and the Quality Assurance Branch, both
of EMSL-Cincinnati prepared the estimates
based on average performance of one techni-
cian qualified by short-course or on-the-job
training and experience in the specific tech-
niques. The procedures are those described in
This Manual.
1.1. MF Analyses
If only fecal coliform bacteria are being
tested, thirty (30) samples (estimating 3
dilutions/sample) can be prepared by one ana-
lyst on day one. Two hours are required to
complete the counting, calculation of results
and verification on day two.
If fecal and total coliform tests are per-
formed using 3 dilutions, twenty (20) samples
can be analyzed in one day by one analyst. On
the second day, counting of plates takes an
estimated 2 1/2 hours. An estimated four
hours are needed for preparation of media,
dilution water, dishes and pipettes for the test
period if analyses are performed over five
days. The time estimates include 10% devoted
to quality control procedures.
1.2 MPN Analyses
After preparation of tubed media, one
worker can process 15 samples for MPN anal-
yses for total and fecal coliforms in an 8-hour
day. The procedures include 5 tube x 5 or more
dilutions to assure the positive and negative
tubes result in 3 significant dilutions needed to
obtain the optimum MPN index. If 15 samples
are analyzed each day for a 5 day week, prepar-
ation and clean-up of tubed media and supplies
for the test period would require an estimated
8 hours. Estimates include 10% of time devoted
to quality control procedures {Part IV of this
Manual).
Since the MPN requires reading and trans-
fer of growth from positive tubes of lauryl
tryptose broth to brilliant green bile broth and
EC broth at 24 and 48 hours, the time span for
one day's samples may cover four days. These
times are indicated as 8, 4, 2 and 1 hours on
the four successive days. New samples tested
on the 2, 3, 4th day, etc., add to each day's
246
&ERA MICROBIOLOGICAL MANUAL 1978
image:
PART V. LABORATORY MANAGEMENT
Section B Manpower and Analytical Costs
Laboratories planning to begin or increase
microbiological activities have difficulty in de-
termining their added manpower, equipment
and supply needs. This Section provides esti-
mates of added costs:
1.
2.
Supplies
Time Expenditures
Specialized Equipment and
1. Time Expenditures for Microbiological
Analyses
The following estimates of time required
for membrane filter (MF) and most probable
number (MPN) tests were prepared in re-
sponse to information requests from Regional
Offices and States planning new or additional
microbiological work. The estimates are
presented as guidelines only.
The Microbiological Methods Section,
8MB and the Quality Assurance Branch, both
of EMSL-Cincinnati prepared the estimates
based on average performance of one techni-
cian qualified by short-course or on-the-job
training and experience in the specific tech-
niques. The procedures are those described in
This Manual.
1.1. MF Analyses
If only fecal coliform bacteria are being
tested, thirty (30) samples (estimating 3
dilutions/sample) can be prepared by one ana-
lyst on day one. Two hours are required to
complete the counting, calculation of results
and verification on day two.
If fecal and total coliform tests are per-
formed using 3 dilutions, twenty (20) samples
can be analyzed in one day by one analyst. On
the second day, counting of plates takes an
estimated 2 1/2 hours. An estimated four
hours are needed for preparation of media,
dilution water, dishes and pipettes for the test
period if analyses are performed over five
days. The time estimates include 10% devoted
to quality control procedures.
1.2 MPN Analyses
After preparation of tubed media, one
worker can process 15 samples for MPN anal-
yses for total and fecal coliforms in an 8-hour
day. The procedures include 5 tube x 5 or more
dilutions to assure the positive and negative
tubes result in 3 significant dilutions needed to
obtain the optimum MPN index. If 15 samples
are analyzed each day for a 5 day week, prepar-
ation and clean-up of tubed media and supplies
for the test period would require an estimated
8 hours. Estimates include 10% of time devoted
to quality control procedures {Part IV of this
Manual).
Since the MPN requires reading and trans-
fer of growth from positive tubes of lauryl
tryptose broth to brilliant green bile broth and
EC broth at 24 and 48 hours, the time span for
one day's samples may cover four days. These
times are indicated as 8, 4, 2 and 1 hours on
the four successive days. New samples tested
on the 2, 3, 4th day, etc., add to each day's
246
&ERA MICROBIOLOGICAL MANUAL 1978
image:
 workload. This add-on effect results in 8 hours
+ 4 hours + 2 hours + 1 hour for a workload
of 15 hours from the 4th day onward. Either
the sample load must be reduced or one must
provide a second technician. The accumulative
load is shown in Table V-B-1.
2. Specialized Equipment and Supplies
The following tables of materials and
equipment are provided as guidance to labora-
tories. Tables V-B-2, 3 and 4 are designed for a
minimal program of 2 samples/day, 7 days a
week. Estimates of expendable supplies are
based on those used in 1 year. Tables V-B-5,6,
7 and 8 are designed for laboratories planning
a program of 15 samples per day, 5 days per
week. Estimates for expendable supplies are
based on those used in 1 week.
The following assumptions are made:
The basic laboratory facility and equipment
are available (space, benches, lighting, utilities,
chemicals and standard glassware).
The laboratory will do membrane filtrations
as single analyses at three dilution levels or
MPN's as five tube, five dilution tests.
The amounts of supplies or numbers of
items are based on needs, then adjusted to
take advantage of quantity discounts by the
dozen, box, 100's, etc. For both laboratory
efforts, the expendable items are based on 2
weeks usage, while consumable media are
based on usage/week in the high effort labora-
tory and usage/year in the low effort laboratory.
Laboratories doing primarily drinking
water analyses may require fewer items; other
laboratories analyzing only polluted waters may
require more items.
Costs are current figures provided to give
rough estimates only. The necessary character-
istics of equipment and materials are cited to
assist the purchaser in his choices.
ANALYTICAL COSTS
247
image:
workload. This add-on effect results in 8 hours
+ 4 hours + 2 hours + 1 hour for a workload
of 15 hours from the 4th day onward. Either
the sample load must be reduced or one must
provide a second technician. The accumulative
load is shown in Table V-B-1.
2. Specialized Equipment and Supplies
The following tables of materials and
equipment are provided as guidance to labora-
tories. Tables V-B-2, 3 and 4 are designed for a
minimal program of 2 samples/day, 7 days a
week. Estimates of expendable supplies are
based on those used in 1 year. Tables V-B-5,6,
7 and 8 are designed for laboratories planning
a program of 15 samples per day, 5 days per
week. Estimates for expendable supplies are
based on those used in 1 week.
The following assumptions are made:
The basic laboratory facility and equipment
are available (space, benches, lighting, utilities,
chemicals and standard glassware).
The laboratory will do membrane filtrations
as single analyses at three dilution levels or
MPN's as five tube, five dilution tests.
The amounts of supplies or numbers of
items are based on needs, then adjusted to
take advantage of quantity discounts by the
dozen, box, 100's, etc. For both laboratory
efforts, the expendable items are based on 2
weeks usage, while consumable media are
based on usage/week in the high effort labora-
tory and usage/year in the low effort laboratory.
Laboratories doing primarily drinking
water analyses may require fewer items; other
laboratories analyzing only polluted waters may
require more items.
Costs are current figures provided to give
rough estimates only. The necessary character-
istics of equipment and materials are cited to
assist the purchaser in his choices.
ANALYTICAL COSTS
247
image:
 M
A
00
Day J_
First Series
Samples Stan
15 MPNS
8 hours
TABLE V-B-1
Estimated Time Required for Fifteen MPN Analyses/Day*
Day 2_ Day 3_ Day 4_ Day 5_ Day 6_
4 hours
2 hours
1 hour
Day 7_ Day 8_
o
3]
O
eg
O
r-
O
O
I
r*
i
r-
*•*
<0
Second Series
15 MPNs
8 hours
4 hours
2 hours
1 hour
Third Series
15 MPNs
8 hours
4 hours
2 hours
1 hour
Fourth Series
15 MPNs
8 hours 4 hours
2 hours
1 hour
Fifth Series
15 MPNs
8 hours
4 hours
2 hours
1 hour
•The time required per MPN analysis is not 1/15 of the time estimated because there is a time savings
in preparing larger numbers of samples.
image:
M
A
00
Day J_
First Series
Samples Stan
15 MPNS
8 hours
TABLE V-B-1
Estimated Time Required for Fifteen MPN Analyses/Day*
Day 2_ Day 3_ Day 4_ Day 5_ Day 6_
4 hours
2 hours
1 hour
Day 7_ Day 8_
o
3]
O
eg
O
r-
O
O
I
r*
i
r-
*•*
<0
Second Series
15 MPNs
8 hours
4 hours
2 hours
1 hour
Third Series
15 MPNs
8 hours
4 hours
2 hours
1 hour
Fourth Series
15 MPNs
8 hours 4 hours
2 hours
1 hour
Fifth Series
15 MPNs
8 hours
4 hours
2 hours
1 hour
•The time required per MPN analysis is not 1/15 of the time estimated because there is a time savings
in preparing larger numbers of samples.
image:
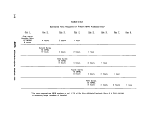 TABLE V-B-2
General Equipment and Supplies
Minimum Program
Incubator,
DWH, 18
Incubator,
Item
gravity convection,
X 19 x 28", (46
waterbath, 44.5 +
35 ± 0.5 C,
X 48 X 71 cm)
0.2 C for fecal coliforms,
Quantity
1
1
Cost
of
Quantity*
$360.00
380.00
LWH 18 x 12 x 7'/2", (46 x 31 X 19 cm)
Sterilizer, steam, bench top, electric heat with temperature
and pressure controls and gauges I.D.: 9" (23 cm)
diameter chamber, 16" (41 cm) deep
pH meter, analog, 0-14 pH range, accuracy + 0.1 pH
units, temperature compensated, with electrode
Qven, double wall, gravity connection RT to 225 C,
automatic temperature control, I.D.: LHD
19 X 18 X 16", (48 X 46 X 41 cm)
Refrigerator, 3 cubic ft. (.19 M3) with freezer
compartment
Thermometer, mercury, range 0-50 C graduated in 0.1 C.
Meets NBS specs.
Cylinder, graduated, 100 ml, 1 ml graduations
Cylinder, graduated, 50 ml, 1 ml graduations
Bottles, dilution, 99 ml mark, screw-cap, Pyrex glass
Bottle, sample, polypropylene, wide mouth, screw-capped
autoclavable.
12
18
48
1500.00
225.00
575.00
425.00
40.00
66.00
85.00
50.00
125 ml
250 ml
500 ml
Bottle, sample, glass, wide mouth, screw-cap, autoclavable
130 ml
210 ml
Beaker, stainless steel, 4 qt. waterbath for media
preparation
Pump, vacuum, polypropylene, water powered, 11.5
liters/min capacity
12
12
12
12
12
1
1
5.90
9.00
13.00
6.80
8.32
15.00
2.92
*1978 prices.
ANALYTICAL COSTS
249
image:
TABLE V-B-2
General Equipment and Supplies
Minimum Program
Incubator,
DWH, 18
Incubator,
Item
gravity convection,
X 19 x 28", (46
waterbath, 44.5 +
35 ± 0.5 C,
X 48 X 71 cm)
0.2 C for fecal coliforms,
Quantity
1
1
Cost
of
Quantity*
$360.00
380.00
LWH 18 x 12 x 7'/2", (46 x 31 X 19 cm)
Sterilizer, steam, bench top, electric heat with temperature
and pressure controls and gauges I.D.: 9" (23 cm)
diameter chamber, 16" (41 cm) deep
pH meter, analog, 0-14 pH range, accuracy + 0.1 pH
units, temperature compensated, with electrode
Qven, double wall, gravity connection RT to 225 C,
automatic temperature control, I.D.: LHD
19 X 18 X 16", (48 X 46 X 41 cm)
Refrigerator, 3 cubic ft. (.19 M3) with freezer
compartment
Thermometer, mercury, range 0-50 C graduated in 0.1 C.
Meets NBS specs.
Cylinder, graduated, 100 ml, 1 ml graduations
Cylinder, graduated, 50 ml, 1 ml graduations
Bottles, dilution, 99 ml mark, screw-cap, Pyrex glass
Bottle, sample, polypropylene, wide mouth, screw-capped
autoclavable.
12
18
48
1500.00
225.00
575.00
425.00
40.00
66.00
85.00
50.00
125 ml
250 ml
500 ml
Bottle, sample, glass, wide mouth, screw-cap, autoclavable
130 ml
210 ml
Beaker, stainless steel, 4 qt. waterbath for media
preparation
Pump, vacuum, polypropylene, water powered, 11.5
liters/min capacity
12
12
12
12
12
1
1
5.90
9.00
13.00
6.80
8.32
15.00
2.92
*1978 prices.
ANALYTICAL COSTS
249
image:
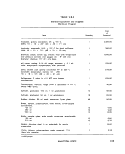 TABLE V-B-2
General Equipment and Supplies
Minimum Program (continued)
Item
Burner, Bunsen, utility
Needle, inoculating, in holder
Tongs, flask
Pen, ink, felt-tip, waterproof
Balance, torsion, two pan, 200 g capacity, accurate
to 10 mg, with 100 g weight
Hot Plate/Magnetic Stirrer, variable speed and heat,
6 X 6", (15 X 15 cm) top
Plpettor, automatic, volume of. 5-50 ml, speed- of
10-60 deliveries/minute with glass syringe
Cost
of
Quantity Quantity*
1 5.25
2 2.50
. 1 pr. 5.25
12 11.00
1 3 1 0.00
1 125.00
1 485.00
•1978 prices.
250 4>EFA MICROBIOLOGICAL MANUAL 1978
image:
TABLE V-B-2
General Equipment and Supplies
Minimum Program (continued)
Item
Burner, Bunsen, utility
Needle, inoculating, in holder
Tongs, flask
Pen, ink, felt-tip, waterproof
Balance, torsion, two pan, 200 g capacity, accurate
to 10 mg, with 100 g weight
Hot Plate/Magnetic Stirrer, variable speed and heat,
6 X 6", (15 X 15 cm) top
Plpettor, automatic, volume of. 5-50 ml, speed- of
10-60 deliveries/minute with glass syringe
Cost
of
Quantity Quantity*
1 5.25
2 2.50
. 1 pr. 5.25
12 11.00
1 3 1 0.00
1 125.00
1 485.00
•1978 prices.
250 4>EFA MICROBIOLOGICAL MANUAL 1978
image:
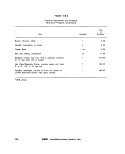 TABLE V-B-3
Equipment and Supplies for MF Analyses
Minimum Program
Item
Filters, membrane, white, gridded 47 mm, 0.45 ym
or equivalent pore size
Pads absorbent, 47 mm (optional)
Dishes, petri, plastic, tight-lid, 50 mm X 12 mm
Bag, plastic, waterproof for 44.5 C waterbath
incubator
Pipet, glass Mohr or bacteriological, 10 ml
in 0.1 ml increments
Pipet, glass Mohr or bacteriological, 2.0 or
2.2 ml, in 0.1 increments
Pipet, glass Mohr or bacteriological, 1.0 or
1.2 ml, in 0. 1 increments
Can, pipet, stainless steel, 2.5 X 2.5 X 16"
6,5 X 6.5 x 41 cm
Jar, polypropylene, for disinfection of pipets.
6.5 X 20" (16.5 X 50 cm)
Flask, vacuum, pyrex glass, 1 liter
Water Trap, glass bottle, stoppered with glass tube
inlet/outlet
Tubing, rubber, vacuum, 3/6" O.D. & 3/32" I.D.
(1.3 cm O.D. & .24 cm I.D.)
Pinchclamp, flat jaw
Forceps, blunt with smooth tip
Microscope, dissecting, binocular, 15 power
Illuminator, microscope, fluorescent, fits round tube
microscope
Quantity
2100 MFs
in pkgs of 100
2100 MFs pads
in pkgs of 100
2100 dishes ,
in boxes of 500
1000 in boxes ,
of 500
24
1,8-
18
3
1
1
1
48
2
2
1
1
Cost
of
Quantity*
$400,00
32.00
210.00
60,00
45.00
28.00
25.00
42.00
20.00
6.00
1.00
9.00
2.00
3.00
200.00
62.00
•1978 prices.
ANALYTICAL COSTS
251
image:
TABLE V-B-3
Equipment and Supplies for MF Analyses
Minimum Program
Item
Filters, membrane, white, gridded 47 mm, 0.45 ym
or equivalent pore size
Pads absorbent, 47 mm (optional)
Dishes, petri, plastic, tight-lid, 50 mm X 12 mm
Bag, plastic, waterproof for 44.5 C waterbath
incubator
Pipet, glass Mohr or bacteriological, 10 ml
in 0.1 ml increments
Pipet, glass Mohr or bacteriological, 2.0 or
2.2 ml, in 0.1 increments
Pipet, glass Mohr or bacteriological, 1.0 or
1.2 ml, in 0. 1 increments
Can, pipet, stainless steel, 2.5 X 2.5 X 16"
6,5 X 6.5 x 41 cm
Jar, polypropylene, for disinfection of pipets.
6.5 X 20" (16.5 X 50 cm)
Flask, vacuum, pyrex glass, 1 liter
Water Trap, glass bottle, stoppered with glass tube
inlet/outlet
Tubing, rubber, vacuum, 3/6" O.D. & 3/32" I.D.
(1.3 cm O.D. & .24 cm I.D.)
Pinchclamp, flat jaw
Forceps, blunt with smooth tip
Microscope, dissecting, binocular, 15 power
Illuminator, microscope, fluorescent, fits round tube
microscope
Quantity
2100 MFs
in pkgs of 100
2100 MFs pads
in pkgs of 100
2100 dishes ,
in boxes of 500
1000 in boxes ,
of 500
24
1,8-
18
3
1
1
1
48
2
2
1
1
Cost
of
Quantity*
$400,00
32.00
210.00
60,00
45.00
28.00
25.00
42.00
20.00
6.00
1.00
9.00
2.00
3.00
200.00
62.00
•1978 prices.
ANALYTICAL COSTS
251
image:
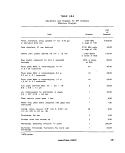 TABLE V-B-3
Equipment and Supplies for MF Analyses
Minimum Program
(continued)
Item
M Endo MF broth (optional)
LES Endo agar (optional)
M-FC broth
Rosollo Acid (for M-FC broth)
Methanol, 95%, in small vial for forceps disinfection
Ethnnol, 95%, unadulterated, for M-Endo, MF broth
and LES Endo agar
Quantity
8 x i/4#/yr
8 x i/4#/yr
8 x «/4#/yr
54 x 1 g/yr
1 pt/yr
500 ml/yr
Cost1
$60.00
72.00
64.00
90.00
1.00
5.00
Equipment and Supplies for Verification of MF Analyses
Minimum Program
Item Quantity Cost1
Tubas, Culture, w.o. Up, borosilicate glass, 8 x 24 $30.00
1 BO x 20 mm, reusable.2
Tube, fermentation, borosilicate, w.o. lip, 8 x 24 1S.OO
75 x 10 mm, reusable.2
Rack, wire, for 10 x 4 culture tubes
Basket, wire, rectangular galvanized,
10 x 6 x 6", (25 x 15 x 15 cm)
Caps, culture tube, aluminum 22 mm I.D.
Lauryl Tryptose broth
Brilliant Green Bile broth
EC broth
6
6
16 x 12
1#/yr
1#/yr
1#/yr
48.00
35.00
40.00
13.80
17.90
16.45
11978 prices.
2Available as disposables.
252 ©ERA MICROBIOLOGICAL MANUAL 197$
image:
TABLE V-B-3
Equipment and Supplies for MF Analyses
Minimum Program
(continued)
Item
M Endo MF broth (optional)
LES Endo agar (optional)
M-FC broth
Rosollo Acid (for M-FC broth)
Methanol, 95%, in small vial for forceps disinfection
Ethnnol, 95%, unadulterated, for M-Endo, MF broth
and LES Endo agar
Quantity
8 x i/4#/yr
8 x i/4#/yr
8 x «/4#/yr
54 x 1 g/yr
1 pt/yr
500 ml/yr
Cost1
$60.00
72.00
64.00
90.00
1.00
5.00
Equipment and Supplies for Verification of MF Analyses
Minimum Program
Item Quantity Cost1
Tubas, Culture, w.o. Up, borosilicate glass, 8 x 24 $30.00
1 BO x 20 mm, reusable.2
Tube, fermentation, borosilicate, w.o. lip, 8 x 24 1S.OO
75 x 10 mm, reusable.2
Rack, wire, for 10 x 4 culture tubes
Basket, wire, rectangular galvanized,
10 x 6 x 6", (25 x 15 x 15 cm)
Caps, culture tube, aluminum 22 mm I.D.
Lauryl Tryptose broth
Brilliant Green Bile broth
EC broth
6
6
16 x 12
1#/yr
1#/yr
1#/yr
48.00
35.00
40.00
13.80
17.90
16.45
11978 prices.
2Available as disposables.
252 ©ERA MICROBIOLOGICAL MANUAL 197$
image:
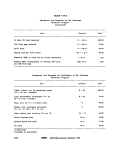 TABLE V-B-4
Equipment and Supplies for MPN Analyses
Minimum Program
Item
Tubes, Culture, w.o. lip, borosilicate glass,
150 X 20 mm, reusable,2
Tubes, Culture, w.o. lip, borosilicate glass,
150 X 25 mm, reusable.2
Tube, fermentation, borosilicate, w.o. Hp>
75 x 10 mm, reusable.2
Rack, wire, for 10 X 5 culture tubes
Basket, wire, rectangular galvanized,
10 X 6 X 6", (25 X 15 X 15 cm)
Caps, culture tube, aluminum 22 mm I.D.
Caps, culture tube, aluminum 27 mm I.D.
Lauryl Tryptose broth
Brilliant Green Bile broth
EC broth
Amount
2 X 576
288
2 X 720
15 X 1
10 X 1
60 X 12
24 X 12
14 X 1#/yr
16 x 1#/yr
15 X 1#/yr
Cost1
$170.00
70.00
105.00
225.00
80.00
1 50.00
60.00
200.00
300.00
250.00
11978 prices,
2Available as disposables.
ANALYTICAL COSTS
253
image:
TABLE V-B-4
Equipment and Supplies for MPN Analyses
Minimum Program
Item
Tubes, Culture, w.o. lip, borosilicate glass,
150 X 20 mm, reusable,2
Tubes, Culture, w.o. lip, borosilicate glass,
150 X 25 mm, reusable.2
Tube, fermentation, borosilicate, w.o. Hp>
75 x 10 mm, reusable.2
Rack, wire, for 10 X 5 culture tubes
Basket, wire, rectangular galvanized,
10 X 6 X 6", (25 X 15 X 15 cm)
Caps, culture tube, aluminum 22 mm I.D.
Caps, culture tube, aluminum 27 mm I.D.
Lauryl Tryptose broth
Brilliant Green Bile broth
EC broth
Amount
2 X 576
288
2 X 720
15 X 1
10 X 1
60 X 12
24 X 12
14 X 1#/yr
16 x 1#/yr
15 X 1#/yr
Cost1
$170.00
70.00
105.00
225.00
80.00
1 50.00
60.00
200.00
300.00
250.00
11978 prices,
2Available as disposables.
ANALYTICAL COSTS
253
image:
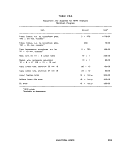 TABLE V-B-S
General Equipment and Supplies
Full Program in Microbiology
Item
Quantity
Cost
of
Quantity*
Pipets, glass, Mohr or bacteriological T.D., 10 ml
in 0.1 ml graduations
Pipets, glass, Mohr or bacteriological T.D., 2 or 2.2 ml
In 0.1 ml graduations
Pipets, glass, Mohr or bacteriological T.D., 1 ml
in 0.1 ml graduations
Can, pipet, stainless steel, 2.5 x 2.5 x 16"
(6.5 X 6.5 X 41 cm)
Jar, polypropylene, for disinfection of pipets,
6.5 X 20" (16.5 X 50 cm)
Cylinder, graduated, 100 ml
Cylinder, graduated, 50 mi
Bottle, dilution, pyrex glass, marked at 99 ml,
screw-cap
Bottle, sample, glass, wide mouth, screw-cap,
autoclavable
125 ml
250 ml
Bottle, sample, polypropylene, wide mouth,
screw-cap, autoclavable
125 ml
2BO ml
500 ml
1000 ml
Thermometer, mercury, 0-50 C, graduated in 0.1 C,
meets NBS specifications
Beaker, stainless steel, 4 quart, waterbath for
media preparation
Flask, vacuum, aspirator, pyrex glass, 1 liter
Water-trap, glass (glass bottle, stoppered, with glass
tube inlet and outlet)
96
96
96
15
24
36
96
72
72
96
96
48
24
3
1
70.00
60.00
55.00
210.00
40.00
132.00
170.00
100.00
42.00
50.00
72.00
108.00
52.00
38.00
40.00
15.00
18.00
1.00
*1978 prices.
254
MICROBIOLOGICAL MANUAL 1978
image:
TABLE V-B-S
General Equipment and Supplies
Full Program in Microbiology
Item
Quantity
Cost
of
Quantity*
Pipets, glass, Mohr or bacteriological T.D., 10 ml
in 0.1 ml graduations
Pipets, glass, Mohr or bacteriological T.D., 2 or 2.2 ml
In 0.1 ml graduations
Pipets, glass, Mohr or bacteriological T.D., 1 ml
in 0.1 ml graduations
Can, pipet, stainless steel, 2.5 x 2.5 x 16"
(6.5 X 6.5 X 41 cm)
Jar, polypropylene, for disinfection of pipets,
6.5 X 20" (16.5 X 50 cm)
Cylinder, graduated, 100 ml
Cylinder, graduated, 50 mi
Bottle, dilution, pyrex glass, marked at 99 ml,
screw-cap
Bottle, sample, glass, wide mouth, screw-cap,
autoclavable
125 ml
250 ml
Bottle, sample, polypropylene, wide mouth,
screw-cap, autoclavable
125 ml
2BO ml
500 ml
1000 ml
Thermometer, mercury, 0-50 C, graduated in 0.1 C,
meets NBS specifications
Beaker, stainless steel, 4 quart, waterbath for
media preparation
Flask, vacuum, aspirator, pyrex glass, 1 liter
Water-trap, glass (glass bottle, stoppered, with glass
tube inlet and outlet)
96
96
96
15
24
36
96
72
72
96
96
48
24
3
1
70.00
60.00
55.00
210.00
40.00
132.00
170.00
100.00
42.00
50.00
72.00
108.00
52.00
38.00
40.00
15.00
18.00
1.00
*1978 prices.
254
MICROBIOLOGICAL MANUAL 1978
image:
 TABLE V-B-5
General Equipment and Supplies
Full Program in Microbiology {continued)
Item
Quantity
Cost
of
Quantity*
Tubing, rubber, vacuum, 3/16' I.D. x 3/32' O.D.
(1.3 cm I.D. X 2.4 cm O.D.)
Needle, inoculating, with holder
Tongs, flask
Pen, ink, felt tip, waterproof
Balance, single pan, electric, top loader, 200 g capacity,
sensitivity 0.02 g for weighings of 2-200 grams
pH meter, analog, 0-14 pH range accuracy + 0.1 pH
units, temperature compensated line voltage, with
comb, electrode
or
pH meter, same as above, with accuracy ^ 0.05
pH units
Burner, gas, Bunsen
Hot plate-magnetic stirrer combination, variable
speed and heat, 15 X 15 cm. top
Incubator, 35 C + 0.5 C, water jacketed radiant heat
18 X 38 X 27", (46 X 96 X 68 cm)
or
Incubator, 35 C + 0.5 C, forced air, large, single chamber
I.D.: DWH 18 X 36 X 27", (46 x 96 X 68 cm)
Incubator, 44.5 C + 0.2 C water bath circulating,
I.D., LWD 36 X 18 X 91A", (91 X 46 X 24 cm)
Sterilizer, large rectangular, double-wall steam, electric
automatic, I.D., LWH 38 x 20 x 20"
(97 X 51 x 51 cm)
Oven, double wall, gravity convection RT to 225 C
I.D., LWH 24 X 20 X 20" (61 X 51 X 51 cm)
Refrigerator, 13 cubic foot, with freezer compartment,
automatic defrost
48'
4
1 pr
12
1
1
2
1
9.00
6.00
5,25
11.00
700.00
225.00
500,00
10.50
125.00
3380.00
2300.00
720.00
14000.00
750.00
500.00
*1978 prices.
ANALYTICAL COSTS
255
image:
TABLE V-B-5
General Equipment and Supplies
Full Program in Microbiology {continued)
Item
Quantity
Cost
of
Quantity*
Tubing, rubber, vacuum, 3/16' I.D. x 3/32' O.D.
(1.3 cm I.D. X 2.4 cm O.D.)
Needle, inoculating, with holder
Tongs, flask
Pen, ink, felt tip, waterproof
Balance, single pan, electric, top loader, 200 g capacity,
sensitivity 0.02 g for weighings of 2-200 grams
pH meter, analog, 0-14 pH range accuracy + 0.1 pH
units, temperature compensated line voltage, with
comb, electrode
or
pH meter, same as above, with accuracy ^ 0.05
pH units
Burner, gas, Bunsen
Hot plate-magnetic stirrer combination, variable
speed and heat, 15 X 15 cm. top
Incubator, 35 C + 0.5 C, water jacketed radiant heat
18 X 38 X 27", (46 X 96 X 68 cm)
or
Incubator, 35 C + 0.5 C, forced air, large, single chamber
I.D.: DWH 18 X 36 X 27", (46 x 96 X 68 cm)
Incubator, 44.5 C + 0.2 C water bath circulating,
I.D., LWD 36 X 18 X 91A", (91 X 46 X 24 cm)
Sterilizer, large rectangular, double-wall steam, electric
automatic, I.D., LWH 38 x 20 x 20"
(97 X 51 x 51 cm)
Oven, double wall, gravity convection RT to 225 C
I.D., LWH 24 X 20 X 20" (61 X 51 X 51 cm)
Refrigerator, 13 cubic foot, with freezer compartment,
automatic defrost
48'
4
1 pr
12
1
1
2
1
9.00
6.00
5,25
11.00
700.00
225.00
500,00
10.50
125.00
3380.00
2300.00
720.00
14000.00
750.00
500.00
*1978 prices.
ANALYTICAL COSTS
255
image:
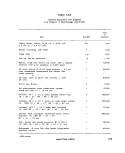 TABLE V-B-6
Equipment and Supplies for MF Analyses
Full Program in Microbiology
Item
Quantity
Cost
of
Quantity*
Membrane filtration assembly, stainless steel, for
47 mm filters
Membrane filtration assembly, plastic, autoclavable,
for 47 mm filters
Membrane filtration assembly, pyrex, for 47 mm filters
UV sterilizer unit for sterilizing MF filtration assemblies
Manifold, PVC, 3 place, for multiple filtrations
Microscope, binocular, dissecting type, 15 power
Lamp, fluorescent, microscope illuminator, fits round
tube microscope
Filters, membrane, white, 47 mm 0.45 ym or equiv.
pore size, gridded
Pads, absorbent, 47 mm
Dishes, petri, plastic, 50 x 12 mm, tight lid
Bags, plastic, waterproof for submersion of M-FC dishes
in waterbath
Bottle, rinse water, round, wide-mouth, screw-cap,
polypropylene, 1000 ml
Forceps, blunt with smooth tip
Counter, mechanical, hand type
Pump, vacuum, polypropylene, water powered, 11.5
liters/rnin capacity
or
Pump, vacuum/pressure, electric, portable, produces
20" mercury vacuum
Plnchclamp, flatjaw
3
1
1
1
1
300
300
500
500
24
3
1
1
12
S3 60.00
24.00
120.00
550.00
200.00
200.00
62.00
57.00
4.50
50.00
30.00
38.00
4.00
9.00
3.00
130.00
6.00
*1978 prices.
256
MICROBIOLOGICAL MANUAL 1978
image:
TABLE V-B-6
Equipment and Supplies for MF Analyses
Full Program in Microbiology
Item
Quantity
Cost
of
Quantity*
Membrane filtration assembly, stainless steel, for
47 mm filters
Membrane filtration assembly, plastic, autoclavable,
for 47 mm filters
Membrane filtration assembly, pyrex, for 47 mm filters
UV sterilizer unit for sterilizing MF filtration assemblies
Manifold, PVC, 3 place, for multiple filtrations
Microscope, binocular, dissecting type, 15 power
Lamp, fluorescent, microscope illuminator, fits round
tube microscope
Filters, membrane, white, 47 mm 0.45 ym or equiv.
pore size, gridded
Pads, absorbent, 47 mm
Dishes, petri, plastic, 50 x 12 mm, tight lid
Bags, plastic, waterproof for submersion of M-FC dishes
in waterbath
Bottle, rinse water, round, wide-mouth, screw-cap,
polypropylene, 1000 ml
Forceps, blunt with smooth tip
Counter, mechanical, hand type
Pump, vacuum, polypropylene, water powered, 11.5
liters/rnin capacity
or
Pump, vacuum/pressure, electric, portable, produces
20" mercury vacuum
Plnchclamp, flatjaw
3
1
1
1
1
300
300
500
500
24
3
1
1
12
S3 60.00
24.00
120.00
550.00
200.00
200.00
62.00
57.00
4.50
50.00
30.00
38.00
4.00
9.00
3.00
130.00
6.00
*1978 prices.
256
MICROBIOLOGICAL MANUAL 1978
image:
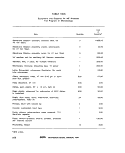 TABLE V-B-7
Equipment and Supplies for MPN Analyses
Full Program in Microbiology
Basket, wire
10 x 6 x
Rack, wire.
Item
, rectangular galvanized,
6" (25.4 X 15 x 15 cm)
for 10 x 5 culture tubes.
Cost
of
Quantity Quantity1
190 $1520.00
150 2250.00
150 X 25 mm
Tubes, culture w.o. lip, borosilicate glass,
150 x 20 mm, reusable.2
Tubes, culture w.o. lip, borosilicate glass,
150 X 25 mm, reusable.2
Tubes, fermentation w.o. lip, borosilicate glass,
75 x 10 mm, reusable.2
Caps, culture tube, aluminum, 22 mm I.D.
Caps, culture, tube, aluminum, 27 mm I.D.
30 X 576
17 x 288
21 X 720
1250 x 12
408 X 12
2560.00
1200.00
1100.00
3125.00
1020.00
11978 prices.
2Available as disposables.
ANALYTICAL COSTS
257
image:
TABLE V-B-7
Equipment and Supplies for MPN Analyses
Full Program in Microbiology
Basket, wire
10 x 6 x
Rack, wire.
Item
, rectangular galvanized,
6" (25.4 X 15 x 15 cm)
for 10 x 5 culture tubes.
Cost
of
Quantity Quantity1
190 $1520.00
150 2250.00
150 X 25 mm
Tubes, culture w.o. lip, borosilicate glass,
150 x 20 mm, reusable.2
Tubes, culture w.o. lip, borosilicate glass,
150 X 25 mm, reusable.2
Tubes, fermentation w.o. lip, borosilicate glass,
75 x 10 mm, reusable.2
Caps, culture tube, aluminum, 22 mm I.D.
Caps, culture, tube, aluminum, 27 mm I.D.
30 X 576
17 x 288
21 X 720
1250 x 12
408 X 12
2560.00
1200.00
1100.00
3125.00
1020.00
11978 prices.
2Available as disposables.
ANALYTICAL COSTS
257
image:
 TABLE V-B-8
Media for Full Program in Microbiology Laboratory
Usage for each Week/100 Samples
Medium
MF Analyses:
M Endo MF Broth
M-FC Broth
LES Endo Agar
Rosollc Acid (for M-FC Broth)
MPN Analyses:
Lauryl Tryptose Broth
Brilliant Green Bile Broth
EC Broth
EMB Agar
MF
Lauryl Tryptose Broth
Brilliant Green Bile Broth
EC Broth
Usage/Week
0.1 Ib/week
0.07 Ib/week
0.17 Ib/week
1 g/week
' 1.96 Ib/wk2
2.2 Ib/wk
2.04 Ib/wk
variable
Verification Costs on 5 Samples/Week
20 Colonies/Sample
.07 Ib/week
.07 Ib/week
.07 Ib/week
Cost/lb1
$17.90
24.85
20.95
1.70/g
13.80
17.90
16.4B
18.70
13.80
17.90
16.45
11878 prices.
2For single strength medium.
258
<8>ERk MICROBIOLOGICAL MANUAL 1978
image:
TABLE V-B-8
Media for Full Program in Microbiology Laboratory
Usage for each Week/100 Samples
Medium
MF Analyses:
M Endo MF Broth
M-FC Broth
LES Endo Agar
Rosollc Acid (for M-FC Broth)
MPN Analyses:
Lauryl Tryptose Broth
Brilliant Green Bile Broth
EC Broth
EMB Agar
MF
Lauryl Tryptose Broth
Brilliant Green Bile Broth
EC Broth
Usage/Week
0.1 Ib/week
0.07 Ib/week
0.17 Ib/week
1 g/week
' 1.96 Ib/wk2
2.2 Ib/wk
2.04 Ib/wk
variable
Verification Costs on 5 Samples/Week
20 Colonies/Sample
.07 Ib/week
.07 Ib/week
.07 Ib/week
Cost/lb1
$17.90
24.85
20.95
1.70/g
13.80
17.90
16.4B
18.70
13.80
17.90
16.45
11878 prices.
2For single strength medium.
258
<8>ERk MICROBIOLOGICAL MANUAL 1978
image:
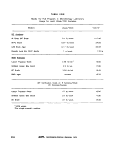 PART V. LABORATORY MANAGEMENT
Section C Laboratory and Field Safety
Introduction
1. Administrative Considerations
This Section has been compiled from the
best available sources. The procedures given
for general laboratory safety follow the OSHA
regulations (1, 2). Specific recommendations
for microbiology were selected from literature
of the Center for Disease Control, the National
Institute for Occupational Safety and Health of
the Public Health Service, the U.S. Environ-
mental Protection Agency and other sources
(3-12).
Safety procedures should be performed
as an integral part of the analytical methods
and should be included in program planning
on a day to day basis.
The objectives of a laboratory and field
safety program are 1)to protect the laboratory
worker, the laboratory environment and the
surrounding community from microbial agents
studied and 2) to protect the integrity of the
microbiological studies. The program is dis-
cussed as follows:
1. Administrative Considerations
2. Sources of Hazard
3. Field Guidelines
4. Laboratory Guidelines
5, Biohazard Control
6. Safety Check List
1.1 Development of a Safety Program
1.1.1 If a laboratory safety program is to
be effective, management must know the
causes of infections in order to develop and
upgrade safety procedures, equipment and
rules, and to reduce incidence of infection. The
lack of information on sources of laboratory
infection (Table V-C-1 and 2) prevents improve-
ment in safety programs and emphasizes the
need for reporting all accidents. A preponder-
ance of evidence in the literature indicates that
if the known causes of labpratory infections
were eliminated, the remaining infections
could be considered to be caused by airborne
transmission.
Some common microbiological proce-
dures shown to produce aerosols include pi-
petting into a petri plates or flasks, opening
lyophilized culture ampuls, opening culture
containers, inserting a hot loop into a culture
container and removing the cover from stan-
dard blender after mixing a sample.
1.1.2 Job attitudes can be the cause of
laboratory accidents: overly rigid work habits,
failure to recognize dangerous situations,
work at excessive speed and deliberate viola-
tions of rules. These attitudes can only be
overcome by the development of safe work
habits through continued education and
training.
SAFETY
259
image:
PART V. LABORATORY MANAGEMENT
Section C Laboratory and Field Safety
Introduction
1. Administrative Considerations
This Section has been compiled from the
best available sources. The procedures given
for general laboratory safety follow the OSHA
regulations (1, 2). Specific recommendations
for microbiology were selected from literature
of the Center for Disease Control, the National
Institute for Occupational Safety and Health of
the Public Health Service, the U.S. Environ-
mental Protection Agency and other sources
(3-12).
Safety procedures should be performed
as an integral part of the analytical methods
and should be included in program planning
on a day to day basis.
The objectives of a laboratory and field
safety program are 1)to protect the laboratory
worker, the laboratory environment and the
surrounding community from microbial agents
studied and 2) to protect the integrity of the
microbiological studies. The program is dis-
cussed as follows:
1. Administrative Considerations
2. Sources of Hazard
3. Field Guidelines
4. Laboratory Guidelines
5, Biohazard Control
6. Safety Check List
1.1 Development of a Safety Program
1.1.1 If a laboratory safety program is to
be effective, management must know the
causes of infections in order to develop and
upgrade safety procedures, equipment and
rules, and to reduce incidence of infection. The
lack of information on sources of laboratory
infection (Table V-C-1 and 2) prevents improve-
ment in safety programs and emphasizes the
need for reporting all accidents. A preponder-
ance of evidence in the literature indicates that
if the known causes of labpratory infections
were eliminated, the remaining infections
could be considered to be caused by airborne
transmission.
Some common microbiological proce-
dures shown to produce aerosols include pi-
petting into a petri plates or flasks, opening
lyophilized culture ampuls, opening culture
containers, inserting a hot loop into a culture
container and removing the cover from stan-
dard blender after mixing a sample.
1.1.2 Job attitudes can be the cause of
laboratory accidents: overly rigid work habits,
failure to recognize dangerous situations,
work at excessive speed and deliberate viola-
tions of rules. These attitudes can only be
overcome by the development of safe work
habits through continued education and
training.
SAFETY
259
image:
 TABLE V-C-1
Laboratory-acquired Infections Related to Personnel and Work*
No.
No.
Distribution
of cases
of deaths
Total # of
Infections
2262
96
Bacteria
1303
53
Type
Viruses
519
31
of Infective Agent
Rickettsia
293
8
Parasites
62
2
Fungi
85
2
Type of Personnel (where known)
Trained Scientific
Personnel"
Students
Animal Caretakers
Clerks, occasional
visitors, maintenance
Types of Work (where known)
Diagnostic
Research
Biological Reagent
Production
Classwork
Combination of
Activities
1534
82
221
87
525 ,
726
§1
37
856 358
80 —
137 3i
48 —
393 96
289 230
19 31
37 —
206
1
40
15
3
155
1
_
57
1
1
1
16
31
—
—
57
—
4
23
17
21
—
599
335
81
133
11
39
•Reference 3.
"Includes research assistants, professional and technical workers and graduate students.
260
&ERA MICROBIOLOGICAL MANUAL 1978
image:
TABLE V-C-1
Laboratory-acquired Infections Related to Personnel and Work*
No.
No.
Distribution
of cases
of deaths
Total # of
Infections
2262
96
Bacteria
1303
53
Type
Viruses
519
31
of Infective Agent
Rickettsia
293
8
Parasites
62
2
Fungi
85
2
Type of Personnel (where known)
Trained Scientific
Personnel"
Students
Animal Caretakers
Clerks, occasional
visitors, maintenance
Types of Work (where known)
Diagnostic
Research
Biological Reagent
Production
Classwork
Combination of
Activities
1534
82
221
87
525 ,
726
§1
37
856 358
80 —
137 3i
48 —
393 96
289 230
19 31
37 —
206
1
40
15
3
155
1
_
57
1
1
1
16
31
—
—
57
—
4
23
17
21
—
599
335
81
133
11
39
•Reference 3.
"Includes research assistants, professional and technical workers and graduate students.
260
&ERA MICROBIOLOGICAL MANUAL 1978
image:
 TABLE V-C-2
Sources of Laboratory-acquired Infections*
Source of
Infection
Work Situation but No Known. Incident
Clinical specimens
Autopsy, including known
accidents
Aerosols
Handled infected animals
and ectoparasites
Work with agent
Discarded glassware
Known accidents
Needle and syringe
Pipetting
Spilling and splattering
Type of Infective Agent
Bacteria Parasites
103 17
95 —
135 1
126 5
412 16
21 ' — '
66 3
66 1
41 5
Fungi
—
39
—
27
1
2
—
2
Injury with broken glass,
etc.
Bite of animal or
44
ectoparasite
Centrifuge
. 28
2
8
2
3
"Reference 3.
SAFETY
261
image:
TABLE V-C-2
Sources of Laboratory-acquired Infections*
Source of
Infection
Work Situation but No Known. Incident
Clinical specimens
Autopsy, including known
accidents
Aerosols
Handled infected animals
and ectoparasites
Work with agent
Discarded glassware
Known accidents
Needle and syringe
Pipetting
Spilling and splattering
Type of Infective Agent
Bacteria Parasites
103 17
95 —
135 1
126 5
412 16
21 ' — '
66 3
66 1
41 5
Fungi
—
39
—
27
1
2
—
2
Injury with broken glass,
etc.
Bite of animal or
44
ectoparasite
Centrifuge
. 28
2
8
2
3
"Reference 3.
SAFETY
261
image:
 1.1.3 Safety training of laboratory and
field personnel, formulation of safety regula-
tions, and the establishment of mechanisms
for reporting and investigating accidents are
prime responsibilities of the laboratory and
field supervisors and higher management.
First aid courses should be provided to the
laboratory supervisor and at least one other
permanent employee.
Each employee should have a copy of the
safety program. Joint supervisor-employee
safety committees should identify potential
laboratory hazards and formulate workable
safety regulations. Laboratory safety regula-
tions should stress the protection of the labora-
tory personnel, janitorial and maintenance
staff and others who might come in contact
with the laboratory and its personnel.
1,2 Reporting Laboratory Infections and
Accidents
1.2.1 Because many laboratory accidents
are not reported, most laboratory infections
are never traced to a specific cause. To im-
prove safety, it is important to maintain good
records of laboratory accidents and infections.
It is necessary to know the pathogens involved
and the circumstances under which the infec-
tion or accident occurred. It is recommended
that each laboratory set up a formal system for
reporting accidents as they occur so that ap-
propriate prophylatic measures may be insti-
tuted. A record of accidents with after effects,
particularly those resulting in infection, can be
of considerable value.
1.2.2 In EPA, laboratory-acquired
infections oY accidents must be reported to the
Immediate supervisor. EPA Form 1440,
Supervisor's Report of Accident, and Form CA
1, "Federal Employee's Notice of Traumatic
Injury and Claim for Continuation of
Pay/Compensation," must be completed by
the employee and the supervisor and filed
within two working days. Form CA 2, "Federal
Employee's Notice of Occupational Disease
and Claim for Compensation" is to be
completed by the employee and submitted
within 30 days.
It is recommended that the safety officer
at each installation conduct a quarterly safety
inspection of the facilities to identify and cor-
rect dangerous conditions or procedures. He
should make full use of the safety check lists
developed for the laboratory. An example of a
safety check list is given at the end of this
Section.
2. Sources of Hazard
2.1 Causative Agents
Only a small percentage of microorgan-
isms are capable of producing disease in
man; they include bacteria, fungi, yeasts,
protozoa, actinomycetes, animal and human
viruses, and rickettsiae (3, 4). Because
innocuous and infectious microorganisms
cannot be differentiated in natural materials
and because microorganisms considered
harmless may produce disease in man under
favorable conditions, it is good practice to
treat all microorganisms and materials as if
they are pathogens or disease carriers.
2.2 Sources in Sampling
Laboratory and field personnel collecting
samples and isolating cultures from natural
sources must be made aware that pathogens
are present in environmental samples.
Disease-causing organisms are found in natu-
ral waters, municipal effluents and sludges,
industrial wastewaters from packing plants, in
soils and runoff from feedlots and from septic
tank systems. These pathogens have also been
found in inadequately-treated finished water
systems and in ground water supplies. Before
working with environmental samples, field
personnel should have thorough training in
aseptic technique and handling pathogens.
2.3 Sources in the Laboratory
Table V-C-1 and 2 present data on
laboratory-acquired infections in the United
States which were collected in a survey of
5000 laboratories over a 20-year period (3).
Table V-C-1 shows the distribution of
laboratory-acquired infections according to
262
MICROBIOLOGICAL MANUAL 1978
image:
1.1.3 Safety training of laboratory and
field personnel, formulation of safety regula-
tions, and the establishment of mechanisms
for reporting and investigating accidents are
prime responsibilities of the laboratory and
field supervisors and higher management.
First aid courses should be provided to the
laboratory supervisor and at least one other
permanent employee.
Each employee should have a copy of the
safety program. Joint supervisor-employee
safety committees should identify potential
laboratory hazards and formulate workable
safety regulations. Laboratory safety regula-
tions should stress the protection of the labora-
tory personnel, janitorial and maintenance
staff and others who might come in contact
with the laboratory and its personnel.
1,2 Reporting Laboratory Infections and
Accidents
1.2.1 Because many laboratory accidents
are not reported, most laboratory infections
are never traced to a specific cause. To im-
prove safety, it is important to maintain good
records of laboratory accidents and infections.
It is necessary to know the pathogens involved
and the circumstances under which the infec-
tion or accident occurred. It is recommended
that each laboratory set up a formal system for
reporting accidents as they occur so that ap-
propriate prophylatic measures may be insti-
tuted. A record of accidents with after effects,
particularly those resulting in infection, can be
of considerable value.
1.2.2 In EPA, laboratory-acquired
infections oY accidents must be reported to the
Immediate supervisor. EPA Form 1440,
Supervisor's Report of Accident, and Form CA
1, "Federal Employee's Notice of Traumatic
Injury and Claim for Continuation of
Pay/Compensation," must be completed by
the employee and the supervisor and filed
within two working days. Form CA 2, "Federal
Employee's Notice of Occupational Disease
and Claim for Compensation" is to be
completed by the employee and submitted
within 30 days.
It is recommended that the safety officer
at each installation conduct a quarterly safety
inspection of the facilities to identify and cor-
rect dangerous conditions or procedures. He
should make full use of the safety check lists
developed for the laboratory. An example of a
safety check list is given at the end of this
Section.
2. Sources of Hazard
2.1 Causative Agents
Only a small percentage of microorgan-
isms are capable of producing disease in
man; they include bacteria, fungi, yeasts,
protozoa, actinomycetes, animal and human
viruses, and rickettsiae (3, 4). Because
innocuous and infectious microorganisms
cannot be differentiated in natural materials
and because microorganisms considered
harmless may produce disease in man under
favorable conditions, it is good practice to
treat all microorganisms and materials as if
they are pathogens or disease carriers.
2.2 Sources in Sampling
Laboratory and field personnel collecting
samples and isolating cultures from natural
sources must be made aware that pathogens
are present in environmental samples.
Disease-causing organisms are found in natu-
ral waters, municipal effluents and sludges,
industrial wastewaters from packing plants, in
soils and runoff from feedlots and from septic
tank systems. These pathogens have also been
found in inadequately-treated finished water
systems and in ground water supplies. Before
working with environmental samples, field
personnel should have thorough training in
aseptic technique and handling pathogens.
2.3 Sources in the Laboratory
Table V-C-1 and 2 present data on
laboratory-acquired infections in the United
States which were collected in a survey of
5000 laboratories over a 20-year period (3).
Table V-C-1 shows the distribution of
laboratory-acquired infections according to
262
MICROBIOLOGICAL MANUAL 1978
image:
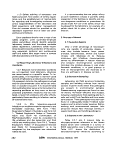 personnel and their work. It is significant that
trained scientific personnel had 1534 of the
1924 infections identified by type of person-
nel. Among laboratory workers, researchers
led with 726 of 1938 infections. These data
suggest that the majority of infections occur
because of carelessness of trained and knowl-
edgeable workers and not because of igno-
rance. However, new technicians should be
made aware that culturing microorganisms
from natural sources develops extremely large
numbers of cells which could cause disease if
not properly handled.
Table V-C-2 presents data on the sources
of laboratory-acquired infections. This table
shows that the five most common accidents
causing laboratory infection were:
1. Accidental inoculation with syringes
and needles.
2. Accidental oral aspiration of infectious
material through a pipet.
3. Cuts or scratches from contaminated
glassware.
4. Spilling or splattering of pathogenic
cultures on floors, table tops, and other
surfaces.
5. Bites of animals or ectoparasites.
It is significant that ir^ about 80% of the
laboratory infections studied ir^ Table V-C-2
the mechanism was not known. It was only
known that the individual had worked with the
agent or had tended infected animals.
3. Field Safety Guidelines
The sample collector or investigator must
also consider safety in his work. The potential
for accidents in field work is much greater than
in the laboratory. The following rules on field
safety were extracted from a comprehensive
safety manual developed by EPA's National
Enforcement and Investigations Center at
Denver (5). They are intended as guidelines to
assist the laboratory in developing its own
protocol.
3.1 Automotive Safety
3.1.1 The driver should make certain that
he has valid state and agency driver licenses
on his person before operating a vehicle.
3.1.2 If the driver observes a questionable
or unsafe condition when first operating a ve-
hicle, he should return it directly to the carpool
regardless of work demands.
3.1.3 Continuous driving in excess of ten
hours, in any 24-hour period, is not
recommended.
3.1.4 Occupants of vehicles should wear
seat belts and shoulder harnesses, where pro-
vided, whenever vehicles are in motion. The
driver should carry a kit provided by the labor-
atory that includes fire extinguisher, flares,
reflectors, and a first-aid kit.
3.1.5 Safety screens should be installed in
carryall and van-type vehicles to separate the
cargo and passenger compartments. If safety
screens are not installed, cargo should not be
stacked higher than the back of the seat.
3.1.6 Employees required to tow a trailer
should be instructed in the proper handling of
the equipment involved.
3.1.7 Vehicles used to tow any kind of
trailer should be equipped with west-coast
type mirrors and the necessary connections
for trailer signal, tail lights, brakes, and safety
chains.
3.1.8 If a boat is transported in a pickup
truck, it should not obstruct the vision of the
driver or extend over the vehicle cab.
3.1.9 A driver backing a vehicle with a
trailer in tow should have someone outside the
vehicle to direct him.
3.2 Boat Safety
3.2.1 Only qualified employees should op-
erate watercraft. Boat operators must have
completed advanced emergency first-aid
training.
SAFETY
263
image:
personnel and their work. It is significant that
trained scientific personnel had 1534 of the
1924 infections identified by type of person-
nel. Among laboratory workers, researchers
led with 726 of 1938 infections. These data
suggest that the majority of infections occur
because of carelessness of trained and knowl-
edgeable workers and not because of igno-
rance. However, new technicians should be
made aware that culturing microorganisms
from natural sources develops extremely large
numbers of cells which could cause disease if
not properly handled.
Table V-C-2 presents data on the sources
of laboratory-acquired infections. This table
shows that the five most common accidents
causing laboratory infection were:
1. Accidental inoculation with syringes
and needles.
2. Accidental oral aspiration of infectious
material through a pipet.
3. Cuts or scratches from contaminated
glassware.
4. Spilling or splattering of pathogenic
cultures on floors, table tops, and other
surfaces.
5. Bites of animals or ectoparasites.
It is significant that ir^ about 80% of the
laboratory infections studied ir^ Table V-C-2
the mechanism was not known. It was only
known that the individual had worked with the
agent or had tended infected animals.
3. Field Safety Guidelines
The sample collector or investigator must
also consider safety in his work. The potential
for accidents in field work is much greater than
in the laboratory. The following rules on field
safety were extracted from a comprehensive
safety manual developed by EPA's National
Enforcement and Investigations Center at
Denver (5). They are intended as guidelines to
assist the laboratory in developing its own
protocol.
3.1 Automotive Safety
3.1.1 The driver should make certain that
he has valid state and agency driver licenses
on his person before operating a vehicle.
3.1.2 If the driver observes a questionable
or unsafe condition when first operating a ve-
hicle, he should return it directly to the carpool
regardless of work demands.
3.1.3 Continuous driving in excess of ten
hours, in any 24-hour period, is not
recommended.
3.1.4 Occupants of vehicles should wear
seat belts and shoulder harnesses, where pro-
vided, whenever vehicles are in motion. The
driver should carry a kit provided by the labor-
atory that includes fire extinguisher, flares,
reflectors, and a first-aid kit.
3.1.5 Safety screens should be installed in
carryall and van-type vehicles to separate the
cargo and passenger compartments. If safety
screens are not installed, cargo should not be
stacked higher than the back of the seat.
3.1.6 Employees required to tow a trailer
should be instructed in the proper handling of
the equipment involved.
3.1.7 Vehicles used to tow any kind of
trailer should be equipped with west-coast
type mirrors and the necessary connections
for trailer signal, tail lights, brakes, and safety
chains.
3.1.8 If a boat is transported in a pickup
truck, it should not obstruct the vision of the
driver or extend over the vehicle cab.
3.1.9 A driver backing a vehicle with a
trailer in tow should have someone outside the
vehicle to direct him.
3.2 Boat Safety
3.2.1 Only qualified employees should op-
erate watercraft. Boat operators must have
completed advanced emergency first-aid
training.
SAFETY
263
image:
 3,2.2 The boat operator must not operate
the boat without a second person on board.
3.2.3 The boat operator is responsible for
the safety of persons and equipment on board.
He should provide a a boat safety briefing to
occupants before embarking.
3.2.4 Occupants must wear life jackets
onboard. No exceptions are permitted. Soft-
soled, non-skid shoes are recommended.
3.2.5 Flare gun, fire extinguishers and first
aid kit should be kept on each boat.
3.2.6 Boats operated in estuaries or open
seas should be equipped with depth-finding
instruments, navigational aids and two-way ra-
dios adequate to communicate with at least
one shore station. Boats with marine radios
should monitor distress frequency except
when transmitting.
3.2.7 Boats should not be operated in high
winds, storms, heavy rain, fog, etc. Boats
should not be operated more than one half
mile from launch point on estuaries, large
lakes, and large rivers until acquiring reliable
weather forecasts.
3.2.8 The operator should attach a red
pennant to the radio mast when operating at
slow speeds (e.g., sampling, dredging, towing).
3.2.9 The operator must install and use
lights according to established practice for
night operations.
3.3 General Rules for Sampling
3.3.1 Require two people on each gauging
or night sampling crew or on other hazardous
projects.
3.3.2 Wear safety glasses, safety shoes,
hard hats, respirators, gas masks, and ear-
protection devices, as appropriate in hazard-
ous areas.
3.3.3 Wear fluorescent vests or jackets
while sampling from roadways and bridges.
During sampling, post a yellow flasher on ap-
proaches at each end of the bridge. On heavily
traveled roads post flagmen or warning de-
vices at each end of bridge that lacks 24-inch
walkways. Such sampling points should be
avoided where possible.
3.3.4 Wear rubber gloves while handling
samples that might be toxic or corrosive. Wear
work gloves while handling sampling equip-
ment. During collection and transport, the field
worker should store containers to prevent
spilling or splashing of samples. Disinfect
hands immediately after handling sewage
samples and equipment for sampling sewage.
3.3.5 Do not sample from railroad bridges
unless there is an adequate walkway or the
railroad dispatcher has been contacted and it
has been positively determined that no trains
will run during sampling period.
3.3.6 Equip vehicles for sampling and as-
sociated work with rotary amber caution
lights. Operate such lights whenever vehicles
are driven slowly on roadways or are parked
near roadways. Do not park vehicles on
bridges.
3.3.7 Inform employees of the safety rules
in force within industrial sites. Employees
must conform to rules promulgated by the
industry while on-site.
3.3.8 Properly ground electrical apparatus
employed in field operations and use battery
straps to handle or move wet-cell batteries.
3.4 Sampling from Manholes
3.4.1 Erect barricades around manholes
where samples are being collected. Do not
leave manholes uncovered while unattended
orunbarricaded.
3.4.2 Do not enter a manhole until it is
cleared by using a blower for at least five
264
&EPA MICROBIOLOGICAL MANUAL 1978
image:
3,2.2 The boat operator must not operate
the boat without a second person on board.
3.2.3 The boat operator is responsible for
the safety of persons and equipment on board.
He should provide a a boat safety briefing to
occupants before embarking.
3.2.4 Occupants must wear life jackets
onboard. No exceptions are permitted. Soft-
soled, non-skid shoes are recommended.
3.2.5 Flare gun, fire extinguishers and first
aid kit should be kept on each boat.
3.2.6 Boats operated in estuaries or open
seas should be equipped with depth-finding
instruments, navigational aids and two-way ra-
dios adequate to communicate with at least
one shore station. Boats with marine radios
should monitor distress frequency except
when transmitting.
3.2.7 Boats should not be operated in high
winds, storms, heavy rain, fog, etc. Boats
should not be operated more than one half
mile from launch point on estuaries, large
lakes, and large rivers until acquiring reliable
weather forecasts.
3.2.8 The operator should attach a red
pennant to the radio mast when operating at
slow speeds (e.g., sampling, dredging, towing).
3.2.9 The operator must install and use
lights according to established practice for
night operations.
3.3 General Rules for Sampling
3.3.1 Require two people on each gauging
or night sampling crew or on other hazardous
projects.
3.3.2 Wear safety glasses, safety shoes,
hard hats, respirators, gas masks, and ear-
protection devices, as appropriate in hazard-
ous areas.
3.3.3 Wear fluorescent vests or jackets
while sampling from roadways and bridges.
During sampling, post a yellow flasher on ap-
proaches at each end of the bridge. On heavily
traveled roads post flagmen or warning de-
vices at each end of bridge that lacks 24-inch
walkways. Such sampling points should be
avoided where possible.
3.3.4 Wear rubber gloves while handling
samples that might be toxic or corrosive. Wear
work gloves while handling sampling equip-
ment. During collection and transport, the field
worker should store containers to prevent
spilling or splashing of samples. Disinfect
hands immediately after handling sewage
samples and equipment for sampling sewage.
3.3.5 Do not sample from railroad bridges
unless there is an adequate walkway or the
railroad dispatcher has been contacted and it
has been positively determined that no trains
will run during sampling period.
3.3.6 Equip vehicles for sampling and as-
sociated work with rotary amber caution
lights. Operate such lights whenever vehicles
are driven slowly on roadways or are parked
near roadways. Do not park vehicles on
bridges.
3.3.7 Inform employees of the safety rules
in force within industrial sites. Employees
must conform to rules promulgated by the
industry while on-site.
3.3.8 Properly ground electrical apparatus
employed in field operations and use battery
straps to handle or move wet-cell batteries.
3.4 Sampling from Manholes
3.4.1 Erect barricades around manholes
where samples are being collected. Do not
leave manholes uncovered while unattended
orunbarricaded.
3.4.2 Do not enter a manhole until it is
cleared by using a blower for at least five
264
&EPA MICROBIOLOGICAL MANUAL 1978
image:
 minutes. Following the five-minute ventilation,
use a lead acetate swab to check for I-^S. If
H2S is present, wear a respirator when enter-
ing manhole. Substitute a respirator for blower
ventilation where explosive gases are present
(i.e., in storm sewer or domestic sewer).
3.4.3 A sample collector entering man-
holes must wear safety lines handled by two
persons outside of manholes. Keep safety lines
taut at all times. Fifteen minutes is the maxi-
mum time allowed in manhole. Keep a vehicle
at hand in case of emergency.
3.4.4 Do not enter sewer lines for any
reason.
3.5 Sampling Channels and Streams
3.5.1 Sample collector must work from
behind a barricade or wear a safety line at-
tached to a secure object when sampling fast-
moving channels or streams from shore, walk-
way, etc. The same rule applies to any open
channel when footing is questionable, i.e.,
snow, steep bank, etc.
3.5.2 Wade only to knee-depth In swift
waterstreams, or to hip-depth in placid water.
When wading in fast moving water secure
safety lines to shore and have at feast two
other persons in attendance.
3.5.3 Attach lines from sampling devices
!°_ a secure object but never to sampling
personnel.
3.6 Sampling Under Ice
3.6.1 Two people are a minimum crew for
operations involving ice cover. One person
must remain on solid footing until thickness of
ice is known.
3.6.2 Do not sample on ice if the ice thick-
ness is less than four inches.
3.6.3 Wear life preservers and secure
safety lines to an object on shore when sam-
pling on ice-covered water.
4. Laboratory Safety Guidelines
The following safety rules are intended as
guidelines. They were developed from the
available safety literature (3-9) and have con-
sidered the Occupational Safety and Health
Administration (OSHA) regulations (1/2). Us-
ing such source materials, the laboratory direc-
tor, laboratory supervisor or senior profes-
sional should develop rules that are specific
for the laboratory program and the organisms
involved.
4.1 Personal Conduct and Clothing
4.1.1 Store coats, hats/jackets, and other
items of personal clothing outside of the mi-
crobiology laboratory. Do not mix laboratory
and street clothes in the same locker.
4.1.2 Wear a non-flammable laboratory
gown or coat in the laboratory. If clothing
becomes contaminated, autoclave before
laundering. Laboratory clothing should not be
worn in clean areas or outside the building.
Open-toed shoes, or extreme shoe styles
should not be worn, since they provide little
protection or are unstable.
4.1.3 Wear goggles or safety glasses to
protect eyes from UV irradition.
4.1.4 Wash hands carefully after labora-
tory and field duties, using a germicidal soap.
4.1.5 Use forceps or rubber gloves when
there is a significant danger of contamination
such as during the clean-up of pathogenic
material.
4.1.6 Do not touch one's face, lick labels
or put pencils and other materials in one's
mouth.
4.1.7 Don't smoke, eat, drink or chew gum
in the laboratory or while sampling. Do not
keep food or drinks in the lab refrigerator or
cold room. Do not brew coffee or tea in the
laboratory area.
SAFETY
265
image:
minutes. Following the five-minute ventilation,
use a lead acetate swab to check for I-^S. If
H2S is present, wear a respirator when enter-
ing manhole. Substitute a respirator for blower
ventilation where explosive gases are present
(i.e., in storm sewer or domestic sewer).
3.4.3 A sample collector entering man-
holes must wear safety lines handled by two
persons outside of manholes. Keep safety lines
taut at all times. Fifteen minutes is the maxi-
mum time allowed in manhole. Keep a vehicle
at hand in case of emergency.
3.4.4 Do not enter sewer lines for any
reason.
3.5 Sampling Channels and Streams
3.5.1 Sample collector must work from
behind a barricade or wear a safety line at-
tached to a secure object when sampling fast-
moving channels or streams from shore, walk-
way, etc. The same rule applies to any open
channel when footing is questionable, i.e.,
snow, steep bank, etc.
3.5.2 Wade only to knee-depth In swift
waterstreams, or to hip-depth in placid water.
When wading in fast moving water secure
safety lines to shore and have at feast two
other persons in attendance.
3.5.3 Attach lines from sampling devices
!°_ a secure object but never to sampling
personnel.
3.6 Sampling Under Ice
3.6.1 Two people are a minimum crew for
operations involving ice cover. One person
must remain on solid footing until thickness of
ice is known.
3.6.2 Do not sample on ice if the ice thick-
ness is less than four inches.
3.6.3 Wear life preservers and secure
safety lines to an object on shore when sam-
pling on ice-covered water.
4. Laboratory Safety Guidelines
The following safety rules are intended as
guidelines. They were developed from the
available safety literature (3-9) and have con-
sidered the Occupational Safety and Health
Administration (OSHA) regulations (1/2). Us-
ing such source materials, the laboratory direc-
tor, laboratory supervisor or senior profes-
sional should develop rules that are specific
for the laboratory program and the organisms
involved.
4.1 Personal Conduct and Clothing
4.1.1 Store coats, hats/jackets, and other
items of personal clothing outside of the mi-
crobiology laboratory. Do not mix laboratory
and street clothes in the same locker.
4.1.2 Wear a non-flammable laboratory
gown or coat in the laboratory. If clothing
becomes contaminated, autoclave before
laundering. Laboratory clothing should not be
worn in clean areas or outside the building.
Open-toed shoes, or extreme shoe styles
should not be worn, since they provide little
protection or are unstable.
4.1.3 Wear goggles or safety glasses to
protect eyes from UV irradition.
4.1.4 Wash hands carefully after labora-
tory and field duties, using a germicidal soap.
4.1.5 Use forceps or rubber gloves when
there is a significant danger of contamination
such as during the clean-up of pathogenic
material.
4.1.6 Do not touch one's face, lick labels
or put pencils and other materials in one's
mouth.
4.1.7 Don't smoke, eat, drink or chew gum
in the laboratory or while sampling. Do not
keep food or drinks in the lab refrigerator or
cold room. Do not brew coffee or tea in the
laboratory area.
SAFETY
265
image:
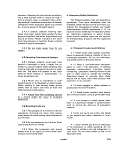 4.1.8 Keep conversation to an absolute
minimum during bench work to prevent self-
infection or loss of analytical data.
4.1.9 Keep reading matter, surplus materi-
als and equipment out of the laboratory area.
4.1.10 Laboratory and field personnel
handling polluted samples should be vacci-
nated against typhoid, tetanus and polio.
4.2.10 Lyophilization procedures can be a
source of laboratory infection. When vacuum
is applied during lyophilization, the contami-
nated air is withdrawn from the ampuls
through the pump and into the room. Use bio-
logical air filters or air decontamination proce-
dures to reduce hazard. Aerosols are also often
created by opening lyophilized ampuls. Re-
duce this hazard by wrapping the ampul in a
disinfectant-soaked pledget of cotton before
breaking.
4.2 Laboratory Equipment
4.2.1 Limit traffic through the work areas.
4.2.2 Treat all cultures and samples as if
they are potentially pathogenic. The degree of
risk Is increased greatly in culture work be-
cause the microorganisms are produced in
very large numbers.
4.2.3 Do not mouth-pipet polluted water,
wastewater or other potentially infectious or
toxic fluids; use a bulb or other mechanical
device. See Part II-B, 1.8.2.
4.2.4 For potable waters, plug pipets with
non-absorbent cotton. Do not use pipets with
wet plugs.
4.2.5 Use a hooded bunsen burner or
shielded electric incinerator to protect against
splattering during culture work.
4.2.6 Maintain benches in a clear and un-
cluttered condition for maximum efficiency
and safety.
4.2.7 Perform all culture work in a
biohazard hood to protect cultures and
workers.
4.2.8 Do not use the kitchen type blender
for mixing materials containing infectious
agents. Safety blenders are available in which
infectious materials may be mixed without dis-
semination of infectious aerosols.
4.2.9 When a vacuum line is used, inter-
pose suitable traps or filters to insure that
infectious agents do not enter the system.
4.2.11 Read II-C-6 for instructions on
proper packing of cultures for mail shipment
before sending any isolates to a central labora-
tory for confirmation.
4.2.12 Periodically clean out freezers, ice
chests and refrigerators to remove any broken
ampuls, tubes, etc., containing infectious ma-
terials. If units contain pathogenic cultures,
use rubber gloves during this cleaning. Use
respiratory protection if actinomycetes, fungi
or other easily disseminated agents are
involved.
4.3 Disinfection/Sterilization
4.3.1 Disinfect table tops and work carts
before and after laboratory work. A bottle of
disinfectant and gauze squares or towelling for
washing and wiping purposes should be avail-
able in laboratory for routine and emergency
use.
4.3.2 Use a disinfectant which specifies
germicidal activity against the organisms most
often encountered in the laboratory. Organo-
iodine complexes, quaternary ammonium
compounds, phenolics and alcohols which are
effective against vegetative bacteria and
viruses are recommended for general use.
However, these disinfectants are not sporo-
cidal. If spore-forming bacteria are encounter-
ed, formaldehyde or formaldehyde/alcohol
solution is recommended. See Table V-C-3.
i
Mercury salts, chlorine-containing com-
pounds or home-use products are not recom-
mended for the laboratory.
266
&EFW MICROBIOLOGICAL MANUAL 1978
image:
4.1.8 Keep conversation to an absolute
minimum during bench work to prevent self-
infection or loss of analytical data.
4.1.9 Keep reading matter, surplus materi-
als and equipment out of the laboratory area.
4.1.10 Laboratory and field personnel
handling polluted samples should be vacci-
nated against typhoid, tetanus and polio.
4.2.10 Lyophilization procedures can be a
source of laboratory infection. When vacuum
is applied during lyophilization, the contami-
nated air is withdrawn from the ampuls
through the pump and into the room. Use bio-
logical air filters or air decontamination proce-
dures to reduce hazard. Aerosols are also often
created by opening lyophilized ampuls. Re-
duce this hazard by wrapping the ampul in a
disinfectant-soaked pledget of cotton before
breaking.
4.2 Laboratory Equipment
4.2.1 Limit traffic through the work areas.
4.2.2 Treat all cultures and samples as if
they are potentially pathogenic. The degree of
risk Is increased greatly in culture work be-
cause the microorganisms are produced in
very large numbers.
4.2.3 Do not mouth-pipet polluted water,
wastewater or other potentially infectious or
toxic fluids; use a bulb or other mechanical
device. See Part II-B, 1.8.2.
4.2.4 For potable waters, plug pipets with
non-absorbent cotton. Do not use pipets with
wet plugs.
4.2.5 Use a hooded bunsen burner or
shielded electric incinerator to protect against
splattering during culture work.
4.2.6 Maintain benches in a clear and un-
cluttered condition for maximum efficiency
and safety.
4.2.7 Perform all culture work in a
biohazard hood to protect cultures and
workers.
4.2.8 Do not use the kitchen type blender
for mixing materials containing infectious
agents. Safety blenders are available in which
infectious materials may be mixed without dis-
semination of infectious aerosols.
4.2.9 When a vacuum line is used, inter-
pose suitable traps or filters to insure that
infectious agents do not enter the system.
4.2.11 Read II-C-6 for instructions on
proper packing of cultures for mail shipment
before sending any isolates to a central labora-
tory for confirmation.
4.2.12 Periodically clean out freezers, ice
chests and refrigerators to remove any broken
ampuls, tubes, etc., containing infectious ma-
terials. If units contain pathogenic cultures,
use rubber gloves during this cleaning. Use
respiratory protection if actinomycetes, fungi
or other easily disseminated agents are
involved.
4.3 Disinfection/Sterilization
4.3.1 Disinfect table tops and work carts
before and after laboratory work. A bottle of
disinfectant and gauze squares or towelling for
washing and wiping purposes should be avail-
able in laboratory for routine and emergency
use.
4.3.2 Use a disinfectant which specifies
germicidal activity against the organisms most
often encountered in the laboratory. Organo-
iodine complexes, quaternary ammonium
compounds, phenolics and alcohols which are
effective against vegetative bacteria and
viruses are recommended for general use.
However, these disinfectants are not sporo-
cidal. If spore-forming bacteria are encounter-
ed, formaldehyde or formaldehyde/alcohol
solution is recommended. See Table V-C-3.
i
Mercury salts, chlorine-containing com-
pounds or home-use products are not recom-
mended for the laboratory.
266
&EFW MICROBIOLOGICAL MANUAL 1978
image:
 TABLE V-C-3
Normal Use Concentration of Disinfectants
Use
Compound Concentration
mg/Iiter
Organo-lodine Complexes
Quaternary Ammonium
Compounds
Phenoltes
Alcohol, 70% w/v
Formaldehyde
Formaldehyde in
70% Alcohol Solution
100-150
700-800
water
solution
8%
4.3.3 If a culture or infective material is
spilled, notify the laboratory supervisor at
once, then disinfect and clean up the area.
4.3.4 Never pour viable cultures or con-
taminated materials in the sink. Never leave
infectious material or equipment unattended
during use.
4.3.5 Immediately after use, place con-
taminated pipets in a disinfectant container
which allows complete immersion; place cul-
tures and contaminated materials in color-
coded biohazard bags and seal. Disinfectant
containers of pipets and sealed bags of materi-
als are autoclaved as units.
4.3.6 Place used glassware in special cans
marked for autoclaving. Keep broken glass-
ware in a separate container. Place plastic
items in separate cans to prevent fusing of
plastic around glass items.
4.3.7 Mark contaminated items as Con-
taminated before removal from the laboratory
for autoclaving. Use temperature-sensitive
tapes which indicate exposure to heat. Pre-
printed tapes or tags simplify this task.
4.3.8 Check autoclaves with the use of
spore strips or spore suspensions of B. stear-
othermophilus and maximum-minimum
recording thermometers. Ideally autoclaves
are equipped with temperature recording de-
vices so that a permanent record may be
maintained.
Check hot air ovens and gas sterilizers
periodically with spore strips or the indicator,
B. subt/'/isvar. niger.
4.3.9 Wet-mop floors weekly, using water
containing a disinfectant. Dry or wet pickup
vacuum cleaners with high-efficiency exhaust
air filters are recommended. Wax floors with
bacteriostatic floor waxes if available..
4.4 Chemicals and Gases
4.4.1 Label containers plainly and perma-
nently. Dispose of material in unlabelled con-
tainers carefully. Wipe or rinse residual ma-
terial from the external surfaces of reagent
containers after use.
4.4.2 Store flammable solvents in an ap-
proved solvent storage cabinet or a well-
ventilated area.
4.4.3 When opening bottles which may be
under pressure i.e., hydrochloric acid, ammo-
nium hydroxide, cover the bottle with a towel
to divert chemical spray.
4.4.4 Use bottle carriers to transport bot-
tles containing hazardous chemicals (acids,
corrosives, flammable liquids). Large cylinders
are transported only by means of a wheeled
cart to which the cylinder is secured. Store and
transport compressed gas cylinders with ship-
ping caps on, in an upright position, always
securely clamped or chained to a firm support
and away from heat.
4.4.5 Reagents and chemical which might
react in water drains or be dangerous to the
environment must be disposed of in other
ways. Examples are 1) sodium azide which
reacts with metal drains to produce very explo-
sive lead or copper azides and 2) mercury and
its salts which should not be returned to the
SAFETY
267
image:
TABLE V-C-3
Normal Use Concentration of Disinfectants
Use
Compound Concentration
mg/Iiter
Organo-lodine Complexes
Quaternary Ammonium
Compounds
Phenoltes
Alcohol, 70% w/v
Formaldehyde
Formaldehyde in
70% Alcohol Solution
100-150
700-800
water
solution
8%
4.3.3 If a culture or infective material is
spilled, notify the laboratory supervisor at
once, then disinfect and clean up the area.
4.3.4 Never pour viable cultures or con-
taminated materials in the sink. Never leave
infectious material or equipment unattended
during use.
4.3.5 Immediately after use, place con-
taminated pipets in a disinfectant container
which allows complete immersion; place cul-
tures and contaminated materials in color-
coded biohazard bags and seal. Disinfectant
containers of pipets and sealed bags of materi-
als are autoclaved as units.
4.3.6 Place used glassware in special cans
marked for autoclaving. Keep broken glass-
ware in a separate container. Place plastic
items in separate cans to prevent fusing of
plastic around glass items.
4.3.7 Mark contaminated items as Con-
taminated before removal from the laboratory
for autoclaving. Use temperature-sensitive
tapes which indicate exposure to heat. Pre-
printed tapes or tags simplify this task.
4.3.8 Check autoclaves with the use of
spore strips or spore suspensions of B. stear-
othermophilus and maximum-minimum
recording thermometers. Ideally autoclaves
are equipped with temperature recording de-
vices so that a permanent record may be
maintained.
Check hot air ovens and gas sterilizers
periodically with spore strips or the indicator,
B. subt/'/isvar. niger.
4.3.9 Wet-mop floors weekly, using water
containing a disinfectant. Dry or wet pickup
vacuum cleaners with high-efficiency exhaust
air filters are recommended. Wax floors with
bacteriostatic floor waxes if available..
4.4 Chemicals and Gases
4.4.1 Label containers plainly and perma-
nently. Dispose of material in unlabelled con-
tainers carefully. Wipe or rinse residual ma-
terial from the external surfaces of reagent
containers after use.
4.4.2 Store flammable solvents in an ap-
proved solvent storage cabinet or a well-
ventilated area.
4.4.3 When opening bottles which may be
under pressure i.e., hydrochloric acid, ammo-
nium hydroxide, cover the bottle with a towel
to divert chemical spray.
4.4.4 Use bottle carriers to transport bot-
tles containing hazardous chemicals (acids,
corrosives, flammable liquids). Large cylinders
are transported only by means of a wheeled
cart to which the cylinder is secured. Store and
transport compressed gas cylinders with ship-
ping caps on, in an upright position, always
securely clamped or chained to a firm support
and away from heat.
4.4.5 Reagents and chemical which might
react in water drains or be dangerous to the
environment must be disposed of in other
ways. Examples are 1) sodium azide which
reacts with metal drains to produce very explo-
sive lead or copper azides and 2) mercury and
its salts which should not be returned to the
SAFETY
267
image:
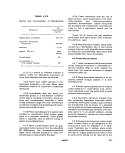 environment Consult reference texts to deter-
mine the proper disposal procedure for each
chemical (8,9),
4.5 Handling Glassware
4.5.1 Discard broken, chipped or badly
scratched glassware. Use gloves or sweep up
broken glass, do not use bare hands. Pick up
fine glass particles with wet paper towelling.
4.5.2 Fire polish tubing and rods.
4.5.3 Protect hands with gloves, towel, or
tubing holder when inserting tubing into stop-
pers. Lubricate the tubing with water or glycer-
ine. Handle tubing close to the stopper and out
of line with end of the tube.
4.5.4 Use asbestos-centered wire gauze
when heating glass vessels over a burner.
4.5.5 Do not attempt to catch falling
glassware.
4.6 Electrical Equipment
4.6.1 Keep materials, tools and hands dry
while handling electrical equipment.
4.6.2 Use grounded outlets only.
4.6.3 Do not use electrical equipment near
flammable solvents.
4.6.4 Use only carbon dioxide or dry pow-
der fire extinguishers in case of fire in or near
any electrical equipment.
4.7 Emergency Precautions
4.7.1 Install and maintain both foam and
carbon dioxide fire extinguishers within easy
access of the laboratory.
4.7.2 Fire exits should be clearly marked
and accessible.
4.7.3 Install and maintain a complete first
aid kit and an oxygen respiration unit in the
laboratory.
5. Biohazard Control
5.1 Safety Cabinets
5.1.1 The safety cabinet is the most impor-
tant primary barrier available to the microbiol-
ogistfor isolation and containment of microor-
ganisms and for protecting the laboratory envi-
ronment, and the surrounding area from con-
tamination. Transfers of cultures especially
pathogenic fungi, actinomycetes and yeasts
should be conducted in the safety cabinets.
5.1.2 UV lamps are commonly used in
biohazard hoods to maintain sterility of the
work area. Goggles should be worn to protect
the worker and cultures should be protected
from undesirable exposure (see Part IV-A, 4 in
this Manual).
5.1.3 There are several types of ventilated
cabinets available for use (10,13):
(a) Partial Barrier Cabinet
The open or closed front cabinet is usually
referred to as a partial barrier ventilated cabi-
net. This cabinet can be used with the glove
panel removed, depending upon an inward
flow of air of at least 100 linear ft. per min. to
prevent escape of airborne particles. It can
also be used with the glove panel in place and
arm-length gloves attached, in which case it
will be maintained under a reduced air pres-
sure of about one inch of water gauge. When
operated closed, the partial barrier needs an
attached air lock for movement of materials. A
third mode of operation consists of using a
cabinet with glove panel attached, but with
gloves removed.
(b) Absolute Barrier Cabinet
The second type of ventilated cabinet is
the gas-tight cabinet system, referred to as an
absolute barrier cabinet. Absolute barrier cabi-
nets are connected to form a modular cabinet
system with enclosed refrigerators, incuba-
tors, etc. Air is drawn into the cabinet system
through ultrahigh efficiency filters and is ex-
hausted through ultrahigh efficiency filters.
268
MICROBIOLOGICAL MANUAL 1978'
image:
environment Consult reference texts to deter-
mine the proper disposal procedure for each
chemical (8,9),
4.5 Handling Glassware
4.5.1 Discard broken, chipped or badly
scratched glassware. Use gloves or sweep up
broken glass, do not use bare hands. Pick up
fine glass particles with wet paper towelling.
4.5.2 Fire polish tubing and rods.
4.5.3 Protect hands with gloves, towel, or
tubing holder when inserting tubing into stop-
pers. Lubricate the tubing with water or glycer-
ine. Handle tubing close to the stopper and out
of line with end of the tube.
4.5.4 Use asbestos-centered wire gauze
when heating glass vessels over a burner.
4.5.5 Do not attempt to catch falling
glassware.
4.6 Electrical Equipment
4.6.1 Keep materials, tools and hands dry
while handling electrical equipment.
4.6.2 Use grounded outlets only.
4.6.3 Do not use electrical equipment near
flammable solvents.
4.6.4 Use only carbon dioxide or dry pow-
der fire extinguishers in case of fire in or near
any electrical equipment.
4.7 Emergency Precautions
4.7.1 Install and maintain both foam and
carbon dioxide fire extinguishers within easy
access of the laboratory.
4.7.2 Fire exits should be clearly marked
and accessible.
4.7.3 Install and maintain a complete first
aid kit and an oxygen respiration unit in the
laboratory.
5. Biohazard Control
5.1 Safety Cabinets
5.1.1 The safety cabinet is the most impor-
tant primary barrier available to the microbiol-
ogistfor isolation and containment of microor-
ganisms and for protecting the laboratory envi-
ronment, and the surrounding area from con-
tamination. Transfers of cultures especially
pathogenic fungi, actinomycetes and yeasts
should be conducted in the safety cabinets.
5.1.2 UV lamps are commonly used in
biohazard hoods to maintain sterility of the
work area. Goggles should be worn to protect
the worker and cultures should be protected
from undesirable exposure (see Part IV-A, 4 in
this Manual).
5.1.3 There are several types of ventilated
cabinets available for use (10,13):
(a) Partial Barrier Cabinet
The open or closed front cabinet is usually
referred to as a partial barrier ventilated cabi-
net. This cabinet can be used with the glove
panel removed, depending upon an inward
flow of air of at least 100 linear ft. per min. to
prevent escape of airborne particles. It can
also be used with the glove panel in place and
arm-length gloves attached, in which case it
will be maintained under a reduced air pres-
sure of about one inch of water gauge. When
operated closed, the partial barrier needs an
attached air lock for movement of materials. A
third mode of operation consists of using a
cabinet with glove panel attached, but with
gloves removed.
(b) Absolute Barrier Cabinet
The second type of ventilated cabinet is
the gas-tight cabinet system, referred to as an
absolute barrier cabinet. Absolute barrier cabi-
nets are connected to form a modular cabinet
system with enclosed refrigerators, incuba-
tors, etc. Air is drawn into the cabinet system
through ultrahigh efficiency filters and is ex-
hausted through ultrahigh efficiency filters.
268
MICROBIOLOGICAL MANUAL 1978'
image:
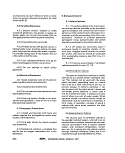 (c) Vented Laminar Flow Cabinet
This third type of safety cabinet is not gas-
tight. It relies on high efficiency filters to pro-
tect the worker and the environment. In the
Figure V-C-1, the blower (1) set into the bottom
of the cabinet pushes air up through a rear
duct into the top of the cabinet (2) and causes a
slight negative pressure in the work area (3). In
the top of the cabinet (2), part of the air is
forced out the exhaust through a High Effi-
ciency, Particulate, Ah* (HEPA) filter (4). How-
ever, the major part of the air is forced down
through a large HEPA filter (5), in a vertical flow
into the work area (6). This vertical flow (lam-
inar flow) combines with the negative pressure
from the blower to draw in enough make-up
from the room to replace that exhausted
above. The make-up air (7) is pulled through
vents at the edge of the hood opening and is
drawn down to the blower without contacting
the work area. It combines with the filtered air
and is recirculated through the HEPA filters.
The laminar flow draws off any contaminating
particles emanating from the work area. HEPA
filters are 99.i9% efficient in removing parti-
cles 0.3 jjm diameter or larger, by the OOP test.
5.1.4 Selection of a Cabinet
The partial barrier cabinet with open front
gives some protection to the worker and the
laboratory environment but does hot protect
the cultures. With the glove panel in place, it
protects the worker and adjacent laboratory
area. The absolute barrier and laminar flow
cabinets provide the greatest protection to the
worker and the cultures.
For routine water bacteriology and limited
work with pathogens, a partial barrier cabinet
with glove panel can be used. If a significant
portion of the workload involves pathogenic
microorganisms, a gas-tight absolute barrier
cabinet with glove ports or laminar flow cabi-
net is recommended. These provide protection
of cultures as well as the worker and the work
environment. Because laminar flow cabinets
do not require glove openings, yet do protect
personnel and culture work and are easy to
use, they are recommended for all but the most
hazardous microbiological operations.
5.2 Biohazard Identification
5.2.1 The revised Federal Occupational
Safety and Health Act of 1972 requires biolog-
ical hazard signs and tags to signify the actual
or potential biological hazard (1, 10). The haz-
ards are defined as infectious agents that
present a risk to human well-being. These
signs and tags are used to identify equipment,
containers, rooms, materials, experimental an-
imals, or combinations of the above, which
contain or are contaminated with viable haz-
ardous agents.
5.2.2 The biological or biohazard symbol
design is shown in Figure V-C-2. It has a fluo-
rescent orange or orange-red color, and may
contain appropriate wording to indicate the
nature or identity of the hazard, the name of
the individual responsible for its control, pre-
cautionary information, etc. The wording must
not be superimposed on the symbol. Back-
ground color is optional, but enough contrast
must be provided so that the symbol can be
clearly defined.
6. Safety Check List
The laboratory safety check list that fol-
lows is provided as a guide for a laboratory to
incorporate wholly or in part into its own safety
program.
SAFETY
269
image:
(c) Vented Laminar Flow Cabinet
This third type of safety cabinet is not gas-
tight. It relies on high efficiency filters to pro-
tect the worker and the environment. In the
Figure V-C-1, the blower (1) set into the bottom
of the cabinet pushes air up through a rear
duct into the top of the cabinet (2) and causes a
slight negative pressure in the work area (3). In
the top of the cabinet (2), part of the air is
forced out the exhaust through a High Effi-
ciency, Particulate, Ah* (HEPA) filter (4). How-
ever, the major part of the air is forced down
through a large HEPA filter (5), in a vertical flow
into the work area (6). This vertical flow (lam-
inar flow) combines with the negative pressure
from the blower to draw in enough make-up
from the room to replace that exhausted
above. The make-up air (7) is pulled through
vents at the edge of the hood opening and is
drawn down to the blower without contacting
the work area. It combines with the filtered air
and is recirculated through the HEPA filters.
The laminar flow draws off any contaminating
particles emanating from the work area. HEPA
filters are 99.i9% efficient in removing parti-
cles 0.3 jjm diameter or larger, by the OOP test.
5.1.4 Selection of a Cabinet
The partial barrier cabinet with open front
gives some protection to the worker and the
laboratory environment but does hot protect
the cultures. With the glove panel in place, it
protects the worker and adjacent laboratory
area. The absolute barrier and laminar flow
cabinets provide the greatest protection to the
worker and the cultures.
For routine water bacteriology and limited
work with pathogens, a partial barrier cabinet
with glove panel can be used. If a significant
portion of the workload involves pathogenic
microorganisms, a gas-tight absolute barrier
cabinet with glove ports or laminar flow cabi-
net is recommended. These provide protection
of cultures as well as the worker and the work
environment. Because laminar flow cabinets
do not require glove openings, yet do protect
personnel and culture work and are easy to
use, they are recommended for all but the most
hazardous microbiological operations.
5.2 Biohazard Identification
5.2.1 The revised Federal Occupational
Safety and Health Act of 1972 requires biolog-
ical hazard signs and tags to signify the actual
or potential biological hazard (1, 10). The haz-
ards are defined as infectious agents that
present a risk to human well-being. These
signs and tags are used to identify equipment,
containers, rooms, materials, experimental an-
imals, or combinations of the above, which
contain or are contaminated with viable haz-
ardous agents.
5.2.2 The biological or biohazard symbol
design is shown in Figure V-C-2. It has a fluo-
rescent orange or orange-red color, and may
contain appropriate wording to indicate the
nature or identity of the hazard, the name of
the individual responsible for its control, pre-
cautionary information, etc. The wording must
not be superimposed on the symbol. Back-
ground color is optional, but enough contrast
must be provided so that the symbol can be
clearly defined.
6. Safety Check List
The laboratory safety check list that fol-
lows is provided as a guide for a laboratory to
incorporate wholly or in part into its own safety
program.
SAFETY
269
image:
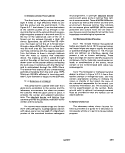 FIGURE V-C-1. Laminar Flow Cabinet.
270
MICROBIOLOGICAL MANUAL 1978
image:
FIGURE V-C-1. Laminar Flow Cabinet.
270
MICROBIOLOGICAL MANUAL 1978
image:
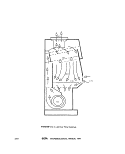 CAUTION
BIOLOGICAL
HAZARD
FIGURE V-C-2. Example of Biohazard Sign.
SAFETY
271
image:
CAUTION
BIOLOGICAL
HAZARD
FIGURE V-C-2. Example of Biohazard Sign.
SAFETY
271
image:
 Safety Check List
fcr Microbiological Water Laboratories
Survey By:
Laboratory:
Location:
Date:
Code: S=Satisfactory, U —Unsatisfactory
1. Administrative Considerations
(a) Laboratory has a formal documented safety program.
(b) Each worker has a copy of the safety program.
(c) Employees are aware of procedures for reporting accidents
and unsafe conditions.
(d) New employees are instructed on laboratory safety.
(e) Joint supervisor-employee safety committee has been estab-
lished to identify potential laboratory hazards.
(f) Records are maintained of accidents and consequences.
(g) Name and phone number of the supervisor and an alternate are
posted at door of the laboratories so he may be contacted
in case of an emergency.
(h) Laboratory supervisor and at least one other permanent
employee have attended appropriate first aid courses. If
so, when:
(date)
{i} Emergency telephone numbers for fire, ambulance, health
centers, and poison control center are placed in a conspic-
uous location near the telephone.
(j) Employees know the location of first aid supplies.
(k) Emergency first aid charts, and hazardous agents charts
are posted in the laboratory.
(1) Fire evacuation plan is established for the laboratory
and is posted In a conspicuous location.
2. Personal Conduct
(a) Personal clothing is stored outside of the microbiology
laboratory.
(b) Lab coats and street clothes are kept in separate
lockers.
272 SEr¥\ MICROBIOLOGICAL MANUAL 1978
image:
Safety Check List
fcr Microbiological Water Laboratories
Survey By:
Laboratory:
Location:
Date:
Code: S=Satisfactory, U —Unsatisfactory
1. Administrative Considerations
(a) Laboratory has a formal documented safety program.
(b) Each worker has a copy of the safety program.
(c) Employees are aware of procedures for reporting accidents
and unsafe conditions.
(d) New employees are instructed on laboratory safety.
(e) Joint supervisor-employee safety committee has been estab-
lished to identify potential laboratory hazards.
(f) Records are maintained of accidents and consequences.
(g) Name and phone number of the supervisor and an alternate are
posted at door of the laboratories so he may be contacted
in case of an emergency.
(h) Laboratory supervisor and at least one other permanent
employee have attended appropriate first aid courses. If
so, when:
(date)
{i} Emergency telephone numbers for fire, ambulance, health
centers, and poison control center are placed in a conspic-
uous location near the telephone.
(j) Employees know the location of first aid supplies.
(k) Emergency first aid charts, and hazardous agents charts
are posted in the laboratory.
(1) Fire evacuation plan is established for the laboratory
and is posted In a conspicuous location.
2. Personal Conduct
(a) Personal clothing is stored outside of the microbiology
laboratory.
(b) Lab coats and street clothes are kept in separate
lockers.
272 SEr¥\ MICROBIOLOGICAL MANUAL 1978
image:
 (c) Laboratory coats are worn at all times in the laboratory-
id) Germicidal soap or medicated surgical sponges are available
for employees' use.
(e) Preparing, eating or drinking food and beverages are not
permitted in the laboratory.
(f) Smoking or chewing gum are not permitted in the laboratory.
(g) Food or drink are not stored in laboratory refrigerators.
(h) Reading materials are not kept in the laboratory.
(i) Laboratory coats are not worn outside the lab.
(j) Employees who have cuts, abrasions, etc. on face, hands,
arms, etc. do not work with infectious agents.
3. Laboratory Equipment
(a) Bulb or mechanical device is used to pipet polluted water,
wastewater or other potentially infectious or toxic fluids.
(b) Pipets are immersed in disinfectant after use.
(c) Benches are maintained in clear and uncluttered condition.
(d) Centrifuge cups and rubber cushions are in good condition.
(e) A suitable disinfectant is available for immediate use.
(f) Blender is used with sealed container assembly.
(g) Microscopes, colony counters, etc. are kept out of the work
area.
(h) Water baths are clean and free of growth and deposits.
(i) Employees are instructed in the operation of the autoclave
and operating instructions are posted near the- autoclave.
(j) Autoclaves, hot air sterilizing ovens, water distilling
equipment, and centrifuges are checked routinely for safe
operation.
Give frequency and last date
Autoclave , - .,
Water still
Centrifuge L.
Hot Air Oven
(k) No broken, chipped or scratched glassware are in use.
(1) Broken glass is discarded in designated containers.
SAFETY 273
image:
(c) Laboratory coats are worn at all times in the laboratory-
id) Germicidal soap or medicated surgical sponges are available
for employees' use.
(e) Preparing, eating or drinking food and beverages are not
permitted in the laboratory.
(f) Smoking or chewing gum are not permitted in the laboratory.
(g) Food or drink are not stored in laboratory refrigerators.
(h) Reading materials are not kept in the laboratory.
(i) Laboratory coats are not worn outside the lab.
(j) Employees who have cuts, abrasions, etc. on face, hands,
arms, etc. do not work with infectious agents.
3. Laboratory Equipment
(a) Bulb or mechanical device is used to pipet polluted water,
wastewater or other potentially infectious or toxic fluids.
(b) Pipets are immersed in disinfectant after use.
(c) Benches are maintained in clear and uncluttered condition.
(d) Centrifuge cups and rubber cushions are in good condition.
(e) A suitable disinfectant is available for immediate use.
(f) Blender is used with sealed container assembly.
(g) Microscopes, colony counters, etc. are kept out of the work
area.
(h) Water baths are clean and free of growth and deposits.
(i) Employees are instructed in the operation of the autoclave
and operating instructions are posted near the- autoclave.
(j) Autoclaves, hot air sterilizing ovens, water distilling
equipment, and centrifuges are checked routinely for safe
operation.
Give frequency and last date
Autoclave , - .,
Water still
Centrifuge L.
Hot Air Oven
(k) No broken, chipped or scratched glassware are in use.
(1) Broken glass is discarded in designated containers.
SAFETY 273
image:
 (m) Electrical circuits are protected against overload with
circuit breakers or ground-fault breakers.
(n) Power cords, control switches and thermostats are in good
working order.
(o) Water taps are protected against back-siphoning.
4. Disinfection/Sterilization
(a) Proper disinfectant is used routinely to disinfect table
tops and carts before and after laboratory work.
(b) Receptacles of contaminated items are marked.
(cj Performance checks of autoclaves, gas sterilizers and hot air
ovens are conducted with the use of spore strips, spore
ampuls, indicators, etc.
Item Frequency Last Date
(d) Safety glasses are provided to employees.
(e) Safety glasses are used with toxic or corrosive agents and
during exposure to UV irradiation.
5. Biohazard Control
(a) Biohazard tags or signs are posted in hazardous areas.
(b) Safety cabinets of the appropriate type and class are
provided.
(c) Lab personnel are vaccinated for typhoid fever, tetanus
and polio.
(d) Floors are wet-mopped weekly, with a disinfectant solution.
(e) Personnel are trained in the proper procedures for handling
lyophilized cultures where used.
6. General Handling and Storage of Chemicals and Gases
(a) Containers of reagents and chemicals are labelled properly.
fb) Flammable solvents are stored in an approved storage
cabinet or well-ventilated area away from oil burners,
hot plates, etc.
{c} Bottle carriers are provided for hazardous substances.
274 SEPA MICROBIOLOGICAL MANUAL 1978
image:
(m) Electrical circuits are protected against overload with
circuit breakers or ground-fault breakers.
(n) Power cords, control switches and thermostats are in good
working order.
(o) Water taps are protected against back-siphoning.
4. Disinfection/Sterilization
(a) Proper disinfectant is used routinely to disinfect table
tops and carts before and after laboratory work.
(b) Receptacles of contaminated items are marked.
(cj Performance checks of autoclaves, gas sterilizers and hot air
ovens are conducted with the use of spore strips, spore
ampuls, indicators, etc.
Item Frequency Last Date
(d) Safety glasses are provided to employees.
(e) Safety glasses are used with toxic or corrosive agents and
during exposure to UV irradiation.
5. Biohazard Control
(a) Biohazard tags or signs are posted in hazardous areas.
(b) Safety cabinets of the appropriate type and class are
provided.
(c) Lab personnel are vaccinated for typhoid fever, tetanus
and polio.
(d) Floors are wet-mopped weekly, with a disinfectant solution.
(e) Personnel are trained in the proper procedures for handling
lyophilized cultures where used.
6. General Handling and Storage of Chemicals and Gases
(a) Containers of reagents and chemicals are labelled properly.
fb) Flammable solvents are stored in an approved storage
cabinet or well-ventilated area away from oil burners,
hot plates, etc.
{c} Bottle carriers are provided for hazardous substances.
274 SEPA MICROBIOLOGICAL MANUAL 1978
image:
 (d) Gas cylinders are securely clamped to a firm support.
(e) Toxic chemicals are clearly marked poison or toxic.
7. Emergency Precautions
(a) Foam and carbon dioxide fire extinguishers are installed
within easy access to laboratory and are properly
maintained. Frequency
(b) Eye wash stations , showers , oxygen
respirators , and fire blankets are available
within easy access.
(c) Fire exits are marked clearly.
(d) First aid kits are available and in good condition.
(e) At least one full-time employee is trained in first aid.
(f) Source of medical assistance is available and known to
employees.
8. Suggested Areas of Improvement:
9- General Comments:
(Signature of Installation Officer) (date)
SAFETY
275
image:
(d) Gas cylinders are securely clamped to a firm support.
(e) Toxic chemicals are clearly marked poison or toxic.
7. Emergency Precautions
(a) Foam and carbon dioxide fire extinguishers are installed
within easy access to laboratory and are properly
maintained. Frequency
(b) Eye wash stations , showers , oxygen
respirators , and fire blankets are available
within easy access.
(c) Fire exits are marked clearly.
(d) First aid kits are available and in good condition.
(e) At least one full-time employee is trained in first aid.
(f) Source of medical assistance is available and known to
employees.
8. Suggested Areas of Improvement:
9- General Comments:
(Signature of Installation Officer) (date)
SAFETY
275
image:
 REFERENCES
1. 29 Code of Federal Regulations (CFR) Part 1910, "Occupational Safety and Health Standards"
and Amendments.
2. Occupational Health and Safety Administration, 1974. Provisions for Federal Worker Safety and
Health, OSHA(October, 1974), Reference File 41:6241
3, American Public Health Association, 1963. Diagnostic Procedures and Reagents, (4th ed.),
APHA, Inc. pp. 89.
4. Pike, R. M., 1976. Laboratory-associated infections: summary and analysis of 3921 cases. Health
Laboratory Science, 13:105.
6. National Field Investigation Center, 1973. NFIC-Denver Safety Manual, NFIC-Denver, EPA,
Denver, CO. EPA 330/9-74-002 (In revision).
6. Wedum.A, G., 1961. Control of laboratory airborne infection. Bacterial Reviews 25.
7. Reitman, M. and A. G. Wedum, 1971. Infectious hazards of common microbiological techniques.
In: Handbook of Laboratory Safety. (N. V. Steere, ed.). The Chemical Rubber Co., Cleveland, OH
pp.~63~3~I
8. Shapton, D. A. and R. G. Board, Ed. 1972. In:Safety in Microbiology. Academic Press, New York,
NY.
9. Steere, N.V., editor, 1971. Handbook of Laboratory Safety. The Chemical Rubber Co., Cleveland,
OH.
10. Manufacturing Chemists Association, 1975. Laboratory Waste Disposal Manual, Washington,
DC. •
11. US Public Health Service, 1974. National Institutes of Health, Biohazards Safety Guide, USPHS,
DHEW, GPO 1740-00383.
12. U.S. Environmental Protection Agency, 1977. Occupational Health and Safety Manual, TN5
(9-12-77).
13. Runkle, K. S. and G. B. Phillips, Ed. 1969. Mlcrobial Contamination Control Facilities. Van
Nostrand Reinhold Co., New York, NY.
276 EBI\ MICROBIOLOGICAL MANUAL 1978
image:
REFERENCES
1. 29 Code of Federal Regulations (CFR) Part 1910, "Occupational Safety and Health Standards"
and Amendments.
2. Occupational Health and Safety Administration, 1974. Provisions for Federal Worker Safety and
Health, OSHA(October, 1974), Reference File 41:6241
3, American Public Health Association, 1963. Diagnostic Procedures and Reagents, (4th ed.),
APHA, Inc. pp. 89.
4. Pike, R. M., 1976. Laboratory-associated infections: summary and analysis of 3921 cases. Health
Laboratory Science, 13:105.
6. National Field Investigation Center, 1973. NFIC-Denver Safety Manual, NFIC-Denver, EPA,
Denver, CO. EPA 330/9-74-002 (In revision).
6. Wedum.A, G., 1961. Control of laboratory airborne infection. Bacterial Reviews 25.
7. Reitman, M. and A. G. Wedum, 1971. Infectious hazards of common microbiological techniques.
In: Handbook of Laboratory Safety. (N. V. Steere, ed.). The Chemical Rubber Co., Cleveland, OH
pp.~63~3~I
8. Shapton, D. A. and R. G. Board, Ed. 1972. In:Safety in Microbiology. Academic Press, New York,
NY.
9. Steere, N.V., editor, 1971. Handbook of Laboratory Safety. The Chemical Rubber Co., Cleveland,
OH.
10. Manufacturing Chemists Association, 1975. Laboratory Waste Disposal Manual, Washington,
DC. •
11. US Public Health Service, 1974. National Institutes of Health, Biohazards Safety Guide, USPHS,
DHEW, GPO 1740-00383.
12. U.S. Environmental Protection Agency, 1977. Occupational Health and Safety Manual, TN5
(9-12-77).
13. Runkle, K. S. and G. B. Phillips, Ed. 1969. Mlcrobial Contamination Control Facilities. Van
Nostrand Reinhold Co., New York, NY.
276 EBI\ MICROBIOLOGICAL MANUAL 1978
image:
 PART V. LABORATORY MANAGEMENT
SECTION D LEGAL CONSIDERATIONS
This Section Is intended to guide practic-
ing microbiologists in assessment of their re-
sponsibilities and role under the three federal
laws on water quality. It is not intended as
formal legal guidance or as representative of
official legal position. It is based on the three
Federal laws on water quality, (1, 2, and 3), on
A Primer on the Law, Evidence and Manage-
ment of Federal Water Pollution Control Cases,
Legal Support Division, US EPA May 1972 (4)
and on "Enforcement Activities," David I. She-
droff, in Proceedings of the First Microbiology
Seminar on Standardization of Methods, US
EPA, March 1973 (5). Lawyers should be con-
sulted for the exact interpretation of the laws
and their applications.
The Section describes the portions of the
Federal laws on water quality that are relevant
to microbiologists and relates analytical me-
thods and record-keeping to these laws. It also
shows how the analytical results become evi-
dence in administrative or court proceedings
and will help the analyst to understand his role
as a witness. A brief outline of the contents of
the Section follows:
1. Enabling Legislation (Federal
Laws Dealing with Water
Quality)
1.1 Scope and Application
1.2 Federal Laws Dealing
with Water Quality
1.3 Federal Water Pollution
Control Act Amend-
ments of 1972 Public
Law 92-500
1.4 The Marine Protection,
Research and Sanctu-
aries Act of 1972,
Public Law 92-532
1.5 The Safe Drinking Water
Act of 1974, Public
Law 93-523
2. Application of the Laws
to Microbiology
2.1 Gathering and Preserving
Evidence
2.2 Admissibility of Evidence
2.3 Preparation for
Testimony
2.4 Testimony in Court
1. Enabling Legislation
1.1 Scope and Application: To under-
stand the role of microbiology in environmen-
tal and compliance monitoring, it is necessary
to briefly describe EPA's responsibilities for
development of methodology, assistance to
the States, promulgation of criteria and guide-
lines, establishment of compliance with per-
mits and conduct of enforcement actions.
Much of the work of the microbiologist in EPA
will involve generation of data to determine
compliance with the Federal laws on water
quality. These laws with related regulations
limit the choice of analytical technique and
sometimes require more documentation than
the analyst might otherwise provide.
LEGAL ASPECTS
277
image:
PART V. LABORATORY MANAGEMENT
SECTION D LEGAL CONSIDERATIONS
This Section Is intended to guide practic-
ing microbiologists in assessment of their re-
sponsibilities and role under the three federal
laws on water quality. It is not intended as
formal legal guidance or as representative of
official legal position. It is based on the three
Federal laws on water quality, (1, 2, and 3), on
A Primer on the Law, Evidence and Manage-
ment of Federal Water Pollution Control Cases,
Legal Support Division, US EPA May 1972 (4)
and on "Enforcement Activities," David I. She-
droff, in Proceedings of the First Microbiology
Seminar on Standardization of Methods, US
EPA, March 1973 (5). Lawyers should be con-
sulted for the exact interpretation of the laws
and their applications.
The Section describes the portions of the
Federal laws on water quality that are relevant
to microbiologists and relates analytical me-
thods and record-keeping to these laws. It also
shows how the analytical results become evi-
dence in administrative or court proceedings
and will help the analyst to understand his role
as a witness. A brief outline of the contents of
the Section follows:
1. Enabling Legislation (Federal
Laws Dealing with Water
Quality)
1.1 Scope and Application
1.2 Federal Laws Dealing
with Water Quality
1.3 Federal Water Pollution
Control Act Amend-
ments of 1972 Public
Law 92-500
1.4 The Marine Protection,
Research and Sanctu-
aries Act of 1972,
Public Law 92-532
1.5 The Safe Drinking Water
Act of 1974, Public
Law 93-523
2. Application of the Laws
to Microbiology
2.1 Gathering and Preserving
Evidence
2.2 Admissibility of Evidence
2.3 Preparation for
Testimony
2.4 Testimony in Court
1. Enabling Legislation
1.1 Scope and Application: To under-
stand the role of microbiology in environmen-
tal and compliance monitoring, it is necessary
to briefly describe EPA's responsibilities for
development of methodology, assistance to
the States, promulgation of criteria and guide-
lines, establishment of compliance with per-
mits and conduct of enforcement actions.
Much of the work of the microbiologist in EPA
will involve generation of data to determine
compliance with the Federal laws on water
quality. These laws with related regulations
limit the choice of analytical technique and
sometimes require more documentation than
the analyst might otherwise provide.
LEGAL ASPECTS
277
image:
 1.2 Federal Laws Dealing with Water
duality (6)
Congress has passed three principal laws
on water quality which concern the microbiol-
ogist: The Federal Water Pollution Control Act,
as amended; the Marine Protection, Research
and Sanctuaries Act, commonly known as the
Ocean Dumping Law; and the Safe Drinking
Water Act. These acts have a common theme:
1.2.1 Legislation is passed by Congress
providing the general framework of Federal
Interest and control of an area of the environ-
ment. EPA promulgates general rules describ-
ing, requiring and/or limiting the qualities of
wastewater discharges or drinking water.
1,2.2 EPA or appropriate state agencies
issue permits placing specific limitations on
discharges, establish Maximum Contaminant
Levels in drinking and ambient water, and pro-
vide general rules controlling underground
injections.
1.2.3 Permittees or others subject to the
particular act may be required to self-monitor
their discharges, and report findings to the
State and/or EPA.
1.2.4 Provisions are made for enforce-
ment actions when permit, variance, or abate-
ment schedules are violated.
1.3 Federal Water Pollution Control Act
Amendments of 1972, Public Law 92-500
(D
(See Appendix A for fisting and summary
of pertinent sections of the law, and the related
microbiological activities).
1.3.1 Background and Summary (6): This
Is the most comprehensive program ever en-
acted to prevent, reduce, and eventually elimi-
nate water pollution. The two general goals of
the Act are: To achieve wherever possible b*y
July 1, 1983, water that is clean enough for
recreational uses and for the protection of
aquatic life; and by 1985 to have no dis-
charges of pollutants into the Nation's waters.
The law extends the Federal program to all
U.S. surface waters, not just interstate waters.
The States have submitted water quality stan-
dards for intrastate waters to EPA for approval
or revision. While the States retain primary
responsibility to prevent, reduce, and elimi-
nate water pollution they must now do so
within the framework of a new national pro-
gram. The law sets forth guidelines for the
control of industrial and municipal water pollu-
tion, expands water quality standards, estab-
lishes a new system of permits for discharges
into the Nation's waters, and creates stringent
enforcement machinery and heavier penalties
for violations.
1.3.2 The Regulatory Scheme (6): Under
this act the States establish the minimum
water quality standards for streams and these
standards are approved by EPA. The Adminis-
trator determines minimum acceptable efflu-
ent limits for municipal treatment plants and
for specific industries based on current tech-
nology! These limits become more restrictive
overtime. Using the more stringent water qual-
ity or treatment limitations, the Administrator
or State determines specific limits for a dis-
charge. These limits set forth in a'permit for a
direct discharge are enforceable by civil pen-
alty, civil or criminal process, or revocation of
permit.
A microbiologist may be called as a wit-
ness to prove the violation of the permit by
direct discharge or to prove the violation of
specific limitations placed on industrial firms
discharging to municipal plants. Generally
these microbiological limitations will relate to
discharges from municipal treatment plants or
from industries such as food processors.
Other enforcement activities for the micro-
biologist under the FWPCA include a permit
program covering sewage sludge discharges
and standards for discharges from marine san-
itation devices and their performance (40
CFR/40 Amendments, 41 No. 20, January 29,
1976). If such permits or standards contain
microbiological limitations, the microbiologist
may be called on to prove or disprove a viola-
tion (Section 405). Standards have been set
for discharges from marine sanitation devices
278
MICROBIOLOGICAL MANUAL 1978
image:
1.2 Federal Laws Dealing with Water
duality (6)
Congress has passed three principal laws
on water quality which concern the microbiol-
ogist: The Federal Water Pollution Control Act,
as amended; the Marine Protection, Research
and Sanctuaries Act, commonly known as the
Ocean Dumping Law; and the Safe Drinking
Water Act. These acts have a common theme:
1.2.1 Legislation is passed by Congress
providing the general framework of Federal
Interest and control of an area of the environ-
ment. EPA promulgates general rules describ-
ing, requiring and/or limiting the qualities of
wastewater discharges or drinking water.
1,2.2 EPA or appropriate state agencies
issue permits placing specific limitations on
discharges, establish Maximum Contaminant
Levels in drinking and ambient water, and pro-
vide general rules controlling underground
injections.
1.2.3 Permittees or others subject to the
particular act may be required to self-monitor
their discharges, and report findings to the
State and/or EPA.
1.2.4 Provisions are made for enforce-
ment actions when permit, variance, or abate-
ment schedules are violated.
1.3 Federal Water Pollution Control Act
Amendments of 1972, Public Law 92-500
(D
(See Appendix A for fisting and summary
of pertinent sections of the law, and the related
microbiological activities).
1.3.1 Background and Summary (6): This
Is the most comprehensive program ever en-
acted to prevent, reduce, and eventually elimi-
nate water pollution. The two general goals of
the Act are: To achieve wherever possible b*y
July 1, 1983, water that is clean enough for
recreational uses and for the protection of
aquatic life; and by 1985 to have no dis-
charges of pollutants into the Nation's waters.
The law extends the Federal program to all
U.S. surface waters, not just interstate waters.
The States have submitted water quality stan-
dards for intrastate waters to EPA for approval
or revision. While the States retain primary
responsibility to prevent, reduce, and elimi-
nate water pollution they must now do so
within the framework of a new national pro-
gram. The law sets forth guidelines for the
control of industrial and municipal water pollu-
tion, expands water quality standards, estab-
lishes a new system of permits for discharges
into the Nation's waters, and creates stringent
enforcement machinery and heavier penalties
for violations.
1.3.2 The Regulatory Scheme (6): Under
this act the States establish the minimum
water quality standards for streams and these
standards are approved by EPA. The Adminis-
trator determines minimum acceptable efflu-
ent limits for municipal treatment plants and
for specific industries based on current tech-
nology! These limits become more restrictive
overtime. Using the more stringent water qual-
ity or treatment limitations, the Administrator
or State determines specific limits for a dis-
charge. These limits set forth in a'permit for a
direct discharge are enforceable by civil pen-
alty, civil or criminal process, or revocation of
permit.
A microbiologist may be called as a wit-
ness to prove the violation of the permit by
direct discharge or to prove the violation of
specific limitations placed on industrial firms
discharging to municipal plants. Generally
these microbiological limitations will relate to
discharges from municipal treatment plants or
from industries such as food processors.
Other enforcement activities for the micro-
biologist under the FWPCA include a permit
program covering sewage sludge discharges
and standards for discharges from marine san-
itation devices and their performance (40
CFR/40 Amendments, 41 No. 20, January 29,
1976). If such permits or standards contain
microbiological limitations, the microbiologist
may be called on to prove or disprove a viola-
tion (Section 405). Standards have been set
for discharges from marine sanitation devices
278
MICROBIOLOGICAL MANUAL 1978
image:
 and their performance (Federal Register 41,
January, 1976).
1.3.3 Analytical Guidelines and Criminal
Sanctions (6)
Analytical guidelines and criminal sanc-
tions for improper analysis or furnishing false
results are included in the Act. Section 304 (g)
calls for the Administrator to promulgate
"...guidelines establishing test procedures for
the analysis of pollutants...". The initial guide-
lines for monitoring the National Pollution Dis-
charge Elimination System (NPDES) (7) contain
test procedures for total coliforms, fecal eoli-
forms, and fecal streptococci using methods
referenced from the 14th Edition of Standard
Methods(8). The guidelines defining second-
ary treatment originally included fecal coli-
form limitations, and permits issued to munici-
pal plants until July, 1976 contain such limita-
tions. These regulations were amended in
July, 1976 and no longer contain microbiolog-
ical limitations. Such limitations may still be
required in permits issued after that date if
required for compliance with water quality
standards or if such parameters are required in
order to comply with State law. Guidelines for
certain food related industries include fecal
coliforms as a limiting parameter. The
amended guidelines for municipal and indus-
trial wastewaters place restrictions on the
measurement of fecal coliforms in chlorinated
or toxic wastewaters. For these wastewaters
the membrane filter or most probable number
(MPN) methods may be used, but the MPN is.
the method of choice when the results may be
involved in controversy. (Refer to the amend-
ments to 40 CFR Part 136 (9)). The methods
are described in Part III, B, C and D,
Microbiologists performing analyses re-
quired under this Act should be aware of the
specialized enforcement procedures in Sec-
tion 309 (c) of FWPCA relating to analyses and
reports of results: "Any person who knowingly
makes any false statement, representation, or
certification in any application, record, report,
plan, or other document filed or required to be
maintained under.this Act or who falsifies,
tampers with, or knowingly renders inaccurate
any monitoring device or method required to
be maintained under this Act, shall upon con-
viction, be punished by a fine of not more than
$10,000, or by imprisonment for not more
than six months, or by both."
1.3.4 Alternative test procedures are per-
mitted for use in NPDES, 40 CFR Part 136 and
in the Drinking Water regulations under 40
CFR Part 141. Information on application for
use of alternative test procedures is given in
these issues of CFR. The details of the compar-
ative testing which may be required are given
in this Manual, under Quality Control, Part IV-C.
1.4 The Marine Protection, Research
and Sanctuaries Act of 1972, (Ocean-
Dumping) Public Law 92-532 (2)
(See Appendix A for listing and summary
of pertinent sections of the law, and the related
microbiological activities).
1.4.1 The Regulatory Scheme: The Marine
Protection, Research and Sanctuaries Act of
1972 regulates the dumping into ocean
waters of all types of materials which would
adversely affect human health and welfare, the
marine environment, ecological systems or
economic development
This Act bans dumping of radiological,
chemical or biological warfare agents and
high-level radioactive wastes. With one excep-
tion, permits are required for transporting ma-
terials for ocean dumping and for the dumping
itself. The Corps of Engineers issues permits
for dredge spoils; EPA issues permits for all
other materials (see Appendix A). The excep-
tion is fish-processing wastes. Since they are a
natural ocean waste product, no permit is re-
quired unless harbors or other protected
waters are involved as the receiving waters, or
unless the EPA Administrator finds that such
deposits in certain offshore areas could endan-
ger health, the environment or ecological
systems.
In evaluating permit applications, EPA and
the Corps of Engineers must consider:
The need for the proposed dumping.
LEGAL ASPECTS
279
image:
and their performance (Federal Register 41,
January, 1976).
1.3.3 Analytical Guidelines and Criminal
Sanctions (6)
Analytical guidelines and criminal sanc-
tions for improper analysis or furnishing false
results are included in the Act. Section 304 (g)
calls for the Administrator to promulgate
"...guidelines establishing test procedures for
the analysis of pollutants...". The initial guide-
lines for monitoring the National Pollution Dis-
charge Elimination System (NPDES) (7) contain
test procedures for total coliforms, fecal eoli-
forms, and fecal streptococci using methods
referenced from the 14th Edition of Standard
Methods(8). The guidelines defining second-
ary treatment originally included fecal coli-
form limitations, and permits issued to munici-
pal plants until July, 1976 contain such limita-
tions. These regulations were amended in
July, 1976 and no longer contain microbiolog-
ical limitations. Such limitations may still be
required in permits issued after that date if
required for compliance with water quality
standards or if such parameters are required in
order to comply with State law. Guidelines for
certain food related industries include fecal
coliforms as a limiting parameter. The
amended guidelines for municipal and indus-
trial wastewaters place restrictions on the
measurement of fecal coliforms in chlorinated
or toxic wastewaters. For these wastewaters
the membrane filter or most probable number
(MPN) methods may be used, but the MPN is.
the method of choice when the results may be
involved in controversy. (Refer to the amend-
ments to 40 CFR Part 136 (9)). The methods
are described in Part III, B, C and D,
Microbiologists performing analyses re-
quired under this Act should be aware of the
specialized enforcement procedures in Sec-
tion 309 (c) of FWPCA relating to analyses and
reports of results: "Any person who knowingly
makes any false statement, representation, or
certification in any application, record, report,
plan, or other document filed or required to be
maintained under.this Act or who falsifies,
tampers with, or knowingly renders inaccurate
any monitoring device or method required to
be maintained under this Act, shall upon con-
viction, be punished by a fine of not more than
$10,000, or by imprisonment for not more
than six months, or by both."
1.3.4 Alternative test procedures are per-
mitted for use in NPDES, 40 CFR Part 136 and
in the Drinking Water regulations under 40
CFR Part 141. Information on application for
use of alternative test procedures is given in
these issues of CFR. The details of the compar-
ative testing which may be required are given
in this Manual, under Quality Control, Part IV-C.
1.4 The Marine Protection, Research
and Sanctuaries Act of 1972, (Ocean-
Dumping) Public Law 92-532 (2)
(See Appendix A for listing and summary
of pertinent sections of the law, and the related
microbiological activities).
1.4.1 The Regulatory Scheme: The Marine
Protection, Research and Sanctuaries Act of
1972 regulates the dumping into ocean
waters of all types of materials which would
adversely affect human health and welfare, the
marine environment, ecological systems or
economic development
This Act bans dumping of radiological,
chemical or biological warfare agents and
high-level radioactive wastes. With one excep-
tion, permits are required for transporting ma-
terials for ocean dumping and for the dumping
itself. The Corps of Engineers issues permits
for dredge spoils; EPA issues permits for all
other materials (see Appendix A). The excep-
tion is fish-processing wastes. Since they are a
natural ocean waste product, no permit is re-
quired unless harbors or other protected
waters are involved as the receiving waters, or
unless the EPA Administrator finds that such
deposits in certain offshore areas could endan-
ger health, the environment or ecological
systems.
In evaluating permit applications, EPA and
the Corps of Engineers must consider:
The need for the proposed dumping.
LEGAL ASPECTS
279
image:
 The effect on human health and welfare,
including economic, aesthetic and recrea-
tional values.
The effect on fisheries, resources, plank-
ton, fish, shellfish, wildlife, shorelines,
beaches and marine ecosystems.
The effect of dumping particular volumes
and concentrations of materials and the
persistence of the effect.
The effect on other uses such as scientific
study, fishing andtrther resource exploitation.
Appropriate locations and methods of dis-
posal or recycling, including land-based
alternatives and the probable impact of
requiring the use of such alternate loca-
tions or methods.
The law charges the Secretary of Com-
merce with responsibility for a comprehensive
and continuing research program involving
the possible long-range effects of pollution,
overfishing or man-induced changes in ocean
ecosystems. Research efforts are to be coordi-
nated with EPA and the Coast Guard.
The basic research objective of the law is to
find ways to minimize or to end all ocean dumping
within five years. It will cover the effects of dump-
Ing materials into ocean or coastal waters and
into the Great Lakes or their connecting waters.
1-4-2 Civil and Criminal Sanctions: The
law provides for both civil and criminal penal-
ties for violations but there is no penalty for
dumping materials from a vessel as emer-
gency action to safeguard life at sea. Any indi-
vidual may initiate a civil suit to enjoin any
person, including Federal, State and local gov-
ernment or agency, who is alleged to be violat-
ing any prohibition, limitations, criterion or
permit established or issued under this law.
1.5 The Safe Drinking Water Act of
1974, Public Law 93-523 (3)
(See Appendix A for listing and summary
of pertinent sections of the law, and the related
microbiological activities).
1.5.1 National Objectives: This Act has as
its main objective the establishment and en-
forcement of primary drinking water stan-
dards. These standards, which are to be en-
forced by the States, will apply to public water
systems and specify maximum levels of: 1)
Those contaminants which may have adverse
health effects {primary standards) and, 2) those
contaminants which should be limited to pro-
tect the public welfare (secondary standards).
The protection of underground drinking water
sources by regulation of State underground
injection control programs and the appoint-
ment of a 15-member National Drinking Water
Advisory Council are also provided for under
this Law.
1.5.2 The Regulatory Scheme
Interim Primary Drinking Water Regula-
tions: The Administrator of EPA proposed na-
tional interim primary drinking water regula-
tions 90 days after enactment of the Law. The
interim regulations were promulgated in De-
cember, 1975(10).
Secondary Drinking Water Regulations:
Following the enactment date of this Law, pro-
posed secondary regulations will address the
aesthetic characteristics of water such as
taste, appearance, etc. Ninety days later these
secondary regulations will be promulgated,
but will not be enforceable.
Study of Maximum Contaminant Levels in
Drinking Water: The National Academy of Sci-
ences conducted a study to determine the
Maximum Contaminant Levels which should
be recommended to protect human health.
The study investigated contaminants that
might have adverse health effects but the lev-
els of which could not be determined in drink-
ing water. The results of the above study are
reported to Congress. EPA then publishes pro-
posals in the Federal Register for recom-
mended maximum levels, which will subse-
quently be promulgated.
Revised Primary Drinking Water Regula-
tions: Following the National Academy of Sci-
ences study, EPA proposes revised primary
drinking water regulations to be adopted in
280
&EPA MICROBIOLOGICAL MANUAL 1978
image:
The effect on human health and welfare,
including economic, aesthetic and recrea-
tional values.
The effect on fisheries, resources, plank-
ton, fish, shellfish, wildlife, shorelines,
beaches and marine ecosystems.
The effect of dumping particular volumes
and concentrations of materials and the
persistence of the effect.
The effect on other uses such as scientific
study, fishing andtrther resource exploitation.
Appropriate locations and methods of dis-
posal or recycling, including land-based
alternatives and the probable impact of
requiring the use of such alternate loca-
tions or methods.
The law charges the Secretary of Com-
merce with responsibility for a comprehensive
and continuing research program involving
the possible long-range effects of pollution,
overfishing or man-induced changes in ocean
ecosystems. Research efforts are to be coordi-
nated with EPA and the Coast Guard.
The basic research objective of the law is to
find ways to minimize or to end all ocean dumping
within five years. It will cover the effects of dump-
Ing materials into ocean or coastal waters and
into the Great Lakes or their connecting waters.
1-4-2 Civil and Criminal Sanctions: The
law provides for both civil and criminal penal-
ties for violations but there is no penalty for
dumping materials from a vessel as emer-
gency action to safeguard life at sea. Any indi-
vidual may initiate a civil suit to enjoin any
person, including Federal, State and local gov-
ernment or agency, who is alleged to be violat-
ing any prohibition, limitations, criterion or
permit established or issued under this law.
1.5 The Safe Drinking Water Act of
1974, Public Law 93-523 (3)
(See Appendix A for listing and summary
of pertinent sections of the law, and the related
microbiological activities).
1.5.1 National Objectives: This Act has as
its main objective the establishment and en-
forcement of primary drinking water stan-
dards. These standards, which are to be en-
forced by the States, will apply to public water
systems and specify maximum levels of: 1)
Those contaminants which may have adverse
health effects {primary standards) and, 2) those
contaminants which should be limited to pro-
tect the public welfare (secondary standards).
The protection of underground drinking water
sources by regulation of State underground
injection control programs and the appoint-
ment of a 15-member National Drinking Water
Advisory Council are also provided for under
this Law.
1.5.2 The Regulatory Scheme
Interim Primary Drinking Water Regula-
tions: The Administrator of EPA proposed na-
tional interim primary drinking water regula-
tions 90 days after enactment of the Law. The
interim regulations were promulgated in De-
cember, 1975(10).
Secondary Drinking Water Regulations:
Following the enactment date of this Law, pro-
posed secondary regulations will address the
aesthetic characteristics of water such as
taste, appearance, etc. Ninety days later these
secondary regulations will be promulgated,
but will not be enforceable.
Study of Maximum Contaminant Levels in
Drinking Water: The National Academy of Sci-
ences conducted a study to determine the
Maximum Contaminant Levels which should
be recommended to protect human health.
The study investigated contaminants that
might have adverse health effects but the lev-
els of which could not be determined in drink-
ing water. The results of the above study are
reported to Congress. EPA then publishes pro-
posals in the Federal Register for recom-
mended maximum levels, which will subse-
quently be promulgated.
Revised Primary Drinking Water Regula-
tions: Following the National Academy of Sci-
ences study, EPA proposes revised primary
drinking water regulations to be adopted in
280
&EPA MICROBIOLOGICAL MANUAL 1978
image:
 180 days and to be effective 18 months after
promulgation. These primary drinking water
regulations specify a Maximum Contaminant
Level or require the use of treatment tech-
niques for each contaminant in lieu of
Maximum Contaminant Levels.
Regulation of State Underground Injec-
tion Control Programs: The Act provides for
regulations which contain minimum require-
ments for effective (State) programs to prevent
underground injection which endangers drink-
ing sources. To be approved, a State program
must prohibit underground injection without a
state permit within three years after the enact-
ment date of the Law. Applicants for under-
ground injection permits must satisfy the State
that the injection will not endanger drinking
water sources. No regulations are promul-
gated that allow underground injection which
endangers drinking water sources.
1.5.3 Quality Control Requirement
In the Safe Drinking Water Act, the Admin-
istrator can specify analytical methodology
which includes quality control and testing
procedures.
1.5.4 Enforcement
(a) State Primary Enforcement Responsi-
bility: A State has the primary enforcement
responsibility for protection of drinking water
if it has a program acceptable to EPA. The EPA
Administrator must determine that the State
has drinking water regulations no less strin-
gent than Federal regulations. The State may
permit variances and exemptions as pre-
scribed in the Law, and must have an adequate
plan for providing safe drinking water under
emergency circumstances. In addition, the
State must have monitoring programs that
comply with Federal requirements and must
possess sufficient enforcement authority.
Approval by the EPA Administrator of the
State's underground injection program gives
to the State the primary enforcement responsi-
bility until such time as the Administrator de-
termines that the State no longer meets its
requirements underthe Act.
C3) fgJ.eJTJ.[ Enforcement: If a State fails to
assure enforcement of drinking water regula-
tions, the EPA Administrator notifies the State
concerning the violation, and provides advice
and technical assistance to the State and to
the public water system that is in non-
compliance, to bring the system into
compliance.
1.5.5 Civil and Criminal Sanctions: The
EPA Adiministrator may bring a civil action to
require compliance with either the national
primary drinking water regulations or with any
requirement of an applicable underground in-
jection control program. A maximum penalty
of $5,000 per day may be imposed by the
court for each day in which a violation occurs.
*2. Application of the Laws to Microbiology
2.1 Gathering and Preserving Evidence
2.1.1 Stream Standards: To establish a
standard violation, it is necessary to show the
navigable waterway is below approved water
quality standards. Water quality criteria spec-
ify permissible levels of chemical and biologi-
cal constituents for receiving waters. It must
be demonstrated that the defendant's dis-
charge caused or contributed to a reduction in
receiving water quality below one or more
applicable standards. Samples should be col-
lected 1) upstream of the discharge, 2) at the
point of discharge and 3) downstream of the
discharge at a point after a reasonable mixing
zone.
Although all State water quality standards
include criteria for the same basic parameters,
there are differences among the states as to
the sampling and test procedures which must
be followed in order to establish a standards
violation. It is thus imperative that only the
testing method specified be used in order to
show that a particular state water quality stan-
dard has or has not been violated.
2.1.2 Effluent Standards: The Agency has
not provided specific guidance in sampling
LEGAL ASPECTS
281
image:
180 days and to be effective 18 months after
promulgation. These primary drinking water
regulations specify a Maximum Contaminant
Level or require the use of treatment tech-
niques for each contaminant in lieu of
Maximum Contaminant Levels.
Regulation of State Underground Injec-
tion Control Programs: The Act provides for
regulations which contain minimum require-
ments for effective (State) programs to prevent
underground injection which endangers drink-
ing sources. To be approved, a State program
must prohibit underground injection without a
state permit within three years after the enact-
ment date of the Law. Applicants for under-
ground injection permits must satisfy the State
that the injection will not endanger drinking
water sources. No regulations are promul-
gated that allow underground injection which
endangers drinking water sources.
1.5.3 Quality Control Requirement
In the Safe Drinking Water Act, the Admin-
istrator can specify analytical methodology
which includes quality control and testing
procedures.
1.5.4 Enforcement
(a) State Primary Enforcement Responsi-
bility: A State has the primary enforcement
responsibility for protection of drinking water
if it has a program acceptable to EPA. The EPA
Administrator must determine that the State
has drinking water regulations no less strin-
gent than Federal regulations. The State may
permit variances and exemptions as pre-
scribed in the Law, and must have an adequate
plan for providing safe drinking water under
emergency circumstances. In addition, the
State must have monitoring programs that
comply with Federal requirements and must
possess sufficient enforcement authority.
Approval by the EPA Administrator of the
State's underground injection program gives
to the State the primary enforcement responsi-
bility until such time as the Administrator de-
termines that the State no longer meets its
requirements underthe Act.
C3) fgJ.eJTJ.[ Enforcement: If a State fails to
assure enforcement of drinking water regula-
tions, the EPA Administrator notifies the State
concerning the violation, and provides advice
and technical assistance to the State and to
the public water system that is in non-
compliance, to bring the system into
compliance.
1.5.5 Civil and Criminal Sanctions: The
EPA Adiministrator may bring a civil action to
require compliance with either the national
primary drinking water regulations or with any
requirement of an applicable underground in-
jection control program. A maximum penalty
of $5,000 per day may be imposed by the
court for each day in which a violation occurs.
*2. Application of the Laws to Microbiology
2.1 Gathering and Preserving Evidence
2.1.1 Stream Standards: To establish a
standard violation, it is necessary to show the
navigable waterway is below approved water
quality standards. Water quality criteria spec-
ify permissible levels of chemical and biologi-
cal constituents for receiving waters. It must
be demonstrated that the defendant's dis-
charge caused or contributed to a reduction in
receiving water quality below one or more
applicable standards. Samples should be col-
lected 1) upstream of the discharge, 2) at the
point of discharge and 3) downstream of the
discharge at a point after a reasonable mixing
zone.
Although all State water quality standards
include criteria for the same basic parameters,
there are differences among the states as to
the sampling and test procedures which must
be followed in order to establish a standards
violation. It is thus imperative that only the
testing method specified be used in order to
show that a particular state water quality stan-
dard has or has not been violated.
2.1.2 Effluent Standards: The Agency has
not provided specific guidance in sampling
LEGAL ASPECTS
281
image:
 and test protocol to microbiologists working
with the effluent standards and compliance
monitoring. A protocol must vary with the way
in which the permits are written. The stan-
dards may set maximum values and average
values by the day, week, month, and year with-
out defining the number and kinds of sample
required to establish compliance with a given
standard. Specifications of numbers and types
of samples are needed to provide weekly,
monthly or yearly maxima or averages.
Each Regional Office of EPA has devel-
oped an approach to compliance monitoring.
Uniformity of sampling and testing schemes is
desirable for data validation and for compari-
son of data between different laboratories.
The need for uniformity is even more impor-
tant with the transfer of the responsibility to
the states for issuance of permits, as legally
permitted. Some states are following EPA-
Regional guidance while others are develop-
ing their own plans for compliance monitoring.
The sampling plan should select the sam-
pling techniques, volumes, frequency, replica-
tion, etc., to meet the standard being chal-
lenged. All sampling and analyses to verify
compliance with a particular standard should
be performed in the same fashion and with the
same frequency. Three rules for a good sam-
pling plan are: 1) fit the design to meet the
effluent standard, i.e., use a reasonable means
to obtain statistical validity 2) apply the plan
uniformly and 3) document the plan, indicate
its source and record its use.
2.1.3 Drinking Water Standards: The Safe
Drinking Act has established Maximum Contami-
nant Levels (MCL's) on an interim basis for com-
munity and non-community systems. The MCL's
are based primarily on the 1962 Public Health
Service Standards. For microbiology, the minimal
sampll/ig frequency per month is specified in
Title 40 Part 141. Samples shall be taken at
regular time intervals and in numbers propor-
tional to the populations served. Samples shall
also be taken at points representative of the
conditions in the distribution systems.
2.1.4 Constitutional Protections: Sample
evidence taken from the defendant's (indiv-
idual or corporate) property without his con-
sent cannot be introduced into evidence in
either a civil or a criminal case because of the
Fourth Amendment guarantee against unrea-
sonable searches and seizures. Consent need
not be obtained to take samples on the public
portions of a waterway, usually up to the ordi-
nary high water level (11). Almost all Fourth
Amendment objections can be prevented by
sending an advance, written notification of the
time, scope, and purpose of any proposed EPA
inspection, or sampling visit and by obtaining
the written consent of the party to be in-
spected (12). If a search warrant has not been
obtained, unannounced investigatory inspec-
tions may be made only if the voluntary con-
sent of a person in authority is secured (13).
2.2 Admissibility of Evidence
2.2.1 Types of Legal Action: Violations of
Public Laws 92-500, 92-532, or 93-523 can
result in civil penalties assessed by the Admin-
istrator, a hearing board, or a court; criminal
sanctions by a court; or a court order requiring
a discharge source to take or cease a particular
action. Except for civil penalties imposed by
the Administrator, formal hearing will be
required.
2.2.2 Authentication of Testimony: Au-
thentication as a condition precedent to ad-
missibility may require testimony under oath
(14). Witnesses are subject to cross-
examination. The form and admissibility of evi-
dence presented in Federal courts are clearly
defined in the Federal Rules of Civil Procedure
(15) and the Federal Rules of Evidence (14).
These formal rules of evidence may be par-
tially annulled for administrative hearings. Lab-
oratory records may not be acceptable evi-
dence without proof of authenticity.
The hearsay rule is one of the most direc-
tive statutes. It states that generally persons
may only testify to what they know personally
and that they must be subject to cross-
examination. However, some exceptions to the
hearsay rule are allowed. Evidence that would
normally be hearsay is admissible in the ad-
ministrative hearing, if it has probative value in
the opinion of the hearing officer. Also, evi-
282
**EPA MICROBIOLOGICAL MANUAL 1978
image:
and test protocol to microbiologists working
with the effluent standards and compliance
monitoring. A protocol must vary with the way
in which the permits are written. The stan-
dards may set maximum values and average
values by the day, week, month, and year with-
out defining the number and kinds of sample
required to establish compliance with a given
standard. Specifications of numbers and types
of samples are needed to provide weekly,
monthly or yearly maxima or averages.
Each Regional Office of EPA has devel-
oped an approach to compliance monitoring.
Uniformity of sampling and testing schemes is
desirable for data validation and for compari-
son of data between different laboratories.
The need for uniformity is even more impor-
tant with the transfer of the responsibility to
the states for issuance of permits, as legally
permitted. Some states are following EPA-
Regional guidance while others are develop-
ing their own plans for compliance monitoring.
The sampling plan should select the sam-
pling techniques, volumes, frequency, replica-
tion, etc., to meet the standard being chal-
lenged. All sampling and analyses to verify
compliance with a particular standard should
be performed in the same fashion and with the
same frequency. Three rules for a good sam-
pling plan are: 1) fit the design to meet the
effluent standard, i.e., use a reasonable means
to obtain statistical validity 2) apply the plan
uniformly and 3) document the plan, indicate
its source and record its use.
2.1.3 Drinking Water Standards: The Safe
Drinking Act has established Maximum Contami-
nant Levels (MCL's) on an interim basis for com-
munity and non-community systems. The MCL's
are based primarily on the 1962 Public Health
Service Standards. For microbiology, the minimal
sampll/ig frequency per month is specified in
Title 40 Part 141. Samples shall be taken at
regular time intervals and in numbers propor-
tional to the populations served. Samples shall
also be taken at points representative of the
conditions in the distribution systems.
2.1.4 Constitutional Protections: Sample
evidence taken from the defendant's (indiv-
idual or corporate) property without his con-
sent cannot be introduced into evidence in
either a civil or a criminal case because of the
Fourth Amendment guarantee against unrea-
sonable searches and seizures. Consent need
not be obtained to take samples on the public
portions of a waterway, usually up to the ordi-
nary high water level (11). Almost all Fourth
Amendment objections can be prevented by
sending an advance, written notification of the
time, scope, and purpose of any proposed EPA
inspection, or sampling visit and by obtaining
the written consent of the party to be in-
spected (12). If a search warrant has not been
obtained, unannounced investigatory inspec-
tions may be made only if the voluntary con-
sent of a person in authority is secured (13).
2.2 Admissibility of Evidence
2.2.1 Types of Legal Action: Violations of
Public Laws 92-500, 92-532, or 93-523 can
result in civil penalties assessed by the Admin-
istrator, a hearing board, or a court; criminal
sanctions by a court; or a court order requiring
a discharge source to take or cease a particular
action. Except for civil penalties imposed by
the Administrator, formal hearing will be
required.
2.2.2 Authentication of Testimony: Au-
thentication as a condition precedent to ad-
missibility may require testimony under oath
(14). Witnesses are subject to cross-
examination. The form and admissibility of evi-
dence presented in Federal courts are clearly
defined in the Federal Rules of Civil Procedure
(15) and the Federal Rules of Evidence (14).
These formal rules of evidence may be par-
tially annulled for administrative hearings. Lab-
oratory records may not be acceptable evi-
dence without proof of authenticity.
The hearsay rule is one of the most direc-
tive statutes. It states that generally persons
may only testify to what they know personally
and that they must be subject to cross-
examination. However, some exceptions to the
hearsay rule are allowed. Evidence that would
normally be hearsay is admissible in the ad-
ministrative hearing, if it has probative value in
the opinion of the hearing officer. Also, evi-
282
**EPA MICROBIOLOGICAL MANUAL 1978
image:
 dence may be presented in written form in a
hearing, but this is more likely when the pre-
ceeding is not a full-fledged trial-type hearing.
Additional exceptions to the hearsay rule
are cited in the recently-enacted Federal Rules
of Evidence (14). These rules state that under
certain circumstances a witness does not have
to be present for his statement to be admissi-
ble. In addition, records of regularly-conducted
business activities, public reports, reports pre-
pared by law enforcement personnel and fac-
tual findings resulting from legal investiga-
tions may be admitted without the testimony
of the person or persons involved.
2.2.3 Admissibility of Records: Under Rule
803 (6) of the Federal Rules of Evidence (14),
written records made in the regular course of
any business (i.e., laboratory operation) may
also be introduced into evidence in civil ac-
tions without the testimony of the person(s)
who made the record. Prior to enactment of
the Federal Rules of Evidence, this authority
was contained in the Federal Business
Records Act, 29 U.S. Code, Section 1732A.
Although preferable, it is not always possi-
ble to have the individuals who collected, kept,
and analyzed samples testify in court. In addi-
tion, if the opposing party does not intend to
contest the integrity of the sample or testing
evidence, admission under the Business
Records Act can save much trial time. For
these reasons, it is important that the proce-
dures followed in evidence, sample collections
and analyses be standardized and described in
an instruction manual which can be offered as
evidence of the standard operating procedure
followed by the laboratory.
2.2.4 Limitations ori the Admissibility of
Records: Although the statutes do not specifi-
cally cover the point, it is clear from the exami-
nation of cases that one of the requirements
for admissibility is that the document has in-
herent probability of trustworthiness. Thus, a
trial judge has discretion in allowing or not
allowing a document into evidence if there is
doubt as to its trustworthiness. One criterion
for the judge to consider is whether the partic-
ular analysis was done as a routine matter or
whether it was specifically done in anticipa-
tion of litigation. This caution in admitting evi-
dence is an indication of distrust of the situa-
tion, not of the individuals involved.
2.2.5 Contacts with Parties to Adjudica-
tory or Adversary Proceedings: The following
statements are quoted directly from the May 5,
1975, memorandum of the Acting Assistant
Administrator for Enforcement, US EPA(16):
As we are now becoming involved in more
and more adjudicatory hearings on
NPDES (National Pollution Discharge Elim-
ination System) permits and in enforce-
ment actions, both through Administrative
Orders and in the Courts, it is very impor-
tant that our staffs clearly understand that
contacts and discussions with parties to
these proceedings be carefully controlled.
We have recently had inquiries about
cases in which requests for adjudicatory
hearing had been granted and in which
EPA technical staff members, without the
knowledge of either the attorney assigned
or of the Enforcement Director, met with
company representatives to discuss the
pending case. In each case, the merits of
EPA's position as compared to that of the
company were discussed, as were possi-
ble areas of compromise with respect to
EPA's position.
Case preparation and decisions on strat-
egy for adjudicatory hearings are the re-
sponsibility of our regional attorneys with
assistance from Headquarters Counsel for
Adjudicatory Hearings. Accordingly, I
would appreciate your instructing your
staff members not to discuss permit ques-
tions or technical issues applicable to a
particular industrial facility which is the
subject of an adjudicatory hearing or an
enforcement action until the appropriate
Enforcement Division attorney, either in
the Regional Office or in Headquarters is
notified.
The foregoing is not to be construed as
discouraging settlement discussions in
pending cases, but is only intended to
LEGAL ASPECTS
283
image:
dence may be presented in written form in a
hearing, but this is more likely when the pre-
ceeding is not a full-fledged trial-type hearing.
Additional exceptions to the hearsay rule
are cited in the recently-enacted Federal Rules
of Evidence (14). These rules state that under
certain circumstances a witness does not have
to be present for his statement to be admissi-
ble. In addition, records of regularly-conducted
business activities, public reports, reports pre-
pared by law enforcement personnel and fac-
tual findings resulting from legal investiga-
tions may be admitted without the testimony
of the person or persons involved.
2.2.3 Admissibility of Records: Under Rule
803 (6) of the Federal Rules of Evidence (14),
written records made in the regular course of
any business (i.e., laboratory operation) may
also be introduced into evidence in civil ac-
tions without the testimony of the person(s)
who made the record. Prior to enactment of
the Federal Rules of Evidence, this authority
was contained in the Federal Business
Records Act, 29 U.S. Code, Section 1732A.
Although preferable, it is not always possi-
ble to have the individuals who collected, kept,
and analyzed samples testify in court. In addi-
tion, if the opposing party does not intend to
contest the integrity of the sample or testing
evidence, admission under the Business
Records Act can save much trial time. For
these reasons, it is important that the proce-
dures followed in evidence, sample collections
and analyses be standardized and described in
an instruction manual which can be offered as
evidence of the standard operating procedure
followed by the laboratory.
2.2.4 Limitations ori the Admissibility of
Records: Although the statutes do not specifi-
cally cover the point, it is clear from the exami-
nation of cases that one of the requirements
for admissibility is that the document has in-
herent probability of trustworthiness. Thus, a
trial judge has discretion in allowing or not
allowing a document into evidence if there is
doubt as to its trustworthiness. One criterion
for the judge to consider is whether the partic-
ular analysis was done as a routine matter or
whether it was specifically done in anticipa-
tion of litigation. This caution in admitting evi-
dence is an indication of distrust of the situa-
tion, not of the individuals involved.
2.2.5 Contacts with Parties to Adjudica-
tory or Adversary Proceedings: The following
statements are quoted directly from the May 5,
1975, memorandum of the Acting Assistant
Administrator for Enforcement, US EPA(16):
As we are now becoming involved in more
and more adjudicatory hearings on
NPDES (National Pollution Discharge Elim-
ination System) permits and in enforce-
ment actions, both through Administrative
Orders and in the Courts, it is very impor-
tant that our staffs clearly understand that
contacts and discussions with parties to
these proceedings be carefully controlled.
We have recently had inquiries about
cases in which requests for adjudicatory
hearing had been granted and in which
EPA technical staff members, without the
knowledge of either the attorney assigned
or of the Enforcement Director, met with
company representatives to discuss the
pending case. In each case, the merits of
EPA's position as compared to that of the
company were discussed, as were possi-
ble areas of compromise with respect to
EPA's position.
Case preparation and decisions on strat-
egy for adjudicatory hearings are the re-
sponsibility of our regional attorneys with
assistance from Headquarters Counsel for
Adjudicatory Hearings. Accordingly, I
would appreciate your instructing your
staff members not to discuss permit ques-
tions or technical issues applicable to a
particular industrial facility which is the
subject of an adjudicatory hearing or an
enforcement action until the appropriate
Enforcement Division attorney, either in
the Regional Office or in Headquarters is
notified.
The foregoing is not to be construed as
discouraging settlement discussions in
pending cases, but is only intended to
LEGAL ASPECTS
283
image:
 provide for orderly resolution of matters
which can be negotiated.
2.3 Preparation for Testimony
^•^' ^ Gathering and Preserving Evidence
in Water Pollution Enforcement Actions: !n ev-
ery water pollution suit, expert testimony will
be of primary importance. To meet its burden
of proof, the Government may have to present
expert testimony on sampling, laboratory ana-
lyses, test results and the harmful effect attrib-
utable to the defendant's discharge. If the Gov-
ernment's expert witnesses do not testify ef-
fectively, the lawsuit may be jeopardized.
2.3.2 Testimony on Sampling: In the order
of proof in a trial concerning pollution there
will be testimony by witnesses who have taken
samples. The samples may be effluents, receiv-
ing waters, potable waters, sludges or sedi-
ments. These witnesses will explain how,
where and when the samples were taken. The
choice of sampling location and what to sam-
ple depends to a large extent on the type of
legal action contemplated.
2.3.3 Documentation of Procedures: In an-
ticipation of possible court presentation of evi-
dence, laboratories must maintain an orderly,
complete and permanent record-keeping and
filing system. A laboratory operating manual
should be used in all laboratories. The manual
formalizes the operation of the laboratory by
describing in detail the sampling procedures,
the line of technical responsibility, specific
analytic methods followed, data handling pro-
cedures, the continuous quality control pro-
gram established for daily operations, partici-
pation in interlaboratory and intralaboratory
quality control programs and safety guide-
lines. Since routines change, personnel should
sign dated receipts that indicate they have
received the operating instructions and modifi-
cations when issued.
Complete records of samples received
must be kept in a separate log and official
chain of custody requirements must be ob-
served. The laboratory data records, analytical
results and computations should be written,
preferably in a bound book or on bench cards,
that can be incorporated into a permanent
record log. Provision should be made for the
signatures of sample collectors, analysts and
direct line supervisors in the sample log and In
the data log so that the laboratory data are
authenticated. As described in Part V-A of this
manual, a quality control log book should be
maintained on a day-to-day basis. It should
record quality control checks on: media and
supplies, equipment and instrumentation, the
actual analyses, data handling and storage.
Training of analysts should include familiariza-
tion with the quality control book and identifi-
cation of their responsibilities in the program.
Each analyst should have a personal copy of
the manual as a guide.
2.3.4 Pre-Trlal Discovery: Whenever an
agency is a party to any federal court litigation,
it will be subject, under the Federal Rules of
Civil Procedure, to pre-trial discovery. The
agency will be required to answer the oppos-
ing party's questions and to produce re-
quested documents. Technical personnel re-
sponding to a motion to produce documents
should deliver related documents to the
agency attorney handling the case. Docu-
ments should not be withheld because they
appear to be damaging to the government's
case. The responsible government attorneys
will determine, on the basis of the law of dis-
covery, which documents must be submitted
to the opposing party.
A sensible filing system should be set up
and followed. The objective of a filing system
is to store information so that it can be found
quickly. Information which is known but is not
reflected in the file is of no use and will not be
available when needed. However, the files
should be examined regularly and outdated or
superfluous information discarded to maintain
manageability. Critical or outspoken com-
ments on notes, route slips or in margins,
should not be retained unless the originator
and recipient are prepared to defend them in
court.
2.3.5 Testimony or\ Methodology: A wit-
ness may be required to provide testimony on
methods of analyses and test results. For ac-
284
MICROBIOLOGICAL MANUAL 1976
image:
provide for orderly resolution of matters
which can be negotiated.
2.3 Preparation for Testimony
^•^' ^ Gathering and Preserving Evidence
in Water Pollution Enforcement Actions: !n ev-
ery water pollution suit, expert testimony will
be of primary importance. To meet its burden
of proof, the Government may have to present
expert testimony on sampling, laboratory ana-
lyses, test results and the harmful effect attrib-
utable to the defendant's discharge. If the Gov-
ernment's expert witnesses do not testify ef-
fectively, the lawsuit may be jeopardized.
2.3.2 Testimony on Sampling: In the order
of proof in a trial concerning pollution there
will be testimony by witnesses who have taken
samples. The samples may be effluents, receiv-
ing waters, potable waters, sludges or sedi-
ments. These witnesses will explain how,
where and when the samples were taken. The
choice of sampling location and what to sam-
ple depends to a large extent on the type of
legal action contemplated.
2.3.3 Documentation of Procedures: In an-
ticipation of possible court presentation of evi-
dence, laboratories must maintain an orderly,
complete and permanent record-keeping and
filing system. A laboratory operating manual
should be used in all laboratories. The manual
formalizes the operation of the laboratory by
describing in detail the sampling procedures,
the line of technical responsibility, specific
analytic methods followed, data handling pro-
cedures, the continuous quality control pro-
gram established for daily operations, partici-
pation in interlaboratory and intralaboratory
quality control programs and safety guide-
lines. Since routines change, personnel should
sign dated receipts that indicate they have
received the operating instructions and modifi-
cations when issued.
Complete records of samples received
must be kept in a separate log and official
chain of custody requirements must be ob-
served. The laboratory data records, analytical
results and computations should be written,
preferably in a bound book or on bench cards,
that can be incorporated into a permanent
record log. Provision should be made for the
signatures of sample collectors, analysts and
direct line supervisors in the sample log and In
the data log so that the laboratory data are
authenticated. As described in Part V-A of this
manual, a quality control log book should be
maintained on a day-to-day basis. It should
record quality control checks on: media and
supplies, equipment and instrumentation, the
actual analyses, data handling and storage.
Training of analysts should include familiariza-
tion with the quality control book and identifi-
cation of their responsibilities in the program.
Each analyst should have a personal copy of
the manual as a guide.
2.3.4 Pre-Trlal Discovery: Whenever an
agency is a party to any federal court litigation,
it will be subject, under the Federal Rules of
Civil Procedure, to pre-trial discovery. The
agency will be required to answer the oppos-
ing party's questions and to produce re-
quested documents. Technical personnel re-
sponding to a motion to produce documents
should deliver related documents to the
agency attorney handling the case. Docu-
ments should not be withheld because they
appear to be damaging to the government's
case. The responsible government attorneys
will determine, on the basis of the law of dis-
covery, which documents must be submitted
to the opposing party.
A sensible filing system should be set up
and followed. The objective of a filing system
is to store information so that it can be found
quickly. Information which is known but is not
reflected in the file is of no use and will not be
available when needed. However, the files
should be examined regularly and outdated or
superfluous information discarded to maintain
manageability. Critical or outspoken com-
ments on notes, route slips or in margins,
should not be retained unless the originator
and recipient are prepared to defend them in
court.
2.3.5 Testimony or\ Methodology: A wit-
ness may be required to provide testimony on
methods of analyses and test results. For ac-
284
MICROBIOLOGICAL MANUAL 1976
image:
 ceptance in court, the witness must be able to
testify that the analytical method or procedure
employed has wide use in the microbiological
community. For example, the procedures out-
lined in Standard Methods {&) and in This Man-
ual are recognized and accepted. In court
cases on record, results obtained using Stan-
dard Methods have been admitted into evi-
dence while deviations from Standard Me-
thodshave had to be explained and justified.
It may be necessary to present testimony
on parameters that are not included in these
publications or on special types of samples to
which the methods described are not applica-
ble. In such cases effective testimony may be
based upon the best methodology currently
available, utilizing as substantiating evidence.
published reports, other method manuals, etc.
to demonstrate that the methods do have rec-
ognition in the scientific community.
The specific test methods to be used in the
application of the Federal Water Pollution Con-
trol Laws may be identified in the Code of
Federal Regulations (CFR). For example, the
procedures required for Section 304 (g) of the
Federal Water Pollution Control Amendments
of 1972 appear in 4O CFR, Part 136. These
guidelines establish the methodology to be
used for compliance monitoring and the me-
thods become those that are acceptable as
standards in court. Part 136 of 40 CFR also
provides a mechanism and rule for obtaining
approval for any alternate procedure that may
be proposed when the recommended method
is not appropriate.
2.3.6 Testimony by Expert: A court may
require that an expert witness' opinion be
based on studies and tests conducted or su-
pervised by him personally. However, experts
are frequently permitted to offer testimony in
the form of an opinion in the area of compe-
tence or based on someone else's work. Such
testimony can be developed through the use of
hypothetical questions and objections tend to
add weight to the expert's testimony rather
than to cast doubt on the witness'
competency.
2.4 Testimony in Court
2.4.1 General Instructions for a Witness:
The following suggestions are made for pros-
pective witnesses to lessen the apprehensions
everyone feels when first testifying before a
board, commission, hearing officer, or in court.
Even veteran witnesses often experience
some anxiety. However, if a witness is properly
prepared on the subject matter of his testi-
mony and his conduct on the witness stand, he
is much more confident about testifying. The
witness will be required to take an oath to tell
nothing but the truth. The important point is
that there are two ways to tell the truth—one is
in a halting hesitant manner, which makes the
board member, hearing officer, judge or jury
doubt that the witness is telling all the facts in
a truthful way, and the other is in a confident
straight forward manner, which gives cre-
dence to the witness' words.
If a scientist is a witness in a case involv-
ing testimony concerning the appearance of
an object, place or condition, he should refresh
his recollection by inspecting the object, place
or condition, etc., before the hearing or trial.
Later he should try to picture the item and
recall the important points of his testimony. He
should repeat this procedure until he has thor-
oughly familiarized himself with the points that
will be made in the testimony.
Before testifying, the witness should visit
a court trial or board hearing and listen to other
witnesses testifying. This will familiarize him
with such surroundings and help him to under-
stand court protocol and the problem of testi-
mony. The scientist should arrive at the hear-
ing in time to listen to other witnesses testify
before taking the witness chair himself.
A good witness listens to the question and
then answers it calmly and directly in a sincere
manner. He knows the facts and can communi-
cate them. He testifies in this manner on cross-
examination as well as on direct examination.
The witness should wear neat, clean
clothes when he testifies and should dress
conservatively.. He should speak clearly and
not chew gum while testifying.
LEGAL ASPECTS
285
image:
ceptance in court, the witness must be able to
testify that the analytical method or procedure
employed has wide use in the microbiological
community. For example, the procedures out-
lined in Standard Methods {&) and in This Man-
ual are recognized and accepted. In court
cases on record, results obtained using Stan-
dard Methods have been admitted into evi-
dence while deviations from Standard Me-
thodshave had to be explained and justified.
It may be necessary to present testimony
on parameters that are not included in these
publications or on special types of samples to
which the methods described are not applica-
ble. In such cases effective testimony may be
based upon the best methodology currently
available, utilizing as substantiating evidence.
published reports, other method manuals, etc.
to demonstrate that the methods do have rec-
ognition in the scientific community.
The specific test methods to be used in the
application of the Federal Water Pollution Con-
trol Laws may be identified in the Code of
Federal Regulations (CFR). For example, the
procedures required for Section 304 (g) of the
Federal Water Pollution Control Amendments
of 1972 appear in 4O CFR, Part 136. These
guidelines establish the methodology to be
used for compliance monitoring and the me-
thods become those that are acceptable as
standards in court. Part 136 of 40 CFR also
provides a mechanism and rule for obtaining
approval for any alternate procedure that may
be proposed when the recommended method
is not appropriate.
2.3.6 Testimony by Expert: A court may
require that an expert witness' opinion be
based on studies and tests conducted or su-
pervised by him personally. However, experts
are frequently permitted to offer testimony in
the form of an opinion in the area of compe-
tence or based on someone else's work. Such
testimony can be developed through the use of
hypothetical questions and objections tend to
add weight to the expert's testimony rather
than to cast doubt on the witness'
competency.
2.4 Testimony in Court
2.4.1 General Instructions for a Witness:
The following suggestions are made for pros-
pective witnesses to lessen the apprehensions
everyone feels when first testifying before a
board, commission, hearing officer, or in court.
Even veteran witnesses often experience
some anxiety. However, if a witness is properly
prepared on the subject matter of his testi-
mony and his conduct on the witness stand, he
is much more confident about testifying. The
witness will be required to take an oath to tell
nothing but the truth. The important point is
that there are two ways to tell the truth—one is
in a halting hesitant manner, which makes the
board member, hearing officer, judge or jury
doubt that the witness is telling all the facts in
a truthful way, and the other is in a confident
straight forward manner, which gives cre-
dence to the witness' words.
If a scientist is a witness in a case involv-
ing testimony concerning the appearance of
an object, place or condition, he should refresh
his recollection by inspecting the object, place
or condition, etc., before the hearing or trial.
Later he should try to picture the item and
recall the important points of his testimony. He
should repeat this procedure until he has thor-
oughly familiarized himself with the points that
will be made in the testimony.
Before testifying, the witness should visit
a court trial or board hearing and listen to other
witnesses testifying. This will familiarize him
with such surroundings and help him to under-
stand court protocol and the problem of testi-
mony. The scientist should arrive at the hear-
ing in time to listen to other witnesses testify
before taking the witness chair himself.
A good witness listens to the question and
then answers it calmly and directly in a sincere
manner. He knows the facts and can communi-
cate them. He testifies in this manner on cross-
examination as well as on direct examination.
The witness should wear neat, clean
clothes when he testifies and should dress
conservatively.. He should speak clearly and
not chew gum while testifying.
LEGAL ASPECTS
285
image:
 2.4.2 Direct Examination
(a) In a discussion on administrative proce-
dures, E. Barrett Prettyman, Retired Chief
Judge, U.S. Court of Appeals for the District of
Columbia, gave the following advice (4):
The best form of oral testimony is a series
of short, accurate, and complete state-
ments of fact. It is to be emphasized that
the testimony will be read by the finder of
the facts, and that he will draw his findings
from what he reads...confused, discursive,
incomplete statements of fact do not yield
satisfactory findings.
(b) The witness should stand upright when
taking the oath, pay attention, say "I do"
clearly, and not slouch in the witness chair. If
the witness has prepared answers to possible
questions, he should not memorize them. It is,
however, very important that he familiarize
himself as much as possible with the facts
about which he will be called to testify.
(c) During direct examination, the witness
may elaborate and respond more fully than is
advisable on cross-examination. However,
when volunteering information, he should not
ramble or stray from the main point raised in
his lawyer's question. Testimony is a dialogue,
not a monologue. If testimony concerns a spe-
cialized technical area, the court or hearing
board will find it easier to understand if it is
presented in the form of short answers to a
logical progression of questions. In addition,
by letting his lawyer control the direction of his
testimony, the witness will avoid making re-
marks which are legally objectionable or tacti-
cally unwise.
(d) The witness should be serious at all
times and avoid laughing or talking about the
case in the building where the hearing or trial
is being held.
(e) While testifying, the witness should talk
to the board member, hearing officer or jury,
looking at him or them most of the time, and
speaking frankly and openly as if to a friend or
neighbor. He should speak clearly and loudly
enough so that anyone in the hearing room or
courtroom can hear him easily. The witness
makes certain that the reporter taking the ver-
batim record of his testimony is able to hear
him and record what he says. The case will be
decided entirely on the words that are re-
ported as the testimony given at the hearing or
trial. The witness must give complete state-
ments in sentence form; half statements or
incomplete sentences may convey the thought
in the context of the hearing, but be unintelligi-
ble when read from the cold record months
later.
2.4.3 Cross-Examination
(a) Concerning cross-examination, the fol-
lowing advice is given to prospective wit-
nesses (4):
Don't argue. Don't fence. Don't guess.
Don't make wisecracks. Don't take sides. Don't
get irritated. Think first, then speak. If you do
not know the answer to a question, say so. If
you do not know the answer but have an opin-
ion or belief on the subject based on informa-
tion, say exactly that and let the hearing officer
decide whether you shall or shall not give such
information as you have. If a 'yes or no' answer
to a question is demanded but you think that a
qualification should be made to any such an-
swer, give the 'yes or no' and at once request
permission to explain your answer. Don't
worry about the effect an answer may have.
Don't worry about being bulldozed or embar-
rassed; counsel will protect you. If you know
the answer to a question, state it as precisely
and succinctly as you can. The best protection
against extensive cross-examination is to be
brief, accurate and calm.
The hearing officer, board member or jury
wants only the facts, not hearsay, conclusions,
or opinions. The witness usually will not be
allowed to testify about what someone else
has told him.
(b) The witness must be polite, even to the
attorney for the opposing part. He should not
be a cocky witness. This will lose him the
respect and objectivity of the trier of the facts
286
MICROBIOLOGICAL MANUAL 1978
image:
2.4.2 Direct Examination
(a) In a discussion on administrative proce-
dures, E. Barrett Prettyman, Retired Chief
Judge, U.S. Court of Appeals for the District of
Columbia, gave the following advice (4):
The best form of oral testimony is a series
of short, accurate, and complete state-
ments of fact. It is to be emphasized that
the testimony will be read by the finder of
the facts, and that he will draw his findings
from what he reads...confused, discursive,
incomplete statements of fact do not yield
satisfactory findings.
(b) The witness should stand upright when
taking the oath, pay attention, say "I do"
clearly, and not slouch in the witness chair. If
the witness has prepared answers to possible
questions, he should not memorize them. It is,
however, very important that he familiarize
himself as much as possible with the facts
about which he will be called to testify.
(c) During direct examination, the witness
may elaborate and respond more fully than is
advisable on cross-examination. However,
when volunteering information, he should not
ramble or stray from the main point raised in
his lawyer's question. Testimony is a dialogue,
not a monologue. If testimony concerns a spe-
cialized technical area, the court or hearing
board will find it easier to understand if it is
presented in the form of short answers to a
logical progression of questions. In addition,
by letting his lawyer control the direction of his
testimony, the witness will avoid making re-
marks which are legally objectionable or tacti-
cally unwise.
(d) The witness should be serious at all
times and avoid laughing or talking about the
case in the building where the hearing or trial
is being held.
(e) While testifying, the witness should talk
to the board member, hearing officer or jury,
looking at him or them most of the time, and
speaking frankly and openly as if to a friend or
neighbor. He should speak clearly and loudly
enough so that anyone in the hearing room or
courtroom can hear him easily. The witness
makes certain that the reporter taking the ver-
batim record of his testimony is able to hear
him and record what he says. The case will be
decided entirely on the words that are re-
ported as the testimony given at the hearing or
trial. The witness must give complete state-
ments in sentence form; half statements or
incomplete sentences may convey the thought
in the context of the hearing, but be unintelligi-
ble when read from the cold record months
later.
2.4.3 Cross-Examination
(a) Concerning cross-examination, the fol-
lowing advice is given to prospective wit-
nesses (4):
Don't argue. Don't fence. Don't guess.
Don't make wisecracks. Don't take sides. Don't
get irritated. Think first, then speak. If you do
not know the answer to a question, say so. If
you do not know the answer but have an opin-
ion or belief on the subject based on informa-
tion, say exactly that and let the hearing officer
decide whether you shall or shall not give such
information as you have. If a 'yes or no' answer
to a question is demanded but you think that a
qualification should be made to any such an-
swer, give the 'yes or no' and at once request
permission to explain your answer. Don't
worry about the effect an answer may have.
Don't worry about being bulldozed or embar-
rassed; counsel will protect you. If you know
the answer to a question, state it as precisely
and succinctly as you can. The best protection
against extensive cross-examination is to be
brief, accurate and calm.
The hearing officer, board member or jury
wants only the facts, not hearsay, conclusions,
or opinions. The witness usually will not be
allowed to testify about what someone else
has told him.
(b) The witness must be polite, even to the
attorney for the opposing part. He should not
be a cocky witness. This will lose him the
respect and objectivity of the trier of the facts
286
MICROBIOLOGICAL MANUAL 1978
image:
 in the case. He should not exaggerate or em-
broider his testimony.
(c) The witness should stop instantly when
the judge, hearing officer or board member
interrupts, or when the other attorney objects
to what is said. He must not try to sneak the
answer in or nod his head for a "yes" or "no"
answer. The reporter has to hear an answer to
record it. If the question is about distances or
time and the answer is only an estimate, he
must say that it is only an estimate.
(c) The witness should listen carefully to
the questions asked. No matter how friendly
the other attorney may seem on cross-
examination, he may be trying to damage the
testimony. He must understand the question
completely and should have it repeated if nec-
essary, then give a thoughtful answer. He must
not give a snap answer. He cannot be rushed
into answering, yet taking too much time
would make the board member, hearing offi-
cer or jury think the witness is making up the
answers.
(d) The witness must answer the question
that is asked—not the question that he thinks
the examiner (particularly the cross-examiner)
intended to ask. The printed record shows only
the question asked, not what was in the exam-
iner's mind and a non-responsive answer may
be very detrimental to the case. This situation
exists when the witness thinks "I know what
he is after but he hasn't asked for it." Answer
only what is asked. The witness must explain
his answers if necessary.
(e) If by chance one's answer is wrong,
correct it immediately; if the answer was not
clear, clarify it immediately. The witness is
sworn to tell the truth. Every material truth
should be readily admitted, even if not to the
advantage of the party for whom he is testify-
ing. He must not stop to figure out whether the
answer will help or hurt his side.
(f) The witness must give positive, definite
answers when at all possible and avoid saying
"I think", "I believe", "in my opinion." If he
does no.t know, he must say so and not make
up an answer. One can be positive about the
important things which he naturally would re-
member. If asked about little details which a
person naturally would not remember it is best
to say that one does not remember, but he
must not let the cross-examiner place him in
the trap of answering question after question
with "1 don't know."
(g) The witness must not act nervous. He
should avoid mannerisms which will make him
appear frightened, not telling the truth, or not
telling all that he knows. Above all, it is most
important that the witness not lose his temper.
Testifying at length is fatiguing. Fatigue will be
recognized by crossness, nervousness, anger,
careless answers and a willingness to say any-
thing or answer any questions in order to leave
the witness stand. When the witness feels
these symptoms, he must recognize them and
strive to overcome these feelings. Some attor-
neys on cross-examination try to wear out the
witness so he will lose his temper and say
things that are not correct, or that will hurt the
testimony. The witness must not let this
happen.
(h) If the witness does not want to answer
a question, he should not ask the judge, hear-
ing officer or board member whether he must
answer it. If it is an improper question, hjs
attorney will object for him. One must not ask
the presiding officer, judge or board member
for advice or help in answering a question. The
witness is on his own. If the question is an
improper one, his attorney will object. If the
judge, hearing officer, or board member then
directs the witness to answer it, he must do so.
He cannot hedge or argue with the opposing
attorney.
(i) There are trick questions which may be
asked and which, if answered, signify "yes" or
"no", ancl will damage the credibility of the
testimony. Two examples follow:
(1) "Have you talked to anybody about this
matter?" If you say "no", the hearing officer or
board member, or a seasoned jury, will know
that is not correct because good lawyers al-
ways talk to the witnesses before they testify.
If one says "yes", the lawyer may try to infer
LEGAL ASPECTS
287
image:
in the case. He should not exaggerate or em-
broider his testimony.
(c) The witness should stop instantly when
the judge, hearing officer or board member
interrupts, or when the other attorney objects
to what is said. He must not try to sneak the
answer in or nod his head for a "yes" or "no"
answer. The reporter has to hear an answer to
record it. If the question is about distances or
time and the answer is only an estimate, he
must say that it is only an estimate.
(c) The witness should listen carefully to
the questions asked. No matter how friendly
the other attorney may seem on cross-
examination, he may be trying to damage the
testimony. He must understand the question
completely and should have it repeated if nec-
essary, then give a thoughtful answer. He must
not give a snap answer. He cannot be rushed
into answering, yet taking too much time
would make the board member, hearing offi-
cer or jury think the witness is making up the
answers.
(d) The witness must answer the question
that is asked—not the question that he thinks
the examiner (particularly the cross-examiner)
intended to ask. The printed record shows only
the question asked, not what was in the exam-
iner's mind and a non-responsive answer may
be very detrimental to the case. This situation
exists when the witness thinks "I know what
he is after but he hasn't asked for it." Answer
only what is asked. The witness must explain
his answers if necessary.
(e) If by chance one's answer is wrong,
correct it immediately; if the answer was not
clear, clarify it immediately. The witness is
sworn to tell the truth. Every material truth
should be readily admitted, even if not to the
advantage of the party for whom he is testify-
ing. He must not stop to figure out whether the
answer will help or hurt his side.
(f) The witness must give positive, definite
answers when at all possible and avoid saying
"I think", "I believe", "in my opinion." If he
does no.t know, he must say so and not make
up an answer. One can be positive about the
important things which he naturally would re-
member. If asked about little details which a
person naturally would not remember it is best
to say that one does not remember, but he
must not let the cross-examiner place him in
the trap of answering question after question
with "1 don't know."
(g) The witness must not act nervous. He
should avoid mannerisms which will make him
appear frightened, not telling the truth, or not
telling all that he knows. Above all, it is most
important that the witness not lose his temper.
Testifying at length is fatiguing. Fatigue will be
recognized by crossness, nervousness, anger,
careless answers and a willingness to say any-
thing or answer any questions in order to leave
the witness stand. When the witness feels
these symptoms, he must recognize them and
strive to overcome these feelings. Some attor-
neys on cross-examination try to wear out the
witness so he will lose his temper and say
things that are not correct, or that will hurt the
testimony. The witness must not let this
happen.
(h) If the witness does not want to answer
a question, he should not ask the judge, hear-
ing officer or board member whether he must
answer it. If it is an improper question, hjs
attorney will object for him. One must not ask
the presiding officer, judge or board member
for advice or help in answering a question. The
witness is on his own. If the question is an
improper one, his attorney will object. If the
judge, hearing officer, or board member then
directs the witness to answer it, he must do so.
He cannot hedge or argue with the opposing
attorney.
(i) There are trick questions which may be
asked and which, if answered, signify "yes" or
"no", ancl will damage the credibility of the
testimony. Two examples follow:
(1) "Have you talked to anybody about this
matter?" If you say "no", the hearing officer or
board member, or a seasoned jury, will know
that is not correct because good lawyers al-
ways talk to the witnesses before they testify.
If one says "yes", the lawyer may try to infer
LEGAL ASPECTS
287
image:
 that you were told what to say. The best thing
to say is that you have talked to Mr ,
your lawyer, to the appellant, etc., and that you
were just asked what the facts were. All that is
wanted is the truth.
(2) "Are you getting paid to testify in this
appeal?" The lawyer asking this hopes your
answer will be "yes", thereby inferring that
you are being paid to say what your side wants
you to say. Your answer should be something
like "No, I am not getting paid to testify, I am
only getting compensation for my time off
from work, and my expenses incurred in being
here." A witness should never be paid a contin-
gency fee as it indicates strongly that since his
compensation depends upon the results, he
may be inclined to overstate the case.
REFERENCES
1. Federal Water Pollution Control Act Amendments of 1972, Public Law 92-500, October 18,
1972,86 Stat. 816,33 United States Code (USC) Sec, 1151.
2. Marine Protection, Research and Sanctuaries Act of 1972, Public Law 92-532, October 23,
19 72,86 Stat. 1052.
3. Safe Drinking Water Act, Public Law 93-523, December 16, 1974, 88 Stat 1660, 42 United
States Code (USC) 300f.
4. U.S. Environmental Protection Agency, Legal Support Division, 1972. A Primer on the Law,
Evidence, and Management of Federal Water Pollution Control Cases, Washington, D.C. pp.
43-52,54^55.
5. Shedroff, D. I., 1973. Enforcement activities. In: Proceedings of the First Microbiology Seminar
on Standardization of Methods, EPA-R4-73-O22, Office ofResearch and Monitoring, U.S.
Environmental Protection Agency, Washington, D.C., pp. 1-11.
6. Shedroff, D. I., 1976. Personal Communication. Office of Enforcement US EPA, Washington, DC.
7, Guidelines Establishing Test Procedures for Analysis of Pollutants, 40 Code of Federal Regula-
tions {CFR) Part 136, Published in Federal Register, 38, p. 28758, October 16,1973.
8. American Public Health Association. 1976. Standard Methods for the Examination of Water and
Wastewater{14th ed.) American Public Health Association, Inc., Washington, DC. p. 874
9. Guidelines for Establishing Test Procedures, 40 Code of Federal Regulations (CFR) Part 136,
Published in Federal Register, 40,52780, Dec. 1,1976.
10. National Interim Primary Drinking Water Regulations, 40 Code of Federal Regulations (CFR) Part
141, Published in Federal Register, 40,59566, December 24,1975.
11. Borough of Ford City vs. United States, 345 F. 2d 645(3rdCir. 1965),
12, Camara vs. Municipal Court, 387 U.S. 523 (1967); See vs. Seattle, 387 U.S. 547 (1967).
13. United States vs. Hammond Milling Co., 413 F. 2d 608 (5th Cir. 1969), cert. den. 396 U.S. 1002
(1970); and United States vs. Thriftimart, Inc. 429 F. 2d 1006 (9th Cir. 1970) cert. den. 400 U.S.
926(1970).
14. The Federal Rules of Evidence, Public Law 93-595, January 2, 1975,88 Stat. 1926,28 United
States Code (USC) App.
15. Federal Rules of Civil Procedure, Rule 43, adopted by the U.S. Supreme Court pursuant to Title
28, U.S. Code (USC) Section 2072, as amended effected July, 1975.
16, Johnson, R. H., Acting Assistant Administrator for Enforcement, EPA Office of Enforcement. May
5,1975. "Contacts with Parties to Adjudicator/ or Adversary Proceeding", Memorandum to EPA
Assistant and Regional Administrators.
288
•SERA MICROBIOLOGICAL MANUAL 1978
image:
that you were told what to say. The best thing
to say is that you have talked to Mr ,
your lawyer, to the appellant, etc., and that you
were just asked what the facts were. All that is
wanted is the truth.
(2) "Are you getting paid to testify in this
appeal?" The lawyer asking this hopes your
answer will be "yes", thereby inferring that
you are being paid to say what your side wants
you to say. Your answer should be something
like "No, I am not getting paid to testify, I am
only getting compensation for my time off
from work, and my expenses incurred in being
here." A witness should never be paid a contin-
gency fee as it indicates strongly that since his
compensation depends upon the results, he
may be inclined to overstate the case.
REFERENCES
1. Federal Water Pollution Control Act Amendments of 1972, Public Law 92-500, October 18,
1972,86 Stat. 816,33 United States Code (USC) Sec, 1151.
2. Marine Protection, Research and Sanctuaries Act of 1972, Public Law 92-532, October 23,
19 72,86 Stat. 1052.
3. Safe Drinking Water Act, Public Law 93-523, December 16, 1974, 88 Stat 1660, 42 United
States Code (USC) 300f.
4. U.S. Environmental Protection Agency, Legal Support Division, 1972. A Primer on the Law,
Evidence, and Management of Federal Water Pollution Control Cases, Washington, D.C. pp.
43-52,54^55.
5. Shedroff, D. I., 1973. Enforcement activities. In: Proceedings of the First Microbiology Seminar
on Standardization of Methods, EPA-R4-73-O22, Office ofResearch and Monitoring, U.S.
Environmental Protection Agency, Washington, D.C., pp. 1-11.
6. Shedroff, D. I., 1976. Personal Communication. Office of Enforcement US EPA, Washington, DC.
7, Guidelines Establishing Test Procedures for Analysis of Pollutants, 40 Code of Federal Regula-
tions {CFR) Part 136, Published in Federal Register, 38, p. 28758, October 16,1973.
8. American Public Health Association. 1976. Standard Methods for the Examination of Water and
Wastewater{14th ed.) American Public Health Association, Inc., Washington, DC. p. 874
9. Guidelines for Establishing Test Procedures, 40 Code of Federal Regulations (CFR) Part 136,
Published in Federal Register, 40,52780, Dec. 1,1976.
10. National Interim Primary Drinking Water Regulations, 40 Code of Federal Regulations (CFR) Part
141, Published in Federal Register, 40,59566, December 24,1975.
11. Borough of Ford City vs. United States, 345 F. 2d 645(3rdCir. 1965),
12, Camara vs. Municipal Court, 387 U.S. 523 (1967); See vs. Seattle, 387 U.S. 547 (1967).
13. United States vs. Hammond Milling Co., 413 F. 2d 608 (5th Cir. 1969), cert. den. 396 U.S. 1002
(1970); and United States vs. Thriftimart, Inc. 429 F. 2d 1006 (9th Cir. 1970) cert. den. 400 U.S.
926(1970).
14. The Federal Rules of Evidence, Public Law 93-595, January 2, 1975,88 Stat. 1926,28 United
States Code (USC) App.
15. Federal Rules of Civil Procedure, Rule 43, adopted by the U.S. Supreme Court pursuant to Title
28, U.S. Code (USC) Section 2072, as amended effected July, 1975.
16, Johnson, R. H., Acting Assistant Administrator for Enforcement, EPA Office of Enforcement. May
5,1975. "Contacts with Parties to Adjudicator/ or Adversary Proceeding", Memorandum to EPA
Assistant and Regional Administrators.
288
•SERA MICROBIOLOGICAL MANUAL 1978
image:
 APPENDIX A
TABLE-1
FEDERAL WATER POLLUTION CONTROL ACT AMENDMENTS Of 1972, PUBLIC LAW 92-500
Microbiological Activities Under Relevant Sections of the Law
Sections of Law
104(a)(5)
Water Quality Surveillance
System
106 (c)
Grants for State Pollution
Control. Program
108 (a)
Pollution Control in the
Great Lakes
301 (b) and 402
Permits for Publicly Owned
(Municipal) Treatment Works
Summary of Sections
The Administrator is required to establish and maintain
a water quality surveillance system with States and
other Federal Agencies, Agencies in the system will
collect and disseminate basic data on the chemical,
physical and biological effects of varying water quality.
They are to develop new methods for identifying and
measuring the effects of pollution on the chemical,
physical and biological integrity of the water.
EPA is to provide assistance and guidance to the States
on the development and operation of procedures and
systems to monitor water quality, including biological
monitoring.
EPA is to conduct projects in cooperation with other
agencies for demonstrating new methods and developing
plans for their use in controlling pollution on the
Great Lakes.
Municipal treatment plants must attain "... second-
ary treatment", as defined by Administrator, or
treatment necessary to meet water quality
standards, whichever is more stringent, by 1977,
and "... best practicable waste treatment tech-
nology over the life of the works" by 1983.
Microbiological Activity
Conduct research, develop methodology
and technology, complete necessary
analyses, perform surveys, and provide
expertise in microbiology.
Provide necessary assistance in
microbiological expertise and
consultation to the States.
Analyze water samples to support method
and development plans for Great Lakes
pollution control.
Analyses to determine compliance or
non-compliance with microbiological
portions of permit requirements.
00
CO
image:
APPENDIX A
TABLE-1
FEDERAL WATER POLLUTION CONTROL ACT AMENDMENTS Of 1972, PUBLIC LAW 92-500
Microbiological Activities Under Relevant Sections of the Law
Sections of Law
104(a)(5)
Water Quality Surveillance
System
106 (c)
Grants for State Pollution
Control. Program
108 (a)
Pollution Control in the
Great Lakes
301 (b) and 402
Permits for Publicly Owned
(Municipal) Treatment Works
Summary of Sections
The Administrator is required to establish and maintain
a water quality surveillance system with States and
other Federal Agencies, Agencies in the system will
collect and disseminate basic data on the chemical,
physical and biological effects of varying water quality.
They are to develop new methods for identifying and
measuring the effects of pollution on the chemical,
physical and biological integrity of the water.
EPA is to provide assistance and guidance to the States
on the development and operation of procedures and
systems to monitor water quality, including biological
monitoring.
EPA is to conduct projects in cooperation with other
agencies for demonstrating new methods and developing
plans for their use in controlling pollution on the
Great Lakes.
Municipal treatment plants must attain "... second-
ary treatment", as defined by Administrator, or
treatment necessary to meet water quality
standards, whichever is more stringent, by 1977,
and "... best practicable waste treatment tech-
nology over the life of the works" by 1983.
Microbiological Activity
Conduct research, develop methodology
and technology, complete necessary
analyses, perform surveys, and provide
expertise in microbiology.
Provide necessary assistance in
microbiological expertise and
consultation to the States.
Analyze water samples to support method
and development plans for Great Lakes
pollution control.
Analyses to determine compliance or
non-compliance with microbiological
portions of permit requirements.
00
CO
image:
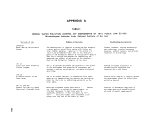 (0
O
TABLE-1
(Continued)
FEDERAL WATER POLLUTION CONTROL ACT AMENDMENTS OF 1972, PUBLIC LAW 92-500
Microbiological Activities Under Relevant Sections of the Law
Sections of Law
301 (b) and 402
Permits for Non-Publicly Owned
(Industrial) Treatment Works
3
O
CD
O
O
2
r-
301 (b) and 307 (b)
Pretreatment Standards for Dis-
charges by Non-Publicly Owned
Enterprises into Publicly-Owned
Plants
304 (a) (b) and (g)
Information and Guidelines
Summary of Sections
(1) Existing Plants: Must attain "... best practicable
control technology currently available", or water
quality standards, whichever is more stringent, by
1977, and "... best available technology economi-
cally achievable" by 1983.
(2) New Plants: Must comply with "... National Indus-
trial Standards of Performance" which for a particular
industry reflect "... the greatest degree of effluent
reduction . . . achievable through the application of
the best available control technology, processes,
operating methods, or other alternatives."
Private industry discharging into public treatment plants
must demonstrate compliance with pretreatment standards
which are determined by the type of waste source and whether
the plant is already existing or is new since the passage of
the Act. Standards for both new and old plants are designed
to prevent the discharge through publicly-owned treatment
works of pollutants which "... interfere with, pass
through, or (are) otherwise incompatible with such works."
Existing sources must comply by three years after promulga-
tion of applicable pretreatment standards.
EPA must develop water quality criteria which reflect know-
ledge of the effects on plankton, fish, shellfish, wildlife,
plant life, esthetics and recreation which may be expected
from presence of pollutants in any body of water or in
ground water. Information must be developed on what factors
are needed to restore and maintain the chemical, physical
and biological integrity of navigable waters, ground waters,
coastal waters and oceans. The Administrator is also re-
quired to issue guidelines for identifying and evaluating
the nature and extent of nonpoint sources of pollutants.
Microbiological Activity
Analyses to determine compliance or
non-compliance with microbiological
portions of permit requirements.
Analyses to determine compliance or
non-compliance with microbiological
portion of the pretreatment standard.
Develop microbial water quality
criteria based on the analyses of
all navigable, ground and coastal
waters and the ocean.
image:
(0
O
TABLE-1
(Continued)
FEDERAL WATER POLLUTION CONTROL ACT AMENDMENTS OF 1972, PUBLIC LAW 92-500
Microbiological Activities Under Relevant Sections of the Law
Sections of Law
301 (b) and 402
Permits for Non-Publicly Owned
(Industrial) Treatment Works
3
O
CD
O
O
2
r-
301 (b) and 307 (b)
Pretreatment Standards for Dis-
charges by Non-Publicly Owned
Enterprises into Publicly-Owned
Plants
304 (a) (b) and (g)
Information and Guidelines
Summary of Sections
(1) Existing Plants: Must attain "... best practicable
control technology currently available", or water
quality standards, whichever is more stringent, by
1977, and "... best available technology economi-
cally achievable" by 1983.
(2) New Plants: Must comply with "... National Indus-
trial Standards of Performance" which for a particular
industry reflect "... the greatest degree of effluent
reduction . . . achievable through the application of
the best available control technology, processes,
operating methods, or other alternatives."
Private industry discharging into public treatment plants
must demonstrate compliance with pretreatment standards
which are determined by the type of waste source and whether
the plant is already existing or is new since the passage of
the Act. Standards for both new and old plants are designed
to prevent the discharge through publicly-owned treatment
works of pollutants which "... interfere with, pass
through, or (are) otherwise incompatible with such works."
Existing sources must comply by three years after promulga-
tion of applicable pretreatment standards.
EPA must develop water quality criteria which reflect know-
ledge of the effects on plankton, fish, shellfish, wildlife,
plant life, esthetics and recreation which may be expected
from presence of pollutants in any body of water or in
ground water. Information must be developed on what factors
are needed to restore and maintain the chemical, physical
and biological integrity of navigable waters, ground waters,
coastal waters and oceans. The Administrator is also re-
quired to issue guidelines for identifying and evaluating
the nature and extent of nonpoint sources of pollutants.
Microbiological Activity
Analyses to determine compliance or
non-compliance with microbiological
portions of permit requirements.
Analyses to determine compliance or
non-compliance with microbiological
portion of the pretreatment standard.
Develop microbial water quality
criteria based on the analyses of
all navigable, ground and coastal
waters and the ocean.
image:
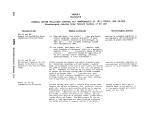 TABLE-1
(Continued)
FEDERAL WATER POLLUTION CONTROL ACT AMENDMENTS OF 1972, PUBLIC LAW 92-500
Microbiological Activities Under Relevant Sections of the Law
Sections of Law
304 (b)
Publication of Effluent
Limitation Guidelines
Summary of Sections
The Administrator shall publish regulations providing
guidelines for effluent limitations.
Microbiological Activity
Provide advice, technical assistance
and analyses required to establish
effluent limitations.
304 (g)
Guidelines for Test
Procedures
307 (a)
Toxic Pollutants
308
Inspections, Monitoring and
Entry
309
Federal Enforcement
The Administrator shall promulgate guidelines estab-
lishing test procedures for the analyses of
pollutants.
Discharge limitations are established or materials are
prohibited that are designated by the Administrator as
toxic, taking into account ". . . toxicity . . . persist-
ence . . . degradability . . . presence of the affected
organisms and the nature and extent of the effect of the
toxic pollutant on such organisms."
Owners and operators of pollution point sources shall
establish and maintain records; make reports; install,
use, and maintain monitoring equipment or methods, in-
cluding biological monitoring methods; and sample effluents
at locations, intervals, and with methods prescribed by
the Administrator.
On the basis of any information available that indicates
non-compliance of the requirements of a permit issued by
a State, the Administrator may notify the person in
alleged violation and the State of such findings. If
after the thirtieth day after notification the State has
not commenced appropriate enforcement action, the Adminis-
trator may issue a compliance order or bring civil action
to enforce the permit conditions or limitations.
Provide advice, technical assistance
and analyses required to establish
microbiological procedures.
Identification and quantification of
pollutants, including viruses,
designated as toxic by the Adminis-
trator.
Inspection of microbiological portions
of records, microbiological equipment
or methods used by owner or operator
of pollution point source; sampling
and analysis of effluents required to
be sampled by the owner or operator
of the pollution point source.
Provide advice and technical assistance
to the State and persons in non-compliance
to bring them into compliance; provide
analytical data, expertise and testimony
as required to establish EPA's case.
10
CO
image:
TABLE-1
(Continued)
FEDERAL WATER POLLUTION CONTROL ACT AMENDMENTS OF 1972, PUBLIC LAW 92-500
Microbiological Activities Under Relevant Sections of the Law
Sections of Law
304 (b)
Publication of Effluent
Limitation Guidelines
Summary of Sections
The Administrator shall publish regulations providing
guidelines for effluent limitations.
Microbiological Activity
Provide advice, technical assistance
and analyses required to establish
effluent limitations.
304 (g)
Guidelines for Test
Procedures
307 (a)
Toxic Pollutants
308
Inspections, Monitoring and
Entry
309
Federal Enforcement
The Administrator shall promulgate guidelines estab-
lishing test procedures for the analyses of
pollutants.
Discharge limitations are established or materials are
prohibited that are designated by the Administrator as
toxic, taking into account ". . . toxicity . . . persist-
ence . . . degradability . . . presence of the affected
organisms and the nature and extent of the effect of the
toxic pollutant on such organisms."
Owners and operators of pollution point sources shall
establish and maintain records; make reports; install,
use, and maintain monitoring equipment or methods, in-
cluding biological monitoring methods; and sample effluents
at locations, intervals, and with methods prescribed by
the Administrator.
On the basis of any information available that indicates
non-compliance of the requirements of a permit issued by
a State, the Administrator may notify the person in
alleged violation and the State of such findings. If
after the thirtieth day after notification the State has
not commenced appropriate enforcement action, the Adminis-
trator may issue a compliance order or bring civil action
to enforce the permit conditions or limitations.
Provide advice, technical assistance
and analyses required to establish
microbiological procedures.
Identification and quantification of
pollutants, including viruses,
designated as toxic by the Adminis-
trator.
Inspection of microbiological portions
of records, microbiological equipment
or methods used by owner or operator
of pollution point source; sampling
and analysis of effluents required to
be sampled by the owner or operator
of the pollution point source.
Provide advice and technical assistance
to the State and persons in non-compliance
to bring them into compliance; provide
analytical data, expertise and testimony
as required to establish EPA's case.
10
CO
image:
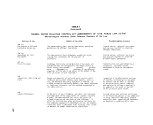 fO
(0
TABLE-1
(Continued)
FEDERAL WATER POLLUTION CONTROL ACT AMENDMENTS OF 1972, PUBLIC LAW 92-500
Microbiological Activities Under Relevant Sections of the Law
Sections of Law
310
International Pollution
Abatement
311
Oil and Hazardous Substance
Liability
312 (b)
Marine Sanitation Devices
403 (c)
Ocean Discharge Criteria
Summary of Sections
The Administrator may call a hearing when he has reason
to believe pollution is occurring from U. S. sources
". . . which endangers the health or welfare of
persons in a foreign country."
This section bans the discharge of oil and any other
"... elements and compounds which, when discharged
in any quantity into , » , waters . . . present an
imminent and substantial danger to the public health or
welfare, including, but not limited to, fish, shellfish,
wildlife, shorelines, and beaches," The ban applies
to any substance which fits this description and that
the Administrator designates as "hazardous."
Vessel sanitation devices must conform to performance
standards issued by the Administrator. New vessels must
comply within two years of promulgation; existing
vessels have five years in which to comply.
The Administrator is required to promulgate guidelines
for determining the degradation of territorial waters,
coastal waters and oceans.
Microbiological Activity
Microbiological surveys to determine
if domestic pollution is adversely
affecting a foreign country; survey
results provide the Administrator
with data to assist him in deciding
whether to call a hearing.
Performance of degradability tests
and experiments under actual or
simulated conditions.
Analyses to confirm compliance with
microbiological portions of per-
formance standards. Analyses to
determine if the device operates
in conformity with the standards;
the Coast Guard is responsible
for such testing of the devices.
Conduct required analyses to
establish guidelines for monitor-
ing' the degradation of territorial
and coastal waters and the
oceans.
image:
fO
(0
TABLE-1
(Continued)
FEDERAL WATER POLLUTION CONTROL ACT AMENDMENTS OF 1972, PUBLIC LAW 92-500
Microbiological Activities Under Relevant Sections of the Law
Sections of Law
310
International Pollution
Abatement
311
Oil and Hazardous Substance
Liability
312 (b)
Marine Sanitation Devices
403 (c)
Ocean Discharge Criteria
Summary of Sections
The Administrator may call a hearing when he has reason
to believe pollution is occurring from U. S. sources
". . . which endangers the health or welfare of
persons in a foreign country."
This section bans the discharge of oil and any other
"... elements and compounds which, when discharged
in any quantity into , » , waters . . . present an
imminent and substantial danger to the public health or
welfare, including, but not limited to, fish, shellfish,
wildlife, shorelines, and beaches," The ban applies
to any substance which fits this description and that
the Administrator designates as "hazardous."
Vessel sanitation devices must conform to performance
standards issued by the Administrator. New vessels must
comply within two years of promulgation; existing
vessels have five years in which to comply.
The Administrator is required to promulgate guidelines
for determining the degradation of territorial waters,
coastal waters and oceans.
Microbiological Activity
Microbiological surveys to determine
if domestic pollution is adversely
affecting a foreign country; survey
results provide the Administrator
with data to assist him in deciding
whether to call a hearing.
Performance of degradability tests
and experiments under actual or
simulated conditions.
Analyses to confirm compliance with
microbiological portions of per-
formance standards. Analyses to
determine if the device operates
in conformity with the standards;
the Coast Guard is responsible
for such testing of the devices.
Conduct required analyses to
establish guidelines for monitor-
ing' the degradation of territorial
and coastal waters and the
oceans.
image:
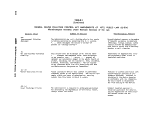 TABLE-1
(Continued)
FEDERAL WATER POLLUTION CONTROL ACT AMENDMENTS OF 1972, PUBLIC LAW 92-500
Microbiological Activities Under Relevant Sections of the Law
Sections of Law
405
Permits for Disposal of
Sewage Sludge
504
Emergency Powers
Summary of Sections
Permits are required for disposal of sewage sludge
(including removal of in-place sewage sludge from one
location and its deposit in another location) where
disposal "... would result in any pollutant . . .
entering . . . waters."
An injunction prohibiting discharge by a particular
source may be issued on proof of ". . . imminent and
substantial endangerment to the health of persons or
to the welfare of persons where such endangerment is
to the livelihood of such persons,"
Microbiological Activity
Analysis of sludges at tine of
transport and at disposal site to
determine compliance or non-compliance
with permit requirements.
Detection of pathogens in water and
from their sources; and enumeration
of indicators authorizing closure
of shellfish beds and identifica-
tion of pollutant sources.
ro
CO
CO
image:
TABLE-1
(Continued)
FEDERAL WATER POLLUTION CONTROL ACT AMENDMENTS OF 1972, PUBLIC LAW 92-500
Microbiological Activities Under Relevant Sections of the Law
Sections of Law
405
Permits for Disposal of
Sewage Sludge
504
Emergency Powers
Summary of Sections
Permits are required for disposal of sewage sludge
(including removal of in-place sewage sludge from one
location and its deposit in another location) where
disposal "... would result in any pollutant . . .
entering . . . waters."
An injunction prohibiting discharge by a particular
source may be issued on proof of ". . . imminent and
substantial endangerment to the health of persons or
to the welfare of persons where such endangerment is
to the livelihood of such persons,"
Microbiological Activity
Analysis of sludges at tine of
transport and at disposal site to
determine compliance or non-compliance
with permit requirements.
Detection of pathogens in water and
from their sources; and enumeration
of indicators authorizing closure
of shellfish beds and identifica-
tion of pollutant sources.
ro
CO
CO
image:
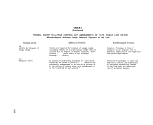 (0
<D
APPENDIX A
TABLE-2
MARINE PROTECTION, RESEARCH AND SANCTUARIES ACT OF 1972, PUBLIC LAW 92-532
Microbiological Activities Under Enforcement and Compliance Monitoring Sections
Sections of Law
m
o
33
i
o
2
p-
I
1
to
102
EPA Permits
Dumping
for Ocean
103
Corps of Engineer Permits
Summary of Sections
Establishment of a program for the issuance of EPA permits
based on criteria which consider the effects of ocean
dumping on human welfare, shellfish and fisheries
resources, plant and animal life, shorelines, beaches,
and marine ecosystems.
The responsibility for issuing permits (based on the
criteria in Section 102 above) for the ocean dumping
of dredged materials is under the jurisdiction of the
Army Corps of Engineers,
Microbiological Activity
Analyses to determine compliance or
non-compliance with microbiological
portions of permit requirements.
Possible conduct of microbiological
analyses to determine that the
proposed dumping ". . .will not un-
reasonably degrade or endanger human
health, welfare, or amenities, or
the marine environment, ecological
systems, or economic potentialities."
(Regulations in 40 CFR 227 set forth
criteria for evaluation of permit
applications for materials containing
living organisms. See especially 227.36.)
Analyses to determine compliance
or non-compliance with microbiolog-
ical portions of permit requirements.
image:
(0
<D
APPENDIX A
TABLE-2
MARINE PROTECTION, RESEARCH AND SANCTUARIES ACT OF 1972, PUBLIC LAW 92-532
Microbiological Activities Under Enforcement and Compliance Monitoring Sections
Sections of Law
m
o
33
i
o
2
p-
I
1
to
102
EPA Permits
Dumping
for Ocean
103
Corps of Engineer Permits
Summary of Sections
Establishment of a program for the issuance of EPA permits
based on criteria which consider the effects of ocean
dumping on human welfare, shellfish and fisheries
resources, plant and animal life, shorelines, beaches,
and marine ecosystems.
The responsibility for issuing permits (based on the
criteria in Section 102 above) for the ocean dumping
of dredged materials is under the jurisdiction of the
Army Corps of Engineers,
Microbiological Activity
Analyses to determine compliance or
non-compliance with microbiological
portions of permit requirements.
Possible conduct of microbiological
analyses to determine that the
proposed dumping ". . .will not un-
reasonably degrade or endanger human
health, welfare, or amenities, or
the marine environment, ecological
systems, or economic potentialities."
(Regulations in 40 CFR 227 set forth
criteria for evaluation of permit
applications for materials containing
living organisms. See especially 227.36.)
Analyses to determine compliance
or non-compliance with microbiolog-
ical portions of permit requirements.
image:
 APPENDIX A
TABLE-3
SAFE DRINKING WATER ACT OF 1974, PUBLIC LAW 93-523
Microbiological Activities Under Enforcement and Compliance Sections
Sections of Law
1412 (a) (1)
Establish Primary Interim
Standards
1412 (c)
Proposed National Secondary
Drinking Water Regulations
1412 (e)
Study by Independent
Organizations
Summary of Sections
EPA has the responsibility for establishing national interim
primary drinking water regulations which will protect human
health by using the technology which is generally available.
The Agency promulgates National Secondary Drinking Water
regulations which are mostly related to the aesthetic
characteristics of drinking water.
The Administrator shall arrange studies with the National
Academy of Sciences or other independent scientific
organization to determine maximum contaminant levels of
known or anticipated contaminants, and to identify those •
contaminants in drinking water which are at levels too
low to measure.
Microbiological Activity
Provide the expertise and advice to
assist in the establishment of the
required safe interim primary standards
for drinking water.
Provide the expertise and advice to
EPA for establishing National Second-
ary Standards relating to micro-
biology.
Provide input as needed for estab-
lishment, performance and evaluation
of studies by the National Academy
of Sciences or other independent
scientific organization.
1413 (b)
Recommended Maximum
Contaminant Levels
1414 (a) (1) (A)
Failure by State to Assure
Enforcement of Standards
The Agency must also establish for each contaminant a
maximum contaminant level which will produce no known
adverse effects and allows an adequate margin of safety.
If the Administrator finds that a State with primary en-
forcement responsibility has not maintained compliance in
its public water systems, he shall so notify the State and
provide assistance in achieving compliance.
Conduct research and monitoring analyses
to establish acceptable levels and
maximum levels for bacterial indicators,
pathogens and viruses.
Provide advice and technical assistance
to the State and water systems to
bring them into compliance.
M
(0
cn
image:
APPENDIX A
TABLE-3
SAFE DRINKING WATER ACT OF 1974, PUBLIC LAW 93-523
Microbiological Activities Under Enforcement and Compliance Sections
Sections of Law
1412 (a) (1)
Establish Primary Interim
Standards
1412 (c)
Proposed National Secondary
Drinking Water Regulations
1412 (e)
Study by Independent
Organizations
Summary of Sections
EPA has the responsibility for establishing national interim
primary drinking water regulations which will protect human
health by using the technology which is generally available.
The Agency promulgates National Secondary Drinking Water
regulations which are mostly related to the aesthetic
characteristics of drinking water.
The Administrator shall arrange studies with the National
Academy of Sciences or other independent scientific
organization to determine maximum contaminant levels of
known or anticipated contaminants, and to identify those •
contaminants in drinking water which are at levels too
low to measure.
Microbiological Activity
Provide the expertise and advice to
assist in the establishment of the
required safe interim primary standards
for drinking water.
Provide the expertise and advice to
EPA for establishing National Second-
ary Standards relating to micro-
biology.
Provide input as needed for estab-
lishment, performance and evaluation
of studies by the National Academy
of Sciences or other independent
scientific organization.
1413 (b)
Recommended Maximum
Contaminant Levels
1414 (a) (1) (A)
Failure by State to Assure
Enforcement of Standards
The Agency must also establish for each contaminant a
maximum contaminant level which will produce no known
adverse effects and allows an adequate margin of safety.
If the Administrator finds that a State with primary en-
forcement responsibility has not maintained compliance in
its public water systems, he shall so notify the State and
provide assistance in achieving compliance.
Conduct research and monitoring analyses
to establish acceptable levels and
maximum levels for bacterial indicators,
pathogens and viruses.
Provide advice and technical assistance
to the State and water systems to
bring them into compliance.
M
(0
cn
image:
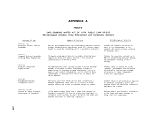 <0
m
TABLE-3
{Continued}
SAFE DRINKING WATER ACT OF 1974, PUBLIC LAW 93-523
Microbiological Activities Under Enforcement and Compliance Sections
s
i
6
r~
O
»
§
g
1-
»*
(O
Sections of Law
1414 (a) (1) (B)
Civil Action
1414 (f)
Non-Coinplianee/Public Hearings
1421
Underground Injection Control
Systems
1431 (a)
Emergency Powers
410
Amendments to the Bottled
Drinking Water Standards
(Section 4. Chapter IV of the
Federal Food, Drug, and
Cosmetic Act)
Summary of Sections
If the Administrator determines that the State abused its
discretion in carrying out its primary enforcement responsi-
bility, the Administrator may commence a civil action to
enforce the standards.
If the Administrator finds non-compliance by a public
water system in a State with primary enforcement responsi-
bility, he may hold hearings to gather information from
technical and other experts and may issue recommendations
on actions which will achieve compliance.
The Administrator shall publish and promulgate regulations
for State underground injection control systems after
public hearing. The States will issue permits for under-
ground injection which will not endanger drinking water
sources; and will inspect, monitor and keep records of
the permitted underground injection wells.
EPA may obtain an injunction against a non-complying water
system on proof of the presence of a contaminant which
presents an imminent and substantial endangerment to human
health and if the appropriate State or local authority has
not acted.
After the promulgation of drinking water regulations, the
Food and Drug Administration must either promulgate amend-
ments to the bottled drinking water standards or publish
reasons for not making amendments.
H i crob i o 1 og i c a 1 Activity
Provide analytical data, expertise
and testimony as required to establish
EPA's case.
Provide confirming analytical data,
recommendations and expert advice on
microbiological aspects demonstrating
non-compliance.
Determine the feasibility of micro-
biological criteria and perform
analyses of injected wastewaters and
of ground waters if required.
Proof of presence of bacterial indica-
tors, pathogens or viruses in suffi-
cient numbers to pose a danger to
human health.
Conduct analyses to determine if the
quality of bottled drinking water
meets drinking water regulations.
image:
<0
m
TABLE-3
{Continued}
SAFE DRINKING WATER ACT OF 1974, PUBLIC LAW 93-523
Microbiological Activities Under Enforcement and Compliance Sections
s
i
6
r~
O
»
§
g
1-
»*
(O
Sections of Law
1414 (a) (1) (B)
Civil Action
1414 (f)
Non-Coinplianee/Public Hearings
1421
Underground Injection Control
Systems
1431 (a)
Emergency Powers
410
Amendments to the Bottled
Drinking Water Standards
(Section 4. Chapter IV of the
Federal Food, Drug, and
Cosmetic Act)
Summary of Sections
If the Administrator determines that the State abused its
discretion in carrying out its primary enforcement responsi-
bility, the Administrator may commence a civil action to
enforce the standards.
If the Administrator finds non-compliance by a public
water system in a State with primary enforcement responsi-
bility, he may hold hearings to gather information from
technical and other experts and may issue recommendations
on actions which will achieve compliance.
The Administrator shall publish and promulgate regulations
for State underground injection control systems after
public hearing. The States will issue permits for under-
ground injection which will not endanger drinking water
sources; and will inspect, monitor and keep records of
the permitted underground injection wells.
EPA may obtain an injunction against a non-complying water
system on proof of the presence of a contaminant which
presents an imminent and substantial endangerment to human
health and if the appropriate State or local authority has
not acted.
After the promulgation of drinking water regulations, the
Food and Drug Administration must either promulgate amend-
ments to the bottled drinking water standards or publish
reasons for not making amendments.
H i crob i o 1 og i c a 1 Activity
Provide analytical data, expertise
and testimony as required to establish
EPA's case.
Provide confirming analytical data,
recommendations and expert advice on
microbiological aspects demonstrating
non-compliance.
Determine the feasibility of micro-
biological criteria and perform
analyses of injected wastewaters and
of ground waters if required.
Proof of presence of bacterial indica-
tors, pathogens or viruses in suffi-
cient numbers to pose a danger to
human health.
Conduct analyses to determine if the
quality of bottled drinking water
meets drinking water regulations.
image:
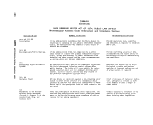 APPENDIX B
FROM; Manual for the Interim Certification of Laboratories Involved in Analyzing Public Drinking Water Supplies, EPA
600/8-78-008, May, 1978. OMTS, Office of REsearch and Development, U.S. Environmental Protection Agency,
Washington, DC 204 60
Chapter V
MICROBIOLOGY: CRITERIA AND PROCEDURES FOR INTERIM
CERTIFICATION OF LABORATORIES INVOLVED
IN ANALYSIS OF PUBLIC WATER SUPPLIES
The criteria and procedures described herein, shown in bold, are minimum requirements consid-
ered essential for laboratories seeking certification for microbiological analysis of public water sup-
plies. The requirements include laboratory equipment and supplies, laboratory practices, methodology,
sample collection, and certain quality control measures. The other items, involving personnel, facili-
ties, additional quality control procedures, data reporting, and action response, are optional. For a
commercial laboratory to qualify for certification in microbiology, it must process a minimum of 20
potable water samples per month using either the multiple tube procedure or membrane filter test.
Until National Revised Primary Drinking Water Regulations require certification of water supply
laboratories, all specifications will be considered as guidelines to be used by certification officials.
At that time, minimal requirements will be essential to certification of laboratories involved in anal-
ysis of public water supplies.
The minimum requirements must be in compliance, or action must be taken to correct defi-
ciencies prior to certification. A laboratory that exceeds these minimum requirements is encouraged
to maintain and improve those higher standards for facilities, equipment, methodology, and quality
control, as well as to continue the upgrading of personnel through training efforts to ensure routine
production of reliable data.
The required methods of analyses are referenced in "Standard Methods for the Examination of
Water and Wastewater," 13th edition; however, some criteria in this document are more specific and
permit fewer variations than "Standard Methods."
The guidelines for quality assurance procedures are those in EPA's quality assurance propam as
cited in the EPA Manual, "Microbiological Methods for Monitoring the Environment" (EMSL EPA
Cincinnati). A valuable source of further detail and background information for the laboratory eval-
uator is available in EPA's "Handbook for Evaluating Water Bacteriological Laboratories" (EPA-
670/9-75-006, August 1976).
Minimum requirements are shown throughout in bold.
PERSONNEL1 (OPTIONAL REQUIREMENTS)
Analyst
The analyst performs microbiological tests with minimal supervision in those specialties for
which he is qualified by education and/or training and experience.
1 Exceptions will be made for those persons employed by the laboratory and currently doing the required analy-
ses prior to promulgation of the interim regulations provided that within 2 years after June 24, 1977, they receive a
minimum of 2 weeks of additional training in water microbiology.
297
image:
APPENDIX B
FROM; Manual for the Interim Certification of Laboratories Involved in Analyzing Public Drinking Water Supplies, EPA
600/8-78-008, May, 1978. OMTS, Office of REsearch and Development, U.S. Environmental Protection Agency,
Washington, DC 204 60
Chapter V
MICROBIOLOGY: CRITERIA AND PROCEDURES FOR INTERIM
CERTIFICATION OF LABORATORIES INVOLVED
IN ANALYSIS OF PUBLIC WATER SUPPLIES
The criteria and procedures described herein, shown in bold, are minimum requirements consid-
ered essential for laboratories seeking certification for microbiological analysis of public water sup-
plies. The requirements include laboratory equipment and supplies, laboratory practices, methodology,
sample collection, and certain quality control measures. The other items, involving personnel, facili-
ties, additional quality control procedures, data reporting, and action response, are optional. For a
commercial laboratory to qualify for certification in microbiology, it must process a minimum of 20
potable water samples per month using either the multiple tube procedure or membrane filter test.
Until National Revised Primary Drinking Water Regulations require certification of water supply
laboratories, all specifications will be considered as guidelines to be used by certification officials.
At that time, minimal requirements will be essential to certification of laboratories involved in anal-
ysis of public water supplies.
The minimum requirements must be in compliance, or action must be taken to correct defi-
ciencies prior to certification. A laboratory that exceeds these minimum requirements is encouraged
to maintain and improve those higher standards for facilities, equipment, methodology, and quality
control, as well as to continue the upgrading of personnel through training efforts to ensure routine
production of reliable data.
The required methods of analyses are referenced in "Standard Methods for the Examination of
Water and Wastewater," 13th edition; however, some criteria in this document are more specific and
permit fewer variations than "Standard Methods."
The guidelines for quality assurance procedures are those in EPA's quality assurance propam as
cited in the EPA Manual, "Microbiological Methods for Monitoring the Environment" (EMSL EPA
Cincinnati). A valuable source of further detail and background information for the laboratory eval-
uator is available in EPA's "Handbook for Evaluating Water Bacteriological Laboratories" (EPA-
670/9-75-006, August 1976).
Minimum requirements are shown throughout in bold.
PERSONNEL1 (OPTIONAL REQUIREMENTS)
Analyst
The analyst performs microbiological tests with minimal supervision in those specialties for
which he is qualified by education and/or training and experience.
1 Exceptions will be made for those persons employed by the laboratory and currently doing the required analy-
ses prior to promulgation of the interim regulations provided that within 2 years after June 24, 1977, they receive a
minimum of 2 weeks of additional training in water microbiology.
297
image:
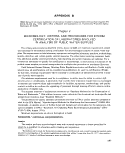 • Academic training: Minimum of high school diploma in academic or laboratory-oriented
vocational courses.
• Job training: Minimum of 30 days on-the-job training plus one week of supplementary train-
ing acceptable to the Federal and State regulatory agency or agency responsible for primacy.
Personnel should take advantage of courses available to Federal and State regulatory
agencies.
* Supervision: Supervision by an experienced professional scientist. In the small water plant
laboratory consisting of a single analyst, the services of a State-approved outside consultant
must be available.
Supervisor I Consultant
The supervisor directs technical personnel in the proper performance of laboratory procedures
and the reporting of results. If no technical supervisor is available, a consultant should be available.
* Academic training: Minimum of a bachelor's degree in microbiology, biology, chemistry, or
a closely related field. Exceptions will be made for employees of laboratories that serve
communities with populations of 50,000 or less if they receive at least 2 weeks of additional
training in water microbiology from a Federal agency, State agency, or university.
» Job training: Technical training in water microbiology for a minimum of 2 weeks from a
Federal agency, State agency, or university in the parameter to be tested. Consultant must
have 1 year of bench experience, approved by the State, in total coliform analysis. State
laboratory expertise would be the most desirable source of outside consultation.
• Experience: One year of bench experience in sanitary (water, milk, or food) microbiology.
LABORATORY FACILITIES (OPTIONAL REQUIREMENTS)
Laboratory space should be adequate (200 ft2 and 6 linear ft of bench space per analyst) to
accommodate periods of peak work load. Working space requirements should include sufficient
bench-top area for processing samples; storage space for media, glassware, and portable equipment
items; floor space for stationary equipment (incubators, waterbaths, refrigerators, etc.); and associ-
ated area for cleaning glassware and sterilizing materials. The space required for both laboratory
work and materials preparation in small water plant laboratories may be consolidated into one
room, with the various functions allocated to different parts of the room.
Facilities should be clean, air-conditioned, and with adequate lighting at bench top (100 ft-
candles).
Laboratory safety, which must be an integral and conscious effort in laboratory operations,
should provide safeguards to avoid electric shock, prevent fire, prevent accidental chemical spills,
and minimize microbiological dangers, facility deficiencies, and equipment failures. While safety
is not an aspect of laboratory certification, the evaluation should point out on an informal basis,
potential safety problems observed during an on-site visit.
298 <SEPA MICROBIOLOGICAL MANUAL 1978
image:
• Academic training: Minimum of high school diploma in academic or laboratory-oriented
vocational courses.
• Job training: Minimum of 30 days on-the-job training plus one week of supplementary train-
ing acceptable to the Federal and State regulatory agency or agency responsible for primacy.
Personnel should take advantage of courses available to Federal and State regulatory
agencies.
* Supervision: Supervision by an experienced professional scientist. In the small water plant
laboratory consisting of a single analyst, the services of a State-approved outside consultant
must be available.
Supervisor I Consultant
The supervisor directs technical personnel in the proper performance of laboratory procedures
and the reporting of results. If no technical supervisor is available, a consultant should be available.
* Academic training: Minimum of a bachelor's degree in microbiology, biology, chemistry, or
a closely related field. Exceptions will be made for employees of laboratories that serve
communities with populations of 50,000 or less if they receive at least 2 weeks of additional
training in water microbiology from a Federal agency, State agency, or university.
» Job training: Technical training in water microbiology for a minimum of 2 weeks from a
Federal agency, State agency, or university in the parameter to be tested. Consultant must
have 1 year of bench experience, approved by the State, in total coliform analysis. State
laboratory expertise would be the most desirable source of outside consultation.
• Experience: One year of bench experience in sanitary (water, milk, or food) microbiology.
LABORATORY FACILITIES (OPTIONAL REQUIREMENTS)
Laboratory space should be adequate (200 ft2 and 6 linear ft of bench space per analyst) to
accommodate periods of peak work load. Working space requirements should include sufficient
bench-top area for processing samples; storage space for media, glassware, and portable equipment
items; floor space for stationary equipment (incubators, waterbaths, refrigerators, etc.); and associ-
ated area for cleaning glassware and sterilizing materials. The space required for both laboratory
work and materials preparation in small water plant laboratories may be consolidated into one
room, with the various functions allocated to different parts of the room.
Facilities should be clean, air-conditioned, and with adequate lighting at bench top (100 ft-
candles).
Laboratory safety, which must be an integral and conscious effort in laboratory operations,
should provide safeguards to avoid electric shock, prevent fire, prevent accidental chemical spills,
and minimize microbiological dangers, facility deficiencies, and equipment failures. While safety
is not an aspect of laboratory certification, the evaluation should point out on an informal basis,
potential safety problems observed during an on-site visit.
298 <SEPA MICROBIOLOGICAL MANUAL 1978
image:
 LABORATORY EQUIPMENT, SUPPLIES, AND MATERIALS (MINIMUM REQUIREMENTS)
The laboratory must have available or access to the items required for the total coliform mem-
brane filter or most probable number procedures as listed below.
» pH Meter: Accuracy must be ±0.1 units.
• Balances—top loader or pan: Balance must be clean, not corroded, and be provided with ap-
propriate weights of good quality. Balance must tare out and detect 50-mg weight accurate-
ly: this sensitivity is required for use in general media preparation of 2g or larger quantities.
• Temperature-monitoring devices:
—Glass or metal thermometers must be graduated in 0.5°C increments.
—Continuous temperature recording devices must be sensitive to within 0.5°C.
—Liquid column of glass thermometers must have no separation.
—A certified thermometer or one of equivalent accuracy must be available.
• Air (or water jacketed) incubator/incubator rooms/waterbatfts/aluminum block incubators:
—Unit must maintain internal temperature of 35.0° ± 0.5°C in area of use at maximum
loading.
—When aluminum block incubators are used, culture dishes and tubes must be snug-fitting in
block.
• Autoclave:
—Autoclave must be in good operating condition when observed during operational cycle or
when time-temperature charts are read. Vertical autoclaves are not recommended. For
most efficient operation, a double-walled autoclave constructed of stainless steel is sug-
gested (optional).
—Autoclave must have pressure and temperature gauges on exhaust side and an operating
safety valve.
—Autoclave must reach sterilization temperature (121°C) and be maintained during steriliza-
tion cycle: no more than 45 minutes is required for'a complete cycle.
—Depressurization must not produce air bubbles in fermentation media.
• Hot-air oven: Oven must be constructed to ensure a stable sterilization temperature. Its use
is optional for sterilization of glass pipets, bottles, flasks, culture dishes, etc. (optional).
• Refrigerator: Refrigerator must hold temperature at 1° to 4.4°C (34° to 40°F).
• Optical/counting/lighting equipment: Low power magnification device (preferably binocular
microscope with 10 to 15x) with fluorescent light source must be available for counting MF
colonies. A mechanical hand tally can be used for counting colonies (optional).
• Inoculation equipment:
—Loop diameter must be at least 3 mm and of 22 to 24 gauge Nichrome, chromel, or
299
image:
LABORATORY EQUIPMENT, SUPPLIES, AND MATERIALS (MINIMUM REQUIREMENTS)
The laboratory must have available or access to the items required for the total coliform mem-
brane filter or most probable number procedures as listed below.
» pH Meter: Accuracy must be ±0.1 units.
• Balances—top loader or pan: Balance must be clean, not corroded, and be provided with ap-
propriate weights of good quality. Balance must tare out and detect 50-mg weight accurate-
ly: this sensitivity is required for use in general media preparation of 2g or larger quantities.
• Temperature-monitoring devices:
—Glass or metal thermometers must be graduated in 0.5°C increments.
—Continuous temperature recording devices must be sensitive to within 0.5°C.
—Liquid column of glass thermometers must have no separation.
—A certified thermometer or one of equivalent accuracy must be available.
• Air (or water jacketed) incubator/incubator rooms/waterbatfts/aluminum block incubators:
—Unit must maintain internal temperature of 35.0° ± 0.5°C in area of use at maximum
loading.
—When aluminum block incubators are used, culture dishes and tubes must be snug-fitting in
block.
• Autoclave:
—Autoclave must be in good operating condition when observed during operational cycle or
when time-temperature charts are read. Vertical autoclaves are not recommended. For
most efficient operation, a double-walled autoclave constructed of stainless steel is sug-
gested (optional).
—Autoclave must have pressure and temperature gauges on exhaust side and an operating
safety valve.
—Autoclave must reach sterilization temperature (121°C) and be maintained during steriliza-
tion cycle: no more than 45 minutes is required for'a complete cycle.
—Depressurization must not produce air bubbles in fermentation media.
• Hot-air oven: Oven must be constructed to ensure a stable sterilization temperature. Its use
is optional for sterilization of glass pipets, bottles, flasks, culture dishes, etc. (optional).
• Refrigerator: Refrigerator must hold temperature at 1° to 4.4°C (34° to 40°F).
• Optical/counting/lighting equipment: Low power magnification device (preferably binocular
microscope with 10 to 15x) with fluorescent light source must be available for counting MF
colonies. A mechanical hand tally can be used for counting colonies (optional).
• Inoculation equipment:
—Loop diameter must be at least 3 mm and of 22 to 24 gauge Nichrome, chromel, or
299
image:
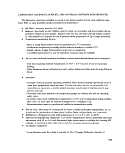 platinum-indium wire. Single-service metal loops, disposable dry heat-sterilized hardwood
applicator sticks, pre-sterilized plastic, or metal loops may be used (optional).
Membrane filtration equipment:
—Units must be made of stainless steel, glass, or autoclavable plastic. Equipment must not
leak and must be uncorroded.
—Field equipment is acceptable for coliform detection only when standard laboratory MF
procedures are followed.
Membrane fitters and pads:
—Membrane filters must be manufactured from cellulose ester materials, white, grid-marked,
47-mm diameter, 0.45 /am pore size. Another pore size may be used if the manufacturer
gives performance data equal to or better than the 0.45-Atm membrane filter.
—Membranes and pads must be autoclavable or presterilized.
Laboratory glassware, plastic ware, and metal utemiJs:
—Except for disposable plastic ware, items must be resistant to effects of corrosion, high
temperature, and vigorous cleaning operations. Metal utensils made of stainless steel are
preferred (optional).
—Flasks, beakers, pipets, dilution botfles, culture dishes, culture tubes, and other glassware
must be of borosilicate glass and free of chips, cracks, or excessive etching. Volumetric
glassware should be Class A, denoting that it meets Federal specifications and need not be
calibrated before use.
—Plastic items must be of clear, inert, nontoxic material arid must retain accurate calibration
marks after repeated autoclaving.
Culture dishes:
—Sterile tight or loose-lid plastic culture dishes or loose-lid glass culture dishes must be used.
—For loose-lid culture dishes, relative humidity in the incubator must be at least 90 percent.
—Culture dish containers must be aluminum or stainless steel; or dishes may be wrapped in
heavy aluminum foil or char-resistant paper.
—Open packs of disposable sterile culture dishes must be reseated between uses.
Culture tubes and closures:
—Culture tubes must be made of borosilicate glass or other corrosion resistant glass and
must be of a sufficient size to contain the culture medium, as well as the sample portions
employed, without being more than 3/4 full. It is desirable that the fermentation vial
extend above the medium (optional).
—Caps must be snug-fitting stainless steel or plastic; loose-fitting aluminum caps or screw
caps are also acceptable.
300 4*ER^ MICROBIOLOGICAL MANUAL 1978
image:
platinum-indium wire. Single-service metal loops, disposable dry heat-sterilized hardwood
applicator sticks, pre-sterilized plastic, or metal loops may be used (optional).
Membrane filtration equipment:
—Units must be made of stainless steel, glass, or autoclavable plastic. Equipment must not
leak and must be uncorroded.
—Field equipment is acceptable for coliform detection only when standard laboratory MF
procedures are followed.
Membrane fitters and pads:
—Membrane filters must be manufactured from cellulose ester materials, white, grid-marked,
47-mm diameter, 0.45 /am pore size. Another pore size may be used if the manufacturer
gives performance data equal to or better than the 0.45-Atm membrane filter.
—Membranes and pads must be autoclavable or presterilized.
Laboratory glassware, plastic ware, and metal utemiJs:
—Except for disposable plastic ware, items must be resistant to effects of corrosion, high
temperature, and vigorous cleaning operations. Metal utensils made of stainless steel are
preferred (optional).
—Flasks, beakers, pipets, dilution botfles, culture dishes, culture tubes, and other glassware
must be of borosilicate glass and free of chips, cracks, or excessive etching. Volumetric
glassware should be Class A, denoting that it meets Federal specifications and need not be
calibrated before use.
—Plastic items must be of clear, inert, nontoxic material arid must retain accurate calibration
marks after repeated autoclaving.
Culture dishes:
—Sterile tight or loose-lid plastic culture dishes or loose-lid glass culture dishes must be used.
—For loose-lid culture dishes, relative humidity in the incubator must be at least 90 percent.
—Culture dish containers must be aluminum or stainless steel; or dishes may be wrapped in
heavy aluminum foil or char-resistant paper.
—Open packs of disposable sterile culture dishes must be reseated between uses.
Culture tubes and closures:
—Culture tubes must be made of borosilicate glass or other corrosion resistant glass and
must be of a sufficient size to contain the culture medium, as well as the sample portions
employed, without being more than 3/4 full. It is desirable that the fermentation vial
extend above the medium (optional).
—Caps must be snug-fitting stainless steel or plastic; loose-fitting aluminum caps or screw
caps are also acceptable.
300 4*ER^ MICROBIOLOGICAL MANUAL 1978
image:
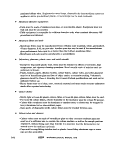 • Measuring equipment:
—Sterile, glass or plastic pipets must be used for measuring 10 ml or less.
—Pipets must deliver the required volume quickly and accurately within a 2,5 percent toler-
ance.
—Pipets must not be badly etched; mouthpiece or delivery tips must not be chipped; gradua-
tion marks must be legible.
—Open packs of disposable sterile pipets must be resealed between uses.
—Pipet containers must be aluminum or stainless steel.
—Graduated cylinders must be used for samples larger than 10 ml; calibrated membrane
filter funnel markings are permissible provided accuracy is within a 2.5 percent tolerance.
GENERAL LABORATORY PRACTICES (MINIMUM REQUIREMENTS)
Sterilization Procedures
• The following times and temperatures must be used for autoclaving materials:
Material Temperature!Minimum Time
Membrane filters and pads 121°C/10min.
Carbohydrate-containing media 121°C/12-15min.
(lauryl tryptose, brilliant green
lactose bUe broth, etc.)
Contaminated materials and discarded 121 C/30min.
tests
Membrane filter assemblies (wrapped), 121 C/30min.
sample coDection bottles (empty),
individual glassware items
Rinse water volumes of 500 ml to 1,000 121°C/45 min.
ml
Rinse water in excess of 1,000 ml 121°C/time adjusted for volume; check
for sterility
Dilution water blank 121°C/30 min.
Membrane filter assembles must be sterilized between sample filtration series. A filtration series
ends when 30 minutes or longer elapse between sample filtrations. At least 2 minutes of UV light or
boiling water may be used on membrane filter assembly to prevent bacterial carry-over between
filtrations (optional).
Dried glassware must be sterilized at a minimum of 170°C for 2 hours.
Laboratory Pure Water (Distilled, Deionized, or Other Processed Waters)
• An analyst must test the quality of the laboratory pure water or have it tested by the State
or by a State-authorized laboratory.
MICROBIOLOGICAL MANUAL 1978 301
image:
• Measuring equipment:
—Sterile, glass or plastic pipets must be used for measuring 10 ml or less.
—Pipets must deliver the required volume quickly and accurately within a 2,5 percent toler-
ance.
—Pipets must not be badly etched; mouthpiece or delivery tips must not be chipped; gradua-
tion marks must be legible.
—Open packs of disposable sterile pipets must be resealed between uses.
—Pipet containers must be aluminum or stainless steel.
—Graduated cylinders must be used for samples larger than 10 ml; calibrated membrane
filter funnel markings are permissible provided accuracy is within a 2.5 percent tolerance.
GENERAL LABORATORY PRACTICES (MINIMUM REQUIREMENTS)
Sterilization Procedures
• The following times and temperatures must be used for autoclaving materials:
Material Temperature!Minimum Time
Membrane filters and pads 121°C/10min.
Carbohydrate-containing media 121°C/12-15min.
(lauryl tryptose, brilliant green
lactose bUe broth, etc.)
Contaminated materials and discarded 121 C/30min.
tests
Membrane filter assemblies (wrapped), 121 C/30min.
sample coDection bottles (empty),
individual glassware items
Rinse water volumes of 500 ml to 1,000 121°C/45 min.
ml
Rinse water in excess of 1,000 ml 121°C/time adjusted for volume; check
for sterility
Dilution water blank 121°C/30 min.
Membrane filter assembles must be sterilized between sample filtration series. A filtration series
ends when 30 minutes or longer elapse between sample filtrations. At least 2 minutes of UV light or
boiling water may be used on membrane filter assembly to prevent bacterial carry-over between
filtrations (optional).
Dried glassware must be sterilized at a minimum of 170°C for 2 hours.
Laboratory Pure Water (Distilled, Deionized, or Other Processed Waters)
• An analyst must test the quality of the laboratory pure water or have it tested by the State
or by a State-authorized laboratory.
MICROBIOLOGICAL MANUAL 1978 301
image:
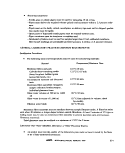 » Only water determined as laboratory pure water (see quality control section) can be used
for performing bacteriological analyses.
Although processed water may be acceptable for routine chemistry, there is a good chance that
it contains enough of some constituent to be toxic or stimulatory to microorganisms (optional).
Rinse and Dilution Water
Stock buffer solution must be prepared according to "Standard Methods" using laboratory pure
water adjusted to pH 7.2. Stock buffer must be autoclaved or filter-sterilized, labeled, dated, and
stored at 1° to 4.4°C. The stored buffer solution must be free of turbidity.
Rinse and dilution water must be prepared by adding 1.25 ml of stock buffer solution per liter
of laboratory pure water. Final pH must be 7.2 ± 0.1.
Media Preparation and Storage
The following are minimum requirements for storing and preparing media:
» Laboratories must use commercial dehydrated media for routine bacteriological procedures
as quality control measures.
• Lauryl tryptose and brilliant green lactose bile broths must be prepared according to
"Standard Methods"; lactose broth is not permitted.
• Dehydrated media containers must be kept tightly closed and stored in a cool, dry location.
Discolored or caked dehydrated media cannot be used.
• Laboratory pure water must be used; dissolution of the media must be completed before
dispensing to culture tubes or bottles.
• The membrane filter broth and agar media must be heated in a boiling water bath until com-
pletely dissolved.
» Membrane filter (MF) broths must be stored and refrigerated no longer than 96 hours. MF
agar media must be stored, refrigerated and used within 2 weeks.
• Most probable number (MPN) media prepared in tubes with loose-fitting caps must be used
within 1 week. If MPN media are refrigerated after sterilization, they must be incubated over-
night at 35° C to confirm usability. Tubes showing growth or gas bubbles must be discarded.
* Media in screw cap containers may be held up to 3 months, provided the media are stored in
the dark and evaporation is not excessive (0.5 ml per 10 ml total volume). Commercially
prepared liquid and agar media supplies may be used (optional).
• Ampouled media must be stored at 1° to 4.4°C (34° to 40°F); time must be limited to man-
ufacturer's expiration date.
METHODOLOGY (MINIMUM REQUIREMENTS)
The required procedures, which are mandatory, are described in the 13th edition of "Standard
Methods": standard coliform MPN tests (p. 664-668), single step or enrichment standard total
coliform membrane filter procedure (p. 679-683). Tentative methods are not acceptable. All other
procedures are considered alternative analytical techniques as described hi section 141.27
302 -&EPA MICROBIOLOGICAL MANUAL 1978
image:
» Only water determined as laboratory pure water (see quality control section) can be used
for performing bacteriological analyses.
Although processed water may be acceptable for routine chemistry, there is a good chance that
it contains enough of some constituent to be toxic or stimulatory to microorganisms (optional).
Rinse and Dilution Water
Stock buffer solution must be prepared according to "Standard Methods" using laboratory pure
water adjusted to pH 7.2. Stock buffer must be autoclaved or filter-sterilized, labeled, dated, and
stored at 1° to 4.4°C. The stored buffer solution must be free of turbidity.
Rinse and dilution water must be prepared by adding 1.25 ml of stock buffer solution per liter
of laboratory pure water. Final pH must be 7.2 ± 0.1.
Media Preparation and Storage
The following are minimum requirements for storing and preparing media:
» Laboratories must use commercial dehydrated media for routine bacteriological procedures
as quality control measures.
• Lauryl tryptose and brilliant green lactose bile broths must be prepared according to
"Standard Methods"; lactose broth is not permitted.
• Dehydrated media containers must be kept tightly closed and stored in a cool, dry location.
Discolored or caked dehydrated media cannot be used.
• Laboratory pure water must be used; dissolution of the media must be completed before
dispensing to culture tubes or bottles.
• The membrane filter broth and agar media must be heated in a boiling water bath until com-
pletely dissolved.
» Membrane filter (MF) broths must be stored and refrigerated no longer than 96 hours. MF
agar media must be stored, refrigerated and used within 2 weeks.
• Most probable number (MPN) media prepared in tubes with loose-fitting caps must be used
within 1 week. If MPN media are refrigerated after sterilization, they must be incubated over-
night at 35° C to confirm usability. Tubes showing growth or gas bubbles must be discarded.
* Media in screw cap containers may be held up to 3 months, provided the media are stored in
the dark and evaporation is not excessive (0.5 ml per 10 ml total volume). Commercially
prepared liquid and agar media supplies may be used (optional).
• Ampouled media must be stored at 1° to 4.4°C (34° to 40°F); time must be limited to man-
ufacturer's expiration date.
METHODOLOGY (MINIMUM REQUIREMENTS)
The required procedures, which are mandatory, are described in the 13th edition of "Standard
Methods": standard coliform MPN tests (p. 664-668), single step or enrichment standard total
coliform membrane filter procedure (p. 679-683). Tentative methods are not acceptable. All other
procedures are considered alternative analytical techniques as described hi section 141.27
302 -&EPA MICROBIOLOGICAL MANUAL 1978
image:
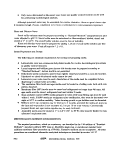 of the National Interim Primary Drinking Water Regulations. Application for the use of alternative
methods may require acceptable comparability data.
The membrane filter procedure is preferred because it permits analysis of large sample volumes
in reduced analysis time. The membranes should show good colony development over the entire
surface. The golden green metallic sheen colonies should be counted and recorded as the coliform
density per 100 ml of water sample. The following rules for reporting any problem with MF results
must be observed:
» Confluent growth; Growth (with or without discrete sheen colonies) covering the entire
filtration area of the membrane. Results are reported as "confluent growth per 100 ml, with
(or without) coliforms," and a new-sample requested.
» TNTC (Too numerous to count): The total number of bacterial colonies on the membrane is
too numerous (usually greater than 200 total colonies), not sufficiently distinct, or both. An
accurate count cannot be made. Results are reported as "TNTC per 100 ml, with (or with-
out) coliforms," and a new sample requested.
* Confluent growth and TNTC: A new sample must be requested, and the sample volumes
filtered must be adjusted to apply the MF procedure; otherwise the MPN procedure must be
used.
• Confirmed MPN test on problem supplies: If the laboratory has elected to use the MPN test
on water supplies that have a continued history of confluent growth or TNTC with the MF
procedure, all presumptive tubes with heavy growth without gas production should be sub-
mitted to the confirmed MPN test to check for the suppression of coliforms. A count is
adjusted based upon confirmation and a new sample requested. This procedure should be
carried out on one sample from each problem water supply once every 3 months.
SAMPLE COLLECTION, HANDLING, AND PRESERVATION (MINIMUM REQUIREMENTS)
When the laboratory has been delegated responsibility for sample collecting, handling, and pres-
ervation, there must be strict adherence to correct sampling procedures, complete identification of
the sample, and prompt transfer of the sample to the laboratory as described in "Standard Meth-
ods," 13th edition, section 450, p. 657-660.
The sample must be representative of the potable water system. The sampling program must
include examination of the finished water at selected sites that systematically cover the distribution
network.
Minimum sample frequency must be that specified in the National Interim Primary Drinking
Water Regulations, 40 CFR 141.21.
The collector must be trained in sampling procedures and approved by the State regulatory
authority or its delegated representative.
The water tap must be sampled after maintaining a steady flow for 2 or 3 minutes to clear serv-
ice line. The tap is free of aerator, strainer, hose attachment, or water purification devices.
The sample volume must be a minimum of 100 ml. The sample bottle must be filled only to the
shoulder to provide space for mixing.
The sample report form must be completed immediately after collection with location, date and
time of collection, chlorine residual, collector's name, and remarks.
303
image:
of the National Interim Primary Drinking Water Regulations. Application for the use of alternative
methods may require acceptable comparability data.
The membrane filter procedure is preferred because it permits analysis of large sample volumes
in reduced analysis time. The membranes should show good colony development over the entire
surface. The golden green metallic sheen colonies should be counted and recorded as the coliform
density per 100 ml of water sample. The following rules for reporting any problem with MF results
must be observed:
» Confluent growth; Growth (with or without discrete sheen colonies) covering the entire
filtration area of the membrane. Results are reported as "confluent growth per 100 ml, with
(or without) coliforms," and a new-sample requested.
» TNTC (Too numerous to count): The total number of bacterial colonies on the membrane is
too numerous (usually greater than 200 total colonies), not sufficiently distinct, or both. An
accurate count cannot be made. Results are reported as "TNTC per 100 ml, with (or with-
out) coliforms," and a new sample requested.
* Confluent growth and TNTC: A new sample must be requested, and the sample volumes
filtered must be adjusted to apply the MF procedure; otherwise the MPN procedure must be
used.
• Confirmed MPN test on problem supplies: If the laboratory has elected to use the MPN test
on water supplies that have a continued history of confluent growth or TNTC with the MF
procedure, all presumptive tubes with heavy growth without gas production should be sub-
mitted to the confirmed MPN test to check for the suppression of coliforms. A count is
adjusted based upon confirmation and a new sample requested. This procedure should be
carried out on one sample from each problem water supply once every 3 months.
SAMPLE COLLECTION, HANDLING, AND PRESERVATION (MINIMUM REQUIREMENTS)
When the laboratory has been delegated responsibility for sample collecting, handling, and pres-
ervation, there must be strict adherence to correct sampling procedures, complete identification of
the sample, and prompt transfer of the sample to the laboratory as described in "Standard Meth-
ods," 13th edition, section 450, p. 657-660.
The sample must be representative of the potable water system. The sampling program must
include examination of the finished water at selected sites that systematically cover the distribution
network.
Minimum sample frequency must be that specified in the National Interim Primary Drinking
Water Regulations, 40 CFR 141.21.
The collector must be trained in sampling procedures and approved by the State regulatory
authority or its delegated representative.
The water tap must be sampled after maintaining a steady flow for 2 or 3 minutes to clear serv-
ice line. The tap is free of aerator, strainer, hose attachment, or water purification devices.
The sample volume must be a minimum of 100 ml. The sample bottle must be filled only to the
shoulder to provide space for mixing.
The sample report form must be completed immediately after collection with location, date and
time of collection, chlorine residual, collector's name, and remarks.
303
image:
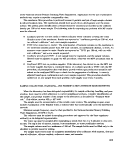 Sample bottles must be of at least 120 mi-capacity, sterile plastic or hard glass, wide mouthed
with stopper or plastic screw cap, and capable of withstanding repeated sterilization. Sodium thio-
sulfate (100 mg/1) is added to all sample bottles during preparation. As an example, 0.1 ml of a 10
percent solution is required in a 4-oz (120-mI) bottle.
Date and time of sample arrival must be added to the sample report form when sample is re-
ceived in the laboratory.
State regulations relating to chain-of-custody, if required, must be followed in the field and in
the laboratory.
Samples delivered by collectors to the laboratory must be analyzed on the day of collection.
Where it is necessary to send water samples by mail, bus, United Parcel Service, courier service,
or private shipping, holding/ transit time between sampling and analyses must not exceed 30 hours.
When possible, samples are refrigerated during transit and during storage in the laboratory (optional).
If the laboratory is required by State regulation to examine samples after 30 hours and up to 48
hours, the laboratory must indicate that the data may be invalid because of excessive delay before
sample processing. Samples arriving after 48 hours shall be refused without exception and a new
sample requested. (The problem of holding time is under investigation by EPA.)
QUALITY CONTROL PROGRAM
Minimum Requirement
A written description for current laboratory quality control program must be available for
review. Management, supervisors, ahd analysts participate in setting up the quality control pro-
gram, Each participant should have a copy of the quality control program and a detailed guide
of his own portion. A record on analytical quality control tests and quality control checks on
media, materials, and equipment must be prepared and retained for 3 years.
Analytical Quality Control Tests for General Laboratory Practices and Methodology
Minimum and optional requirements for analytical quality control tests for general practices
and methodology are:
» Minimum requirements;
—At least five sheen or borderline sheen colonies must be verified from each membrane con-
taining five or more such colonies. Counts must be adjusted based on verification. The
verification procedure must be conducted by transferring growth from colonies into lauryl
tryptose broth (LTB) tubes and then transferring growth from gas-positive LTB cultures to
brilliant green lactose bile (BGLB) tubes. Colonies must not be transferred exclusively to
BGLB because of the lower recovery of stressed coliforms in this more selective medium.
However, colonies may be transferred to LTB and BGLB simultaneously. Negative LTB
tubes must be reincubated a second day and confirmed if gas is produced. It is desirable to
verify all sheen and borderline sheen colonies (optional).
—A start and finish MF control test (rinse water, medium, and supplies) must be conducted
for each filtration series. If sterile controls indicate contamination, all data on samples
affected must be rejected and a request made for immediate resampling of those waters
involved in the laboratory error.
304 < MICROBIOLOGICAL MANUAL 1978
image:
Sample bottles must be of at least 120 mi-capacity, sterile plastic or hard glass, wide mouthed
with stopper or plastic screw cap, and capable of withstanding repeated sterilization. Sodium thio-
sulfate (100 mg/1) is added to all sample bottles during preparation. As an example, 0.1 ml of a 10
percent solution is required in a 4-oz (120-mI) bottle.
Date and time of sample arrival must be added to the sample report form when sample is re-
ceived in the laboratory.
State regulations relating to chain-of-custody, if required, must be followed in the field and in
the laboratory.
Samples delivered by collectors to the laboratory must be analyzed on the day of collection.
Where it is necessary to send water samples by mail, bus, United Parcel Service, courier service,
or private shipping, holding/ transit time between sampling and analyses must not exceed 30 hours.
When possible, samples are refrigerated during transit and during storage in the laboratory (optional).
If the laboratory is required by State regulation to examine samples after 30 hours and up to 48
hours, the laboratory must indicate that the data may be invalid because of excessive delay before
sample processing. Samples arriving after 48 hours shall be refused without exception and a new
sample requested. (The problem of holding time is under investigation by EPA.)
QUALITY CONTROL PROGRAM
Minimum Requirement
A written description for current laboratory quality control program must be available for
review. Management, supervisors, ahd analysts participate in setting up the quality control pro-
gram, Each participant should have a copy of the quality control program and a detailed guide
of his own portion. A record on analytical quality control tests and quality control checks on
media, materials, and equipment must be prepared and retained for 3 years.
Analytical Quality Control Tests for General Laboratory Practices and Methodology
Minimum and optional requirements for analytical quality control tests for general practices
and methodology are:
» Minimum requirements;
—At least five sheen or borderline sheen colonies must be verified from each membrane con-
taining five or more such colonies. Counts must be adjusted based on verification. The
verification procedure must be conducted by transferring growth from colonies into lauryl
tryptose broth (LTB) tubes and then transferring growth from gas-positive LTB cultures to
brilliant green lactose bile (BGLB) tubes. Colonies must not be transferred exclusively to
BGLB because of the lower recovery of stressed coliforms in this more selective medium.
However, colonies may be transferred to LTB and BGLB simultaneously. Negative LTB
tubes must be reincubated a second day and confirmed if gas is produced. It is desirable to
verify all sheen and borderline sheen colonies (optional).
—A start and finish MF control test (rinse water, medium, and supplies) must be conducted
for each filtration series. If sterile controls indicate contamination, all data on samples
affected must be rejected and a request made for immediate resampling of those waters
involved in the laboratory error.
304 < MICROBIOLOGICAL MANUAL 1978
image:
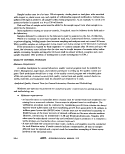 —The MPN test must be carried to completion, except for gram staining, on 10 percent of
positive confirmed samples. If no positive tubes result from potable water samples, the
completed test except for gram staining must be performed quarterly on at least one
positive source water.
—Laboratory pure water must be analyzed annually by the test for bactericidal properties
for distilled water ("Standard Methods," 13th edition, p. 646). Only satisfactorily tested
water is permissible in preparing media, reagents, rinse, and dilution water. If the tests do
not meet the requirements, corrective action must be taken and the water retested.
—Laboratory pure water must be analyzed monthly for conductance, pH, chlorine residual,
and standard plate count. If tests exceed requirements, corrective action must be taken
and the water retested.
—Laboratory pure water must not be in contact with heavy metals. It must be analyzed
initially and annually thereafter for trace metals (especially Pb, Cd, Cr, Cu, Ni, and Zn). If
tests do not meet the requirements, corrective action must be taken and the water re-
tested.
—Standard plate count procedure must be performed as described in "Standard Methods,"
13th edition, p. 660-662. Plates must be incubated at 35° ± 0.5°C for 48 hours.
—Requirements for laboratory pure water:
pH 5.5 - 7.5
Conductivity Greater than 0.2 megohm as resistivity or
less than 5.0 mieromhos/cm at 25°C
Trace metals:
A single metal Not greater than 0,05 mg/1
Total metals Equal to or less than 1.0 mg/1
Test for bactericidal properties of dis-
tilled water {"Standard Methods,"
13th edition, p. 646) 0.8 - 3.0
Free chlorine residual 0.0
Standard plate count Less than 10,000/ml
—Laboratory must analyze one quality control sample per year (when available) for param-
eter^) measured.
—Laboratory must satisfactorily analyze one unknown performance sample per year (when
available) for parameter(s) measured.
Optional requirements:
—Duplicate analyses should be run on known positive samples at a minimum frequency of
one per month. The duplicates may be run as a split sample by more than one analyst,
with each split being a 50-ml sample.
—Water plant laboratories should examine a minimum of one polluted water source per
month in addition to the required number of distribution samples.
—If there is more than one analyst in laboratory, at least once per month each analyst
305
image:
—The MPN test must be carried to completion, except for gram staining, on 10 percent of
positive confirmed samples. If no positive tubes result from potable water samples, the
completed test except for gram staining must be performed quarterly on at least one
positive source water.
—Laboratory pure water must be analyzed annually by the test for bactericidal properties
for distilled water ("Standard Methods," 13th edition, p. 646). Only satisfactorily tested
water is permissible in preparing media, reagents, rinse, and dilution water. If the tests do
not meet the requirements, corrective action must be taken and the water retested.
—Laboratory pure water must be analyzed monthly for conductance, pH, chlorine residual,
and standard plate count. If tests exceed requirements, corrective action must be taken
and the water retested.
—Laboratory pure water must not be in contact with heavy metals. It must be analyzed
initially and annually thereafter for trace metals (especially Pb, Cd, Cr, Cu, Ni, and Zn). If
tests do not meet the requirements, corrective action must be taken and the water re-
tested.
—Standard plate count procedure must be performed as described in "Standard Methods,"
13th edition, p. 660-662. Plates must be incubated at 35° ± 0.5°C for 48 hours.
—Requirements for laboratory pure water:
pH 5.5 - 7.5
Conductivity Greater than 0.2 megohm as resistivity or
less than 5.0 mieromhos/cm at 25°C
Trace metals:
A single metal Not greater than 0,05 mg/1
Total metals Equal to or less than 1.0 mg/1
Test for bactericidal properties of dis-
tilled water {"Standard Methods,"
13th edition, p. 646) 0.8 - 3.0
Free chlorine residual 0.0
Standard plate count Less than 10,000/ml
—Laboratory must analyze one quality control sample per year (when available) for param-
eter^) measured.
—Laboratory must satisfactorily analyze one unknown performance sample per year (when
available) for parameter(s) measured.
Optional requirements:
—Duplicate analyses should be run on known positive samples at a minimum frequency of
one per month. The duplicates may be run as a split sample by more than one analyst,
with each split being a 50-ml sample.
—Water plant laboratories should examine a minimum of one polluted water source per
month in addition to the required number of distribution samples.
—If there is more than one analyst in laboratory, at least once per month each analyst
305
image:
 should count the sheen colonies on a membrane from a polluted water source. Colonies on
the membrane should be verified and the analysts' counts compared to the verified count.
—A minimum number of the official water supply samples required for each system should
be analyzed by the State laboratory. For example, systems that are required to have less
than 10 samples examined per month should submit one additional sample to a State
authorized laboratory. Water systems with sample requirements above 10 per month
would submit two additional samples to a State authorized laboratory.
Quality Control Checks of Laboratory Media, Equipment, and Supplies
Minimum and optional requirements for quality control checks of laboratory media, equipment,
and supplies are:
• Minimum requirements:
—pH meter must be clean and calibrated each use period with pH 7.0 standard buffer. Buf-
fer aliquot must be used only once. Commercial buffer solutions must be dated on initial
use.
—Balances (top loader or pan) must be calibrated annually.
—Glass thermometers or continuous recording devices for incubators must be checked year-
ly and metal thermometers quarterly (or at more frequent intervals when necessary)
against a certified thermometer or one of equivalent accuracy.
—Temperature in air (or water jacketed) incubator/incubator room/waterbaths/aluminum
block incubators must be recorded continuously or recorded daily from in-place thermom-
eter^) immersed in liquid and placed on shelves in use.
—Date, time, and temperature must be recorded continuously or recorded for each steriliza-
tion cycle of the autoclave.
—Hqt air oven must be equipped with a thermometer calibrated in the range of 170°C or
with a temperature recording device. Records must be maintained showing date, time/, and
temperature of each sterilization cycle. It is desirable to place the thermometer bulb in
sand and to avoid overcrowding (optional).
—Membrane filters used must be those recommended by the manufacturer for water analy-
sis. The recommendation must be based on data relating to ink toxicity, recovery, reten-
tion, and absence of growth-promoting substances.
—Washing processes must provide clean glassware with no stains or spotting. With initial use
of a detergent or washing product and whenever a different washing product is used, the
rinsing process must demonstrate that it provides glassware free of toxic material by the
inhibitory residue test ("Standard Methods," 13th edition, p. 643).
—At least one bottle per batch of sterilized sample bottles must be checked by adding ap-
proximately 25 ml of sterile LTB broth to each bottle. It must be incubated at 35 ± 0.5°C
for 24 hours and checked for growth.
—Service contracts or approved internal protocols must be maintained on balances, auto-
clave, water still, etc., and the service records entered in a log book.
306 &EPA MICROBIOLOGICAL MANUAL 1978
image:
should count the sheen colonies on a membrane from a polluted water source. Colonies on
the membrane should be verified and the analysts' counts compared to the verified count.
—A minimum number of the official water supply samples required for each system should
be analyzed by the State laboratory. For example, systems that are required to have less
than 10 samples examined per month should submit one additional sample to a State
authorized laboratory. Water systems with sample requirements above 10 per month
would submit two additional samples to a State authorized laboratory.
Quality Control Checks of Laboratory Media, Equipment, and Supplies
Minimum and optional requirements for quality control checks of laboratory media, equipment,
and supplies are:
• Minimum requirements:
—pH meter must be clean and calibrated each use period with pH 7.0 standard buffer. Buf-
fer aliquot must be used only once. Commercial buffer solutions must be dated on initial
use.
—Balances (top loader or pan) must be calibrated annually.
—Glass thermometers or continuous recording devices for incubators must be checked year-
ly and metal thermometers quarterly (or at more frequent intervals when necessary)
against a certified thermometer or one of equivalent accuracy.
—Temperature in air (or water jacketed) incubator/incubator room/waterbaths/aluminum
block incubators must be recorded continuously or recorded daily from in-place thermom-
eter^) immersed in liquid and placed on shelves in use.
—Date, time, and temperature must be recorded continuously or recorded for each steriliza-
tion cycle of the autoclave.
—Hqt air oven must be equipped with a thermometer calibrated in the range of 170°C or
with a temperature recording device. Records must be maintained showing date, time/, and
temperature of each sterilization cycle. It is desirable to place the thermometer bulb in
sand and to avoid overcrowding (optional).
—Membrane filters used must be those recommended by the manufacturer for water analy-
sis. The recommendation must be based on data relating to ink toxicity, recovery, reten-
tion, and absence of growth-promoting substances.
—Washing processes must provide clean glassware with no stains or spotting. With initial use
of a detergent or washing product and whenever a different washing product is used, the
rinsing process must demonstrate that it provides glassware free of toxic material by the
inhibitory residue test ("Standard Methods," 13th edition, p. 643).
—At least one bottle per batch of sterilized sample bottles must be checked by adding ap-
proximately 25 ml of sterile LTB broth to each bottle. It must be incubated at 35 ± 0.5°C
for 24 hours and checked for growth.
—Service contracts or approved internal protocols must be maintained on balances, auto-
clave, water still, etc., and the service records entered in a log book.
306 &EPA MICROBIOLOGICAL MANUAL 1978
image:
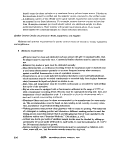 —Records must be available for inspection on batches of sterilized media showing lot num-
bers, date, sterilization time-temperature, final pH, and technician's name.
* Optional requirements:
—Positive and negative cultures should be used, and testing should be carried out to deter-
mine recovery and performance compared to a previous acceptable lot of medium,
—Media should be ordered on a basis of 12-month needs. Bottles should be dated on receipt
and when opened initially. Except for large volume uses, media should be purchased in 1/4-
Ib bottles. Bottles of media should be used within 6 months after opening; however, in no
case should opened media be used after one year. Opened bottles should be stored in a des-
iccator to extend storage time beyond 6 months. Shelf life of unopened bottles is 2 years.
—Testing should be carried out in media and membranes to determine recovery .and per-
formance compared to previous acceptable lot.
—Lot number of membrane filters and date of receipt should be recorded.
—Heat sensitive tapes and spore strips or ampoules should be used during sterilization. Maxi-
mum registering thermometer is recommended.
DATA REPORTING (MINIMUM REQUIREMENTS)
Where the laboratory has the responsibility for sample collections, the sample collector should
complete a sample report form immediately after each sample is taken. The information on the
form includes sample identification number, sample collector's name, time and date of collection,
arrival time and date in the laboratory, direct count, MF verified count, MPN completed count,
analyst's name, and other special information.
Results should be calculated and entered on the sample report form to be forwarded. A careful
check should be made to verify that each result was entered correctly from the bench sheet and
initialed by the analyst.
All results should be reported immediately to the proper authority.
Positive results are reported as preliminary without waiting for MF verification or MPN comple-
tion. After MF verification and/or MPN completion, the adjusted counts should be reported.
A copy of the sample report form should be retained either by the laboratory or State program
for 3 years. If results are entered into a computer storage system, a printout of the data should be
returned to the laboratory for verification with bench sheets.
ACTION RESPONSE TO LABORATORY RESULTS (MINIMUM REQUIREMENT)
When action response is a designated laboratory responsibility, the proper authorities should be
promptly notified on unsatisfactory sample results, and a request should be made for resampling
from the same sampling point.
307
image:
—Records must be available for inspection on batches of sterilized media showing lot num-
bers, date, sterilization time-temperature, final pH, and technician's name.
* Optional requirements:
—Positive and negative cultures should be used, and testing should be carried out to deter-
mine recovery and performance compared to a previous acceptable lot of medium,
—Media should be ordered on a basis of 12-month needs. Bottles should be dated on receipt
and when opened initially. Except for large volume uses, media should be purchased in 1/4-
Ib bottles. Bottles of media should be used within 6 months after opening; however, in no
case should opened media be used after one year. Opened bottles should be stored in a des-
iccator to extend storage time beyond 6 months. Shelf life of unopened bottles is 2 years.
—Testing should be carried out in media and membranes to determine recovery .and per-
formance compared to previous acceptable lot.
—Lot number of membrane filters and date of receipt should be recorded.
—Heat sensitive tapes and spore strips or ampoules should be used during sterilization. Maxi-
mum registering thermometer is recommended.
DATA REPORTING (MINIMUM REQUIREMENTS)
Where the laboratory has the responsibility for sample collections, the sample collector should
complete a sample report form immediately after each sample is taken. The information on the
form includes sample identification number, sample collector's name, time and date of collection,
arrival time and date in the laboratory, direct count, MF verified count, MPN completed count,
analyst's name, and other special information.
Results should be calculated and entered on the sample report form to be forwarded. A careful
check should be made to verify that each result was entered correctly from the bench sheet and
initialed by the analyst.
All results should be reported immediately to the proper authority.
Positive results are reported as preliminary without waiting for MF verification or MPN comple-
tion. After MF verification and/or MPN completion, the adjusted counts should be reported.
A copy of the sample report form should be retained either by the laboratory or State program
for 3 years. If results are entered into a computer storage system, a printout of the data should be
returned to the laboratory for verification with bench sheets.
ACTION RESPONSE TO LABORATORY RESULTS (MINIMUM REQUIREMENT)
When action response is a designated laboratory responsibility, the proper authorities should be
promptly notified on unsatisfactory sample results, and a request should be made for resampling
from the same sampling point.
307
image:
 SAMPLE FORMS FOR ON-SITE EVALUATION OF LABORATORIES INVOLVED IN
ANALYSIS OF PUBLIC WATER SUPPLIES-MICROBIOLOGY
LABORATORY:.
STREET;.
CITY: STATE:
TELEPHONE NUMBER:,
SURVEY BY:
AFFILIATION:.
DATE;.
CODES FOR MARKING ON-SITE EVALUATION FORMS:
S- Satisfactory
U—Unsatisfactory
NA- Not Applicable
308 &ERA MICROBIOLOGICAL MANUAL 1978
image:
SAMPLE FORMS FOR ON-SITE EVALUATION OF LABORATORIES INVOLVED IN
ANALYSIS OF PUBLIC WATER SUPPLIES-MICROBIOLOGY
LABORATORY:.
STREET;.
CITY: STATE:
TELEPHONE NUMBER:,
SURVEY BY:
AFFILIATION:.
DATE;.
CODES FOR MARKING ON-SITE EVALUATION FORMS:
S- Satisfactory
U—Unsatisfactory
NA- Not Applicable
308 &ERA MICROBIOLOGICAL MANUAL 1978
image:
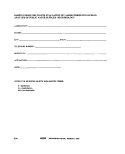 Laboratory Evaluator.
Location Date
PERSONNEL
The form dealing with personnel can be found on the following page.
LABORATORY FACILITIES
Space in laboratory and preparation room is adequate for needs during peak work periods
(200 ft2 and 6 linear ft of usable bench space per analyst).
Facilities are clean, with adequate lighting (100 ft-candles) and air conditioning.
NOTE: Material on pages 53-65, except where indicated, are minimum requirements.
309
image:
Laboratory Evaluator.
Location Date
PERSONNEL
The form dealing with personnel can be found on the following page.
LABORATORY FACILITIES
Space in laboratory and preparation room is adequate for needs during peak work periods
(200 ft2 and 6 linear ft of usable bench space per analyst).
Facilities are clean, with adequate lighting (100 ft-candles) and air conditioning.
NOTE: Material on pages 53-65, except where indicated, are minimum requirements.
309
image:
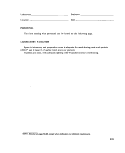 CO
O
PERSONNEL
Laboratory.
Location
Date
Evaluator
Position/title
Laboratory director
Supervisor/consultant
Professionals
(note discipline)
Technician/analyst
Name
Academic training
HS
BA/BS
SA,
MA/MS
sA[p)[l If?
Ph.D.
F©
Present
specialty
&M €
Experience
(years/area)
MIY
o
o
00
o
O
2
image:
CO
O
PERSONNEL
Laboratory.
Location
Date
Evaluator
Position/title
Laboratory director
Supervisor/consultant
Professionals
(note discipline)
Technician/analyst
Name
Academic training
HS
BA/BS
SA,
MA/MS
sA[p)[l If?
Ph.D.
F©
Present
specialty
&M €
Experience
(years/area)
MIY
o
o
00
o
O
2
image:
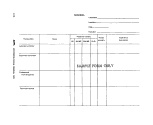 Laboratory . Evaluator
• Location Date
LABORATORY EQUIPMENT, SUPPLIES, AND MATERIALS
L pHMeter
Manufacturer Model
Clean, calibrated to 0.1 pH units each use period; record maintained .
Aliquot of standard pH 7.0 buffer used only once
2. Balance—Top Loader or Pan
Manufacturer .,; ' - ,' :—\—: Model
Clean. Detects a 50-mg weight accurately (for a general media preparation of >2-g
quantities)
Good quality weights in clean condition
3. Temperature-Monitoring Devices
Accuracy checked annually against a certified thermometer or one of equivalent
accuracy . : .
Legible graduations in 0.5°C-increments ,
No separation in liquid column
4. Incubator or Incubator Room
Manufacturer, ; Model.
Sufficient size for daily work load
Uniform temperature maintained on shelves in all areas used (35.0° ± 0.5°C)
Calibrated thermometer with bulb immersed in liquid and located on shelves in use.
Temperature recorded daily or recording thermometer sensitive to ± 0.5°C
5. Autoclave
Manufacturer Model
Reaches sterilization temperature (121°C), maintains 121°C during sterilization
cycle, and requires no more than 45 min for a complete cycle
Pressure and temperature gauges on exhaust side and an operating safety valve ..
No air bubbles produced in fermentation vials during depressurization
Record maintained on time and temperature for each sterilization cycle ,
311
image:
Laboratory . Evaluator
• Location Date
LABORATORY EQUIPMENT, SUPPLIES, AND MATERIALS
L pHMeter
Manufacturer Model
Clean, calibrated to 0.1 pH units each use period; record maintained .
Aliquot of standard pH 7.0 buffer used only once
2. Balance—Top Loader or Pan
Manufacturer .,; ' - ,' :—\—: Model
Clean. Detects a 50-mg weight accurately (for a general media preparation of >2-g
quantities)
Good quality weights in clean condition
3. Temperature-Monitoring Devices
Accuracy checked annually against a certified thermometer or one of equivalent
accuracy . : .
Legible graduations in 0.5°C-increments ,
No separation in liquid column
4. Incubator or Incubator Room
Manufacturer, ; Model.
Sufficient size for daily work load
Uniform temperature maintained on shelves in all areas used (35.0° ± 0.5°C)
Calibrated thermometer with bulb immersed in liquid and located on shelves in use.
Temperature recorded daily or recording thermometer sensitive to ± 0.5°C
5. Autoclave
Manufacturer Model
Reaches sterilization temperature (121°C), maintains 121°C during sterilization
cycle, and requires no more than 45 min for a complete cycle
Pressure and temperature gauges on exhaust side and an operating safety valve ..
No air bubbles produced in fermentation vials during depressurization
Record maintained on time and temperature for each sterilization cycle ,
311
image:
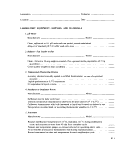 6. Hot-Air Oven
Manufacturer Model
Operates at a minimum of 170 C
Thermometer inserted or oven equipped with temperature-recording thermometer
device
Time and temperature record maintained for each sterilization cycle
Thermometer bulb in sand (optional)
7. Refrigerator
Temperature maintained at 1° to 4.4° C (34° to 40°F)
8, Optical Equipment
Low power magnification device (preferably binocular microscope with 10 to 15X)
with fluorescent light source for counting MF colonies
Colonies counted with a mechanical hand tally (optional);
9. Inoculation Equipment
Sterilized loops of at least 3-mm diameter, 22 to 24 gauge Nichrome, Chromel, or
platinum-iridium wire
or
Disposable dry heat-sterilized hardwood applicator sticks or presterilized loops....
JO. Membrane Filtration Equipment
Manufacturer Model
Made of stainless steel, glass, or autoclavable plastic
Nonleaking and uncorroded
22. Membrane Filters and Pads
Manufacturer Model
Filters recommended by manufacturer for water analyses
Filters and pads presterilized or autoclavable
12. Glass, Plastic, and Metal Utensils for Media Preparation
Washing process provides glassware free of toxic residue as demonstrated by the
inhibitory residue test
Glass items of borosilicate, free of chips and cracks
Utensils clean and free from foreign residues or dried medium
Plastic items clear with visible graduations
312 £EPA MICROBIOLOGICAL MANUAL 1978
image:
6. Hot-Air Oven
Manufacturer Model
Operates at a minimum of 170 C
Thermometer inserted or oven equipped with temperature-recording thermometer
device
Time and temperature record maintained for each sterilization cycle
Thermometer bulb in sand (optional)
7. Refrigerator
Temperature maintained at 1° to 4.4° C (34° to 40°F)
8, Optical Equipment
Low power magnification device (preferably binocular microscope with 10 to 15X)
with fluorescent light source for counting MF colonies
Colonies counted with a mechanical hand tally (optional);
9. Inoculation Equipment
Sterilized loops of at least 3-mm diameter, 22 to 24 gauge Nichrome, Chromel, or
platinum-iridium wire
or
Disposable dry heat-sterilized hardwood applicator sticks or presterilized loops....
JO. Membrane Filtration Equipment
Manufacturer Model
Made of stainless steel, glass, or autoclavable plastic
Nonleaking and uncorroded
22. Membrane Filters and Pads
Manufacturer Model
Filters recommended by manufacturer for water analyses
Filters and pads presterilized or autoclavable
12. Glass, Plastic, and Metal Utensils for Media Preparation
Washing process provides glassware free of toxic residue as demonstrated by the
inhibitory residue test
Glass items of borosilicate, free of chips and cracks
Utensils clean and free from foreign residues or dried medium
Plastic items clear with visible graduations
312 £EPA MICROBIOLOGICAL MANUAL 1978
image:
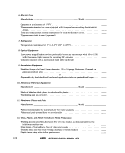 13. Sample Bottles
Wide-mouth hard glass bottles; stoppered or plastic screw-capped; capacity at least
120 ml
Glass-stoppered bottles with tops covered with aluminum foil or kraft
paper
Screw-caps have leakproof nontoxic liners that can withstand repeated sterilization
(30 min at 121°C)
Sterile sample bottles contain 10 mg of dechlorinating agent per 100 ml of sample .
14. Pipets
Brand ; Type
Sterile; glass or plastic; with a 2.5 percent tolerance
Tips unbroken; graduations distinctly marked
15. Pipet Containers
Aluminum, stainless steel
Pipets wrapped in quality kraft paper (char-resistant)
Open packs of disposable sterile pipets resealed between uses.
16. Culture Dishes
Brand. , Type.
Sterile plastic or glass ,
Open packs of disposable sterile plastic dishes resealed between uses .
Dishes are in containers of aluminum or stainless-steel with covers or
are wrapped with heavy aluminum foil or char-resistant paper
/ 7. Culture Tubes and Closures
Sufficient size to contain sterile medium and sample without danger of spillage.
Metal or plastic caps; plastic plugs
Borosilicate glass or other corrosion-resistant glass
313
image:
13. Sample Bottles
Wide-mouth hard glass bottles; stoppered or plastic screw-capped; capacity at least
120 ml
Glass-stoppered bottles with tops covered with aluminum foil or kraft
paper
Screw-caps have leakproof nontoxic liners that can withstand repeated sterilization
(30 min at 121°C)
Sterile sample bottles contain 10 mg of dechlorinating agent per 100 ml of sample .
14. Pipets
Brand ; Type
Sterile; glass or plastic; with a 2.5 percent tolerance
Tips unbroken; graduations distinctly marked
15. Pipet Containers
Aluminum, stainless steel
Pipets wrapped in quality kraft paper (char-resistant)
Open packs of disposable sterile pipets resealed between uses.
16. Culture Dishes
Brand. , Type.
Sterile plastic or glass ,
Open packs of disposable sterile plastic dishes resealed between uses .
Dishes are in containers of aluminum or stainless-steel with covers or
are wrapped with heavy aluminum foil or char-resistant paper
/ 7. Culture Tubes and Closures
Sufficient size to contain sterile medium and sample without danger of spillage.
Metal or plastic caps; plastic plugs
Borosilicate glass or other corrosion-resistant glass
313
image:
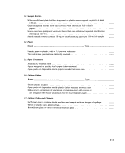 Laboratory Evaluator,
Location Date
GENERAL LABORATORY PRACTICES
L Sterilization Procedures
Satisfactory sterilization procedures and/or records ,
Tube .broth media and reagents sterilized at 121°C 12 to IS min
Tubes and flasks packed loosely in baskets or racks for uniform heating and cooling
MF presterilized or autoclaved at 121°C for 10 min with fast exhaust
MF assemblies and empty sample bottles sterilized at 121°C for 30 min.
MF assemblies sterilized between sample filtration series
Rinse water volumes of 500 to 1,000 ml sterilized at 121°C
for 45 min ,
Dilution water blanks autoclaved at 121°C for 30 min
Wire loops, needles, and forceps sterilized
Total exposure of MPN media to heat not over 45 min
Timing for sterilization begins when autoclave reaches 121 °C
Individual glassware items autoclaved at 121°C for 30 min ,
Individual dry glassware items sterilized 2 hours at 170°C (dry heat)
Pipets, culture dishes, and inoculating loops in boxes sterilized at 170°C for 2 hours,
MPN media removed and cooled as soon as possible after sterilization and stored in
cool dark place (optional)
UV light or boiling water for at least 2 min may be used on membrane filter assem-
blies to reduce bacterial carry-over between each filtration (optional)
2. Laboratory Pure Water
Only laboratory pure water used in preparing media, reagents, rinse water, and dilu-
tion water
Laboratory pure water not in contact with heavy metals
Source: Laboratory-prepared Purchased.
If laboratory-prepared:
Still manufacturer
Deionizer manufacturer
Record of recharge frequency.
Production rate and quality adequate for laboratory needs
Inspected, repaired, cleaned by service contract or in-house service
a. Chemical quality control
Record of satisfactory annual analyses for trace metals
A single metal not greater than 0.05 mg/1
314 -SEPA MICROBIOLOGICAL MANUAL 1978
image:
Laboratory Evaluator,
Location Date
GENERAL LABORATORY PRACTICES
L Sterilization Procedures
Satisfactory sterilization procedures and/or records ,
Tube .broth media and reagents sterilized at 121°C 12 to IS min
Tubes and flasks packed loosely in baskets or racks for uniform heating and cooling
MF presterilized or autoclaved at 121°C for 10 min with fast exhaust
MF assemblies and empty sample bottles sterilized at 121°C for 30 min.
MF assemblies sterilized between sample filtration series
Rinse water volumes of 500 to 1,000 ml sterilized at 121°C
for 45 min ,
Dilution water blanks autoclaved at 121°C for 30 min
Wire loops, needles, and forceps sterilized
Total exposure of MPN media to heat not over 45 min
Timing for sterilization begins when autoclave reaches 121 °C
Individual glassware items autoclaved at 121°C for 30 min ,
Individual dry glassware items sterilized 2 hours at 170°C (dry heat)
Pipets, culture dishes, and inoculating loops in boxes sterilized at 170°C for 2 hours,
MPN media removed and cooled as soon as possible after sterilization and stored in
cool dark place (optional)
UV light or boiling water for at least 2 min may be used on membrane filter assem-
blies to reduce bacterial carry-over between each filtration (optional)
2. Laboratory Pure Water
Only laboratory pure water used in preparing media, reagents, rinse water, and dilu-
tion water
Laboratory pure water not in contact with heavy metals
Source: Laboratory-prepared Purchased.
If laboratory-prepared:
Still manufacturer
Deionizer manufacturer
Record of recharge frequency.
Production rate and quality adequate for laboratory needs
Inspected, repaired, cleaned by service contract or in-house service
a. Chemical quality control
Record of satisfactory annual analyses for trace metals
A single metal not greater than 0.05 mg/1
314 -SEPA MICROBIOLOGICAL MANUAL 1978
image:
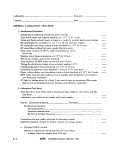 Total metals: equal to or less than 1.0 mg/1.
Record of monthly analyses of laboratory pure water
Conductance: >0.2 megohm resistivity or <5.0 microhmos/cm .
pH: 5.5-7.5
Standard plate count: <10,000/ml.
Free chlorine residual: 0.0
b. Microbiological quality control
Test for bactericidal properties of distilled water (0.8-3.0) performed at least
annually
Testing laboratory Date Ratio _
3. Rinse and Dilution Water
Stock buffer solution prepared according to "Standard Methods," 13th edition.. . .
Stock buffer solution adjusted to pH 7.2
Stock buffer autoclaved at 121°C, stored at 1° to 4.4°C (34° to 40°F) or filter
sterilized . .
Stock buffer labeled and dated
Stock potassium phosphate buffer solution (1.25 ml) added per liter distilled water
for rinse and dilution water
Final pH 7.2 ± 0.1
4. Media
Dehydrated media bottle kept tightly closed and protected from dust and excessive
humidity in storage areas .
Dehydrated media not used if discolored or caked
Laboratory pure water used in media preparation
Dissolution of media complete before dispensing to culture tubes or bottles
MPN tube media with loose-fitting caps used in less than 1 week
Tube media in screw-capped tubes held no longer than 3 months
Ampouled media stored at 1° to 4.4°C and time limited to manufacturer's expira-
tion date :
Media stored at low temperatures are incubated overnight prior to use and
tubes with air bubbles discarded
Media protected from sunlight
MF media stored in refrigerator; broth medium used within 96 hours, agar within
two weeks if prepared in tight-fitting dishes
315
image:
Total metals: equal to or less than 1.0 mg/1.
Record of monthly analyses of laboratory pure water
Conductance: >0.2 megohm resistivity or <5.0 microhmos/cm .
pH: 5.5-7.5
Standard plate count: <10,000/ml.
Free chlorine residual: 0.0
b. Microbiological quality control
Test for bactericidal properties of distilled water (0.8-3.0) performed at least
annually
Testing laboratory Date Ratio _
3. Rinse and Dilution Water
Stock buffer solution prepared according to "Standard Methods," 13th edition.. . .
Stock buffer solution adjusted to pH 7.2
Stock buffer autoclaved at 121°C, stored at 1° to 4.4°C (34° to 40°F) or filter
sterilized . .
Stock buffer labeled and dated
Stock potassium phosphate buffer solution (1.25 ml) added per liter distilled water
for rinse and dilution water
Final pH 7.2 ± 0.1
4. Media
Dehydrated media bottle kept tightly closed and protected from dust and excessive
humidity in storage areas .
Dehydrated media not used if discolored or caked
Laboratory pure water used in media preparation
Dissolution of media complete before dispensing to culture tubes or bottles
MPN tube media with loose-fitting caps used in less than 1 week
Tube media in screw-capped tubes held no longer than 3 months
Ampouled media stored at 1° to 4.4°C and time limited to manufacturer's expira-
tion date :
Media stored at low temperatures are incubated overnight prior to use and
tubes with air bubbles discarded
Media protected from sunlight
MF media stored in refrigerator; broth medium used within 96 hours, agar within
two weeks if prepared in tight-fitting dishes
315
image:
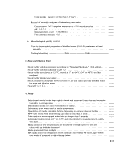 5. Lauryl Tryptose Broth
Manufacturer Lot No.,
Single strength composition, 35.6 g per liter pure water
Single strength pH 6.8 ± 0.2; double strength pH 6.7 ± 0.2
Not less than 10 ml per tube
Media made to result in single strength after addition of sample portions.
6. Brilliant Green Lactose Bile Broth
Manufacturer Lot No.
Medium composition 40 g per liter pure water
Final pH 7.2 ± 0.2
7. M-Endo Media
Manufacturer Lot No.
Medium composition 48.0 g per liter pure water optionally 15 g agar added/1
Reconstituted in laboratory pure water containing 2 percent ethanol (not
denatured)
Final pH 7.2 ± 0.2
Medium held in boiling water bath until completely dissolved
8, Standard Plate Count Agar
Correct composition, sterile and pH 7.0 ± 0.2
Sterile medium not remelted a second time after sterilization
Culture dishes incubated 48 hours at 35° ± 0.5°C
No more than 1.0 ml or less than 0.1 ml sample plated (sample or dilution).
Liquefied agar, 10 ml or more; medium temperature between 44° to 46°C.
Melted medium stored no longer than 3 hours before use
Only plates with between 30 to 300 colonies counted; when 1 ml of undiluted
sample is plated, colony density may be less than 30
Only two significant figures recorded and calculated as standard plate count/
1.0ml «
316 <e>5ft MICROBIOLOGICAL MANUAL 1978
image:
5. Lauryl Tryptose Broth
Manufacturer Lot No.,
Single strength composition, 35.6 g per liter pure water
Single strength pH 6.8 ± 0.2; double strength pH 6.7 ± 0.2
Not less than 10 ml per tube
Media made to result in single strength after addition of sample portions.
6. Brilliant Green Lactose Bile Broth
Manufacturer Lot No.
Medium composition 40 g per liter pure water
Final pH 7.2 ± 0.2
7. M-Endo Media
Manufacturer Lot No.
Medium composition 48.0 g per liter pure water optionally 15 g agar added/1
Reconstituted in laboratory pure water containing 2 percent ethanol (not
denatured)
Final pH 7.2 ± 0.2
Medium held in boiling water bath until completely dissolved
8, Standard Plate Count Agar
Correct composition, sterile and pH 7.0 ± 0.2
Sterile medium not remelted a second time after sterilization
Culture dishes incubated 48 hours at 35° ± 0.5°C
No more than 1.0 ml or less than 0.1 ml sample plated (sample or dilution).
Liquefied agar, 10 ml or more; medium temperature between 44° to 46°C.
Melted medium stored no longer than 3 hours before use
Only plates with between 30 to 300 colonies counted; when 1 ml of undiluted
sample is plated, colony density may be less than 30
Only two significant figures recorded and calculated as standard plate count/
1.0ml «
316 <e>5ft MICROBIOLOGICAL MANUAL 1978
image:
 Laboratory P^__ Evaluator.
Location : _^_ Date
METHODOLOGY
Methodology specified in "Standard Methods," 13th edition, or EPA manual
M-Endo broth, M-Endo agar, or Les Endo agar used in a single step procedure,
In two-step Les M-Endo procedure, MF incubated on lauryl-tryptose-broth-saturated
absorbent pad for 1.5 to 2 hours at 3.5° ± 0.5°C; then on M-Endo broth or Les
Endo agar for 20 to 22 hours at 35° ± 0.5°C
/. Total Coliform Membrane Filter Procedure
Samples containing excessive bacterial populations (greater than 200), confluency,
or turbidity retested by the MPN procedure
Filtration assembly sterile at start of each series
Absorbent pads saturated with medium, excess discarded; or 4.0 ml of agar medium
can be used per culture dish instead of a pad
Sample shaken vigorously immediately before test
Jest sample portions measured and not less than 100 ml
Funnel rinsed at least twice with 20- to 30-ml portiqns of sterile buffered water
MF removed with sterile forceps grasping a*ea outside effective filtering area
MF rolled onto medium pad or agar so air bubbles are not trapped
2, Incubation of Membrane Filter Cultures
Total incubation time 22 to 24 hours at 35° ± 0.5'C
Incubated in tight-fitting culture dishes or loose-fitting dishes incubated in high
relative humidity chambers
3, Membrane Filter Colony Counting
Samples repeated when coliforms are "TNTC" or colony growth is confluent, possi-
bly obscuring coliform development and/or detection
Total coliform count calculated in density per 100 ml
Samples containing five or more coliforms per 100 ml are resampled and tested . . .
Low power magnification device with fluorescent light positioned for maximum
sheen visibility
4. Verification of Total Coliform Colonies
All typical coliform (sheen) colonies or at least five randomly selected sheen colo-
nies verified in lauryl tryptose broth and BGLB
Counts adjusted based on verification
All atypical coliform (borderline sheen) colonies or at least five randomly-selected
colonies verified in LTB and BGLB
Counts adjusted based on verification ,. ,
317
image:
Laboratory P^__ Evaluator.
Location : _^_ Date
METHODOLOGY
Methodology specified in "Standard Methods," 13th edition, or EPA manual
M-Endo broth, M-Endo agar, or Les Endo agar used in a single step procedure,
In two-step Les M-Endo procedure, MF incubated on lauryl-tryptose-broth-saturated
absorbent pad for 1.5 to 2 hours at 3.5° ± 0.5°C; then on M-Endo broth or Les
Endo agar for 20 to 22 hours at 35° ± 0.5°C
/. Total Coliform Membrane Filter Procedure
Samples containing excessive bacterial populations (greater than 200), confluency,
or turbidity retested by the MPN procedure
Filtration assembly sterile at start of each series
Absorbent pads saturated with medium, excess discarded; or 4.0 ml of agar medium
can be used per culture dish instead of a pad
Sample shaken vigorously immediately before test
Jest sample portions measured and not less than 100 ml
Funnel rinsed at least twice with 20- to 30-ml portiqns of sterile buffered water
MF removed with sterile forceps grasping a*ea outside effective filtering area
MF rolled onto medium pad or agar so air bubbles are not trapped
2, Incubation of Membrane Filter Cultures
Total incubation time 22 to 24 hours at 35° ± 0.5'C
Incubated in tight-fitting culture dishes or loose-fitting dishes incubated in high
relative humidity chambers
3, Membrane Filter Colony Counting
Samples repeated when coliforms are "TNTC" or colony growth is confluent, possi-
bly obscuring coliform development and/or detection
Total coliform count calculated in density per 100 ml
Samples containing five or more coliforms per 100 ml are resampled and tested . . .
Low power magnification device with fluorescent light positioned for maximum
sheen visibility
4. Verification of Total Coliform Colonies
All typical coliform (sheen) colonies or at least five randomly selected sheen colo-
nies verified in lauryl tryptose broth and BGLB
Counts adjusted based on verification
All atypical coliform (borderline sheen) colonies or at least five randomly-selected
colonies verified in LTB and BGLB
Counts adjusted based on verification ,. ,
317
image:
 5. MF Field Equipment
Manufacturer , Model _
Only standard laboratory MF procedures adapted to field application
6. Total Coliforrn Most Probable Number Procedure
a. Presumptive Test
Five standard portions, either 10 or 100 ml
Sample shaken vigorously immediately before test
Tubes incubated at 35° ± 0.5°C for 24 ±2 hours
Examined for gas (any gas bubble indicates positive test) ,
Tubes that are gas-positive within 24 hours submitted promptly to confirm test .
Negative tubes returned to incubator and examined for gas within 48 ±3 hours;
positives submitted to confirm test
Public water supply samples with heavy growth and no gas production con-
firmed for presence of suppressed coliforms
Adjusted count reported based upon confirmation
Adequate test labeling and tube dilution coding (optional)
b. Confirmed Test
Presumptive positive tube gently shaken or mixed by rotating
One loopful or one dip of applicator transferred from presumptive tube to
BGLB
Incubated at 35°C ± 0.5°; checked within 24 hours ± 2 hours for gas production.
Positive confirmed tube results recorded; negative tubes reincubated and read
within 48 ± 3 hours
Unsatisfactory sample defined as three or more positive confirmed tubes
c. Completed Test
Applied to 10 percent of all positive samples each quarter
Applied to all positive confirmed tubes in each test completed
Positive confirmed tubes streaked on EMB plates for colony isolation
Plates adequately streaked to obtain discrete colonies
Incubated at 35° ± 0.5°C for 24 ± 2 hours
Typical nucleated colonies, with or without sheen, on EMB plates selected for
completed test identification
If typical colonies absent, atypical colonies selected for completed test
identification
If no colonies or only colorless colonies appear, confirmed test for that particu-
lar tube considered negative
An isolated typical colony or two atypical colonies transferred to lauryl tryptose
broth
Incubated at 35° ± 0.5°C; checked for gas within 48 ± 3 hours
Cultures producing gas in lauryl tryptose broth within 48 ± 3 hours are consid-
ered coliforms
318 wEPA MICROBIOLOGICAL MANUAL 1978
image:
5. MF Field Equipment
Manufacturer , Model _
Only standard laboratory MF procedures adapted to field application
6. Total Coliforrn Most Probable Number Procedure
a. Presumptive Test
Five standard portions, either 10 or 100 ml
Sample shaken vigorously immediately before test
Tubes incubated at 35° ± 0.5°C for 24 ±2 hours
Examined for gas (any gas bubble indicates positive test) ,
Tubes that are gas-positive within 24 hours submitted promptly to confirm test .
Negative tubes returned to incubator and examined for gas within 48 ±3 hours;
positives submitted to confirm test
Public water supply samples with heavy growth and no gas production con-
firmed for presence of suppressed coliforms
Adjusted count reported based upon confirmation
Adequate test labeling and tube dilution coding (optional)
b. Confirmed Test
Presumptive positive tube gently shaken or mixed by rotating
One loopful or one dip of applicator transferred from presumptive tube to
BGLB
Incubated at 35°C ± 0.5°; checked within 24 hours ± 2 hours for gas production.
Positive confirmed tube results recorded; negative tubes reincubated and read
within 48 ± 3 hours
Unsatisfactory sample defined as three or more positive confirmed tubes
c. Completed Test
Applied to 10 percent of all positive samples each quarter
Applied to all positive confirmed tubes in each test completed
Positive confirmed tubes streaked on EMB plates for colony isolation
Plates adequately streaked to obtain discrete colonies
Incubated at 35° ± 0.5°C for 24 ± 2 hours
Typical nucleated colonies, with or without sheen, on EMB plates selected for
completed test identification
If typical colonies absent, atypical colonies selected for completed test
identification
If no colonies or only colorless colonies appear, confirmed test for that particu-
lar tube considered negative
An isolated typical colony or two atypical colonies transferred to lauryl tryptose
broth
Incubated at 35° ± 0.5°C; checked for gas within 48 ± 3 hours
Cultures producing gas in lauryl tryptose broth within 48 ± 3 hours are consid-
ered coliforms
318 wEPA MICROBIOLOGICAL MANUAL 1978
image:
 Laboratory Evaluator.
Location , Date
SAMPLE COLLECTION, HANDLING, AND PRESERVATION
Representative samples of potable water distribution system ,.. , ,
Minimal sampling frequency as specified in the National Interim Primary Drinking Water
Regulations
Sample collector trained and approved as required by State regulatory authority or its
. delegated representative
1. Sample Bottles
Sterile sample bottles of at least 120 ml; able to withstand repeated sterilization....
Ample air space remains after sample collected to allow for adequate mixing.
Sodium thiosulfate, 100 mg/1, added to sample bottle before sterilization :...
2. Sampling
Sample collected after maintaining a steady flow for 2 to 3 min to clear service
line
Tap free of aerator, strainer, hose attachment, water purification, or other devices ..
Samples refrigerated when possible during transit and storage periods in the labora-
tory (optional)
3. Sample Identification
Sample identified immediately after collection
Identification includes, water source, location, time and date of collection, and col-
lector's name; insufficiently identified samples discarded.
Chlorine residual where applicable
4. Sample Transit Time
Transit time for potable water samples sent by mail or commercial transportation,
not in excess of 30 hours
No sample processed after 48-hour transit/storage
Samples delivered to laboratory by collectors examined the day of collection ....
Data marked as questionable on samples analyzed after 30 hours
5. Sample Receipt in Laboratory
Sample logged in when received in laboratory, including date and time of arrival and
analysis
Chain-of-custody procedures required by State regulations followed .............
319
image:
Laboratory Evaluator.
Location , Date
SAMPLE COLLECTION, HANDLING, AND PRESERVATION
Representative samples of potable water distribution system ,.. , ,
Minimal sampling frequency as specified in the National Interim Primary Drinking Water
Regulations
Sample collector trained and approved as required by State regulatory authority or its
. delegated representative
1. Sample Bottles
Sterile sample bottles of at least 120 ml; able to withstand repeated sterilization....
Ample air space remains after sample collected to allow for adequate mixing.
Sodium thiosulfate, 100 mg/1, added to sample bottle before sterilization :...
2. Sampling
Sample collected after maintaining a steady flow for 2 to 3 min to clear service
line
Tap free of aerator, strainer, hose attachment, water purification, or other devices ..
Samples refrigerated when possible during transit and storage periods in the labora-
tory (optional)
3. Sample Identification
Sample identified immediately after collection
Identification includes, water source, location, time and date of collection, and col-
lector's name; insufficiently identified samples discarded.
Chlorine residual where applicable
4. Sample Transit Time
Transit time for potable water samples sent by mail or commercial transportation,
not in excess of 30 hours
No sample processed after 48-hour transit/storage
Samples delivered to laboratory by collectors examined the day of collection ....
Data marked as questionable on samples analyzed after 30 hours
5. Sample Receipt in Laboratory
Sample logged in when received in laboratory, including date and time of arrival and
analysis
Chain-of-custody procedures required by State regulations followed .............
319
image:
 Laboratory Evaluator,
Location Date
QUALITY CONTROL
A written laboratory quality control program is available for review.
/. Analytical Quality Control
A record containing results of analytical control tests available for review
a. Verification of MF Colonies
At least five coliforms verified from each positive sample
Sheen colonies in mixed confluent growth reported and verified (optional)
b. Negative Coliform Controls
A start and finish MF control test (rinse water, medium, and supplies) run with
each filtration series
When controls indicate contamination occurred, all data on affected samples
rejected and resampling requested
c. Total Coliform Confirmed Test
Presumptive tubes with heavy growth but no gas production submitted to con-
firmed test to check for suppression of coliforms. Confirmation procedure
carried out every 3 months on one sample from each problem water supply ..
d. Duplicate analyses (optional)
Duplicate analyses run on positive polluted samples not to exceed 10 percent
but a minimum of one per month (optional)
e. Positive Control Samples (optional)
One positive control sample (polluted water) run each month (optional)
f. Colony Counting (If More Than One Analyst in Laboratory) (optional)
Two or more analysts count sheen colonies; all colonies are verified; analysts'
counts compared to verified counts; procedure is carried out at least once per
month (optional)
g. Check Analyses by State Laboratories (optional)
A minimum of samples, proportional to the local laboratory work load, proc-
essed by State laboratory (see criteria for recommendations) (optional)
320 «*EFft MICROBIOLOGICAL MANUAL 1978
image:
Laboratory Evaluator,
Location Date
QUALITY CONTROL
A written laboratory quality control program is available for review.
/. Analytical Quality Control
A record containing results of analytical control tests available for review
a. Verification of MF Colonies
At least five coliforms verified from each positive sample
Sheen colonies in mixed confluent growth reported and verified (optional)
b. Negative Coliform Controls
A start and finish MF control test (rinse water, medium, and supplies) run with
each filtration series
When controls indicate contamination occurred, all data on affected samples
rejected and resampling requested
c. Total Coliform Confirmed Test
Presumptive tubes with heavy growth but no gas production submitted to con-
firmed test to check for suppression of coliforms. Confirmation procedure
carried out every 3 months on one sample from each problem water supply ..
d. Duplicate analyses (optional)
Duplicate analyses run on positive polluted samples not to exceed 10 percent
but a minimum of one per month (optional)
e. Positive Control Samples (optional)
One positive control sample (polluted water) run each month (optional)
f. Colony Counting (If More Than One Analyst in Laboratory) (optional)
Two or more analysts count sheen colonies; all colonies are verified; analysts'
counts compared to verified counts; procedure is carried out at least once per
month (optional)
g. Check Analyses by State Laboratories (optional)
A minimum of samples, proportional to the local laboratory work load, proc-
essed by State laboratory (see criteria for recommendations) (optional)
320 «*EFft MICROBIOLOGICAL MANUAL 1978
image:
 2. Quality Control of Equipment, Supplies and Media
a. Records
Satisfactory records containing complete quality control checks on equipment,
supplies, and media available for inspection
b. Equipment and Supplies
Service contracts or approved internal protocol maintained on balance, auto-
clave, water still, etc.; service records entered in a log book _
Glass thermometers calibrated annually against a certified thermometer; metal
thermometers checked quarterly _
pH Meters standardized with pH 7.0 buffer , _
Laboratory pure water analyzed as described in criteria _
Lot numbers and dates of receipt of membrane filters recorded (optional)
Heat-sensitive tapes and/or spare strips/ampoules used during sterilization (optional)
c. Media Quality Control-
Laboratory chemicals of Analytical Reagent Grade _
Dyes certified for bacteriological use _
pH checked and recorded on each batch of medium after preparation and
sterilization _
Causes for deviations beyond ± 0.2 pH units specified _
Media ordered on a basis of 12-month need; purchased in 1/4-lb. quantities,
except those used in large amounts (optional)
Bottles dated on receipt and when opened (optional)
Opened bottles of routinely used media discarded within 6 months (if stored in
desiccator storage may be extended) (optional)
Shelf life of unopened bottles not in excess of 2 years (optional)
New lots of media quality tested against satisfactory lot using natural water
samples (optional)
321
image:
2. Quality Control of Equipment, Supplies and Media
a. Records
Satisfactory records containing complete quality control checks on equipment,
supplies, and media available for inspection
b. Equipment and Supplies
Service contracts or approved internal protocol maintained on balance, auto-
clave, water still, etc.; service records entered in a log book _
Glass thermometers calibrated annually against a certified thermometer; metal
thermometers checked quarterly _
pH Meters standardized with pH 7.0 buffer , _
Laboratory pure water analyzed as described in criteria _
Lot numbers and dates of receipt of membrane filters recorded (optional)
Heat-sensitive tapes and/or spare strips/ampoules used during sterilization (optional)
c. Media Quality Control-
Laboratory chemicals of Analytical Reagent Grade _
Dyes certified for bacteriological use _
pH checked and recorded on each batch of medium after preparation and
sterilization _
Causes for deviations beyond ± 0.2 pH units specified _
Media ordered on a basis of 12-month need; purchased in 1/4-lb. quantities,
except those used in large amounts (optional)
Bottles dated on receipt and when opened (optional)
Opened bottles of routinely used media discarded within 6 months (if stored in
desiccator storage may be extended) (optional)
Shelf life of unopened bottles not in excess of 2 years (optional)
New lots of media quality tested against satisfactory lot using natural water
samples (optional)
321
image:
 Laboratory • Evaluator.
Location , Date
DATA REPORTING
Sample information and laboratory data fully recorded
Direct MF counts and/or confirmed MPN results reported promptly
After MF verification and/or MPN completion, adjusted counts reported
One copy of report form retained in laboratory or by State program for 3 years
Test results assembled and available for inspection (optional)
322 <8-ER<V MICROBIOLOGICAL MANUAL 1978
image:
Laboratory • Evaluator.
Location , Date
DATA REPORTING
Sample information and laboratory data fully recorded
Direct MF counts and/or confirmed MPN results reported promptly
After MF verification and/or MPN completion, adjusted counts reported
One copy of report form retained in laboratory or by State program for 3 years
Test results assembled and available for inspection (optional)
322 <8-ER<V MICROBIOLOGICAL MANUAL 1978
image:
 Laboratory , Evaluator.
Location : Date
ACTION RESPONSE TO LABORATORY RESULTS
Unsatisfactory test results given action response and resampled as defined in National
Interim Primary Drinking Water Regulations , . .
State and responsible local authority notified within 48 hours after check samples cpji-
firm coliform occurrence
All data reported to State and local authorities within 40 days
323
image:
Laboratory , Evaluator.
Location : Date
ACTION RESPONSE TO LABORATORY RESULTS
Unsatisfactory test results given action response and resampled as defined in National
Interim Primary Drinking Water Regulations , . .
State and responsible local authority notified within 48 hours after check samples cpji-
firm coliform occurrence
All data reported to State and local authorities within 40 days
323
image:
 APPENDIX C
BIBLIOGRAPHY
1. Kittrell, R. W., 1969. A Practical Guide to Water Quality Standards of Streams, Publ. No.
CWR-5. U.S. Department of the Interior, FWPCA, U.S. Government Printing Office,
Washington, DC.
2. American Public Health Association, 1975. Standard Methods for the Examination of
Water and Wastewater, (14th ed.) Washington, DC.
3. Society of American Bacteriologists, 1957. Manual of Microbiological Methods,
McGraw-Hill Book Company, Inc., New York, NY.
4. Geldrelch, E. E., 1975. Handbook for Evaluating Water Bacteriological Laboratories,
(2nd ed.) U.S. Environmental Protection Agency, Cincinnati, OH. EPA-670/9-75-006.
5. Scarpino, P. V,, 1971. Bacterial and viral analysis of water and wastewater. Chapter 12.
In: Water and Water Pollution Handbook. Volume 2. (L L Ciaccio, ed.) Marcel Dekker,
Inc., New York, NY. 2^639.
6. Mitchell, Ralph (ed.), 1972. Water Pollution Microbiology. John Wiley and Sons, Inc.,
New York, NY.
7. Current Practices in Water Microbiology. 1973. U.S. Environmental Protection Agency,
Office of Water Program Operations, National Training and Operational Technology
Center, Cincinnati, OH.
8. Greeson, P.E., T. A. Ehlke, G. A. Irwin, B. W. Lium, and K. V. Slack, 1977. Techniques
of Water Resources investigations of the United States Geological Survey. Chapter A4,
Methods for Collection and Analysis of Aquatic Biological and Microbiological Samples.
Book 5, Laboratory Analysis. U.S. Dept., of the Interior, Superintendent of Documents,
U.S. Government Printing Office, Washington, D.C. 20402.
9. Bordner, R. H., C. F. Frith and J. A. Winter, Eds., 1977. Proceedings of the Symposium
on Recovery of Indicator Organisms Employing Membrane Filters. U.S. Environmental
Protection Agency, EPA-60019-77-024, EMSL-Cincinnati, Cincinnati, OH 45268.
324 &EFA MICROBIOLOGICAL MANUAL 1978
image:
APPENDIX C
BIBLIOGRAPHY
1. Kittrell, R. W., 1969. A Practical Guide to Water Quality Standards of Streams, Publ. No.
CWR-5. U.S. Department of the Interior, FWPCA, U.S. Government Printing Office,
Washington, DC.
2. American Public Health Association, 1975. Standard Methods for the Examination of
Water and Wastewater, (14th ed.) Washington, DC.
3. Society of American Bacteriologists, 1957. Manual of Microbiological Methods,
McGraw-Hill Book Company, Inc., New York, NY.
4. Geldrelch, E. E., 1975. Handbook for Evaluating Water Bacteriological Laboratories,
(2nd ed.) U.S. Environmental Protection Agency, Cincinnati, OH. EPA-670/9-75-006.
5. Scarpino, P. V,, 1971. Bacterial and viral analysis of water and wastewater. Chapter 12.
In: Water and Water Pollution Handbook. Volume 2. (L L Ciaccio, ed.) Marcel Dekker,
Inc., New York, NY. 2^639.
6. Mitchell, Ralph (ed.), 1972. Water Pollution Microbiology. John Wiley and Sons, Inc.,
New York, NY.
7. Current Practices in Water Microbiology. 1973. U.S. Environmental Protection Agency,
Office of Water Program Operations, National Training and Operational Technology
Center, Cincinnati, OH.
8. Greeson, P.E., T. A. Ehlke, G. A. Irwin, B. W. Lium, and K. V. Slack, 1977. Techniques
of Water Resources investigations of the United States Geological Survey. Chapter A4,
Methods for Collection and Analysis of Aquatic Biological and Microbiological Samples.
Book 5, Laboratory Analysis. U.S. Dept., of the Interior, Superintendent of Documents,
U.S. Government Printing Office, Washington, D.C. 20402.
9. Bordner, R. H., C. F. Frith and J. A. Winter, Eds., 1977. Proceedings of the Symposium
on Recovery of Indicator Organisms Employing Membrane Filters. U.S. Environmental
Protection Agency, EPA-60019-77-024, EMSL-Cincinnati, Cincinnati, OH 45268.
324 &EFA MICROBIOLOGICAL MANUAL 1978
image:
 INDEX
Absorbent pads, 74, 205
Accidents, reporting, 262
Accuracy, method, 240
Actinomycetes, analytical method for, 186
Agar, nutrient, 39
Agglutination test
for H antigen, 179
for O grouping, 177
for O and Vi, alternate procedure, 179
for Vi antigen, 178
Air density plates in quality control, 196
Alcohol
for sterilization procedures, 71, 74
in WIF media, 43-45
Alternate test procedures, 92
Analytical cost, 246
Analytical quality control
comparative testing of methodologies, 236
in compliance monitoring, 239
in routine analyses, 231
Antisera, for serological testing of
Salmonella, 177
Applicator sticks, 32, 74, 80
Arabinose (L) fermentation, 41, 149
Arabinose, (L), Solution in purple broth
base, 41
Arginine decarboxylase test, 122, 171
ASTM tests for membrane filters
bacterial retention, 206
extractables, 207
flow rate, 207
inhibitory effects, 206
recovery, 206
Asymmetry of data, 227
Autoclave, steam
quality control, 216
specifications, 36, 37, 38
temperature control, 216
Automotive safety, 263
Azide dextrose broth, 46
Balances
quality control, 212
specifications, 33
Bacteria
see total coliforms, 108
fecal coliforms, 124
fecal streptococci, 135
Salmonella, 154
standard plate count, 101
Bathing beaches, sampling, 29
BHI tests
10 C and 45 C, 146
6.5% NaCI and pH 9.6, 147
with 0.4% potassium tellurite, 147
Bench forms
for membrane filter analyses, 60
for MPN analyses, 60
Biochemical characterization of the
Eriterobacterlaceae, 176
Biochemical identification of Salmonella, 167
Biochemical tests
coliforms, 119
fecal streptococci,
multitest systems,
Salmonella, 167
146
172
325
image:
INDEX
Absorbent pads, 74, 205
Accidents, reporting, 262
Accuracy, method, 240
Actinomycetes, analytical method for, 186
Agar, nutrient, 39
Agglutination test
for H antigen, 179
for O grouping, 177
for O and Vi, alternate procedure, 179
for Vi antigen, 178
Air density plates in quality control, 196
Alcohol
for sterilization procedures, 71, 74
in WIF media, 43-45
Alternate test procedures, 92
Analytical cost, 246
Analytical quality control
comparative testing of methodologies, 236
in compliance monitoring, 239
in routine analyses, 231
Antisera, for serological testing of
Salmonella, 177
Applicator sticks, 32, 74, 80
Arabinose (L) fermentation, 41, 149
Arabinose, (L), Solution in purple broth
base, 41
Arginine decarboxylase test, 122, 171
ASTM tests for membrane filters
bacterial retention, 206
extractables, 207
flow rate, 207
inhibitory effects, 206
recovery, 206
Asymmetry of data, 227
Autoclave, steam
quality control, 216
specifications, 36, 37, 38
temperature control, 216
Automotive safety, 263
Azide dextrose broth, 46
Balances
quality control, 212
specifications, 33
Bacteria
see total coliforms, 108
fecal coliforms, 124
fecal streptococci, 135
Salmonella, 154
standard plate count, 101
Bathing beaches, sampling, 29
BHI tests
10 C and 45 C, 146
6.5% NaCI and pH 9.6, 147
with 0.4% potassium tellurite, 147
Bench forms
for membrane filter analyses, 60
for MPN analyses, 60
Biochemical characterization of the
Eriterobacterlaceae, 176
Biochemical identification of Salmonella, 167
Biochemical tests
coliforms, 119
fecal streptococci,
multitest systems,
Salmonella, 167
146
172
325
image:
 Biohazard, control of, 268
Bismuth sulfite agar, 53
Blending, high solids samples, 62
Blood agar base, with 10% blood, 50
*
Blood agar with 0,4% potassium tellurite, 50
Boat safety, 263
Bottles, sample, 36
Brain heart infusion
agar, 47
•gar with potassium tellurite, 49
broth, 47
broth pH 9.6, 48
broth with 40% bile, 48
broth with 6.5% NaCI, 48
Brilliant green agar, 52
Brilliant green lactose bile broth, 45
Brom thymol blue, pH check on glassware,
199
Buffered glucose medium, see MR-VP Broth,
42
Buffered water
peptone, 57
phosphate, 57
Calculating results
MF analyses, 75
MPN analyses, 81
spread plates, 69
Catalase test, 147
Celita (diatorrtaceous earth), 160
Centrifuge, quality control of, 213
Certification program. Appendix B, 297
Citrate test, 122
Chain of custody, 17
Characterization of Enterobacterlaceae, 176
Check list, safety, 269
Chelating agent, 6
Chemicals and gases, safe use of, 267
Chlorinated effluents, 6, 96
Chlorination of wastes, 6, 96
Chlorine, damage to cells, 6, 96
Citrobacter, 108
Cleaning glassware, 36
Coliforms, differentiation of, 119
Conforms, fecal
definition, 124
MF test, delayed incubation, 128
MF test, direct, 124
MF test, verification, 130
MPN test, 132
Coliform test limitations
fecal coliforms, MF, 124
total coliforms, MF, 108
total coliforms, MPN, 114
Coliforms, total
differentiation of, 119
MF test, immediate two-step, 111
MF test, single step, 110
MF test, delayed , 112
MF verification, 113
MPN test, 114
Colony
counting, pour plate, 69
counting, spread plate, 69
counting, membrane filter, 75
counting by more than one analyst, 231
spreader colonies, 106
Colony counters, 33
Conjugate
approved list, 182
fluorescent antibody, 182
titration of, 182
Comparative testing of methodologies, 234
Completed MPN, 81
See also Total Coliform, 118
Analytical Quality Control, 231
326
&EPA MICROBIOLOGICAL MANUAL 1978
image:
Biohazard, control of, 268
Bismuth sulfite agar, 53
Blending, high solids samples, 62
Blood agar base, with 10% blood, 50
*
Blood agar with 0,4% potassium tellurite, 50
Boat safety, 263
Bottles, sample, 36
Brain heart infusion
agar, 47
•gar with potassium tellurite, 49
broth, 47
broth pH 9.6, 48
broth with 40% bile, 48
broth with 6.5% NaCI, 48
Brilliant green agar, 52
Brilliant green lactose bile broth, 45
Brom thymol blue, pH check on glassware,
199
Buffered glucose medium, see MR-VP Broth,
42
Buffered water
peptone, 57
phosphate, 57
Calculating results
MF analyses, 75
MPN analyses, 81
spread plates, 69
Catalase test, 147
Celita (diatorrtaceous earth), 160
Centrifuge, quality control of, 213
Certification program. Appendix B, 297
Citrate test, 122
Chain of custody, 17
Characterization of Enterobacterlaceae, 176
Check list, safety, 269
Chelating agent, 6
Chemicals and gases, safe use of, 267
Chlorinated effluents, 6, 96
Chlorination of wastes, 6, 96
Chlorine, damage to cells, 6, 96
Citrobacter, 108
Cleaning glassware, 36
Coliforms, differentiation of, 119
Conforms, fecal
definition, 124
MF test, delayed incubation, 128
MF test, direct, 124
MF test, verification, 130
MPN test, 132
Coliform test limitations
fecal coliforms, MF, 124
total coliforms, MF, 108
total coliforms, MPN, 114
Coliforms, total
differentiation of, 119
MF test, immediate two-step, 111
MF test, single step, 110
MF test, delayed , 112
MF verification, 113
MPN test, 114
Colony
counting, pour plate, 69
counting, spread plate, 69
counting, membrane filter, 75
counting by more than one analyst, 231
spreader colonies, 106
Colony counters, 33
Conjugate
approved list, 182
fluorescent antibody, 182
titration of, 182
Comparative testing of methodologies, 234
Completed MPN, 81
See also Total Coliform, 118
Analytical Quality Control, 231
326
&EPA MICROBIOLOGICAL MANUAL 1978
image:
 Composite sampling, 6
Concentration techniques, for Salmonella, 155
Confirmed MPN, 81
See Fecal Coliform, 132
See also Fecal Streptococci, 142
See also Total Coliform, 117
Costs of microbiological analyses, 246
Counting colonies, more than one analyst, 231
Counting range, method characteristic, 240
Cross-examination, in court, 286
Culture dishes, 32
Culture media
dehydrated, 38
preparation and use, 38, 208
quality control of, 211
rehydration of, 38
specific media, 39
sterilization, 38
Culture tubes, 34
Cultures, shipment of, 89
Cytochrome oxidase test, 122, 170
Data transformation, 227
Decarboxylase medium, 55
Decarboxylase tests, 122, 171
Dechlorinating agent, sodium thiosqlfate, 6
Decontamination of laboratory, 266
Deionized water, 56
Delayed incubation MF method
for fecal coiiforms, 128
for total coiiforms, 112
Depth samplers
Kemmerer, 14
New York Dept. of Health, 8
Niskin, 8
ZoBell J-Z, 8
Detergent suitability test for glassware, 199
Differentiation of coiiforms, 119
Differentiation of Enterobacteriaceae, 176
Dilution
bottles, 34, 74
necessity for, 62
serial, 62
water, 57, 62
Dilution water
peptone dilution water, 57
phosphate buffer solution, stock, 57
phosphate buffer, 57
preparation of dilution and rinse water, 58
Direct MF method, 124
Disinfectants, safe use, 266
Distilled water, 56
Documentation, of quality control progam, 244
Drinking water
analyses of, 109
regulations, 280
Dry heat sterilization, 36
Dulcitol fermentation test, 170
Dulcitol selenite broth, 51
Duplicate analyses, 231
1C medium (broth), 46
EDTA, chelating agent, 6
Electrical equipment, safe use, 268
Enrichment procedures. Salmonella, 162
Enterobacter ,108
Enterobacteriaceae, differentiation of,
Table, 176
Eosin methylene blue agar, 46
Equipment and instrumentation
costs of, 246
quality control of, 198
327
image:
Composite sampling, 6
Concentration techniques, for Salmonella, 155
Confirmed MPN, 81
See Fecal Coliform, 132
See also Fecal Streptococci, 142
See also Total Coliform, 117
Costs of microbiological analyses, 246
Counting colonies, more than one analyst, 231
Counting range, method characteristic, 240
Cross-examination, in court, 286
Culture dishes, 32
Culture media
dehydrated, 38
preparation and use, 38, 208
quality control of, 211
rehydration of, 38
specific media, 39
sterilization, 38
Culture tubes, 34
Cultures, shipment of, 89
Cytochrome oxidase test, 122, 170
Data transformation, 227
Decarboxylase medium, 55
Decarboxylase tests, 122, 171
Dechlorinating agent, sodium thiosqlfate, 6
Decontamination of laboratory, 266
Deionized water, 56
Delayed incubation MF method
for fecal coiiforms, 128
for total coiiforms, 112
Depth samplers
Kemmerer, 14
New York Dept. of Health, 8
Niskin, 8
ZoBell J-Z, 8
Detergent suitability test for glassware, 199
Differentiation of coiiforms, 119
Differentiation of Enterobacteriaceae, 176
Dilution
bottles, 34, 74
necessity for, 62
serial, 62
water, 57, 62
Dilution water
peptone dilution water, 57
phosphate buffer solution, stock, 57
phosphate buffer, 57
preparation of dilution and rinse water, 58
Direct MF method, 124
Disinfectants, safe use, 266
Distilled water, 56
Documentation, of quality control progam, 244
Drinking water
analyses of, 109
regulations, 280
Dry heat sterilization, 36
Dulcitol fermentation test, 170
Dulcitol selenite broth, 51
Duplicate analyses, 231
1C medium (broth), 46
EDTA, chelating agent, 6
Electrical equipment, safe use, 268
Enrichment procedures. Salmonella, 162
Enterobacter ,108
Enterobacteriaceae, differentiation of,
Table, 176
Eosin methylene blue agar, 46
Equipment and instrumentation
costs of, 246
quality control of, 198
327
image:
 Equivalency program, 92
Escherichla, 108
Estuarlne waters, sampling in, 28
Ethanol, 43-45, 71, 74
Ethyl violet azide broth, 47
Ethylena oxide sterilization, 36
Evidence, legal, 281
Facilities, requirements for, 194
Fecal coliform
definition 'of the group, 124
MF. delayed-incubation method, 128
MF direct method, 124
MF verification, 130
MPN, 132
Fecal streptococci
confirmation of enterococci, 147
definition of, 135
determination of fecal coliform/fecal
streptococcal ratios, 145
identification of Group Q streptococci, 150
identification of species, 145
Isolation and confirmation, 146
membrane filter method, 136
membrane filter verification, 138
MPN method, 139
pour plate method, 143
separation of enterococci and Group Q
streptococci, 147
separation of enterococcus group by species,
147
separation of enterococci by origin, 149
separation and speciation of S. bovis and
S, eguinus, 152
Fecal streptococci test limitations
MF method, 136
MPN procedure, 139
pour plate method, 143
Federal Water Pollution Control Amendments,
Act of 1972, 278
Fermentation
tubes, 34
vials, 34
Fermentation tests
arabinose (L), 149
glycerol ,147
inositol, 171
lactose, 152, 171
malonate, 170
sorbose. pH 10, 150
sorbitol (D), 147
Field kits, 97 ... .
Field log sheets, 17
Field problems, 97
Field safety guidelines, 263
Filter, cartridge, 161
Filter, diatomaceous earth, 160
Filter, membrane (MF) method
concentrating enterics, 161
fecal coliforms, 124, 128
fecal streptococci, 136
general, 70
total coliforms, 108
Filter funnel, 71-73
Filtration sterilization, 36
Filtration techniques for concentrating enterics
cartridge (Balston), 161
diatomaceous earth, 160
membrane filter (flat), 161
Filtration volume, 62
Fluorescent antibody testing, 180
Fluorescent antibody reagents, 204
Fluorescent dyes, 204
Fluorescent light, 71
Forceps, 71
Freezer, 215
Funnel, membrane filter, 71-73
Gelatin hydrolysis test, 149, 171
Glassware
cleaning, 36
detergent suitability test for, 199
dilution bottles, 34
fermentation tubes and vials, 34
328
MICROBIOLOGICAL MANUAL 1978
image:
Equivalency program, 92
Escherichla, 108
Estuarlne waters, sampling in, 28
Ethanol, 43-45, 71, 74
Ethyl violet azide broth, 47
Ethylena oxide sterilization, 36
Evidence, legal, 281
Facilities, requirements for, 194
Fecal coliform
definition 'of the group, 124
MF. delayed-incubation method, 128
MF direct method, 124
MF verification, 130
MPN, 132
Fecal streptococci
confirmation of enterococci, 147
definition of, 135
determination of fecal coliform/fecal
streptococcal ratios, 145
identification of Group Q streptococci, 150
identification of species, 145
Isolation and confirmation, 146
membrane filter method, 136
membrane filter verification, 138
MPN method, 139
pour plate method, 143
separation of enterococci and Group Q
streptococci, 147
separation of enterococcus group by species,
147
separation of enterococci by origin, 149
separation and speciation of S. bovis and
S, eguinus, 152
Fecal streptococci test limitations
MF method, 136
MPN procedure, 139
pour plate method, 143
Federal Water Pollution Control Amendments,
Act of 1972, 278
Fermentation
tubes, 34
vials, 34
Fermentation tests
arabinose (L), 149
glycerol ,147
inositol, 171
lactose, 152, 171
malonate, 170
sorbose. pH 10, 150
sorbitol (D), 147
Field kits, 97 ... .
Field log sheets, 17
Field problems, 97
Field safety guidelines, 263
Filter, cartridge, 161
Filter, diatomaceous earth, 160
Filter, membrane (MF) method
concentrating enterics, 161
fecal coliforms, 124, 128
fecal streptococci, 136
general, 70
total coliforms, 108
Filter funnel, 71-73
Filtration sterilization, 36
Filtration techniques for concentrating enterics
cartridge (Balston), 161
diatomaceous earth, 160
membrane filter (flat), 161
Filtration volume, 62
Fluorescent antibody testing, 180
Fluorescent antibody reagents, 204
Fluorescent dyes, 204
Fluorescent light, 71
Forceps, 71
Freezer, 215
Funnel, membrane filter, 71-73
Gelatin hydrolysis test, 149, 171
Glassware
cleaning, 36
detergent suitability test for, 199
dilution bottles, 34
fermentation tubes and vials, 34
328
MICROBIOLOGICAL MANUAL 1978
image:
 graduates and pipets, 33 *
pH check, 199
quality control, 199
sample bottles, 36
sterility checks, 200
sterilization, 36
Glucose broth, buffered (MR-VP broth), 42
Glycerol, fermentation test, 147
Grab samples, 8
Graduated cylinders, 34
Gram stain, 86
Ground water, analysis of, 97
H antigens, test for, 179
H broth, 56
Hazards, laboratory, sources, 262
Heat, dry, sterilization by, 36
Heat, moist, sterilization by, 36
Hemolysis test, 149
Hoods (safety cabinets), 268
Hot air sterilization, 36
Hydrogen ion concentration, 212
IMViC test media, 42
Incineration, sterilization by, 36
Incomplete recovery, suppression, 96
Identification of Enterobacteriaceae, 176 •
Immediate incubation MF method, (direct MF),
124
Impression slides, 182
Incubation temperatures for Salmonella. 164
Incubators
quality control, 216
specifications, 32
temperature control ,216
Indole test, 121 , 170
Industrial wastes, Ktebsiella in, 97
Infections •
laboratory acquired, 262
reporting, 262
Injured cells, 92 •
Inoculation loops, needles, applicator sticks,
32
Inoculation of cultures, methods for, 65
Interference, by turbidity, 96
Interlaboratory quality control, 244
Intralaboratory quality control, 192, 244
Isolation of bacteria
pour plate method, 65
spread plate method, 65
streak plate method, 65
Isolation of Salmonella, plating methods, 164
Isolation techniques, 65
KF streptococcus agar, 46
Kemmerer sampler, -14
Klebsiella in industrial wastes, 97
Klebsiella pneumoniae, 108;
LES MF holding medium, 44
Laboratory check list for safety, 269
Laboratory equipment, quality control of, 198
Laboratory facilities, quality control of, 194
Laboratory management
development of a QC program, 244
legal considerations, 277
manpower and analytical costs, 246
safety, 259
Laboratory personnel, quality control of, 197 .
Laboratory pure water, 56, 200
use test for, 203
329
image:
graduates and pipets, 33 *
pH check, 199
quality control, 199
sample bottles, 36
sterility checks, 200
sterilization, 36
Glucose broth, buffered (MR-VP broth), 42
Glycerol, fermentation test, 147
Grab samples, 8
Graduated cylinders, 34
Gram stain, 86
Ground water, analysis of, 97
H antigens, test for, 179
H broth, 56
Hazards, laboratory, sources, 262
Heat, dry, sterilization by, 36
Heat, moist, sterilization by, 36
Hemolysis test, 149
Hoods (safety cabinets), 268
Hot air sterilization, 36
Hydrogen ion concentration, 212
IMViC test media, 42
Incineration, sterilization by, 36
Incomplete recovery, suppression, 96
Identification of Enterobacteriaceae, 176 •
Immediate incubation MF method, (direct MF),
124
Impression slides, 182
Incubation temperatures for Salmonella. 164
Incubators
quality control, 216
specifications, 32
temperature control ,216
Indole test, 121 , 170
Industrial wastes, Ktebsiella in, 97
Infections •
laboratory acquired, 262
reporting, 262
Injured cells, 92 •
Inoculation loops, needles, applicator sticks,
32
Inoculation of cultures, methods for, 65
Interference, by turbidity, 96
Interlaboratory quality control, 244
Intralaboratory quality control, 192, 244
Isolation of bacteria
pour plate method, 65
spread plate method, 65
streak plate method, 65
Isolation of Salmonella, plating methods, 164
Isolation techniques, 65
KF streptococcus agar, 46
Kemmerer sampler, -14
Klebsiella in industrial wastes, 97
Klebsiella pneumoniae, 108;
LES MF holding medium, 44
Laboratory check list for safety, 269
Laboratory equipment, quality control of, 198
Laboratory facilities, quality control of, 194
Laboratory management
development of a QC program, 244
legal considerations, 277
manpower and analytical costs, 246
safety, 259
Laboratory personnel, quality control of, 197 .
Laboratory pure water, 56, 200
use test for, 203
329
image:
 Laboratory records, 17
MF analyses, 59
MPN analyses, 59
Laboratory supplies, quality control of, 199
Lactose, fermentation, 152, 171
Lactose In purple broth base, 41
Lakes and Impoundment sampling, 24
Lauryl tryptose sulfate broth, 45
Laws, Federal Water
Federal Water Pollution Control Act
Amendments of 1972, Public Law
92-500, 278
Marine Protection, Research and
Sanctuaries Act of 1972, Public
Law 92-532, 279
Safe Drinking Water Act of 1974,
Public Law 93-523, 28O
sections relevant to microbiology, 289
Levlne's EMB agar, 46
Limitations of,
coliform test (total), MF, 108
coliform test (total), MPN, 114
fecal coliform test, MF, 124
fecal coliform MPN method, 132
fecal streptococci test
MF method, 136
MPN method, 139
pour plate method, 143
MF method, general, 70
MPN method, general, 78
Litmus milk, 49
Lysine decarboxylase test, 122, 171
Lyslne iron agar (LIA) test, 53, 169
M-FC agar, 43
M-FC broth. 43
M-Endo holding medium, 44
M-indo agar LES, 44
M-Endo broth MF, 43
MF methods
concentration of Salmonella, , 161
cost, 246
fecal coliform, 124, 128
fecal streptococci, 136
general MF techniques, 70
total coliform, 108
M-Coliform broth, 43
M-Coliform holding broth, (LES holding medium),
44
MPN, (most probable number), 78
MR-VP broth, 42
M-VFC holding medium, 45
Malonate broth, 55
Marine water, sampling of, 28
Malonate broth test, 170
Manpower and analytical costs, 246
Marine Protection Research and Sanctuaries Act
of 1972, 92, 279
Marine Sanitation Regulations, 92, see Marine
Protection, Research and Sanctuaries Act of
1972, 279
McFarland's barium sulfate standard, 177
Mean
arithmetic, 225
geometric, 226
Media, culture
azide dextrose broth, 46
bismuth sulfite agar, 53
blood agar base, with 10% blood, 50
blood agar with 0.4% potassium tellurite, 50
brain heart infusion agar, 47
brain heart infusion agar with potassium
tellurite, 49
brain heart infusion broth, pH 9.6, 48
brain heart infusion broth with 40% bile,
48
brain heart infusion broth with 6.5% NaCI,
48
brilliant green agar, 52
brilliant green bile broth 2%, 45
comparative testing, 203
decarboxylase medium, 55
dulcitol selenite broth, 51
EC medium (broth), 46
330
MICROBIOLOGICAL MANUAL 1978
image:
Laboratory records, 17
MF analyses, 59
MPN analyses, 59
Laboratory supplies, quality control of, 199
Lactose, fermentation, 152, 171
Lactose In purple broth base, 41
Lakes and Impoundment sampling, 24
Lauryl tryptose sulfate broth, 45
Laws, Federal Water
Federal Water Pollution Control Act
Amendments of 1972, Public Law
92-500, 278
Marine Protection, Research and
Sanctuaries Act of 1972, Public
Law 92-532, 279
Safe Drinking Water Act of 1974,
Public Law 93-523, 28O
sections relevant to microbiology, 289
Levlne's EMB agar, 46
Limitations of,
coliform test (total), MF, 108
coliform test (total), MPN, 114
fecal coliform test, MF, 124
fecal coliform MPN method, 132
fecal streptococci test
MF method, 136
MPN method, 139
pour plate method, 143
MF method, general, 70
MPN method, general, 78
Litmus milk, 49
Lysine decarboxylase test, 122, 171
Lyslne iron agar (LIA) test, 53, 169
M-FC agar, 43
M-FC broth. 43
M-Endo holding medium, 44
M-indo agar LES, 44
M-Endo broth MF, 43
MF methods
concentration of Salmonella, , 161
cost, 246
fecal coliform, 124, 128
fecal streptococci, 136
general MF techniques, 70
total coliform, 108
M-Coliform broth, 43
M-Coliform holding broth, (LES holding medium),
44
MPN, (most probable number), 78
MR-VP broth, 42
M-VFC holding medium, 45
Malonate broth, 55
Marine water, sampling of, 28
Malonate broth test, 170
Manpower and analytical costs, 246
Marine Protection Research and Sanctuaries Act
of 1972, 92, 279
Marine Sanitation Regulations, 92, see Marine
Protection, Research and Sanctuaries Act of
1972, 279
McFarland's barium sulfate standard, 177
Mean
arithmetic, 225
geometric, 226
Media, culture
azide dextrose broth, 46
bismuth sulfite agar, 53
blood agar base, with 10% blood, 50
blood agar with 0.4% potassium tellurite, 50
brain heart infusion agar, 47
brain heart infusion agar with potassium
tellurite, 49
brain heart infusion broth, pH 9.6, 48
brain heart infusion broth with 40% bile,
48
brain heart infusion broth with 6.5% NaCI,
48
brilliant green agar, 52
brilliant green bile broth 2%, 45
comparative testing, 203
decarboxylase medium, 55
dulcitol selenite broth, 51
EC medium (broth), 46
330
MICROBIOLOGICAL MANUAL 1978
image:
 eosin methylene blue agar, see Levine's EMB
agar, 46
ethyl violet azide broth, 47
general use, 39
glucose broth, buffered (MR-VP broth), 42
H broth, 56
IMViC test media
tryptone 1%, 42
MR-VP broth, 42
Simmon's citrate agar, 42
KF streptococcus agar, 46
lactose 10% in purple broth base, 41
lauryl tryptose broth, see lauryl sulfate
broth, 45
LES MF holding medium, coliform, see
M-coliform holding broth, 44
litmus milk, 49
lysine iron agar, 53
M-coliform broth, 43
M-coliform holding broth, see LES
holding medium, 44 .
M-Endo agar LES, 44
M-Endo holding medium, 44
M-FC agar, 42
M-FC broth, 42
M-VFC holding medium, 45
malonate broth, 55
media for fecal streptococci, 46
media for Salmonella and other enterics, 51
medium for actinomycetes, 56
MF media for conforms, 42
motility sulfide medium, 55 ,
motility test medium, 42
MPN media for coliforms, 45
nutrient agar, 39
nutrient broth, 39
nutrient gelatin, 49
phenylaianine agar, 54
plate count agar, (Standard Methods Agar),
4O
potassium tellurite in blood agar, 5O
potassium tellurite in brain heart infusion
agar, 49
purple broth base ,41
purple broth base with sorbose, pH 10, 41
PSE agar (Pfizer selective enterococcus), 47
selenite F broth ,51
Simmon's citrate agar, 42
skim milk with 0.1% methylene blue, 49
standard methods agar, 40
starch agar, 48
starch casein agar, 5i
starch liquid, medium, 48
TTC agar (Tetrazolium Glucose Agar), 50
tetrathionate brilliant green broth, 51
tetrathionate broth base ,51
tetrazolium glucose agar, (TTC agar), 50
triple sugar iron agar, 53
2,3,5-triphenyl tetrazolium chloride agar,
(tetrazolium Glucose Agar), 5,0
tryptic soy broth, 40
trypticase soy agar,- 40
tryptone glucose yeast agar (Standard
Methods Agar), 40
tryptophane broth, (tryptone, 1%), 42
urea agar base, 54
urea agar base, 10X, 54
xylose lysine brilliant green agar, 52
xylose lysine desoxycholate agar, 52
Media dispensing apparatus, 213
Media, quality control of, 208
use test for, 203
Median, 226
Membrane filter apparatus, 71
Membrane filter method
concentrating Salmonella, 161
costs, 246
fecal coliforms, 124, 128
fecal streptococci, 136
total coliforms, 108
Membrane filters '• •
ASTM tests for, 205
changes in, 97
comparative testing, 203
government specification, 205
quality control of, 211
specifications and use, 74
use tests, 205
Measurement of analysts' precision, 232
Meter, for UV light, 199
Method characterization, 240
Method modifications, 97
Method selection, 91
Methyl red test, 121
Methylene blue, reduction in mflk te,sj, 147
Microbiologists' responsibilities under water
laws. Appendix A, 289
Microscope, compound
quality control of, 214
use in stain examination, 80, 87
331
image:
eosin methylene blue agar, see Levine's EMB
agar, 46
ethyl violet azide broth, 47
general use, 39
glucose broth, buffered (MR-VP broth), 42
H broth, 56
IMViC test media
tryptone 1%, 42
MR-VP broth, 42
Simmon's citrate agar, 42
KF streptococcus agar, 46
lactose 10% in purple broth base, 41
lauryl tryptose broth, see lauryl sulfate
broth, 45
LES MF holding medium, coliform, see
M-coliform holding broth, 44
litmus milk, 49
lysine iron agar, 53
M-coliform broth, 43
M-coliform holding broth, see LES
holding medium, 44 .
M-Endo agar LES, 44
M-Endo holding medium, 44
M-FC agar, 42
M-FC broth, 42
M-VFC holding medium, 45
malonate broth, 55
media for fecal streptococci, 46
media for Salmonella and other enterics, 51
medium for actinomycetes, 56
MF media for conforms, 42
motility sulfide medium, 55 ,
motility test medium, 42
MPN media for coliforms, 45
nutrient agar, 39
nutrient broth, 39
nutrient gelatin, 49
phenylaianine agar, 54
plate count agar, (Standard Methods Agar),
4O
potassium tellurite in blood agar, 5O
potassium tellurite in brain heart infusion
agar, 49
purple broth base ,41
purple broth base with sorbose, pH 10, 41
PSE agar (Pfizer selective enterococcus), 47
selenite F broth ,51
Simmon's citrate agar, 42
skim milk with 0.1% methylene blue, 49
standard methods agar, 40
starch agar, 48
starch casein agar, 5i
starch liquid, medium, 48
TTC agar (Tetrazolium Glucose Agar), 50
tetrathionate brilliant green broth, 51
tetrathionate broth base ,51
tetrazolium glucose agar, (TTC agar), 50
triple sugar iron agar, 53
2,3,5-triphenyl tetrazolium chloride agar,
(tetrazolium Glucose Agar), 5,0
tryptic soy broth, 40
trypticase soy agar,- 40
tryptone glucose yeast agar (Standard
Methods Agar), 40
tryptophane broth, (tryptone, 1%), 42
urea agar base, 54
urea agar base, 10X, 54
xylose lysine brilliant green agar, 52
xylose lysine desoxycholate agar, 52
Media dispensing apparatus, 213
Media, quality control of, 208
use test for, 203
Median, 226
Membrane filter apparatus, 71
Membrane filter method
concentrating Salmonella, 161
costs, 246
fecal coliforms, 124, 128
fecal streptococci, 136
total coliforms, 108
Membrane filters '• •
ASTM tests for, 205
changes in, 97
comparative testing, 203
government specification, 205
quality control of, 211
specifications and use, 74
use tests, 205
Measurement of analysts' precision, 232
Meter, for UV light, 199
Method characterization, 240
Method modifications, 97
Method selection, 91
Methyl red test, 121
Methylene blue, reduction in mflk te,sj, 147
Microbiologists' responsibilities under water
laws. Appendix A, 289
Microscope, compound
quality control of, 214
use in stain examination, 80, 87
331
image:
 Microscope, fluorescence
use in fluorescent antibody techniques, 180
Microscope, low power
quality control, 214
use In MF method, 71
Milk, peptonization test, 150
Mode, 228
Moist heat sterilization, 36
Most probable number (MPN) methods
costs, 246
fecal coliforms, 132
fecal streptococci, 139
general technique, 78
tables, 82
Salmonella, 180
total coliforms, 114
Motility test, 122, 171
Motility test medium, 42
Multi-test systems, (biochemical tests), 122, 172
National Interim Primary Drinking Water
Reflulations (NiPDWR), 91
National Pollution Discharge Elimination
System (NPDES) Guidelines, 92
Negative Controls, 231
Neutralization of toxic materials and metals, 6
New York Dept of Health depth sampler, 8
Niskin sampler, 8
Normal distribution, 227
Nutrient agar, 39
Nutrient broth, 39
Nutrient gelatin, 49
0 and VI antigens, alternate test for, 179
0 Group test for Salmonella, 177
ONPG test fO-nltrophenyl-B-D-galacto-
pyranoside), 171
Orntthine decarboxylase test, 122, 171
Oven, dry heat, 36
Parallel testing, 96, 234
Pathogens, 154
laboratory safety guidelines, 265
shipment of cultures, 88
sources of hazard, 262
Peptone, dilution water, 57
Performance characteristics
in method development, 240
in method evaluation and comparison, 240
Performance sample, 231
Performance specifications, equipment and
materials
balance, 33
dilution blanks, 58
general, 198
graduates, 33
incubators, 32
membrane filters, 205
pipets, 34
Personal safety, 265
Personnel, requirements, 197
Petri dishes, 32
membrane filters, 74
pour and streak, 66
pH measurements
glassware, 199
media, 208
pH meter
quality control, 205
specifications, 33
Phenol red broth base, 40
Phenylalanine agar, 54
Phenylalanlne test, 170
Phosphate-buffered water, 57
Plpet containers, 34
Pipets
specifications, 34
tolerances, 34
Pipetting devices, 34
332
MICROBIOLOGICAL MANUAL 1978
image:
Microscope, fluorescence
use in fluorescent antibody techniques, 180
Microscope, low power
quality control, 214
use In MF method, 71
Milk, peptonization test, 150
Mode, 228
Moist heat sterilization, 36
Most probable number (MPN) methods
costs, 246
fecal coliforms, 132
fecal streptococci, 139
general technique, 78
tables, 82
Salmonella, 180
total coliforms, 114
Motility test, 122, 171
Motility test medium, 42
Multi-test systems, (biochemical tests), 122, 172
National Interim Primary Drinking Water
Reflulations (NiPDWR), 91
National Pollution Discharge Elimination
System (NPDES) Guidelines, 92
Negative Controls, 231
Neutralization of toxic materials and metals, 6
New York Dept of Health depth sampler, 8
Niskin sampler, 8
Normal distribution, 227
Nutrient agar, 39
Nutrient broth, 39
Nutrient gelatin, 49
0 and VI antigens, alternate test for, 179
0 Group test for Salmonella, 177
ONPG test fO-nltrophenyl-B-D-galacto-
pyranoside), 171
Orntthine decarboxylase test, 122, 171
Oven, dry heat, 36
Parallel testing, 96, 234
Pathogens, 154
laboratory safety guidelines, 265
shipment of cultures, 88
sources of hazard, 262
Peptone, dilution water, 57
Performance characteristics
in method development, 240
in method evaluation and comparison, 240
Performance sample, 231
Performance specifications, equipment and
materials
balance, 33
dilution blanks, 58
general, 198
graduates, 33
incubators, 32
membrane filters, 205
pipets, 34
Personal safety, 265
Personnel, requirements, 197
Petri dishes, 32
membrane filters, 74
pour and streak, 66
pH measurements
glassware, 199
media, 208
pH meter
quality control, 205
specifications, 33
Phenol red broth base, 40
Phenylalanine agar, 54
Phenylalanlne test, 170
Phosphate-buffered water, 57
Plpet containers, 34
Pipets
specifications, 34
tolerances, 34
Pipetting devices, 34
332
MICROBIOLOGICAL MANUAL 1978
image:
 Plate count agar, (Standard Methods Agar),
40
Plating methods
pour, 65
spread, 65
streak, 65
Plates, culture, 32
Plates, spot culture, 182
Portable equipment, see Field kits, 97
Positive controls, 231
Potable water analyses
MF procedures, 108
MPN procedures, 114
special rules for counting, 113
total coliforms, 108
Potable water, sampling, 22
Potassium tellurite
in blood agar, 50
in brain heart infusion agar, 49
Pour plate method
Standard Plate Count, 101
Fecal Streptococci, 143
Precision, method , 240
Presumptive test
Total Coliform ,117
Isolation and Enumeration, 78
Pretreatment of samples, 59
PSE agar, 47
Public water supplies, sampling, 22-24
Pure cultures, 65 . , ,
Purple broth base, 41
Purple broth base with sorbose, pH 10, 41
Quality assurance
analytical quality control procedures, 231
comparative testing of methodologies, 234
compliance monitoring, 233
culture media, 208
development of a QA program, 244
equipment and instrumentation, 198
general laboratory supplies, 199
laboratory facilities, 194
laboratory management, 244
laboratory operations, 194
membrane filters, 205
personnel, 197
routine analyses, 231
sampling collection and handling, 194
statistics for microbiology, 225
Quality assurance of media
preparation, 208
purchase, 208
record maintenance, 211
sterilization, 209
storage recommendations, 210
use of agars, broths and enrichment
media, 210
Quality assurance program
documentation, 244
interlaboratory, 244
intralaboratory, 244
Quality control records, 194, 244
Quantitation of Salmonella, 179
Quebec colony counter, 66
Range, 227
Reagents, quality control of
chemical, 204
dyes and stains, 204
FA reagents, 204
serological, 204
Records
field, 17
laboratory
MF, 19, 60-61
MPN, 19, 60
quality control, 244
sampling, 22
Recovery
ambient temperature effect, 92
incomplete recovery, 96
interferences, 96
suppression, 96
333
image:
Plate count agar, (Standard Methods Agar),
40
Plating methods
pour, 65
spread, 65
streak, 65
Plates, culture, 32
Plates, spot culture, 182
Portable equipment, see Field kits, 97
Positive controls, 231
Potable water analyses
MF procedures, 108
MPN procedures, 114
special rules for counting, 113
total coliforms, 108
Potable water, sampling, 22
Potassium tellurite
in blood agar, 50
in brain heart infusion agar, 49
Pour plate method
Standard Plate Count, 101
Fecal Streptococci, 143
Precision, method , 240
Presumptive test
Total Coliform ,117
Isolation and Enumeration, 78
Pretreatment of samples, 59
PSE agar, 47
Public water supplies, sampling, 22-24
Pure cultures, 65 . , ,
Purple broth base, 41
Purple broth base with sorbose, pH 10, 41
Quality assurance
analytical quality control procedures, 231
comparative testing of methodologies, 234
compliance monitoring, 233
culture media, 208
development of a QA program, 244
equipment and instrumentation, 198
general laboratory supplies, 199
laboratory facilities, 194
laboratory management, 244
laboratory operations, 194
membrane filters, 205
personnel, 197
routine analyses, 231
sampling collection and handling, 194
statistics for microbiology, 225
Quality assurance of media
preparation, 208
purchase, 208
record maintenance, 211
sterilization, 209
storage recommendations, 210
use of agars, broths and enrichment
media, 210
Quality assurance program
documentation, 244
interlaboratory, 244
intralaboratory, 244
Quality control records, 194, 244
Quantitation of Salmonella, 179
Quebec colony counter, 66
Range, 227
Reagents, quality control of
chemical, 204
dyes and stains, 204
FA reagents, 204
serological, 204
Records
field, 17
laboratory
MF, 19, 60-61
MPN, 19, 60
quality control, 244
sampling, 22
Recovery
ambient temperature effect, 92
incomplete recovery, 96
interferences, 96
suppression, 96
333
image:
 Recreational waters, sampling
bathing beaches, 29
swimming pools, 29
Reference sample, 231
Refrigerator
quality control, 215
temperature control, 215
Repeat sampling, potable water supplies, 24
Reporting infections and accidents, 262
Results, reporting
MF analyses, 75
MPN analyses, 81
spread plates, 69
RODAC plates, agar, 195
Rosolic acid, 43
Rounding off numbers, 70
Safe Drinking Water Act of 1974, 280
Safety
administrative considerations, 259
biohazard control, 268
field guidelines, 263
laboratory guidelines, 265
safety check list, 269
sources of hazard, 262
Safety cabinets (hoods)
description, 268
quality control, 198, 214
Safety check list, 269
Safety guidelines
automotive, 263
biohazard control, 268
boat, 263
field, 263
laboratory, 265
safety check list, 269
sampling rules, 264
sampling under ice, 265
Safety program, development, 259
Salmonella
biochemical identification procedures
minimal biochemical set, 168
multitest systems, 172
optional biochemical tests, 171
screening tests, 169
cartridge filter, 161
concentration, 155
definition of genus, 154
diatomaceous earth, 160
fluorescent antibody screening technique,
180
isolation of, 164
membrane filtration, 161
primary enrichment, 162
quantitative techniques, 179
cartridge filter, 180
MF/diatomaceous earth filter, 180
serological testing, 173
slide agglutination test for 0
grouping, 177
slide agglutination test for Vi
antigen, 178
alternative slide agglutination test,
179
tube test for H antigen, 179
swab, technique, 155
Sample
containers, 6
dechlorination of, 6
dilution of, 62
high solids, 62
holding time limitations, 30
identification and handling, 14
preservation and transit, 30
pretreatment, 59
report forms, 17-18, 20,21
solid-type, 62
storage temperature, 30
volume, 6
Sample Collection, Quality Control in, 194
Sampling
chain of custody, 17
domestic and industrial wastes, 29
equipment, 8-14
frequency of, 24
general use lakes and impoundments, 24
marine & estuarine waters, 28
potable water supplies, 22
recreational waters, 29
safety, 264
sediment, 14
shellfish-harvesting waters, 29
site selection, 22
sludges, 14
soil ,14
streams, 24
334
MICROBIOLOGICAL MANUAL 1978
image:
Recreational waters, sampling
bathing beaches, 29
swimming pools, 29
Reference sample, 231
Refrigerator
quality control, 215
temperature control, 215
Repeat sampling, potable water supplies, 24
Reporting infections and accidents, 262
Results, reporting
MF analyses, 75
MPN analyses, 81
spread plates, 69
RODAC plates, agar, 195
Rosolic acid, 43
Rounding off numbers, 70
Safe Drinking Water Act of 1974, 280
Safety
administrative considerations, 259
biohazard control, 268
field guidelines, 263
laboratory guidelines, 265
safety check list, 269
sources of hazard, 262
Safety cabinets (hoods)
description, 268
quality control, 198, 214
Safety check list, 269
Safety guidelines
automotive, 263
biohazard control, 268
boat, 263
field, 263
laboratory, 265
safety check list, 269
sampling rules, 264
sampling under ice, 265
Safety program, development, 259
Salmonella
biochemical identification procedures
minimal biochemical set, 168
multitest systems, 172
optional biochemical tests, 171
screening tests, 169
cartridge filter, 161
concentration, 155
definition of genus, 154
diatomaceous earth, 160
fluorescent antibody screening technique,
180
isolation of, 164
membrane filtration, 161
primary enrichment, 162
quantitative techniques, 179
cartridge filter, 180
MF/diatomaceous earth filter, 180
serological testing, 173
slide agglutination test for 0
grouping, 177
slide agglutination test for Vi
antigen, 178
alternative slide agglutination test,
179
tube test for H antigen, 179
swab, technique, 155
Sample
containers, 6
dechlorination of, 6
dilution of, 62
high solids, 62
holding time limitations, 30
identification and handling, 14
preservation and transit, 30
pretreatment, 59
report forms, 17-18, 20,21
solid-type, 62
storage temperature, 30
volume, 6
Sample Collection, Quality Control in, 194
Sampling
chain of custody, 17
domestic and industrial wastes, 29
equipment, 8-14
frequency of, 24
general use lakes and impoundments, 24
marine & estuarine waters, 28
potable water supplies, 22
recreational waters, 29
safety, 264
sediment, 14
shellfish-harvesting waters, 29
site selection, 22
sludges, 14
soil ,14
streams, 24
334
MICROBIOLOGICAL MANUAL 1978
image:
 Sampling techniques, 6
Screening procedures for Salmonella
biochemical tests, 169
flourescent antibody technique, 180
Sediments, 62
Sediment sampler
Van Donsel-Geldreich, 14 • .
Selection of analytical methods, 91
Selectivity, method, 240
Selenite dulcitol broth, 51
Selenite F broth, 51
Serological testing. Salmonella, 173
Serological reagents, 204
Serratia marescens, retention test for
MFs, 206
Sewage, 92
Shellfish-harvesting waters, sampling, 29
Shipment of cultures, 87
Significant figures, 69
Simmons Citrate agar, 42
Slides, impression, 182
Sodium thiosulfate, for dechlorination
(neutralization), 6
Soil sampling, 14
Sorbitol (D) fermentation test, 149
Sorbose pH 10 fermentation test, 152
Specifications, performance and tolerance
balances, 33
dilution blanks, 58
graduates, 34
incubators, 32
MFs, 205
pipets, . 33
Specificity, method, 240
Spectrophotometer, quality control, 213
Spread plates
technique, 66
monitoring UV light effectiveness, 198
Spreader colonies, 106
Stain
crystal violet, 87
gram procedure, 86
Loeffler's methylene blue, 87
Lugol's iodine, 87
safranin, 87
smears, preparation of, 86
Staining procedures, 86
Standard deviation, 226
Standard methods agar, 40
Standard plate count
apparatus and materials, 102
counting and reporting results, 104
dilution of sample, 102
media, 102
precision and accuracy, 106
procedure, 102
scope and application, 101
Starch agar, 48
Starch casein agar, 56
Starch hydrolysis test, 150
Starch liquid medium, 48
Statistics for microbiology
measures of central tendency, 224
measures of dispersion, 226
normal distribution, 227
Steam sterilization, 36
Sterilization procedures
alcohol, 74
dry heat, 36
ethylene oxide chemical, 36
filtration, 36
incineration, 36
moist heat (steam), 36
ultraviolet irradiation, 36
Sterilizer, steam, 38
335
image:
Sampling techniques, 6
Screening procedures for Salmonella
biochemical tests, 169
flourescent antibody technique, 180
Sediments, 62
Sediment sampler
Van Donsel-Geldreich, 14 • .
Selection of analytical methods, 91
Selectivity, method, 240
Selenite dulcitol broth, 51
Selenite F broth, 51
Serological testing. Salmonella, 173
Serological reagents, 204
Serratia marescens, retention test for
MFs, 206
Sewage, 92
Shellfish-harvesting waters, sampling, 29
Shipment of cultures, 87
Significant figures, 69
Simmons Citrate agar, 42
Slides, impression, 182
Sodium thiosulfate, for dechlorination
(neutralization), 6
Soil sampling, 14
Sorbitol (D) fermentation test, 149
Sorbose pH 10 fermentation test, 152
Specifications, performance and tolerance
balances, 33
dilution blanks, 58
graduates, 34
incubators, 32
MFs, 205
pipets, . 33
Specificity, method, 240
Spectrophotometer, quality control, 213
Spread plates
technique, 66
monitoring UV light effectiveness, 198
Spreader colonies, 106
Stain
crystal violet, 87
gram procedure, 86
Loeffler's methylene blue, 87
Lugol's iodine, 87
safranin, 87
smears, preparation of, 86
Staining procedures, 86
Standard deviation, 226
Standard methods agar, 40
Standard plate count
apparatus and materials, 102
counting and reporting results, 104
dilution of sample, 102
media, 102
precision and accuracy, 106
procedure, 102
scope and application, 101
Starch agar, 48
Starch casein agar, 56
Starch hydrolysis test, 150
Starch liquid medium, 48
Statistics for microbiology
measures of central tendency, 224
measures of dispersion, 226
normal distribution, 227
Steam sterilization, 36
Sterilization procedures
alcohol, 74
dry heat, 36
ethylene oxide chemical, 36
filtration, 36
incineration, 36
moist heat (steam), 36
ultraviolet irradiation, 36
Sterilizer, steam, 38
335
image:
 Storage
dehydrated media, 208
impression slides, 183
prepared media, 210
samples, 30
Streak plate method, 65
Streptococci, fecal
definition, 135
determination of FC/FS ratios, 145
identification of species, 145
methods for enumeration and identification,
136
MF method, 136
MF verification, 138
MPN method, 139
pour plate method, 143
Streptomycetes (actinomycetes), 186
Stressed microorganisms, 92
Stream sampling, 24
Suitability test, detergent 199
for laboratory pure water, 200
Supplies
costs, 247
quality control of, 199
Suppression, 96
Surface sampling
by hand, 8
by weighted frame, 8
Surface sampler, 8
Swab contact method, 196
Swab technique for concentrating enterics, 155
Swimming pools, sampling, 29
Tables, MPN, 82
Temperature of incubation for Salmonella, 164
Temperature recording devices, 215
Test, water suitability, 200
Testimony, in court, 284
Tetrathionate brilliant green broth, 51
Tetrathionate brilliant green broth enrichment
for Salmonella, 163
Tetrathionate broth base, 51
Tetrathionate broth enrichment for
Salmonella, 163
Tetrazolium chloride, 2,3,5-triphenyl
reduction test, 147
Tetrazolium glucose agar (TTC agar), 50
Thermometer, 215
Time expenditures for microbiological analyses,
246
Titration of FA conjugate, 182
Tolerances
balances, 33
dilution blanks, 58
graduates, 33
incubators, 32
pipets, 33
Total Conforms, Analyses for
differentiation of, 119
MF test, delayed, 112
MF test, single-step, 110
MF test, two-step, 111
MF test, verification, 113
MPN test, 114
Toxic metals, neutralization of, 6
Training for personnel, 198
Transit time, 30
Triple sugar iron agar (TSI) test, 169
2,3,5-triphenyl tetrazolium chloride agar,
{tetrazolium glucose agar), 50
Triple sugar iron agar, 13
Tryptic soy broth, 40
Trypticase soy agar, 40
Tryptone glucose yeast agar,(Standard Methods
Agar), 40
*
Tryptophane broth, (tryptone, 1%), 42
336
MICROBIOLOGICAL MANUAL 1978
image:
Storage
dehydrated media, 208
impression slides, 183
prepared media, 210
samples, 30
Streak plate method, 65
Streptococci, fecal
definition, 135
determination of FC/FS ratios, 145
identification of species, 145
methods for enumeration and identification,
136
MF method, 136
MF verification, 138
MPN method, 139
pour plate method, 143
Streptomycetes (actinomycetes), 186
Stressed microorganisms, 92
Stream sampling, 24
Suitability test, detergent 199
for laboratory pure water, 200
Supplies
costs, 247
quality control of, 199
Suppression, 96
Surface sampling
by hand, 8
by weighted frame, 8
Surface sampler, 8
Swab contact method, 196
Swab technique for concentrating enterics, 155
Swimming pools, sampling, 29
Tables, MPN, 82
Temperature of incubation for Salmonella, 164
Temperature recording devices, 215
Test, water suitability, 200
Testimony, in court, 284
Tetrathionate brilliant green broth, 51
Tetrathionate brilliant green broth enrichment
for Salmonella, 163
Tetrathionate broth base, 51
Tetrathionate broth enrichment for
Salmonella, 163
Tetrazolium chloride, 2,3,5-triphenyl
reduction test, 147
Tetrazolium glucose agar (TTC agar), 50
Thermometer, 215
Time expenditures for microbiological analyses,
246
Titration of FA conjugate, 182
Tolerances
balances, 33
dilution blanks, 58
graduates, 33
incubators, 32
pipets, 33
Total Conforms, Analyses for
differentiation of, 119
MF test, delayed, 112
MF test, single-step, 110
MF test, two-step, 111
MF test, verification, 113
MPN test, 114
Toxic metals, neutralization of, 6
Training for personnel, 198
Transit time, 30
Triple sugar iron agar (TSI) test, 169
2,3,5-triphenyl tetrazolium chloride agar,
{tetrazolium glucose agar), 50
Triple sugar iron agar, 13
Tryptic soy broth, 40
Trypticase soy agar, 40
Tryptone glucose yeast agar,(Standard Methods
Agar), 40
*
Tryptophane broth, (tryptone, 1%), 42
336
MICROBIOLOGICAL MANUAL 1978
image:
 TTC (2,3,5-triphenyl tetrazolium chloride), 147
TTC agar (tetrazolium glucose agar), 5O
Tubes, culture, 34
Turbidity standard, (McFarland's barium sulfate),
177
Ultraviolet lamp sterilizer
meter, 199
monitoring efficiency, 198
use, 75
Ultraviolet light meter, 212, 199
Ultraviolet sterilization, 36
Unsatisfactory samples, potable waters, 24
Urea agar base, 54
Urea agar base, 10X, 54
Urease test, 169
Use test for media, membranes, and .
laboratory pure water, 203
Van Donsel-Geldreich sediment sampler, 14
Variability of replicates (precision) 240
Variance, 226
Verification
general, 78
fecal coliforms, 130
fecal streptococci, 138
membrane filter tests, 78
total coliforms, 113
Vi antigen, test for, 178
Voges-Proskauer test, 121
Water, deionized, 56
Water, deionizer, 212
Water, dilution, 57, 62
Water, distilled, 56
Water, laboratory pure, 56
Water laws, Federal, 277
Water quality criteria, 92
Water quality standards, 92
Water quality tests
use test, 203
water suitability- test, 200
Water still, 56, 212
Water suitability, test for, 200
k
Water tap sampling, 14
Waterbath, for tempering agar, 66, 68, 102
Waterbath, incubator
quality control, 215
specifications, 32
temperature control, 215
Workload, guidelines for, 246
Xylose -lysine brilliant green agar, 52
Xylose lysine desoxycholate agar, 52
ZoBell J-Z sampler, 8
337
image:
TTC (2,3,5-triphenyl tetrazolium chloride), 147
TTC agar (tetrazolium glucose agar), 5O
Tubes, culture, 34
Turbidity standard, (McFarland's barium sulfate),
177
Ultraviolet lamp sterilizer
meter, 199
monitoring efficiency, 198
use, 75
Ultraviolet light meter, 212, 199
Ultraviolet sterilization, 36
Unsatisfactory samples, potable waters, 24
Urea agar base, 54
Urea agar base, 10X, 54
Urease test, 169
Use test for media, membranes, and .
laboratory pure water, 203
Van Donsel-Geldreich sediment sampler, 14
Variability of replicates (precision) 240
Variance, 226
Verification
general, 78
fecal coliforms, 130
fecal streptococci, 138
membrane filter tests, 78
total coliforms, 113
Vi antigen, test for, 178
Voges-Proskauer test, 121
Water, deionized, 56
Water, deionizer, 212
Water, dilution, 57, 62
Water, distilled, 56
Water, laboratory pure, 56
Water laws, Federal, 277
Water quality criteria, 92
Water quality standards, 92
Water quality tests
use test, 203
water suitability- test, 200
Water still, 56, 212
Water suitability, test for, 200
k
Water tap sampling, 14
Waterbath, for tempering agar, 66, 68, 102
Waterbath, incubator
quality control, 215
specifications, 32
temperature control, 215
Workload, guidelines for, 246
Xylose -lysine brilliant green agar, 52
Xylose lysine desoxycholate agar, 52
ZoBell J-Z sampler, 8
337
image:
 TECHNICAL REPORT DATA
(Please read Instructions on the reverse before completing)
1 REPORT NO,
EPA-600/8-78-Q17
3. RECIPIENT'S ACCESSION-NO,
4. TITLE AND SUBTITLE
MICROBIOLOGICAL METHODS FOR MONITORING THE ENVIRONMENT
Water and Wastes
5. REPORT DATE
December 1978
6. PERFORMING ORGANIZATION CODE
7. AUTHORss) Editors:
Robert H. Bordner and John A. Winter, EMSL-Cincinnati;
Pasquale Scarplno, University of Cincinnati
8. PERFORMING ORGANIZATION REPORT NO
9. PERFORMING ORGANIZATION NAME AND ADDRESS
10. PROGRAM ELEMENT NO.
1HD 621
SAJfE AS BELOW
11, CONTRACT/GRANT NO.
68-03-0431
12, SPONSORING AGENCY NAME AND AOOHESS
Environmental Monitoring and Support Lab. - Cinn, OH
Office of Research and Development
U.S. Environmental Protection Agency
Cincinnati, OH 45268
13. TYPE OF REPORT AND PERIOD COVERED
Final
14. SPONSORING AGENCY CODE
EPA/600/06
15, SUPPLEMENTARY NOTES
Project Officer: John Winter,
EMSL, Cincinnati
18, ABSTRACT
This first EPA manual contains uniform laboratory and field methods for
microbiological analyses of waters and wastewaters, and is recommended in
enforcement, monitoring and research activities. The procedures are prepared
in detailed, stepwise form for the bench worker. The manual covers colifonn,
fecal colifora, fecal streptococci, Salmonella, actinomycetes and Standard
Plate Count organisms with the necessary support sections on sampling, equip-
ment, media, basic techniques, safety, and quality assurance.
7.
KEY WORDS AND DOCUMENT ANALYSIS
DESCRIPTORS
b.lDENTIFIERS/OPEN ENDED TERMS
c. cos AT I Field/Croup
Aquatic microbiology
Coliform bacteria
Enterobacteriaceae
Potable wa,ter
Public law
Quality assurance
Safety
Methodology
Microbiology
Surface waters
Statistics
Water analysis
Water pollution
Water quality
Waste water
Analytical procedures
Standard plate count
Total coliforms
Fecal coliforms
Pathogens
Indicator organisms
Fecal streptococci ,
06/M
19, DISTRIBUTION STATEMENT
RELEASE TO PUBLIC
19. SECURITY CLASS (ThisReport!
Unclassified
21. NO. OF PAGES
354
2O, SECURITY CLASS (Thispage)
Unclassified
22. PRICE
EPA Form 2220-1 C9-73)
338
*U,S. GOVERNMENT PRINTING OFFICE: 1991- S»M«7/HOSH1
image:
TECHNICAL REPORT DATA
(Please read Instructions on the reverse before completing)
1 REPORT NO,
EPA-600/8-78-Q17
3. RECIPIENT'S ACCESSION-NO,
4. TITLE AND SUBTITLE
MICROBIOLOGICAL METHODS FOR MONITORING THE ENVIRONMENT
Water and Wastes
5. REPORT DATE
December 1978
6. PERFORMING ORGANIZATION CODE
7. AUTHORss) Editors:
Robert H. Bordner and John A. Winter, EMSL-Cincinnati;
Pasquale Scarplno, University of Cincinnati
8. PERFORMING ORGANIZATION REPORT NO
9. PERFORMING ORGANIZATION NAME AND ADDRESS
10. PROGRAM ELEMENT NO.
1HD 621
SAJfE AS BELOW
11, CONTRACT/GRANT NO.
68-03-0431
12, SPONSORING AGENCY NAME AND AOOHESS
Environmental Monitoring and Support Lab. - Cinn, OH
Office of Research and Development
U.S. Environmental Protection Agency
Cincinnati, OH 45268
13. TYPE OF REPORT AND PERIOD COVERED
Final
14. SPONSORING AGENCY CODE
EPA/600/06
15, SUPPLEMENTARY NOTES
Project Officer: John Winter,
EMSL, Cincinnati
18, ABSTRACT
This first EPA manual contains uniform laboratory and field methods for
microbiological analyses of waters and wastewaters, and is recommended in
enforcement, monitoring and research activities. The procedures are prepared
in detailed, stepwise form for the bench worker. The manual covers colifonn,
fecal colifora, fecal streptococci, Salmonella, actinomycetes and Standard
Plate Count organisms with the necessary support sections on sampling, equip-
ment, media, basic techniques, safety, and quality assurance.
7.
KEY WORDS AND DOCUMENT ANALYSIS
DESCRIPTORS
b.lDENTIFIERS/OPEN ENDED TERMS
c. cos AT I Field/Croup
Aquatic microbiology
Coliform bacteria
Enterobacteriaceae
Potable wa,ter
Public law
Quality assurance
Safety
Methodology
Microbiology
Surface waters
Statistics
Water analysis
Water pollution
Water quality
Waste water
Analytical procedures
Standard plate count
Total coliforms
Fecal coliforms
Pathogens
Indicator organisms
Fecal streptococci ,
06/M
19, DISTRIBUTION STATEMENT
RELEASE TO PUBLIC
19. SECURITY CLASS (ThisReport!
Unclassified
21. NO. OF PAGES
354
2O, SECURITY CLASS (Thispage)
Unclassified
22. PRICE
EPA Form 2220-1 C9-73)
338
*U,S. GOVERNMENT PRINTING OFFICE: 1991- S»M«7/HOSH1
image: