<pubnumber>600278086</pubnumber>
<title>At-sea incineration of herbicide orange onboard the M/T Vulcanus</title>
<pages>274</pages>
<pubyear>1978</pubyear>
<provider>NEPIS</provider>
<access>online</access>
<origin>hardcopy</origin>
<author></author>
<publisher></publisher>
<subject></subject>
<abstract></abstract>
<operator>LM</operator>
<scandate>20120914</scandate>
<type>single page tiff</type>
<keyword></keyword>
EPA-600/2-78-086
April 1978
Environmental Protection Technology Series
AT-SEA INCINERATION
OF HERBICIDE ORANGE
ONBOARD THE M/T VULCANUS
Industrial Environmental Research Laboratory
Office of Research and Development
U.S. Environmental Protection Agency
Research Triangle Park, North Carolina 27711
image:
 EPA-600/2-78-086
April 1978
AT-SEA INCINERATION
OF HERBICIDE ORANGE
ONBOARD THE M/T VULCANUS
by
D.G. Ackerman, H.J. Fisher, R.J. Johnson,
R.F. Maddalone, B.J. Matthews, E.L. Moon,
K.H. Scheyer, C.C. Shih, and R.F. Tobias
TRW, Inc.
One Space Park
Redondo Beach, California 90278
Contract No. 68-01-2966
Program Element No. 1AB604
EPA Project Officer: Ronald A. Venezia
U.S. Air Force Project Officer: James W. Tremblay
Industrial Environmental Research Laboratory
Ullice of tnergy, Minerals, HIK! Industry
Research Triangle Park, NC 27711
Prepared for
U.S. AIR FORCE U.S. ENVIRONMENTAL PROTECTION AGENCY
OEHL/EC and Office of Research and Development
Brooks Air Force Base, Texas 78235 Washington, D.C. 20460
image:
EPA-600/2-78-086
April 1978
AT-SEA INCINERATION
OF HERBICIDE ORANGE
ONBOARD THE M/T VULCANUS
by
D.G. Ackerman, H.J. Fisher, R.J. Johnson,
R.F. Maddalone, B.J. Matthews, E.L. Moon,
K.H. Scheyer, C.C. Shih, and R.F. Tobias
TRW, Inc.
One Space Park
Redondo Beach, California 90278
Contract No. 68-01-2966
Program Element No. 1AB604
EPA Project Officer: Ronald A. Venezia
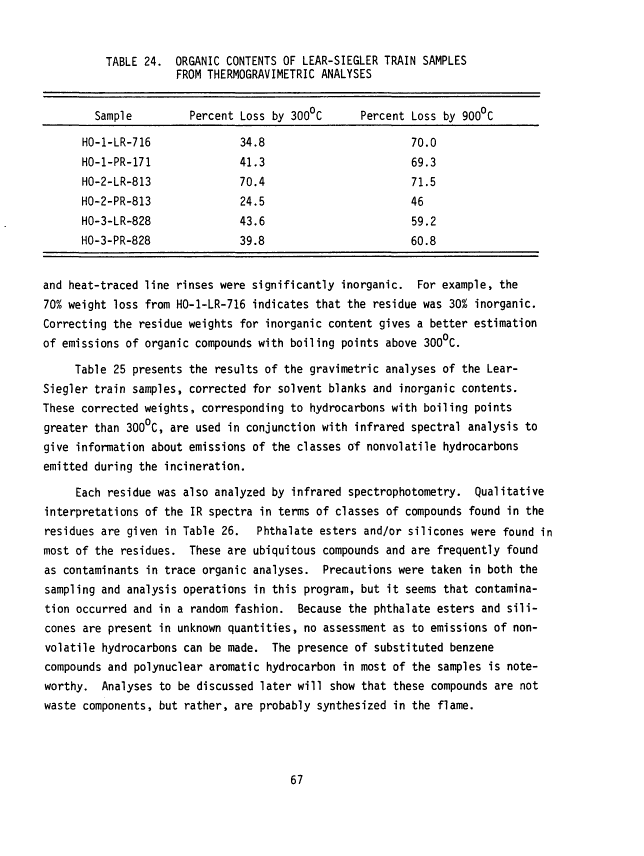
U.S. Air Force Project Officer: James W. Tremblay
Industrial Environmental Research Laboratory
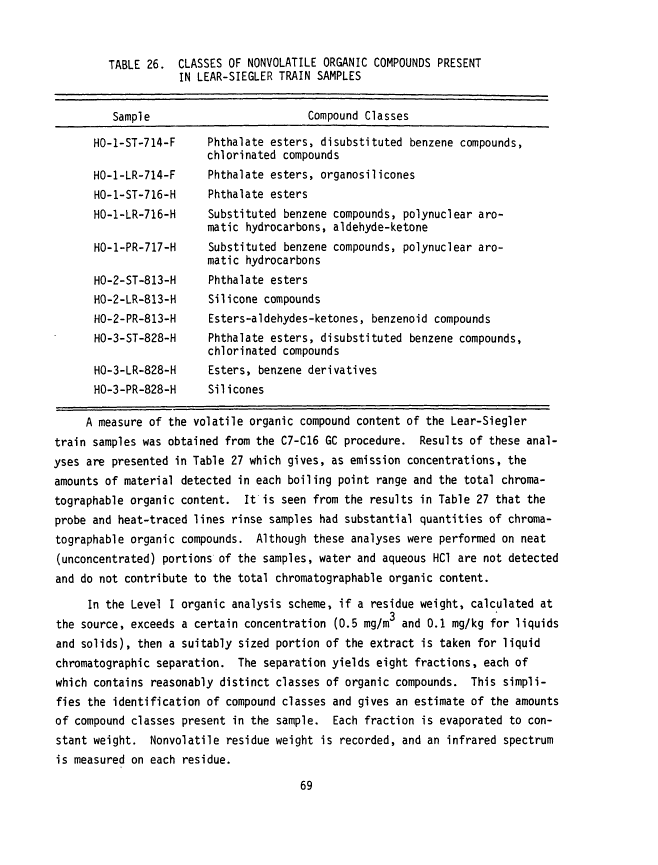
Ullice of tnergy, Minerals, HIK! Industry
Research Triangle Park, NC 27711
Prepared for
U.S. AIR FORCE U.S. ENVIRONMENTAL PROTECTION AGENCY
OEHL/EC and Office of Research and Development
Brooks Air Force Base, Texas 78235 Washington, D.C. 20460
image:
 ABSTRACT
This report describes at-sea incineration of approximately 10,400 metric
tons of U.S. Air Force-owned Herbicide Orange onboard the incinerator ship
M/T Vulcanus. Incineration took place within a Pacific Ocean burn zone located
West of Johnston Atoll which was designated by the U.S. Environmental Protec-
tion Agency. Three shiploads of Herbicide Orange were incinerated. The first
shipload was transported from the U.S. Naval Construction Battalion Base at
Gulfport, Mississippi, to the burn zone and incinerated under provisions of
U.S. EPA Research Permit No. 770DH001R. Shiploads two and three were subse-
quently taken onboard the Vulcanus at Johnston Island and incinerated under
U.S. EPA Special Permit No. 770DH001S. The U.S. Air Force and Ocean Combus-
tion Services, B.V., The Netherlands (owner of the M/T Vulcanus), were the
permi ttees.
Monitoring, sampling, and analysis of the incineration process to assure
compliance with U.S. EPA permit operating and safety conditions related to
at-sea operations were performed by personnel of TRW, Inc., Redondo Beach,
California. A U.S. EPA representative was onboard the Vulcanus during the
Research Permit burn. A U.S. Air Force representative participated in the
monitoring team activities during all three burns.
Monitoring activities utilized on-line instrumentation to measure carbon
monoxide and dioxide, oxygen concentration, and total hydrocarbons from both
incinerators. These parameters served as a measure of overall combustion effi-
ciency with primary emphasis on the ratio of carbon dioxide to carbon monoxide
in the effluent gases. Combustion efficiency exceeded 99.9% during all three
burns. Herbicide Orange was injected into the incineration system at an aver-
age rate of 14.5 metric tons per hour. Optical pyrometer flame temperature
measurements averaged 1500°C. A dwell time of 1.0 second was calculated for
the combustion gases in the incinerators.
image:
ABSTRACT
This report describes at-sea incineration of approximately 10,400 metric
tons of U.S. Air Force-owned Herbicide Orange onboard the incinerator ship
M/T Vulcanus. Incineration took place within a Pacific Ocean burn zone located
West of Johnston Atoll which was designated by the U.S. Environmental Protec-
tion Agency. Three shiploads of Herbicide Orange were incinerated. The first
shipload was transported from the U.S. Naval Construction Battalion Base at
Gulfport, Mississippi, to the burn zone and incinerated under provisions of
U.S. EPA Research Permit No. 770DH001R. Shiploads two and three were subse-
quently taken onboard the Vulcanus at Johnston Island and incinerated under
U.S. EPA Special Permit No. 770DH001S. The U.S. Air Force and Ocean Combus-
tion Services, B.V., The Netherlands (owner of the M/T Vulcanus), were the
permi ttees.
Monitoring, sampling, and analysis of the incineration process to assure
compliance with U.S. EPA permit operating and safety conditions related to
at-sea operations were performed by personnel of TRW, Inc., Redondo Beach,
California. A U.S. EPA representative was onboard the Vulcanus during the
Research Permit burn. A U.S. Air Force representative participated in the
monitoring team activities during all three burns.
Monitoring activities utilized on-line instrumentation to measure carbon
monoxide and dioxide, oxygen concentration, and total hydrocarbons from both
incinerators. These parameters served as a measure of overall combustion effi-
ciency with primary emphasis on the ratio of carbon dioxide to carbon monoxide
in the effluent gases. Combustion efficiency exceeded 99.9% during all three
burns. Herbicide Orange was injected into the incineration system at an aver-
age rate of 14.5 metric tons per hour. Optical pyrometer flame temperature
measurements averaged 1500°C. A dwell time of 1.0 second was calculated for
the combustion gases in the incinerators.
image:
 Effluent sampling was accomplished using a traversing sample probe
installed on the starboard incinerator. A USAF benzene impinger train and a
modified EPA Method 5 train were used to acquire combustion effluent samples.
Analysis of these samples was conducted to determine destruction efficiencies
for the normal butyl esters of 2,4-dichlorophenoxyacetic acid and 2,4,5 tri-
chlorophenoxyacetic acid, primary constituents of Herbicide Orange, as well as
2,3,7,8 tetrachlorodibenzo-p-dioxin, a contaminant present in the herbicide.
Destruction efficiencies in excess of 99.9% were determined for all three
burns.
Destruction and combustion efficiencies measured during the Research and
Special Permit burns met or exceeded requirements. All other conditions of
the permits related to at-sea incineration operations were met including adher-
ence to a comprehensive safety plan.
This report was submitted in fulfillment of Contract No. 68-01-2966 by
TRW Defense and Space Systems Group, TRW Inc., under sponsorship of the U.S.
Environmental Protection Agency. This report covers the period 15 April 1977
to 15 April 1978.
m
image:
Effluent sampling was accomplished using a traversing sample probe
installed on the starboard incinerator. A USAF benzene impinger train and a
modified EPA Method 5 train were used to acquire combustion effluent samples.
Analysis of these samples was conducted to determine destruction efficiencies
for the normal butyl esters of 2,4-dichlorophenoxyacetic acid and 2,4,5 tri-
chlorophenoxyacetic acid, primary constituents of Herbicide Orange, as well as
2,3,7,8 tetrachlorodibenzo-p-dioxin, a contaminant present in the herbicide.
Destruction efficiencies in excess of 99.9% were determined for all three
burns.
Destruction and combustion efficiencies measured during the Research and
Special Permit burns met or exceeded requirements. All other conditions of
the permits related to at-sea incineration operations were met including adher-
ence to a comprehensive safety plan.
This report was submitted in fulfillment of Contract No. 68-01-2966 by
TRW Defense and Space Systems Group, TRW Inc., under sponsorship of the U.S.
Environmental Protection Agency. This report covers the period 15 April 1977
to 15 April 1978.
m
image:
 ACKNOWLEDGEMENTS
This effort was successfully accomplished because of the assistance and
cooperation of a large number of individuals and their respective organizations.
Equipment design and development, definition of sampling requirements, the
acquisition of samples and their subsequent analyses were accomplished by per-
sonnel from the Applied Technology and Environmental Engineering Divisions of
TRW, Inc., Redondo Beach, California. Analyses of certain types of samples
were performed by the Brehm Laboratory of Wright State University, Dayton, Ohio;
by Battelle-Columbus Laboratories, Columbus, Ohio; and by U.S. Air Force Occupa-
tional and Environmental Health Laboratories, Kelly and Brooks Air Force Bases,
Texas. Engineering liaison to adapt test equipment for use onboard the M/T
Vulcanus was facilitated by the management of Ocean Combustion Services, B.V.,
of The Netherlands. Installation of this equipment, as well as the acquisition
of data and samples, was accomplished through the assistance of the ship's
officers and crew. Complete cooperation was received from Johnston Island per-
sonnel of Holmes and Narver, Inc., Anaheim, California.
Technical direction, assistance, and planning of the conceptual design and
implementation of this program were received from a number of agencies and orga-
nizations within the U.S. Government. These include the U.S. Environmental Pro-
tection Agency's Oil and Special Materials Control Division (OSMCD), Washington,
D.C., Industrial Environmental Research Laboratory (IERL), Research Triangle
Park, North Carolina, and the Regional Office, Region IX, San Francisco,
California; the U.S. Air Force's Occupational and Environmental Health Labora-
tories (OEHL), Kelly and Brooks Air Force Bases, Texas, and McClellan Air Force
Base, California; the Air Force Logistics Command, Wright-Patterson Air Force
Base, Dayton, Ohio; the Military Sealift Command; the Military Airlift Command;
and the Defense Nuclear Agency. The Honolulu, Hawaii, Communications Station
of the U.S. Coast Guard provided communications between the M/T Vulcanus and
Johnston Island. U.S. Coast Guard Headquarters, Washington, D.C., provided
guidance in installation of equipment on the Vulcanus to conform with U.S. mari-
time regulations.
The authors are indebted to the many individuals of all of these organiza-
tions for their contributions.
iv
image:
ACKNOWLEDGEMENTS
This effort was successfully accomplished because of the assistance and
cooperation of a large number of individuals and their respective organizations.
Equipment design and development, definition of sampling requirements, the
acquisition of samples and their subsequent analyses were accomplished by per-
sonnel from the Applied Technology and Environmental Engineering Divisions of
TRW, Inc., Redondo Beach, California. Analyses of certain types of samples
were performed by the Brehm Laboratory of Wright State University, Dayton, Ohio;
by Battelle-Columbus Laboratories, Columbus, Ohio; and by U.S. Air Force Occupa-
tional and Environmental Health Laboratories, Kelly and Brooks Air Force Bases,
Texas. Engineering liaison to adapt test equipment for use onboard the M/T
Vulcanus was facilitated by the management of Ocean Combustion Services, B.V.,
of The Netherlands. Installation of this equipment, as well as the acquisition
of data and samples, was accomplished through the assistance of the ship's
officers and crew. Complete cooperation was received from Johnston Island per-
sonnel of Holmes and Narver, Inc., Anaheim, California.
Technical direction, assistance, and planning of the conceptual design and
implementation of this program were received from a number of agencies and orga-
nizations within the U.S. Government. These include the U.S. Environmental Pro-
tection Agency's Oil and Special Materials Control Division (OSMCD), Washington,
D.C., Industrial Environmental Research Laboratory (IERL), Research Triangle
Park, North Carolina, and the Regional Office, Region IX, San Francisco,
California; the U.S. Air Force's Occupational and Environmental Health Labora-
tories (OEHL), Kelly and Brooks Air Force Bases, Texas, and McClellan Air Force
Base, California; the Air Force Logistics Command, Wright-Patterson Air Force
Base, Dayton, Ohio; the Military Sealift Command; the Military Airlift Command;
and the Defense Nuclear Agency. The Honolulu, Hawaii, Communications Station
of the U.S. Coast Guard provided communications between the M/T Vulcanus and
Johnston Island. U.S. Coast Guard Headquarters, Washington, D.C., provided
guidance in installation of equipment on the Vulcanus to conform with U.S. mari-
time regulations.
The authors are indebted to the many individuals of all of these organiza-
tions for their contributions.
iv
image:
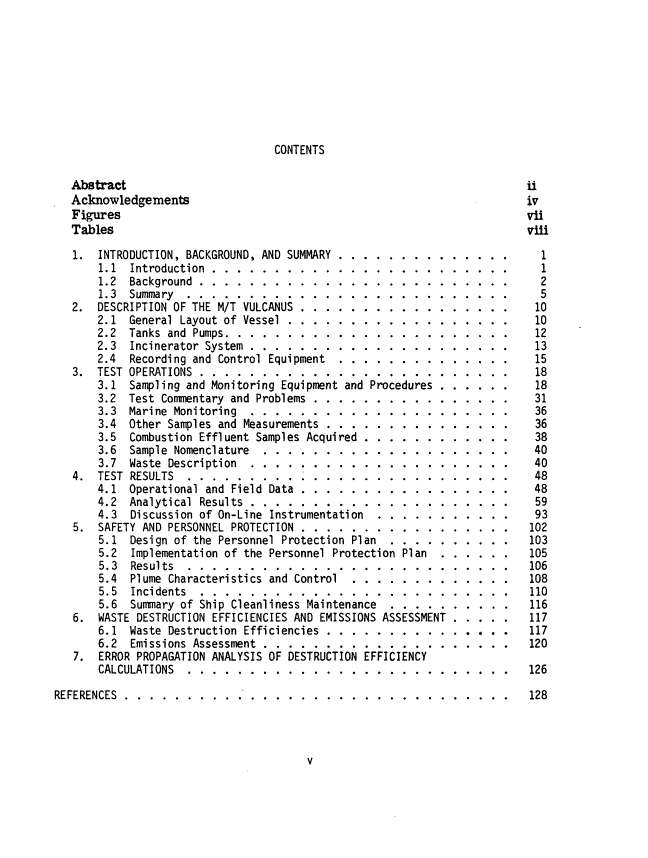
 CONTENTS
Abstract li
Acknowledgements iv
Figures vii
Tables iriii
1. INTRODUCTION, BACKGROUND, AND SUMMARY 1
1.1 Introduction 1
1.2 Background 2
1.3 Summary 5
2. DESCRIPTION OF THE M/T VULCANUS 10
2.1 General Layout of Vessel 10
2.2 Tanks and Pumps 12
2.3 Incinerator System 13
2.4 Recording and Control Equipment 15
3. TEST OPERATIONS 18
3.1 Sampling and Monitoring Equipment and Procedures 18
3.2 Test Commentary and Problems 31
3.3 Marine Monitoring 36
3.4 Other Samples and Measurements 36
3.5 Combustion Effluent Samples Acquired 38
3.6 Sample Nomenclature 40
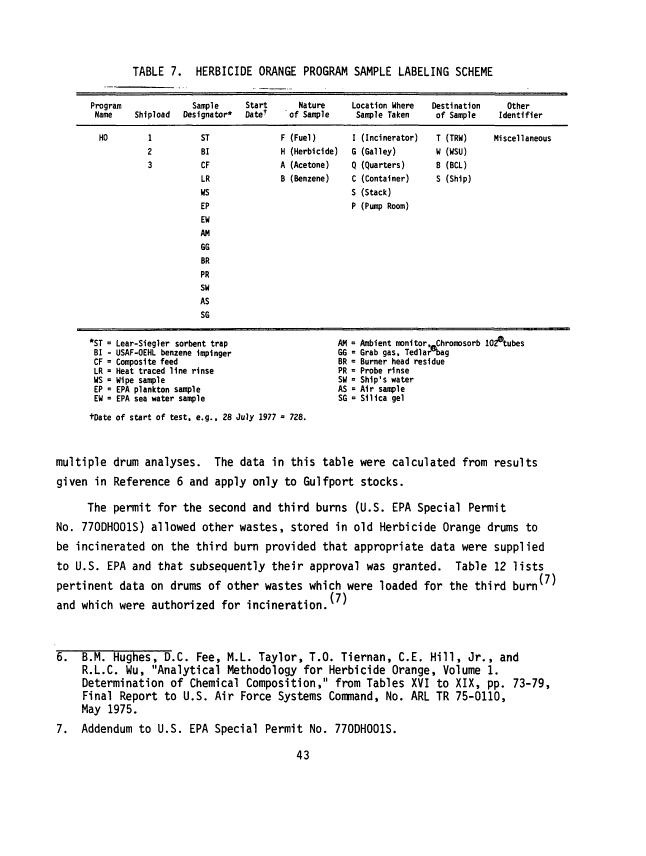
3.7 Waste Description 40
4. TEST RESULTS 48
4.1 Operational and Field Data 48
4.2 Analytical Results 59
4.3 Discussion of On-Line Instrumentation 93
5. SAFETY AND PERSONNEL PROTECTION 102
5.1 Design of the Personnel Protection Plan 103
5.2 Implementation of the Personnel Protection Plan 105
5.3 Results 106
5.4 Plume Characteristics and Control 108
5.5 Incidents 110
5.6 Summary of Ship Cleanliness Maintenance 116
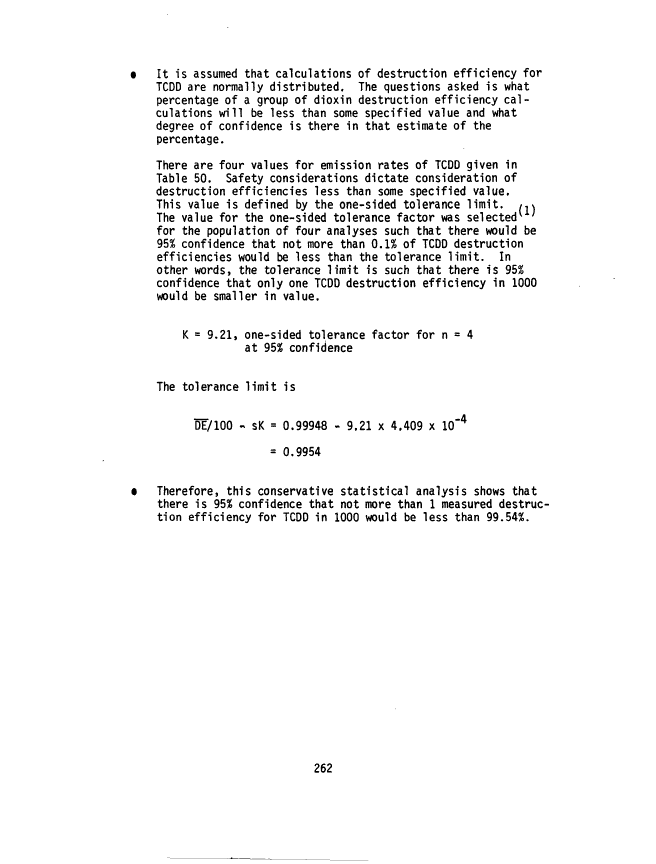
6. WASTE DESTRUCTION EFFICIENCIES AND EMISSIONS ASSESSMENT 117
6.1 Waste Destruction Efficiencies 117
6.2 Emissions Assessment 120
7. ERROR PROPAGATION ANALYSIS OF DESTRUCTION EFFICIENCY
CALCULATIONS 126
REFERENCES 128
image:
CONTENTS
Abstract li
Acknowledgements iv
Figures vii
Tables iriii
1. INTRODUCTION, BACKGROUND, AND SUMMARY 1
1.1 Introduction 1
1.2 Background 2
1.3 Summary 5
2. DESCRIPTION OF THE M/T VULCANUS 10
2.1 General Layout of Vessel 10
2.2 Tanks and Pumps 12
2.3 Incinerator System 13
2.4 Recording and Control Equipment 15
3. TEST OPERATIONS 18
3.1 Sampling and Monitoring Equipment and Procedures 18
3.2 Test Commentary and Problems 31
3.3 Marine Monitoring 36
3.4 Other Samples and Measurements 36
3.5 Combustion Effluent Samples Acquired 38
3.6 Sample Nomenclature 40
3.7 Waste Description 40
4. TEST RESULTS 48
4.1 Operational and Field Data 48
4.2 Analytical Results 59
4.3 Discussion of On-Line Instrumentation 93
5. SAFETY AND PERSONNEL PROTECTION 102
5.1 Design of the Personnel Protection Plan 103
5.2 Implementation of the Personnel Protection Plan 105
5.3 Results 106
5.4 Plume Characteristics and Control 108
5.5 Incidents 110
5.6 Summary of Ship Cleanliness Maintenance 116
6. WASTE DESTRUCTION EFFICIENCIES AND EMISSIONS ASSESSMENT 117
6.1 Waste Destruction Efficiencies 117
6.2 Emissions Assessment 120
7. ERROR PROPAGATION ANALYSIS OF DESTRUCTION EFFICIENCY
CALCULATIONS 126
REFERENCES 128
image:
 CONTENTS (Continued)
APPENDICES 129
A. Safety Plan for Incineration of Herbicide Orange
Onboard the M/T Vulcanus 129
B. Toxicological Properties of 2,4-D, 2,4,5-T and TCDD 155
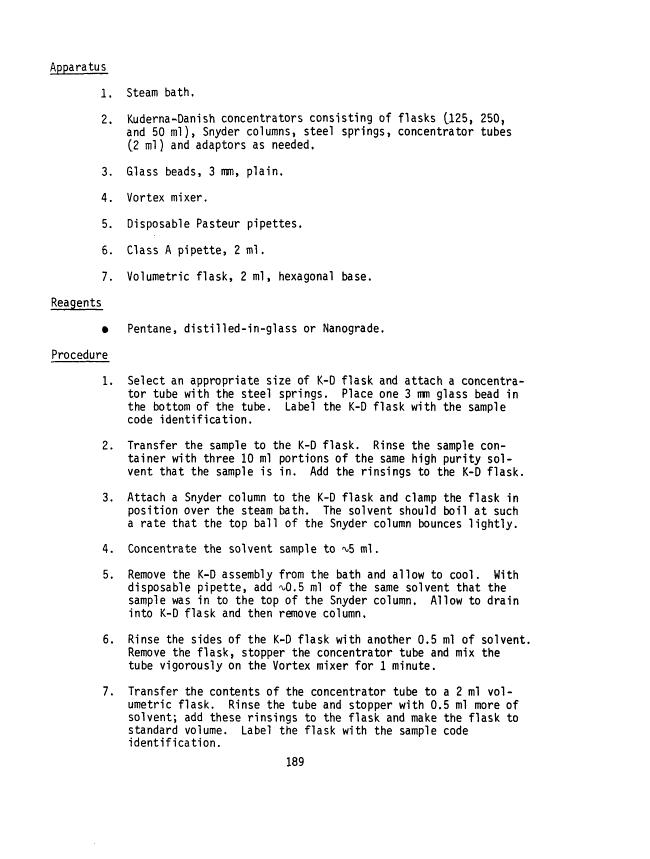
C. Analytical Procedures Used by TRW 182
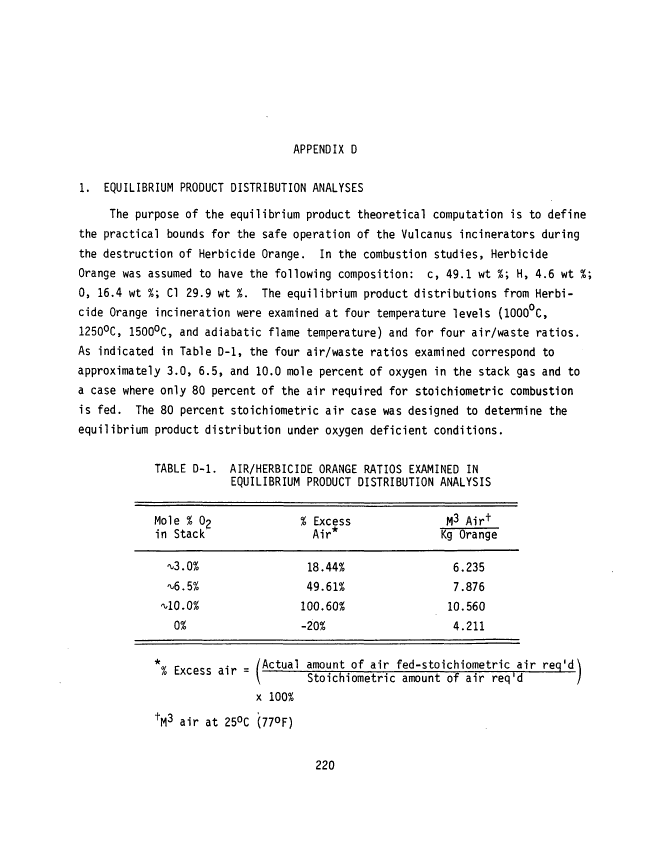
D. Thermochemical Analysis and Estimation of
Emission Levels 218
E. Trapping Efficiency Study of the Lear-Siegler
Train Sorbent Trap 230
F. Sample Calculations 236
G. Analysis of Variance of Destruction
Efficiency Calculations 248
image:
CONTENTS (Continued)
APPENDICES 129
A. Safety Plan for Incineration of Herbicide Orange
Onboard the M/T Vulcanus 129
B. Toxicological Properties of 2,4-D, 2,4,5-T and TCDD 155
C. Analytical Procedures Used by TRW 182
D. Thermochemical Analysis and Estimation of
Emission Levels 218
E. Trapping Efficiency Study of the Lear-Siegler
Train Sorbent Trap 230
F. Sample Calculations 236
G. Analysis of Variance of Destruction
Efficiency Calculations 248
image:
 FIGURES
Number Page
1 Geographical relationship of burn zone to Johnston
Atoll and the Hawaiian Islands 6
2 M/T Vulcanus — incineration vessel 10
3 Cargo tank layout schematic 12
4 Incinerator configuration 13
5 Incineration system — burner and thermocouple locations ... 14
6 Layout of portable laboratory 21
7 Configuration of heat traced lines, probes, and
sampling trains 22
8 Schematic of on-line monitoring system 23
9 Probe design 25
10 Schematic of mount for the movable probe 25
11 Sampling port locations 27
12 Traverse points for stack sampling 27
13 Schematic of USAF-OEHL benzene impinger sampling train .... 28
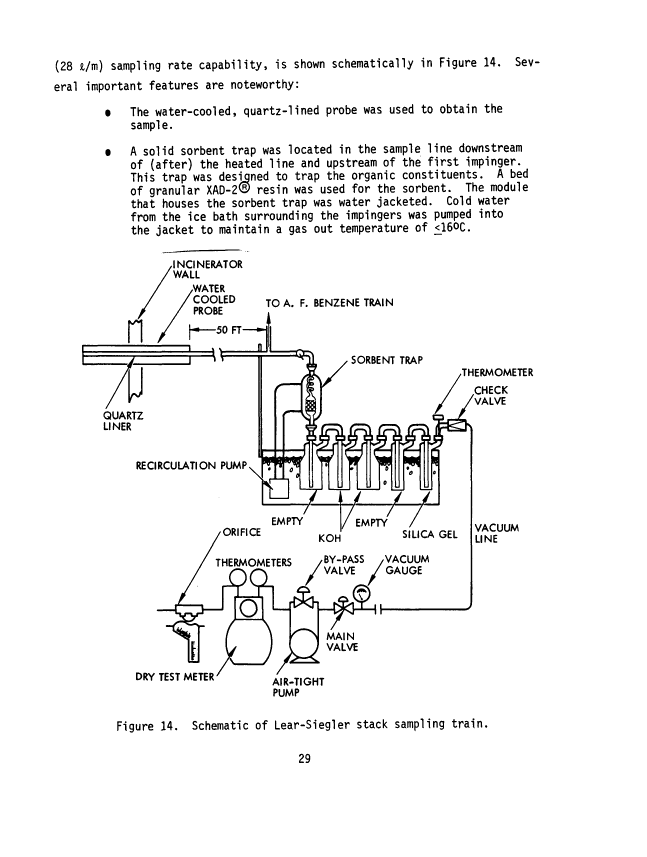
14 Schematic of Lear-Siegler stack sampling train 29
15 Combustion efficiency versus probe insertion depth 52
16 Flow diagram of TRW analysis plan 61
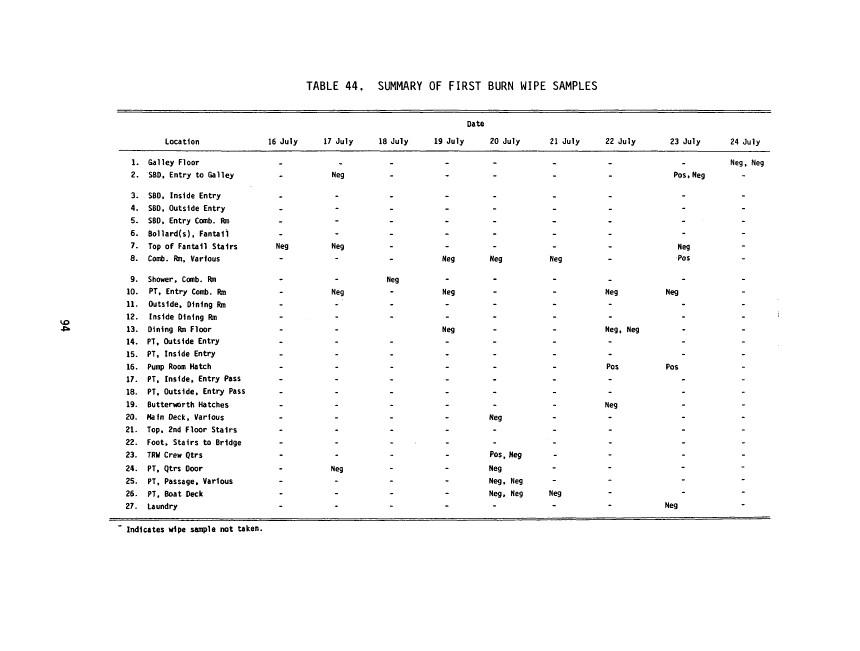
17 Location of wipe samples on M/T Vulcanus — summary
of three burns 97
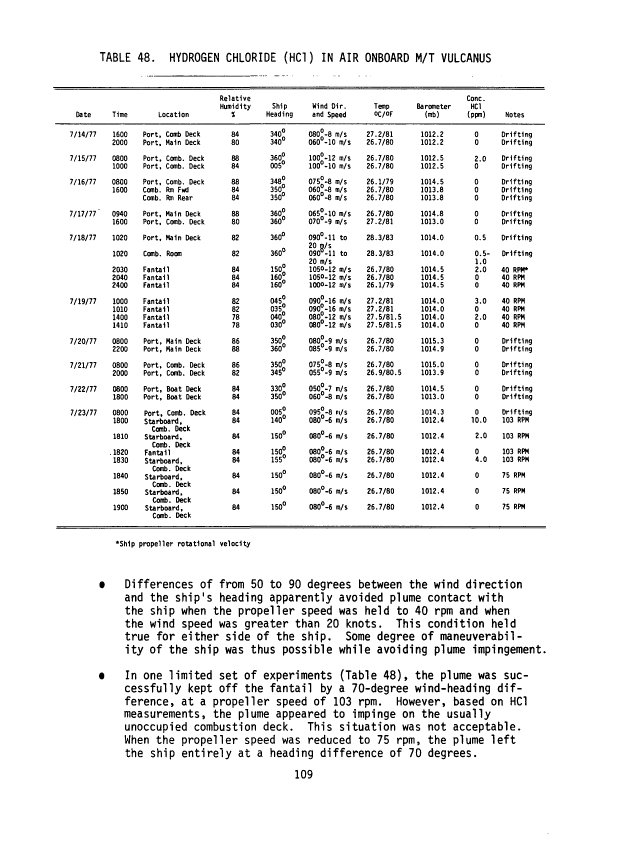
18 Ship headings relative to wind direction which avoided
plume impact on ship 110
19 Schematic of Vulcanus1 main deck showing
spill locations 113
vii
image:
FIGURES
Number Page
1 Geographical relationship of burn zone to Johnston
Atoll and the Hawaiian Islands 6
2 M/T Vulcanus — incineration vessel 10
3 Cargo tank layout schematic 12
4 Incinerator configuration 13
5 Incineration system — burner and thermocouple locations ... 14
6 Layout of portable laboratory 21
7 Configuration of heat traced lines, probes, and
sampling trains 22
8 Schematic of on-line monitoring system 23
9 Probe design 25
10 Schematic of mount for the movable probe 25
11 Sampling port locations 27
12 Traverse points for stack sampling 27
13 Schematic of USAF-OEHL benzene impinger sampling train .... 28
14 Schematic of Lear-Siegler stack sampling train 29
15 Combustion efficiency versus probe insertion depth 52
16 Flow diagram of TRW analysis plan 61
17 Location of wipe samples on M/T Vulcanus — summary
of three burns 97
18 Ship headings relative to wind direction which avoided
plume impact on ship 110
19 Schematic of Vulcanus1 main deck showing
spill locations 113
vii
image:
 TABLES
Number Page
1 Definition of Incineration Efficiency Terms 7
2 Summary of Calculated Incineration Efficiencies 8
3 Specifications of the M/T Vulcanus 11
4 On-Line Monitors 23
5 Summary of Combustion Effluent Samples Acquired 39
6 Train Sample Volumes and Apportionment of Probe and
Line Rinses 41
7 Herbicide Orange Program Sample Labeling Scheme ........ 43
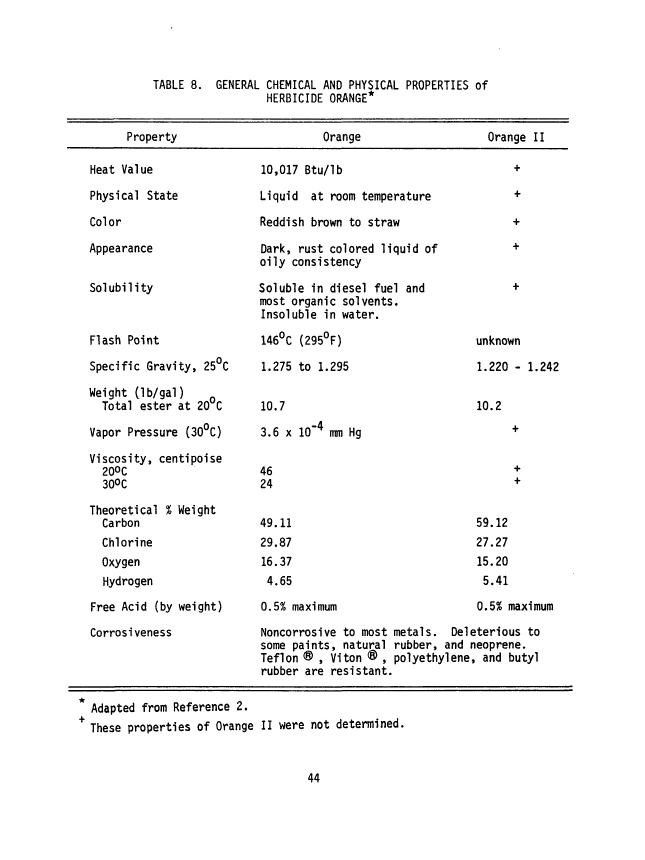
8 General Chemical and Physical Properties of
Herbicide Orange 44
9 General Properties of Ingredient Esters of
Herbicide Orange 45
10 General Data Relative to TCDD 45
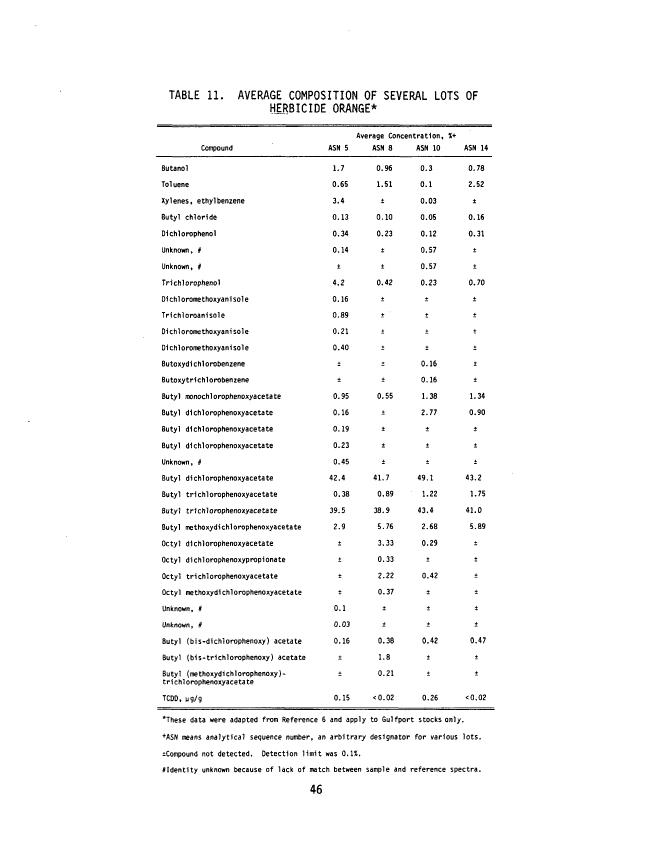
11 Average Composition of Several Lots of
Herbicide Orange 46
12 Drums Authorized for Loading for Third Bum 47
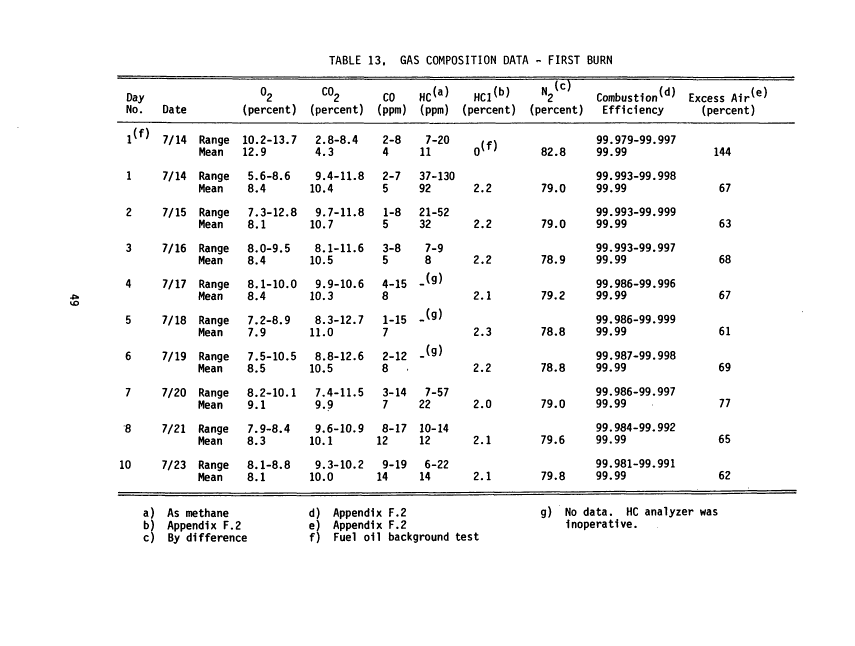
13 Gas Composition Data - First Burn 49
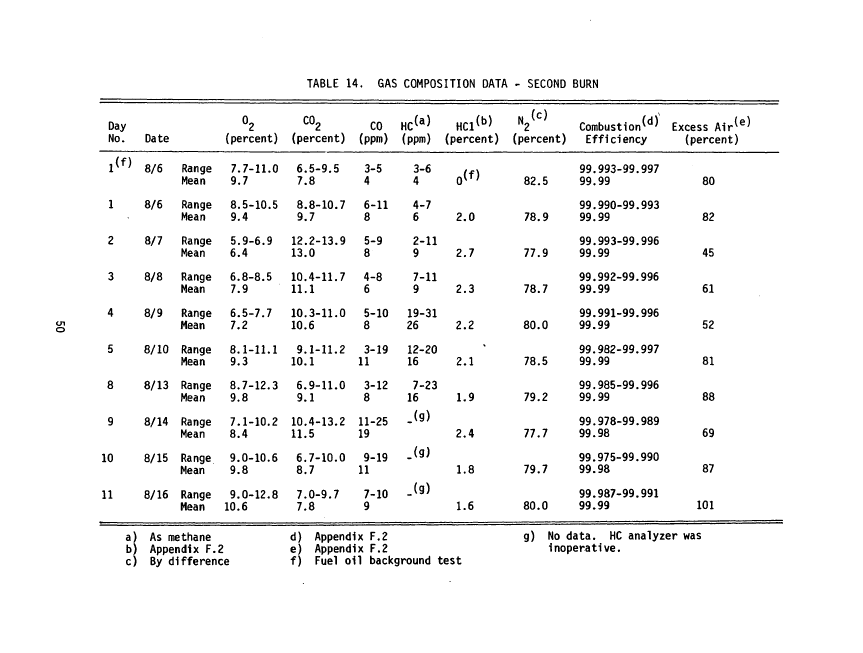
14 Gas Composition Data - Second Burn 50
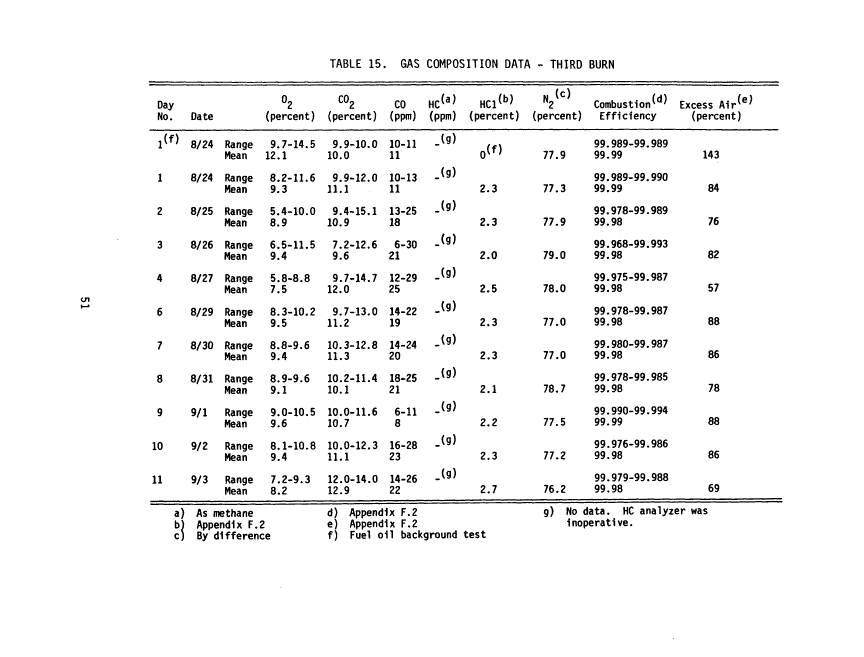
15 Gas Composition Data - Third Burn 51
16 Gas Composition Data Summary - All Herbicide
Orange Burns 53
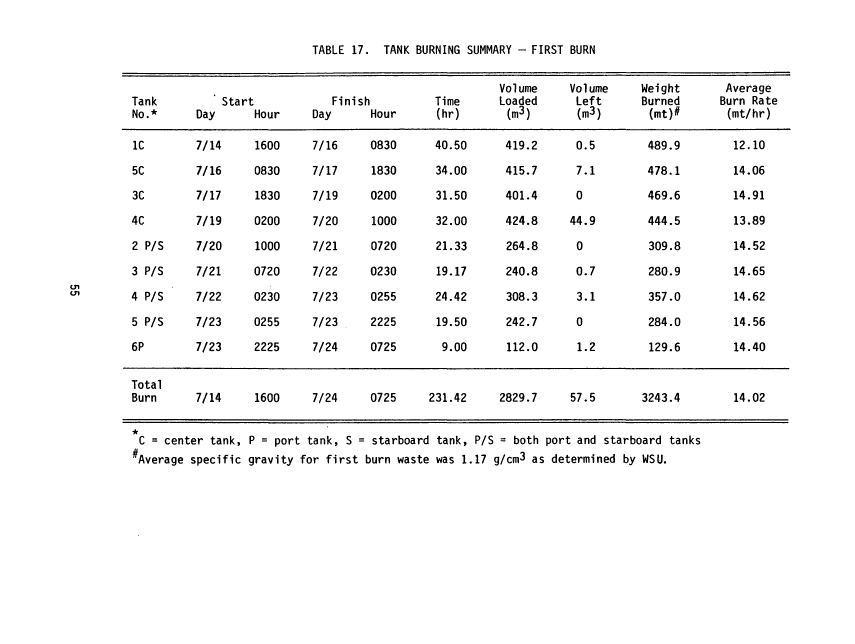
17 Tank Burning Summary - First Burn 55
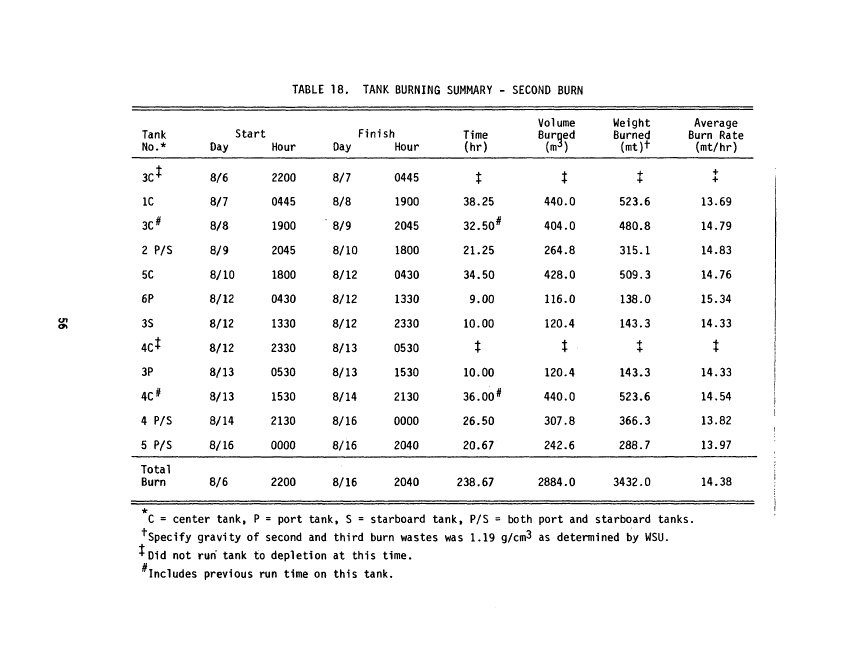
18 Tank Burning Summary - Second Burn 56
viii
image:
TABLES
Number Page
1 Definition of Incineration Efficiency Terms 7
2 Summary of Calculated Incineration Efficiencies 8
3 Specifications of the M/T Vulcanus 11
4 On-Line Monitors 23
5 Summary of Combustion Effluent Samples Acquired 39
6 Train Sample Volumes and Apportionment of Probe and
Line Rinses 41
7 Herbicide Orange Program Sample Labeling Scheme ........ 43
8 General Chemical and Physical Properties of
Herbicide Orange 44
9 General Properties of Ingredient Esters of
Herbicide Orange 45
10 General Data Relative to TCDD 45
11 Average Composition of Several Lots of
Herbicide Orange 46
12 Drums Authorized for Loading for Third Bum 47
13 Gas Composition Data - First Burn 49
14 Gas Composition Data - Second Burn 50
15 Gas Composition Data - Third Burn 51
16 Gas Composition Data Summary - All Herbicide
Orange Burns 53
17 Tank Burning Summary - First Burn 55
18 Tank Burning Summary - Second Burn 56
viii
image:
 TABLES (Continued)
Number Page
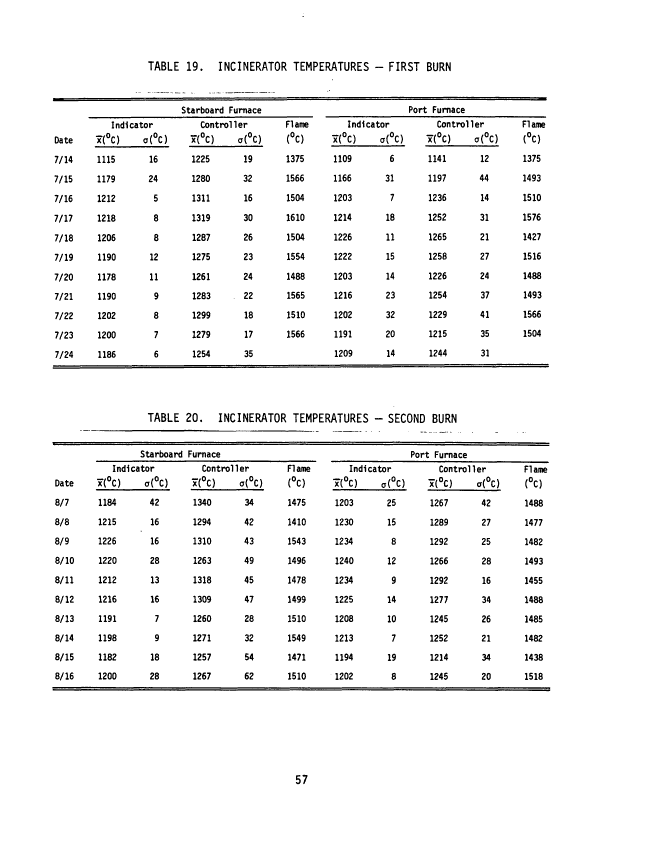
19 Incinerator Temperatures - First Burn 57
20 Incinerator Temperatures - Second Burn 57
21 Incinerator Temperatures - Third Burn 58
22 Results of C7-C16 GC Analyses of Feedstocks 65
23 Results of GCMS Analyses of Feedstocks 66
24 Organic Contents of Lear-Siegler Train Samples
from Thermogravimetric Analyses 67
25 Results of Gravimetric Analyses of Lear-Siegler
Train Samples 68
26 Classes of Nonvolatile Organic Compounds Present
in Lear-Siegler Train Samples 69
27 Emissions of Volatile Organic Compounds from C7-C16
GC Analyses of Lear-Siegler Train Samples 70
28 Gravimetric Results of Liquid Chromatographic
Separations of Lear-Siegler Train Samples 72
29 Compound Classes Present in LC Fractions from
Lear-Siegler Train Samples 73
30 GC/MS Analyses of Lear-Siegler Train Samples 75
31 Results of C1-C6 Analyses of Grab Gas Samples 79
32 Organic Contents of Burner Residue Extracts from
Thermogravimetric Analyses 80
33 Results of Gravimetric Analyses of Burner Residue
Samples 80
34 Results of C7-C16 GC Analyses of Burner
Residue Samples 81
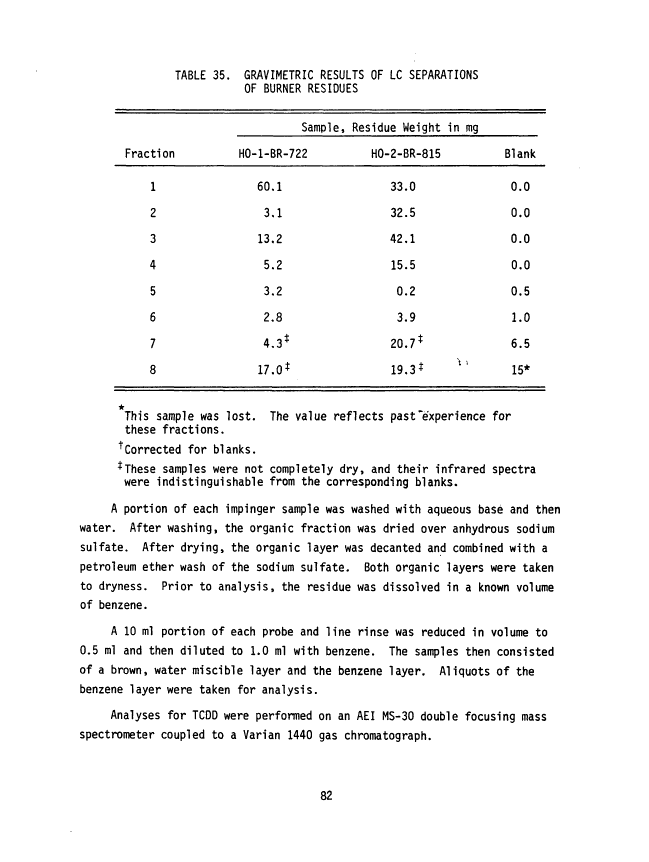
35 Gravimetric Results of LC Separations of
Burner Residues 82
36 Compound Classes Present in LC Fractions from
Burner Residue Samples 83
ix
image:
TABLES (Continued)
Number Page
19 Incinerator Temperatures - First Burn 57
20 Incinerator Temperatures - Second Burn 57
21 Incinerator Temperatures - Third Burn 58
22 Results of C7-C16 GC Analyses of Feedstocks 65
23 Results of GCMS Analyses of Feedstocks 66
24 Organic Contents of Lear-Siegler Train Samples
from Thermogravimetric Analyses 67
25 Results of Gravimetric Analyses of Lear-Siegler
Train Samples 68
26 Classes of Nonvolatile Organic Compounds Present
in Lear-Siegler Train Samples 69
27 Emissions of Volatile Organic Compounds from C7-C16
GC Analyses of Lear-Siegler Train Samples 70
28 Gravimetric Results of Liquid Chromatographic
Separations of Lear-Siegler Train Samples 72
29 Compound Classes Present in LC Fractions from
Lear-Siegler Train Samples 73
30 GC/MS Analyses of Lear-Siegler Train Samples 75
31 Results of C1-C6 Analyses of Grab Gas Samples 79
32 Organic Contents of Burner Residue Extracts from
Thermogravimetric Analyses 80
33 Results of Gravimetric Analyses of Burner Residue
Samples 80
34 Results of C7-C16 GC Analyses of Burner
Residue Samples 81
35 Gravimetric Results of LC Separations of
Burner Residues 82
36 Compound Classes Present in LC Fractions from
Burner Residue Samples 83
ix
image:
 TABLES (Continued)
Number Page
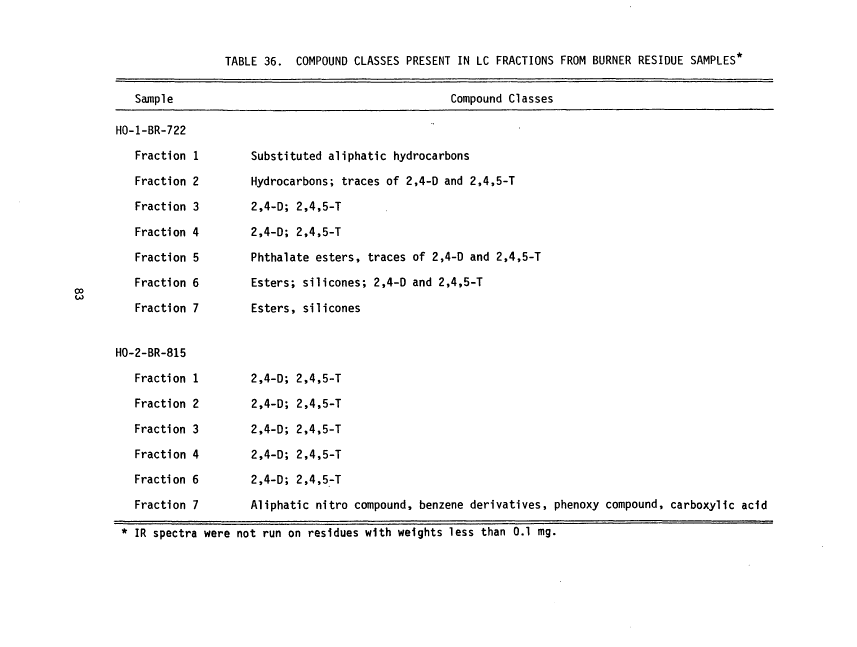
37 Results of GC/MS Analyses of Burner Residue Samples 84
38 Results of WSU Analyses of Stack Samples for TCDD 85
39 Results of BCL Analyses of First Burn Workspace
Air Monitors 87
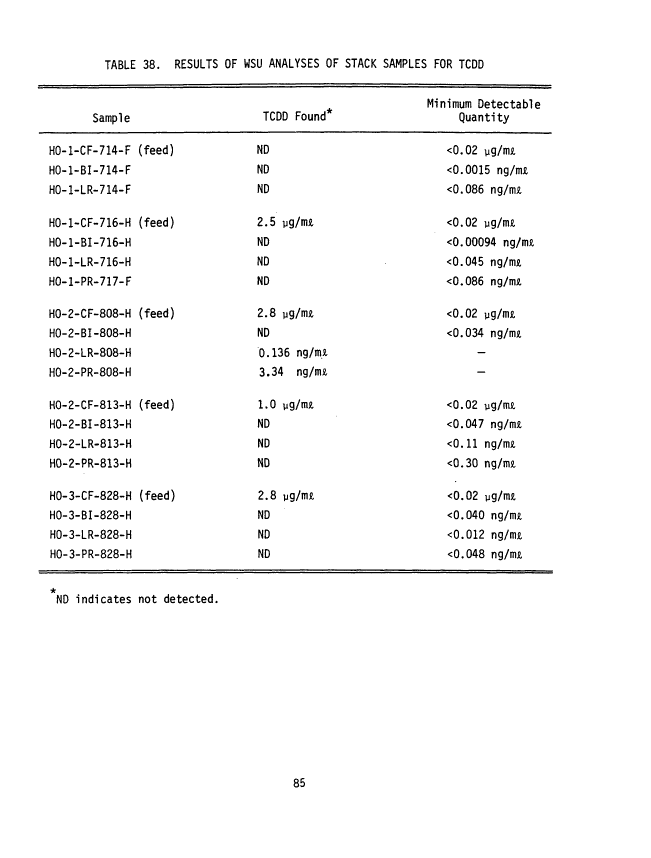
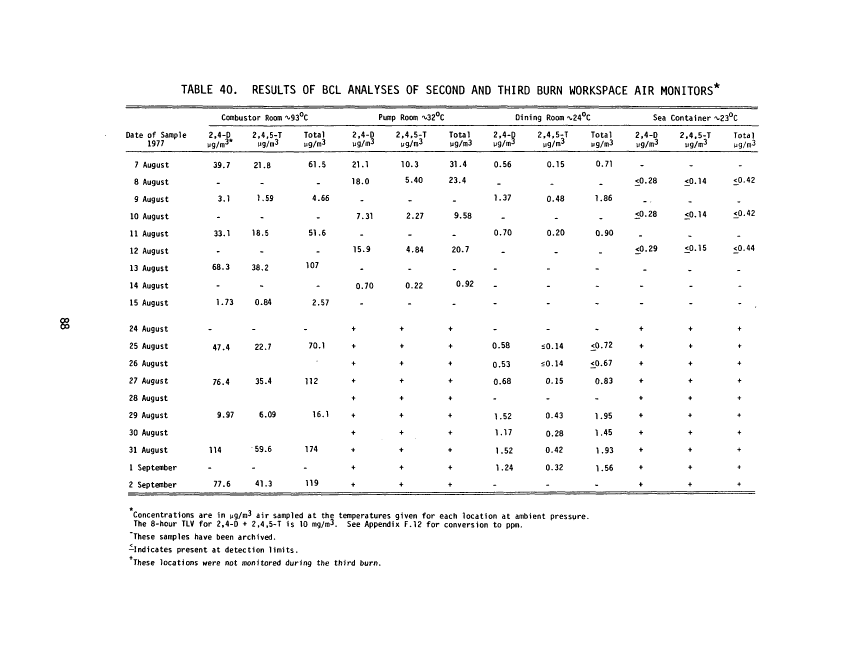
40 Results of BCL Analyses of Second and Third Burn
Workspace Air Monitors 88
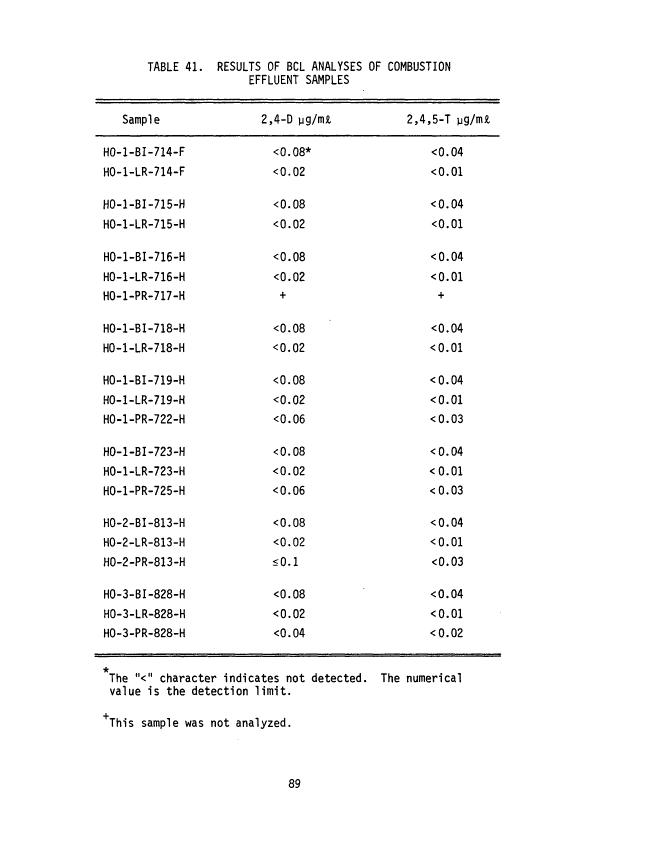
41 Results of BCL Analyses of Combustion Effluent Samples .... 89
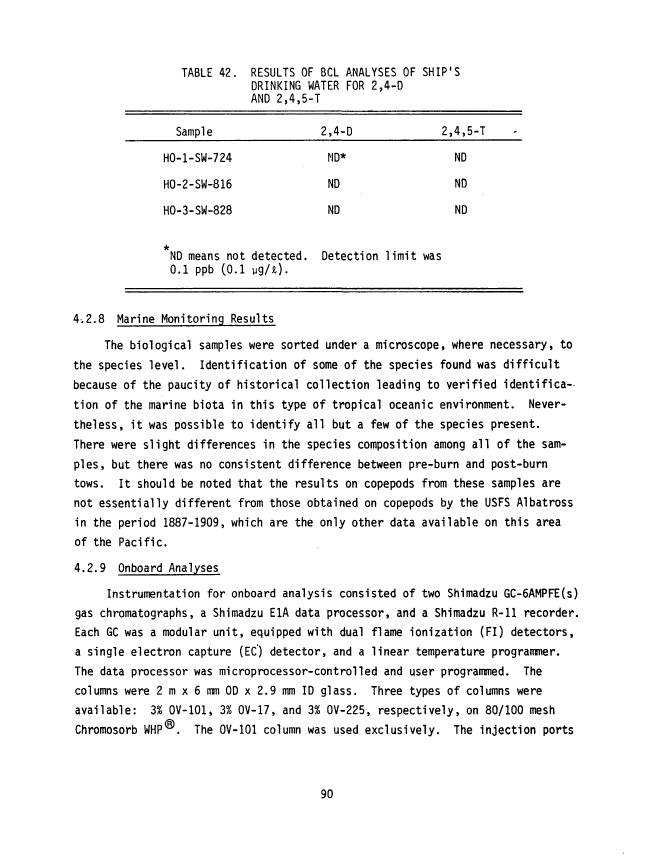
42 Results of BCL Analyses of Ship's Drinking Water
for 2,4-D and 2,4,5-T 90
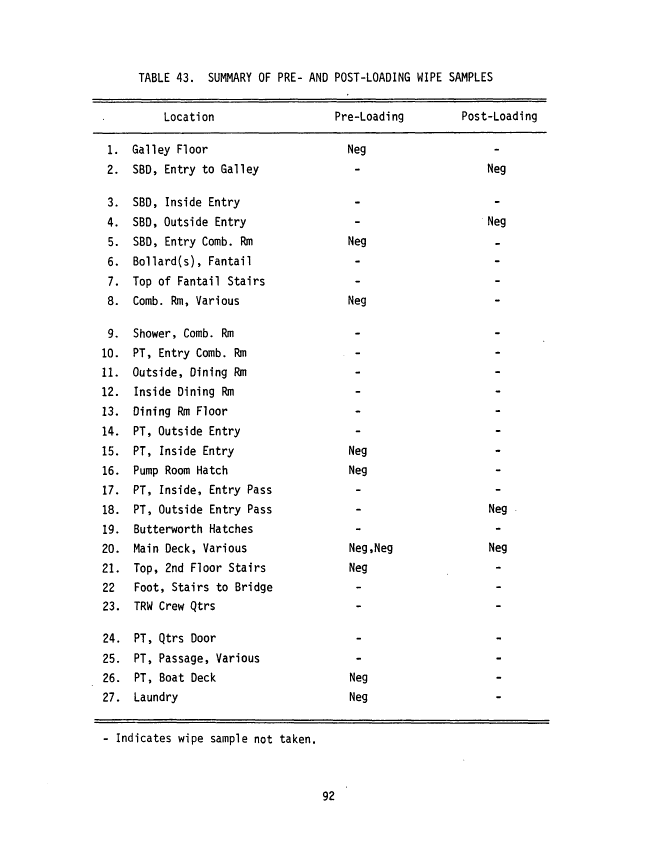
43 Summary of Pre- and Post-Loading Wipe Samples 92
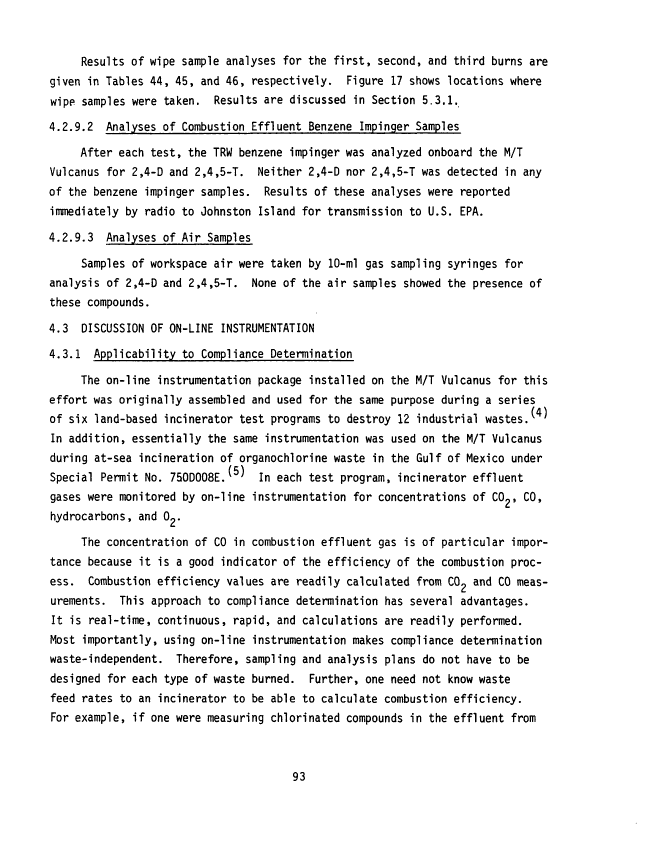
44 Summary of First Burn Wipe Samples 94
45 Summary of Second Burn Wipe Samples 95
46 Summary of Third Burn Wipe Samples 96
47 Comparison of Combustion and Destruction Efficiencies .... 99
48 Hydrogen Chloride (HC1) in Air Onboard M/T Vulcanus 109
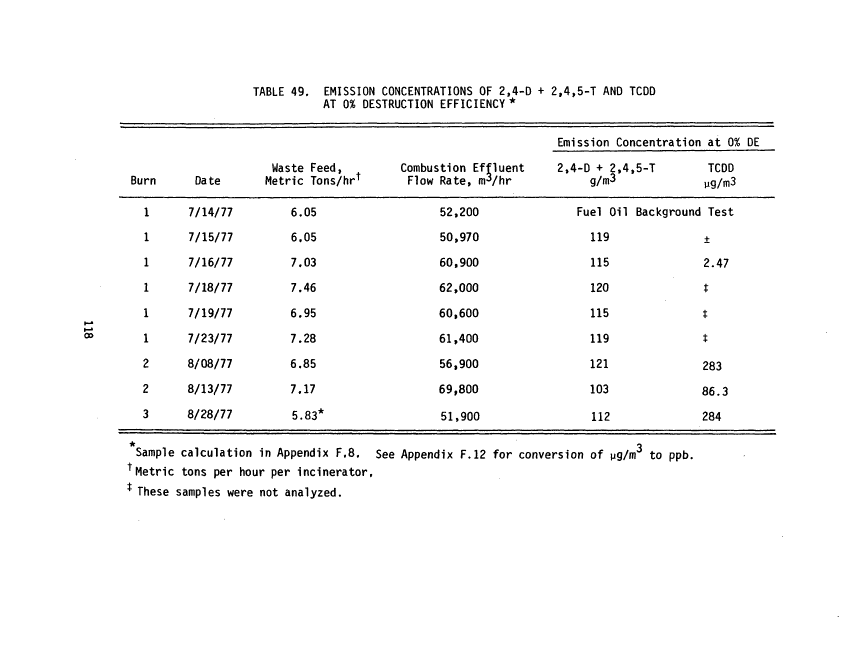
49 Emission Concentrations of 2,4-D + 2,4,5-T and TCDD at
0% Destruction Efficiency 118
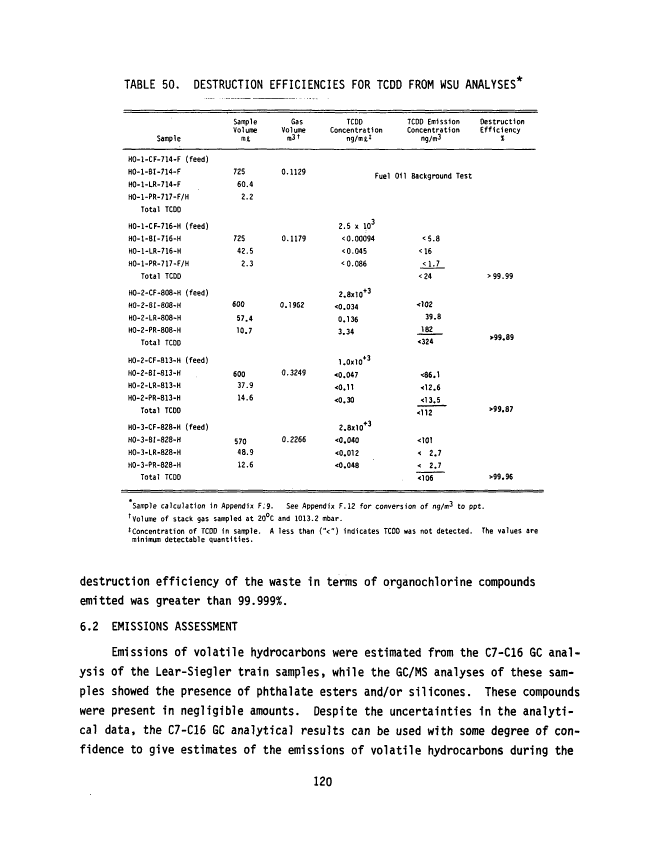
50 Destruction Efficiencies for TCDD from WSU Analyses 120
51 Destruction Efficiencies for 2,4-D and 2,4,5-T from
Lear-Siegler Train Analyses 121
52 Destruction Efficiencies for 2,4-D and 2,4,5-T from
BCL Analyses 122
53 Destruction Efficiencies of Organochlorine Compounds 123
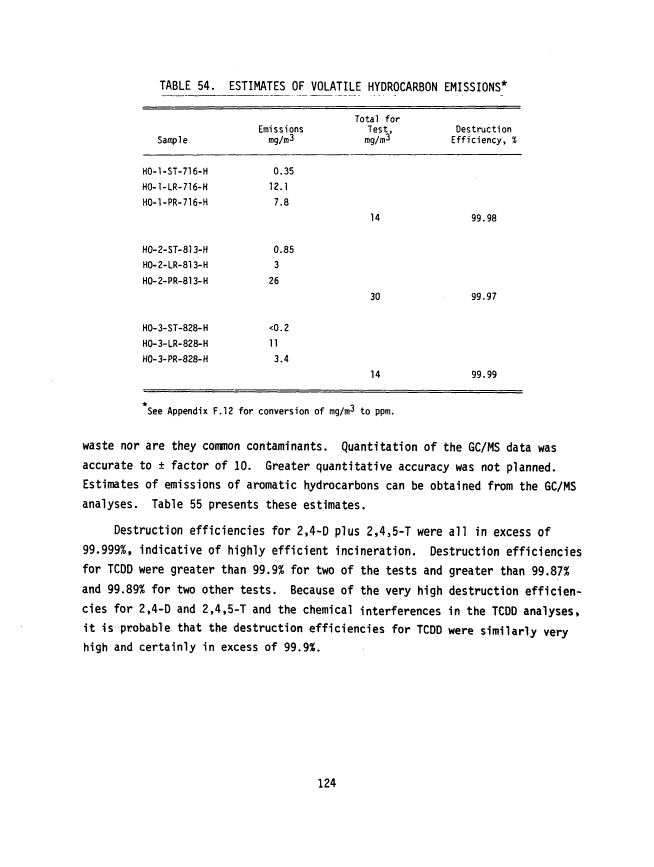
54 Estimates of Volatile Hydrocarbon Emissions 124
55 Estimates of Emissions of Aromatic Hydrocarbons 125
56 Summary of Variables for Error Analysis 127
image:
TABLES (Continued)
Number Page
37 Results of GC/MS Analyses of Burner Residue Samples 84
38 Results of WSU Analyses of Stack Samples for TCDD 85
39 Results of BCL Analyses of First Burn Workspace
Air Monitors 87
40 Results of BCL Analyses of Second and Third Burn
Workspace Air Monitors 88
41 Results of BCL Analyses of Combustion Effluent Samples .... 89
42 Results of BCL Analyses of Ship's Drinking Water
for 2,4-D and 2,4,5-T 90
43 Summary of Pre- and Post-Loading Wipe Samples 92
44 Summary of First Burn Wipe Samples 94
45 Summary of Second Burn Wipe Samples 95
46 Summary of Third Burn Wipe Samples 96
47 Comparison of Combustion and Destruction Efficiencies .... 99
48 Hydrogen Chloride (HC1) in Air Onboard M/T Vulcanus 109
49 Emission Concentrations of 2,4-D + 2,4,5-T and TCDD at
0% Destruction Efficiency 118
50 Destruction Efficiencies for TCDD from WSU Analyses 120
51 Destruction Efficiencies for 2,4-D and 2,4,5-T from
Lear-Siegler Train Analyses 121
52 Destruction Efficiencies for 2,4-D and 2,4,5-T from
BCL Analyses 122
53 Destruction Efficiencies of Organochlorine Compounds 123
54 Estimates of Volatile Hydrocarbon Emissions 124
55 Estimates of Emissions of Aromatic Hydrocarbons 125
56 Summary of Variables for Error Analysis 127
image:
 1. INTRODUCTION, BACKGROUND, AND SUMMARY
1.1 INTRODUCTION
Thermal destruction of combustible wastes at sea is recognized as an alter-
native to land based incineration. In late 1974 and in March of 1977, organo-
chlorine wastes were incinerated in the Gulf of Mexico by the Motor Tanker (M/T)
Vulcanus. These efforts, evaluated by the U.S. Environmental Protection Agency
(U.S. EPA), provided a technical basis for concluding that at-sea incineration
is a viable alternative to other means of disposal.
Incineration of U.S. Air Force stocks of Herbicide Orange was performed
onboard the M/T Vulcanus operating in the Pacific Ocean west of Johnston Atoll.
Approximately 10,400 metric tons were incinerated under permits granted by the
U.S. EPA. The first shipload, loaded at the Naval Construction Battalion Cen-
ter at Gulfport, Mississippi, was incinerated under Research Permit No. 770DH001R.
The second and third shiploads, loaded at Johnston Island (one of the islands
comprising Johnston Atoll), were incinerated under Special Permit No. 770DH001S.
The Herbicide Orange incinerated consisted of an approximate 50-50 mixture
by volume of the n-butyl esters of 2,4-dichlorophenoxyacetic acid (2,4-D) and
2,4,5-trichlorophenoxyacetic acid (2,4,5-Tr . There was a small quantity of
Orange II herbicide which consisted of an approximate 50-50 mixture by volume of
2,4-D and the iso-octyl ester of 2,4,5-trichlorophenoxyacetic acid^ '. Certain
lots of the herbicide contained the contaminant 2,3,7,8-tetrachlorodibenzo-p-
dioxin (TCDD). The TCDD concentration in the entire stock of herbicide averaged
1.9 ppm and ranged from 0 to 47 ppnr . Diesel fuel used to rinse herbicide
drums and equipment associated with dedrumming and loading was mixed with the
herbicide for incineration.
1. From U.S. EPA Special Permit No. 770DH001S.
image:
1. INTRODUCTION, BACKGROUND, AND SUMMARY
1.1 INTRODUCTION
Thermal destruction of combustible wastes at sea is recognized as an alter-
native to land based incineration. In late 1974 and in March of 1977, organo-
chlorine wastes were incinerated in the Gulf of Mexico by the Motor Tanker (M/T)
Vulcanus. These efforts, evaluated by the U.S. Environmental Protection Agency
(U.S. EPA), provided a technical basis for concluding that at-sea incineration
is a viable alternative to other means of disposal.
Incineration of U.S. Air Force stocks of Herbicide Orange was performed
onboard the M/T Vulcanus operating in the Pacific Ocean west of Johnston Atoll.
Approximately 10,400 metric tons were incinerated under permits granted by the
U.S. EPA. The first shipload, loaded at the Naval Construction Battalion Cen-
ter at Gulfport, Mississippi, was incinerated under Research Permit No. 770DH001R.
The second and third shiploads, loaded at Johnston Island (one of the islands
comprising Johnston Atoll), were incinerated under Special Permit No. 770DH001S.
The Herbicide Orange incinerated consisted of an approximate 50-50 mixture
by volume of the n-butyl esters of 2,4-dichlorophenoxyacetic acid (2,4-D) and
2,4,5-trichlorophenoxyacetic acid (2,4,5-Tr . There was a small quantity of
Orange II herbicide which consisted of an approximate 50-50 mixture by volume of
2,4-D and the iso-octyl ester of 2,4,5-trichlorophenoxyacetic acid^ '. Certain
lots of the herbicide contained the contaminant 2,3,7,8-tetrachlorodibenzo-p-
dioxin (TCDD). The TCDD concentration in the entire stock of herbicide averaged
1.9 ppm and ranged from 0 to 47 ppnr . Diesel fuel used to rinse herbicide
drums and equipment associated with dedrumming and loading was mixed with the
herbicide for incineration.
1. From U.S. EPA Special Permit No. 770DH001S.
image:
 1.2 BACKGROUND
The at-sea incineration of U.S. Air Force stocks of Herbicide Orange was a
complex undertaking. A large number of U.S. Government organizations and civil-
ian contractors contributed to the effort, and a brief discussion of the program
organization will be helpful in understanding the scope of this report.
Permits to incinerate the waste were granted to the U.S. Air Force, owner
of the waste, and to Ocean Combustion Services, B.V., of The Netherlands, owner
of the M/T Vulcanus, as co-permittees.
The U.S. EPA contracted with TRW, Inc., to perform environmental monitoring
during the incineration of the herbicide. This program was funded by the U.S.
Air Force. The scope of TRW's activities under this contract included design
and preparation of stack sampling and monitoring equipment, development of a
comprehensive personnel protection plan, development and implementation of a
sampling and analysis protocol, acquisition of samples and monitoring of combus-
tion effluent during incinerator operation, analysis of the samples and moni-
toring data, and evaluation of the results.
TRW's role in the incineration program was thus limited to at-sea opera-
tions. It was TRW's responsibility to monitor the following permit conditions
(renumbered but verbatim from Reference 1):
1. The Permittees are authorized to heat up incinerators with fuel
oil while in route to the site but may not incinerate the des-
cribed wastes except in the site which is defined in longitude
and latitude as follows: From 15 degrees 45 minutes to 17 degrees
45 minutes north latitude. From 171 degrees 30 minutes to
173 degrees 30 minutes west longitude.
2. During start-up, Herbicide Orange shall not be fed into the
incinerators until a flame temperature of 1280°C has been
reached in the furnace and only one burner at a time shall
be changed over to the waste. The start-up temperature of
1280°C must be reached before the next burner is changed
over to Herbicide Orange.
3. Monitoring of the furnaces for temperature, and for complete-
ness of combustion, shall be in effect during the change-over.
A record of temperature shall also be maintained during this
time.
4. The incinerator flame temperature shall be greater than
1250°C when burning waste.
image:
1.2 BACKGROUND
The at-sea incineration of U.S. Air Force stocks of Herbicide Orange was a
complex undertaking. A large number of U.S. Government organizations and civil-
ian contractors contributed to the effort, and a brief discussion of the program
organization will be helpful in understanding the scope of this report.
Permits to incinerate the waste were granted to the U.S. Air Force, owner
of the waste, and to Ocean Combustion Services, B.V., of The Netherlands, owner
of the M/T Vulcanus, as co-permittees.
The U.S. EPA contracted with TRW, Inc., to perform environmental monitoring
during the incineration of the herbicide. This program was funded by the U.S.
Air Force. The scope of TRW's activities under this contract included design
and preparation of stack sampling and monitoring equipment, development of a
comprehensive personnel protection plan, development and implementation of a
sampling and analysis protocol, acquisition of samples and monitoring of combus-
tion effluent during incinerator operation, analysis of the samples and moni-
toring data, and evaluation of the results.
TRW's role in the incineration program was thus limited to at-sea opera-
tions. It was TRW's responsibility to monitor the following permit conditions
(renumbered but verbatim from Reference 1):
1. The Permittees are authorized to heat up incinerators with fuel
oil while in route to the site but may not incinerate the des-
cribed wastes except in the site which is defined in longitude
and latitude as follows: From 15 degrees 45 minutes to 17 degrees
45 minutes north latitude. From 171 degrees 30 minutes to
173 degrees 30 minutes west longitude.
2. During start-up, Herbicide Orange shall not be fed into the
incinerators until a flame temperature of 1280°C has been
reached in the furnace and only one burner at a time shall
be changed over to the waste. The start-up temperature of
1280°C must be reached before the next burner is changed
over to Herbicide Orange.
3. Monitoring of the furnaces for temperature, and for complete-
ness of combustion, shall be in effect during the change-over.
A record of temperature shall also be maintained during this
time.
4. The incinerator flame temperature shall be greater than
1250°C when burning waste.
image:
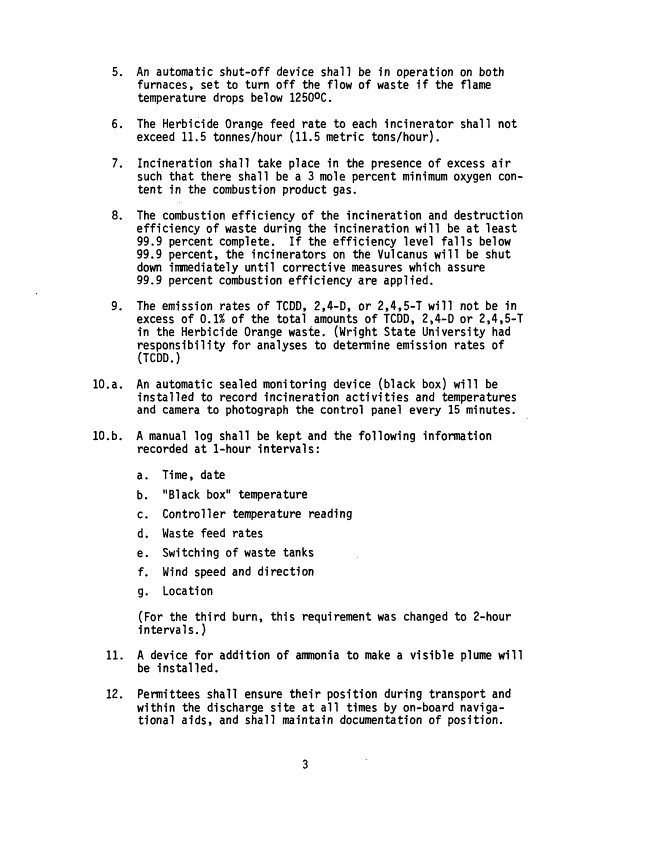
 5. An automatic shut-off device shall be in operation on both
furnaces, set to turn off the flow of waste if the flame
temperature drops below 1250°C.
6. The Herbicide Orange feed rate to each incinerator shall not
exceed 11.5 tonnes/hour (11.5 metric tons/hour).
7. Incineration shall take place in the presence of excess air
such that there shall be a 3 mole percent minimum oxygen con-
tent in the combustion product gas.
8. The combustion efficiency of the incineration and destruction
efficiency of waste during the incineration will be at least
99.9 percent complete. If the efficiency level falls below
99.9 percent, the incinerators on the Vulcanus will be shut
down immediately until corrective measures which assure
99.9 percent combustion efficiency are applied.
9. The emission rates of TCDD, 2,4-D, or 2,4,5-T will not be in
excess of 0.1% of the total amounts of TCDD, 2,4-D or 2,4,5-T
in the Herbicide Orange waste. (Wright State University had
responsibility for analyses to determine emission rates of
(TCDD.)
10.a. An automatic sealed monitoring device (black box) will be
installed to record incineration activities and temperatures
and camera to photograph the control panel every 15 minutes.
10.b. A manual log shall be kept and the following information
recorded at 1-hour intervals:
a. Time, date
b. "Black box" temperature
c. Controller temperature reading
d. Waste feed rates
e. Switching of waste tanks
f. Wind speed and direction
g. Location
(For the third burn, this requirement was changed to 2-hour
intervals.)
11. A device for addition of ammonia to make a visible plume will
be installed.
12. Permittees shall ensure their position during transport and
within the discharge site at all times by on-board naviga-
tional aids, and shall maintain documentation of position.
image:
5. An automatic shut-off device shall be in operation on both
furnaces, set to turn off the flow of waste if the flame
temperature drops below 1250°C.
6. The Herbicide Orange feed rate to each incinerator shall not
exceed 11.5 tonnes/hour (11.5 metric tons/hour).
7. Incineration shall take place in the presence of excess air
such that there shall be a 3 mole percent minimum oxygen con-
tent in the combustion product gas.
8. The combustion efficiency of the incineration and destruction
efficiency of waste during the incineration will be at least
99.9 percent complete. If the efficiency level falls below
99.9 percent, the incinerators on the Vulcanus will be shut
down immediately until corrective measures which assure
99.9 percent combustion efficiency are applied.
9. The emission rates of TCDD, 2,4-D, or 2,4,5-T will not be in
excess of 0.1% of the total amounts of TCDD, 2,4-D or 2,4,5-T
in the Herbicide Orange waste. (Wright State University had
responsibility for analyses to determine emission rates of
(TCDD.)
10.a. An automatic sealed monitoring device (black box) will be
installed to record incineration activities and temperatures
and camera to photograph the control panel every 15 minutes.
10.b. A manual log shall be kept and the following information
recorded at 1-hour intervals:
a. Time, date
b. "Black box" temperature
c. Controller temperature reading
d. Waste feed rates
e. Switching of waste tanks
f. Wind speed and direction
g. Location
(For the third burn, this requirement was changed to 2-hour
intervals.)
11. A device for addition of ammonia to make a visible plume will
be installed.
12. Permittees shall ensure their position during transport and
within the discharge site at all times by on-board naviga-
tional aids, and shall maintain documentation of position.
image:
 13. Permittees shall have installed and in operating condition a
radio or other communications devices which are capable of
voice transmission to the mainland from the Vulcanus when in
route to the incineration site and during the incineration of
the waste in the designated site. The frequency of reporting
and information to be transmitted is set forth in the Herbicide
Orange Contingency Plan contained in Appendix 9 of the hearing
record of April 7, 1977.
14. During the burns the Permittees shall transmit the following
information to EPA Headquarters every 24 hours:
a. Operating temperatures
b. Average combustion efficiency
c. Significant malfunctions/incidents
15. The Permittees shall monitor for carbon monoxide, carbon diox-
ide, oxygen, 2,4-D, 2,4,5-T, TCDD and other parameters in
accordance with the monitoring plan contained in Appendix B
(of the permit).
16. The Permittees shall comply with all provisions of the com-
prehensive safety plan set forth in Appendix C (of the permit).
During incineration of the first shipload, a U.S. EPA Representative was
onboard to determine compliance with permit conditions. During incineration
of the second and third shiploads, the leader of the TRW sampling team was
designated U.S. EPA Advisor relative to permit compliance.
The U.S. Air Force issued a contract (No. F41608-77-C-0169) to the Brehm
Laboratory of Wright State University (WSU) to perform analyses for the toxic
contaminant (2,3,7,8-tetrachlorodibenzo-p-dioxin, TCDD) in the combustion efflu-
ent samples taken onboard the ship during incineration. The analyses by Wright
State were intended to determine compliance with the permit requirement that
emissions of TCDD not exceed 0.1% of the total TCDD in the waste. In other
words, the destruction efficiency of TCDD was required to be not less than
99.9%.
The U.S. Air Force issued a contract (No. F08635-76-D-0168) to Battelle-
Columbus Laboratories (BCL) to perform land based environmental monitoring
(air, land, and water) during the dedrumming and loading operations at Johnston
Atoll. BCL also analyzed combustion effluent, potable water, and workspace
air monitor samples from the ship for 2,4-D and 2,4,5-T.
image:
13. Permittees shall have installed and in operating condition a
radio or other communications devices which are capable of
voice transmission to the mainland from the Vulcanus when in
route to the incineration site and during the incineration of
the waste in the designated site. The frequency of reporting
and information to be transmitted is set forth in the Herbicide
Orange Contingency Plan contained in Appendix 9 of the hearing
record of April 7, 1977.
14. During the burns the Permittees shall transmit the following
information to EPA Headquarters every 24 hours:
a. Operating temperatures
b. Average combustion efficiency
c. Significant malfunctions/incidents
15. The Permittees shall monitor for carbon monoxide, carbon diox-
ide, oxygen, 2,4-D, 2,4,5-T, TCDD and other parameters in
accordance with the monitoring plan contained in Appendix B
(of the permit).
16. The Permittees shall comply with all provisions of the com-
prehensive safety plan set forth in Appendix C (of the permit).
During incineration of the first shipload, a U.S. EPA Representative was
onboard to determine compliance with permit conditions. During incineration
of the second and third shiploads, the leader of the TRW sampling team was
designated U.S. EPA Advisor relative to permit compliance.
The U.S. Air Force issued a contract (No. F41608-77-C-0169) to the Brehm
Laboratory of Wright State University (WSU) to perform analyses for the toxic
contaminant (2,3,7,8-tetrachlorodibenzo-p-dioxin, TCDD) in the combustion efflu-
ent samples taken onboard the ship during incineration. The analyses by Wright
State were intended to determine compliance with the permit requirement that
emissions of TCDD not exceed 0.1% of the total TCDD in the waste. In other
words, the destruction efficiency of TCDD was required to be not less than
99.9%.
The U.S. Air Force issued a contract (No. F08635-76-D-0168) to Battelle-
Columbus Laboratories (BCL) to perform land based environmental monitoring
(air, land, and water) during the dedrumming and loading operations at Johnston
Atoll. BCL also analyzed combustion effluent, potable water, and workspace
air monitor samples from the ship for 2,4-D and 2,4,5-T.
image:
 U.S. Air Force Occupational and Environmental Health Laboratories (OEHL)
at Kelly and Brooks Air Force Bases, Texas, analyzed miscellaneous samples from
both land based and at-sea operations. BCL and WSU analyzed a variety of sam-
ples intended to determine the effect of U.S. EPA approved ship cleaning proce-
dures after waste incineration had been completed. The TRW sampling team
leader had been designated by the U.S. EPA to monitor that portion of the ship
cleaning performed while the TRW team was still onboard the ship.
The final responsibility of TRW to the U.S. EPA was to prepare a final
report assembling and evaluating all data relating to incineration operations
so as to determine compliance with those permit conditions concerning at-sea
operations.
1.3 SUMMARY
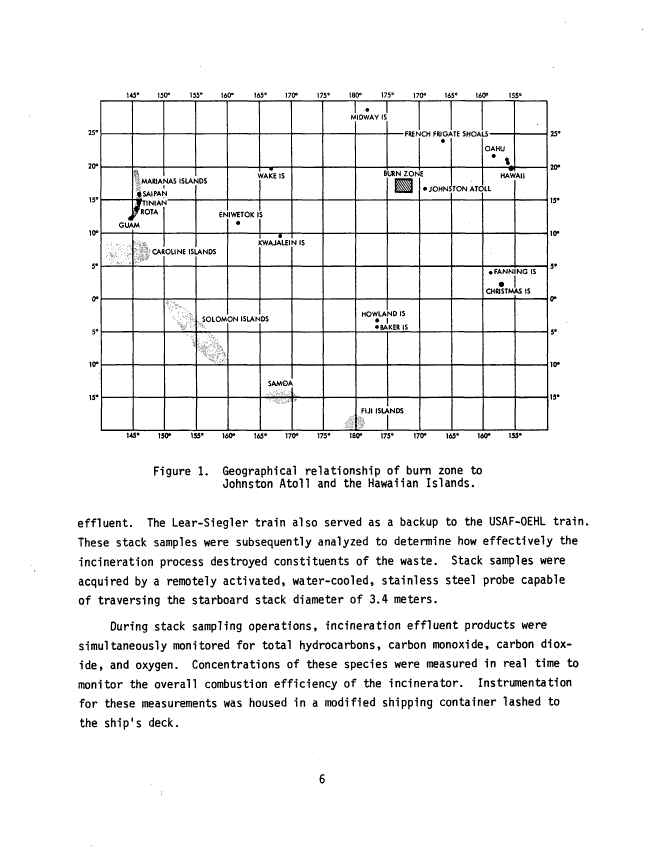
Incineration of the herbicide took place in a U.S. EPA-designated burn
zone approximately 120 miles west of Johnston Atoll, as defined by the follow-
ing coordinates: 15°45' to 17°45' N latitude and 171°30' to 173°30' W longi-
tude. The relationship of the burn zone to Johnston Atoll and the Hawaiian
Islands is shown in Figure 1.
o
A total of 10,400 metric tons (8780 m , 2.31 million gallons) of waste was
burned, requiring 714 hours. The average incineration rate was 14.5 metric
tons per hour or 7.3 metric tons per hour per incinerator. For all three burns,
the average flame temperature was 1500°C as determined by daily optical pyrom-
eter measurements. The average incinerator wall temperature (controller
thermocouple) was 1273°C for all three burns. For the three burns, the average
combustion effluent flow rate per incinerator was calculated to be 70,700 cubic
meters per hour (dry gas at 20°C). Given these average conditions of combustion
air and waste feed rates and temperature, the average calculated incinerator
residence time was 1.0 second. The incinerator residence time was the time
available for a waste molecule to be converted to combustion products.
Stack sampling operations utilized a USAF-OEHL benzene impinger train and
a modified U.S. EPA Method 5 train (Lear-Siegler) which incorporated an organic
vapor sorbent trap. The USAF-OEHL train was the primary train for acquiring
samples for TCDD analysis, whereas the Lear-Siegler train was used to acquire
samples to be analyzed for organic species potentially present in the combustion
image:
U.S. Air Force Occupational and Environmental Health Laboratories (OEHL)
at Kelly and Brooks Air Force Bases, Texas, analyzed miscellaneous samples from
both land based and at-sea operations. BCL and WSU analyzed a variety of sam-
ples intended to determine the effect of U.S. EPA approved ship cleaning proce-
dures after waste incineration had been completed. The TRW sampling team
leader had been designated by the U.S. EPA to monitor that portion of the ship
cleaning performed while the TRW team was still onboard the ship.
The final responsibility of TRW to the U.S. EPA was to prepare a final
report assembling and evaluating all data relating to incineration operations
so as to determine compliance with those permit conditions concerning at-sea
operations.
1.3 SUMMARY
Incineration of the herbicide took place in a U.S. EPA-designated burn
zone approximately 120 miles west of Johnston Atoll, as defined by the follow-
ing coordinates: 15°45' to 17°45' N latitude and 171°30' to 173°30' W longi-
tude. The relationship of the burn zone to Johnston Atoll and the Hawaiian
Islands is shown in Figure 1.
o
A total of 10,400 metric tons (8780 m , 2.31 million gallons) of waste was
burned, requiring 714 hours. The average incineration rate was 14.5 metric
tons per hour or 7.3 metric tons per hour per incinerator. For all three burns,
the average flame temperature was 1500°C as determined by daily optical pyrom-
eter measurements. The average incinerator wall temperature (controller
thermocouple) was 1273°C for all three burns. For the three burns, the average
combustion effluent flow rate per incinerator was calculated to be 70,700 cubic
meters per hour (dry gas at 20°C). Given these average conditions of combustion
air and waste feed rates and temperature, the average calculated incinerator
residence time was 1.0 second. The incinerator residence time was the time
available for a waste molecule to be converted to combustion products.
Stack sampling operations utilized a USAF-OEHL benzene impinger train and
a modified U.S. EPA Method 5 train (Lear-Siegler) which incorporated an organic
vapor sorbent trap. The USAF-OEHL train was the primary train for acquiring
samples for TCDD analysis, whereas the Lear-Siegler train was used to acquire
samples to be analyzed for organic species potentially present in the combustion
image:
 145°
150"
155°
160°
165°
170°
175"
180° 175° 170° 165° 160° 155°
25"
20°
15s
10°
0«
10°
15*
t
GUA
*',
'MARIA
fSAIPAr
iFTINIAf
fROTA
M
CAI
«IAS ISLAf
-1
g
OLINE IS
- -
-
IDS
Eh
AMDS
SOLOM
, -,
<
IWETOK 1
•
DN ISLAN
/AKE IS
.
•
(WAJALEI
DS
SAMO/
4 IS
N
•
IDWAY IS
B
HOWLA
•
•BA
FIJI ISL
JRNZOI>
MDIS
KERIS
,NDS
CH FRIG>
•
• JOHN!
TE SHOA
TON ATC
OAHU
' I
HAV
LL
• FANN
•
CHRISTM,
Ml
NG IS
kSIS
25°
20°
15°
10-
10-
IS-
MS' ISO* 15S" 160° 165° 170° 175° 180° 175° 170° 16S° 160° 153*
Figure 1. Geographical relationship of burn zone to
Johnston Atoll and the Hawaiian Islands.
effluent. The Lear-Siegler train also served as a backup to the USAF-OEHL train.
These stack samples were subsequently analyzed to determine how effectively the
incineration process destroyed constituents of the waste. Stack samples were
acquired by a remotely activated, water-cooled, stainless steel probe capable
of traversing the starboard stack diameter of 3.4 meters.
During stack sampling operations, incineration effluent products were
simultaneously monitored for total hydrocarbons, carbon monoxide, carbon diox-
ide, and oxygen. Concentrations of these species were measured in real time to
monitor the overall combustion efficiency of the incinerator. Instrumentation
for these measurements was housed in a modified shipping container lashed to
the ship's deck.
image:
145°
150"
155°
160°
165°
170°
175"
180° 175° 170° 165° 160° 155°
25"
20°
15s
10°
0«
10°
15*
t
GUA
*',
'MARIA
fSAIPAr
iFTINIAf
fROTA
M
CAI
«IAS ISLAf
-1
g
OLINE IS
- -
-
IDS
Eh
AMDS
SOLOM
, -,
<
IWETOK 1
•
DN ISLAN
/AKE IS
.
•
(WAJALEI
DS
SAMO/
4 IS
N
•
IDWAY IS
B
HOWLA
•
•BA
FIJI ISL
JRNZOI>
MDIS
KERIS
,NDS
CH FRIG>
•
• JOHN!
TE SHOA
TON ATC
OAHU
' I
HAV
LL
• FANN
•
CHRISTM,
Ml
NG IS
kSIS
25°
20°
15°
10-
10-
IS-
MS' ISO* 15S" 160° 165° 170° 175° 180° 175° 170° 16S° 160° 153*
Figure 1. Geographical relationship of burn zone to
Johnston Atoll and the Hawaiian Islands.
effluent. The Lear-Siegler train also served as a backup to the USAF-OEHL train.
These stack samples were subsequently analyzed to determine how effectively the
incineration process destroyed constituents of the waste. Stack samples were
acquired by a remotely activated, water-cooled, stainless steel probe capable
of traversing the starboard stack diameter of 3.4 meters.
During stack sampling operations, incineration effluent products were
simultaneously monitored for total hydrocarbons, carbon monoxide, carbon diox-
ide, and oxygen. Concentrations of these species were measured in real time to
monitor the overall combustion efficiency of the incinerator. Instrumentation
for these measurements was housed in a modified shipping container lashed to
the ship's deck.
image:
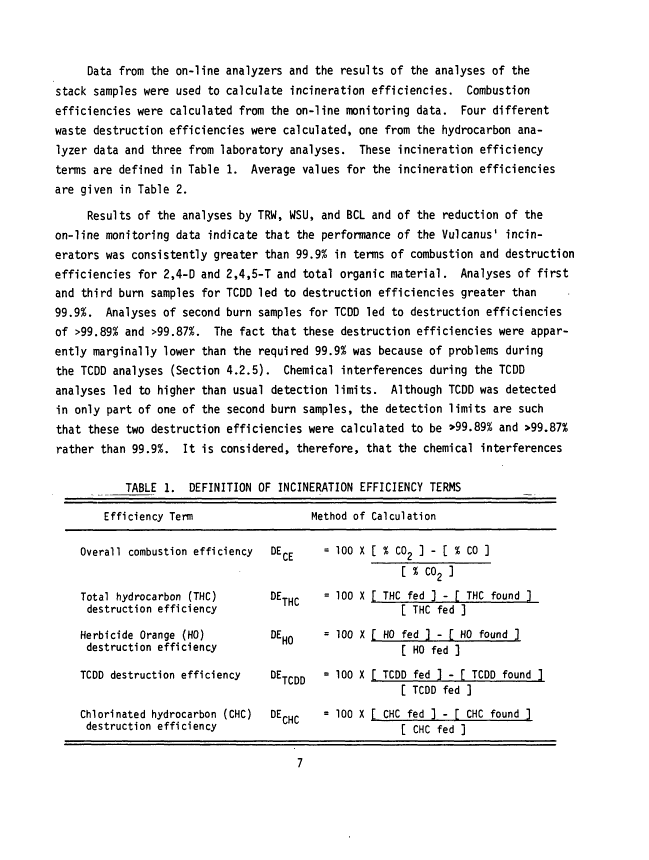
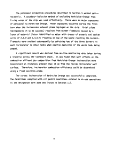
 Data from the on-line analyzers and the results of the analyses of the
stack samples were used to calculate incineration efficiencies. Combustion
efficiencies were calculated from the on-line monitoring data. Four different
waste destruction efficiencies were calculated, one from the hydrocarbon ana-
lyzer data and three from laboratory analyses. These incineration efficiency
terms are defined in Table 1. Average values for the incineration efficiencies
are given in Table 2.
Results of the analyses by TRW, WSU, and BCL and of the reduction of the
on-line monitoring data indicate that the performance of the Vulcanus1 incin-
erators was consistently greater than 99.9% in terms of combustion and destruction
efficiencies for 2,4-D and 2,4,5-T and total organic material. Analyses of first
and third burn samples for TCDD led to destruction efficiencies greater than
99.9%. Analyses of second burn samples for TCDD led to destruction efficiencies
of >99.89% and >99.87%. The fact that these destruction efficiencies were appar-
ently marginally lower than the required 99.9% was because of problems during
the TCDD analyses (Section 4.2.5). Chemical interferences during the TCDD
analyses led to higher than usual detection limits. Although TCDD was detected
in only part of one of the second burn samples, the detection limits are such
that these two destruction efficiencies were calculated to be >99.89% and >99.87%
rather than 99.9%. It is considered, therefore, that the chemical interferences
TABLE 1. DEFINITION OF INCINERATION EFFICIENCY TERMS
Efficiency Term
Method of Calculation
Overall combustion efficiency DECE = 100 X [ % C02 ] - [ % CO ]
Total hydrocarbon (THC) DE
destruction efficiency
Herbicide Orange (HO) DE
destruction efficiency
TCDD destruction efficiency DE
Chlorinated hydrocarbon (CHC)
destruction efficiency
THC
HO
TCDD
C0
100 X [ THC fed ] - [ THC found ]
[ THC fed ]
= 100 X [ HO fed ] - [ HO found ]
[ HO fed ]
" 100 X [ TCDD fed ] - [ TCDD found ]
[ TCDD fed ]
= 100 X [ CHC fed ] - [ CHC found ]
[ CHC fed ]
image:
Data from the on-line analyzers and the results of the analyses of the
stack samples were used to calculate incineration efficiencies. Combustion
efficiencies were calculated from the on-line monitoring data. Four different
waste destruction efficiencies were calculated, one from the hydrocarbon ana-
lyzer data and three from laboratory analyses. These incineration efficiency
terms are defined in Table 1. Average values for the incineration efficiencies
are given in Table 2.
Results of the analyses by TRW, WSU, and BCL and of the reduction of the
on-line monitoring data indicate that the performance of the Vulcanus1 incin-
erators was consistently greater than 99.9% in terms of combustion and destruction
efficiencies for 2,4-D and 2,4,5-T and total organic material. Analyses of first
and third burn samples for TCDD led to destruction efficiencies greater than
99.9%. Analyses of second burn samples for TCDD led to destruction efficiencies
of >99.89% and >99.87%. The fact that these destruction efficiencies were appar-
ently marginally lower than the required 99.9% was because of problems during
the TCDD analyses (Section 4.2.5). Chemical interferences during the TCDD
analyses led to higher than usual detection limits. Although TCDD was detected
in only part of one of the second burn samples, the detection limits are such
that these two destruction efficiencies were calculated to be >99.89% and >99.87%
rather than 99.9%. It is considered, therefore, that the chemical interferences
TABLE 1. DEFINITION OF INCINERATION EFFICIENCY TERMS
Efficiency Term
Method of Calculation
Overall combustion efficiency DECE = 100 X [ % C02 ] - [ % CO ]
Total hydrocarbon (THC) DE
destruction efficiency
Herbicide Orange (HO) DE
destruction efficiency
TCDD destruction efficiency DE
Chlorinated hydrocarbon (CHC)
destruction efficiency
THC
HO
TCDD
C0
100 X [ THC fed ] - [ THC found ]
[ THC fed ]
= 100 X [ HO fed ] - [ HO found ]
[ HO fed ]
" 100 X [ TCDD fed ] - [ TCDD found ]
[ TCDD fed ]
= 100 X [ CHC fed ] - [ CHC found ]
[ CHC fed ]
image:
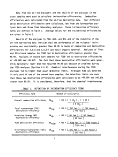 TABLE 2. SUMMARY OF CALCULATED INCINERATION EFFICIENCIES
DECE
DETHC
DEHO
DETCDD
DECHC
First
Burn
99.992
99.982
> 99. 999
>99.99
>99.999
Second
Burn
99.989
99.992
> 99. 999
>99.88
>99.999
Third
Burn
99.983
.(a)
> 99. 999
>99.96
> 99. 999
Combined
3 Burns
99.990
99.985
> 99. 999
>99.93
> 99. 999
Analyzer was inoperative during third burn
and not inadequate incinerator performance caused the marginal destruction
efficiencies. The extremely high destruction efficiencies for 2,4-D and 2,4,5-T
during the second burn (Section 6) support this contention.
Mostly glass components were incorporated in the sampling trains which
stood up well to the corrosive (HC1) combustion effluent. The on-line ana-
lyzer system functioned adequately and maintained adequate sensitivity for
measuring combustion gases. Some damage to the CO and hydrocarbon analyzers
occurred from the corrosive gases passing through them, necessitating more fre-
quent maintenance and calibration. The damage was caused by an engineering
oversight which left a cold spot in the system. Condensation thus occurred,
and it was the condensate that damaged the instruments. No effects from the
unusual shock vibration or saltwater environment were noted.
Incinerator controls and instrumentation were adequate. Redundant incin-
erator wall thermocouples would be desirable from an operational standpoint
because loss of wall thermocouples would shut off incineration and because they
cannot be replaced while the incinerators are hot.
8
image:
TABLE 2. SUMMARY OF CALCULATED INCINERATION EFFICIENCIES
DECE
DETHC
DEHO
DETCDD
DECHC
First
Burn
99.992
99.982
> 99. 999
>99.99
>99.999
Second
Burn
99.989
99.992
> 99. 999
>99.88
>99.999
Third
Burn
99.983
.(a)
> 99. 999
>99.96
> 99. 999
Combined
3 Burns
99.990
99.985
> 99. 999
>99.93
> 99. 999
Analyzer was inoperative during third burn
and not inadequate incinerator performance caused the marginal destruction
efficiencies. The extremely high destruction efficiencies for 2,4-D and 2,4,5-T
during the second burn (Section 6) support this contention.
Mostly glass components were incorporated in the sampling trains which
stood up well to the corrosive (HC1) combustion effluent. The on-line ana-
lyzer system functioned adequately and maintained adequate sensitivity for
measuring combustion gases. Some damage to the CO and hydrocarbon analyzers
occurred from the corrosive gases passing through them, necessitating more fre-
quent maintenance and calibration. The damage was caused by an engineering
oversight which left a cold spot in the system. Condensation thus occurred,
and it was the condensate that damaged the instruments. No effects from the
unusual shock vibration or saltwater environment were noted.
Incinerator controls and instrumentation were adequate. Redundant incin-
erator wall thermocouples would be desirable from an operational standpoint
because loss of wall thermocouples would shut off incineration and because they
cannot be replaced while the incinerators are hot.
8
image:
 The personnel protection procedures described in Section 5 worked satis-
factorily. A boundary-isolation method of excluding Herbicide Orange from
living areas of the ship was used effectively. There were no major exposures
of personnel to Herbicide Orange. Minor exposures occurred during the first
burn when the incinerator exhaust plume impinged on the ship. Brief plume
impingements (5 to 60 seconds) resulted from burner flameouts caused by a
layer of material (later identified as water with traces of arsenic and sodium
salts of 2,4-D and 2,4,5-T) floating on top of the waste reaching the burners.
Flameouts were avoided subsequently by switching two of the three burners in
each incinerator to other tanks when nearing depletion of the waste tank being
pumped.
A significant result was derived from on-line monitoring data taken during
a traverse across the starboard stack. It was found that wall effects on the
combustion effluent gas composition from Herbicide Orange incineration were
nonexistent at distances greater than 10 cm from the inside incinerator wall
surface. Therefore, incinerator combustion efficiency could be determined
using a fixed position probe.
The at-sea incineration of Herbicide Orange was successfully completed.
The Permittees complied with all permit conditions related to at-sea operations
in the designated burn zone and listed in Section 1.2.
image:
The personnel protection procedures described in Section 5 worked satis-
factorily. A boundary-isolation method of excluding Herbicide Orange from
living areas of the ship was used effectively. There were no major exposures
of personnel to Herbicide Orange. Minor exposures occurred during the first
burn when the incinerator exhaust plume impinged on the ship. Brief plume
impingements (5 to 60 seconds) resulted from burner flameouts caused by a
layer of material (later identified as water with traces of arsenic and sodium
salts of 2,4-D and 2,4,5-T) floating on top of the waste reaching the burners.
Flameouts were avoided subsequently by switching two of the three burners in
each incinerator to other tanks when nearing depletion of the waste tank being
pumped.
A significant result was derived from on-line monitoring data taken during
a traverse across the starboard stack. It was found that wall effects on the
combustion effluent gas composition from Herbicide Orange incineration were
nonexistent at distances greater than 10 cm from the inside incinerator wall
surface. Therefore, incinerator combustion efficiency could be determined
using a fixed position probe.
The at-sea incineration of Herbicide Orange was successfully completed.
The Permittees complied with all permit conditions related to at-sea operations
in the designated burn zone and listed in Section 1.2.
image:
 2. DESCRIPTION OF THE M/T VULCANUS
2.1 GENERAL LAYOUT OF VESSEL
The M/T Vulcanus, originally a cargo ship, was converted in 1972 to a
chemical tanker fitted with two large incinerators located at the stern. The
vessel meets all applicable requirements of the Intergovernmental Maritime
Consultative Organization (IMCO) concerning transport of dangerous cargo by
tanker. Figure 2 is a picture of the vessel, and Table 3 gives some of the
ship's specifications. Both the picture and the table were furnished by Ocean
Combustion Services, B.V., Rotterdam, The Netherlands, who manage the vessel.
Because of her size - an overall length of 102 meters, a beam of
14.4 meters, and a maximum draft of 7.4 meters - the Vulcanus is able to
Figure 2. M/T Vulcanus - incineration vessel
10
image:
2. DESCRIPTION OF THE M/T VULCANUS
2.1 GENERAL LAYOUT OF VESSEL
The M/T Vulcanus, originally a cargo ship, was converted in 1972 to a
chemical tanker fitted with two large incinerators located at the stern. The
vessel meets all applicable requirements of the Intergovernmental Maritime
Consultative Organization (IMCO) concerning transport of dangerous cargo by
tanker. Figure 2 is a picture of the vessel, and Table 3 gives some of the
ship's specifications. Both the picture and the table were furnished by Ocean
Combustion Services, B.V., Rotterdam, The Netherlands, who manage the vessel.
Because of her size - an overall length of 102 meters, a beam of
14.4 meters, and a maximum draft of 7.4 meters - the Vulcanus is able to
Figure 2. M/T Vulcanus - incineration vessel
10
image:
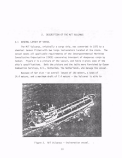 TABLE 3. SPECIFICATIONS OF THE M/T VULCANUS
Length overall
Breadth
Draft, maximum
Deadweight (DWT)
Speed
Tank capacity
Number of tanks
Tank coating
Loading equipment
Hose connection
Safety equipment
Waste to be processed
Incinerators
Per incinerator:
Overall height
Combustion chamber
OD
ID
Stack (top)
OD
ID
Waste feed (max)
Combustion air (max)
Burners (Vortex type)
Volume
Residence time
101.95 meters
14.40 meters
7.40 meters
4,768 metric tons
10-13 knots
3,503 cubic meters (cu m)
15, ranging in size from 115 cu m to
574 cu m
No coating in tanks, pipes, pumps, etc.
All equipment consists of low carbon
steel
Not available, but can be placed on
board, if required
10.2, 15.2, and 20.3 centimeters
(4,6, 8 inches)in diameter
Specially designed for this task and in
accordance with latest regulations of
IMCO, Scheepvaart-Inspectie (The Hague)
Must be liquid and pumpable. May con-
tain solid substances in pieces up to
5 centimeters in size. Must not attack
mild steel
10.45 m
5.5 m
4.8 m
3.8 m
3.4 m
12.5 metric tons/hour
90,000 m /hour
3
120 m3
1.0 sec at 1500 °C (calculated)
11
image:
TABLE 3. SPECIFICATIONS OF THE M/T VULCANUS
Length overall
Breadth
Draft, maximum
Deadweight (DWT)
Speed
Tank capacity
Number of tanks
Tank coating
Loading equipment
Hose connection
Safety equipment
Waste to be processed
Incinerators
Per incinerator:
Overall height
Combustion chamber
OD
ID
Stack (top)
OD
ID
Waste feed (max)
Combustion air (max)
Burners (Vortex type)
Volume
Residence time
101.95 meters
14.40 meters
7.40 meters
4,768 metric tons
10-13 knots
3,503 cubic meters (cu m)
15, ranging in size from 115 cu m to
574 cu m
No coating in tanks, pipes, pumps, etc.
All equipment consists of low carbon
steel
Not available, but can be placed on
board, if required
10.2, 15.2, and 20.3 centimeters
(4,6, 8 inches)in diameter
Specially designed for this task and in
accordance with latest regulations of
IMCO, Scheepvaart-Inspectie (The Hague)
Must be liquid and pumpable. May con-
tain solid substances in pieces up to
5 centimeters in size. Must not attack
mild steel
10.45 m
5.5 m
4.8 m
3.8 m
3.4 m
12.5 metric tons/hour
90,000 m /hour
3
120 m3
1.0 sec at 1500 °C (calculated)
11
image:
 operate worldwide. Two diesel engines drive a single propeller to give cruis-
ing speeds of 10 to 13 knots. Her crew numbers 18; twelve to operate the ves-
sel and six to operate the incinerators.
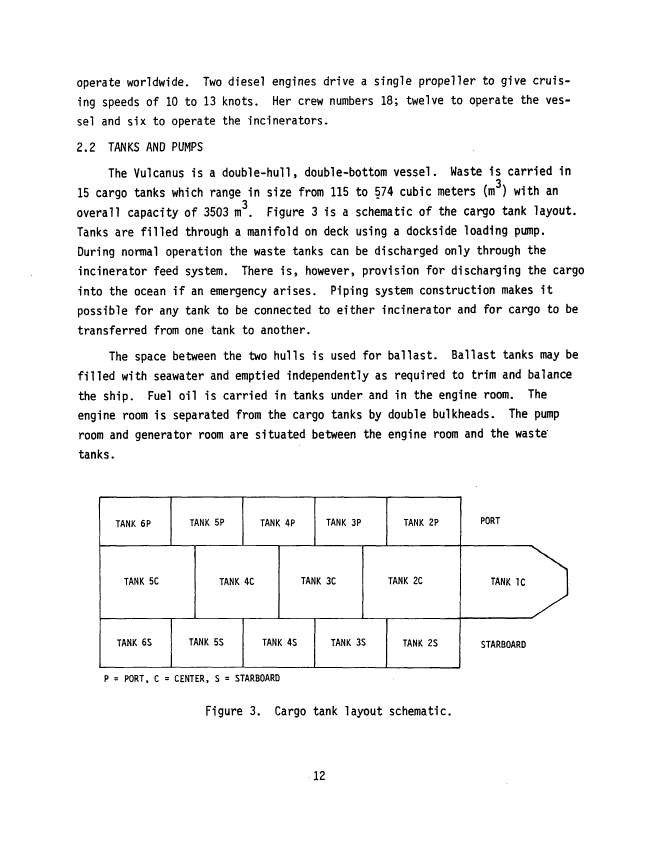
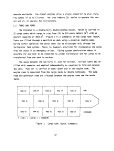
2.2 TANKS AND PUMPS
The Vulcanus is a double-hull, double-bottom vessel. Waste 1s carried in
15 cargo tanks which range in size from 115 to 574 cubic meters (m ) with an
overall capacity of 3503 m . Figure 3 is a schematic of the cargo tank layout.
Tanks are filled through a manifold on deck using a dockside loading pump.
During normal operation the waste tanks can be discharged only through the
incinerator feed system. There is, however, provision for discharging the cargo
into the ocean if an emergency arises. Piping system construction makes it
possible for any tank to be connected to either incinerator and for cargo to be
transferred from one tank to another.
The space between the two hulls is used for ballast. Ballast tanks may be
filled with seawater and emptied independently as required to trim and balance
the ship. Fuel oil is carried in tanks under and in the engine room. The
engine room is separated from the cargo tanks by double bulkheads. The pump
room and generator room are situated between the engine room and the waste
tanks.
TANK 6P
TANK 5P
TANK 4P
TANK 3P
TANK 2P
TANK 5C
TANK 6S
TANK 4C
TANK 5S
TANK 3C
TANK 4S
TANK 2C
TANK 3S
TANK 2S
PORT
TANK 1C
STARBOARD
P = PORT, C = CENTER, S = STARBOARD
Figure 3. Cargo tank layout schematic.
12
image:
operate worldwide. Two diesel engines drive a single propeller to give cruis-
ing speeds of 10 to 13 knots. Her crew numbers 18; twelve to operate the ves-
sel and six to operate the incinerators.
2.2 TANKS AND PUMPS
The Vulcanus is a double-hull, double-bottom vessel. Waste 1s carried in
15 cargo tanks which range in size from 115 to 574 cubic meters (m ) with an
overall capacity of 3503 m . Figure 3 is a schematic of the cargo tank layout.
Tanks are filled through a manifold on deck using a dockside loading pump.
During normal operation the waste tanks can be discharged only through the
incinerator feed system. There is, however, provision for discharging the cargo
into the ocean if an emergency arises. Piping system construction makes it
possible for any tank to be connected to either incinerator and for cargo to be
transferred from one tank to another.
The space between the two hulls is used for ballast. Ballast tanks may be
filled with seawater and emptied independently as required to trim and balance
the ship. Fuel oil is carried in tanks under and in the engine room. The
engine room is separated from the cargo tanks by double bulkheads. The pump
room and generator room are situated between the engine room and the waste
tanks.
TANK 6P
TANK 5P
TANK 4P
TANK 3P
TANK 2P
TANK 5C
TANK 6S
TANK 4C
TANK 5S
TANK 3C
TANK 4S
TANK 2C
TANK 3S
TANK 2S
PORT
TANK 1C
STARBOARD
P = PORT, C = CENTER, S = STARBOARD
Figure 3. Cargo tank layout schematic.
12
image:
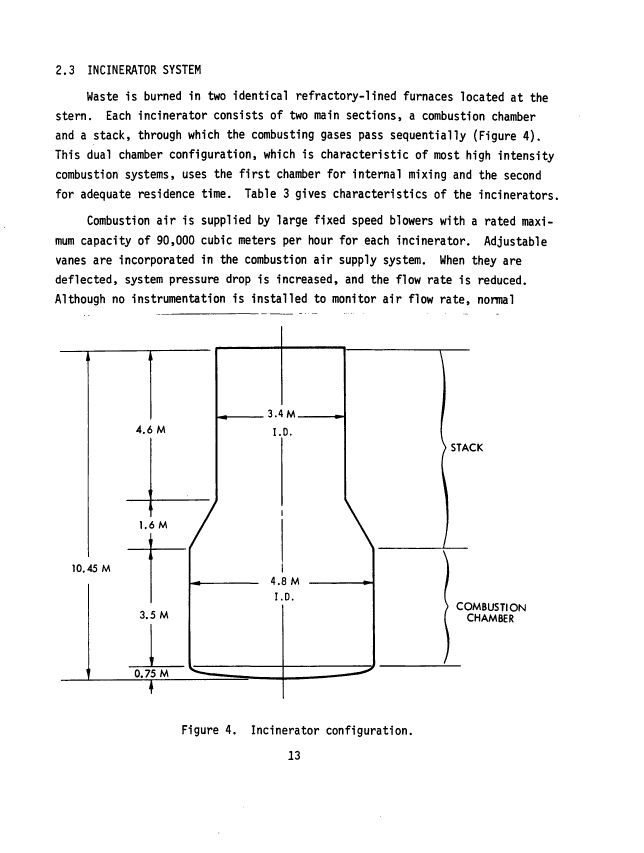
 2.3 INCINERATOR SYSTEM
Waste is burned in two identical refractory-lined furnaces located at the
stern. Each incinerator consists of two main sections, a combustion chamber
and a stack, through which the combusting gases pass sequentially (Figure 4).
This dual chamber configuration, which is characteristic of most high intensity
combustion systems, uses the first chamber for internal mixing and the second
for adequate residence time. Table 3 gives characteristics of the incinerators.
Combustion air is supplied by large fixed speed blowers with a rated maxi-
mum capacity of 90,000 cubic meters per hour for each incinerator. Adjustable
vanes are incorporated in the combustion air supply system. When they are
deflected, system pressure drop is increased, and the flow rate is reduced.
Although no instrumentation is installed to monitor air flow rate, normal
4.6 M
3.4M.
I.D.
> STACK
1.6M
10.45 M
3.5 M
0.75M
i
4.8M
I.D.
COMBUSTION
CHAMBER
Figure 4. Incinerator configuration.
13
image:
2.3 INCINERATOR SYSTEM
Waste is burned in two identical refractory-lined furnaces located at the
stern. Each incinerator consists of two main sections, a combustion chamber
and a stack, through which the combusting gases pass sequentially (Figure 4).
This dual chamber configuration, which is characteristic of most high intensity
combustion systems, uses the first chamber for internal mixing and the second
for adequate residence time. Table 3 gives characteristics of the incinerators.
Combustion air is supplied by large fixed speed blowers with a rated maxi-
mum capacity of 90,000 cubic meters per hour for each incinerator. Adjustable
vanes are incorporated in the combustion air supply system. When they are
deflected, system pressure drop is increased, and the flow rate is reduced.
Although no instrumentation is installed to monitor air flow rate, normal
4.6 M
3.4M.
I.D.
> STACK
1.6M
10.45 M
3.5 M
0.75M
i
4.8M
I.D.
COMBUSTION
CHAMBER
Figure 4. Incinerator configuration.
13
image:
 operation is stated by the ship's chief engineer to be between 75,000 and
80,000 cubic meters per hour at ambient conditions.
Liquid wastes are fed to the combustion system by means of electrically
driven pumps. Upstream of each burner supply pump is a device (Gorator) for
reducing the solids in the waste to a pumpable slurry. The Gorator also acts
as a mixing pump by recirculating the waste through the waste tank. Power for
the blowers, pumps and other parts of the incinerator system is supplied by
two diesel-generators with a total capacity of 750 kW at 440 volts and
60 Hertz.
Three burners of the vortex type are located at the same level on the
*
periphery of each furnace near its base. The burners are of a rotating cup,
concentric design and deliver waste or fuel oil through a central tube to an
atomization nozzle, where it meets high velocity air delivered through an
annulus. The burners are positioned as shown in Figure 5.
BURNER 6
BURNER 5
THERMOCOUPLE INDICATORS
(BLACK-BOX AND CONTROL PANEL)
(STARBOARD FURNACE)
THERMOCOUPLE FOR STARBOARD
FURNACE AUTOMATIC SHUT-OFF
BURNER 4
BURNER 3
BURNER 1
THERMOCOUPLE FOR PORT
FURNACE AUTOMATIC SHUT-OFF
THERMOCOUPLE INDICATORS
(BLACK BOX AND CONTROL PANEL)
(PORT FURNACE)
BURNER 2
Figure 5. Incineration system — burner and thermocouple locations.
14
image:
operation is stated by the ship's chief engineer to be between 75,000 and
80,000 cubic meters per hour at ambient conditions.
Liquid wastes are fed to the combustion system by means of electrically
driven pumps. Upstream of each burner supply pump is a device (Gorator) for
reducing the solids in the waste to a pumpable slurry. The Gorator also acts
as a mixing pump by recirculating the waste through the waste tank. Power for
the blowers, pumps and other parts of the incinerator system is supplied by
two diesel-generators with a total capacity of 750 kW at 440 volts and
60 Hertz.
Three burners of the vortex type are located at the same level on the
*
periphery of each furnace near its base. The burners are of a rotating cup,
concentric design and deliver waste or fuel oil through a central tube to an
atomization nozzle, where it meets high velocity air delivered through an
annulus. The burners are positioned as shown in Figure 5.
BURNER 6
BURNER 5
THERMOCOUPLE INDICATORS
(BLACK-BOX AND CONTROL PANEL)
(STARBOARD FURNACE)
THERMOCOUPLE FOR STARBOARD
FURNACE AUTOMATIC SHUT-OFF
BURNER 4
BURNER 3
BURNER 1
THERMOCOUPLE FOR PORT
FURNACE AUTOMATIC SHUT-OFF
THERMOCOUPLE INDICATORS
(BLACK BOX AND CONTROL PANEL)
(PORT FURNACE)
BURNER 2
Figure 5. Incineration system — burner and thermocouple locations.
14
image:
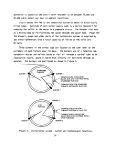 Three-way valves are utilized on each burner to provide either waste feed,
fuel oil feed, or a shutoff condition. Waste and fuel oil cannot be valved into
a burner simultaneously; however, alternate burners could be operated with fuel
and waste to achieve higher or lower combustion temperatures if necessary,
depending on the relative heat contents of the fuel oil and waste.
Periodically the burners require cleaning. They are normally cleaned one
at a time with the remaining two firing waste. Cleaning is easily accomplished
because the burners are readily accessible. Each burner has a vertical pivot
so that it can be swung out of the furnace. The opening left by this operation
is temporarily closed by a cover. The burners are cleaned by a metal tool which
is pushed through the burner.
2.4 RECORDING AND CONTROL EQUIPMENT
2.4.1 Waste Measurements
A new measuring system was installed into each tank for the Herbicide
Orange burns. It was a sealed system to prevent waste vapors from escaping.
However, this system proved unsatisfactory because it measured only the top
one-third of each tank and because the tanks had to be vented to atmosphere
in order to pump waste out. Sounding the depth of waste in each tank with a
tape was another method of determining burn rate. Both of these methods were
only useful in port or in calm seas (i.e., minimum ship roll). During the
actual burns, the total time was recorded for emptying each tank and a time
averaged waste feed rate was determined.
2.4.2 Wall Temperature Measurements
Temperatures during operation of the incinerators were measured by two
platinum-platinum/10% rhodium thermocouples in each incinerator. Each pair is
located in a well opposite one of the burners (Figure 5). One thermocouple is
located approximately 1.3 cm from the inside surface of the refractory lining.
This thermocouple provides temperature information to the automatic waste shut-
off system and is called the controller thermocouple. A second thermocouple,
approximately 4 cm from the inner surface of the firebrick, is referred to as
the "indicator" because it provides temperature information to a panel located
in the incinerator control room and to a panel ("black box") located on the
bridge.
15
image:
Three-way valves are utilized on each burner to provide either waste feed,
fuel oil feed, or a shutoff condition. Waste and fuel oil cannot be valved into
a burner simultaneously; however, alternate burners could be operated with fuel
and waste to achieve higher or lower combustion temperatures if necessary,
depending on the relative heat contents of the fuel oil and waste.
Periodically the burners require cleaning. They are normally cleaned one
at a time with the remaining two firing waste. Cleaning is easily accomplished
because the burners are readily accessible. Each burner has a vertical pivot
so that it can be swung out of the furnace. The opening left by this operation
is temporarily closed by a cover. The burners are cleaned by a metal tool which
is pushed through the burner.
2.4 RECORDING AND CONTROL EQUIPMENT
2.4.1 Waste Measurements
A new measuring system was installed into each tank for the Herbicide
Orange burns. It was a sealed system to prevent waste vapors from escaping.
However, this system proved unsatisfactory because it measured only the top
one-third of each tank and because the tanks had to be vented to atmosphere
in order to pump waste out. Sounding the depth of waste in each tank with a
tape was another method of determining burn rate. Both of these methods were
only useful in port or in calm seas (i.e., minimum ship roll). During the
actual burns, the total time was recorded for emptying each tank and a time
averaged waste feed rate was determined.
2.4.2 Wall Temperature Measurements
Temperatures during operation of the incinerators were measured by two
platinum-platinum/10% rhodium thermocouples in each incinerator. Each pair is
located in a well opposite one of the burners (Figure 5). One thermocouple is
located approximately 1.3 cm from the inside surface of the refractory lining.
This thermocouple provides temperature information to the automatic waste shut-
off system and is called the controller thermocouple. A second thermocouple,
approximately 4 cm from the inner surface of the firebrick, is referred to as
the "indicator" because it provides temperature information to a panel located
in the incinerator control room and to a panel ("black box") located on the
bridge.
15
image:
 The thermocouples used to activate the automatic waste shutoff system and
the recording equipment have been quite reliable and durable according to per-
sonnel of the M/T Vulcanus. There were no failures during the operations cov-
ered in this report.
2.4.3 Emergency Automatic Waste Shutoff
A Plastomatic 2000 system (supplied by Withoff-PhiHips, Bremen, West
Germany) was used for the emergency automatic waste shutoff. This system uses
a thermocouple controlled, spring loaded, solenoid actuated valve which shuts
off waste to the burners when the temperature of the furnace drops below a pre-
set selected temperature. During these tests the U.S. EPA required the Plasto-
matic controller to be set such that waste flow would be shut off if the flame
temperature dropped below 1250°C.
If the temperature in a furnace should drop below the preselected minimum,
the Plastomatic 2000 solenoid is deactivated, allowing a spring loaded valvej to
close, shutting off the flow of waste to the three burners of that furnace. !
i
The valve which is closed shuts the waste line in both directions and also stops
i
the waste pumps by cutting power to them. A power failure or thermocouple burn-
out in the Plastomatic 2000 system would also shut off the flow of waste to the
burners involved.
If the system should shut off the waste flow, the pump which has been
stopped and the valves which have been closed may be restarted after the cause
has been identified and corrected and after the Plastomatic has been reset. It
should be noted that operating procedures require restart and reestablishment
of the required flame temperature using fuel oil before waste can be burned
again.
The controller thermocouple was also utilized to indicate real-time tempera-
ture measurements. This was accomplished by adjusting the controller dial from
the shutoff temperature setting to increasingly higher temperature settings.
When the adjusted setting was coincident with the actual temperature sensed by
this thermocouple, the feed valve relay clicked. Observation of the pointer
location with respect to the temperature scale on the dial provided a tempera-
ture reading. The waste shutoff system was not immediately activated because
a time delay was incorporated in the electrical circuit. The pointer was then
16
image:
The thermocouples used to activate the automatic waste shutoff system and
the recording equipment have been quite reliable and durable according to per-
sonnel of the M/T Vulcanus. There were no failures during the operations cov-
ered in this report.
2.4.3 Emergency Automatic Waste Shutoff
A Plastomatic 2000 system (supplied by Withoff-PhiHips, Bremen, West
Germany) was used for the emergency automatic waste shutoff. This system uses
a thermocouple controlled, spring loaded, solenoid actuated valve which shuts
off waste to the burners when the temperature of the furnace drops below a pre-
set selected temperature. During these tests the U.S. EPA required the Plasto-
matic controller to be set such that waste flow would be shut off if the flame
temperature dropped below 1250°C.
If the temperature in a furnace should drop below the preselected minimum,
the Plastomatic 2000 solenoid is deactivated, allowing a spring loaded valvej to
close, shutting off the flow of waste to the three burners of that furnace. !
i
The valve which is closed shuts the waste line in both directions and also stops
i
the waste pumps by cutting power to them. A power failure or thermocouple burn-
out in the Plastomatic 2000 system would also shut off the flow of waste to the
burners involved.
If the system should shut off the waste flow, the pump which has been
stopped and the valves which have been closed may be restarted after the cause
has been identified and corrected and after the Plastomatic has been reset. It
should be noted that operating procedures require restart and reestablishment
of the required flame temperature using fuel oil before waste can be burned
again.
The controller thermocouple was also utilized to indicate real-time tempera-
ture measurements. This was accomplished by adjusting the controller dial from
the shutoff temperature setting to increasingly higher temperature settings.
When the adjusted setting was coincident with the actual temperature sensed by
this thermocouple, the feed valve relay clicked. Observation of the pointer
location with respect to the temperature scale on the dial provided a tempera-
ture reading. The waste shutoff system was not immediately activated because
a time delay was incorporated in the electrical circuit. The pointer was then
16
image:
 reset to the required automatic shutoff temperature before the system activated.
The ability to record temperatures in this manner was useful in the event that
the indicator wall temperature thermocouple should fail during operation.
2.4.4 Special Equipment
Certain equipment has been installed on the Vulcanus because of its partic-
ular type of operation. These items of equipment are:
• Loran and Decca Navigational Systems: This equipment is needed
in American (Loran) and European (Decca) waters in order to
locate the ship precisely at all times. Celestial navigation
was used to locate and keep the Vulcanus in the designated
burn zone.
• Anemometer: This equipment measures the velocity and force
of the wind. It is, therefore, useful in selecting an atti-
tude of the ship during various wind conditions such that the
plume may be directed away from the ship and its personnel.
• Radio Communication; The Vulcanus is equipped with SSB (single
side band) and DSB (double side band) radio for voice and contin-
uous wave communication; MF (medium frequency) and SF (short
wave) telegraphy; Marifoon (VHF) (all channels) for close-in
voice communication; and Semafoon (a private telephonic communi-
cation system). For this program, a Hagenuck Synthesized Trans-
ceiver was installed to permit voice communication over all
marine frequencies. A radio was also located on the bridge
so that the watch officer could hear marine broadcasts at all
times.
• Optical Pyrometer: A portable optical pyrometer was utilized
during the test program to measure incinerator flame tempera-
tures. These measurements were taken daily using a Leeds and
Northrup optical pyrometer operating in the 6500 A range.
• Black Box: On the bridge was a panel in a sealable enclosure
referred to as the "black box" which displayed information
necessary to assure that wastes were being burned at proper
temperatures and, in Europe where the Decca Navigator can
receive suitable land based signals, at the proper location.
The panel displays included the following information: indicator
thermocouple readings for each incinerator; day, month, and time;
status (on/off) of the waste pumps; and the vessel's position
by the Decca Navigator. An 8 mm movie camera within the black
box photographed the panel every 15 minutes during incinerator
operations. Films from the incineration of Herbicide Orange
were retained by the U.S. EPA.
17
image:
reset to the required automatic shutoff temperature before the system activated.
The ability to record temperatures in this manner was useful in the event that
the indicator wall temperature thermocouple should fail during operation.
2.4.4 Special Equipment
Certain equipment has been installed on the Vulcanus because of its partic-
ular type of operation. These items of equipment are:
• Loran and Decca Navigational Systems: This equipment is needed
in American (Loran) and European (Decca) waters in order to
locate the ship precisely at all times. Celestial navigation
was used to locate and keep the Vulcanus in the designated
burn zone.
• Anemometer: This equipment measures the velocity and force
of the wind. It is, therefore, useful in selecting an atti-
tude of the ship during various wind conditions such that the
plume may be directed away from the ship and its personnel.
• Radio Communication; The Vulcanus is equipped with SSB (single
side band) and DSB (double side band) radio for voice and contin-
uous wave communication; MF (medium frequency) and SF (short
wave) telegraphy; Marifoon (VHF) (all channels) for close-in
voice communication; and Semafoon (a private telephonic communi-
cation system). For this program, a Hagenuck Synthesized Trans-
ceiver was installed to permit voice communication over all
marine frequencies. A radio was also located on the bridge
so that the watch officer could hear marine broadcasts at all
times.
• Optical Pyrometer: A portable optical pyrometer was utilized
during the test program to measure incinerator flame tempera-
tures. These measurements were taken daily using a Leeds and
Northrup optical pyrometer operating in the 6500 A range.
• Black Box: On the bridge was a panel in a sealable enclosure
referred to as the "black box" which displayed information
necessary to assure that wastes were being burned at proper
temperatures and, in Europe where the Decca Navigator can
receive suitable land based signals, at the proper location.
The panel displays included the following information: indicator
thermocouple readings for each incinerator; day, month, and time;
status (on/off) of the waste pumps; and the vessel's position
by the Decca Navigator. An 8 mm movie camera within the black
box photographed the panel every 15 minutes during incinerator
operations. Films from the incineration of Herbicide Orange
were retained by the U.S. EPA.
17
image:
 3. TEST OPERATIONS
3.1 SAMPLING AND MONITORING EQUIPMENT AND PROCEDURES
The combustion product effluent stream from the incineration of Herbicide
Orange onboard the M/T Vulcanus was sampled utilizing three probes. Two ceramic
probes (one in each stack) were installed to divert the gases to an on-line mon-
itoring system comprised of CO, COg, Og, and hydrocarbon analyzers. For a more
comprehensive characterization of the combustion effluent chemical species,
including specific herbicide constituents, a water-cooled probe capable of
traversing the starboard incinerator diverted a representative portion of the
effluent stream to two sampling trains. These sampling trains were: (1) the
USAF-OEHL benzene impinger train which was previously tested and proven effec-
tive for sampling 2,4-D, 2,4,5-T, and TCDD, and (2) a modified U.S. EPA Method
5 train which incorporated a sorbent trap that has been used extensively for
the general trapping of organic compounds in commercial incineration of
organochlorines. The USAF train was the primary train for acquiring the sam-
ples for TCDD analysis, whereas the sorbent train acted as a backup system for
TCDD, as well as the primary train for the determination of organic species
potentially present in the effluent.
In addition to stack sampling, a variety of air, liquid, and solid samples
were taken. These samples included:
• Plankton and seawater samples - Plankton and seawater tows were
made in the burn zone before and after incineration of the first
shipload.
t Tedlar® bag stack gas grab samples - Samples of the stack
gas obtained from the gas conditioner were taken to supple-
ment the XAD-2® module information. Each sample was
28 liters in volume.
0 Burner residues - Samples of burner residue were taken when
the burners were cleaned.
18
image:
3. TEST OPERATIONS
3.1 SAMPLING AND MONITORING EQUIPMENT AND PROCEDURES
The combustion product effluent stream from the incineration of Herbicide
Orange onboard the M/T Vulcanus was sampled utilizing three probes. Two ceramic
probes (one in each stack) were installed to divert the gases to an on-line mon-
itoring system comprised of CO, COg, Og, and hydrocarbon analyzers. For a more
comprehensive characterization of the combustion effluent chemical species,
including specific herbicide constituents, a water-cooled probe capable of
traversing the starboard incinerator diverted a representative portion of the
effluent stream to two sampling trains. These sampling trains were: (1) the
USAF-OEHL benzene impinger train which was previously tested and proven effec-
tive for sampling 2,4-D, 2,4,5-T, and TCDD, and (2) a modified U.S. EPA Method
5 train which incorporated a sorbent trap that has been used extensively for
the general trapping of organic compounds in commercial incineration of
organochlorines. The USAF train was the primary train for acquiring the sam-
ples for TCDD analysis, whereas the sorbent train acted as a backup system for
TCDD, as well as the primary train for the determination of organic species
potentially present in the effluent.
In addition to stack sampling, a variety of air, liquid, and solid samples
were taken. These samples included:
• Plankton and seawater samples - Plankton and seawater tows were
made in the burn zone before and after incineration of the first
shipload.
t Tedlar® bag stack gas grab samples - Samples of the stack
gas obtained from the gas conditioner were taken to supple-
ment the XAD-2® module information. Each sample was
28 liters in volume.
0 Burner residues - Samples of burner residue were taken when
the burners were cleaned.
18
image:
 • Composite waste feed - Samples of waste being fed to the
incinerators were taken for determination of the composi-
tion of the waste. These samples were taken at burner
No. 4 rather than from the tanks.
• HC1 measurements - Air was sampled with a Drager® appa-
ratus during incinerator operations to detect whether the
plume was contacting the ship.
• Air samples - Ambient air grab samples were taken at specific
locations using a gas syringe and analyzed for 2,4-D and
2,4,5-T by an onboard gas chromatograph.
(R)
• Wipe samples - Whatman 41 w filter papers were used to wipe
selected areas of the ship. They were extracted and analyzed
by the onboard GC for 2,4-D and 2,4,5-T.
• Workspace air mom'tors - MSA personnel monitors fitted with
Chromosorb 102& absorption tubes were placed at several
positions on the ship to monitor personnel exposure to
2,4-D and 2,4,5-T.
Samples of stack gas, burner residues, and composite feeds were taken for
completeness of sampling, and results are given in Section 4. HC1 measurements,
air samples, wipe samples, and workspace air monitor samples were taken as
part of the personnel protection plan and are discussed in Section 5.
3.1.1 On-Line Monitoring System/Portable Laboratory
A standard shipping container was modified as a portable laboratory to
house the on-line monitoring instrumentation and to serve as the operations
room for the sampling team. Its overall dimensions were 2.4 x 6.1 x 2.4 m.
It was constructed of 2.54 cm plywood with an exterior fiberglass coat and was
built on a base of approximately 15 cm longitudinal and transverse structural
steel channels and beams. A hardwood floor of 5 cm dimensioned lumber was pro-
vided, and all corners had cast metal stacking and tie-down provisions for
securing the container to the ship's deck.
The container tare weight was 1,800 kg, and maximum gross weight was
20,000 kg. It is estimated that the total weight of the equipment and con-
tainer was 8,700 kg. It can be forklifted or hoisted by slings, and it is
19
image:
• Composite waste feed - Samples of waste being fed to the
incinerators were taken for determination of the composi-
tion of the waste. These samples were taken at burner
No. 4 rather than from the tanks.
• HC1 measurements - Air was sampled with a Drager® appa-
ratus during incinerator operations to detect whether the
plume was contacting the ship.
• Air samples - Ambient air grab samples were taken at specific
locations using a gas syringe and analyzed for 2,4-D and
2,4,5-T by an onboard gas chromatograph.
(R)
• Wipe samples - Whatman 41 w filter papers were used to wipe
selected areas of the ship. They were extracted and analyzed
by the onboard GC for 2,4-D and 2,4,5-T.
• Workspace air mom'tors - MSA personnel monitors fitted with
Chromosorb 102& absorption tubes were placed at several
positions on the ship to monitor personnel exposure to
2,4-D and 2,4,5-T.
Samples of stack gas, burner residues, and composite feeds were taken for
completeness of sampling, and results are given in Section 4. HC1 measurements,
air samples, wipe samples, and workspace air monitor samples were taken as
part of the personnel protection plan and are discussed in Section 5.
3.1.1 On-Line Monitoring System/Portable Laboratory
A standard shipping container was modified as a portable laboratory to
house the on-line monitoring instrumentation and to serve as the operations
room for the sampling team. Its overall dimensions were 2.4 x 6.1 x 2.4 m.
It was constructed of 2.54 cm plywood with an exterior fiberglass coat and was
built on a base of approximately 15 cm longitudinal and transverse structural
steel channels and beams. A hardwood floor of 5 cm dimensioned lumber was pro-
vided, and all corners had cast metal stacking and tie-down provisions for
securing the container to the ship's deck.
The container tare weight was 1,800 kg, and maximum gross weight was
20,000 kg. It is estimated that the total weight of the equipment and con-
tainer was 8,700 kg. It can be forklifted or hoisted by slings, and it is
19
image:
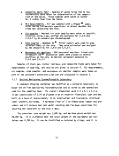 structurally sound for stacking. The portable laboratory was stacked above an
identical container, which was used for storage of supplies and spares. The
stacking arrangement on the ship met U.S. Coast Guard requirements. Figure 6
gives a view of the equipment arrangement in the portable laboratory.
Power for the portable laboratory and sampling equipment was provided by
a motor generator which converted the 440 V, 60 Hz ship's power to 110 V, 60 Hz.
This motor generator was installed on the observation deck, above the bridge. A
backup motor generator was similarly installed.
3.1.1.1 Fixed Probe Design
The probe used for the on-line gas analyzers was in addition to the sampling
equipment previously used on the Vulcanus. The probe was a 122- by 1.27-cm OD
high temperature alumina tube with a 1.6 mm wall. This ceramic material was
inert and had been shown to operate well in similar environments. It required
no cooling and was fixed in place (i.e., it would not traverse). One of these
probes was installed in each incinerator stack and extended about 38 cm (15 in.)
past the inner wall. Heat traced Teflon® lines connected these probes to a
three-way valve. This valve was connected to a manifold in the portable labora-
tory leading to two parallel gas analysis systems. Figure 7 is a schematic of
the probe and heat traced line layout. This design made it possible to monitor
either incinerator with either gas analysis system although both incinerators
could not be monitored simultaneously.
3.1.1.2 Instrumentation
On-line monitoring of the concentrations of selected gases in both inciner-
ator effluents was accomplished by two complete duplicate systems schematically
depicted in Figure 8. These measurements served as indices of the effectiveness
of the thermal destruction process. The on-line monitors used one ceramic probe
in each stack with heated line delivery systems. This allowed random monitoring
of the incinerators regardless of the status of the other trains. The monitors
and their calibration ranges are shown in Table 4. The manifold system was
designed so that either a complete bank of instruments or one instrument can be
operated depending on the operational readiness of any given instrument.
Besides availability of duplicate analyzers, spare parts were carried onboard.
20
image:
structurally sound for stacking. The portable laboratory was stacked above an
identical container, which was used for storage of supplies and spares. The
stacking arrangement on the ship met U.S. Coast Guard requirements. Figure 6
gives a view of the equipment arrangement in the portable laboratory.
Power for the portable laboratory and sampling equipment was provided by
a motor generator which converted the 440 V, 60 Hz ship's power to 110 V, 60 Hz.
This motor generator was installed on the observation deck, above the bridge. A
backup motor generator was similarly installed.
3.1.1.1 Fixed Probe Design
The probe used for the on-line gas analyzers was in addition to the sampling
equipment previously used on the Vulcanus. The probe was a 122- by 1.27-cm OD
high temperature alumina tube with a 1.6 mm wall. This ceramic material was
inert and had been shown to operate well in similar environments. It required
no cooling and was fixed in place (i.e., it would not traverse). One of these
probes was installed in each incinerator stack and extended about 38 cm (15 in.)
past the inner wall. Heat traced Teflon® lines connected these probes to a
three-way valve. This valve was connected to a manifold in the portable labora-
tory leading to two parallel gas analysis systems. Figure 7 is a schematic of
the probe and heat traced line layout. This design made it possible to monitor
either incinerator with either gas analysis system although both incinerators
could not be monitored simultaneously.
3.1.1.2 Instrumentation
On-line monitoring of the concentrations of selected gases in both inciner-
ator effluents was accomplished by two complete duplicate systems schematically
depicted in Figure 8. These measurements served as indices of the effectiveness
of the thermal destruction process. The on-line monitors used one ceramic probe
in each stack with heated line delivery systems. This allowed random monitoring
of the incinerators regardless of the status of the other trains. The monitors
and their calibration ranges are shown in Table 4. The manifold system was
designed so that either a complete bank of instruments or one instrument can be
operated depending on the operational readiness of any given instrument.
Besides availability of duplicate analyzers, spare parts were carried onboard.
20
image:
 ro
Jv A. DOUBLE SIDE DOORS
^>^ \l ^X. (PERMANENTLY CLOSED)
r- 2 x. b TYPICAL ^^ y X.
AIR.
f CONDIT
26Wxl9Hx290|f
NEAR
CEILING L
ELEC. AND L
PT ITMWTMf1 I
« n
3AS CYLJ
STOR.
• RACK
J 2'x4'
\ MAY
Jj
d Jl Vix •
CAB.
FOR
FLAMM.
CHEM.
g'xa'xa1
STOR. |FILE 1
CAB. CAB« INSTR
2'x3'x6'l |A8' LIGHT FIXTJ |
I — % ?LACES |
nr— ^ ..... j i | | |
! INSTR. 1
| 1 RACK 12 !
11 i
GC \ \
t^VE RECORDER
FILE Mcr
CAB /-CRT BKR PANEL GAS COND
1 ' BELOW ^ U2"x36"x
Tfc 1 1 IN N 1 M 10 fl
J-BOXES ON "-AJp" DOOR WINDOW
THIS END \ /
NO PROTRUSIONS ON \ /
SIDES OF CONTAINER ?
81
DOUBLE
END
DOORS
Figure 6. Layout of portable laboratory.
image:
ro
Jv A. DOUBLE SIDE DOORS
^>^ \l ^X. (PERMANENTLY CLOSED)
r- 2 x. b TYPICAL ^^ y X.
AIR.
f CONDIT
26Wxl9Hx290|f
NEAR
CEILING L
ELEC. AND L
PT ITMWTMf1 I
« n
3AS CYLJ
STOR.
• RACK
J 2'x4'
\ MAY
Jj
d Jl Vix •
CAB.
FOR
FLAMM.
CHEM.
g'xa'xa1
STOR. |FILE 1
CAB. CAB« INSTR
2'x3'x6'l |A8' LIGHT FIXTJ |
I — % ?LACES |
nr— ^ ..... j i | | |
! INSTR. 1
| 1 RACK 12 !
11 i
GC \ \
t^VE RECORDER
FILE Mcr
CAB /-CRT BKR PANEL GAS COND
1 ' BELOW ^ U2"x36"x
Tfc 1 1 IN N 1 M 10 fl
J-BOXES ON "-AJp" DOOR WINDOW
THIS END \ /
NO PROTRUSIONS ON \ /
SIDES OF CONTAINER ?
81
DOUBLE
END
DOORS
Figure 6. Layout of portable laboratory.
image:
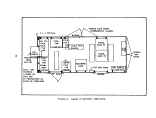 STARBOARD
STACK
4 FT ALUMINA
PROBES
PORT
STACK
15 FT GAS
SAMPLING
PROBE
50 FT X 3/8"
HEAT TRACED
TEFLON LINE
10 FT X 3/8" TEFLON
HEAT TRACED LINE
50 FT X 3/8"
TEFLON HEAT TRACED LINES
U.S.A.F.
BENZENE
TRAIN
SOLENOID VALVE
SORBENT
MODULE
VALVE TRAIN
50 FT X 3/8" TEFLON
HEAT TRACED LINE
OBSERVATION DECK,
ABOVE BRIDGE
PORTABLE
LABORATORY,
MAIN DECK
10 FT X 3/8" TEFLON
HEAT TRACED LINES TO
ON-LINE MONITORS
Figure 7. Configuration of heat traced lines, probes, and sampling trains.
22
image:
STARBOARD
STACK
4 FT ALUMINA
PROBES
PORT
STACK
15 FT GAS
SAMPLING
PROBE
50 FT X 3/8"
HEAT TRACED
TEFLON LINE
10 FT X 3/8" TEFLON
HEAT TRACED LINE
50 FT X 3/8"
TEFLON HEAT TRACED LINES
U.S.A.F.
BENZENE
TRAIN
SOLENOID VALVE
SORBENT
MODULE
VALVE TRAIN
50 FT X 3/8" TEFLON
HEAT TRACED LINE
OBSERVATION DECK,
ABOVE BRIDGE
PORTABLE
LABORATORY,
MAIN DECK
10 FT X 3/8" TEFLON
HEAT TRACED LINES TO
ON-LINE MONITORS
Figure 7. Configuration of heat traced lines, probes, and sampling trains.
22
image:
 PWJBE I k&A* -<WVr HEAT TRACED LIU
' GAS COKDITJOHDi
run satcr
Figure 8. Schematic of on-line monitoring system.
TABLE 4. ON-LINE MONITORS
Species
Analyzed
Hydrocarbons
(HC)
Carbon Monoxide
Mfg and
Model
Beckman 402
Beckman 865
Analyzer Type
FID heated
NDIR
Instrument Range
0.05 ppm to 10% in
8 ranges
0-200 ppm,
(CO)
Carbon Dioxide Beckman 864
(C02)
Oxygen (02) Beckman 742
Oxygen (02) Taylor 0247A
NDIR
Electro-chemical
Paramagnetic
0-2000 ppm,
0 - 2%
0 - 4%, 0 - B%
0 - 15%
0 - 5%, 0 - 10%
0 - 25%
0 - 5%, 0 - 10%
0 - 25%
23
image:
PWJBE I k&A* -<WVr HEAT TRACED LIU
' GAS COKDITJOHDi
run satcr
Figure 8. Schematic of on-line monitoring system.
TABLE 4. ON-LINE MONITORS
Species
Analyzed
Hydrocarbons
(HC)
Carbon Monoxide
Mfg and
Model
Beckman 402
Beckman 865
Analyzer Type
FID heated
NDIR
Instrument Range
0.05 ppm to 10% in
8 ranges
0-200 ppm,
(CO)
Carbon Dioxide Beckman 864
(C02)
Oxygen (02) Beckman 742
Oxygen (02) Taylor 0247A
NDIR
Electro-chemical
Paramagnetic
0-2000 ppm,
0 - 2%
0 - 4%, 0 - B%
0 - 15%
0 - 5%, 0 - 10%
0 - 25%
0 - 5%, 0 - 10%
0 - 25%
23
image:
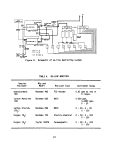 As shown in Figure 8, on-line monitoring was performed on the gas sample stream
after processing by the gas conditioner. In addition, because the Beckman
Model 747 02 analyzer is disabled by HC1 vapors, a soda lime scrubber for acid
gas was utilized in the oxygen analyzer sample line as shown. Typical operating
times were from 1 to 3 hours. The system was then switched to ambient air to
purge the conditioners and instruments for approximately 30 to 60 minutes.
3.1.2 Acquisition of Combustion Effluent Samples
Combustion effluent samples were taken from the starboard incinerator using
a quartz-lined, water-cooled, remotely traversed probe. Flue gases were con-
ducted to the Lear-Siegler sorbent trap and USAF-OEHL benzene impinger trains
through a 15 m heat traced Teflon® line. The control module for the travers-
ing probe and the two sampling trains were located on the observation deck, the
topmost deck of the Vulcanus. This deck is located directly above the bridge
and forward of the funnel (Figure 2).
3.1.2.1 Traversing Probe
The common probe for the two sampling trains was a stainless steel jacketed,
water-cooled probe with a quartz liner as shown schematically in Figure 9. The
liner provided an inert surface for the sample gas, and the cooled stainless
steel jacket shielded this gas from extreme combustion temperatures to quench
any further reactions of the sample constituents. Water cooling also protected
the metal probe from warping or otherwise being degraded in the extreme tempera-
tures. Further cooling of the gas was modulated by aspirating an air/water mix-
ture into the space between the steel jacket and quartz liner. The probe was
approximately 4.6 m in length.
Figure 10 shows the water-cooled traversing probe mount installation for
the Vulcanus. Design features for this probe mount are given below:
1) The tip of each probe was remotely positionable for the amount
of insertion. No adjustment was required for azimuth and
elevation.
2) Insertion positioning accuracy was within ±10 cm by command
from a remote location.
3) The probe mount was attached to the incinerator flange as
shown in Figure 10. The outboard end of the mount assembly
was supported by an A-frame secured to the deck.
24
image:
As shown in Figure 8, on-line monitoring was performed on the gas sample stream
after processing by the gas conditioner. In addition, because the Beckman
Model 747 02 analyzer is disabled by HC1 vapors, a soda lime scrubber for acid
gas was utilized in the oxygen analyzer sample line as shown. Typical operating
times were from 1 to 3 hours. The system was then switched to ambient air to
purge the conditioners and instruments for approximately 30 to 60 minutes.
3.1.2 Acquisition of Combustion Effluent Samples
Combustion effluent samples were taken from the starboard incinerator using
a quartz-lined, water-cooled, remotely traversed probe. Flue gases were con-
ducted to the Lear-Siegler sorbent trap and USAF-OEHL benzene impinger trains
through a 15 m heat traced Teflon® line. The control module for the travers-
ing probe and the two sampling trains were located on the observation deck, the
topmost deck of the Vulcanus. This deck is located directly above the bridge
and forward of the funnel (Figure 2).
3.1.2.1 Traversing Probe
The common probe for the two sampling trains was a stainless steel jacketed,
water-cooled probe with a quartz liner as shown schematically in Figure 9. The
liner provided an inert surface for the sample gas, and the cooled stainless
steel jacket shielded this gas from extreme combustion temperatures to quench
any further reactions of the sample constituents. Water cooling also protected
the metal probe from warping or otherwise being degraded in the extreme tempera-
tures. Further cooling of the gas was modulated by aspirating an air/water mix-
ture into the space between the steel jacket and quartz liner. The probe was
approximately 4.6 m in length.
Figure 10 shows the water-cooled traversing probe mount installation for
the Vulcanus. Design features for this probe mount are given below:
1) The tip of each probe was remotely positionable for the amount
of insertion. No adjustment was required for azimuth and
elevation.
2) Insertion positioning accuracy was within ±10 cm by command
from a remote location.
3) The probe mount was attached to the incinerator flange as
shown in Figure 10. The outboard end of the mount assembly
was supported by an A-frame secured to the deck.
24
image:
 -AIR/WATER MIXTURE RETURN
-AIR/WATER MIXTURE IN
SEA WATER OUT
SEA WATER IN
AIR/WATER MIXTURE OUT
AIR/WATER MIXTURE
IN
SEA WATER IN
SEA WATER RETURN
QUARTZ LINER
PROBE CROSS SECTION
Figure 9. Probe design.
FLANGE ON
INCINERATOR
PROBE
PROBE BASE
CONVEYOR ROLLER
PROBE CARRIAGE
CONVEYOR ROLLER
A-FRAME
SUPPORT
WALL OF
INCINERATOR
Figure 10. Schematic of mount for the movable probe.
25
image:
-AIR/WATER MIXTURE RETURN
-AIR/WATER MIXTURE IN
SEA WATER OUT
SEA WATER IN
AIR/WATER MIXTURE OUT
AIR/WATER MIXTURE
IN
SEA WATER IN
SEA WATER RETURN
QUARTZ LINER
PROBE CROSS SECTION
Figure 9. Probe design.
FLANGE ON
INCINERATOR
PROBE
PROBE BASE
CONVEYOR ROLLER
PROBE CARRIAGE
CONVEYOR ROLLER
A-FRAME
SUPPORT
WALL OF
INCINERATOR
Figure 10. Schematic of mount for the movable probe.
25
image:
 The position of the port in the starboard stack used for inserting the
water-cooled probe is shown in Figure 11, which also shows the locations of the
two ceramic probes. The port for the water-cooled probe was located about
7.6 m above the plane of the burners, about 0.9 m below the top of the stack,
and directly above burner No. 6, so that the traverse diameter was at a
6-degree angle with respect to the centerline of the keel.
Ten sampling points were located along the traverse diameter according to
U.S. EPA Method 1. These points are shown in Figure 12. Because the probe
support I-beam had been extended 1 meter to allow full withdrawal of the probe
from the stack, the last two points could not be reached. The overall sampling
time was about 4 hours, or 30 minutes at each of the eight points that were
accessible.
3.1.2.2 USAF Benzene Impinger Train
The Air Force benzene impinger train apparatus was developed for previous
(2)
incineration tests of Herbicide Orange in 1973V . Equipment and sampling tech-
niques were validated in a test program based upon mass balance of known herbi-
cide constituents fed to this sampling train versus the amount found.
The sampling system used to monitor emissions of herbicide components and
TCDD was a modified version of the one described in Appendix E of Reference 2.
The modification was the insertion of a 15 m heated Teflon® line with temper-
ature monitor, six Greenburg-Smith impingers, a pump and a dry gas meter. Fig-
ure 13 is a schematic of the system. The first two impingers were modified
Greenburg-Smith with a coarse quartz frit added to the end of the nozzle.
These impingers were filled with 350 ml of benzene. The next two impingers,
with the Greenburg-Smith type impactor nozzle removed, were 2/3 filled with
activated charcoal. The fifth impinger contained 240 ml of 30% (w/v) NaOH
to absorb HC1, and the last impinger contained silica gel which was used to
remove hLO from the gas stream.
The system operated at a flow rate of 2 to 3 liters per minute. Sampling
began after the incinerator reached equilibrium while incinerating Herbicide
2. "Final Environmental Statement on Disposition of Orange Herbicide by
Incineration," U.S. Department of the Air Force, November 1974.
26
image:
The position of the port in the starboard stack used for inserting the
water-cooled probe is shown in Figure 11, which also shows the locations of the
two ceramic probes. The port for the water-cooled probe was located about
7.6 m above the plane of the burners, about 0.9 m below the top of the stack,
and directly above burner No. 6, so that the traverse diameter was at a
6-degree angle with respect to the centerline of the keel.
Ten sampling points were located along the traverse diameter according to
U.S. EPA Method 1. These points are shown in Figure 12. Because the probe
support I-beam had been extended 1 meter to allow full withdrawal of the probe
from the stack, the last two points could not be reached. The overall sampling
time was about 4 hours, or 30 minutes at each of the eight points that were
accessible.
3.1.2.2 USAF Benzene Impinger Train
The Air Force benzene impinger train apparatus was developed for previous
(2)
incineration tests of Herbicide Orange in 1973V . Equipment and sampling tech-
niques were validated in a test program based upon mass balance of known herbi-
cide constituents fed to this sampling train versus the amount found.
The sampling system used to monitor emissions of herbicide components and
TCDD was a modified version of the one described in Appendix E of Reference 2.
The modification was the insertion of a 15 m heated Teflon® line with temper-
ature monitor, six Greenburg-Smith impingers, a pump and a dry gas meter. Fig-
ure 13 is a schematic of the system. The first two impingers were modified
Greenburg-Smith with a coarse quartz frit added to the end of the nozzle.
These impingers were filled with 350 ml of benzene. The next two impingers,
with the Greenburg-Smith type impactor nozzle removed, were 2/3 filled with
activated charcoal. The fifth impinger contained 240 ml of 30% (w/v) NaOH
to absorb HC1, and the last impinger contained silica gel which was used to
remove hLO from the gas stream.
The system operated at a flow rate of 2 to 3 liters per minute. Sampling
began after the incinerator reached equilibrium while incinerating Herbicide
2. "Final Environmental Statement on Disposition of Orange Herbicide by
Incineration," U.S. Department of the Air Force, November 1974.
26
image:
 PORT CERAMIC PROBE
C OF KEEL
TARBOARD CERAMIC PROBE
PORT LOCATED
OVER BURNER AND
POINTING TO CENTER
OF INCINERATOR
Figure 11. Sampling port locations.
DISTANCE ROM INSIDE WALL (CM)
132 290
312 264
224
117
76
51 8
28
j
SHIP FOfWARD-
SHIP AFT
Figure 12. Traverse points for stack sampling.
27
image:
PORT CERAMIC PROBE
C OF KEEL
TARBOARD CERAMIC PROBE
PORT LOCATED
OVER BURNER AND
POINTING TO CENTER
OF INCINERATOR
Figure 11. Sampling port locations.
DISTANCE ROM INSIDE WALL (CM)
132 290
312 264
224
117
76
51 8
28
j
SHIP FOfWARD-
SHIP AFT
Figure 12. Traverse points for stack sampling.
27
image:
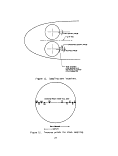 FOiL WRAPPED
THERMOMETER
HEAT TRACED
LINE
COARSE FRITS
NAOH SILICA
BENZENE CHARCOAL NAOH GEL
PUMP
DRY GAS
METER
Figure 13. Schematic of USAF-OEHL benzene impinger sampling train.
Orange and during the operation of the sorbent trap train. Because of the sen-
sitivity of TCDD to UV light, benzene impingers were wrapped in aluminum foil.
Once assembled, they were not reopened. Upon completion of the 1-hour sampling
period, contents of the impingers and connectors were transferred to amber glass
containers. Benzene addition, sample removal, and acetone rinsing were accom-
plished by pouring the solvents through the ball joints using a glass or Teflon®
funnel. All rinses were added down the center nozzle to ensure completeness of
rinsing.
Three USAF train samples were taken during each day of stack sampling.
One sample was taken for TCDD analysis by WSU, one sample for analysis of
2,4-D and 2,4,5-T by BCL, and the third sample for onboard analysis of 2,4-D
and 2,4,5-T by TRW.
At the end of the test, the heat traced Teflon® line and probe were
rinsed with acetone and transferred to separate amber glass containers. All
sample containers were stored aboard ship until the test burn was completed.
After the Vulcanus docked at Johnston Island, samples were shipped by the U.S.
Air Force to the proper destination for subsequent analysis.
3.1.2.3 Sorbent Trap Sampling System
The sorbent trap train was a modification of a standard Lear-Sieg!er U.S.
EPA Method 5 train. This sampling train, which has approximately a 1 cfm
28
image:
FOiL WRAPPED
THERMOMETER
HEAT TRACED
LINE
COARSE FRITS
NAOH SILICA
BENZENE CHARCOAL NAOH GEL
PUMP
DRY GAS
METER
Figure 13. Schematic of USAF-OEHL benzene impinger sampling train.
Orange and during the operation of the sorbent trap train. Because of the sen-
sitivity of TCDD to UV light, benzene impingers were wrapped in aluminum foil.
Once assembled, they were not reopened. Upon completion of the 1-hour sampling
period, contents of the impingers and connectors were transferred to amber glass
containers. Benzene addition, sample removal, and acetone rinsing were accom-
plished by pouring the solvents through the ball joints using a glass or Teflon®
funnel. All rinses were added down the center nozzle to ensure completeness of
rinsing.
Three USAF train samples were taken during each day of stack sampling.
One sample was taken for TCDD analysis by WSU, one sample for analysis of
2,4-D and 2,4,5-T by BCL, and the third sample for onboard analysis of 2,4-D
and 2,4,5-T by TRW.
At the end of the test, the heat traced Teflon® line and probe were
rinsed with acetone and transferred to separate amber glass containers. All
sample containers were stored aboard ship until the test burn was completed.
After the Vulcanus docked at Johnston Island, samples were shipped by the U.S.
Air Force to the proper destination for subsequent analysis.
3.1.2.3 Sorbent Trap Sampling System
The sorbent trap train was a modification of a standard Lear-Sieg!er U.S.
EPA Method 5 train. This sampling train, which has approximately a 1 cfm
28
image:
 (28 £/m) sampling rate capability, is shown schematically in Figure 14. Sev-
eral important features are noteworthy:
• The water-cooled, quartz-lined probe was used to obtain the
sample.
• A solid sorbent trap was located in the sample line downstream
of (after) the heated line and upstream of the first impinger.
This trap was designed to trap the organic constituents. A bed
of granular XAD-2® resin was used for the sorbent. The module
that houses the sorbent trap was water jacketed. Cold water
from the ice bath surrounding the impingers was pumped into
the jacket to maintain a gas out temperature of <160C.
n
^INCINERATOR
WALL
/WATER
COOLED
PROBE
SOFT
TO A. F. BENZENE TRAIN
QUARTZ
LINER
RECIRCULATION PUMP
THERMOMETER
CHECK
VALVE
\
EMPTY
'ORIFICE
THERMOMETERS
EMPTY
7
KOH
BY-PASS /VACUUM
VALVE / GAUGE
SILICA GEL
VACUUM
LINE
DRY TEST METER
AIR-TIGHT
PUMP
Figure 14. Schematic of Lear-Siegler stack sampling train.
29
image:
(28 £/m) sampling rate capability, is shown schematically in Figure 14. Sev-
eral important features are noteworthy:
• The water-cooled, quartz-lined probe was used to obtain the
sample.
• A solid sorbent trap was located in the sample line downstream
of (after) the heated line and upstream of the first impinger.
This trap was designed to trap the organic constituents. A bed
of granular XAD-2® resin was used for the sorbent. The module
that houses the sorbent trap was water jacketed. Cold water
from the ice bath surrounding the impingers was pumped into
the jacket to maintain a gas out temperature of <160C.
n
^INCINERATOR
WALL
/WATER
COOLED
PROBE
SOFT
TO A. F. BENZENE TRAIN
QUARTZ
LINER
RECIRCULATION PUMP
THERMOMETER
CHECK
VALVE
\
EMPTY
'ORIFICE
THERMOMETERS
EMPTY
7
KOH
BY-PASS /VACUUM
VALVE / GAUGE
SILICA GEL
VACUUM
LINE
DRY TEST METER
AIR-TIGHT
PUMP
Figure 14. Schematic of Lear-Siegler stack sampling train.
29
image:
 • Additional large capacity (2-liter) impingers were added to
the train to permit sampling for 4 hours without having to
replace the NaOH acid scrubbing impingers or to remove the
excess moisture trapped in the impingers.
• Because the sorbent material has poor trapping efficiency for
low molecular weight, high volatility organic species in the
GI to GS range, it was necessary to supplement the organic
sorbent trap sample. An integrated, composite grab gas sam-
ple was taken utilizing 28-liter Tedlar® gas sample bags.
The gas sample was taken at the Beckman gas conditioner (Fig-
ure 6) which minimized sample alteration and facilitated the
sampling operation.
The sorbent trap train used during this program has been tested extensively
for trapping organic compounds in general^ ' and organochlorine compounds in
(4 5)
particular. * ' Prior to incinerating Herbicide Orange, Arthur D. Little, Inc.,
tested the sorbent trap with TCDD and found an average recovery efficiency of
65%. ' TRW tested the sorbent trap train with TCDD and found an average col-
lection/recovery efficiency of 62%. The TRW tests are described in detail in
Appendix E.
After test completion, the various samples were taken and preserved as
fol1ows:
• The probe and the heat traced Teflon® sample line between the
probe and the sorbent trap/impinger portion of the sampling
trains were cleaned between tests by rinsing with acetone.
The rinsings and any dislodged particulate were saved and
stored in a cool place in amber glass bottles with Teflon® -
lined caps. These rinses were apportioned on Johnston Island
according to the gas volumes sampled by the respective trains.
• The solid sorbent trap was removed from the train, capped,
and stored prior to shipment to TRW by the U.S. Air Force.
3. "Selection and Evaluation of Sorbent Resins for the collection of Organic
Compounds," Report No. EPA-600/7-77-044, April 1977.
4. "Destroying Chemical Wastes in Commercial Scale Incinerators," Final Report
to U.S. EPA, November 1977, to be published under NTIS.
5. J.F. Clausen, H.J. Fisher, R.J. Johnson E.L. Moon, C.C. Shih, R.F. Tobias,
and C.A. Zee, "At-Sea Incineration of Organochlorine Wastes Onboard the M/T
Vulcanus," Report No. EPA-600/2-77-196, September 1977.
30
image:
• Additional large capacity (2-liter) impingers were added to
the train to permit sampling for 4 hours without having to
replace the NaOH acid scrubbing impingers or to remove the
excess moisture trapped in the impingers.
• Because the sorbent material has poor trapping efficiency for
low molecular weight, high volatility organic species in the
GI to GS range, it was necessary to supplement the organic
sorbent trap sample. An integrated, composite grab gas sam-
ple was taken utilizing 28-liter Tedlar® gas sample bags.
The gas sample was taken at the Beckman gas conditioner (Fig-
ure 6) which minimized sample alteration and facilitated the
sampling operation.
The sorbent trap train used during this program has been tested extensively
for trapping organic compounds in general^ ' and organochlorine compounds in
(4 5)
particular. * ' Prior to incinerating Herbicide Orange, Arthur D. Little, Inc.,
tested the sorbent trap with TCDD and found an average recovery efficiency of
65%. ' TRW tested the sorbent trap train with TCDD and found an average col-
lection/recovery efficiency of 62%. The TRW tests are described in detail in
Appendix E.
After test completion, the various samples were taken and preserved as
fol1ows:
• The probe and the heat traced Teflon® sample line between the
probe and the sorbent trap/impinger portion of the sampling
trains were cleaned between tests by rinsing with acetone.
The rinsings and any dislodged particulate were saved and
stored in a cool place in amber glass bottles with Teflon® -
lined caps. These rinses were apportioned on Johnston Island
according to the gas volumes sampled by the respective trains.
• The solid sorbent trap was removed from the train, capped,
and stored prior to shipment to TRW by the U.S. Air Force.
3. "Selection and Evaluation of Sorbent Resins for the collection of Organic
Compounds," Report No. EPA-600/7-77-044, April 1977.
4. "Destroying Chemical Wastes in Commercial Scale Incinerators," Final Report
to U.S. EPA, November 1977, to be published under NTIS.
5. J.F. Clausen, H.J. Fisher, R.J. Johnson E.L. Moon, C.C. Shih, R.F. Tobias,
and C.A. Zee, "At-Sea Incineration of Organochlorine Wastes Onboard the M/T
Vulcanus," Report No. EPA-600/2-77-196, September 1977.
30
image:
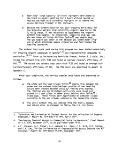 The total volume of liquid in the impingers was measured
to determine moisture corrections for sampled gas volume.
3.2 TEST COMMENTARY AND PROBLEMS
3.2.1 First Burn Commentary and Problems
The Vulcanus arrived at Johnston Island on the morning of 11 July 1977.
For the next 3 days the ship was outfitted with the sampling probes, lines and
other equipment. Part of the outfitting had been accomplished on land prior to
the arrival of the Vulcanus. In particular, the instruments had been checked
out and calibrated. When the ship arrived, the storage container was removed
from the ship and emptied of the probe, A-frame probe support, gas cylinders,
and other equipment. The storage container was then reloaded and the portable
laboratory placed on top. Both containers were then lashed to the deck. A
servicing platform was built below the probe support, and a walkway was con-
structed from the ship's central catwalk to the portable laboratory.
On 13 July the Vulcanus left port for the burn site and arrived early on
14 July. Pre-incineration plankton tows were performed, as described in Sec-
tion 3.3. The incinerators were then heated with fuel oil. Once flame tem-
peratures reached 1280°C, a fuel oil background test was started. Upon comple-
tion, burner changeover to Herbicide Orange was started at 1540 hours on
14 July. Incineration of the first shipload was completed at 0225 hours on
24 July. Post-incineration plankton tows were performed. The Vulcanus returned
to Johnston Island on 25 July.
The weather was pleasant, the seas reasonably calm, and the wind was steady
at 9 to 12 m/sec (18 to 24 knots). The incinerator plume was not visible except
when ammonia was injected at the tops of the incinerators. A series of photo-
graphs were taken by the U.S. Navy during a flyover mission.
Generally, the sampling went smoothly, especially after the first two runs
were completed. By that time, most of the minor problems and procedural diffi-
culties had been eliminated. A persistent problem was the difficulty in attain-
ing effluent sample gas outlet temperatures above 100°C in the traversing probe.
Thermocouples and flow rates were checked to eliminate any faulty readings. It
was finally determined that because the probe was designed for a 5 cfm gas flow,
the low (0.8 to 1 cfm) flow rates exceeded the temperature control design.
31
image:
The total volume of liquid in the impingers was measured
to determine moisture corrections for sampled gas volume.
3.2 TEST COMMENTARY AND PROBLEMS
3.2.1 First Burn Commentary and Problems
The Vulcanus arrived at Johnston Island on the morning of 11 July 1977.
For the next 3 days the ship was outfitted with the sampling probes, lines and
other equipment. Part of the outfitting had been accomplished on land prior to
the arrival of the Vulcanus. In particular, the instruments had been checked
out and calibrated. When the ship arrived, the storage container was removed
from the ship and emptied of the probe, A-frame probe support, gas cylinders,
and other equipment. The storage container was then reloaded and the portable
laboratory placed on top. Both containers were then lashed to the deck. A
servicing platform was built below the probe support, and a walkway was con-
structed from the ship's central catwalk to the portable laboratory.
On 13 July the Vulcanus left port for the burn site and arrived early on
14 July. Pre-incineration plankton tows were performed, as described in Sec-
tion 3.3. The incinerators were then heated with fuel oil. Once flame tem-
peratures reached 1280°C, a fuel oil background test was started. Upon comple-
tion, burner changeover to Herbicide Orange was started at 1540 hours on
14 July. Incineration of the first shipload was completed at 0225 hours on
24 July. Post-incineration plankton tows were performed. The Vulcanus returned
to Johnston Island on 25 July.
The weather was pleasant, the seas reasonably calm, and the wind was steady
at 9 to 12 m/sec (18 to 24 knots). The incinerator plume was not visible except
when ammonia was injected at the tops of the incinerators. A series of photo-
graphs were taken by the U.S. Navy during a flyover mission.
Generally, the sampling went smoothly, especially after the first two runs
were completed. By that time, most of the minor problems and procedural diffi-
culties had been eliminated. A persistent problem was the difficulty in attain-
ing effluent sample gas outlet temperatures above 100°C in the traversing probe.
Thermocouples and flow rates were checked to eliminate any faulty readings. It
was finally determined that because the probe was designed for a 5 cfm gas flow,
the low (0.8 to 1 cfm) flow rates exceeded the temperature control design.
31
image:
 Even using a heated gas stream in the air cooling portion of the probe did not
appreciably change the sample gas outlet temperature. The result of this prob-
lem probably was the collection of a larger fraction of high boiling point
materials in the probe than would be collected at the higher (150° to 200°C)
operating temperature. This problem was circumvented by more frequent rinsing
of the probe. Because the ship was rolling between 10 to 20 degrees from
vertical, the probe rinsing was difficult.
The vast majority of problems were minor. These were:
• Leaks: A leak at the thermocouple joint of the Lear-Siegler
train was corrected with additional sealant. Transportation
had caused a number of fittings in the pneumatic systems of
the portable laboratory to loosen. The loose fittings were
easily tightened.
t Wireless pickup by onboard instruments. Radio communications
were picked up by the test equipment. In particular, the
onboard gas chromatograph was completely inoperative during
voice or continuous wave transmissions.
• Electrical interference: The solenoid valves on the gas
conditioners gave rise to small signals which were picked
up by the on-line instrumentation recorders.
• Plugs in heat traced lines: Condensate and particulate
material shed by the incinerators caused frequent partial
plugs in the heat traced lines. The lines were cleaned
without difficulty.
• Corrosion: The combustion effluent was quite corrosive
because of its HC1 content and corroded stainless steel
fittings; however, no failures occurred.
0 Instrument damage: The gas conditioners were ineffective
in removing condensate from the sample stream. The conden-
sate damaged one of the CO analyzers. Rearrangement of the
inlet and outlet manifolds of the on-line instrumentation
prevented further damage.
There were several instances during the first burn when one or more burners
were briefly extinguished (5 to 60 seconds) by water (determined after the burn
to be 99% water, about 1% sodium salts of 2,4-D and 2,4,5-T, and about 80 ppm
arsenic) floating on top of the herbicide in certain tanks. When flameouts
occurred, pumping from that tank was stopped manually by the Chief Engineer who
switched the incinerators to other waste tanks. The remaining material in that
tank was retained pending resolution after completing the first burn.
32
image:
Even using a heated gas stream in the air cooling portion of the probe did not
appreciably change the sample gas outlet temperature. The result of this prob-
lem probably was the collection of a larger fraction of high boiling point
materials in the probe than would be collected at the higher (150° to 200°C)
operating temperature. This problem was circumvented by more frequent rinsing
of the probe. Because the ship was rolling between 10 to 20 degrees from
vertical, the probe rinsing was difficult.
The vast majority of problems were minor. These were:
• Leaks: A leak at the thermocouple joint of the Lear-Siegler
train was corrected with additional sealant. Transportation
had caused a number of fittings in the pneumatic systems of
the portable laboratory to loosen. The loose fittings were
easily tightened.
t Wireless pickup by onboard instruments. Radio communications
were picked up by the test equipment. In particular, the
onboard gas chromatograph was completely inoperative during
voice or continuous wave transmissions.
• Electrical interference: The solenoid valves on the gas
conditioners gave rise to small signals which were picked
up by the on-line instrumentation recorders.
• Plugs in heat traced lines: Condensate and particulate
material shed by the incinerators caused frequent partial
plugs in the heat traced lines. The lines were cleaned
without difficulty.
• Corrosion: The combustion effluent was quite corrosive
because of its HC1 content and corroded stainless steel
fittings; however, no failures occurred.
0 Instrument damage: The gas conditioners were ineffective
in removing condensate from the sample stream. The conden-
sate damaged one of the CO analyzers. Rearrangement of the
inlet and outlet manifolds of the on-line instrumentation
prevented further damage.
There were several instances during the first burn when one or more burners
were briefly extinguished (5 to 60 seconds) by water (determined after the burn
to be 99% water, about 1% sodium salts of 2,4-D and 2,4,5-T, and about 80 ppm
arsenic) floating on top of the herbicide in certain tanks. When flameouts
occurred, pumping from that tank was stopped manually by the Chief Engineer who
switched the incinerators to other waste tanks. The remaining material in that
tank was retained pending resolution after completing the first burn.
32
image:
 The Plastomatic 2000 control system did not instantaneously shut off the
flow of material to the incinerators. There is a built-in electrical circuit
time delay in this system of unknown but presumably short duration. In addition,
controller thermocouples are imbedded in the incinerator firebrick walls and are
not directly exposed to the flame environment. Consequently, a thermal lag exists
between a decrease in flame temperature and the corresponding reduction in fire-
brick temperature sensed by the controller thermocouple. This thermal lag is
also of unknown duration. Total time lag (electrical plus thermal) of the system
exceeded the brief durations of the flameouts.
During the post-burn debriefing on Johnston Island, procedures were devel-
oped to flash (evaporate) the contaminated water and to avoid plume impingements
caused by flameouts. Full discussions of the flameouts and procedures are given
in Section 5.
3.2.2 Second Burn Commentary and Problems
The M/T Vulcanus sailed from Johnston Island at 0830 hours on 6 August
1977. At 2030 hours on 6 August a star fix indicated the ship was within the
burn zone, and at 2144 hours the first burner was changed from diesel oil feed
to herbicide feed. The on-line monitor system obtained data throughout the
changeover period. The Vulcanus finished the second shipload of herbicide at
2000 hours on 16 August 1977 and docked at Johnston Island at 0800 on 17 August.
Throughout the second burn, weather and sea conditions were much milder
than during the first burn. The wind speed was quite stable, averaging
10 m/sec (20 knots). There were no plume impingements. The procedure devel-
oped after the first burn to prevent flameouts worked satisfactorily. Sampling
and monitoring activities were accomplished as planned.
Inoperative CO and hydrocarbon analyzers had been sent back to the manufac-
turer for refurbishment after the first burn. The instruments were returned in
time for installation before sailing for the second burn. In addition, the U.S.
Air Force supplied a third CO analyzer.
Because of the first burn flameouts, residual material was left in several
tanks (Section 4.1.2). The residuals were sampled and analyzed after returning
to Johnston Island. Most of the residual material was herbicide, but there was
a layer of water (on top of the herbicide) which contained about 1% sodium
33
image:
The Plastomatic 2000 control system did not instantaneously shut off the
flow of material to the incinerators. There is a built-in electrical circuit
time delay in this system of unknown but presumably short duration. In addition,
controller thermocouples are imbedded in the incinerator firebrick walls and are
not directly exposed to the flame environment. Consequently, a thermal lag exists
between a decrease in flame temperature and the corresponding reduction in fire-
brick temperature sensed by the controller thermocouple. This thermal lag is
also of unknown duration. Total time lag (electrical plus thermal) of the system
exceeded the brief durations of the flameouts.
During the post-burn debriefing on Johnston Island, procedures were devel-
oped to flash (evaporate) the contaminated water and to avoid plume impingements
caused by flameouts. Full discussions of the flameouts and procedures are given
in Section 5.
3.2.2 Second Burn Commentary and Problems
The M/T Vulcanus sailed from Johnston Island at 0830 hours on 6 August
1977. At 2030 hours on 6 August a star fix indicated the ship was within the
burn zone, and at 2144 hours the first burner was changed from diesel oil feed
to herbicide feed. The on-line monitor system obtained data throughout the
changeover period. The Vulcanus finished the second shipload of herbicide at
2000 hours on 16 August 1977 and docked at Johnston Island at 0800 on 17 August.
Throughout the second burn, weather and sea conditions were much milder
than during the first burn. The wind speed was quite stable, averaging
10 m/sec (20 knots). There were no plume impingements. The procedure devel-
oped after the first burn to prevent flameouts worked satisfactorily. Sampling
and monitoring activities were accomplished as planned.
Inoperative CO and hydrocarbon analyzers had been sent back to the manufac-
turer for refurbishment after the first burn. The instruments were returned in
time for installation before sailing for the second burn. In addition, the U.S.
Air Force supplied a third CO analyzer.
Because of the first burn flameouts, residual material was left in several
tanks (Section 4.1.2). The residuals were sampled and analyzed after returning
to Johnston Island. Most of the residual material was herbicide, but there was
a layer of water (on top of the herbicide) which contained about 1% sodium
33
image:
 salts of 2,4-D and 2,4,5-T and about 80 ppm of arsenic. This material was
consolidated into tank 6P. In addition, tank 6P was then filled with herbicide
from Johnston Island. It was planned to flash the water layer through the star-
board stack by feeding one burner from tank 6P and the other two burners from
tanks 3S and 3P. It was planned to acquire a stack sample and on-line data dur-
ing the flashing. However, the flashing period lasted only a few minutes.
Therefore, no stack sample was acquired. Flame temperatures were observed with
the optical pyrometer every 5 minutes during this period, and the lowest temper-
ature observed was 1408°C.
There were no major problems encountered during the second burn. The
on-line instrumentation was the source of continuous minor problems, especially
the CO and hydrocarbon analyzers and the gas conditioners. Alteration of the
inlet and outlet manifolds to the on-line instruments prevented the accumulation
of condensate which had damaged instruments during the first burn, but the CO
analyzers tended to be noisier than during the first burn and required more
frequent adjustment and balancing. On 11 August, no on-line data were acquired
because all three CO analyzers were inoperative. The refurbished hydrocarbon
analyzer was inoperative because the proportional temperature controllers oper-
ated improperly (both controllers were on continuously). Parts from the refur-
bished HC analyzer were used to keep the other HC analyzer operating. About
halfway through burn two, one gas conditioner began leaking stack gas into the
portable laboratory. Switching gas conditioners alleviated the problem.
Because of these problems, on-line monitoring was limited to 1 hour per day.
The incinerators shed particulates from the firebrick linings which caused
frequent plugging of the heat-traced lines.
A minor problem was the loss of voice communication with Johnston Island
on 11 August. The M/T Vulcanus could not transmit but could receive voice com-
munications. Thereafter, communication from the M/T Vulcanus was by continuous
wave. Communications were slower and more cumbersome, but no problems were
caused by the loss of voice communication.
3.2.3 Third Burn Commentary and Problems
The M/T Vulcanus sailed from Johnston Island for the third burn at
1905 hours on 23 August 1977 and entered the burn zone at 0600 hours on
34
image:
salts of 2,4-D and 2,4,5-T and about 80 ppm of arsenic. This material was
consolidated into tank 6P. In addition, tank 6P was then filled with herbicide
from Johnston Island. It was planned to flash the water layer through the star-
board stack by feeding one burner from tank 6P and the other two burners from
tanks 3S and 3P. It was planned to acquire a stack sample and on-line data dur-
ing the flashing. However, the flashing period lasted only a few minutes.
Therefore, no stack sample was acquired. Flame temperatures were observed with
the optical pyrometer every 5 minutes during this period, and the lowest temper-
ature observed was 1408°C.
There were no major problems encountered during the second burn. The
on-line instrumentation was the source of continuous minor problems, especially
the CO and hydrocarbon analyzers and the gas conditioners. Alteration of the
inlet and outlet manifolds to the on-line instruments prevented the accumulation
of condensate which had damaged instruments during the first burn, but the CO
analyzers tended to be noisier than during the first burn and required more
frequent adjustment and balancing. On 11 August, no on-line data were acquired
because all three CO analyzers were inoperative. The refurbished hydrocarbon
analyzer was inoperative because the proportional temperature controllers oper-
ated improperly (both controllers were on continuously). Parts from the refur-
bished HC analyzer were used to keep the other HC analyzer operating. About
halfway through burn two, one gas conditioner began leaking stack gas into the
portable laboratory. Switching gas conditioners alleviated the problem.
Because of these problems, on-line monitoring was limited to 1 hour per day.
The incinerators shed particulates from the firebrick linings which caused
frequent plugging of the heat-traced lines.
A minor problem was the loss of voice communication with Johnston Island
on 11 August. The M/T Vulcanus could not transmit but could receive voice com-
munications. Thereafter, communication from the M/T Vulcanus was by continuous
wave. Communications were slower and more cumbersome, but no problems were
caused by the loss of voice communication.
3.2.3 Third Burn Commentary and Problems
The M/T Vulcanus sailed from Johnston Island for the third burn at
1905 hours on 23 August 1977 and entered the burn zone at 0600 hours on
34
image:
 24 August. The changeover from diesel fuel to herbicide was completed by
0800 hours. On-line data were acquired during the changeover in the starboard
stack. At 1608 hours on 2 September, the last of the contaminated herbicide
was burned, and all burners were switched to the uncontaminated (TCDD-free,
detection limit of <0.02 ppm) herbicide that had been used to rinse the ship's
tanks in accordance with the U.S. EPA approved tank rinsing procedure. At
1150 hours on 3 September, the last of the TCDD-free herbicide tank rinsate had
been burned. The Vulcanus then left the burn zone and docked at Johnston Island
at 1330 hours on 4 September 1977.
During the first week of the third burn, the weather was unpleasant, and
the seas were much rougher than during the first and second burns. Rolls
averaged nearly 20 degrees to either side with a 30-degree maximum. All sam-
pling and monitoring activities were accomplished according to plan. Several
times the combustion effluent became visible as a plume for the first time dur-
ing all three burns (except for those times when ammonia was injected into the
stack) possibly because of high humidity from heavy rainfall. Winds were higher
(averaging 12 to 14 m/sec, 24 to 28 knots) than during the previous two burns,
so there were several instances when the plume partially eddied back onto the
ship. During these periods the ship was put under power and oriented to avoid
plume impingement.
Time averaged waste feed rates were not measured during the third burn.
This was because of the rough weather, which prevented accurate gauging as
tanks neared depletion, and to the tank rinsing procedure, which required waste
tanks at near depletion to be filled with rinsing material. An overall waste
feed rate was calculated from the total time of incineration and the volume of
material burned.
In order to reduce TCDD-contaminated herbicide residuals in the waste
tanks, a tank rinsing procedure was developed by the U.S. Air Force and approved
by the U.S. EPA. During the third burn, waste tanks were rinsed serially as
they were depleted by filling with TCDD-free herbicide. The TCDD-free rinsate
(647.4 metric tons) had been loaded at Gulfport into Tank 2C and had not been
incinerated during the first two burns. Used rinsate was incinerated at the end
of the third burn, and the amount of rinsate was included in the third burn
average feed rate.
35
image:
24 August. The changeover from diesel fuel to herbicide was completed by
0800 hours. On-line data were acquired during the changeover in the starboard
stack. At 1608 hours on 2 September, the last of the contaminated herbicide
was burned, and all burners were switched to the uncontaminated (TCDD-free,
detection limit of <0.02 ppm) herbicide that had been used to rinse the ship's
tanks in accordance with the U.S. EPA approved tank rinsing procedure. At
1150 hours on 3 September, the last of the TCDD-free herbicide tank rinsate had
been burned. The Vulcanus then left the burn zone and docked at Johnston Island
at 1330 hours on 4 September 1977.
During the first week of the third burn, the weather was unpleasant, and
the seas were much rougher than during the first and second burns. Rolls
averaged nearly 20 degrees to either side with a 30-degree maximum. All sam-
pling and monitoring activities were accomplished according to plan. Several
times the combustion effluent became visible as a plume for the first time dur-
ing all three burns (except for those times when ammonia was injected into the
stack) possibly because of high humidity from heavy rainfall. Winds were higher
(averaging 12 to 14 m/sec, 24 to 28 knots) than during the previous two burns,
so there were several instances when the plume partially eddied back onto the
ship. During these periods the ship was put under power and oriented to avoid
plume impingement.
Time averaged waste feed rates were not measured during the third burn.
This was because of the rough weather, which prevented accurate gauging as
tanks neared depletion, and to the tank rinsing procedure, which required waste
tanks at near depletion to be filled with rinsing material. An overall waste
feed rate was calculated from the total time of incineration and the volume of
material burned.
In order to reduce TCDD-contaminated herbicide residuals in the waste
tanks, a tank rinsing procedure was developed by the U.S. Air Force and approved
by the U.S. EPA. During the third burn, waste tanks were rinsed serially as
they were depleted by filling with TCDD-free herbicide. The TCDD-free rinsate
(647.4 metric tons) had been loaded at Gulfport into Tank 2C and had not been
incinerated during the first two burns. Used rinsate was incinerated at the end
of the third burn, and the amount of rinsate was included in the third burn
average feed rate.
35
image:
 During the first of the two scheduled stack sampling tests on 24 August,
the purge air line to the on-line instrumentation broke, and the grab gas sam-
ple was not acquired. During this test the only operative hydrocarbon analyzer
ceased functioning. Later it was found that the sample capillary to the flame
detector had become plugged. The sample capillary from the inoperative HC
analyzer was installed, but after a short operating period it too became
plugged. Both HC analyzers were then inoperative. The two operable CO ana-
lyzers had problems, one tended to drift upwards in scale because of condensa-
tion in the sample cell, and the other instrument became too noisy to operate.
On-line monitoring was limited to 1 hour per day because of these problems.
At the end of the first test, the brake on the traversing probe failed,
and the probe moved part way into the stack. Coolant water was still flowing,
and the probe, after removal from the stack, was found to be undamaged. When
not actually in use, the probe was thereafter tied to the probe mount to pre-
clude inadvertent insertion into the stack.
After docking at Johnston Island on 4 September, all TRW equipment was
removed from the M/T Vulcanus for shipment back to the mainland.
3.3 MARINE MONITORING
Plankton samples were collected in the burn site before and after the first
bum. The initial samples were collected near the eastern boundary of the site
on 15 July 1977 before incineration was started. The first plankton tow was
conducted 5 hours before sunrise and the second tow 4 to 5 hours after sunset.
After completing incineration of the first shipload of Herbicide Orange,
plankton tows were made at least 64.3 km (40 mi) downwind of the site of last
burning. The ship was allowed to drift during the post-burn tows. Plankton
tows were conducted 4 to 5 hours after sunrise and 4 to 5 hours after sunset
on 24 July. All plankton samples were placed in quart jars, labeled, and pre-
served with formalin for analysis by the U.S. EPA.
3.4 OTHER SAMPLES AND MEASUREMENTS
3.4.1 Workspace Air Monitors
Workspace air monitors consisted of four MSA personnel samplers stationed
in the dining room, pump room, portable laboratory on the main deck, and
36
image:
During the first of the two scheduled stack sampling tests on 24 August,
the purge air line to the on-line instrumentation broke, and the grab gas sam-
ple was not acquired. During this test the only operative hydrocarbon analyzer
ceased functioning. Later it was found that the sample capillary to the flame
detector had become plugged. The sample capillary from the inoperative HC
analyzer was installed, but after a short operating period it too became
plugged. Both HC analyzers were then inoperative. The two operable CO ana-
lyzers had problems, one tended to drift upwards in scale because of condensa-
tion in the sample cell, and the other instrument became too noisy to operate.
On-line monitoring was limited to 1 hour per day because of these problems.
At the end of the first test, the brake on the traversing probe failed,
and the probe moved part way into the stack. Coolant water was still flowing,
and the probe, after removal from the stack, was found to be undamaged. When
not actually in use, the probe was thereafter tied to the probe mount to pre-
clude inadvertent insertion into the stack.
After docking at Johnston Island on 4 September, all TRW equipment was
removed from the M/T Vulcanus for shipment back to the mainland.
3.3 MARINE MONITORING
Plankton samples were collected in the burn site before and after the first
bum. The initial samples were collected near the eastern boundary of the site
on 15 July 1977 before incineration was started. The first plankton tow was
conducted 5 hours before sunrise and the second tow 4 to 5 hours after sunset.
After completing incineration of the first shipload of Herbicide Orange,
plankton tows were made at least 64.3 km (40 mi) downwind of the site of last
burning. The ship was allowed to drift during the post-burn tows. Plankton
tows were conducted 4 to 5 hours after sunrise and 4 to 5 hours after sunset
on 24 July. All plankton samples were placed in quart jars, labeled, and pre-
served with formalin for analysis by the U.S. EPA.
3.4 OTHER SAMPLES AND MEASUREMENTS
3.4.1 Workspace Air Monitors
Workspace air monitors consisted of four MSA personnel samplers stationed
in the dining room, pump room, portable laboratory on the main deck, and
36
image:
 incinerator room. A 3 mm ID glass tube, filled with Chromosorb 102® for a length
of 25 mm, was attached to each sampler and used to sample air for 2,4-D and
2,4,5-T analysis. This technique for sampling air for 2,4-D and 2,4,5-T had
been previously tested by USAF-OEHL/2'
The practical life of a pump battery was 12 hours on one charge. The need
for changing pumps was eliminated by using transformers (220V/110V) so the
pumps could be operated by the ship's power. The monitor in the pump room could
not be operated from a transformer because of maritime regulations. During the
first burn, the tubes were changed every 12 hours. One the second and third
burns the tubes were changed every 24 hours. Selected tubes were analyzed on
Johnston Island after each burn, the remaining tubes have been archived.
3.4.2 Wipe Samples
Wipes of selected areas of the ship were made to monitor how effectively
the boundary-isolation plan was keeping herbicide from living areas. Using
11-cm diameter Whatman 41® filter paper discs, areas about 1 square meter were
wiped. The wipes were extracted with benzene, and the extracts were analyzed
with the onboard gas chromatograph.
3.4.3 Air and Impinger Samples
Workspace air at various positions on the ship was sampled using 10 ml gas
sampling syringes, and analyses were performed with the onboard gas chromato-
graph. In addition, samples of the benzene impingers were analyzed to deter-
mine concentrations of 2»4-D and 2,4,5-T in the combustion effluent.
3.4.4 Waste Feed Rate
The sealed waste gauging system installed for the Herbicide Orange burns
was not satisfactory for measuring waste feed rates because it gauged only the
top one-third of each tank. In addition, it could not compensate for the ship's
rolling which caused tank contents to slosh. A manual method of gauging tank
contents was also unsatisfactory because it could not compensate for the ship's
rolling.
Waste feed rates were determined, therefore, by measuring the time to
deplete each tank. The volume of each tank was known, and the amount of waste
loaded into each tank was measured after loading. During incineration, the
37
image:
incinerator room. A 3 mm ID glass tube, filled with Chromosorb 102® for a length
of 25 mm, was attached to each sampler and used to sample air for 2,4-D and
2,4,5-T analysis. This technique for sampling air for 2,4-D and 2,4,5-T had
been previously tested by USAF-OEHL/2'
The practical life of a pump battery was 12 hours on one charge. The need
for changing pumps was eliminated by using transformers (220V/110V) so the
pumps could be operated by the ship's power. The monitor in the pump room could
not be operated from a transformer because of maritime regulations. During the
first burn, the tubes were changed every 12 hours. One the second and third
burns the tubes were changed every 24 hours. Selected tubes were analyzed on
Johnston Island after each burn, the remaining tubes have been archived.
3.4.2 Wipe Samples
Wipes of selected areas of the ship were made to monitor how effectively
the boundary-isolation plan was keeping herbicide from living areas. Using
11-cm diameter Whatman 41® filter paper discs, areas about 1 square meter were
wiped. The wipes were extracted with benzene, and the extracts were analyzed
with the onboard gas chromatograph.
3.4.3 Air and Impinger Samples
Workspace air at various positions on the ship was sampled using 10 ml gas
sampling syringes, and analyses were performed with the onboard gas chromato-
graph. In addition, samples of the benzene impingers were analyzed to deter-
mine concentrations of 2»4-D and 2,4,5-T in the combustion effluent.
3.4.4 Waste Feed Rate
The sealed waste gauging system installed for the Herbicide Orange burns
was not satisfactory for measuring waste feed rates because it gauged only the
top one-third of each tank. In addition, it could not compensate for the ship's
rolling which caused tank contents to slosh. A manual method of gauging tank
contents was also unsatisfactory because it could not compensate for the ship's
rolling.
Waste feed rates were determined, therefore, by measuring the time to
deplete each tank. The volume of each tank was known, and the amount of waste
loaded into each tank was measured after loading. During incineration, the
37
image:
 times required to pump out the tanks were measured. During the first burn, as
described in Section 3.2, some of the tanks were not completely emptied. The
contents of these tanks were gauged after returning to Johnston Island, and the
feed rates were corrected for residual waste. On the second and third burns,
the tanks were emptied to near dryness, which meant residuals of 20 to 50 liters
according to the ship's Chief Engineer.
3.4.5 Temperature Measurements
Permit conditions required hourly notation of the temperatures of the con-
troller and indicator thermocouples. The ship's engineering staff entered
temperature readings in the log and made them available to test personnel.
Once each day the flame temperature of each incinerator was measured with an
optical pyrometer.
3.5 COMBUSTION EFFLUENT SAMPLES ACQUIRED
Samples acquired onboard the M/T Vulcanus relating to the combustion proc-
ess were: heat-traced line rinses, probe rinses, sorbent traps, benzene impin-
gers, composite feeds, grab gas bags, and burner residues. Probe rinses, heat-
traced line rinses, sorbent traps, and benzene impingers were combustion efflu-
ent samples. Composite feed samples were necessary to calculate destruction
efficiencies for the combustion process. Burner residue samples were acquired
because they may be a waste disposal problem. On the M/T Vulcanus, however,
burner residues were returned to the incinerator, so that they were neither a
disposal problem nor an emission. Table 5 shows the dates of the tests, the
sampling times, volumes of dry gas acquired, moisture content of the gas sam-
ples, average waste feed rates for each test, and the samples which were taken.
Initially, it was intended to rinse the probe only once after each shipload was
incinerated. It was decided after the first two tests during the first burn to
rinse the probe after each test, if practicable; it was thought, as discussed in
Section 3.2.1, that excess condensation might be occurring in the probe because
of lower than desirable sample outlet gas temperatures.
The Lear-Siegler and USAF-OEHL sampling trains were operated simultaneously,
pulling combustion effluent through the same probe and heat-traced line. One
3 3
Lear-Siegler sample of about 4 m and three impinger samples of about 0.1 m
each were acquired per test. Thus, a complete sorbent trap or impinger sample
38
image:
times required to pump out the tanks were measured. During the first burn, as
described in Section 3.2, some of the tanks were not completely emptied. The
contents of these tanks were gauged after returning to Johnston Island, and the
feed rates were corrected for residual waste. On the second and third burns,
the tanks were emptied to near dryness, which meant residuals of 20 to 50 liters
according to the ship's Chief Engineer.
3.4.5 Temperature Measurements
Permit conditions required hourly notation of the temperatures of the con-
troller and indicator thermocouples. The ship's engineering staff entered
temperature readings in the log and made them available to test personnel.
Once each day the flame temperature of each incinerator was measured with an
optical pyrometer.
3.5 COMBUSTION EFFLUENT SAMPLES ACQUIRED
Samples acquired onboard the M/T Vulcanus relating to the combustion proc-
ess were: heat-traced line rinses, probe rinses, sorbent traps, benzene impin-
gers, composite feeds, grab gas bags, and burner residues. Probe rinses, heat-
traced line rinses, sorbent traps, and benzene impingers were combustion efflu-
ent samples. Composite feed samples were necessary to calculate destruction
efficiencies for the combustion process. Burner residue samples were acquired
because they may be a waste disposal problem. On the M/T Vulcanus, however,
burner residues were returned to the incinerator, so that they were neither a
disposal problem nor an emission. Table 5 shows the dates of the tests, the
sampling times, volumes of dry gas acquired, moisture content of the gas sam-
ples, average waste feed rates for each test, and the samples which were taken.
Initially, it was intended to rinse the probe only once after each shipload was
incinerated. It was decided after the first two tests during the first burn to
rinse the probe after each test, if practicable; it was thought, as discussed in
Section 3.2.1, that excess condensation might be occurring in the probe because
of lower than desirable sample outlet gas temperatures.
The Lear-Siegler and USAF-OEHL sampling trains were operated simultaneously,
pulling combustion effluent through the same probe and heat-traced line. One
3 3
Lear-Siegler sample of about 4 m and three impinger samples of about 0.1 m
each were acquired per test. Thus, a complete sorbent trap or impinger sample
38
image:
 TABLE 5. SUMMARY OF COMBUSTION EFFLUENT SAMPLES ACQUIRED
CO
Test Dates, 1977
Sampling Time,
min
Volume Sampled,
dry m'
Volume % Moisture
Average Feed Rate,
metric tons/hr*
Samples Taken:
Composite Feed
Sorbent Trap
Line Rinse
Probe Rinse
Impingers
Silica Gel
Grab Gas
Burner Residue
7/14 7/15
212 255
3.93 6.20
6.9 +
6.05 6.05
X X
X X
X X
± ±
X X
X X
± ±
± ±
First Burn
7/16 7/18
240 192
6.09 5.84
10.4 +
7.03 7.46
X X
X X
X X
x ±
X X
X X
X ±
± ±
Second Burn
7/19 7/23 8/7
240 240 195
5.86 5.23 5.03
+ + +
6.99 7.28 6.85
XXX
XXX
XXX
XXX
XXX
XXX
X ± X
± X ±
8/8
238
6.30
+
6.85
X
X
X
X
X
X
X
X
8/10 8/13
231 250
3.93 8.83
+ 6.9
7.38 7.16
X X
X X
X X
X X
X X
X X
X X
± ±
Third Burn
8/14 8/24 8/28
221 238 221
5.99 2.81 6.88
+ + 8.4
6.91 7.60 5.90
XXX
XXX
XXX
XXX
XXX
X ± X
X ± X
X ± ±
*Metr1c tons per hour per Incinerator.
•(•Samples from these tests were archived and not analyzed,
±Samples not acquired.
image:
TABLE 5. SUMMARY OF COMBUSTION EFFLUENT SAMPLES ACQUIRED
CO
Test Dates, 1977
Sampling Time,
min
Volume Sampled,
dry m'
Volume % Moisture
Average Feed Rate,
metric tons/hr*
Samples Taken:
Composite Feed
Sorbent Trap
Line Rinse
Probe Rinse
Impingers
Silica Gel
Grab Gas
Burner Residue
7/14 7/15
212 255
3.93 6.20
6.9 +
6.05 6.05
X X
X X
X X
± ±
X X
X X
± ±
± ±
First Burn
7/16 7/18
240 192
6.09 5.84
10.4 +
7.03 7.46
X X
X X
X X
x ±
X X
X X
X ±
± ±
Second Burn
7/19 7/23 8/7
240 240 195
5.86 5.23 5.03
+ + +
6.99 7.28 6.85
XXX
XXX
XXX
XXX
XXX
XXX
X ± X
± X ±
8/8
238
6.30
+
6.85
X
X
X
X
X
X
X
X
8/10 8/13
231 250
3.93 8.83
+ 6.9
7.38 7.16
X X
X X
X X
X X
X X
X X
X X
± ±
Third Burn
8/14 8/24 8/28
221 238 221
5.99 2.81 6.88
+ + 8.4
6.91 7.60 5.90
XXX
XXX
XXX
XXX
XXX
X ± X
X ± X
X ± ±
*Metr1c tons per hour per Incinerator.
•(•Samples from these tests were archived and not analyzed,
±Samples not acquired.
image:
 included a portion of the probe and heat-traced line rinses for that test. The
apportionment of the probe and heat-traced line rinses was based on the amount
of stack effluent acquired in a given sorbent trap or impinger sample. Thus, if
a Lear-Siegler sorbent trap sample represented 94% of the total volume of efflu-
ent sampled, then 94% each of the probe and heat-traced line rinses for that
test were taken as part of that Lear-Siegler train sample in order to obtain
proper mass discharge rates.
Table 6 gives the total volume of effluent sampled in each test, volumes
of each probe and heat-traced line rinse, volumes of effluent represented by
each sorbent trap and impinger sample, and portions of each probe and heat-
traced line rinse which are part of each sorbent trap and impinger sample.
3.6 SAMPLE NOMENCLATURE
The variety and number of samples acquired onboard the M/T Vulcanus neces-
sitated a compact nomenclature. Table 7 lists the sample labeling scheme used
on the ship and in the subsequent analyses. These sample designators are used
in presenting analytical results. A typical sample name might be HO-1-ST-714-F.
This designation means:
• HO - Herbicide Orange program
• 1 - First shipload (first burn)
• ST - Sorbent trap sample
0 714 - Date sample was taken, i.e., 7/14/77
t F - Fuel oil was being burned.
3.7 WASTE DESCRIPTION
In addition to Herbicide Orange, the waste incinerated contained diesel fuel,
which was used to rinse drums and other equipment used in dedrumming and handling
the herbicide, and water-contaminated herbicide. Table 8 lists physical proper-
(2} (2^
tiesv ' of Herbicide Orange. Table 9 lists propertiesv ' of the ingredient
(?)
esters of Herbicide Orange. Table 10 lists propertiesv ' of TCDD. Table 11 shows
the chemical composition of several lots of Herbicide Orange resulting from
40
image:
included a portion of the probe and heat-traced line rinses for that test. The
apportionment of the probe and heat-traced line rinses was based on the amount
of stack effluent acquired in a given sorbent trap or impinger sample. Thus, if
a Lear-Siegler sorbent trap sample represented 94% of the total volume of efflu-
ent sampled, then 94% each of the probe and heat-traced line rinses for that
test were taken as part of that Lear-Siegler train sample in order to obtain
proper mass discharge rates.
Table 6 gives the total volume of effluent sampled in each test, volumes
of each probe and heat-traced line rinse, volumes of effluent represented by
each sorbent trap and impinger sample, and portions of each probe and heat-
traced line rinse which are part of each sorbent trap and impinger sample.
3.6 SAMPLE NOMENCLATURE
The variety and number of samples acquired onboard the M/T Vulcanus neces-
sitated a compact nomenclature. Table 7 lists the sample labeling scheme used
on the ship and in the subsequent analyses. These sample designators are used
in presenting analytical results. A typical sample name might be HO-1-ST-714-F.
This designation means:
• HO - Herbicide Orange program
• 1 - First shipload (first burn)
• ST - Sorbent trap sample
0 714 - Date sample was taken, i.e., 7/14/77
t F - Fuel oil was being burned.
3.7 WASTE DESCRIPTION
In addition to Herbicide Orange, the waste incinerated contained diesel fuel,
which was used to rinse drums and other equipment used in dedrumming and handling
the herbicide, and water-contaminated herbicide. Table 8 lists physical proper-
(2} (2^
tiesv ' of Herbicide Orange. Table 9 lists propertiesv ' of the ingredient
(?)
esters of Herbicide Orange. Table 10 lists propertiesv ' of TCDD. Table 11 shows
the chemical composition of several lots of Herbicide Orange resulting from
40
image:
 TABLE 6. TRAIN SAMPLE VOLUMES AND APPORTIONMENT OF PROBE AND LINE RINSES
Burn
1
1
1
1
1
1
1
1
2
2
2
2
2
3
3
Date
7/14/77
7/15/77
7/16/77
7/17/77
7/18/77
7/19/77
7/22/77
7/23/77
8/7/77
8/8/77
8/10/77
8/13/77
8/14/77
8/24/77
8/28/77
Analyze
Sampl es
Yes
No
Yes
No
No
No
No
No
No
Yes
No
No
Yes
Total Gas Probe Rinse
Volume Volume
m + ml
4.2667
6.5703
6.4513
17.2883
6.2105
6.2057
12.4162
5.5708
5.7876
6.9367
4.6008
9.7710
6.5367
3.4951
7.6127
330
310
340
380
380
440
440
450
423
423
Line Rinse
Volume
ml
2280
2195
2320
2175
2385
1565
1290
2030
2980
1140
2285
1962
1642
Lear-S1egler Train
Gas Volume
m3
3.9262
6.2012
6.0914
16.2188
5.8449
5.8618
11.7067
5.2380
5.0346
6.3016
3.9348
8.8333
5.9894
2.8136
6.8847
Probe Rinse
% Split, mi
92.02
94.38
94.42
93.81
94.11
94.46
94.29
94.03
86.99
90.84
85.54
90.40
91.63
80.5
90.43
74.9
11.9
116
310
146
146
292
320
331
345
376
398
412
341
383
Line Rinse
Split, mil
2098
2082
2191
2047
2253
1472
1122
1844
2549
1031
2094
1579
1485
Gas Volume
m3
0.1129
0.1240
0.1179
0.3548
0.1161
0.1263
0.2424
0.1142
0.2305
0. 1962
0.2085
0.3249
0.1913
0.2247
0.2266
Wright State Impinger
Probe Rinse
% Split, mi
2.65
1.89
1.83
2.05
1.87
2.04
1.95
2.05
3.98
2.83
4.53
3.33
2.93
6.43
2.98
2.16
2.37
2.25
6.77
2.90
3.16
6.06
6.97
15.1
10.7
19.9
14.6
13.2
27.2
12.6
Line Rinse
Split, mi
60.42
41.49
42.46
40.67
48:65
32.08
51.4
57.4
135.0
37.9
66.9
126
48.9
(continued)
*Sample calculation 1n Appendix F.I.
+Gas volumes have been corrected to 20°C and 1013.2 mbar pressure.
image:
TABLE 6. TRAIN SAMPLE VOLUMES AND APPORTIONMENT OF PROBE AND LINE RINSES
Burn
1
1
1
1
1
1
1
1
2
2
2
2
2
3
3
Date
7/14/77
7/15/77
7/16/77
7/17/77
7/18/77
7/19/77
7/22/77
7/23/77
8/7/77
8/8/77
8/10/77
8/13/77
8/14/77
8/24/77
8/28/77
Analyze
Sampl es
Yes
No
Yes
No
No
No
No
No
No
Yes
No
No
Yes
Total Gas Probe Rinse
Volume Volume
m + ml
4.2667
6.5703
6.4513
17.2883
6.2105
6.2057
12.4162
5.5708
5.7876
6.9367
4.6008
9.7710
6.5367
3.4951
7.6127
330
310
340
380
380
440
440
450
423
423
Line Rinse
Volume
ml
2280
2195
2320
2175
2385
1565
1290
2030
2980
1140
2285
1962
1642
Lear-S1egler Train
Gas Volume
m3
3.9262
6.2012
6.0914
16.2188
5.8449
5.8618
11.7067
5.2380
5.0346
6.3016
3.9348
8.8333
5.9894
2.8136
6.8847
Probe Rinse
% Split, mi
92.02
94.38
94.42
93.81
94.11
94.46
94.29
94.03
86.99
90.84
85.54
90.40
91.63
80.5
90.43
74.9
11.9
116
310
146
146
292
320
331
345
376
398
412
341
383
Line Rinse
Split, mil
2098
2082
2191
2047
2253
1472
1122
1844
2549
1031
2094
1579
1485
Gas Volume
m3
0.1129
0.1240
0.1179
0.3548
0.1161
0.1263
0.2424
0.1142
0.2305
0. 1962
0.2085
0.3249
0.1913
0.2247
0.2266
Wright State Impinger
Probe Rinse
% Split, mi
2.65
1.89
1.83
2.05
1.87
2.04
1.95
2.05
3.98
2.83
4.53
3.33
2.93
6.43
2.98
2.16
2.37
2.25
6.77
2.90
3.16
6.06
6.97
15.1
10.7
19.9
14.6
13.2
27.2
12.6
Line Rinse
Split, mi
60.42
41.49
42.46
40.67
48:65
32.08
51.4
57.4
135.0
37.9
66.9
126
48.9
(continued)
*Sample calculation 1n Appendix F.I.
+Gas volumes have been corrected to 20°C and 1013.2 mbar pressure.
image:
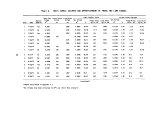 TABLE 6. (continued)
ro
Burn Date
1
1
1
1
1
1
1
1
2
2
2
2
2
3
3
7/14/77
7/15/77
7/16/77
7/17/77
7 7 18/77
7/19/77
7/22/77
7/23/77
8/7/77
8/8/77
8/10/77
8/13/77
8/14/77
8/24/77
8/28/77
Analyze
Sampl es
Yes
No
Yes
No
No
No
No
No
No
Yes
No
No
Yes
Total Gas
Vol ume
4.2667
6.5703
6.4513
17.2883
6.2105
6.2057
12.4162
5.5708
5.7876
6.9367
4.6008
9.7710
6.5367
3.4951
7.6127
Probe Rinse
Volume
mi
330
310
340
380
380
440
440
450
423
423
Line Rinse
Volume
mi
2280
2195
2320
2175
2385
1565
1290
2030
2980
1140
2285
1962
1642
TRW Impinger
Gas Volume
m3
0.1160
0.1189
0.1209
0.3558
0.1260
0.1117
0.2377
0.1128
0.2701
0.2185
0.2263
0.334
0.1774
0.2305
0.2203
Probe Rinse
* Split, ml
2.72
1.81
1.87
2.06
2.03
1.80
1.91
2.02
4.67
3.15
4.92
3.42
2.71
6.6
2.89
2.21
2.27
2.31
6.79
3.15
2.78
5.93
6.87
17.7
12.0
21.6
15.0
12.2
27.9
12.2
Line Rinse
Split, mi
62.02
39.73
43.58
44.15
42.93
31.61
60.2
63.9
147.0
39.0
61.9
129.0
47.5
Battelle/USAF Impinger
Gas Volume ppobe R1nse
«T % Split, mi
0.1116
0.1262
0.1211
0.3589
0.1235
0.1059
0.2294
0.1058
0.2524
0.2210
0.2304
0.2788
0.1786
0.2263
0.2811
2.62
1.92
1.88
2.08
1.99
1.71
1.85
1.90
4.36
3.19
5.01
2.85
2.73
6.48
3.69
2.13
2.41
2.31
6.85
3.08
2.65
5.73
6.46
16.6
12.2
22.0
12.6
12.3
27.4
15.6
Line Rinse
Split, mil
59.74
42.14
43.62
43.28
40.78
29.74
56.3
64.8
149.0
32.5
62.4
127
60.6
*Sample calculation in Appendix F.I.
•(•Gas volumes have been corrected to 20°C and 1013.2 mbar pressure.
image:
TABLE 6. (continued)
ro
Burn Date
1
1
1
1
1
1
1
1
2
2
2
2
2
3
3
7/14/77
7/15/77
7/16/77
7/17/77
7 7 18/77
7/19/77
7/22/77
7/23/77
8/7/77
8/8/77
8/10/77
8/13/77
8/14/77
8/24/77
8/28/77
Analyze
Sampl es
Yes
No
Yes
No
No
No
No
No
No
Yes
No
No
Yes
Total Gas
Vol ume
4.2667
6.5703
6.4513
17.2883
6.2105
6.2057
12.4162
5.5708
5.7876
6.9367
4.6008
9.7710
6.5367
3.4951
7.6127
Probe Rinse
Volume
mi
330
310
340
380
380
440
440
450
423
423
Line Rinse
Volume
mi
2280
2195
2320
2175
2385
1565
1290
2030
2980
1140
2285
1962
1642
TRW Impinger
Gas Volume
m3
0.1160
0.1189
0.1209
0.3558
0.1260
0.1117
0.2377
0.1128
0.2701
0.2185
0.2263
0.334
0.1774
0.2305
0.2203
Probe Rinse
* Split, ml
2.72
1.81
1.87
2.06
2.03
1.80
1.91
2.02
4.67
3.15
4.92
3.42
2.71
6.6
2.89
2.21
2.27
2.31
6.79
3.15
2.78
5.93
6.87
17.7
12.0
21.6
15.0
12.2
27.9
12.2
Line Rinse
Split, mi
62.02
39.73
43.58
44.15
42.93
31.61
60.2
63.9
147.0
39.0
61.9
129.0
47.5
Battelle/USAF Impinger
Gas Volume ppobe R1nse
«T % Split, mi
0.1116
0.1262
0.1211
0.3589
0.1235
0.1059
0.2294
0.1058
0.2524
0.2210
0.2304
0.2788
0.1786
0.2263
0.2811
2.62
1.92
1.88
2.08
1.99
1.71
1.85
1.90
4.36
3.19
5.01
2.85
2.73
6.48
3.69
2.13
2.41
2.31
6.85
3.08
2.65
5.73
6.46
16.6
12.2
22.0
12.6
12.3
27.4
15.6
Line Rinse
Split, mil
59.74
42.14
43.62
43.28
40.78
29.74
56.3
64.8
149.0
32.5
62.4
127
60.6
*Sample calculation in Appendix F.I.
•(•Gas volumes have been corrected to 20°C and 1013.2 mbar pressure.
image:
 TABLE 7. HERBICIDE ORANGE PROGRAM SAMPLE LABELING SCHEME
.- .
Program
Name Sh1 pi oad
HO 1
2
3
Sample
Designator*
ST
BI
CF
LR
WS
EP
EW
AM
G6
BR
PR
SW
AS
SG
Start Nature
Date? of Sample
F (Fuel)
H (Herbicide)
A (Acetone)
B (Benzene)
Location Where
Sample Taken
I (Incinerator)
G (Galley)
Q (Quarters)
C (Container)
S (Stack)
P (Pump Room)
Destination
of Sample
T (TRW)
W (WSU)
B (BCL)
S (Ship)
Other
Identifier
Miscellaneous
*ST = Lear-S1egler sorbent trap
BI - USAF-OEHL benzene Implnger
CF - Composite feed
LR = Heat traced line rinse
WS •= Wipe sample
EP = EPA plankton sample
EW = EPA sea water sample
tDate of start of test, e.g., 28 July 1977 = 728.
AM = Ambient mon1tor,_Chromosorb 102®tubes
GG = Grab gas, Tedlar^bag
BR = Burner head residue
PR = Probe rinse
SW = Ship's water
AS = A1r sample
SG - Silica gel
multiple drum analyses. The data in this table were calculated from results
given in Reference 6 and apply only to Gulfport stocks.
The permit for the second and third burns (U.S. EPA Special Permit
No. 770DH001S) allowed other wastes, stored in old Herbicide Orange drums to
be incinerated on the third burn provided that appropriate data were supplied
to U.S. EPA and that subsequently their approval was granted. Table 12 lists
pertinent data on drums of other wastes which were loaded for the third burn
and which were authorized for incineration. '
(7)
B.M. Hughes, D.C. Fee, M.L. Taylor, T.O. Tiernan, C.E. Hill, Jr., and
R.L.C. Wu, "Analytical Methodology for Herbicide Orange, Volume 1.
Determination of Chemical Composition," from Tables XVI to XIX, pp. 73-79,
Final Report to U.S. Air Force Systems Command, No. ARL TR 75-0110,
May 1975.
Addendum to U.S. EPA Special Permit No. 770DH001S.
43
image:
TABLE 7. HERBICIDE ORANGE PROGRAM SAMPLE LABELING SCHEME
.- .
Program
Name Sh1 pi oad
HO 1
2
3
Sample
Designator*
ST
BI
CF
LR
WS
EP
EW
AM
G6
BR
PR
SW
AS
SG
Start Nature
Date? of Sample
F (Fuel)
H (Herbicide)
A (Acetone)
B (Benzene)
Location Where
Sample Taken
I (Incinerator)
G (Galley)
Q (Quarters)
C (Container)
S (Stack)
P (Pump Room)
Destination
of Sample
T (TRW)
W (WSU)
B (BCL)
S (Ship)
Other
Identifier
Miscellaneous
*ST = Lear-S1egler sorbent trap
BI - USAF-OEHL benzene Implnger
CF - Composite feed
LR = Heat traced line rinse
WS •= Wipe sample
EP = EPA plankton sample
EW = EPA sea water sample
tDate of start of test, e.g., 28 July 1977 = 728.
AM = Ambient mon1tor,_Chromosorb 102®tubes
GG = Grab gas, Tedlar^bag
BR = Burner head residue
PR = Probe rinse
SW = Ship's water
AS = A1r sample
SG - Silica gel
multiple drum analyses. The data in this table were calculated from results
given in Reference 6 and apply only to Gulfport stocks.
The permit for the second and third burns (U.S. EPA Special Permit
No. 770DH001S) allowed other wastes, stored in old Herbicide Orange drums to
be incinerated on the third burn provided that appropriate data were supplied
to U.S. EPA and that subsequently their approval was granted. Table 12 lists
pertinent data on drums of other wastes which were loaded for the third burn
and which were authorized for incineration. '
(7)
B.M. Hughes, D.C. Fee, M.L. Taylor, T.O. Tiernan, C.E. Hill, Jr., and
R.L.C. Wu, "Analytical Methodology for Herbicide Orange, Volume 1.
Determination of Chemical Composition," from Tables XVI to XIX, pp. 73-79,
Final Report to U.S. Air Force Systems Command, No. ARL TR 75-0110,
May 1975.
Addendum to U.S. EPA Special Permit No. 770DH001S.
43
image:
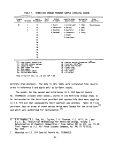 TABLE 8. GENERAL CHEMICAL AND PHYSICAL PROPERTIES of
HERBICIDE ORANGE*
Property
Orange
Orange II
Heat Value
Physical State
Color
Appearance
Solubility
Flash Point
Specific Gravity, 25°C
Weight (Ib/gal)
Total ester at 20UC
Vapor Pressure (30°C)
Viscosity, centipoise
20°C
30°C
Theoretical % Weight
Carbon
Chlorine
Oxygen
Hydrogen
Free Acid (by weight)
Corrosiveness
10,017 Btu/lb
Liquid at room temperature
Reddish brown to straw
Dark, rust colored liquid of
oily consistency
Soluble in diesel fuel and
most organic solvents.
Insoluble in water.
146°C (295°F)
1.275 to 1.295
10.7
-4
3.6 x 10 ^ mm Hg
46
24
49.11
29.87
16.37
4.65
0.5% maximum
unknown
1.220 - 1.242
10.2
59.12
27.27
15.20
5.41
0.5% maximum
Noncorrosive to most metals. Deleterious to
some paints, natural rubber, and neoprene.
Teflon ® , Viton ® , polyethylene, and butyl
rubber are resistant.
* Adapted from Reference 2.
+ These properties of Orange II were not determined.
44
image:
TABLE 8. GENERAL CHEMICAL AND PHYSICAL PROPERTIES of
HERBICIDE ORANGE*
Property
Orange
Orange II
Heat Value
Physical State
Color
Appearance
Solubility
Flash Point
Specific Gravity, 25°C
Weight (Ib/gal)
Total ester at 20UC
Vapor Pressure (30°C)
Viscosity, centipoise
20°C
30°C
Theoretical % Weight
Carbon
Chlorine
Oxygen
Hydrogen
Free Acid (by weight)
Corrosiveness
10,017 Btu/lb
Liquid at room temperature
Reddish brown to straw
Dark, rust colored liquid of
oily consistency
Soluble in diesel fuel and
most organic solvents.
Insoluble in water.
146°C (295°F)
1.275 to 1.295
10.7
-4
3.6 x 10 ^ mm Hg
46
24
49.11
29.87
16.37
4.65
0.5% maximum
unknown
1.220 - 1.242
10.2
59.12
27.27
15.20
5.41
0.5% maximum
Noncorrosive to most metals. Deleterious to
some paints, natural rubber, and neoprene.
Teflon ® , Viton ® , polyethylene, and butyl
rubber are resistant.
* Adapted from Reference 2.
+ These properties of Orange II were not determined.
44
image:
 TABLE 9. GENERAL PROPERTIES OF INGREDIENT ESTERS OF
HERBICIDE ORANGE*
Property N-Butyl-2,4-D N-Butyl-2,4,5-T Iso-Octyl-2,4,5-T
Purity (ester by weight) 98%, minimum 95%, minimum 95%, minimum
Appearance -clear, reddish brown liquids -
Free Acid (by weight) 0.5%, maximum 0.5%, maximum 0.5%, maximum
Specific Gravity (20°C) + 1.316-1.340 1.200-1.22
Molecular Weight 277.15 311.60 367.71
Theoretical % Weight
Carbon
Chlorine
Oxygen
Hydrogen
52.01
25.58
17.32
5.09
46.26
34.13
15.40
4.21
52.26
28.93
13.05
5.76
* Adapted from Reference 2.
+ Parameter not determined.
TABLE 10. GENERAL DATA RELATIVE TO TCDD*
Property Data
Content in Orange or Range: 0-47 mg/kg. Estimated mean
Orange II is 1.9 mg/kg with 95% confidence
limits of 2.6 and 1.2 mg/kg.
Molecular Weight 321.97
Theoretical % Weight
Carbon 44.77
Chlorine 44.04
Oxygen 9.94
Hydrogen 1.25
Adapted from Reference 2.
45
image:
TABLE 9. GENERAL PROPERTIES OF INGREDIENT ESTERS OF
HERBICIDE ORANGE*
Property N-Butyl-2,4-D N-Butyl-2,4,5-T Iso-Octyl-2,4,5-T
Purity (ester by weight) 98%, minimum 95%, minimum 95%, minimum
Appearance -clear, reddish brown liquids -
Free Acid (by weight) 0.5%, maximum 0.5%, maximum 0.5%, maximum
Specific Gravity (20°C) + 1.316-1.340 1.200-1.22
Molecular Weight 277.15 311.60 367.71
Theoretical % Weight
Carbon
Chlorine
Oxygen
Hydrogen
52.01
25.58
17.32
5.09
46.26
34.13
15.40
4.21
52.26
28.93
13.05
5.76
* Adapted from Reference 2.
+ Parameter not determined.
TABLE 10. GENERAL DATA RELATIVE TO TCDD*
Property Data
Content in Orange or Range: 0-47 mg/kg. Estimated mean
Orange II is 1.9 mg/kg with 95% confidence
limits of 2.6 and 1.2 mg/kg.
Molecular Weight 321.97
Theoretical % Weight
Carbon 44.77
Chlorine 44.04
Oxygen 9.94
Hydrogen 1.25
Adapted from Reference 2.
45
image:
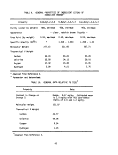 TABLE 11. AVERAGE COMPOSITION OF SEVERAL LOTS OF
HERBICIDE ORANGE*
Compound
Butanol
Toluene
Xylenes, ethyl benzene
Butyl chloride
Dlchlorophenol
Unknown, 1
Unknown, 1
Trichlorophenol
01 chl oromethoxyani sol e
Trichloroanisole
Dichloromethoxyanisole
01 chl oromethoxyani sol e
Butoxydi chl orobenzene
Butoxytrichlorobenzene
Butyl monochlorophenoxyacetate
Butyl dichlorophenoxyacetate
Butyl dichlorophenoxyacetate
Butyl dichlorophenoxyacetate
Unknown, tt
Butyl dichlorophenoxyacetate
Butyl trlchlorophenoxyacetate
Butyl trlchlorophenoxyacetate
Butyl methoxydichlorophenoxyacetate
Octyl dichlorophenoxyacetate
Octyl dichlorophenoxypropionate
Octyl trichlorophenoxyacetate
Octyl methoxydichlorophenoxyacetate
Unknown, t
Unknown, 0
Butyl (bis-dichlorophenoxy) acetate
Butyl (bis-trichlorophenoxy) acetate
Butyl (methoxydichlorophenoxy)-
trichlorophenoxyacetate
TCDD, ug/g
ASN 5
1.7
0.65
3.4
0.13
0.34
0.14
±
4.2
0.16
0.89
0.21
0.40
+
±
0.95
0.16
0.19
0.23
0.45
42.4
0.38
39.5
2.9
+
±
±
±
0.1
0.03
0.16
±
±
0.15
Average Concentration, %+
ASN 8 ASN 10
0.96
1.51
±
0.10
0.23
±
±
0.42
+
•f
±
+
+
•f
0.55
±
±
±
±
41.7
0.89
38.9
5.76
3.33
0.33
2.22
0.37
±
±
0.38
1.8
0.21
<0.02
0.3
0.1
0.03
0.05
0.12
0.57
0.57
0.23
+
±
4.
+
0.16
0.16
1.38
2.77
+
±
-f.
49.1
1.22
43.4
2.68
0.29
±
0.42
±
+
+
0.42
±
+
0.26
ASN 14
0.78
2.52
±
0.16
0.31
±
+
0.70
±
+
^
j
t
±
1.34
0.90
t
±
±
43.2
1.75
41.0
5.89
±
+
±
±
±
±
0.47
±
±
<0.02
*These data were adapted from Reference 6 and apply to Gulfport stocks only.
+ASN means analytical sequence number, an arbitrary designator for various lots.
tCompound not detected. Detection limit was 0.1%.
^Identity unknown because of lack of match between sample and reference spectra.
46
image:
TABLE 11. AVERAGE COMPOSITION OF SEVERAL LOTS OF
HERBICIDE ORANGE*
Compound
Butanol
Toluene
Xylenes, ethyl benzene
Butyl chloride
Dlchlorophenol
Unknown, 1
Unknown, 1
Trichlorophenol
01 chl oromethoxyani sol e
Trichloroanisole
Dichloromethoxyanisole
01 chl oromethoxyani sol e
Butoxydi chl orobenzene
Butoxytrichlorobenzene
Butyl monochlorophenoxyacetate
Butyl dichlorophenoxyacetate
Butyl dichlorophenoxyacetate
Butyl dichlorophenoxyacetate
Unknown, tt
Butyl dichlorophenoxyacetate
Butyl trlchlorophenoxyacetate
Butyl trlchlorophenoxyacetate
Butyl methoxydichlorophenoxyacetate
Octyl dichlorophenoxyacetate
Octyl dichlorophenoxypropionate
Octyl trichlorophenoxyacetate
Octyl methoxydichlorophenoxyacetate
Unknown, t
Unknown, 0
Butyl (bis-dichlorophenoxy) acetate
Butyl (bis-trichlorophenoxy) acetate
Butyl (methoxydichlorophenoxy)-
trichlorophenoxyacetate
TCDD, ug/g
ASN 5
1.7
0.65
3.4
0.13
0.34
0.14
±
4.2
0.16
0.89
0.21
0.40
+
±
0.95
0.16
0.19
0.23
0.45
42.4
0.38
39.5
2.9
+
±
±
±
0.1
0.03
0.16
±
±
0.15
Average Concentration, %+
ASN 8 ASN 10
0.96
1.51
±
0.10
0.23
±
±
0.42
+
•f
±
+
+
•f
0.55
±
±
±
±
41.7
0.89
38.9
5.76
3.33
0.33
2.22
0.37
±
±
0.38
1.8
0.21
<0.02
0.3
0.1
0.03
0.05
0.12
0.57
0.57
0.23
+
±
4.
+
0.16
0.16
1.38
2.77
+
±
-f.
49.1
1.22
43.4
2.68
0.29
±
0.42
±
+
+
0.42
±
+
0.26
ASN 14
0.78
2.52
±
0.16
0.31
±
+
0.70
±
+
^
j
t
±
1.34
0.90
t
±
±
43.2
1.75
41.0
5.89
±
+
±
±
±
±
0.47
±
±
<0.02
*These data were adapted from Reference 6 and apply to Gulfport stocks only.
+ASN means analytical sequence number, an arbitrary designator for various lots.
tCompound not detected. Detection limit was 0.1%.
^Identity unknown because of lack of match between sample and reference spectra.
46
image:
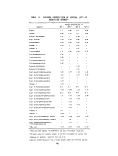 TABLE 12, DRUMS AUTHORIZED FOR LOADINQ FOR THIRD BURN
•
Drum
Identification
X-112
X-113
X-136
X-128
X-135
X-130
X-131
X-132
X-126
X-127
X-110
X-lll
X-116
X-102
X-104
X-105
X-106
X-108
X-109
X-114
X-117
X-115
X-118
X-121
X-133
X-100
X-129
X-134
X-123
X-122
X-119
T-l
T-5
T-10
Primary Constituent
Herb. Orange
Herb. Orange/Water
Herb. Orange
Water on Herb. Orange
Motor Oil
Herb. Orange
Herb. Orange
Herb. Orange
Used Motor Oil
Herb. Orange
Herb. White*
Herb. Orange
Herb. Orange and White*
Water
Herb. White*
Herb. White*
Herb. White*
Water
Herb. White*
Herb. White*
Diesel Fuel
Diesel Fuel
Herb. White
Diesel Fuel
Water Over Herb. White*
Herb. Orange
Herb. Orange and 011
1/4" Water Over Orange
6" Water Over Orange
Herb. Orange, Green Dye
Herb. White*
6" Water Over Orange
1/4" Water Over Orange
Water
Arsenic Content, ppm
N.D.
120 (2200 1n .3/4" Water)
N.D.
N.D.
N.D.
N.D.
612
476
N.D. P6 = 100 mg/1
516
20
412
31
N.D.
20
N.D.
N.D.
N.D.
QNS
N.D.
N.D.
N.D.
N.D.
N.D.
N.D.
112
N.D.
N.D.
20 (27 1n Water)
N.D.
N.D.
—
—
—
Remarks
Load 1n Center Tanks
Load 1n Center Tanks
Load in Center Tanks
Load in Center Tanks
Load in Center Tanks
Load 1n Center Tanks
Load 1n Center Tanks
Load in Center Tanks
Load in Center Tanks
Load in Center Tanks
Load 1n Center Tanks
Load in Center Tanks
Load in Center Tanks
Load in Tank 6P
Load in Center Tanks
Load in Center Tanks
Load in Center Tanks
Load in Tank 6P
Load in Center Tanks
Load 1n Center Tanks
Load in Center Tanks
Load in Center Tanks
Load in Center Tanks
Load in Center Tanks
Load in Center Tanks
Load in Center Tanks
Load in Center Tanks
Load in Center Tanks
Load in Center Tanks
Load in Center Tanks
Load in Center Tanks
Load in Center Tanks
Load In Center Tanks
Load Tank 6P
N.D. » None Detected QNS * Quantity not sufficient for analysis
•Herbicide White was a mixture of Plcloram and 2,4-D.
47
image:
TABLE 12, DRUMS AUTHORIZED FOR LOADINQ FOR THIRD BURN
•
Drum
Identification
X-112
X-113
X-136
X-128
X-135
X-130
X-131
X-132
X-126
X-127
X-110
X-lll
X-116
X-102
X-104
X-105
X-106
X-108
X-109
X-114
X-117
X-115
X-118
X-121
X-133
X-100
X-129
X-134
X-123
X-122
X-119
T-l
T-5
T-10
Primary Constituent
Herb. Orange
Herb. Orange/Water
Herb. Orange
Water on Herb. Orange
Motor Oil
Herb. Orange
Herb. Orange
Herb. Orange
Used Motor Oil
Herb. Orange
Herb. White*
Herb. Orange
Herb. Orange and White*
Water
Herb. White*
Herb. White*
Herb. White*
Water
Herb. White*
Herb. White*
Diesel Fuel
Diesel Fuel
Herb. White
Diesel Fuel
Water Over Herb. White*
Herb. Orange
Herb. Orange and 011
1/4" Water Over Orange
6" Water Over Orange
Herb. Orange, Green Dye
Herb. White*
6" Water Over Orange
1/4" Water Over Orange
Water
Arsenic Content, ppm
N.D.
120 (2200 1n .3/4" Water)
N.D.
N.D.
N.D.
N.D.
612
476
N.D. P6 = 100 mg/1
516
20
412
31
N.D.
20
N.D.
N.D.
N.D.
QNS
N.D.
N.D.
N.D.
N.D.
N.D.
N.D.
112
N.D.
N.D.
20 (27 1n Water)
N.D.
N.D.
—
—
—
Remarks
Load 1n Center Tanks
Load 1n Center Tanks
Load in Center Tanks
Load in Center Tanks
Load in Center Tanks
Load 1n Center Tanks
Load 1n Center Tanks
Load in Center Tanks
Load in Center Tanks
Load in Center Tanks
Load 1n Center Tanks
Load in Center Tanks
Load in Center Tanks
Load in Tank 6P
Load in Center Tanks
Load in Center Tanks
Load in Center Tanks
Load in Tank 6P
Load in Center Tanks
Load 1n Center Tanks
Load in Center Tanks
Load in Center Tanks
Load in Center Tanks
Load in Center Tanks
Load in Center Tanks
Load in Center Tanks
Load in Center Tanks
Load in Center Tanks
Load in Center Tanks
Load in Center Tanks
Load in Center Tanks
Load in Center Tanks
Load In Center Tanks
Load Tank 6P
N.D. » None Detected QNS * Quantity not sufficient for analysis
•Herbicide White was a mixture of Plcloram and 2,4-D.
47
image:
 4. TEST RESULTS
This section presents the results of monitoring, sampling, and analysis
operations on this program. Many of the calculations are complex; therefore,
sample calculations are presented in Appendix F. When an example calculation
is given, the text is so noted.
4.1 OPERATIONAL AND FIELD DATA
Data acquired onboard the ship during the three burn periods included
on-line gas composition, waste feed rates, and incinerator wall and flame tem-
peratures. Each of these is discussed in the following secttons.
4.1.1 Combustion Effluent Gas Composition
Signal outputs from the on-line instruments were recorded on strip charts
and an Esterline-Angus data logging device which automatically printed out the
millivolt signal from each instrument at 5-minute intervals. Data were acquired
for approximately 29 hours during the first 10-day burn period, and for 17 hours
and 13 hours, respectively, during the second and third burns of 11 days each.
Monitoring times ranged from 1 to 5 hours duration representing random and
preselected day and night monitoring. Daylight monitoring was normally coor-
dinated with stack sampling activities so that on-line data may be compared to
results derived from the analysis of stack gas samples. During the on-line
monitoring, the data were continuously evaluated and assessed daily to deter-
mine compliance with combustion efficiency, temperature, and excess air require-
ments specified in the permit.
Results of the gas composition analyses for each burn, shown in Tables 13,
14 and 15, were calculated on a dry basis, i.e., the samples were water-free
when analyzed and no correction has been made for removed moisture. Oxygen
values have been corrected for the volumes of C02 and HC1 which were removed
from the oxygen analyzer sample feed before analysis by a scrubber installed
to protect the instrument. The range of levels for each species shows the
48
image:
4. TEST RESULTS
This section presents the results of monitoring, sampling, and analysis
operations on this program. Many of the calculations are complex; therefore,
sample calculations are presented in Appendix F. When an example calculation
is given, the text is so noted.
4.1 OPERATIONAL AND FIELD DATA
Data acquired onboard the ship during the three burn periods included
on-line gas composition, waste feed rates, and incinerator wall and flame tem-
peratures. Each of these is discussed in the following secttons.
4.1.1 Combustion Effluent Gas Composition
Signal outputs from the on-line instruments were recorded on strip charts
and an Esterline-Angus data logging device which automatically printed out the
millivolt signal from each instrument at 5-minute intervals. Data were acquired
for approximately 29 hours during the first 10-day burn period, and for 17 hours
and 13 hours, respectively, during the second and third burns of 11 days each.
Monitoring times ranged from 1 to 5 hours duration representing random and
preselected day and night monitoring. Daylight monitoring was normally coor-
dinated with stack sampling activities so that on-line data may be compared to
results derived from the analysis of stack gas samples. During the on-line
monitoring, the data were continuously evaluated and assessed daily to deter-
mine compliance with combustion efficiency, temperature, and excess air require-
ments specified in the permit.
Results of the gas composition analyses for each burn, shown in Tables 13,
14 and 15, were calculated on a dry basis, i.e., the samples were water-free
when analyzed and no correction has been made for removed moisture. Oxygen
values have been corrected for the volumes of C02 and HC1 which were removed
from the oxygen analyzer sample feed before analysis by a scrubber installed
to protect the instrument. The range of levels for each species shows the
48
image:
 TABLE 13. GAS COMPOSITION DATA - FIRST BURN
Day
No.
l<f:
1
2
3
4
5
6
7
8
10
Date
* 7/14
7/14
7/15
7/16
7/17
7/18
7/19
7/20
7/21
7/23
Range
Mean
Range
Mean
Range
Mean
Range
Mean
Range
Mean
Range
Mean
Range
Mean
Range
Mean
Range
Mean
Range
Mean
°2
(percent)
10.2-13.7
12.9
5.6-8.6
8.4
7.3-12.8
8.1
8.0-9.5
8.4
8.1-10.0
8.4
7.2-8.9
7.9
7.5-10.5
8.5
8.2-10.1
9.1
7.9-8.4
8.3
8.1-8.8
8.1
C02 CO HC<a> HCl<b>
(percent) (ppm) (ppm) (percent)
2.8-8.4
4.3
9.4-11.8
10.4
9.7-11.8
10.7
8.1-11.6
10.5
9.9-10.6
10.3
8.3-12.7
11.0
8.8-12.6
10.5
7.4-11.5
9.9
9.6-10.9
10.1
9.3-10.2
10.0
2-8
4
2-7
5
1-8
5
3-8
5
4-15
8
1-15
7
2-12
8
3-14
7
8-17
12
9-19
14
7-20
11
37-130
92
21-52
32
7-9
8
_(g)
Jg)
_(g)
7-57
22
10-14
12
6-22
14
0(f)
2.2
2.2
2.2
2.1
2.3
2.2
2.0
2.1
2.1
(c)
N2 Combustion^ Excess Air^
(percent) Efficiency (percent)
82.8
79.0
79.0
78.9
79.2
78.8
78.8
79.0
79.6
79.8
99.979-99.
99.99
99.993-99.
99.99
99.993-99.
99.99
99.993-99.
99.99
99.986-99.
99.99
99.986-99.
99.99
99.987-99.
99.99
99.986-99.
99.99
99.984-99.
99.99
99.981-99.
99.99
997
998
999
997
996
999
998
997
992
991
144
67
63
68
67
61
69
77
65
62
a) As methane
b) Appendix F.2
c) By difference
d) Appendix F.2
e) Appendix F.2
f)
Fuel oil background test
g) No data. HC analyzer was
Inoperative.
image:
TABLE 13. GAS COMPOSITION DATA - FIRST BURN
Day
No.
l<f:
1
2
3
4
5
6
7
8
10
Date
* 7/14
7/14
7/15
7/16
7/17
7/18
7/19
7/20
7/21
7/23
Range
Mean
Range
Mean
Range
Mean
Range
Mean
Range
Mean
Range
Mean
Range
Mean
Range
Mean
Range
Mean
Range
Mean
°2
(percent)
10.2-13.7
12.9
5.6-8.6
8.4
7.3-12.8
8.1
8.0-9.5
8.4
8.1-10.0
8.4
7.2-8.9
7.9
7.5-10.5
8.5
8.2-10.1
9.1
7.9-8.4
8.3
8.1-8.8
8.1
C02 CO HC<a> HCl<b>
(percent) (ppm) (ppm) (percent)
2.8-8.4
4.3
9.4-11.8
10.4
9.7-11.8
10.7
8.1-11.6
10.5
9.9-10.6
10.3
8.3-12.7
11.0
8.8-12.6
10.5
7.4-11.5
9.9
9.6-10.9
10.1
9.3-10.2
10.0
2-8
4
2-7
5
1-8
5
3-8
5
4-15
8
1-15
7
2-12
8
3-14
7
8-17
12
9-19
14
7-20
11
37-130
92
21-52
32
7-9
8
_(g)
Jg)
_(g)
7-57
22
10-14
12
6-22
14
0(f)
2.2
2.2
2.2
2.1
2.3
2.2
2.0
2.1
2.1
(c)
N2 Combustion^ Excess Air^
(percent) Efficiency (percent)
82.8
79.0
79.0
78.9
79.2
78.8
78.8
79.0
79.6
79.8
99.979-99.
99.99
99.993-99.
99.99
99.993-99.
99.99
99.993-99.
99.99
99.986-99.
99.99
99.986-99.
99.99
99.987-99.
99.99
99.986-99.
99.99
99.984-99.
99.99
99.981-99.
99.99
997
998
999
997
996
999
998
997
992
991
144
67
63
68
67
61
69
77
65
62
a) As methane
b) Appendix F.2
c) By difference
d) Appendix F.2
e) Appendix F.2
f)
Fuel oil background test
g) No data. HC analyzer was
Inoperative.
image:
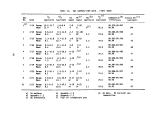 TABLE 14. GAS COMPOSITION DATA - SECOND BURN
en
O
Day
No.
i<f
1
2
3
4
5
8
9
10
11
Date
) 8/6
8/6
8/7
8/8
8/9
8/10
8/13
8/14
8/15
8/16
Range
Mean
Range
Mean
Range
Mean
Range
Mean
Range
Mean
Range
Mean
Range
Mean
Range
Mean
Range
Mean
Range
Mean
(percent)
7.7-11.0
9.7
8.5-10.5
9.4
5.9-6.9
6.4
6.8-8.5
7.9
6.5-7.7
7.2
8.1-11.1
9.3
8.7-12.3
9.8
7.1-10.2
8.4
9.0-10.6
9.8
9.0-12.8
10.6
co2
(percent)
6.5-9.5
7.8
8.8-10.7
9.7
12.2-13.9
13.0
10.4-11.7
11.1
10.3-11.0
10.6
9.1-11.2
10.1
6.9-11.0
9.1
10.4-13.2
11.5
6.7-10.0
8.7
7.0-9.7
7.8
CO
(ppm)
3-5
4
6-11
8
5-9
8
4-8
6
5-10
8
3-19
11
3-12
8
11-25
19
9-19
11
7-10
9
HC(a) HCl(b)
(ppm) (percent)
3-6
4
4-7
6
2-11
9
7-11
9
19-31
26
12-20
16
7-23
16
.(9)
.(9)
.(9)
0(f)
2.0
2.7
2.3
2.2
2.1
1.9
2.4
1.8
1.6
N 'c' frfV (P^
1 2 Combustion^0' Excess Mr(e)
(percent) Efficiency (percent)
82.5
78.9
77.9
78.7
80.0
78.5
79.2
77.7
79.7
80.0
99.993-99.
99.99
99.990-99.
99.99
99.993-99.
99.99
99.992-99.
99.99
99.991-99.
99.99
99.982-99.
99.99
99.985-99.
99.99
99.978-99.
99.98
99.975-99.
99.98
99.987-99.
99.99
997
993
996
996
996
997
996
989
990
991
80
82
45
61
52
81
88
69
87
101
As methane
Appendix F.2
c) By difference
d) Appendix F.2
e) Appendix F.2
f) Fuel oil background test
g) No data. HC analyzer was
Inoperative.
image:
TABLE 14. GAS COMPOSITION DATA - SECOND BURN
en
O
Day
No.
i<f
1
2
3
4
5
8
9
10
11
Date
) 8/6
8/6
8/7
8/8
8/9
8/10
8/13
8/14
8/15
8/16
Range
Mean
Range
Mean
Range
Mean
Range
Mean
Range
Mean
Range
Mean
Range
Mean
Range
Mean
Range
Mean
Range
Mean
(percent)
7.7-11.0
9.7
8.5-10.5
9.4
5.9-6.9
6.4
6.8-8.5
7.9
6.5-7.7
7.2
8.1-11.1
9.3
8.7-12.3
9.8
7.1-10.2
8.4
9.0-10.6
9.8
9.0-12.8
10.6
co2
(percent)
6.5-9.5
7.8
8.8-10.7
9.7
12.2-13.9
13.0
10.4-11.7
11.1
10.3-11.0
10.6
9.1-11.2
10.1
6.9-11.0
9.1
10.4-13.2
11.5
6.7-10.0
8.7
7.0-9.7
7.8
CO
(ppm)
3-5
4
6-11
8
5-9
8
4-8
6
5-10
8
3-19
11
3-12
8
11-25
19
9-19
11
7-10
9
HC(a) HCl(b)
(ppm) (percent)
3-6
4
4-7
6
2-11
9
7-11
9
19-31
26
12-20
16
7-23
16
.(9)
.(9)
.(9)
0(f)
2.0
2.7
2.3
2.2
2.1
1.9
2.4
1.8
1.6
N 'c' frfV (P^
1 2 Combustion^0' Excess Mr(e)
(percent) Efficiency (percent)
82.5
78.9
77.9
78.7
80.0
78.5
79.2
77.7
79.7
80.0
99.993-99.
99.99
99.990-99.
99.99
99.993-99.
99.99
99.992-99.
99.99
99.991-99.
99.99
99.982-99.
99.99
99.985-99.
99.99
99.978-99.
99.98
99.975-99.
99.98
99.987-99.
99.99
997
993
996
996
996
997
996
989
990
991
80
82
45
61
52
81
88
69
87
101
As methane
Appendix F.2
c) By difference
d) Appendix F.2
e) Appendix F.2
f) Fuel oil background test
g) No data. HC analyzer was
Inoperative.
image:
 TABLE 15. GAS COMPOSITION DATA - THIRD BURN
Day
No.
,(f!
1
2
3
4
6
7
8
9
10
11
Date
* 8/24
8/24
8/25
8/26
8/27
8/29
8/30
8/31
9/1
9/2
9/3
Range
Mean
Range
Mean
Range
Mean
Range
Mean
Range
Mean
Range
Mean
Range
Mean
Range
Mean
Range
Mean
Range
Mean
Range
Mean
°2
(percent)
9.7-14.5
12.1
8.2-11.6
9.3
5.4-10.0
8.9
6.5-11.5
9.4
5.8-8.8
7.5
8.3-10.2
9.5
8.8-9.6
9.4
8.9-9.6
9.1
9.0-10.5
9.6
8.1-10.8
9.4
7.2-9.3
8.2
co2
(percent)
9.9-10.0
10.0
9.9-12.0
11.1
9.4-15.1
10.9
7.2-12.6
9.6
9.7-14.7
12.0
9.7-13.0
11.2
10.3-12.8
11.3
10.2-11.4
10.1
10.0-11.6
10.7
10.0-12.3
11.1
12.0-14.0
12.9
CO HC*a)
(ppm) (ppm)
10-11 -(g)
11
10-13 -(g)
11
13-25 -(g)
18
6-30 -*g)
21
12-29 -(g)
25
14-22 -lg)
19
14-24 -<g>
20
18-25 -*g)
21
6-11 -lg)
8
16-28 -(g)
23
14-26 -(g)
22
HCl<b>
(percent)
0(0
2.3
2.3
2.0
2.5
2.3
2.3
2.1
2.2
2.3
2.7
N2 Combustion^) Excess Air^e)
(percent) Efficiency (percent)
77.9
77.3
77.9
79.0
78.0
77.0
77.0
78.7
77.5
77.2
76.2
99.
99.
99.
99.
99.
99.
99.
99.
99.
99.
99.
99.
99.
99.
99.
99.
99.
99.
99.
99.
99.
99.
989-99.
99
989-99.
99
978-99.
98
968-99.
98
975-99.
98
978-99.
98
980-99.
98
978-99.
98
990-99.
99
976-99.
98
979-99.
98
989
990
989
993
987
987
987
985
994
986
988
143
84
76
82
57
88
86
78
88
86
69
a) As methane
pendix F.
di fference
OLJ na
b) Appendix F.2
c) By
d) Appendix F.2
e) Appendix F.2
f) Fuel oil background test
g) No data. HC analyzer was
inoperative.
image:
TABLE 15. GAS COMPOSITION DATA - THIRD BURN
Day
No.
,(f!
1
2
3
4
6
7
8
9
10
11
Date
* 8/24
8/24
8/25
8/26
8/27
8/29
8/30
8/31
9/1
9/2
9/3
Range
Mean
Range
Mean
Range
Mean
Range
Mean
Range
Mean
Range
Mean
Range
Mean
Range
Mean
Range
Mean
Range
Mean
Range
Mean
°2
(percent)
9.7-14.5
12.1
8.2-11.6
9.3
5.4-10.0
8.9
6.5-11.5
9.4
5.8-8.8
7.5
8.3-10.2
9.5
8.8-9.6
9.4
8.9-9.6
9.1
9.0-10.5
9.6
8.1-10.8
9.4
7.2-9.3
8.2
co2
(percent)
9.9-10.0
10.0
9.9-12.0
11.1
9.4-15.1
10.9
7.2-12.6
9.6
9.7-14.7
12.0
9.7-13.0
11.2
10.3-12.8
11.3
10.2-11.4
10.1
10.0-11.6
10.7
10.0-12.3
11.1
12.0-14.0
12.9
CO HC*a)
(ppm) (ppm)
10-11 -(g)
11
10-13 -(g)
11
13-25 -(g)
18
6-30 -*g)
21
12-29 -(g)
25
14-22 -lg)
19
14-24 -<g>
20
18-25 -*g)
21
6-11 -lg)
8
16-28 -(g)
23
14-26 -(g)
22
HCl<b>
(percent)
0(0
2.3
2.3
2.0
2.5
2.3
2.3
2.1
2.2
2.3
2.7
N2 Combustion^) Excess Air^e)
(percent) Efficiency (percent)
77.9
77.3
77.9
79.0
78.0
77.0
77.0
78.7
77.5
77.2
76.2
99.
99.
99.
99.
99.
99.
99.
99.
99.
99.
99.
99.
99.
99.
99.
99.
99.
99.
99.
99.
99.
99.
989-99.
99
989-99.
99
978-99.
98
968-99.
98
975-99.
98
978-99.
98
980-99.
98
978-99.
98
990-99.
99
976-99.
98
979-99.
98
989
990
989
993
987
987
987
985
994
986
988
143
84
76
82
57
88
86
78
88
86
69
a) As methane
pendix F.
di fference
OLJ na
b) Appendix F.2
c) By
d) Appendix F.2
e) Appendix F.2
f) Fuel oil background test
g) No data. HC analyzer was
inoperative.
image:
 maximum and minimum levels measured for all data points. The mean value is a
numerical average of all data points. Sample calculations for HC1 concentra-
tion, combustion efficiency, and excess air are given in Appendix F.2.
Table 16 is a summary of the on-line data for all three burns. These
data show the relative uniformity of the burning operation as evidenced by the
low standard deviation in the stack concentrations of CO, COg. Og, and total
hydrocarbons. Based on the data obtained during incineration onboard the M/T
Vulcanus, the combustion efficiency was 99.97% or greater during all monitoring
periods. Excess air ranged from 45 to 101%, and the average oxygen concentra-
tion ranged from 5.4 to 12.8% for all Herbicide Orange burn data. For the fuel
oil background tests, excess air varied from 80 to 144%.
On-line gas composition data were taken during a traverse of the sampling
probe across the starboard incinerator stack. Data acquired at 1-minute inter-
vals while the probe was stationary at each location are presented in Figure 15.
Results indicate that incinerator combustion efficiency can be measured accu-
rately with a fixed probe at any position greater than 10 cm into the furnace.
All C0/C02 measurements beyond this point yielded calculated efficiencies of
99.991 +0.002%.
•z.
LU
»—«
O
o
i—i
t—
to
99
99.
99
.99-
98-
.97-
1
:_t4+-v,--+-ff-
8
r Q - Indicates num
readings 1ncl
0 50 100 150 200
ber of one minute
uded 1n data point
250 300
SAMPLE PROBE DEPTH, CM
Figure 15. Combustion efficiency versus probe insertion depth.
52
image:
maximum and minimum levels measured for all data points. The mean value is a
numerical average of all data points. Sample calculations for HC1 concentra-
tion, combustion efficiency, and excess air are given in Appendix F.2.
Table 16 is a summary of the on-line data for all three burns. These
data show the relative uniformity of the burning operation as evidenced by the
low standard deviation in the stack concentrations of CO, COg. Og, and total
hydrocarbons. Based on the data obtained during incineration onboard the M/T
Vulcanus, the combustion efficiency was 99.97% or greater during all monitoring
periods. Excess air ranged from 45 to 101%, and the average oxygen concentra-
tion ranged from 5.4 to 12.8% for all Herbicide Orange burn data. For the fuel
oil background tests, excess air varied from 80 to 144%.
On-line gas composition data were taken during a traverse of the sampling
probe across the starboard incinerator stack. Data acquired at 1-minute inter-
vals while the probe was stationary at each location are presented in Figure 15.
Results indicate that incinerator combustion efficiency can be measured accu-
rately with a fixed probe at any position greater than 10 cm into the furnace.
All C0/C02 measurements beyond this point yielded calculated efficiencies of
99.991 +0.002%.
•z.
LU
»—«
O
o
i—i
t—
to
99
99.
99
.99-
98-
.97-
1
:_t4+-v,--+-ff-
8
r Q - Indicates num
readings 1ncl
0 50 100 150 200
ber of one minute
uded 1n data point
250 300
SAMPLE PROBE DEPTH, CM
Figure 15. Combustion efficiency versus probe insertion depth.
52
image:
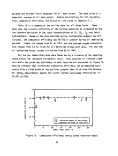 TABLE 16. GAS COMPOSITION DATA SUMMARY -ALL HERBICIDE ORANGE BURNS
in
co
Burn 1 Minimum
Maximum
Mean
Standard Deviation
No. of Data Points
Burn 2 Minimum
Maximum
Mean
Standard Deviation
No. of Data Points
Burn 3 Minimum
Maximum
Mean
Standard Deviation
No. of Data Points
Combined Burns Minimum
1, 2, and 3 Maximum
Mean
Standard Deviation
No. of Data Points
°2
(percent)
5.6
12.8
8.7
±1.4
305
5.9
12.8
9.1
±1.4
131
5.4
12.6
9.1
±1.4
82
5.4
12.8
8.9
±1.4
518
co2
(percent)
7.4
12.7
10.1
±1.7
305
6.7
13.9
10.1
±1.6
131
7.2
15.1
11.1
±1.6
82
6.7
15.1
10.3
±1.7
518
CO
(ppm)
1
19
8
±3
305
3
25
11
±5
131
6
30
19
±6
82
1
30
10
±6
518
HC
(ppm)
6
130
30
±28
143*
2
31
14
±7
58*
_*
-
_
-
•
2
130
25
±25
201*
Combustion
Efficiency (%)
99.981
99.999
99.992
±0.004
305
99.975
99.997
99.989
±0.005
131
99.968
99.994
99.983
±0.006
82
99.968
99.999
99.990
±0.005
518
*HC Analyzer was inoperative for some tests during Burns 1 and 2 and for all of Burn 3.
image:
TABLE 16. GAS COMPOSITION DATA SUMMARY -ALL HERBICIDE ORANGE BURNS
in
co
Burn 1 Minimum
Maximum
Mean
Standard Deviation
No. of Data Points
Burn 2 Minimum
Maximum
Mean
Standard Deviation
No. of Data Points
Burn 3 Minimum
Maximum
Mean
Standard Deviation
No. of Data Points
Combined Burns Minimum
1, 2, and 3 Maximum
Mean
Standard Deviation
No. of Data Points
°2
(percent)
5.6
12.8
8.7
±1.4
305
5.9
12.8
9.1
±1.4
131
5.4
12.6
9.1
±1.4
82
5.4
12.8
8.9
±1.4
518
co2
(percent)
7.4
12.7
10.1
±1.7
305
6.7
13.9
10.1
±1.6
131
7.2
15.1
11.1
±1.6
82
6.7
15.1
10.3
±1.7
518
CO
(ppm)
1
19
8
±3
305
3
25
11
±5
131
6
30
19
±6
82
1
30
10
±6
518
HC
(ppm)
6
130
30
±28
143*
2
31
14
±7
58*
_*
-
_
-
•
2
130
25
±25
201*
Combustion
Efficiency (%)
99.981
99.999
99.992
±0.004
305
99.975
99.997
99.989
±0.005
131
99.968
99.994
99.983
±0.006
82
99.968
99.999
99.990
±0.005
518
*HC Analyzer was inoperative for some tests during Burns 1 and 2 and for all of Burn 3.
image:
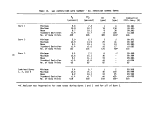 4.1.2 Waste Feed Rate
Time averaged feed rates were recorded by tank during the first and
second burns. Tables 17 and 18 present these data, giving burn times, volumes
and weights of material burned, and burn rates in metric tons per hour. Dur-
ing the third burn, rough seas precluded measuring tank residuals (Section
3.2.3), so that incremental burn rates were not recorded. The average feed
rate for the third burn was 15.2 metric tons per hour (3706 metric tons, 3114 m ,
in 244 hours). The overall amount of material incinerated during the third burn
o
included 86.7 metric tons"(85 m ) of herbicide contaminated water and 647.4 metric
tons (544 m ) of TCDD-free herbicide that was used to rinse the waste tanks.
Specific gravities of five samples (Table 5) of first-burn herbicide were
measured by WSU. These averaged 1.17 g/cm . WSU also measured the specific
gravity of samples from the second and third burns, and both had specific
gravities of 1.19 g/cm . These specific gravities were used to convert volumes
of herbicide burned to mass flow rates.
4.1.3 Temperature and Residence Time
Both direct flame and wall temperature thermocouple measurements were made
during incinerator operation. Wall thermocouple temperatures (controller
and indicator thermocouples) were recorded hourly by the ship's crew for both
of the incinerators. Independent flame temperature measurements were measured
daily using a visible light optical pyrometer manufactured by Leeds & Northrop
(Catalog No. 8632-F). Average daily flame and wall temperatures measured
together with standard deviations during Herbicide Orange incineration are
presented in Tables 19, 20, and 21 for each burn period.
These data indicate that the incinerator temperatures were consistently
uniform and comparable. The low variation in the temperature measurements,
particularly the flame temperatures, correlates well with the relatively con-
stant combustion efficiencies derived from the on-line data and indicates well-
controlled combustion during each bum.
54
image:
4.1.2 Waste Feed Rate
Time averaged feed rates were recorded by tank during the first and
second burns. Tables 17 and 18 present these data, giving burn times, volumes
and weights of material burned, and burn rates in metric tons per hour. Dur-
ing the third burn, rough seas precluded measuring tank residuals (Section
3.2.3), so that incremental burn rates were not recorded. The average feed
rate for the third burn was 15.2 metric tons per hour (3706 metric tons, 3114 m ,
in 244 hours). The overall amount of material incinerated during the third burn
o
included 86.7 metric tons"(85 m ) of herbicide contaminated water and 647.4 metric
tons (544 m ) of TCDD-free herbicide that was used to rinse the waste tanks.
Specific gravities of five samples (Table 5) of first-burn herbicide were
measured by WSU. These averaged 1.17 g/cm . WSU also measured the specific
gravity of samples from the second and third burns, and both had specific
gravities of 1.19 g/cm . These specific gravities were used to convert volumes
of herbicide burned to mass flow rates.
4.1.3 Temperature and Residence Time
Both direct flame and wall temperature thermocouple measurements were made
during incinerator operation. Wall thermocouple temperatures (controller
and indicator thermocouples) were recorded hourly by the ship's crew for both
of the incinerators. Independent flame temperature measurements were measured
daily using a visible light optical pyrometer manufactured by Leeds & Northrop
(Catalog No. 8632-F). Average daily flame and wall temperatures measured
together with standard deviations during Herbicide Orange incineration are
presented in Tables 19, 20, and 21 for each burn period.
These data indicate that the incinerator temperatures were consistently
uniform and comparable. The low variation in the temperature measurements,
particularly the flame temperatures, correlates well with the relatively con-
stant combustion efficiencies derived from the on-line data and indicates well-
controlled combustion during each bum.
54
image:
 TABLE 17. TANK BURNING SUMMARY - FIRST BURN
in
en
Tank
No.*
1C
5C
3C
4C
2 P/S
3 P/S
4 P/S
5 P/S
6P
Total
Burn
' Start
Day
7/14
7/16
7/17
7/19
7/20
7/21
7/22
7/23
7/23
7/14
Hour
1600
0830
1830
0200
1000
0720
0230
0255
2225
1600
Finish
Day
7/16
7/17
7/19
7/20
7/21
7/22
7/23
7/23
7/24
7/24
Hour
0830
1830
0200
1000
0720
0230
0255
2225
0725
0725
Time
(hr)
40.50
34.00
31.50
32.00
21.33
19.17
24.42
19.50
9.00
231.42
Volume
Loaded
(m3)
419.2
415.7
401.4
424.8
264.8
240.8
308.3
242.7
112.0
2829.7
Volume
Left
(m3)
0.5
7.1
0
44.9
0
0.7
3.1
0
1.2
57.5
Weight
Burned
(mt)*
489.9
478.1
469.6
444.5
309.8
280.9
357.0
284.0
129.6
3243.4
Average
Burn Rate
(mt/hr)
12.10
14.06
14.91
13.89
14.52
14.65
14.62
14.56
14.40
14.02
C = center tank, P = port tank, S = starboard tank, P/S = both port and starboard tanks
Average specific gravity for first burn waste was 1.17 g/cm3 as determined by WSU.
image:
TABLE 17. TANK BURNING SUMMARY - FIRST BURN
in
en
Tank
No.*
1C
5C
3C
4C
2 P/S
3 P/S
4 P/S
5 P/S
6P
Total
Burn
' Start
Day
7/14
7/16
7/17
7/19
7/20
7/21
7/22
7/23
7/23
7/14
Hour
1600
0830
1830
0200
1000
0720
0230
0255
2225
1600
Finish
Day
7/16
7/17
7/19
7/20
7/21
7/22
7/23
7/23
7/24
7/24
Hour
0830
1830
0200
1000
0720
0230
0255
2225
0725
0725
Time
(hr)
40.50
34.00
31.50
32.00
21.33
19.17
24.42
19.50
9.00
231.42
Volume
Loaded
(m3)
419.2
415.7
401.4
424.8
264.8
240.8
308.3
242.7
112.0
2829.7
Volume
Left
(m3)
0.5
7.1
0
44.9
0
0.7
3.1
0
1.2
57.5
Weight
Burned
(mt)*
489.9
478.1
469.6
444.5
309.8
280.9
357.0
284.0
129.6
3243.4
Average
Burn Rate
(mt/hr)
12.10
14.06
14.91
13.89
14.52
14.65
14.62
14.56
14.40
14.02
C = center tank, P = port tank, S = starboard tank, P/S = both port and starboard tanks
Average specific gravity for first burn waste was 1.17 g/cm3 as determined by WSU.
image:
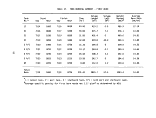 TABLE 18. TANK BURNING SUMMARY - SECOND BURN
Ol
Tank
No.*
3C*
1C
3C#
2 P/S
5C
6P
3S
4C*
3P
4C#
4 P/S
5 P/S
Total
Burn
Start
Day
8/6
8/7
8/8
8/9
8/10
8/12
8/12
8/12
8/13
8/13
8/14
8/16
8/6
Hour
2200
0445
1900
2045
1800
0430
1330
2330
0530
1530
2130
0000
2200
Day
8/7
8/8
8/9
8/10
8/12
8/12
8/12
8/13
8/13
8/14
8/16
8/16
8/16
Finish
Hour
0445
1900
2045
1800
0430
1330
2330
0530
1530
2130
0000
2040
2040
Time
(hr)
t
38.25
32.50*
21.25
34.50
9.00
10.00
t
10.00
36.00*
26.50
20.67
238.67
Volume
Burned
(m3)
t
440.0
404.0
264.8
428.0
116.0
120.4
t
120.4
440.0
307.8
242.6
2884.0
Weight
Burned
(mt)t
t
523.6
480.8
315.1
509.3
138.0
143.3
t
143.3
523.6
366.3
288.7
3432.0
Average
Burn Rate
(mt/hr)
+
+
13.69
14.79
14.83
14.76
15.34
14.33
t
14.33
14.54
13.82
13.97
14.38
*
C = center tank, P = port tank, S = starboard tank, P/S = both port and starboard tanks.
^Specify gravity of second and third burn wastes was 1.19 g/cm3 as determined by WSU.
^Did not run tank to depletion at this time.
&
Includes previous run time on this tank.
image:
TABLE 18. TANK BURNING SUMMARY - SECOND BURN
Ol
Tank
No.*
3C*
1C
3C#
2 P/S
5C
6P
3S
4C*
3P
4C#
4 P/S
5 P/S
Total
Burn
Start
Day
8/6
8/7
8/8
8/9
8/10
8/12
8/12
8/12
8/13
8/13
8/14
8/16
8/6
Hour
2200
0445
1900
2045
1800
0430
1330
2330
0530
1530
2130
0000
2200
Day
8/7
8/8
8/9
8/10
8/12
8/12
8/12
8/13
8/13
8/14
8/16
8/16
8/16
Finish
Hour
0445
1900
2045
1800
0430
1330
2330
0530
1530
2130
0000
2040
2040
Time
(hr)
t
38.25
32.50*
21.25
34.50
9.00
10.00
t
10.00
36.00*
26.50
20.67
238.67
Volume
Burned
(m3)
t
440.0
404.0
264.8
428.0
116.0
120.4
t
120.4
440.0
307.8
242.6
2884.0
Weight
Burned
(mt)t
t
523.6
480.8
315.1
509.3
138.0
143.3
t
143.3
523.6
366.3
288.7
3432.0
Average
Burn Rate
(mt/hr)
+
+
13.69
14.79
14.83
14.76
15.34
14.33
t
14.33
14.54
13.82
13.97
14.38
*
C = center tank, P = port tank, S = starboard tank, P/S = both port and starboard tanks.
^Specify gravity of second and third burn wastes was 1.19 g/cm3 as determined by WSU.
^Did not run tank to depletion at this time.
&
Includes previous run time on this tank.
image:
 TABLE 19. INCINERATOR TEMPERATURES - FIRST BURN
Starboard Furnace
Date
7/14
7/15
7/16
7/17
7/18
7/19
7/20
7/21
7/22
7/23
7/24
Date
8/7
8/8
8/9
8/10
8/11
8/12
8/13
8/14
8/15
8/16
Indicator
x(°C) o(°C)
1115
1179
1212
1218
1206
1190
1178
1190
1202
1200
1186
16
24
5
8
8
12
11
9
8
7
6
TABLE
Starboard
Indicator
x(°O a(°C)
1184
1215
1226
1220
1212
1216
1191
1198
1182
1200
42
16
16
28
13
16
7
9
18
28
Controller
7(°C) a(°C)
1225
1280
1311
1319
1287
1275
1261
1283
1299
1279
1254
20.
19
32
16
30
26
23
24
22
18
17
35
Flame
(°0
1375
1566
1504
1610
1504
1554
1488
1565
1510
1566
Port
Furnace
Indicator Controller
x(°C) a(°C) x(°C) a(°C)
1109
1166
1203
1214
1226
1222
1203
1216
1202
1191
1209
INCINERATOR TEMPERATURES
Furnace
Controller
x(°C) a(°C)
1340
1294
1310
1263
1318
1309
1260
1271
1257
1267
34
42
43
49
45
47
28
32
54
62
Flame
(°0
1475
1410
1543
1496
1478
1499
1510
1549
1471
1510
6
31
7
18
11
15
14
23
32
20
14
- SECOND
1141
1197
1236
1252
1265
1258
1226
1254
1229
1215
1244
BURN
12
44
14
31
21
27
24
37
41
35
31
Flame
(°0
1375
1493
1510
1576
1427
1516
1488
1493
1566
1504
Port Furnace
Indicator
•x(°C) a(°O
1203
1230
1234
1240
1234
1225
1208
1213
1194
1202
25
15
8
12
9
14
10
7
19
8
Controller
x(°C) a(°C)
1267
1289
1292
1266
1292
1277
1245
1252
1214
1245
42
27
25
28
16
34
26
21
34
20
Flame
(°C)
1488
1477
1482
1493
1455
1488
1485
1482
1438
1518
57
image:
TABLE 19. INCINERATOR TEMPERATURES - FIRST BURN
Starboard Furnace
Date
7/14
7/15
7/16
7/17
7/18
7/19
7/20
7/21
7/22
7/23
7/24
Date
8/7
8/8
8/9
8/10
8/11
8/12
8/13
8/14
8/15
8/16
Indicator
x(°C) o(°C)
1115
1179
1212
1218
1206
1190
1178
1190
1202
1200
1186
16
24
5
8
8
12
11
9
8
7
6
TABLE
Starboard
Indicator
x(°O a(°C)
1184
1215
1226
1220
1212
1216
1191
1198
1182
1200
42
16
16
28
13
16
7
9
18
28
Controller
7(°C) a(°C)
1225
1280
1311
1319
1287
1275
1261
1283
1299
1279
1254
20.
19
32
16
30
26
23
24
22
18
17
35
Flame
(°0
1375
1566
1504
1610
1504
1554
1488
1565
1510
1566
Port
Furnace
Indicator Controller
x(°C) a(°C) x(°C) a(°C)
1109
1166
1203
1214
1226
1222
1203
1216
1202
1191
1209
INCINERATOR TEMPERATURES
Furnace
Controller
x(°C) a(°C)
1340
1294
1310
1263
1318
1309
1260
1271
1257
1267
34
42
43
49
45
47
28
32
54
62
Flame
(°0
1475
1410
1543
1496
1478
1499
1510
1549
1471
1510
6
31
7
18
11
15
14
23
32
20
14
- SECOND
1141
1197
1236
1252
1265
1258
1226
1254
1229
1215
1244
BURN
12
44
14
31
21
27
24
37
41
35
31
Flame
(°0
1375
1493
1510
1576
1427
1516
1488
1493
1566
1504
Port Furnace
Indicator
•x(°C) a(°O
1203
1230
1234
1240
1234
1225
1208
1213
1194
1202
25
15
8
12
9
14
10
7
19
8
Controller
x(°C) a(°C)
1267
1289
1292
1266
1292
1277
1245
1252
1214
1245
42
27
25
28
16
34
26
21
34
20
Flame
(°C)
1488
1477
1482
1493
1455
1488
1485
1482
1438
1518
57
image:
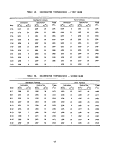 TABLE 21. INCINERATOR TEMPERATURES - THIRD BURN
Starboard Furnace
Date
8/25
8/26
8/27
8/28
8/29
8/30
8/31
9/1
9/2
Indicator
x(°C) o(°C)
1181
1195
1207
1177
1190
1203
1199
1191
1199
14
9
15
16
20
20
10
17
24
Controller
x(°C) o(°C)
1273
1294
1310
1262
1288
1298
1300
1277
1283
38
40
43
48
46
52
36
44
51
Flame
(°c)
1427
1574
1493
1493
1510
1471
1471
1454
1526
Indicator
x(°C) 0(°C)
1212
1198
1209
1193
1251
1234
1238
1236
1200
12
22
11
22
30
15
23
35
18
Port Furnace
Controller
x(°C) 0(°C)
1265
1227
1257
1231
1325
1292
1313
1303
1254
19
41
25
56
47
28
42
62
38
Flame
(°0
1499
1385
1485
1460
1529
1482
1510
1524
1460
The incineration permits required that during startup (1) Herbicide
Orange could not be fed until flame temperatures had reached 1280°C, (2)
only one burner at a time could be switched from fuel oil to herbicide, and
(3) flame temperatures of 1280°C had to be reached before the next burner was
changed to herbicide. During the startup period of each burn, flame tempera-
tures were measured with the optical pyrometer. Flame temperatures were always
in excess of 1280°C as the burners were changed one-by-one to herbicide.
Based on the elemental composition of the waste (Table 8) and an average
feed rate of 7.3 metric tons per hour per incinerator, the average emission
rates of major stack gas components from each incinerator were calculated
(Appendix F.3) to be:
C02 6,690 m3/hr
HC1 1,378 m3/hr
02 5,781 m3/hr
N2 47,150 m3/hr
H20 4,839 m3/hr
for a total average combustion effluent flow rate of 65,838 m3/hr at 0°C.
58
image:
TABLE 21. INCINERATOR TEMPERATURES - THIRD BURN
Starboard Furnace
Date
8/25
8/26
8/27
8/28
8/29
8/30
8/31
9/1
9/2
Indicator
x(°C) o(°C)
1181
1195
1207
1177
1190
1203
1199
1191
1199
14
9
15
16
20
20
10
17
24
Controller
x(°C) o(°C)
1273
1294
1310
1262
1288
1298
1300
1277
1283
38
40
43
48
46
52
36
44
51
Flame
(°c)
1427
1574
1493
1493
1510
1471
1471
1454
1526
Indicator
x(°C) 0(°C)
1212
1198
1209
1193
1251
1234
1238
1236
1200
12
22
11
22
30
15
23
35
18
Port Furnace
Controller
x(°C) 0(°C)
1265
1227
1257
1231
1325
1292
1313
1303
1254
19
41
25
56
47
28
42
62
38
Flame
(°0
1499
1385
1485
1460
1529
1482
1510
1524
1460
The incineration permits required that during startup (1) Herbicide
Orange could not be fed until flame temperatures had reached 1280°C, (2)
only one burner at a time could be switched from fuel oil to herbicide, and
(3) flame temperatures of 1280°C had to be reached before the next burner was
changed to herbicide. During the startup period of each burn, flame tempera-
tures were measured with the optical pyrometer. Flame temperatures were always
in excess of 1280°C as the burners were changed one-by-one to herbicide.
Based on the elemental composition of the waste (Table 8) and an average
feed rate of 7.3 metric tons per hour per incinerator, the average emission
rates of major stack gas components from each incinerator were calculated
(Appendix F.3) to be:
C02 6,690 m3/hr
HC1 1,378 m3/hr
02 5,781 m3/hr
N2 47,150 m3/hr
H20 4,839 m3/hr
for a total average combustion effluent flow rate of 65,838 m3/hr at 0°C.
58
image:
 Incinerator residence time was calculated from:
120
65,838 „
x
sec
3600 273.16
3
where 120 is the volume of an incinerator in m ; 65,838 is the average calcu-
lated combustion effluent flow rate in m /hr at 0°C; and T is the flame tempera-
ture in °K. Incinerator residence times at different flame temperatures
(Appendix F-4) are given below:
Flame Temperature Residence Time
(°C) (sec)
1100 1.31
1200 1.22
1300 1.14
1400 1.07
1500 1.01
4.2 ANALYTICAL RESULTS
The results of laboratory analyses by TRW, WSU, and BCL of samples taken
during the Herbicide Orange program are presented and discussed in this section.
The purpose and scope of laboratory analyses performed by the three contractors
were quite different. The TRW combustion effluent analyses were intended pri-
marily to assure permit conditions were met.
Wright State University analyzed the combustion effluent samples for TCDD
only. The results of their analyses for TCDD were used in deciding to issue a
Special Permit for the second and third burns and to assess the overall accept-
ability of the incineration based on the destruction efficiency for TCDD.
Battelle-Columbus analyzed benzene impinger samples for 2,4-D and 2,4,5-T
in order to give rapid confirmation of shipboard analyses. BCL also analyzed
workspace air monitor samples and ship's drinking water samples for 2,4-D and
2,4,5-T.
The analytical methodology used by each of the three contractors is
described briefly in this section.
59
image:
Incinerator residence time was calculated from:
120
65,838 „
x
sec
3600 273.16
3
where 120 is the volume of an incinerator in m ; 65,838 is the average calcu-
lated combustion effluent flow rate in m /hr at 0°C; and T is the flame tempera-
ture in °K. Incinerator residence times at different flame temperatures
(Appendix F-4) are given below:
Flame Temperature Residence Time
(°C) (sec)
1100 1.31
1200 1.22
1300 1.14
1400 1.07
1500 1.01
4.2 ANALYTICAL RESULTS
The results of laboratory analyses by TRW, WSU, and BCL of samples taken
during the Herbicide Orange program are presented and discussed in this section.
The purpose and scope of laboratory analyses performed by the three contractors
were quite different. The TRW combustion effluent analyses were intended pri-
marily to assure permit conditions were met.
Wright State University analyzed the combustion effluent samples for TCDD
only. The results of their analyses for TCDD were used in deciding to issue a
Special Permit for the second and third burns and to assess the overall accept-
ability of the incineration based on the destruction efficiency for TCDD.
Battelle-Columbus analyzed benzene impinger samples for 2,4-D and 2,4,5-T
in order to give rapid confirmation of shipboard analyses. BCL also analyzed
workspace air monitor samples and ship's drinking water samples for 2,4-D and
2,4,5-T.
The analytical methodology used by each of the three contractors is
described briefly in this section.
59
image:
 4.2.1 Detection Limits
It will be seen later in this section that incineration of Herbicide
Orange was quite effective. Neither 2,4-D nor 2,4,5-T was found in any com-
bustion effluent sample. The definition and usage of detection limits are thus
of importance in presenting the results of the analyses and in calculating
destruction efficiencies.
A detection limit is that amount of sought-for substance (analyte) which
gives a detectable signal. There are various definitions of what constitutes
a detectable signal; in the GC and GC/MS analyses in this program, a peak height
three times the noise level is considered detectable. Quantitation at the detec-
tion limit is marginal (± factor of 2-3) because the signal is not much larger
than the noise.
The.minimum detectable quantity may be defined as that amount of analyte
which produces a signal which is quantitatable with some specified level of
precision. The precision of quantitation at the minimum detectable quantity
is usually greater than at the detection limit.
If the analyte is not detected, it may still be present in the sample but
in an amount that does not produce a detectable signal. If the detection limit
is adequate for the purposes of the analysis, it is used to set an upper bound
on the analyte concentration which is indicated as less than (<) the value of
the detection limit.
4.2.2 TRW Analytical Methodology
The TRW analyses employed a variety of techniques to develop estimates of
the amounts and kinds of organic compounds emitted during the incineration
(8 9}
process. The analytical scheme was a modified U.S. EPA Level I approach/ ' '
Figure 16 is a flow chart of the analytical scheme. A brief description is
given below. Detailed procedures are given in Appendix C.
8."IERL-RTP Procedures Manual: Level 1 Environmental Assessment," U.S. EPA
Document No. EPA-600/2-76-160a, June 1976.
9. "Combustion Source Assessment. Methods and Procedures Manual for Sampling
and Analysis," TRW Report to U.S. EPA, September 1977.
60
image:
4.2.1 Detection Limits
It will be seen later in this section that incineration of Herbicide
Orange was quite effective. Neither 2,4-D nor 2,4,5-T was found in any com-
bustion effluent sample. The definition and usage of detection limits are thus
of importance in presenting the results of the analyses and in calculating
destruction efficiencies.
A detection limit is that amount of sought-for substance (analyte) which
gives a detectable signal. There are various definitions of what constitutes
a detectable signal; in the GC and GC/MS analyses in this program, a peak height
three times the noise level is considered detectable. Quantitation at the detec-
tion limit is marginal (± factor of 2-3) because the signal is not much larger
than the noise.
The.minimum detectable quantity may be defined as that amount of analyte
which produces a signal which is quantitatable with some specified level of
precision. The precision of quantitation at the minimum detectable quantity
is usually greater than at the detection limit.
If the analyte is not detected, it may still be present in the sample but
in an amount that does not produce a detectable signal. If the detection limit
is adequate for the purposes of the analysis, it is used to set an upper bound
on the analyte concentration which is indicated as less than (<) the value of
the detection limit.
4.2.2 TRW Analytical Methodology
The TRW analyses employed a variety of techniques to develop estimates of
the amounts and kinds of organic compounds emitted during the incineration
(8 9}
process. The analytical scheme was a modified U.S. EPA Level I approach/ ' '
Figure 16 is a flow chart of the analytical scheme. A brief description is
given below. Detailed procedures are given in Appendix C.
8."IERL-RTP Procedures Manual: Level 1 Environmental Assessment," U.S. EPA
Document No. EPA-600/2-76-160a, June 1976.
9. "Combustion Source Assessment. Methods and Procedures Manual for Sampling
and Analysis," TRW Report to U.S. EPA, September 1977.
60
image:
 SOLIDS
1
A GEL
1
SORKNT TRAP
BUM
RESIC
SOXHLET
EXTR'N
SOXHLET
EXTR'N
C7 - C17 GC
K-D CONC'N
ACETONE
BLANK
O - C17 GC
IMPINGE*
BLANKS
K-D CONCN
Figure 16. Flow diagram of TRW analysis plan.
image:
SOLIDS
1
A GEL
1
SORKNT TRAP
BUM
RESIC
SOXHLET
EXTR'N
SOXHLET
EXTR'N
C7 - C17 GC
K-D CONC'N
ACETONE
BLANK
O - C17 GC
IMPINGE*
BLANKS
K-D CONCN
Figure 16. Flow diagram of TRW analysis plan.
image:
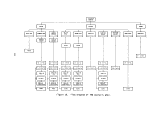 Organic compound emissions are grouped into three general categories:
• Gaseous - compounds boiling below 90°C
• Volatile - compounds boiling between 90° and 300°C
• Nonvolatile - compounds boiling above 300°C
Gaseous compounds were determined by the C1-C6 gas chromatographic (GC)
procedure. This analysis determined only amounts of organic compounds. No
attempt to identify compound classes or individual species was made. The sam-
ples in this program were taken in Tedlar gas sampling bags and analyzed at
TRW. There was no sample preparation.
Volatile organic compounds were determined by the C7-C16 GC procedure and
by gas chromatography-mass spectrometry. The amounts of organic compounds were
determined by the C7-C16 GC analysis. Compound classes and individual species
were determined by the GC/MS analysis. Sample preparation was by extraction
and concentration for solid samples and by concentration for liquid samples.
Nonvolatile organic compounds were determined by gravimetry, infrared
spectrophotometry, and thermogravimetry. The gravimetric analysis determines
the weight of nonvolatile residue obtained from concentrated samples. For this
program, the residue weights were large. Therefore, thermogravimetric analyses
were performed to determine whether the residues were wholly or only partially
organic. The combination of gravimetry and thermogravimetry gave a measure of
the amount of nonvolatile organic compounds in a sample. Infrared analyses
identified classes of organic compounds in a residue. The combination of the
three techniques thus gave estimates of the amounts of nonvolatile organic com-
pound emissions and the classes of compounds being emitted. If a residue was
large, it was separated into eight fractions, each of which was analyzed by
gravimetry and infrared spectrophotometry.
4.2.2.1 Sample Preparation
The extent of sample preparation varied with sample type. The sample types
acquired were:
• Sorbent traps
• Probe rinses
• Heat traced line rinses
• Burner residues
62
image:
Organic compound emissions are grouped into three general categories:
• Gaseous - compounds boiling below 90°C
• Volatile - compounds boiling between 90° and 300°C
• Nonvolatile - compounds boiling above 300°C
Gaseous compounds were determined by the C1-C6 gas chromatographic (GC)
procedure. This analysis determined only amounts of organic compounds. No
attempt to identify compound classes or individual species was made. The sam-
ples in this program were taken in Tedlar gas sampling bags and analyzed at
TRW. There was no sample preparation.
Volatile organic compounds were determined by the C7-C16 GC procedure and
by gas chromatography-mass spectrometry. The amounts of organic compounds were
determined by the C7-C16 GC analysis. Compound classes and individual species
were determined by the GC/MS analysis. Sample preparation was by extraction
and concentration for solid samples and by concentration for liquid samples.
Nonvolatile organic compounds were determined by gravimetry, infrared
spectrophotometry, and thermogravimetry. The gravimetric analysis determines
the weight of nonvolatile residue obtained from concentrated samples. For this
program, the residue weights were large. Therefore, thermogravimetric analyses
were performed to determine whether the residues were wholly or only partially
organic. The combination of gravimetry and thermogravimetry gave a measure of
the amount of nonvolatile organic compounds in a sample. Infrared analyses
identified classes of organic compounds in a residue. The combination of the
three techniques thus gave estimates of the amounts of nonvolatile organic com-
pound emissions and the classes of compounds being emitted. If a residue was
large, it was separated into eight fractions, each of which was analyzed by
gravimetry and infrared spectrophotometry.
4.2.2.1 Sample Preparation
The extent of sample preparation varied with sample type. The sample types
acquired were:
• Sorbent traps
• Probe rinses
• Heat traced line rinses
• Burner residues
62
image:
 t Composite feeds
• Grab gas in gas sampling bags
t Benzene impingers
The sorbent traps contain XAD-2, a porous polymer sorbent. The resin from
each trap was extracted in a soxhlet extractor with pentane for 24 hours. The
extract was then made to constant volume. Weighed portions of the burner resi-
dues were treated in the same manner. The probe and heat-traced line rinse
samples were acetone solutions which also contained aqueous HC1, dissolved
stainless steel, and firebrick particulates shed by the incinerator linings.
Because of the large amount of such particulate material, the second and third
®
burn probe and heat traced line rinses were filtered first through Whatman 41
®
filters and then through 47 micrometer cutoff Mi Hi pore filters. The volumes
of the probe and heat-traced line rinses were measured at Johnston Island after
each burn before shipment. The volumes were also measured prior to starting
the analyses.
Two-mi aliquots of the sorbent trap and burner residue extracts were set
aside for the C7-C16 GC analysis. The remainder of the extracts were concen-
trated to 2 ml. Similarly, 250-ml portions of the probe and heat-traced line
rinses were taken for analysis. A 2-ml aliquot of each was set aside for the
C7-C16 GC analysis, and the remaining 248-ml portions were concentrated to 2 ml.
4.2.2.2 Analytical Techniques
Brief descriptions of the analytical techniques used are given below:
• Gravimetry/Infrared Spectroscopy (Grav/IR): A 0.5-ml aliquot
of each concentrate was evaporated to constant weight, and the
nonvolatile residue weight was measured. This weight provided
an estimate of the content of nonvolatile organic compounds in
a sample. An infrared spectrum was measured on a portion of
each residue to give qualitative information on classes of com-
pounds present in the sample.
• Thermogravimetric Analysis (TGA): Despite having been filtered,
the residues from the probe and heat-traced line rinses were
higher than usually observed. It was suspected that the resi-
dues might have significant inorganic contents. Therefore,
thermogravimetric analyses were performed. Basically, the anal-
ysis involves heating the sample at a uniform rate and recording
weight loss as a function of temperature. The sample is con-
tained in a small pan suspended from a microbalance. The fur-
nace atmosphere was nitrogen, so that only organic carbon was
volatilized.
63
image:
t Composite feeds
• Grab gas in gas sampling bags
t Benzene impingers
The sorbent traps contain XAD-2, a porous polymer sorbent. The resin from
each trap was extracted in a soxhlet extractor with pentane for 24 hours. The
extract was then made to constant volume. Weighed portions of the burner resi-
dues were treated in the same manner. The probe and heat-traced line rinse
samples were acetone solutions which also contained aqueous HC1, dissolved
stainless steel, and firebrick particulates shed by the incinerator linings.
Because of the large amount of such particulate material, the second and third
®
burn probe and heat traced line rinses were filtered first through Whatman 41
®
filters and then through 47 micrometer cutoff Mi Hi pore filters. The volumes
of the probe and heat-traced line rinses were measured at Johnston Island after
each burn before shipment. The volumes were also measured prior to starting
the analyses.
Two-mi aliquots of the sorbent trap and burner residue extracts were set
aside for the C7-C16 GC analysis. The remainder of the extracts were concen-
trated to 2 ml. Similarly, 250-ml portions of the probe and heat-traced line
rinses were taken for analysis. A 2-ml aliquot of each was set aside for the
C7-C16 GC analysis, and the remaining 248-ml portions were concentrated to 2 ml.
4.2.2.2 Analytical Techniques
Brief descriptions of the analytical techniques used are given below:
• Gravimetry/Infrared Spectroscopy (Grav/IR): A 0.5-ml aliquot
of each concentrate was evaporated to constant weight, and the
nonvolatile residue weight was measured. This weight provided
an estimate of the content of nonvolatile organic compounds in
a sample. An infrared spectrum was measured on a portion of
each residue to give qualitative information on classes of com-
pounds present in the sample.
• Thermogravimetric Analysis (TGA): Despite having been filtered,
the residues from the probe and heat-traced line rinses were
higher than usually observed. It was suspected that the resi-
dues might have significant inorganic contents. Therefore,
thermogravimetric analyses were performed. Basically, the anal-
ysis involves heating the sample at a uniform rate and recording
weight loss as a function of temperature. The sample is con-
tained in a small pan suspended from a microbalance. The fur-
nace atmosphere was nitrogen, so that only organic carbon was
volatilized.
63
image:
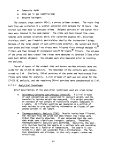 • C7-C16 Gas Chromatography: This analysis gives an estimate of
the volatile organic content of a sample: compounds boiling
between 90° and 300°C. The compounds in a neat sample or uncon-
centrated sample extract are separated in order of increasing
boiling points. Compounds in various ranges, defined in cali-
bration with the n-C7 through n-C16 alkanes, are quantitated
as n-decane.
• Liquid Chromatographic Separation (LC): If an extract contains
sufficient organic material that an emission concentration is
calculated to exceed 0.5 mg/m3 (or 0.1 mg/kg), then a portion
of the extract is separated into eight fractions by liquid chro-
matography. This separation has the effect of simplifying the
sample because each fraction will contain certain classes of
compounds. Each fraction is evaporated to dryness. The residue
weight is measured. An infrared spectrum is measured on each
residue having sufficient weight.
• Gas Chromatography - Mass Spectrometry (GC/MS): In this tech-
nique, compounds in a concentrate are separated by gas Chroma-
tography and detected by a mass spectrometer. The mass spectrum
of a compound is unique. In practice, the spectra of closely
related positional isomers and optical isomers are not distin-
guishable. GC/MS is not particularly quantitative unless stand-
ards of each sought-for compound are also available and analyzed.
In the analysis of the herbicide samples, quantitative measure-
ments were made for 2,4-D and 2,4,5-T. Estimates of concentrations
of other identified compounds were also made.
4.2.3 TRW Analytical Results
4.2.3.1 Waste Feed Analyses
Four composite feed samples, taken at Burner No. 4, were analyzed. One
was a sample of the diesel fuel used to heat the incinerators and was taken as
part of the background test. Two were Herbicide Orange. The fourth sample
was of herbicide-contaminated water that was flashed during the third burn.
The waste feed samples were analyzed by the following procedures:
• GC analysis for C6-C17 hydrocarbons
• GC/MS for qualitative analysis
The results of the C7-C16 GC analysis are given in Table 22. It can be
seen that the diesel fuel feed had a substantial content of compounds boiling
below 300°C. The two herbicide feeds have only small amounts of compounds
boiling below 300 C. The fourth feed sample had no detectable amounts of
organic compounds boiling below 300°C. (Both 2,4-D and 2,4,5-T, which comprise
more than 90% of Herbicide Orange, have boiling points well above 300°C.)
64
image:
• C7-C16 Gas Chromatography: This analysis gives an estimate of
the volatile organic content of a sample: compounds boiling
between 90° and 300°C. The compounds in a neat sample or uncon-
centrated sample extract are separated in order of increasing
boiling points. Compounds in various ranges, defined in cali-
bration with the n-C7 through n-C16 alkanes, are quantitated
as n-decane.
• Liquid Chromatographic Separation (LC): If an extract contains
sufficient organic material that an emission concentration is
calculated to exceed 0.5 mg/m3 (or 0.1 mg/kg), then a portion
of the extract is separated into eight fractions by liquid chro-
matography. This separation has the effect of simplifying the
sample because each fraction will contain certain classes of
compounds. Each fraction is evaporated to dryness. The residue
weight is measured. An infrared spectrum is measured on each
residue having sufficient weight.
• Gas Chromatography - Mass Spectrometry (GC/MS): In this tech-
nique, compounds in a concentrate are separated by gas Chroma-
tography and detected by a mass spectrometer. The mass spectrum
of a compound is unique. In practice, the spectra of closely
related positional isomers and optical isomers are not distin-
guishable. GC/MS is not particularly quantitative unless stand-
ards of each sought-for compound are also available and analyzed.
In the analysis of the herbicide samples, quantitative measure-
ments were made for 2,4-D and 2,4,5-T. Estimates of concentrations
of other identified compounds were also made.
4.2.3 TRW Analytical Results
4.2.3.1 Waste Feed Analyses
Four composite feed samples, taken at Burner No. 4, were analyzed. One
was a sample of the diesel fuel used to heat the incinerators and was taken as
part of the background test. Two were Herbicide Orange. The fourth sample
was of herbicide-contaminated water that was flashed during the third burn.
The waste feed samples were analyzed by the following procedures:
• GC analysis for C6-C17 hydrocarbons
• GC/MS for qualitative analysis
The results of the C7-C16 GC analysis are given in Table 22. It can be
seen that the diesel fuel feed had a substantial content of compounds boiling
below 300°C. The two herbicide feeds have only small amounts of compounds
boiling below 300 C. The fourth feed sample had no detectable amounts of
organic compounds boiling below 300°C. (Both 2,4-D and 2,4,5-T, which comprise
more than 90% of Herbicide Orange, have boiling points well above 300°C.)
64
image:
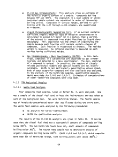 TABLE 22. RESULTS OF C7-C16 GC ANALYSES OF FEEDSTOCKS
Boiling Point Concentration in Sample, mg/ml
Range, °C HO-1-CF-714-F HO-1-CF-716-H HO-2-CF-813-H HO-3-CF-813-H
C7
C8
C9
CIO
Cll
C12
C13
C14
C15
C16
Total
90-110
110-140
140-160
160-180
180-200
200-220
220-240
240-260
260-280
280-300
<0.7
<0.7
<0.7
<0.7
200
<0.7
<0.7
<0.7
<0.7
180
380
<0.7
<0.7
<0.7
<0.7
<0.7
<0.7
<0.7
<0.7
<0.7
6.5
6.5
<0.7
<0.7
<0.7
<0.7
<0.7
<0.7
<0.7
<0.7
<0.7
11
11
<0.7
<0.7
<0.7
<0.7
<0.7
<0.7
<0.7
<0.7
<0.7
<0.7
<0.7
The results of the GC/MS analyses of the waste feeds are given in Table 23.
This analysis was quantitative for 2,4-D and 2,4,5-T to an accuracy of ± factor
of 2. Quantitation of other identified compounds is ± factor of 10. Each feed
was analyzed after first having been diluted a thousandfold with pentane. The
two herbicide feeds were also analyzed neat (i.e., not diluted); both of these
samples were identical.
4.2.3.2 Analysis of Lear-Siegler Train Samples
After sample penetration, a 0.5-ml aliquot of each concentrate was evap-
orated to constant weight to obtain a measure of nonvolatile residue, that is,
organic compounds boiling at greater than 300°C. The probe and heat-traced
line rinse samples gave high residue weights. It was decided to determine
whether these residues were partially inorganic. Small portions of the residues
were analyzed by thermogravimetric analysis (TGA). These results are given in
Table 24. Because the furnace atmosphere was nitrogen, only organic carbon was
determined; nonorganic carbon (e.g., graphite, carbon black) was not determined.
The weight loss at 300°C was taken as a measure of volatile organics; the weight
loss at 900°C was taken as a measure of the total organic compound content of a
sample. The data in Table 24 show that the nonvolatile residues from the probe
65
image:
TABLE 22. RESULTS OF C7-C16 GC ANALYSES OF FEEDSTOCKS
Boiling Point Concentration in Sample, mg/ml
Range, °C HO-1-CF-714-F HO-1-CF-716-H HO-2-CF-813-H HO-3-CF-813-H
C7
C8
C9
CIO
Cll
C12
C13
C14
C15
C16
Total
90-110
110-140
140-160
160-180
180-200
200-220
220-240
240-260
260-280
280-300
<0.7
<0.7
<0.7
<0.7
200
<0.7
<0.7
<0.7
<0.7
180
380
<0.7
<0.7
<0.7
<0.7
<0.7
<0.7
<0.7
<0.7
<0.7
6.5
6.5
<0.7
<0.7
<0.7
<0.7
<0.7
<0.7
<0.7
<0.7
<0.7
11
11
<0.7
<0.7
<0.7
<0.7
<0.7
<0.7
<0.7
<0.7
<0.7
<0.7
<0.7
The results of the GC/MS analyses of the waste feeds are given in Table 23.
This analysis was quantitative for 2,4-D and 2,4,5-T to an accuracy of ± factor
of 2. Quantitation of other identified compounds is ± factor of 10. Each feed
was analyzed after first having been diluted a thousandfold with pentane. The
two herbicide feeds were also analyzed neat (i.e., not diluted); both of these
samples were identical.
4.2.3.2 Analysis of Lear-Siegler Train Samples
After sample penetration, a 0.5-ml aliquot of each concentrate was evap-
orated to constant weight to obtain a measure of nonvolatile residue, that is,
organic compounds boiling at greater than 300°C. The probe and heat-traced
line rinse samples gave high residue weights. It was decided to determine
whether these residues were partially inorganic. Small portions of the residues
were analyzed by thermogravimetric analysis (TGA). These results are given in
Table 24. Because the furnace atmosphere was nitrogen, only organic carbon was
determined; nonorganic carbon (e.g., graphite, carbon black) was not determined.
The weight loss at 300°C was taken as a measure of volatile organics; the weight
loss at 900°C was taken as a measure of the total organic compound content of a
sample. The data in Table 24 show that the nonvolatile residues from the probe
65
image:
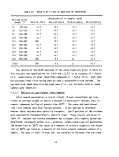 TABLE 23. RESULTS OF GCMS ANALYSES OF FEEDSTOCKS
Sample
HO-1-CF-714-F*
HO-1-CR-716-H*
HO-2-CF-813-H*
HO-3-CF-828-H*
HO-l-CF-716-Ht
HO-2-CF-813-H f
Compound
Hydrocarbons
Fluorene (i-pr)
2,4-D
2,4,5-T
2,4-D
2,4,5-T
Nothing other than solvent
Trichlorophenol
Tri chl oroani sole
Di chl oromethoxybenzene
Monochlorophenoxyacetic acid,
butyl ester
2,4-D
2,4,5-T
Di chl oromethoxyani sol e ,
octyl ester
Di chl orodi benzo-p-di oxi n
Same as neat sample of
HO-1-CF-716-H
Concentration
parts per thousand
Major
5
1000 (=
1000 (=
1000 (=
1000 (=
<1
Trace
Trace
Trace
Trace
Major
Major
Trace
Trace
50%)
50%)
50%)
50%)
These samples were diluted 1000-fold in pentane. Detection limit was
1 yg/ml.
These samples were run neat. The detection limit was 50 ng/yl.
66
image:
TABLE 23. RESULTS OF GCMS ANALYSES OF FEEDSTOCKS
Sample
HO-1-CF-714-F*
HO-1-CR-716-H*
HO-2-CF-813-H*
HO-3-CF-828-H*
HO-l-CF-716-Ht
HO-2-CF-813-H f
Compound
Hydrocarbons
Fluorene (i-pr)
2,4-D
2,4,5-T
2,4-D
2,4,5-T
Nothing other than solvent
Trichlorophenol
Tri chl oroani sole
Di chl oromethoxybenzene
Monochlorophenoxyacetic acid,
butyl ester
2,4-D
2,4,5-T
Di chl oromethoxyani sol e ,
octyl ester
Di chl orodi benzo-p-di oxi n
Same as neat sample of
HO-1-CF-716-H
Concentration
parts per thousand
Major
5
1000 (=
1000 (=
1000 (=
1000 (=
<1
Trace
Trace
Trace
Trace
Major
Major
Trace
Trace
50%)
50%)
50%)
50%)
These samples were diluted 1000-fold in pentane. Detection limit was
1 yg/ml.
These samples were run neat. The detection limit was 50 ng/yl.
66
image:
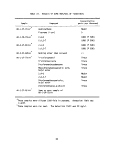 TABLE 24. ORGANIC CONTENTS OF LEAR-SIEGLER TRAIN SAMPLES
FROM THERMOGRAVIMETRIC ANALYSES
Sampl e
HO-l-LR-716
HO-l-PR-171
HO-2-LR-813
HO-2-PR-813
HO-3-LR-828
HO-3-PR-828
Percent Loss by 300°C
34.8
41.3
70.4
24.5
43.6
39.8
Percent Loss by 900°C
70.0
69.3
71.5
46
59.2
60.8
and heat-traced line rinses were significantly inorganic. For example, the
70% weight loss from HO-l-LR-716 indicates that the residue was 30% inorganic.
Correcting the residue weights for inorganic content gives a better estimation
of emissions of organic compounds with boiling points above 300 C.
Table 25 presents the results of the gravimetric analyses of the Lear-
Si egler train samples, corrected for solvent blanks and inorganic contents.
These corrected weights, corresponding to hydrocarbons with boiling points
greater than 300°C, are used in conjunction with infrared spectral analysis to
give information about emissions of the classes of nonvolatile hydrocarbons
emitted during the incineration.
Each residue was also analyzed by infrared spectrophotometry. Qualitative
interpretations of the IR spectra in terms of classes of compounds found in the
residues are given in Table 26. Phthalate esters and/or silicones were found in
most of the residues. These are ubiquitous compounds and are frequently found
as contaminants in trace organic analyses. Precautions were taken in both the
sampling and analysis operations in this program, but it seems that contamina-
tion occurred and in a random fashion. Because the phthalate esters and sili-
cones are present in unknown quantities, no assessment as to emissions of non-
volatile hydrocarbons can be made. The presence of substituted benzene
compounds and polynuclear aromatic hydrocarbon in most of the samples is note-
worthy. Analyses to be discussed later will show that these compounds are not
waste components, but rather, are probably synthesized in the flame.
67
image:
TABLE 24. ORGANIC CONTENTS OF LEAR-SIEGLER TRAIN SAMPLES
FROM THERMOGRAVIMETRIC ANALYSES
Sampl e
HO-l-LR-716
HO-l-PR-171
HO-2-LR-813
HO-2-PR-813
HO-3-LR-828
HO-3-PR-828
Percent Loss by 300°C
34.8
41.3
70.4
24.5
43.6
39.8
Percent Loss by 900°C
70.0
69.3
71.5
46
59.2
60.8
and heat-traced line rinses were significantly inorganic. For example, the
70% weight loss from HO-l-LR-716 indicates that the residue was 30% inorganic.
Correcting the residue weights for inorganic content gives a better estimation
of emissions of organic compounds with boiling points above 300 C.
Table 25 presents the results of the gravimetric analyses of the Lear-
Si egler train samples, corrected for solvent blanks and inorganic contents.
These corrected weights, corresponding to hydrocarbons with boiling points
greater than 300°C, are used in conjunction with infrared spectral analysis to
give information about emissions of the classes of nonvolatile hydrocarbons
emitted during the incineration.
Each residue was also analyzed by infrared spectrophotometry. Qualitative
interpretations of the IR spectra in terms of classes of compounds found in the
residues are given in Table 26. Phthalate esters and/or silicones were found in
most of the residues. These are ubiquitous compounds and are frequently found
as contaminants in trace organic analyses. Precautions were taken in both the
sampling and analysis operations in this program, but it seems that contamina-
tion occurred and in a random fashion. Because the phthalate esters and sili-
cones are present in unknown quantities, no assessment as to emissions of non-
volatile hydrocarbons can be made. The presence of substituted benzene
compounds and polynuclear aromatic hydrocarbon in most of the samples is note-
worthy. Analyses to be discussed later will show that these compounds are not
waste components, but rather, are probably synthesized in the flame.
67
image:
 TABLE 25. RESULTS OF GRAVIMETRIC ANALYSES OF LEAR-SIEGLER TRAIN SAMPLES
00
Sampl e
HO-1-ST-714-F
HO-1-LR-714-F
HO-1-ST-716-H
HO-1-LR-716-H
HO-1-PR-717-H
HO-2-ST-813-H
HO-2-LR-813-H
HO-2-PR-813-H
HO-3-ST-828-H
HO-3-LR-828-H
HO-3-PR-828-H
Residue
Weight
mg
0.561
0.250
0.727
184.572
337.873
2.195
386.786
218.946
2.827
216.918
98.089
Volume
Concentrated
ml*
298/300
248/250
348/350
248/250
248/250
298/300
248/250
248/250
198/200
248/250
248/250
Blank
Correction
mg
0.422
0.620
0.422
0.620
0.620
0.422
0.620
0.620
0.422
0.620
0.620
Volume
of
Sample
2098
2191
310
1031
398
1485
383
Organic
Fraction
%
t
t
t
70.0
69.3
t
71.5
46.0
t
59.2
60.8
Weight in
Sample
mg
1.837
3.256
2.503
4562
1170
8.417
4597
646
11.000
3074
368
Sample calculation in Appendix F.5.
*This notation indicates that, for example, 298 ml of the 300 ml extract volume of the sorbent trap
of 7/14/77 was concentrated.
These residues were too small to perform thermogravimetry.
image:
TABLE 25. RESULTS OF GRAVIMETRIC ANALYSES OF LEAR-SIEGLER TRAIN SAMPLES
00
Sampl e
HO-1-ST-714-F
HO-1-LR-714-F
HO-1-ST-716-H
HO-1-LR-716-H
HO-1-PR-717-H
HO-2-ST-813-H
HO-2-LR-813-H
HO-2-PR-813-H
HO-3-ST-828-H
HO-3-LR-828-H
HO-3-PR-828-H
Residue
Weight
mg
0.561
0.250
0.727
184.572
337.873
2.195
386.786
218.946
2.827
216.918
98.089
Volume
Concentrated
ml*
298/300
248/250
348/350
248/250
248/250
298/300
248/250
248/250
198/200
248/250
248/250
Blank
Correction
mg
0.422
0.620
0.422
0.620
0.620
0.422
0.620
0.620
0.422
0.620
0.620
Volume
of
Sample
2098
2191
310
1031
398
1485
383
Organic
Fraction
%
t
t
t
70.0
69.3
t
71.5
46.0
t
59.2
60.8
Weight in
Sample
mg
1.837
3.256
2.503
4562
1170
8.417
4597
646
11.000
3074
368
Sample calculation in Appendix F.5.
*This notation indicates that, for example, 298 ml of the 300 ml extract volume of the sorbent trap
of 7/14/77 was concentrated.
These residues were too small to perform thermogravimetry.
image:
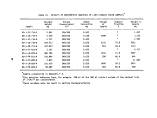 TABLE 26. CLASSES OF NONVOLATILE ORGANIC COMPOUNDS PRESENT
IN LEAR-SIEGLER TRAIN SAMPLES
Sample Compound Classes
HO-1-ST-714-F Phthalate esters, disubstituted benzene compounds,
chlorinated compounds
HO-1-LR-714-F Phthalate esters, organosilicones
HQ-1-ST-716-H Phthalate esters
HO-1-LR-716-H Substituted benzene compounds, polynuclear aro-
matic hydrocarbons, aldehyde-ketone
HO-1-PR-717-H Substituted benzene compounds, polynuclear aro-
matic hydrocarbons
HO-2-ST-813-H Phthalate esters
HO-2-LR-813-H Silicone compounds
HO-2-PR-813-H Esters-aldehydes-ketones, benzenoid compounds
HO-3-ST-828-H Phthalate esters, disubstituted benzene compounds,
chlorinated compounds
HO-3-LR-828-H Esters, benzene derivatives
HO-3-PR-828-H Silicones
A measure of the volatile organic compound content of the Lear-Siegler
train samples was obtained from the C7-C16 GC procedure. Results of these anal-
yses are presented in Table 27 which gives, as emission concentrations, the
amounts of material detected in each boiling point range and the total chroma-
tographable organic content. It is seen from the results in Table 27 that the
probe and heat-traced lines rinse samples had substantial quantities of chroma-
tographable organic compounds. Although these analyses were performed on neat
(unconcentrated) portions of the samples, water and aqueous HC1 are not detected
and do not contribute to the total chromatographable organic content.
In the Level I organic analysis scheme, if a residue weight, calculated at
o
the source, exceeds a certain concentration (0.5 mg/m and 0.1 mg/kg for liquids
and solids), then a suitably sized portion of the extract is taken for liquid
chromatograpnic separation. The separation yields eight fractions, each of
which contains reasonably distinct classes of organic compounds. This simpli-
fies the identification of compound classes and gives an estimate of the amounts
of compound classes present in the sample. Each fraction is evaporated to con-
stant weight. Nonvolatile residue weight is recorded, and an infrared spectrum
is measured on each residue.
69
image:
TABLE 26. CLASSES OF NONVOLATILE ORGANIC COMPOUNDS PRESENT
IN LEAR-SIEGLER TRAIN SAMPLES
Sample Compound Classes
HO-1-ST-714-F Phthalate esters, disubstituted benzene compounds,
chlorinated compounds
HO-1-LR-714-F Phthalate esters, organosilicones
HQ-1-ST-716-H Phthalate esters
HO-1-LR-716-H Substituted benzene compounds, polynuclear aro-
matic hydrocarbons, aldehyde-ketone
HO-1-PR-717-H Substituted benzene compounds, polynuclear aro-
matic hydrocarbons
HO-2-ST-813-H Phthalate esters
HO-2-LR-813-H Silicone compounds
HO-2-PR-813-H Esters-aldehydes-ketones, benzenoid compounds
HO-3-ST-828-H Phthalate esters, disubstituted benzene compounds,
chlorinated compounds
HO-3-LR-828-H Esters, benzene derivatives
HO-3-PR-828-H Silicones
A measure of the volatile organic compound content of the Lear-Siegler
train samples was obtained from the C7-C16 GC procedure. Results of these anal-
yses are presented in Table 27 which gives, as emission concentrations, the
amounts of material detected in each boiling point range and the total chroma-
tographable organic content. It is seen from the results in Table 27 that the
probe and heat-traced lines rinse samples had substantial quantities of chroma-
tographable organic compounds. Although these analyses were performed on neat
(unconcentrated) portions of the samples, water and aqueous HC1 are not detected
and do not contribute to the total chromatographable organic content.
In the Level I organic analysis scheme, if a residue weight, calculated at
o
the source, exceeds a certain concentration (0.5 mg/m and 0.1 mg/kg for liquids
and solids), then a suitably sized portion of the extract is taken for liquid
chromatograpnic separation. The separation yields eight fractions, each of
which contains reasonably distinct classes of organic compounds. This simpli-
fies the identification of compound classes and gives an estimate of the amounts
of compound classes present in the sample. Each fraction is evaporated to con-
stant weight. Nonvolatile residue weight is recorded, and an infrared spectrum
is measured on each residue.
69
image:
 TABLE 27. EMISSIONS OF VOLATILE ORGANIC COMPOUNDS FROM C7-C16
GC ANALYSES OF LEAR-SIEGLER TRAIN SAMPLES*
Emission Concentration, ppm ' n .. ... .. Total
rY Detection Chromatographable
C7 „ C8 . C9 „ CIO „ Cll „ C12 „ C13 „ C14 „ C15 „ C16 „ Limit Organic Content
Sample 90-120°C 120-140°C 140-160°C 160-180°C 180-200°C 200-220°C 220-240°C 240-260°C 260-280°C 280-300°C mg/m3 mg/m3
HO-1-ST-714F + * +
HO-1-LR-714F + 7.5 +
HO-1-ST-716-H + + +
HO-1-LR-716-H + * +
HO-1-PR-717-H + 7.6 +
HO-2-ST-813-H 0.61 0.14 +
HO-2-LR-813-H + <• +
HO-2-PR-813-H + * .13
HO-3-ST-828-H + + +
HO-3-LR-828-H 2.2 8.0 +
HO-3-PR-828-H + 3.4 +
0.23 +
3.7 +
0.23 +
4.3 +
0.1 +
+ +
2.3 +
6.0 +
+ +
0.65 +
+ +
+ + . 0.15 + + <0.05
+ +2.7 + +• <0.4
+ + 0.12 + + <0.04
1.1 2.2 2.9 1.6 + <0.3
+ + 0.08 + + <0.01
+ + + 0.10 + <0.02
0.23 + + + + <0.08
0.50 0.09 0.09 0.27 2.6 <0.03
•f + + + + < 0.02
+ + + + + <0.2
+ + + + + <0.04
0.38
14
0.35
12.1
7.8
0.85
3
26
<0.2
11
3.4
*Gas volumes corrected to 20°C. Sample calculation in Appendix F.6. See Appendix F.12 for conversion of mg/m3 to ppm.
+Indicates nothing was detected in that range. The column labeled Detection Limit shows the amount of material which could have been present
without being detected. The pluses were used to highlight what was found rather than what was not found, since most of the entries would be less
than values. The detection limit for these analyses was 0.7 ng/u £ Injected.
image:
TABLE 27. EMISSIONS OF VOLATILE ORGANIC COMPOUNDS FROM C7-C16
GC ANALYSES OF LEAR-SIEGLER TRAIN SAMPLES*
Emission Concentration, ppm ' n .. ... .. Total
rY Detection Chromatographable
C7 „ C8 . C9 „ CIO „ Cll „ C12 „ C13 „ C14 „ C15 „ C16 „ Limit Organic Content
Sample 90-120°C 120-140°C 140-160°C 160-180°C 180-200°C 200-220°C 220-240°C 240-260°C 260-280°C 280-300°C mg/m3 mg/m3
HO-1-ST-714F + * +
HO-1-LR-714F + 7.5 +
HO-1-ST-716-H + + +
HO-1-LR-716-H + * +
HO-1-PR-717-H + 7.6 +
HO-2-ST-813-H 0.61 0.14 +
HO-2-LR-813-H + <• +
HO-2-PR-813-H + * .13
HO-3-ST-828-H + + +
HO-3-LR-828-H 2.2 8.0 +
HO-3-PR-828-H + 3.4 +
0.23 +
3.7 +
0.23 +
4.3 +
0.1 +
+ +
2.3 +
6.0 +
+ +
0.65 +
+ +
+ + . 0.15 + + <0.05
+ +2.7 + +• <0.4
+ + 0.12 + + <0.04
1.1 2.2 2.9 1.6 + <0.3
+ + 0.08 + + <0.01
+ + + 0.10 + <0.02
0.23 + + + + <0.08
0.50 0.09 0.09 0.27 2.6 <0.03
•f + + + + < 0.02
+ + + + + <0.2
+ + + + + <0.04
0.38
14
0.35
12.1
7.8
0.85
3
26
<0.2
11
3.4
*Gas volumes corrected to 20°C. Sample calculation in Appendix F.6. See Appendix F.12 for conversion of mg/m3 to ppm.
+Indicates nothing was detected in that range. The column labeled Detection Limit shows the amount of material which could have been present
without being detected. The pluses were used to highlight what was found rather than what was not found, since most of the entries would be less
than values. The detection limit for these analyses was 0.7 ng/u £ Injected.
image:
 Table 28 gives the residue weights of the Lear-Siegler train samples sep-
arated by liquid chromatography. While all of the samples except the sorbent
traps of 7/14/77 and 7/16/77 met the criterion for the separation, only those
samples listed in .Table 28 had sufficient material to perform the separation.
It is sometimes difficult to dry the latter three fractions, which contain
methanol in the eluent. Infrared spectra of several fractions showed that they
were not dry or were indistinguishable from the corresponding blank. Two frac-
tions (6 and 7) in the line rinse of 8/13/77 evidently contained inorganic
acids, as the aluminum evaporation-weighing dishes were partially dissolved.
Table 29 presents the interpretations of the IR spectra of the residues
from the LC separations which had sufficient material (greater than 0.1 mg).
Phthalate esters and/or silicones were again found in most of the residues.
Benzenoid compounds and polynuclear aromatic hydrocarbons were also found in
the line and probe rinse fractions.
Gas chromatographic-mass spectrometric analyses were performed on the con-
centrates from the Lear-Siegler train samples. These analyses were quantitative
for 2,4-D and 2,4,5-T. An attempt was made to identify other compounds found
and to give semi quantitative estimates of amounts. The results of these anal-
yses are given in Table 30. There were a number of unidentifiable compounds.
The major reason for not being able to identify a compound was the lack of a
reference spectrum in the GC/MS spectral data library. To identify a compound,
the mass spectrum of that compound is compared with reference mass spectra in
the library. If no match is found, the compound cannot be identified.
It is noteworthy that neither 2,4-D nor 2,4,5-T was found in any of the
Lear-Siegler train samples. Phthalate esters and/or silicones were found in
all of the samples. Many interesting compounds were found. Fluorene was found
in the diesel fuel and in the line rinse from the fuel oil background. Dichlor-
obiphenyl, a polychlorinated biphenyl, was found in the sorbent trap samples
taken when herbicide was burned. However, no other polychlorinated biphenyls
were identified. The probe and heat-traced line rinses from the herbicide
tests contained a variety of aromatic compounds. A number of polynuclear aro-
matic compounds were identified.
71
image:
Table 28 gives the residue weights of the Lear-Siegler train samples sep-
arated by liquid chromatography. While all of the samples except the sorbent
traps of 7/14/77 and 7/16/77 met the criterion for the separation, only those
samples listed in .Table 28 had sufficient material to perform the separation.
It is sometimes difficult to dry the latter three fractions, which contain
methanol in the eluent. Infrared spectra of several fractions showed that they
were not dry or were indistinguishable from the corresponding blank. Two frac-
tions (6 and 7) in the line rinse of 8/13/77 evidently contained inorganic
acids, as the aluminum evaporation-weighing dishes were partially dissolved.
Table 29 presents the interpretations of the IR spectra of the residues
from the LC separations which had sufficient material (greater than 0.1 mg).
Phthalate esters and/or silicones were again found in most of the residues.
Benzenoid compounds and polynuclear aromatic hydrocarbons were also found in
the line and probe rinse fractions.
Gas chromatographic-mass spectrometric analyses were performed on the con-
centrates from the Lear-Siegler train samples. These analyses were quantitative
for 2,4-D and 2,4,5-T. An attempt was made to identify other compounds found
and to give semi quantitative estimates of amounts. The results of these anal-
yses are given in Table 30. There were a number of unidentifiable compounds.
The major reason for not being able to identify a compound was the lack of a
reference spectrum in the GC/MS spectral data library. To identify a compound,
the mass spectrum of that compound is compared with reference mass spectra in
the library. If no match is found, the compound cannot be identified.
It is noteworthy that neither 2,4-D nor 2,4,5-T was found in any of the
Lear-Siegler train samples. Phthalate esters and/or silicones were found in
all of the samples. Many interesting compounds were found. Fluorene was found
in the diesel fuel and in the line rinse from the fuel oil background. Dichlor-
obiphenyl, a polychlorinated biphenyl, was found in the sorbent trap samples
taken when herbicide was burned. However, no other polychlorinated biphenyls
were identified. The probe and heat-traced line rinses from the herbicide
tests contained a variety of aromatic compounds. A number of polynuclear aro-
matic compounds were identified.
71
image:
 TABLE 28. GRAVIMETRIC RESULTS OF LIQUID CHROMATOGRAPHIC SEPARATIONS OF LEAR-SIEGLER TRAIN SAMPLES
ro
Fraction
1
2
3
4
5
6
7
8
HO-l-LR-716
0.0
0.0
0.1
0.0
0.1
171.4
90.5*
31.1*
HO-l-PR-716
0.2
2.1
0.7'
3.5
73.8
87. 2*
30. 5*
11.2*
Sample, Residue
HO-2-LR-813
0.1
0.0
0.3
0.2
0.0
284.1*
184.4*
11.9*
Weight In mg
HO-2-PR-813
2.9
0.0
7.2
46.3
32.5
68.5
27.4
6.8*
HO-3-LR-828
0.0
0.0
0.0
0.0
1.4
136.4
54.5
12.5*
HO-3-PR-828
4.4
0.1
0.5
0.2
6.6
75.0
36.2
19.2*
Blank
0.0
0.0
0.0
0.0
0.5
1.0
6.5
15+
These fractions contained acids which reacted with the aluminum weighing pans. The eighth fraction eluent
contains HC1, so that these solutions were evaporated in glass dishes.
HThis sample was lost in analysis. The value reflects past experience with these fractions.
*These fractions were wet and/or had IR spectra indistinguishable from the corresponding blank.
image:
TABLE 28. GRAVIMETRIC RESULTS OF LIQUID CHROMATOGRAPHIC SEPARATIONS OF LEAR-SIEGLER TRAIN SAMPLES
ro
Fraction
1
2
3
4
5
6
7
8
HO-l-LR-716
0.0
0.0
0.1
0.0
0.1
171.4
90.5*
31.1*
HO-l-PR-716
0.2
2.1
0.7'
3.5
73.8
87. 2*
30. 5*
11.2*
Sample, Residue
HO-2-LR-813
0.1
0.0
0.3
0.2
0.0
284.1*
184.4*
11.9*
Weight In mg
HO-2-PR-813
2.9
0.0
7.2
46.3
32.5
68.5
27.4
6.8*
HO-3-LR-828
0.0
0.0
0.0
0.0
1.4
136.4
54.5
12.5*
HO-3-PR-828
4.4
0.1
0.5
0.2
6.6
75.0
36.2
19.2*
Blank
0.0
0.0
0.0
0.0
0.5
1.0
6.5
15+
These fractions contained acids which reacted with the aluminum weighing pans. The eighth fraction eluent
contains HC1, so that these solutions were evaporated in glass dishes.
HThis sample was lost in analysis. The value reflects past experience with these fractions.
*These fractions were wet and/or had IR spectra indistinguishable from the corresponding blank.
image:
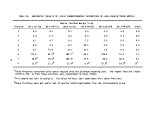 TABLE 29. COMPOUND CLASSES PRESENT IN LC FRACTIONS FROM
LEAR-SIEGLER TRAIN SAMPLES *
Sample
Compound Classes
HO-2-LR-813
Fraction 1
Fraction 6
Fraction 7
Fraction 8
HO-3-LR-828
Fraction 5
Fraction 6
Fraction 8
HO-3-PR-828
Fraction 1
Fraction 3
Fraction 5
Fraction 6
Fraction 7
HO-l-LR-716
Fraction 3
Fraction 6
Fraction 8
Saturated aliphatic hydrocarbons
Same as blank
Same as blank
Same as blank
Phthalate esters
Phthalate esters
Same as blank
Esters; silicones; benzene derivatives, including PAH
compounds; aldehydes-ketones
Esters, silicones, aldehydes-ketones
Esters, silicones, aldehydes-ketones
Esters, silicones, aldehydes-ketones
Same as blank
Phthalate esters
Esters
Same as blank
(continued)
* IR spectra were not run on residues with weights less than 0.1 mg.
73
image:
TABLE 29. COMPOUND CLASSES PRESENT IN LC FRACTIONS FROM
LEAR-SIEGLER TRAIN SAMPLES *
Sample
Compound Classes
HO-2-LR-813
Fraction 1
Fraction 6
Fraction 7
Fraction 8
HO-3-LR-828
Fraction 5
Fraction 6
Fraction 8
HO-3-PR-828
Fraction 1
Fraction 3
Fraction 5
Fraction 6
Fraction 7
HO-l-LR-716
Fraction 3
Fraction 6
Fraction 8
Saturated aliphatic hydrocarbons
Same as blank
Same as blank
Same as blank
Phthalate esters
Phthalate esters
Same as blank
Esters; silicones; benzene derivatives, including PAH
compounds; aldehydes-ketones
Esters, silicones, aldehydes-ketones
Esters, silicones, aldehydes-ketones
Esters, silicones, aldehydes-ketones
Same as blank
Phthalate esters
Esters
Same as blank
(continued)
* IR spectra were not run on residues with weights less than 0.1 mg.
73
image:
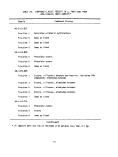 TABLE 29. (continued)*
Sample
Compound Classes
HO-l-PR-717
Fraction 2
Fraction 3
Fraction 4
Fraction 5
Fraction 8
HO-2-PR-813
Fraction 1
Fraction 2
Fraction 3
Fraction 4
Fraction 5
Fraction 6
Fraction 7
Fraction 8
Phthalate esters
Phthalate esters
Esters, aldehydes-ketones, benzene derivatives,
silicones
Esters, aldehydes-ketones, benzene derivatives
Same as blank
Benzene derivatives, including PAH compounds; esters;
aldehydes-ketones
Benzene derivatives, including PAH compounds;
aldehydes-ketones; silicones
Benzene derivatives, including PAH compounds, esters;
aldehydes-ketones; silicones
Benzene derivatives, esters, aldehydes-ketones
Esters, aldehydes-ketones
Esters, aldehydes-ketones
Aldehydes-ketones
Same as blank
* IR spectra were not run on residues with weights less than 0.1 mg.
74
image:
TABLE 29. (continued)*
Sample
Compound Classes
HO-l-PR-717
Fraction 2
Fraction 3
Fraction 4
Fraction 5
Fraction 8
HO-2-PR-813
Fraction 1
Fraction 2
Fraction 3
Fraction 4
Fraction 5
Fraction 6
Fraction 7
Fraction 8
Phthalate esters
Phthalate esters
Esters, aldehydes-ketones, benzene derivatives,
silicones
Esters, aldehydes-ketones, benzene derivatives
Same as blank
Benzene derivatives, including PAH compounds; esters;
aldehydes-ketones
Benzene derivatives, including PAH compounds;
aldehydes-ketones; silicones
Benzene derivatives, including PAH compounds, esters;
aldehydes-ketones; silicones
Benzene derivatives, esters, aldehydes-ketones
Esters, aldehydes-ketones
Esters, aldehydes-ketones
Aldehydes-ketones
Same as blank
* IR spectra were not run on residues with weights less than 0.1 mg.
74
image:
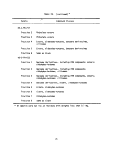 TABLE 30. GC/MS ANALYSES OF LEAR-SIEGLER TRAIN SAMPLES*
Sampl e
HO-l-ST-714
HO-l-LR-714
HO-l-ST-716
HO-l-LR-716
HO-l-PR-717
Compound
Organo-silicone
Organo-silicone
Phthalate ester
Phthalate ester
Phthalate ester
Fluorene - (CH3)5
Dichlorobiphenyl
Phthalate ester
Unknown, chlorinated
Substituted aromatic
Organo-silicone
C14H22' subst- aromatic
^14^22* subst- Aromatic
Substituted aromatic
Substituted aromatic
Substituted aromatic
Substituted aromatic
Pyrene
Organo-silicone
Organo-silicone
Hydrocarbons
Concentration
ng/yl
10
10
5
5
5
10
10
2
10
5
5
5
5
5
5
5
5
5
5
5
Major
Stack
Concentration
yg/m3
5
5
3
3
20
40
3
0.7
3
15
15
15
15
15
15
15
15
15
15
0.8
(continued)
*
Sample calculation in Appendix F.7. See Appendix F.12 for conversion of
ug/m3 to ppb. The detection limit was 1 ng/ul. Accuracy for 2,4-D and
2,4,5-T was ± factor of 2. Accuracy for other species was ± factor of 10.
75
image:
TABLE 30. GC/MS ANALYSES OF LEAR-SIEGLER TRAIN SAMPLES*
Sampl e
HO-l-ST-714
HO-l-LR-714
HO-l-ST-716
HO-l-LR-716
HO-l-PR-717
Compound
Organo-silicone
Organo-silicone
Phthalate ester
Phthalate ester
Phthalate ester
Fluorene - (CH3)5
Dichlorobiphenyl
Phthalate ester
Unknown, chlorinated
Substituted aromatic
Organo-silicone
C14H22' subst- aromatic
^14^22* subst- Aromatic
Substituted aromatic
Substituted aromatic
Substituted aromatic
Substituted aromatic
Pyrene
Organo-silicone
Organo-silicone
Hydrocarbons
Concentration
ng/yl
10
10
5
5
5
10
10
2
10
5
5
5
5
5
5
5
5
5
5
5
Major
Stack
Concentration
yg/m3
5
5
3
3
20
40
3
0.7
3
15
15
15
15
15
15
15
15
15
15
0.8
(continued)
*
Sample calculation in Appendix F.7. See Appendix F.12 for conversion of
ug/m3 to ppb. The detection limit was 1 ng/ul. Accuracy for 2,4-D and
2,4,5-T was ± factor of 2. Accuracy for other species was ± factor of 10.
75
image:
 TABLE 30. (continued)
Sampl e
HO-2-ST-813
HO-2-LR-813
HO-2-PR-813
HO-3-ST-828
HO-3-LR-828
Compound
Aromatic
Dichloroaromatic
Trichlorophenol
Trichloroaromatic
Dichlorobiphenyl
Phthalate ester
Unknown, chlorinated
Benzil
Phthalate ester
Organo-silicone
Organo-silicone
Many other unidentified
compounds
Unknown, chlorinated
Dichlorobiphenyl
Chi oromethyl acenapthene
Unknown, chlorinated
Benzil
Phthalate ester
(CH3)x-aromatic (MW 288)
(CH3)x-aromatic (MW 288)
Organo-silicone
(CH.J -aromatic (MW 202)
0 X
(continued)
76
Concentration
ng/ul
100
100
50
20
20
20
50
20
1000
50
Major
Major
100
10
10
100
100
100
50
50
10
10
Stack
Concentration
yg/m^
20
20
10
5
5
5
10
5
230
50
30
3
3
30
30
30
90
90
20
20
image:
TABLE 30. (continued)
Sampl e
HO-2-ST-813
HO-2-LR-813
HO-2-PR-813
HO-3-ST-828
HO-3-LR-828
Compound
Aromatic
Dichloroaromatic
Trichlorophenol
Trichloroaromatic
Dichlorobiphenyl
Phthalate ester
Unknown, chlorinated
Benzil
Phthalate ester
Organo-silicone
Organo-silicone
Many other unidentified
compounds
Unknown, chlorinated
Dichlorobiphenyl
Chi oromethyl acenapthene
Unknown, chlorinated
Benzil
Phthalate ester
(CH3)x-aromatic (MW 288)
(CH3)x-aromatic (MW 288)
Organo-silicone
(CH.J -aromatic (MW 202)
0 X
(continued)
76
Concentration
ng/ul
100
100
50
20
20
20
50
20
1000
50
Major
Major
100
10
10
100
100
100
50
50
10
10
Stack
Concentration
yg/m^
20
20
10
5
5
5
10
5
230
50
30
3
3
30
30
30
90
90
20
20
image:
 TABLE 30. (continued)
Sample
HO-3-LR-828
(Cont.)
HO-3-PR-828
Compound
(CH3) -aromatic
Organo-silicone
Pyrene
Organo-silicone
Phthalate ester
(CH3)x-aromatic (MW 196)
Chloro-aromatic (MU 218)
Anthracene
(CH3)x-aromatic (MW 200)
(CH3)x-aromatic (MW 216)
(CH3)x-aromatic (MW 276)
(CH,) -aromatic (MW 216)
<J A
Methyl , ethyl -pyrene •
(CH,) -aromatic (MW 258)
0 A
(CH-) -aromatic (MW 240)
w A
(CHJ -aromatic (MW 240)
0 X
(CH3)x-pyrene
(CH3)x-aromatic (MW 240)
(CH3)x-aromatic (MW 240)
(CH3)x-aromatic (MW 316)
(CH3)x-aromatic (MW 316)
(CH3)x-aromatic (MW 300)
Concentration
ng/yl
5
10
10
5
5
5
100
100
100
10
10
10
10
10
10
10
10
10
10
10
10
10
Stack
Concentration
yg/m3
10
20
20
10
10
10
50
50
50
5
5
5
5
5
5
5
5
5
5
5
5
5
(continued)
77
image:
TABLE 30. (continued)
Sample
HO-3-LR-828
(Cont.)
HO-3-PR-828
Compound
(CH3) -aromatic
Organo-silicone
Pyrene
Organo-silicone
Phthalate ester
(CH3)x-aromatic (MW 196)
Chloro-aromatic (MU 218)
Anthracene
(CH3)x-aromatic (MW 200)
(CH3)x-aromatic (MW 216)
(CH3)x-aromatic (MW 276)
(CH,) -aromatic (MW 216)
<J A
Methyl , ethyl -pyrene •
(CH,) -aromatic (MW 258)
0 A
(CH-) -aromatic (MW 240)
w A
(CHJ -aromatic (MW 240)
0 X
(CH3)x-pyrene
(CH3)x-aromatic (MW 240)
(CH3)x-aromatic (MW 240)
(CH3)x-aromatic (MW 316)
(CH3)x-aromatic (MW 316)
(CH3)x-aromatic (MW 300)
Concentration
ng/yl
5
10
10
5
5
5
100
100
100
10
10
10
10
10
10
10
10
10
10
10
10
10
Stack
Concentration
yg/m3
10
20
20
10
10
10
50
50
50
5
5
5
5
5
5
5
5
5
5
5
5
5
(continued)
77
image:
 TABLE £0. (continued)
Stack
Concentration Concentration
Sample Compound ng/pl yg/m3
HO-3-PR-828 (CHJ -aromatic (MW 296) 10 5
(Cont.) J x
(CH3)x-aromatic (MW 298) 10 5
(CH3)x-aromatic (MW 280) 10 5
(CH3)x-aromatic (MW 298) 10 5
Phthalate ester 10 5
(CH3)x-aromatic (MW 356) 10 5
(CHJ -aromatic (MW 314) 10 5
0 A
(CH~) -aromatic (MW 336) 10 5
O X
(CHJ -aromatic (MW 336) 10 5
<3 X
78
image:
TABLE £0. (continued)
Stack
Concentration Concentration
Sample Compound ng/pl yg/m3
HO-3-PR-828 (CHJ -aromatic (MW 296) 10 5
(Cont.) J x
(CH3)x-aromatic (MW 298) 10 5
(CH3)x-aromatic (MW 280) 10 5
(CH3)x-aromatic (MW 298) 10 5
Phthalate ester 10 5
(CH3)x-aromatic (MW 356) 10 5
(CHJ -aromatic (MW 314) 10 5
0 A
(CH~) -aromatic (MW 336) 10 5
O X
(CHJ -aromatic (MW 336) 10 5
<3 X
78
image:
 4.2.3.3 Results of Analyses of Gas Sampling Bags
The XAD-2 resin in the sorbent trap does not efficiently collect organic
compounds with boiling points below about 90°C. Therefore, samples of combus-
tion effluent were acquired in Tedlar gas sampling bags. The contents of the
bags were analyzed by the C1-C6 GC procedure. The results are presented in
Table 31. Because of inadvertent delays in transportation, the samples must
be considered compromised. During the several weeks delay between acquisition
and analysis, reactive species are probably lost entirely. Irreversible absorp-
tion and condensation also occur in gas sampling bags and probably occurred in
these. Hydrocarbons were detected at the 10 to 20 ppm level in every test
onboard the M/T Vulcanus, yet only one of the three grab gas samples showed
detectable levels of hydrocarbons.
4.2.3.4 Burner Residue Analyses
The nonvolatile residues obtained from the burner residue extracts were
large, as were the residues from the probe and heat-traced line extracts.
Therefore, thermogravimetric analyses of these residues were also performed.
The results of these analyses are given in Table 32. The analyses show that
the residues from the burner residue extracts are essentially wholly organic in
content.
Table 33 presents the results of the gravimetric analyses of the burner
residue extracts. It is seen that the burner residues have contents of extract-
able nonvolatile organic compounds of from 3.1 to 10.2%. The burner residues
are probably mostly inorganic carbon.
TABLE 31. RESULTS OF C1-C6 ANALYSES
OF GRAB GAS SAMPLES
Concentration of
C1-C6 Hydrocarbons
Sample ppm
HO-l-GG-714 ND*
HO-l-GG-716 +
HO-2-GG-813 22
HO-3-GG-828 ND*
*
ND means not detected. Detection limit was
+1 Ppm.
Not Acquired
79
image:
4.2.3.3 Results of Analyses of Gas Sampling Bags
The XAD-2 resin in the sorbent trap does not efficiently collect organic
compounds with boiling points below about 90°C. Therefore, samples of combus-
tion effluent were acquired in Tedlar gas sampling bags. The contents of the
bags were analyzed by the C1-C6 GC procedure. The results are presented in
Table 31. Because of inadvertent delays in transportation, the samples must
be considered compromised. During the several weeks delay between acquisition
and analysis, reactive species are probably lost entirely. Irreversible absorp-
tion and condensation also occur in gas sampling bags and probably occurred in
these. Hydrocarbons were detected at the 10 to 20 ppm level in every test
onboard the M/T Vulcanus, yet only one of the three grab gas samples showed
detectable levels of hydrocarbons.
4.2.3.4 Burner Residue Analyses
The nonvolatile residues obtained from the burner residue extracts were
large, as were the residues from the probe and heat-traced line extracts.
Therefore, thermogravimetric analyses of these residues were also performed.
The results of these analyses are given in Table 32. The analyses show that
the residues from the burner residue extracts are essentially wholly organic in
content.
Table 33 presents the results of the gravimetric analyses of the burner
residue extracts. It is seen that the burner residues have contents of extract-
able nonvolatile organic compounds of from 3.1 to 10.2%. The burner residues
are probably mostly inorganic carbon.
TABLE 31. RESULTS OF C1-C6 ANALYSES
OF GRAB GAS SAMPLES
Concentration of
C1-C6 Hydrocarbons
Sample ppm
HO-l-GG-714 ND*
HO-l-GG-716 +
HO-2-GG-813 22
HO-3-GG-828 ND*
*
ND means not detected. Detection limit was
+1 Ppm.
Not Acquired
79
image:
 TABLE 32. ORGANIC CONTENTS OF BURNER RESIDUE EXTRACTS
FROM THERMOGRAVIMETRIC ANALYSES
Sample
HO-l-BR-722
HO-2-BR-815
%' Loss By
300°C
100
97.3
% Loss By
900°C
100
98
TABLE 33. RESULTS OF GRAVIMETRIC ANALYSES
OF BURNER RESIDUE SAMPLES
Sample
Weight
Residue Volume in
Weight Concentrated Sample
mg ml mg
Weight
Organic of
Fraction Sample Concentration
% g mg/g
HO-l-BR-722
HO-2-BR-815
64.
77.
251
714
498/500
498/500
258
312
.036
.104
100
98
8
3
.3025
.0017
31
102
A measure of the volatile organic content of the burner residue extracts
is given by the C7-C16 GC analyses. Results of these analyses are given in
Table 34. These data show a low volatile organic content.
The residue weights from both burner residue extracts exceeded the criteria
for performing in GC separation. Table 35 presents the weights of the residues
from the fractions into which these samples, were separated. The recovery from
one sample was high and probably the result of insufficient drying.
Infrared spectra were taken on the residues from each of the fractions.
The interpretation of these spectra in terms of classes of compounds are given
in Table 36. Phthalate esters and silicones were again found. However, the
herbicide components 2,4-D and 2,4,5-T were found, as well as a phenoxy compound
and a carboxylic acid.
GC/MS analyses were performed on the burner residue extracts, and the
results are presented in Table 37. The major herbicide components, 2,4-D and
2,4,5-T, were found as were other minor components. In the previous at-sea
(5)
incineration program/ ' traces of waste feed components were also found in the
80
image:
TABLE 32. ORGANIC CONTENTS OF BURNER RESIDUE EXTRACTS
FROM THERMOGRAVIMETRIC ANALYSES
Sample
HO-l-BR-722
HO-2-BR-815
%' Loss By
300°C
100
97.3
% Loss By
900°C
100
98
TABLE 33. RESULTS OF GRAVIMETRIC ANALYSES
OF BURNER RESIDUE SAMPLES
Sample
Weight
Residue Volume in
Weight Concentrated Sample
mg ml mg
Weight
Organic of
Fraction Sample Concentration
% g mg/g
HO-l-BR-722
HO-2-BR-815
64.
77.
251
714
498/500
498/500
258
312
.036
.104
100
98
8
3
.3025
.0017
31
102
A measure of the volatile organic content of the burner residue extracts
is given by the C7-C16 GC analyses. Results of these analyses are given in
Table 34. These data show a low volatile organic content.
The residue weights from both burner residue extracts exceeded the criteria
for performing in GC separation. Table 35 presents the weights of the residues
from the fractions into which these samples, were separated. The recovery from
one sample was high and probably the result of insufficient drying.
Infrared spectra were taken on the residues from each of the fractions.
The interpretation of these spectra in terms of classes of compounds are given
in Table 36. Phthalate esters and silicones were again found. However, the
herbicide components 2,4-D and 2,4,5-T were found, as well as a phenoxy compound
and a carboxylic acid.
GC/MS analyses were performed on the burner residue extracts, and the
results are presented in Table 37. The major herbicide components, 2,4-D and
2,4,5-T, were found as were other minor components. In the previous at-sea
(5)
incineration program/ ' traces of waste feed components were also found in the
80
image:
 TABLE 34. RESULTS OF C7-C16 GC ANALYSES OF BURNER
RESIDUE SAMPLES
Range
C7
C8
C9
CIO
Cll
C12
CIS
C14
C15
C16
Total
Sample, Concentration
HO-l-BR-722
<0.04
<0.04
<0.04
0.3
<0.04
<0.04
<0.04
0.18
0.60
0.42
1.5
in mg/g
HO-2-BR-815
<0.01
1.7
<0.1
<0.1
<0.1
<0.1
<0.1
<0.1
0.5
<0.1
2.2
burner residue samples. The presence of waste feed components in the burner
residues implies that the rotating cup burners remain quite cool relative to
the flame and the incinerator walls.
4.2.4 Wright State University Analytical Methodology
Wright State University has, under contract to the U.S. Air Force, developed
methodology for determining TCDD in Herbicide Orange and in samples relating to
the storage and disposal of Herbicide Orange. Details of WSU methodology may
be found in Reference 6.
TCDD in composite feeds was isolated from the bulk of feedstock by liquid
chromatography on a mixed-bed silica gel/alumina column. The fraction contain-
ing TCDD was taken to dryness. Prior to analysis, the residue was taken up in
a known volume of benzene.
81
image:
TABLE 34. RESULTS OF C7-C16 GC ANALYSES OF BURNER
RESIDUE SAMPLES
Range
C7
C8
C9
CIO
Cll
C12
CIS
C14
C15
C16
Total
Sample, Concentration
HO-l-BR-722
<0.04
<0.04
<0.04
0.3
<0.04
<0.04
<0.04
0.18
0.60
0.42
1.5
in mg/g
HO-2-BR-815
<0.01
1.7
<0.1
<0.1
<0.1
<0.1
<0.1
<0.1
0.5
<0.1
2.2
burner residue samples. The presence of waste feed components in the burner
residues implies that the rotating cup burners remain quite cool relative to
the flame and the incinerator walls.
4.2.4 Wright State University Analytical Methodology
Wright State University has, under contract to the U.S. Air Force, developed
methodology for determining TCDD in Herbicide Orange and in samples relating to
the storage and disposal of Herbicide Orange. Details of WSU methodology may
be found in Reference 6.
TCDD in composite feeds was isolated from the bulk of feedstock by liquid
chromatography on a mixed-bed silica gel/alumina column. The fraction contain-
ing TCDD was taken to dryness. Prior to analysis, the residue was taken up in
a known volume of benzene.
81
image:
 TABLE 35. GRAVIMETRIC RESULTS OF LC SEPARATIONS
OF BURNER RESIDUES
Fraction
1
2
3
4
5
6
7
8
Sample,
HO-l-BR-722
60.1
3,1
13.2
5.2
3.2
2.8
4.3*
17.0*
Residue Weight in mg
HO-2-BR-815
33.0
32.5
42,1
15.5
0.2
3.9
20.7*
19.3* ''
Blank
0.0
0.0
0.0
0.0
0.5
1.0
6.5
15*
*
This sample was lost. The value reflects past experience for
these fractions.
*Corrected for blanks.
* These samples were not completely dry, and their infrared spectra
were indistinguishable from the corresponding blanks.
A portion of each impinger sample was washed with aqueous base and then
water. After washing, the organic fraction was dried over anhydrous sodium
sulfate. After drying, the organic layer was decanted and combined with a
petroleum ether wash of the sodium sulfate. Both organic layers were taken
to dryness. Prior to analysis, the residue was dissolved in a known volume
of benzene.
A 10 ml portion of each probe and line rinse was reduced in volume to
0.5 ml and then diluted to 1.0 ml with benzene. The samples then consisted
of a brown, water miscible layer and the benzene layer. Aliquots of the
benzene layer were taken for analysis.
Analyses for TCDD were performed on an AEI MS-30 double focusing mass
spectrometer coupled to a Van'an 1440 gas chromatograph.
82
image:
TABLE 35. GRAVIMETRIC RESULTS OF LC SEPARATIONS
OF BURNER RESIDUES
Fraction
1
2
3
4
5
6
7
8
Sample,
HO-l-BR-722
60.1
3,1
13.2
5.2
3.2
2.8
4.3*
17.0*
Residue Weight in mg
HO-2-BR-815
33.0
32.5
42,1
15.5
0.2
3.9
20.7*
19.3* ''
Blank
0.0
0.0
0.0
0.0
0.5
1.0
6.5
15*
*
This sample was lost. The value reflects past experience for
these fractions.
*Corrected for blanks.
* These samples were not completely dry, and their infrared spectra
were indistinguishable from the corresponding blanks.
A portion of each impinger sample was washed with aqueous base and then
water. After washing, the organic fraction was dried over anhydrous sodium
sulfate. After drying, the organic layer was decanted and combined with a
petroleum ether wash of the sodium sulfate. Both organic layers were taken
to dryness. Prior to analysis, the residue was dissolved in a known volume
of benzene.
A 10 ml portion of each probe and line rinse was reduced in volume to
0.5 ml and then diluted to 1.0 ml with benzene. The samples then consisted
of a brown, water miscible layer and the benzene layer. Aliquots of the
benzene layer were taken for analysis.
Analyses for TCDD were performed on an AEI MS-30 double focusing mass
spectrometer coupled to a Van'an 1440 gas chromatograph.
82
image:
 TABLE 36. COMPOUND CLASSES PRESENT IN LC FRACTIONS FROM BURNER RESIDUE SAMPLES
Sample
Compound Classes
CD
to
HO-l-BR-722
Fraction 1
Fraction 2
Fraction 3
Fraction 4
Fraction 5
Fraction 6
Fraction 7
HO-2-BR-815
Fraction 1
Fraction 2
Fraction 3
Fraction 4
Fraction 6
Fraction 7
Substituted aliphatic hydrocarbons
Hydrocarbons; traces of 2,4-D and 2,4,5-T
2,4-D; 2,4,5-T
2,4-D; 2,4,5-T
Phthalate esters, traces of 2,4-D and 2,4,5-T
Esters; silicones; 2,4-D and 2,4,5-T
Esters, silicones
2,4-D; 2,4,5-T
2,4-D; 2,4,5-T
2,4-D; 2,4,5-T
2,4-D; 2,4,5-T
2,4-D; 2,4,5-T
Aliphatic nitro compound, benzene derivatives, phenoxy compound, carboxylic acid
* IR spectra were not run on residues with weights less than 0.1 mg.
image:
TABLE 36. COMPOUND CLASSES PRESENT IN LC FRACTIONS FROM BURNER RESIDUE SAMPLES
Sample
Compound Classes
CD
to
HO-l-BR-722
Fraction 1
Fraction 2
Fraction 3
Fraction 4
Fraction 5
Fraction 6
Fraction 7
HO-2-BR-815
Fraction 1
Fraction 2
Fraction 3
Fraction 4
Fraction 6
Fraction 7
Substituted aliphatic hydrocarbons
Hydrocarbons; traces of 2,4-D and 2,4,5-T
2,4-D; 2,4,5-T
2,4-D; 2,4,5-T
Phthalate esters, traces of 2,4-D and 2,4,5-T
Esters; silicones; 2,4-D and 2,4,5-T
Esters, silicones
2,4-D; 2,4,5-T
2,4-D; 2,4,5-T
2,4-D; 2,4,5-T
2,4-D; 2,4,5-T
2,4-D; 2,4,5-T
Aliphatic nitro compound, benzene derivatives, phenoxy compound, carboxylic acid
* IR spectra were not run on residues with weights less than 0.1 mg.
image:
 TABLE 37. RESULTS OF GC/MS ANALYSES OF BURNER RESIDUE SAMPLES
Sample Compound
HO-l-BR-712 2,4-D
2,4, 5-T
Hydrocarbons
Methoxy-2,4-D
HO-2-BR-815 2,4-D
2,4, 5-T
Chlorophenoxyacetic acid, butyl ester
Methoxy-2,4-D
Octyl ester of 2,4-D
Octyl ester of 2,4,5-T
Concentration
mg/g
0.1
0.12
Major
0.005
0.7
0.7
0.01
0.67
0.07
0.07
4.2.5 Wright State University Analytical Results
Because of its extensive experience in the analysis of TCDD in Herbicide
Orange and related environmental samples, the Brehm Laboratory of Wright State
University was selected by the U.S. EPA and the U.S. Air Force to perform anal-
yses of combustion effluent samples for the purpose of determining permit com-
pliance with respect to emissions of TCDD.
Table 38 presents results of the WSU analyses of the combustion effluent
samples for TCDD. It is seen that TCDD was detected in only the line and probe
rinse samples of 8 August (HO-2-LR-808-4 and HO-2-PR-808-H, respectively).
Comparison of the minimum detectable concentrations shows that they vary widely.
For example, TCDD was not detected in any of the benzene impinger samples, yet
the minimum detectable concentrations ranged from <0.00094 ng/ml (HO-1-BI-716-H)
to <0.047 ng/ml (HO-2-BI-813-H). This variation was a consequence of the com-
plexity of the samples. There was (Section 4.2.3) a large number of organic
compounds in the samples. Many of these compounds were similar to TCDD in
molecular weight; consequently, the state-of-the-art methodology being employed
was not capable of completely separating TCDD from these extraneous compounds.
These compounds thus acted as interferences in the determination of TCDD and
84
image:
TABLE 37. RESULTS OF GC/MS ANALYSES OF BURNER RESIDUE SAMPLES
Sample Compound
HO-l-BR-712 2,4-D
2,4, 5-T
Hydrocarbons
Methoxy-2,4-D
HO-2-BR-815 2,4-D
2,4, 5-T
Chlorophenoxyacetic acid, butyl ester
Methoxy-2,4-D
Octyl ester of 2,4-D
Octyl ester of 2,4,5-T
Concentration
mg/g
0.1
0.12
Major
0.005
0.7
0.7
0.01
0.67
0.07
0.07
4.2.5 Wright State University Analytical Results
Because of its extensive experience in the analysis of TCDD in Herbicide
Orange and related environmental samples, the Brehm Laboratory of Wright State
University was selected by the U.S. EPA and the U.S. Air Force to perform anal-
yses of combustion effluent samples for the purpose of determining permit com-
pliance with respect to emissions of TCDD.
Table 38 presents results of the WSU analyses of the combustion effluent
samples for TCDD. It is seen that TCDD was detected in only the line and probe
rinse samples of 8 August (HO-2-LR-808-4 and HO-2-PR-808-H, respectively).
Comparison of the minimum detectable concentrations shows that they vary widely.
For example, TCDD was not detected in any of the benzene impinger samples, yet
the minimum detectable concentrations ranged from <0.00094 ng/ml (HO-1-BI-716-H)
to <0.047 ng/ml (HO-2-BI-813-H). This variation was a consequence of the com-
plexity of the samples. There was (Section 4.2.3) a large number of organic
compounds in the samples. Many of these compounds were similar to TCDD in
molecular weight; consequently, the state-of-the-art methodology being employed
was not capable of completely separating TCDD from these extraneous compounds.
These compounds thus acted as interferences in the determination of TCDD and
84
image:
 TABLE 38. RESULTS OF WSU ANALYSES OF STACK SAMPLES FOR TCDD
Sample
HO-1-CF-714-F (feed)
HO-1-BI-714-F
HO-1-LR-714-F
HO-1-CF-716-H (feed)
HO-1-BI-716-H
HO-1-LR-716-H
HO-1-PR-717-F
HO-2-CF-808-H (feed)
HO-2-BI-808-H
HO-2-LR-808-H
HO-2-PR-808-H
HO-2-CF-813-H (feed)
HO-2-BI-813-H
HO-2-LR-813-H
HO-2-PR-813-H
HO-3-CF-828-H (feed)
HO-3-BI-828-H
HO-3-LR-828-H
HO-3-PR-828-H
TCDD Found*
ND
ND
ND
2.5 yg/nu
ND
ND
ND
2.8 yg/nu
ND
0.136 ng/nu
3.34 ng/nu
1.0 yg/nu
ND
ND
ND
2.8 yg/nu
ND
ND
ND
Minimum Detectable
Quantity
<0.02 yg/nu
<0.0015 ng/nu
<0.086 ng/nu
<0.02 yg/nu
<0. 00094 ng/nu
<0.045 ng/nu
<0.086 ng/m£
<0.02 yg/nu
<0.034 ng/m£
—
—
<0.02 yg/m£
<0.047 ng/m£
<0.11 ng/nu
<0.30 ng/m£
<0.02 yg/m£
<0.040 ng/m£
<0.012 ng/mji
<0.048 ng/nu
ND indicates not detected.
85
image:
TABLE 38. RESULTS OF WSU ANALYSES OF STACK SAMPLES FOR TCDD
Sample
HO-1-CF-714-F (feed)
HO-1-BI-714-F
HO-1-LR-714-F
HO-1-CF-716-H (feed)
HO-1-BI-716-H
HO-1-LR-716-H
HO-1-PR-717-F
HO-2-CF-808-H (feed)
HO-2-BI-808-H
HO-2-LR-808-H
HO-2-PR-808-H
HO-2-CF-813-H (feed)
HO-2-BI-813-H
HO-2-LR-813-H
HO-2-PR-813-H
HO-3-CF-828-H (feed)
HO-3-BI-828-H
HO-3-LR-828-H
HO-3-PR-828-H
TCDD Found*
ND
ND
ND
2.5 yg/nu
ND
ND
ND
2.8 yg/nu
ND
0.136 ng/nu
3.34 ng/nu
1.0 yg/nu
ND
ND
ND
2.8 yg/nu
ND
ND
ND
Minimum Detectable
Quantity
<0.02 yg/nu
<0.0015 ng/nu
<0.086 ng/nu
<0.02 yg/nu
<0. 00094 ng/nu
<0.045 ng/nu
<0.086 ng/m£
<0.02 yg/nu
<0.034 ng/m£
—
—
<0.02 yg/m£
<0.047 ng/m£
<0.11 ng/nu
<0.30 ng/m£
<0.02 yg/m£
<0.040 ng/m£
<0.012 ng/mji
<0.048 ng/nu
ND indicates not detected.
85
image:
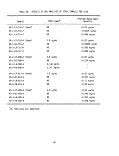 caused minimum detectable concentrations to be variable and higher than they
would have been in the absence of the interferences.
4.2.6 Battelle-Columbus Laboratories Analytical Methodology
Battelle-Columbus Laboratories (BCL), under contract to the U.S. Air Force,
set up and staffed a laboratory on Johnston Island for land based environmental
monitoring during the dedrumming operation. BCL provided quick-response analy-
ses for 2,4-D and 2,4,5-T in combustion effluent and drinking water samples from
the shipboard incineration. BCL also analyzed for 2,4-D and 2,4,5-T the work-
®
space air monitor Chromosorb 102 samples taken onboard the ship.
Combustion effluent samples (probe and heat-traced lines rinses and benzene
impingers) were analyzed directly by gas chromatography with electron capture
detection (GC-ECD). Ship's drinking water samples were first extracted with
(B)
hexane and then analyzed by GC-ECD. The Chromosorb 102 tube workspace air
monitor samples were extracted in a soxhlet apparatus for 1 hour with pentane,
concentrated, and then analyzed by GC-ECD.
4.2.7 Battelle-Columbus Laboratories Analytical Results
4.2.7.1 Analyses of Workspace Air Monitor Samples
Results of the analyses of workspace air monitor samples by BCL are given
in Tables 39 and 40. These results are discussed in Section 5.3.2.
4.2.7.2 Analyses of Combustion Effluent Samples
Table 41 presents the results of analyses of combustion effluent samples
by BCL. A peak having the correct retention time for 2,4-D was found in the
chromatogram of the probe rinse of 8/13/77. This cannot, however, be
considered conclusive proof that 2,4-D was present. Neither 2,4-D nor 2,4,5-T
were found in any other combustion effluent sample.
4.2.7.3 Analyses of Potable Water Samples
Three samples of drinking water from the M/T Vulcanus were analyzed for
2,4-D and 2,4,5-T. Neither compound was detected, as shown in Table 42.
86
image:
caused minimum detectable concentrations to be variable and higher than they
would have been in the absence of the interferences.
4.2.6 Battelle-Columbus Laboratories Analytical Methodology
Battelle-Columbus Laboratories (BCL), under contract to the U.S. Air Force,
set up and staffed a laboratory on Johnston Island for land based environmental
monitoring during the dedrumming operation. BCL provided quick-response analy-
ses for 2,4-D and 2,4,5-T in combustion effluent and drinking water samples from
the shipboard incineration. BCL also analyzed for 2,4-D and 2,4,5-T the work-
®
space air monitor Chromosorb 102 samples taken onboard the ship.
Combustion effluent samples (probe and heat-traced lines rinses and benzene
impingers) were analyzed directly by gas chromatography with electron capture
detection (GC-ECD). Ship's drinking water samples were first extracted with
(B)
hexane and then analyzed by GC-ECD. The Chromosorb 102 tube workspace air
monitor samples were extracted in a soxhlet apparatus for 1 hour with pentane,
concentrated, and then analyzed by GC-ECD.
4.2.7 Battelle-Columbus Laboratories Analytical Results
4.2.7.1 Analyses of Workspace Air Monitor Samples
Results of the analyses of workspace air monitor samples by BCL are given
in Tables 39 and 40. These results are discussed in Section 5.3.2.
4.2.7.2 Analyses of Combustion Effluent Samples
Table 41 presents the results of analyses of combustion effluent samples
by BCL. A peak having the correct retention time for 2,4-D was found in the
chromatogram of the probe rinse of 8/13/77. This cannot, however, be
considered conclusive proof that 2,4-D was present. Neither 2,4-D nor 2,4,5-T
were found in any other combustion effluent sample.
4.2.7.3 Analyses of Potable Water Samples
Three samples of drinking water from the M/T Vulcanus were analyzed for
2,4-D and 2,4,5-T. Neither compound was detected, as shown in Table 42.
86
image:
 TABLE 39. RESULTS OF BCL ANALYSES OF FIRST BURN WORKSPACE AIR MONITORS"
00
Date of Sample
1977
13 July
14 July
14 July
15 July
15 July
16 July
16 July
17 July
17 July
18 July
18 July
19 July
19 July
20 July
20 July
21 July
21 July
22 July
22 July
23 July
23 July
24 July
24 July
Night
Day
Night
Day
Night
Day
Night
Day
Night
Day
Night
Day
Night
Day
Night
Day
Night
Day
Night
Day
Night
Day
Night
Combustor Room, -v.93°C Pump Room, i.32°C Dining Room, •>.24''C
2,4-D 2,4,5-T Total 2,4-D 2,4,5-T Total 2,4-D 2,4,5-T Total
ug/m3* ug/m3 ug/m3 ug/m3 ug/m3 ug/m3 ug/m3 ug/m ug/m
+ + + 0.42 0.1 0.52 + + +
<0.22 0.06 <0.28 + + + 4 + +
+ + ++ + + + + +
+ + ++ + + <0.22 <0.08 <0.31
+ + + 1.43 0.55 1.98 * + +
+ + + 62.2 10.8 73 0.26 <0.29 ±0.55
<0.76 <0.38 <1.1 0.99 0.23 1.22 <1.03 <0.10 <1.14
+ + + 3.45 1.26 4.70 + + +
+ + ++ + + + + +
0.54 <1.1 <1.6 + + + <0.68 <0.10 <0.78
++++++ <0.93 <0.14 .£l-07
+ + + 4.72 2.23 6.96 + + +
+ + ++++ + + +
+ + ++ + + + + +
3.2 1.5 4.7 + + + <0.53 <0.08 <0.61
+ + + 1.68 0.52 2.20 + + +
+ + ++ + + + + +
5.1 2.5 7.5 + + + <0.23 <0.09 <0.31
+ + ++ + + + + +
+ + ++ + + + + +
+ + + 3.00 1.02 4.03 + + +
+ + ++ + + + + +
0.27 0.16 0.44 + + + + + +
Sea Container, •v23°C
2.4-D 2,4,5-T Total
ug/m3 ug/m3 ug/m3
+
+ + +
+ + +
<O.S8 <0.29 <0.87
+ + +
<0.58 <0.29 <0.88
<0.52 <0.08 <0.59
+ + +
+ + +
0.16 <0.27 <0.44
0.31 <0.28 <0.59
+ + +
+ + +
<0.57 <0.28 <0.85
+ + +
+
+ + +
+
<0.57 <0.08 <0.66
+ + +
+
+ + +
+ + 4
Concentrations are In ug/m3 air sampled at the temperatures given for each location at ambient pressure.
The 8-hour TLV for 2,4-D + 2,4,5-T is 10 mg/m3. See Appendix F.12 for conversion to ppm.
These samples have been archived.
Indicates not detected. The numerical value is the detection limit.
—Indicates present at detection limits.
image:
TABLE 39. RESULTS OF BCL ANALYSES OF FIRST BURN WORKSPACE AIR MONITORS"
00
Date of Sample
1977
13 July
14 July
14 July
15 July
15 July
16 July
16 July
17 July
17 July
18 July
18 July
19 July
19 July
20 July
20 July
21 July
21 July
22 July
22 July
23 July
23 July
24 July
24 July
Night
Day
Night
Day
Night
Day
Night
Day
Night
Day
Night
Day
Night
Day
Night
Day
Night
Day
Night
Day
Night
Day
Night
Combustor Room, -v.93°C Pump Room, i.32°C Dining Room, •>.24''C
2,4-D 2,4,5-T Total 2,4-D 2,4,5-T Total 2,4-D 2,4,5-T Total
ug/m3* ug/m3 ug/m3 ug/m3 ug/m3 ug/m3 ug/m3 ug/m ug/m
+ + + 0.42 0.1 0.52 + + +
<0.22 0.06 <0.28 + + + 4 + +
+ + ++ + + + + +
+ + ++ + + <0.22 <0.08 <0.31
+ + + 1.43 0.55 1.98 * + +
+ + + 62.2 10.8 73 0.26 <0.29 ±0.55
<0.76 <0.38 <1.1 0.99 0.23 1.22 <1.03 <0.10 <1.14
+ + + 3.45 1.26 4.70 + + +
+ + ++ + + + + +
0.54 <1.1 <1.6 + + + <0.68 <0.10 <0.78
++++++ <0.93 <0.14 .£l-07
+ + + 4.72 2.23 6.96 + + +
+ + ++++ + + +
+ + ++ + + + + +
3.2 1.5 4.7 + + + <0.53 <0.08 <0.61
+ + + 1.68 0.52 2.20 + + +
+ + ++ + + + + +
5.1 2.5 7.5 + + + <0.23 <0.09 <0.31
+ + ++ + + + + +
+ + ++ + + + + +
+ + + 3.00 1.02 4.03 + + +
+ + ++ + + + + +
0.27 0.16 0.44 + + + + + +
Sea Container, •v23°C
2.4-D 2,4,5-T Total
ug/m3 ug/m3 ug/m3
+
+ + +
+ + +
<O.S8 <0.29 <0.87
+ + +
<0.58 <0.29 <0.88
<0.52 <0.08 <0.59
+ + +
+ + +
0.16 <0.27 <0.44
0.31 <0.28 <0.59
+ + +
+ + +
<0.57 <0.28 <0.85
+ + +
+
+ + +
+
<0.57 <0.08 <0.66
+ + +
+
+ + +
+ + 4
Concentrations are In ug/m3 air sampled at the temperatures given for each location at ambient pressure.
The 8-hour TLV for 2,4-D + 2,4,5-T is 10 mg/m3. See Appendix F.12 for conversion to ppm.
These samples have been archived.
Indicates not detected. The numerical value is the detection limit.
—Indicates present at detection limits.
image:
 TABLE 40. RESULTS OF BCL ANALYSES OF SECOND AND THIRD BURN WORKSPACE AIR MONITORS1*
Date of Sample
1977
7 August
8 August
9 August
10 August
11 August
12 August
13 August
14 August
15 August
24 August
25 August
26 August
27 August
28 August
29 August
30 August
31 August
1 September
2 September
Combustor Room ^93°C
2,4-D^ 2,4,5-T Total
MQ/ni Mg/m^ u9/ro
39.7 21.8 61.5
-
3.1 1.59 4.66
-
33.1 18.5 51.6
.
68.3 38.2 107
-
1.73 0.84 2.57
.
47.4 22.7 70.1
76.4 35.4 112
9.97 6.09 16.1
114 59.6 174
-
77.6 41.3 119
Pump Room ^32°C Dining Room -v.24
2,4-D 2,4,5-T Total 2,4-D
ug/m3 ug/m3 ug/m3 ug/m3
21.1 10.3 31.4 0.56
18.0 5.40 23.4
1.37
7.31 2.27 9.58
0.70
15.9 4.84 20.7
-
0.70 0.22 0.92
-
+
+ + + 0.58
+ + + 0.53
+ + + 0.68
+ + +
+ + + 1.52
+ + + 1.17
+ + + 1.52
+ + + 1.24
+
2,4,5-T
ug/m3
0.15
-
0.48
-
0.20
.
-
-
-
-
<0.14
<0.14
0.15
-
0.43
0.28
0.42
0.32
-
°C Sea Container ^!
Total 2,4-D 2,4,5-T
ug/m3 ug/m3 ug/m3
0.71
<0.28 <0.14
1.86
<0.28 <0.14
0.90
<0.29 10.15
-
,
-
+ -f
<0.72 + +
<0.67 + +
0.83 + +
+ +
1.95 + +
1.45 + +
1.93 + +
1.56 + +
-
?3°C
Total
wg/m3
-
<0.42
-
^0.42
_
<0.44
_
-
- ' ,
+
+
+
+
+
+
+
+
+
+
Concentrations are in pg/n3 air sampled at the temperatures given for each location at ambient pressure.
The 8-hour TLV for 2,4-D + 2,4,5-T is 10 mg/m3. See Appendix F.12 for conversion to ppm.
"These samples have been archived.
-Indicates present at detection limits.
These locations were not monitored during the third burn.
image:
TABLE 40. RESULTS OF BCL ANALYSES OF SECOND AND THIRD BURN WORKSPACE AIR MONITORS1*
Date of Sample
1977
7 August
8 August
9 August
10 August
11 August
12 August
13 August
14 August
15 August
24 August
25 August
26 August
27 August
28 August
29 August
30 August
31 August
1 September
2 September
Combustor Room ^93°C
2,4-D^ 2,4,5-T Total
MQ/ni Mg/m^ u9/ro
39.7 21.8 61.5
-
3.1 1.59 4.66
-
33.1 18.5 51.6
.
68.3 38.2 107
-
1.73 0.84 2.57
.
47.4 22.7 70.1
76.4 35.4 112
9.97 6.09 16.1
114 59.6 174
-
77.6 41.3 119
Pump Room ^32°C Dining Room -v.24
2,4-D 2,4,5-T Total 2,4-D
ug/m3 ug/m3 ug/m3 ug/m3
21.1 10.3 31.4 0.56
18.0 5.40 23.4
1.37
7.31 2.27 9.58
0.70
15.9 4.84 20.7
-
0.70 0.22 0.92
-
+
+ + + 0.58
+ + + 0.53
+ + + 0.68
+ + +
+ + + 1.52
+ + + 1.17
+ + + 1.52
+ + + 1.24
+
2,4,5-T
ug/m3
0.15
-
0.48
-
0.20
.
-
-
-
-
<0.14
<0.14
0.15
-
0.43
0.28
0.42
0.32
-
°C Sea Container ^!
Total 2,4-D 2,4,5-T
ug/m3 ug/m3 ug/m3
0.71
<0.28 <0.14
1.86
<0.28 <0.14
0.90
<0.29 10.15
-
,
-
+ -f
<0.72 + +
<0.67 + +
0.83 + +
+ +
1.95 + +
1.45 + +
1.93 + +
1.56 + +
-
?3°C
Total
wg/m3
-
<0.42
-
^0.42
_
<0.44
_
-
- ' ,
+
+
+
+
+
+
+
+
+
+
Concentrations are in pg/n3 air sampled at the temperatures given for each location at ambient pressure.
The 8-hour TLV for 2,4-D + 2,4,5-T is 10 mg/m3. See Appendix F.12 for conversion to ppm.
"These samples have been archived.
-Indicates present at detection limits.
These locations were not monitored during the third burn.
image:
 TABLE 41. RESULTS OF BCL ANALYSES OF COMBUSTION
EFFLUENT SAMPLES
Sampl e
HO-1-BI-714-F
HO-1-LR-714-F
HO-1-BI-715-H
HO-1-LR-715-H
HO-1-BI-716-H
HO-1-LR-716-H
HO-1-PR-717-H
HO-1-BI-718-H
HO-1-LR-718-H
HO-1-BI-719-H
HO-1-LR-719-H
HO-1-PR-722-H
HO-1-BI-723-H
HO-1-LR-723-H
HO-1-PR-725-H
HO-2-BI-813-H
HO-2-LR-813-H
HO-2-PR-813-H
HO-3-BI-828-H
HO-3-LR-828-H
HO-3-PR-828-H
2,4-D yg/mfc
<0.08*
<0.02
<0.08
<0.02
<0.08
<0.02
+
<0.08
<0.02
<0.08
<0.02
<0.06
<0.08
<0.02
<0.06
<0.08
<0.02
<0.1
<0.08
<0.02
<0.04
2,4, 5-T yg/rU
<0.04
<0.01
<0.04
<0.01
<0.04
<0.01
+
<0.04
<0.01
<0.04
<0.01
<0.03
<0.04
<0.01
<0.03
<0.04
<0.01
<0.03
<0.04
<0.01
<0.02
The "<" character indicates not detected. The numerical
value is the detection limit.
This sample was not analyzed.
89
image:
TABLE 41. RESULTS OF BCL ANALYSES OF COMBUSTION
EFFLUENT SAMPLES
Sampl e
HO-1-BI-714-F
HO-1-LR-714-F
HO-1-BI-715-H
HO-1-LR-715-H
HO-1-BI-716-H
HO-1-LR-716-H
HO-1-PR-717-H
HO-1-BI-718-H
HO-1-LR-718-H
HO-1-BI-719-H
HO-1-LR-719-H
HO-1-PR-722-H
HO-1-BI-723-H
HO-1-LR-723-H
HO-1-PR-725-H
HO-2-BI-813-H
HO-2-LR-813-H
HO-2-PR-813-H
HO-3-BI-828-H
HO-3-LR-828-H
HO-3-PR-828-H
2,4-D yg/mfc
<0.08*
<0.02
<0.08
<0.02
<0.08
<0.02
+
<0.08
<0.02
<0.08
<0.02
<0.06
<0.08
<0.02
<0.06
<0.08
<0.02
<0.1
<0.08
<0.02
<0.04
2,4, 5-T yg/rU
<0.04
<0.01
<0.04
<0.01
<0.04
<0.01
+
<0.04
<0.01
<0.04
<0.01
<0.03
<0.04
<0.01
<0.03
<0.04
<0.01
<0.03
<0.04
<0.01
<0.02
The "<" character indicates not detected. The numerical
value is the detection limit.
This sample was not analyzed.
89
image:
 TABLE 42. RESULTS OF BCL ANALYSES OF SHIP'S
DRINKING WATER FOR 2,4-D
AND 2,4,5-T
Sample
HO-l-SW-724
HO-2-SW-816
HO-3-SW-828
2,4-D
MD*
ND
ND
2,4,5-T
ND
ND
ND
ND means not detected. Detection limit was
0.1 ppb (0.1
4^2.8 Marine Monitoring Results
The biological samples were sorted under a microscope, where necessary, to
the species level. Identification of some of the species found was difficult
because of the paucity of historical collection leading to verified identifica-
tion of the marine biota in this type of tropical oceanic environment. Never-
theless, it was possible to identify all but a few of the species present.
There were slight differences in the species composition among all of the sam-
ples, but there was no consistent difference between pre-burn and post-burn
tows. It should be noted that the results on copepods from these samples are
not essentially different from those obtained on copepods by the USFS Albatross
in the period 1887-1909, which are the only other data available on this area
of the Pacific.
4.2.9 Onboard Analyses
Instrumentation for onboard analysis consisted of two Shimadzu GC-6AMPFE(s)
gas chromatographs, a Shimadzu E1A data processor, and a Shimadzu R-ll recorder.
Each GC was a modular unit, equipped with dual flame ionization (FI) detectors,
a single electron capture (EC) detector, and a linear temperature programmer.
The data processor was microprocessor-controlled and user programmed. The
columns were 2 m x 6 mm OD x 2.9 mm ID glass. Three types of columns were
available: 3% OV-101, 3% OV-17, and 3% OV-225, respectively, on 80/100 mesh
Chromosorb WHP®. The OV-101 column was used exclusively. The injection ports
90
image:
TABLE 42. RESULTS OF BCL ANALYSES OF SHIP'S
DRINKING WATER FOR 2,4-D
AND 2,4,5-T
Sample
HO-l-SW-724
HO-2-SW-816
HO-3-SW-828
2,4-D
MD*
ND
ND
2,4,5-T
ND
ND
ND
ND means not detected. Detection limit was
0.1 ppb (0.1
4^2.8 Marine Monitoring Results
The biological samples were sorted under a microscope, where necessary, to
the species level. Identification of some of the species found was difficult
because of the paucity of historical collection leading to verified identifica-
tion of the marine biota in this type of tropical oceanic environment. Never-
theless, it was possible to identify all but a few of the species present.
There were slight differences in the species composition among all of the sam-
ples, but there was no consistent difference between pre-burn and post-burn
tows. It should be noted that the results on copepods from these samples are
not essentially different from those obtained on copepods by the USFS Albatross
in the period 1887-1909, which are the only other data available on this area
of the Pacific.
4.2.9 Onboard Analyses
Instrumentation for onboard analysis consisted of two Shimadzu GC-6AMPFE(s)
gas chromatographs, a Shimadzu E1A data processor, and a Shimadzu R-ll recorder.
Each GC was a modular unit, equipped with dual flame ionization (FI) detectors,
a single electron capture (EC) detector, and a linear temperature programmer.
The data processor was microprocessor-controlled and user programmed. The
columns were 2 m x 6 mm OD x 2.9 mm ID glass. Three types of columns were
available: 3% OV-101, 3% OV-17, and 3% OV-225, respectively, on 80/100 mesh
Chromosorb WHP®. The OV-101 column was used exclusively. The injection ports
90
image:
 and detector lines had glass inserts. One unit was used as the primary analy-
sis instrument; the other unit was held in reserve.
In order to provide power as free as possible from noise transients, the
GC, recorder, and data processor were run off a Shimadzu-supplied transformer
to step down the 120V, 60 Hz motor generator power to 100V, 60 Hz.
All onboard analyses were performed isothermally at 170 C. The carrier
gas was nitrogen at 30 ml/min. Electron capture was the means of detection.
Under these conditions, an analysis required 20 minutes.
4.2.9.1 Analyses of Wipe Samples
Wipe samples were taken daily throughout incineration operations to monitor
and determine the effectiveness of the boundary exclusion method of controlling
Herbicide Orange contamination. These samples were taken by gently rubbing an
approximately 1 m area of surface, e.g., deck, wall, floor, with a Whatman 41®
filter paper disc. The discs were extracted by soaking in 5 ml of benzene for
30 minutes, and the extracts were then analyzed using the onboard GC. Because
of space and time limitations, wipes could not be extracted exhaustively, as in
a soxhlet extractor. Therefore, the efficiency of extraction of 2,4-D and
2,4,5-T from the wipes was not known.
Standards of 2,4-D and 2,4,5-T were obtained from the U.S. EPA. A sample
of waste was also used to prepare a standard. There were four major peaks in
the U.S. EPA-derived working standards; the waste-derived standard contained
corresponding peaks. The presence of all four peaks was required to confirm
the presence of 2,4-D and 2,4,5-T in a wipe sample. Because of the unknown
extraction efficiency, results of the wipe sample analyses are given as positive
(herbicide present) or negative (herbicide absent).
Wipe samples were taken in Gulfport, MI, before and after herbicide was
loaded. These wipes served as a background to permit the analysts to distin-
guish the contribution of previous wastes and ship's lubricants to the chromato-
grams from 2,4-D and 2,4,5-T. Results of the background wipe samples are given
in Table 43. All of the pre- and post-loading wipe samples were negative for
2,4-D and 2,4,5-T.
91
image:
and detector lines had glass inserts. One unit was used as the primary analy-
sis instrument; the other unit was held in reserve.
In order to provide power as free as possible from noise transients, the
GC, recorder, and data processor were run off a Shimadzu-supplied transformer
to step down the 120V, 60 Hz motor generator power to 100V, 60 Hz.
All onboard analyses were performed isothermally at 170 C. The carrier
gas was nitrogen at 30 ml/min. Electron capture was the means of detection.
Under these conditions, an analysis required 20 minutes.
4.2.9.1 Analyses of Wipe Samples
Wipe samples were taken daily throughout incineration operations to monitor
and determine the effectiveness of the boundary exclusion method of controlling
Herbicide Orange contamination. These samples were taken by gently rubbing an
approximately 1 m area of surface, e.g., deck, wall, floor, with a Whatman 41®
filter paper disc. The discs were extracted by soaking in 5 ml of benzene for
30 minutes, and the extracts were then analyzed using the onboard GC. Because
of space and time limitations, wipes could not be extracted exhaustively, as in
a soxhlet extractor. Therefore, the efficiency of extraction of 2,4-D and
2,4,5-T from the wipes was not known.
Standards of 2,4-D and 2,4,5-T were obtained from the U.S. EPA. A sample
of waste was also used to prepare a standard. There were four major peaks in
the U.S. EPA-derived working standards; the waste-derived standard contained
corresponding peaks. The presence of all four peaks was required to confirm
the presence of 2,4-D and 2,4,5-T in a wipe sample. Because of the unknown
extraction efficiency, results of the wipe sample analyses are given as positive
(herbicide present) or negative (herbicide absent).
Wipe samples were taken in Gulfport, MI, before and after herbicide was
loaded. These wipes served as a background to permit the analysts to distin-
guish the contribution of previous wastes and ship's lubricants to the chromato-
grams from 2,4-D and 2,4,5-T. Results of the background wipe samples are given
in Table 43. All of the pre- and post-loading wipe samples were negative for
2,4-D and 2,4,5-T.
91
image:
 TABLE 43. SUMMARY OF PRE- AND POST-LOADING WIPE SAMPLES
Location
Pre-Loading
Post-Loading
1. Galley Floor
2. SBD, Entry to Galley
3. SBD, Inside Entry
4. SBD, Outside Entry
5. SBD, Entry Comb. Rm
6. Bollard(s), Fantail
7. Top of Fantail Stairs
8. Comb. Rm, Various
9. Shower, Comb. Rm
10. PT, Entry Comb. Rm
11. Outside, Dining Rm
12. Inside Dining Rm
13. Dining Rm Floor
14. PT, Outside Entry
15. PT, Inside Entry
16. Pump Room Hatch
17. PT, Inside, Entry Pass
18. PT, Outside Entry Pass
19. Butterworth Hatches
20. Main Deck, Various
21. Top, 2nd Floor Stairs
22 Foot, Stairs to Bridge
TRW Crew Qtrs
23.
24.
25.
26.
27.
PT, Qtrs Door
PT, Passage, Various
PT, Boat Deck
Laundry
Neg
Neg
Neg
Neg
Neg
Neg
Neg
Neg,Neg
Neg
Neg
Neg
Neg
Neg
- Indicates wipe sample not taken.
92
image:
TABLE 43. SUMMARY OF PRE- AND POST-LOADING WIPE SAMPLES
Location
Pre-Loading
Post-Loading
1. Galley Floor
2. SBD, Entry to Galley
3. SBD, Inside Entry
4. SBD, Outside Entry
5. SBD, Entry Comb. Rm
6. Bollard(s), Fantail
7. Top of Fantail Stairs
8. Comb. Rm, Various
9. Shower, Comb. Rm
10. PT, Entry Comb. Rm
11. Outside, Dining Rm
12. Inside Dining Rm
13. Dining Rm Floor
14. PT, Outside Entry
15. PT, Inside Entry
16. Pump Room Hatch
17. PT, Inside, Entry Pass
18. PT, Outside Entry Pass
19. Butterworth Hatches
20. Main Deck, Various
21. Top, 2nd Floor Stairs
22 Foot, Stairs to Bridge
TRW Crew Qtrs
23.
24.
25.
26.
27.
PT, Qtrs Door
PT, Passage, Various
PT, Boat Deck
Laundry
Neg
Neg
Neg
Neg
Neg
Neg
Neg
Neg,Neg
Neg
Neg
Neg
Neg
Neg
- Indicates wipe sample not taken.
92
image:
 Results of wipe sample analyses for the first, second, and third burns are
given in Tables 44, 45, and 46, respectively. Figure 17 shows locations where
wipe samples were taken. Results are discussed in Section 5.3.1.
4.2.9.2 Analyses of Combustion Effluent Benzene Impinger Samples
After each test, the TRW benzene impinger was analyzed onboard the M/T
Vulcanus for 2,4-D and 2,4,5-T. Neither 2,4-D nor 2,4,5-T was detected in any
of the benzene impinger samples. Results of these analyses were reported
immediately by radio to Johnston Island for transmission to U.S. EPA.
4.2.9.3 Analyses of Air Samples
Samples of workspace air were taken by 10-ml gas sampling syringes for
analysis of 2,4-D and 2,4,5-T. None of the air samples showed the presence of
these compounds.
4.3 DISCUSSION OF ON-LINE INSTRUMENTATION
4.3.1 Applicability to Compliance Determination
The on-line instrumentation package installed on the M/T Vulcanus for this
effort was originally assembled and used for the same purpose during a series
(A)
of six land-based incinerator test programs to destroy 12 industrial wastes. '
In addition, essentially the same instrumentation was used on the M/T Vulcanus
during at-sea incineration of organochlorine waste in the Gulf of Mexico under
Special Permit No. 750D008E. ' In each test program, incinerator effluent
gases were monitored by on-line instrumentation for concentrations of COp. CO,
hydrocarbons, and Op.
The concentration of CO in combustion effluent gas is of particular impor-
tance because it is a good indicator of the efficiency of the combustion proc-
ess. Combustion efficiency values are readily calculated from COp and CO meas-
urements. This approach to compliance determination has several advantages.
It is real-time, continuous, rapid, and calculations are readily performed.
Most importantly, using on-line instrumentation makes compliance determination
waste-independent. Therefore, sampling and analysis plans do not have to be
designed for each type of waste burned. Further, one need not know waste
feed rates to an incinerator to be able to calculate combustion efficiency.
For example, if one were measuring chlorinated compounds in the effluent from
93
image:
Results of wipe sample analyses for the first, second, and third burns are
given in Tables 44, 45, and 46, respectively. Figure 17 shows locations where
wipe samples were taken. Results are discussed in Section 5.3.1.
4.2.9.2 Analyses of Combustion Effluent Benzene Impinger Samples
After each test, the TRW benzene impinger was analyzed onboard the M/T
Vulcanus for 2,4-D and 2,4,5-T. Neither 2,4-D nor 2,4,5-T was detected in any
of the benzene impinger samples. Results of these analyses were reported
immediately by radio to Johnston Island for transmission to U.S. EPA.
4.2.9.3 Analyses of Air Samples
Samples of workspace air were taken by 10-ml gas sampling syringes for
analysis of 2,4-D and 2,4,5-T. None of the air samples showed the presence of
these compounds.
4.3 DISCUSSION OF ON-LINE INSTRUMENTATION
4.3.1 Applicability to Compliance Determination
The on-line instrumentation package installed on the M/T Vulcanus for this
effort was originally assembled and used for the same purpose during a series
(A)
of six land-based incinerator test programs to destroy 12 industrial wastes. '
In addition, essentially the same instrumentation was used on the M/T Vulcanus
during at-sea incineration of organochlorine waste in the Gulf of Mexico under
Special Permit No. 750D008E. ' In each test program, incinerator effluent
gases were monitored by on-line instrumentation for concentrations of COp. CO,
hydrocarbons, and Op.
The concentration of CO in combustion effluent gas is of particular impor-
tance because it is a good indicator of the efficiency of the combustion proc-
ess. Combustion efficiency values are readily calculated from COp and CO meas-
urements. This approach to compliance determination has several advantages.
It is real-time, continuous, rapid, and calculations are readily performed.
Most importantly, using on-line instrumentation makes compliance determination
waste-independent. Therefore, sampling and analysis plans do not have to be
designed for each type of waste burned. Further, one need not know waste
feed rates to an incinerator to be able to calculate combustion efficiency.
For example, if one were measuring chlorinated compounds in the effluent from
93
image:
 TABLE 44, SUMMARY OF FIRST BURN WIPE SAMPLES
1.
2.
3.
4.
5.
6.
7.
8.
9.
10.
11.
12.
13.
14.
15.
16.
17.
18.
19.
20.
21.
22.
23.
24.
25.
26.
27.
Location 16 July
Galley Floor
SBD, Entry to Galley
SBD, Inside Entry
SBD, Outside Entry
SBD, Entry Comb. Rm
Bollard(s), Fan tall
Top of Fantall Stairs Neg
Comb. Rm, Various
Shower, Comb. Rm
PT, Entry Comb. Rm
Outside. Dining Rm
Inside Dining Rm
Dining Rm Floor
PT, Outside Entry
PT, Inside Entry
Pump Room Hatch
PT, Inside, Entry Pass
PT. Outside, Entry Pass
Butterworth Hatches
Main Deck, Various
Top, 2nd Floor Stairs
Foot, Stairs to Bridge
TRW Crew Qtrs
PT, Qtrs Door
PT, Passage, Various
PT, Boat Deck
Laundry
Date
17 July 18 July 19 July 20 July 21 July 22 July 23 July 24 July
Neg, Neg
Neg ... _ POS , Neg
.... - -
-
-
-
Neg - - Neg -
Neg Neg Neg - Pos
Neg -
Neg Neg - Neg Neg
-- --
-
Neg - Neg, Neg -
.
.
Pos Pos
.
.
Neg
Neg - -
.
.
Pos, Neg - -
Neg - - Neg - - -
Neg. Neg
Neg. Neg Neg - -
Neg
Indicates wipe sample not taken.
image:
TABLE 44, SUMMARY OF FIRST BURN WIPE SAMPLES
1.
2.
3.
4.
5.
6.
7.
8.
9.
10.
11.
12.
13.
14.
15.
16.
17.
18.
19.
20.
21.
22.
23.
24.
25.
26.
27.
Location 16 July
Galley Floor
SBD, Entry to Galley
SBD, Inside Entry
SBD, Outside Entry
SBD, Entry Comb. Rm
Bollard(s), Fan tall
Top of Fantall Stairs Neg
Comb. Rm, Various
Shower, Comb. Rm
PT, Entry Comb. Rm
Outside. Dining Rm
Inside Dining Rm
Dining Rm Floor
PT, Outside Entry
PT, Inside Entry
Pump Room Hatch
PT, Inside, Entry Pass
PT. Outside, Entry Pass
Butterworth Hatches
Main Deck, Various
Top, 2nd Floor Stairs
Foot, Stairs to Bridge
TRW Crew Qtrs
PT, Qtrs Door
PT, Passage, Various
PT, Boat Deck
Laundry
Date
17 July 18 July 19 July 20 July 21 July 22 July 23 July 24 July
Neg, Neg
Neg ... _ POS , Neg
.... - -
-
-
-
Neg - - Neg -
Neg Neg Neg - Pos
Neg -
Neg Neg - Neg Neg
-- --
-
Neg - Neg, Neg -
.
.
Pos Pos
.
.
Neg
Neg - -
.
.
Pos, Neg - -
Neg - - Neg - - -
Neg. Neg
Neg. Neg Neg - -
Neg
Indicates wipe sample not taken.
image:
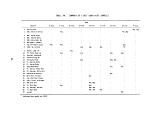 TABLE 45. SUMMARY OF SECOND BURN WIPE SAMPLES
Location
7 Aug 7 Aug 8 Aug 9 Aug 9 Aug
Date
10 Aug 11 Aug 12 Aug 13 Aug 13 Aug 14 Aug 15 Aug 16 Aug
10
in
1. Galley Floor -
2. SBD, Entry to Galley -
3. SBD, Inside Entry . - - -
4. SBD, Outside Entry Pos Pos Pos Pos
5. SBD, Entry Comb Rm Neg
6. Bollard(s). Fantall -
7. Top of Fantall Stairs - - Neg -
8. Comb Room Various -
9. Shower-Comb Rm -
10. PT, Entry Comb Rm Pos - Neg Pos
Neg
Neg
Neg
(Inside)
Pos
Neg
Neg
Neg
Neg
Pos
Neg
Neg
Pos
Neg
Neg
Neg
Neg - !
Neg - Neg
Neg
Pos
Neg
Neg
Neg
Pos
Neg
11.
12.
13.
14.
15.
16.
17.
18.
19.
20.
21.
22.
23.
24.
25.
26.
27.
Outside Dining Rm Pos
Inside Dining Entry Pos
Dining Rm Floor
PT, Outside Entry Pos
PT, Inside Entry
Pump Rm Hatch
PT, Inside Entry Pass.
PT, Outside Entry Pass.
Butterworth Hatches
Main Deck, Various
Top, 2nd Floor Stairs
Foot, Stairs to Bridge
TRH Crew Qtrs
PT, Qtrs Door
PT Passage, Various
PT, Boat Deck
Laundry
Pos
Pos
Pos
Pos Pos Pos
.
Pos
.
.
Pos
- -
- -
-
-
-
-
-
-
Neg -
--_-----
Neg Neg Neg Neg - "eg Neg
Neg Neg Neg Pos -
_ .
-
-
------
-
-
---- - - - -
— • — — — — —
---- -»--
-
- „-.. -" - -
- - _ _ - » _-
-
Indicates wipe sample not taken.
image:
TABLE 45. SUMMARY OF SECOND BURN WIPE SAMPLES
Location
7 Aug 7 Aug 8 Aug 9 Aug 9 Aug
Date
10 Aug 11 Aug 12 Aug 13 Aug 13 Aug 14 Aug 15 Aug 16 Aug
10
in
1. Galley Floor -
2. SBD, Entry to Galley -
3. SBD, Inside Entry . - - -
4. SBD, Outside Entry Pos Pos Pos Pos
5. SBD, Entry Comb Rm Neg
6. Bollard(s). Fantall -
7. Top of Fantall Stairs - - Neg -
8. Comb Room Various -
9. Shower-Comb Rm -
10. PT, Entry Comb Rm Pos - Neg Pos
Neg
Neg
Neg
(Inside)
Pos
Neg
Neg
Neg
Neg
Pos
Neg
Neg
Pos
Neg
Neg
Neg
Neg - !
Neg - Neg
Neg
Pos
Neg
Neg
Neg
Pos
Neg
11.
12.
13.
14.
15.
16.
17.
18.
19.
20.
21.
22.
23.
24.
25.
26.
27.
Outside Dining Rm Pos
Inside Dining Entry Pos
Dining Rm Floor
PT, Outside Entry Pos
PT, Inside Entry
Pump Rm Hatch
PT, Inside Entry Pass.
PT, Outside Entry Pass.
Butterworth Hatches
Main Deck, Various
Top, 2nd Floor Stairs
Foot, Stairs to Bridge
TRH Crew Qtrs
PT, Qtrs Door
PT Passage, Various
PT, Boat Deck
Laundry
Pos
Pos
Pos
Pos Pos Pos
.
Pos
.
.
Pos
- -
- -
-
-
-
-
-
-
Neg -
--_-----
Neg Neg Neg Neg - "eg Neg
Neg Neg Neg Pos -
_ .
-
-
------
-
-
---- - - - -
— • — — — — —
---- -»--
-
- „-.. -" - -
- - _ _ - » _-
-
Indicates wipe sample not taken.
image:
 TABLE 46. SUMMARY OF THIRD BURN WIPE SAMPLES
<£>
1.
2.
3.
4.
5.
6.
7.
8.
9.
10.
11.
12.
13.
14.
15.
16.
17.
18.
19.
20.
21.
22.
23.
24.
25.
26.
27.
Location 25 Aug
Galley Floor
SBD, Entry to Galley
SBD, Inside Entry Neg
SBD, Outside Entry
SBD, Entry Comb Rm
Bollard(s) Fantall
Top of Fantall Stairs
Comb Rm, Various
Shower, Comb Rm
PT, Entry Comb Rm Neg
Outside Dining Rm
Inside Dining Rm
Dining Rm Floor Neg
PT, Outside, Entry
PT, Inside, Entry Pos
Pump Rm Hatch Pos
PT, Inside Entry Pass
PT, Outside Entry Pass
Butterworth Hatches
Deck, Main
Top Qtrs Stairs,
2nd Floor
Foot, Stairs to Bridge
TRW Crew Qtrs
PT, Qtrs Door
PT Passage, Various
PT, Boat Deck
Laundry
Date
26 Aug 27 Aug 28 Aug 29 Aug 30 Aug 31 Aug 1 Sep 2 Sep
Neg - - - - - - Pos
Pos Pos
Neg Neg - Neg Neg Neg Neg
_--- _ - • -
_--- - - • -
Pos
Neg
-
_--- - _ - -
Neg - - Pos Pos - Pos Pos
---- - ~ -"
_ - - - -
Neg Neg - Pos Pos Pos Pos Pos
-
Neg Neg - Pos Pos Neg Pos
_
Pos
Pos
___-
Pos - - - -
Neg - - - Pos
Neg
... - - -
_ _ -
- -
- - - -
_---- - -•
Indicates wipe sample not taken.
image:
TABLE 46. SUMMARY OF THIRD BURN WIPE SAMPLES
<£>
1.
2.
3.
4.
5.
6.
7.
8.
9.
10.
11.
12.
13.
14.
15.
16.
17.
18.
19.
20.
21.
22.
23.
24.
25.
26.
27.
Location 25 Aug
Galley Floor
SBD, Entry to Galley
SBD, Inside Entry Neg
SBD, Outside Entry
SBD, Entry Comb Rm
Bollard(s) Fantall
Top of Fantall Stairs
Comb Rm, Various
Shower, Comb Rm
PT, Entry Comb Rm Neg
Outside Dining Rm
Inside Dining Rm
Dining Rm Floor Neg
PT, Outside, Entry
PT, Inside, Entry Pos
Pump Rm Hatch Pos
PT, Inside Entry Pass
PT, Outside Entry Pass
Butterworth Hatches
Deck, Main
Top Qtrs Stairs,
2nd Floor
Foot, Stairs to Bridge
TRW Crew Qtrs
PT, Qtrs Door
PT Passage, Various
PT, Boat Deck
Laundry
Date
26 Aug 27 Aug 28 Aug 29 Aug 30 Aug 31 Aug 1 Sep 2 Sep
Neg - - - - - - Pos
Pos Pos
Neg Neg - Neg Neg Neg Neg
_--- _ - • -
_--- - - • -
Pos
Neg
-
_--- - _ - -
Neg - - Pos Pos - Pos Pos
---- - ~ -"
_ - - - -
Neg Neg - Pos Pos Pos Pos Pos
-
Neg Neg - Pos Pos Neg Pos
_
Pos
Pos
___-
Pos - - - -
Neg - - - Pos
Neg
... - - -
_ _ -
- -
- - - -
_---- - -•
Indicates wipe sample not taken.
image:
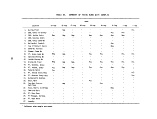 1. Galley Floor
2. Sbd. entry to galley
3. Inside Sbd. entry to Qtrs.
4. Outside Sbd. entry to Qtrs.
5. Sbd. entry to Combustion Room
6. Bollard, fantall and Combustion Room
7. Top of fantail stairs
8. Combustion Room, various
9. Shower, Inside
10. Port entry to Combustion Room
11. Entry to dining area
12. Inside dining area
13. Dining Room Floor
14. Outside Port entry to Qtrs.
15. Inside Port entry to Qtrs.
16. Pump Room Hatch
17. Inside Port Passageway entry
18. Outside Port Passageway entry
19. Butterworth Hatches, various
20. Main deck, various
21. Top, 2nd. deck stairs (not shown)
22. Foot of stairs to bridge (not shown)
23. TRW crew Qtrs. (not shown)
24. Port door, Qtrs. (not shown)
25. Port Passage, various (not shown)
26. Port Boat Deck (not shown)
27. Laundry (not shown)
10
•-COMBUSTION AREA »ir« LIVING AREA *-j
II I
II I
-TANKAGE AREA
Figure 17. Location of wipe samples on M/T Vulcanus — summary of three burns.
image:
1. Galley Floor
2. Sbd. entry to galley
3. Inside Sbd. entry to Qtrs.
4. Outside Sbd. entry to Qtrs.
5. Sbd. entry to Combustion Room
6. Bollard, fantall and Combustion Room
7. Top of fantail stairs
8. Combustion Room, various
9. Shower, Inside
10. Port entry to Combustion Room
11. Entry to dining area
12. Inside dining area
13. Dining Room Floor
14. Outside Port entry to Qtrs.
15. Inside Port entry to Qtrs.
16. Pump Room Hatch
17. Inside Port Passageway entry
18. Outside Port Passageway entry
19. Butterworth Hatches, various
20. Main deck, various
21. Top, 2nd. deck stairs (not shown)
22. Foot of stairs to bridge (not shown)
23. TRW crew Qtrs. (not shown)
24. Port door, Qtrs. (not shown)
25. Port Passage, various (not shown)
26. Port Boat Deck (not shown)
27. Laundry (not shown)
10
•-COMBUSTION AREA »ir« LIVING AREA *-j
II I
II I
-TANKAGE AREA
Figure 17. Location of wipe samples on M/T Vulcanus — summary of three burns.
image:
 burning an organochlorine waste, it would be necessary to know the waste feed
rate in order to calculate an incineration destruction efficiency.
In addition to on-line monitoring during these test programs, samples of
all process streams, such as combustion effluent, incinerator ash, feed stocks,
and scrubber effluent, were acquired for laboratory analysis. Results of these
analyses were used to calculate destruction efficiencies for specific waste
components. Table 47 presents a comparison of combustion and destruction effi-
ciencies determined on both land based and at-sea incineration tests. The
results in Table 47 indicate that combustion efficiency compared well with waste
destruction efficiency. In those cases where a destruction efficiency was lower
than the corresponding combustion efficiency, waste constituents were found in
incinerator ash, and destruction efficiencies based on combustion effluent anal-
yses only were higher than those given in the table.
For the Gulf of Mexico tests on the M/T Vulcanus, ' a special moveable,
water-cooled, stainless steel jacketed probe with a quartz liner was developed.
This probe traversed the starboard incinerator stack and conducted the combus-
tion effluent gas to both the SASS stack sampling train and the on-line instru-
mentation. Analysis of on-line monitoring data led to the important conclusion
that a fixed-position probe drawing sample gas from a single point in the stack
would have served to measure the effluent gas composition and incinerator com-
bustion efficiency. At probe insertion depths greater than 15 cm past the inner
wall of the stack, wall effects were negligible, and all calculated combustion
efficiencies were greater than 99.9%.
For the Herbicide Orange incineration tests, a fixed-position alumina
probe was placed approximately 38 cm (15 in.) past the inner wall of each incin-
erator stack, and the moveable probe was again placed in the starboard stack.
The moveable probe conducted combustion effluent to the sampling trains, while
the fixed-position probes conducted combustion effluent gas samples to the
on-line monitors. One test was performed with the moveable probe connected to
the on-line monitors so that combustion efficiency could be measured as a func-
tion of distance across the stack. The results of this test are given in
Figure 15 and show that at insertion depths greater than 10 cm combustion
efficiencies were essentially invariant and exceeded 99.991%'.
98
image:
burning an organochlorine waste, it would be necessary to know the waste feed
rate in order to calculate an incineration destruction efficiency.
In addition to on-line monitoring during these test programs, samples of
all process streams, such as combustion effluent, incinerator ash, feed stocks,
and scrubber effluent, were acquired for laboratory analysis. Results of these
analyses were used to calculate destruction efficiencies for specific waste
components. Table 47 presents a comparison of combustion and destruction effi-
ciencies determined on both land based and at-sea incineration tests. The
results in Table 47 indicate that combustion efficiency compared well with waste
destruction efficiency. In those cases where a destruction efficiency was lower
than the corresponding combustion efficiency, waste constituents were found in
incinerator ash, and destruction efficiencies based on combustion effluent anal-
yses only were higher than those given in the table.
For the Gulf of Mexico tests on the M/T Vulcanus, ' a special moveable,
water-cooled, stainless steel jacketed probe with a quartz liner was developed.
This probe traversed the starboard incinerator stack and conducted the combus-
tion effluent gas to both the SASS stack sampling train and the on-line instru-
mentation. Analysis of on-line monitoring data led to the important conclusion
that a fixed-position probe drawing sample gas from a single point in the stack
would have served to measure the effluent gas composition and incinerator com-
bustion efficiency. At probe insertion depths greater than 15 cm past the inner
wall of the stack, wall effects were negligible, and all calculated combustion
efficiencies were greater than 99.9%.
For the Herbicide Orange incineration tests, a fixed-position alumina
probe was placed approximately 38 cm (15 in.) past the inner wall of each incin-
erator stack, and the moveable probe was again placed in the starboard stack.
The moveable probe conducted combustion effluent to the sampling trains, while
the fixed-position probes conducted combustion effluent gas samples to the
on-line monitors. One test was performed with the moveable probe connected to
the on-line monitors so that combustion efficiency could be measured as a func-
tion of distance across the stack. The results of this test are given in
Figure 15 and show that at insertion depths greater than 10 cm combustion
efficiencies were essentially invariant and exceeded 99.991%'.
98
image:
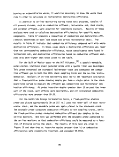 TABLE 47. COMPARISON OF COMBUSTION AND DESTRUCTION EFFICIENCIES*
Site
Rollins
Environmental
Services
3M Company
Systech
Marquardt
M/T Vulcanus
M/T Vulcanus
Waste
PCBs, hammermilled capacitors
PCBs, whole capacitors
Nitrochlorobenzene waste
Polyvinyl chloride waste
Phenol waste
Monomethylmethacrylate waste
Ethyl ene waste
Hexachlorocyclopentadiene waste
Organochlorine waste
Herbicide Orange
Combustion
Efficiency,
%
99.99
99.99
99.99
99.97-99.99
99.98-99.99
99.98-99.99
99.98
99.98
99.96-99.98
99.99
Destruction
Efficiency
as Organicsr
%
99.96
99.94
99.84-99.87
99.80-99.88
99.93-99.95
99.96-99.98
99.86-99.95
99.94-99.95
99.91-99.96
>99.999
Destruction
Efficiency,
Waste
Constituents,
%
>99.999
99. 51"
>99.999
99.999
99.99,
>99.999
>99.999
>99.999
>99.999
99.92-99.98
>99.99
«
Adapted from data in References 4 and 5.
'Overall destruction efficiency reduced by high PCB content in ash. Efficiency based on combus-
tion effluent sampling was >99.999%.
This destruction efficiency was based on emissions of all organic compounds.
image:
TABLE 47. COMPARISON OF COMBUSTION AND DESTRUCTION EFFICIENCIES*
Site
Rollins
Environmental
Services
3M Company
Systech
Marquardt
M/T Vulcanus
M/T Vulcanus
Waste
PCBs, hammermilled capacitors
PCBs, whole capacitors
Nitrochlorobenzene waste
Polyvinyl chloride waste
Phenol waste
Monomethylmethacrylate waste
Ethyl ene waste
Hexachlorocyclopentadiene waste
Organochlorine waste
Herbicide Orange
Combustion
Efficiency,
%
99.99
99.99
99.99
99.97-99.99
99.98-99.99
99.98-99.99
99.98
99.98
99.96-99.98
99.99
Destruction
Efficiency
as Organicsr
%
99.96
99.94
99.84-99.87
99.80-99.88
99.93-99.95
99.96-99.98
99.86-99.95
99.94-99.95
99.91-99.96
>99.999
Destruction
Efficiency,
Waste
Constituents,
%
>99.999
99. 51"
>99.999
99.999
99.99,
>99.999
>99.999
>99.999
>99.999
99.92-99.98
>99.99
«
Adapted from data in References 4 and 5.
'Overall destruction efficiency reduced by high PCB content in ash. Efficiency based on combus-
tion effluent sampling was >99.999%.
This destruction efficiency was based on emissions of all organic compounds.
image:
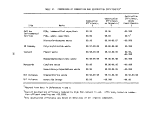 4.3.2 Problems with On-line Instrumentation
During land-based incinerator tests, the on-line instrumentation was housed
in an automotive van equipped as a portable laboratory. No problems were
encountered with the on-line instruments during the land based tests despite
the long drives from site to site and corrosiveness of many of the wastes.
For the at-sea incineration tests, a standard shipping container was mod-
ified as a portable laboratory to house the instruments. During the Gulf of
Mexico tests, a progressive baseline drift of the C0« analyzer was encountered,
and more frequent calibration was necessary.
During the Herbicide Orange burns, there were considerable difficulties
with the on-line instrumentation as described in Section 3.2. Usable data were
acquired although more frequent calibration and tuning were necessary. It is
believed, however, that problems with the on-line instruments were caused by
system design oversights rather than by any problems inherent in the instruments
themselves or by their use.
The system design errors were cold spots in the lines conducting the com-
bustion effluent gas samples from the probe to the on-line instruments. A single
heat-traced line led from the observation deck to the portable laboratory where
it was connected to a manifold. Valves in this manifold permitted the operator
to switch the combustion effluent to either gas conditioner. Heat traced lines
led from the manifold to the gas conditioner. The manifold itself, however,
was not heated. Consequently, condensation may have occurred, and the conden-
sate would have been quite corrosive because of the HC1 content of the combus-
tion effluent. The Perma-Pure® dryer in each gas conditioner was designed to
remove only water vapor. Therefore, liquid water could have passed through the
gas conditioners.
In the equipment mounting rack containing the on-line instruments were
inlet and outlet manifolds which distributed sample gas to and recombined sample
gas from the instruments. Neither of these manifolds was heated. Condensate
was observed in the outlet manifold, and some condensate drained into and
damaged the CO analyzers.
100
image:
4.3.2 Problems with On-line Instrumentation
During land-based incinerator tests, the on-line instrumentation was housed
in an automotive van equipped as a portable laboratory. No problems were
encountered with the on-line instruments during the land based tests despite
the long drives from site to site and corrosiveness of many of the wastes.
For the at-sea incineration tests, a standard shipping container was mod-
ified as a portable laboratory to house the instruments. During the Gulf of
Mexico tests, a progressive baseline drift of the C0« analyzer was encountered,
and more frequent calibration was necessary.
During the Herbicide Orange burns, there were considerable difficulties
with the on-line instrumentation as described in Section 3.2. Usable data were
acquired although more frequent calibration and tuning were necessary. It is
believed, however, that problems with the on-line instruments were caused by
system design oversights rather than by any problems inherent in the instruments
themselves or by their use.
The system design errors were cold spots in the lines conducting the com-
bustion effluent gas samples from the probe to the on-line instruments. A single
heat-traced line led from the observation deck to the portable laboratory where
it was connected to a manifold. Valves in this manifold permitted the operator
to switch the combustion effluent to either gas conditioner. Heat traced lines
led from the manifold to the gas conditioner. The manifold itself, however,
was not heated. Consequently, condensation may have occurred, and the conden-
sate would have been quite corrosive because of the HC1 content of the combus-
tion effluent. The Perma-Pure® dryer in each gas conditioner was designed to
remove only water vapor. Therefore, liquid water could have passed through the
gas conditioners.
In the equipment mounting rack containing the on-line instruments were
inlet and outlet manifolds which distributed sample gas to and recombined sample
gas from the instruments. Neither of these manifolds was heated. Condensate
was observed in the outlet manifold, and some condensate drained into and
damaged the CO analyzers.
100
image:
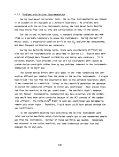 Several changes in the design of the on-line monitoring system used in the
Herbicide Orange tests would allow extended operation without excessive mainte-
nance, calibration, and tuning:
• Elimination of cold spots in the lines carrying combustion
effluent and siting of manifolds so that condensate which might
form cannot drain into instruments.
• Addition of condensate traps in lines carrying sample gas. The
volumes of these traps should be small so as to minimize instru-
ment response time to concentration changes in the sample gas.
t Substitution of a gas conditioner operating on a different prin-
ciple, such as refrigeration, for the diffusion-type gas con-
ditioner used thus far. Alternatively, appropriate absorption
systems for H?0 and HC1 might be found, and gas conditioners
could be eliminated.
The extensive test program discussed in this section has demonstrated the
feasibility of using on-line monitoring instruments to measure CCL and CO con-
centrations in incinerator effluent streams and to determine permit compliance.
The instrumentation package withstood hard travel and corrosive combustion
gases. The only problems occurred because of design oversights.
101
image:
Several changes in the design of the on-line monitoring system used in the
Herbicide Orange tests would allow extended operation without excessive mainte-
nance, calibration, and tuning:
• Elimination of cold spots in the lines carrying combustion
effluent and siting of manifolds so that condensate which might
form cannot drain into instruments.
• Addition of condensate traps in lines carrying sample gas. The
volumes of these traps should be small so as to minimize instru-
ment response time to concentration changes in the sample gas.
t Substitution of a gas conditioner operating on a different prin-
ciple, such as refrigeration, for the diffusion-type gas con-
ditioner used thus far. Alternatively, appropriate absorption
systems for H?0 and HC1 might be found, and gas conditioners
could be eliminated.
The extensive test program discussed in this section has demonstrated the
feasibility of using on-line monitoring instruments to measure CCL and CO con-
centrations in incinerator effluent streams and to determine permit compliance.
The instrumentation package withstood hard travel and corrosive combustion
gases. The only problems occurred because of design oversights.
101
image:
 5. SAFETY AND PERSONNEL PROTECTION
This section describes the procedures which were used to protect personnel
from exposure to Herbicide Orange and TCDD or their combustion products during
the at-sea incineration of the herbicide onboard the M/T Vulcanus. The person-
nel protection plan was incorporated into the Safety Plan (Appendix A) and thus
became part of the permit conditions for the incineration.
Herbicide Orange is an organic chloride consisting of a 50/50 mixture
(approximately) of 2,4-D and 2,4,5-T. When drummed, this material contained
TCDD as a toxic but minor constituent at levels of 0.5 to 47.0 ppm with an
12)
average concentration of 1.9 ppm.v '
Herbicide Orange (i.e., 2,4-D and 2,4,5-T) has been shown to be moderately
toxic and is rapidly eliminated from the body by the kidneys. The American
Conference of Governmental Industrial Hygienists (AC6IH) has recommended Thresh-
old Limit Values (TLVs) in air for either 2,4-D or 2,4,5-T to be 10 mg/m . The
TLV is a time-weighted safe air concentration for an 8-hour day or 40-hour work
week. Based on the TLV, a range of time-limited ambient (personnel breathing
zone) concentrations considered safe exposure levels for personnel onboard the
M/T Vulcanus were set (Appendix A) as follows:
Combined Concentration of Butyl Esters of 2,4-D and 2,4,5-T
3
2.0 mg/m for samples taken periodically over 16 hours or
10.0 mg/m for samples taken periodically over 8 hours
TCDD has been shown to be extremely toxic, with no-effect dose levels for
embryotoxicity and chick edema as low as 0.03 to 0.1 yg/kg/of body weight/day,
respectively. The safe ambient concentration for TCDD onboard the M/T Vulcanus
was established as 6 ng/m (Appendix A). Furthermore, TCDD in its physiological
action is embryotoxic, teratogenic (especially in the first trimester) and
acnegenic. It is this extremely high toxicity, with the possibility of organic
damage and the disfiguring effects of chloracne, which dictated the type of
102
image:
5. SAFETY AND PERSONNEL PROTECTION
This section describes the procedures which were used to protect personnel
from exposure to Herbicide Orange and TCDD or their combustion products during
the at-sea incineration of the herbicide onboard the M/T Vulcanus. The person-
nel protection plan was incorporated into the Safety Plan (Appendix A) and thus
became part of the permit conditions for the incineration.
Herbicide Orange is an organic chloride consisting of a 50/50 mixture
(approximately) of 2,4-D and 2,4,5-T. When drummed, this material contained
TCDD as a toxic but minor constituent at levels of 0.5 to 47.0 ppm with an
12)
average concentration of 1.9 ppm.v '
Herbicide Orange (i.e., 2,4-D and 2,4,5-T) has been shown to be moderately
toxic and is rapidly eliminated from the body by the kidneys. The American
Conference of Governmental Industrial Hygienists (AC6IH) has recommended Thresh-
old Limit Values (TLVs) in air for either 2,4-D or 2,4,5-T to be 10 mg/m . The
TLV is a time-weighted safe air concentration for an 8-hour day or 40-hour work
week. Based on the TLV, a range of time-limited ambient (personnel breathing
zone) concentrations considered safe exposure levels for personnel onboard the
M/T Vulcanus were set (Appendix A) as follows:
Combined Concentration of Butyl Esters of 2,4-D and 2,4,5-T
3
2.0 mg/m for samples taken periodically over 16 hours or
10.0 mg/m for samples taken periodically over 8 hours
TCDD has been shown to be extremely toxic, with no-effect dose levels for
embryotoxicity and chick edema as low as 0.03 to 0.1 yg/kg/of body weight/day,
respectively. The safe ambient concentration for TCDD onboard the M/T Vulcanus
was established as 6 ng/m (Appendix A). Furthermore, TCDD in its physiological
action is embryotoxic, teratogenic (especially in the first trimester) and
acnegenic. It is this extremely high toxicity, with the possibility of organic
damage and the disfiguring effects of chloracne, which dictated the type of
102
image:
 precautions which were instituted for the protection of personnel involved in
the at-sea incineration. The physiological activity and toxicological proper-
ties of 2,4-D, 2,4,5-T, and TCDD are discussed in detail in Appendix B.
The methods of entry into the body of both Herbicide Orange and TCDD are
by ingestion, absorption through the skin, and inhalation.
5.1 DESIGN OF THE PERSONNEL PROTECTION PLAN
From an operational standpoint, the M/T Vulcanus, pictured in Figure 2 and
shown schematically in Figure 17, consists of several functionally discrete
parts, each devoted to a specific operation, such as waste storage, propulsion,
combustion, and living quarters. Herbicide Orange was handled in the storage
and combustion areas.
The living quarters, mess hall, galley, and recreation areas are located
between the- tankage area (forward) and the combustion room (aft). The location
of the various functional portions of the ship are shown in Figure 17. The
crew of 18 and the test and observation team of 8 were allowed to move freely
about the ship in performing their duties, and to return to the living area for
meals, sleep, and recreation. This situation could have resulted in bringing
toxic materials into the living quarters unless specific preventive procedures
were established.
A personnel protection plan was, therefore, designed to isolate the toxic
material in the storage and combustion areas, protect personnel from possible
contamination, and prevent the spread of Herbicide Orange into other portions
of the ship. Important considerations in the selection of this personnel pro-
tection plan were the:
• Confined nature of a shipboard operation
• Centralization of living quarters
t Percutaneous, ingestion, and inhalation paths of exposure
• High toxicity of TCDD.
It was considered mandatory that working personnel be free of contamination
before returning to eating and living facilities in order to avoid exposure of
others not normally required to come in contact with the chemicals and to pre-
vent additional exposure risk to themselves. A boundary-isolation method was
selected as the most effective technique for excluding Herbicide Orange from
103
image:
precautions which were instituted for the protection of personnel involved in
the at-sea incineration. The physiological activity and toxicological proper-
ties of 2,4-D, 2,4,5-T, and TCDD are discussed in detail in Appendix B.
The methods of entry into the body of both Herbicide Orange and TCDD are
by ingestion, absorption through the skin, and inhalation.
5.1 DESIGN OF THE PERSONNEL PROTECTION PLAN
From an operational standpoint, the M/T Vulcanus, pictured in Figure 2 and
shown schematically in Figure 17, consists of several functionally discrete
parts, each devoted to a specific operation, such as waste storage, propulsion,
combustion, and living quarters. Herbicide Orange was handled in the storage
and combustion areas.
The living quarters, mess hall, galley, and recreation areas are located
between the- tankage area (forward) and the combustion room (aft). The location
of the various functional portions of the ship are shown in Figure 17. The
crew of 18 and the test and observation team of 8 were allowed to move freely
about the ship in performing their duties, and to return to the living area for
meals, sleep, and recreation. This situation could have resulted in bringing
toxic materials into the living quarters unless specific preventive procedures
were established.
A personnel protection plan was, therefore, designed to isolate the toxic
material in the storage and combustion areas, protect personnel from possible
contamination, and prevent the spread of Herbicide Orange into other portions
of the ship. Important considerations in the selection of this personnel pro-
tection plan were the:
• Confined nature of a shipboard operation
• Centralization of living quarters
t Percutaneous, ingestion, and inhalation paths of exposure
• High toxicity of TCDD.
It was considered mandatory that working personnel be free of contamination
before returning to eating and living facilities in order to avoid exposure of
others not normally required to come in contact with the chemicals and to pre-
vent additional exposure risk to themselves. A boundary-isolation method was
selected as the most effective technique for excluding Herbicide Orange from
103
image:
 those areas where personnel were concentrated. This concept appeared to have
the greatest possibility of success with the least interference with working
personnel. The objective was to isolate Herbicide Orange within set boundaries,
control access to those areas, and to eliminate carrying of the waste across
the boundaries by ship or test personnel. The ship was, therefore, divided
into clean and contaminated areas with boundaries separating them.
• Three areas of the ship were considered to be probable sources
of contamination:
1) The main deck (forward) which covered the waste storage
tanks. Filling ports and access hatches (Butterworths)
protrude through this deck from the tanks.
2) The pump room, located below decks, aft of the waste storage
area and below the living quarters.
3) The combustion room, which houses the lower portions of the
two furnaces, the burners, and the combustion control area.
• One area was designated as free of contamination. This area
contained:
1) The bridge, with ship control and radio communication.
2) Living quarters for officers, crew, and test team.
3) The galley and combined mess hall/recreation room.
In addition to defining the boundary-isqlation method for controlling per-
sonnel movement, the personnel protection plan also defined criteria for inter-
rupting the incineration to prevent exposure to Herbicide Orange. These cri-
teria are discussed in Appendix A. In brief, the personnel protection plan
provided for interruption of incinerator operations if:
• Conditions prevented keeping the plume off the ship
• Major spills occurred which could not readily be contained or
cleaned
t Combustion efficiency fell below 99.9%
• Concentrations of 2,4-D + 2,4,5-T in the combustion effluent
exceeded 130 ppm (130 yg/m3) as determined by onboard analysis
t Workspace air concentrations of 2,4-D + 2,4,5-T exceeded the
TLV of 10 ppm over 8 hours or 2 ppm over 16 hours as determined
by onboard analysis
104
image:
those areas where personnel were concentrated. This concept appeared to have
the greatest possibility of success with the least interference with working
personnel. The objective was to isolate Herbicide Orange within set boundaries,
control access to those areas, and to eliminate carrying of the waste across
the boundaries by ship or test personnel. The ship was, therefore, divided
into clean and contaminated areas with boundaries separating them.
• Three areas of the ship were considered to be probable sources
of contamination:
1) The main deck (forward) which covered the waste storage
tanks. Filling ports and access hatches (Butterworths)
protrude through this deck from the tanks.
2) The pump room, located below decks, aft of the waste storage
area and below the living quarters.
3) The combustion room, which houses the lower portions of the
two furnaces, the burners, and the combustion control area.
• One area was designated as free of contamination. This area
contained:
1) The bridge, with ship control and radio communication.
2) Living quarters for officers, crew, and test team.
3) The galley and combined mess hall/recreation room.
In addition to defining the boundary-isqlation method for controlling per-
sonnel movement, the personnel protection plan also defined criteria for inter-
rupting the incineration to prevent exposure to Herbicide Orange. These cri-
teria are discussed in Appendix A. In brief, the personnel protection plan
provided for interruption of incinerator operations if:
• Conditions prevented keeping the plume off the ship
• Major spills occurred which could not readily be contained or
cleaned
t Combustion efficiency fell below 99.9%
• Concentrations of 2,4-D + 2,4,5-T in the combustion effluent
exceeded 130 ppm (130 yg/m3) as determined by onboard analysis
t Workspace air concentrations of 2,4-D + 2,4,5-T exceeded the
TLV of 10 ppm over 8 hours or 2 ppm over 16 hours as determined
by onboard analysis
104
image:
 5.2 IMPLEMENTATION OF THE PERSONNEL PROTECTION PLAN
The following goals were set for personnel protection onboard the M/T
Vulcanus:
• Isolating Herbicide Orange in working areas and excluding it
from living areas by defining boundaries between dirty and
clean areas
t Eliminating potential contamination carriers by providing for
decontamination at these boundaries
• Locating and controlling contamination in a timely manner
• Controlling and monitoring incinerator operations to prevent
workspace air concentrations of 2,4-D and 2,4,5-T in excess
of TLVs.
Concepts developed in the Safety Plan were implemented by the test team
and the ship's officers and crew. Implementation of the personnel protection
procedures was effected by:
• A detailed briefing of ship and test personnel explaining the
need for following the procedures by all personnel and the
boundary-isolation concept
• Providing adequate and comfortable disposable protective cloth-
ing and a shower at the port exit from the combustion room
§ Providing for an onboard analytical chemistry capability for
detecting the spread of contamination past set boundaries and
workspace air concentrations in excess of TLVs.
Briefing of the crew of the M/T Vulcanus was carried out at Gulfport, MI,
just prior to loading the ship with Herbicide Orange. The briefing covered the
toxic properties of Herbicide Orange, the need for personal hygiene, and the
effectiveness of safety procedures in preventing exposure. Test personnel were
similarly briefed. All personnel who might have come into contact with Herbicide
Orange were given pre- and post-program physical examinations.
Protective clothing consisted of cellulose fiber coveralls and plastic
shoe covers. The coveralls were light, porous, comfortable and inexpensive.
They were discarded after each shift. Fresh coveralls were issued at the begin-
ning of each shift. Shoe covers were available at the exits from the living
quarters and at the port entrance to the combustion room. Disposal cans for
105
image:
5.2 IMPLEMENTATION OF THE PERSONNEL PROTECTION PLAN
The following goals were set for personnel protection onboard the M/T
Vulcanus:
• Isolating Herbicide Orange in working areas and excluding it
from living areas by defining boundaries between dirty and
clean areas
t Eliminating potential contamination carriers by providing for
decontamination at these boundaries
• Locating and controlling contamination in a timely manner
• Controlling and monitoring incinerator operations to prevent
workspace air concentrations of 2,4-D and 2,4,5-T in excess
of TLVs.
Concepts developed in the Safety Plan were implemented by the test team
and the ship's officers and crew. Implementation of the personnel protection
procedures was effected by:
• A detailed briefing of ship and test personnel explaining the
need for following the procedures by all personnel and the
boundary-isolation concept
• Providing adequate and comfortable disposable protective cloth-
ing and a shower at the port exit from the combustion room
§ Providing for an onboard analytical chemistry capability for
detecting the spread of contamination past set boundaries and
workspace air concentrations in excess of TLVs.
Briefing of the crew of the M/T Vulcanus was carried out at Gulfport, MI,
just prior to loading the ship with Herbicide Orange. The briefing covered the
toxic properties of Herbicide Orange, the need for personal hygiene, and the
effectiveness of safety procedures in preventing exposure. Test personnel were
similarly briefed. All personnel who might have come into contact with Herbicide
Orange were given pre- and post-program physical examinations.
Protective clothing consisted of cellulose fiber coveralls and plastic
shoe covers. The coveralls were light, porous, comfortable and inexpensive.
They were discarded after each shift. Fresh coveralls were issued at the begin-
ning of each shift. Shoe covers were available at the exits from the living
quarters and at the port entrance to the combustion room. Disposal cans for
105
image:
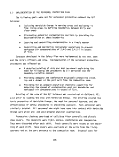 used coveralls and shoe covers were provided in the shower area just inside the
boundary. These cans were emptied daily and their contents burned.
A shower was installed in the combustion room at the port entrance just
off the main deck (Figure 17). Soap, cotton-tipped swabs, powder, and fungi-
cide were available. The water from the shower drained off the ship and into
the ocean. The shower was for use by personnel going off duty from the combus-
tion room or from other contamination sources, such as the pump room or storage
area.
An onboard analytical chemistry capability was discussed in Section 4.2.9.
An extensive sampling and monitoring program was followed. To detect the spread
of contamination or excessive workspace air levels of herbicide, onboard gas
chromatographic analyses of the following types of samples were performed:
t Areas critical with respect to the spread of contamination or
likely to be sources of contamination were wiped with filter
paper discs and then analyzed.
• Workspace air samples were taken by gas sampling syringes and
analyzed.
t Portions of USAF-OEHL benzene impinger train samples were ana-
lyzed after each stack sampling test.
In addition, combustion efficiency was measured daily in order to deter-
mine that the permit requirement of at least 99.9% efficiency was met.
Monitoring activities included continuous workspace air samples (Sec-
tion 3.4.1) and ship's drinking water. These samples were analyzed after
each burn on Johnston Island.
5.3 RESULTS
Descriptions of the sampling techniques and equipment, analytical method-
ology, and results of the analyses used to implement the personnel protection
plan are given in Sections 3 and 4. Analytical results and their implications
with respect to the personnel protection plan are discussed in following
sections.
5.3.1 Wipe Samples
Examination of suspected areas of contamination was carried out by wiping
sections of the deck, walkways, and walls with filter paper. The wipes were
placed in individual screw cap bottles and subjected to gas chromotographic
106
image:
used coveralls and shoe covers were provided in the shower area just inside the
boundary. These cans were emptied daily and their contents burned.
A shower was installed in the combustion room at the port entrance just
off the main deck (Figure 17). Soap, cotton-tipped swabs, powder, and fungi-
cide were available. The water from the shower drained off the ship and into
the ocean. The shower was for use by personnel going off duty from the combus-
tion room or from other contamination sources, such as the pump room or storage
area.
An onboard analytical chemistry capability was discussed in Section 4.2.9.
An extensive sampling and monitoring program was followed. To detect the spread
of contamination or excessive workspace air levels of herbicide, onboard gas
chromatographic analyses of the following types of samples were performed:
t Areas critical with respect to the spread of contamination or
likely to be sources of contamination were wiped with filter
paper discs and then analyzed.
• Workspace air samples were taken by gas sampling syringes and
analyzed.
t Portions of USAF-OEHL benzene impinger train samples were ana-
lyzed after each stack sampling test.
In addition, combustion efficiency was measured daily in order to deter-
mine that the permit requirement of at least 99.9% efficiency was met.
Monitoring activities included continuous workspace air samples (Sec-
tion 3.4.1) and ship's drinking water. These samples were analyzed after
each burn on Johnston Island.
5.3 RESULTS
Descriptions of the sampling techniques and equipment, analytical method-
ology, and results of the analyses used to implement the personnel protection
plan are given in Sections 3 and 4. Analytical results and their implications
with respect to the personnel protection plan are discussed in following
sections.
5.3.1 Wipe Samples
Examination of suspected areas of contamination was carried out by wiping
sections of the deck, walkways, and walls with filter paper. The wipes were
placed in individual screw cap bottles and subjected to gas chromotographic
106
image:
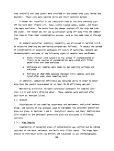 analysis for 2,4-D and 2,4,5-T. Figure 17 shows the location of the wipe samples
on a plan view of the M/T Vulcanus. Results of these analyses, given in detail
in Table 44 (first burn), Table 45 (second burn), and Table 46 (third burn) show
that good segregation of the herbicide was achieved during the first burn and
that the galley and living quarters were free of herbicide.
However, because of minor spills (Section 5.5.2) during tank sampling before
the second burn, the main deck around tank access hatches became contaminated.
The presence of waste in living quarters and entry passageways was immediately
detected by wipe sampling (Table'45). Scrubbing the interior floors and hosing
the passageways reduced herbicide in these areas to below detection limits.
The presence of TCDD-free herbicide was detected in living quarters and
entry passageways during the third burn (Table 46). This contamination was
caused by minor spills of TCDD-free herbicide (Section 5.5.2). The amounts of
2
TCDD-free herbicide found were very low, estimated to be <10 yg/m .
5.3.2 Workspace Air Monitors
Workspace air was monitored in the dining room, combustion room, pump room,
and portable laboratory. These samples were analyzed, and the results are given
in Tables 39 and 40.
Results of the analyses show that concentrations of herbicide in the four
o
areas monitored were low, from 0.06 to 174 yg/m , during all three burns. High-
est concentrations were found in the pump room, a not unexpected situation. In
chemical tankers, this room is the chief source of fumes from the cargo being
3
handled. The permitted concentrations of Herbicide Orange of 2.0 mg/m /16 hours
3
and 10.0 mg/m /8 hours are greater than 1 order of magnitude above the concen-
trations found in the pump room, where personnel exposure was infrequent and of
short duration.
In the combustion room, where the ambient temperatures were 200°F in some
areas, the permitted concentrations of herbicide were greater than 1 order of
magnitude above the measured values. In the living area and portable laboratory,
the permitted concentrations of herbicide were 3 to 4 orders of magnitude above
the measured values. In all areas tested, it is evident that personnel were
adequately protected with a large safety factor from toxic levels of Herbicide
Orange in workspace air.
107
image:
analysis for 2,4-D and 2,4,5-T. Figure 17 shows the location of the wipe samples
on a plan view of the M/T Vulcanus. Results of these analyses, given in detail
in Table 44 (first burn), Table 45 (second burn), and Table 46 (third burn) show
that good segregation of the herbicide was achieved during the first burn and
that the galley and living quarters were free of herbicide.
However, because of minor spills (Section 5.5.2) during tank sampling before
the second burn, the main deck around tank access hatches became contaminated.
The presence of waste in living quarters and entry passageways was immediately
detected by wipe sampling (Table'45). Scrubbing the interior floors and hosing
the passageways reduced herbicide in these areas to below detection limits.
The presence of TCDD-free herbicide was detected in living quarters and
entry passageways during the third burn (Table 46). This contamination was
caused by minor spills of TCDD-free herbicide (Section 5.5.2). The amounts of
2
TCDD-free herbicide found were very low, estimated to be <10 yg/m .
5.3.2 Workspace Air Monitors
Workspace air was monitored in the dining room, combustion room, pump room,
and portable laboratory. These samples were analyzed, and the results are given
in Tables 39 and 40.
Results of the analyses show that concentrations of herbicide in the four
o
areas monitored were low, from 0.06 to 174 yg/m , during all three burns. High-
est concentrations were found in the pump room, a not unexpected situation. In
chemical tankers, this room is the chief source of fumes from the cargo being
3
handled. The permitted concentrations of Herbicide Orange of 2.0 mg/m /16 hours
3
and 10.0 mg/m /8 hours are greater than 1 order of magnitude above the concen-
trations found in the pump room, where personnel exposure was infrequent and of
short duration.
In the combustion room, where the ambient temperatures were 200°F in some
areas, the permitted concentrations of herbicide were greater than 1 order of
magnitude above the measured values. In the living area and portable laboratory,
the permitted concentrations of herbicide were 3 to 4 orders of magnitude above
the measured values. In all areas tested, it is evident that personnel were
adequately protected with a large safety factor from toxic levels of Herbicide
Orange in workspace air.
107
image:
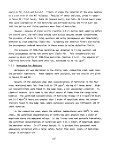 5.3.3 Potable Water Samples
Table 42 presents results of analyses of three samples of the drinking
water used during the three burns. No herbicide could be detected at a detec-
tion limit of less than 0.1 ppb.
5.4 PLUME CHARACTERISTICS AND CONTROL
The Safety Plan (Appendix A) defined a responsibility for maintaining a
speed and heading of the M/T Vulcanus so as to prevent contact of the plume
with the ship.
Experience during the burning of organochlorine wastes by the M/T Vulcanus
in the Gulf of Mexico and during the Herbicide Orange burns off Johnston Island
showed that certain relative wind conditions and ship headings affected the
direction and behavior of the plume and were effective in keeping it off the
ship.
Visual location of the plume during the herbicide incineration was diffi-
cult because it was generally transparent and could only be seen close to the
furnaces as a convection disturbance in the atmosphere. However, the plume was
made visible as desired by the addition of NH- gas at the stack level. HC1 mea-
surements were also used to detect the plume, even though it could not be seen.
A Drager apparatus consisting of an aspirating bellows and a standard color
developing tube was used to identify and locate the plume by its HC1 content.
A series of experiments was performed in order to study and measure the
effect of wind speed, wind direction, ship heading, and propeller rpm on the
plume. The results are summarized in Table 48. They appear to be a useful
basis for plume control during at-sea incinerations.
In these experiments the ship was positioned in a particular attitude
(heading) to the wind, the wind speed measured with an anemometer, and tests
made for HC1 on the downwind part of the ship. HC1 was used as a convenient
tracer for the plume.
When HC1 was noted on the ship, even at the detection limit of 0.1 ppm,
the contemporary conditions of ship heading, wind speed, and propeller rpm were
considered unacceptable. The following observations were made:
i Drifting with the wind at 90 degrees directly abeam showed no
HC1 and thus no plume impingement onboard at wind speeds up
to and including 10 m/s (20 knots). Incineration under these
conditions may, therefore, be permitted.
108
image:
5.3.3 Potable Water Samples
Table 42 presents results of analyses of three samples of the drinking
water used during the three burns. No herbicide could be detected at a detec-
tion limit of less than 0.1 ppb.
5.4 PLUME CHARACTERISTICS AND CONTROL
The Safety Plan (Appendix A) defined a responsibility for maintaining a
speed and heading of the M/T Vulcanus so as to prevent contact of the plume
with the ship.
Experience during the burning of organochlorine wastes by the M/T Vulcanus
in the Gulf of Mexico and during the Herbicide Orange burns off Johnston Island
showed that certain relative wind conditions and ship headings affected the
direction and behavior of the plume and were effective in keeping it off the
ship.
Visual location of the plume during the herbicide incineration was diffi-
cult because it was generally transparent and could only be seen close to the
furnaces as a convection disturbance in the atmosphere. However, the plume was
made visible as desired by the addition of NH- gas at the stack level. HC1 mea-
surements were also used to detect the plume, even though it could not be seen.
A Drager apparatus consisting of an aspirating bellows and a standard color
developing tube was used to identify and locate the plume by its HC1 content.
A series of experiments was performed in order to study and measure the
effect of wind speed, wind direction, ship heading, and propeller rpm on the
plume. The results are summarized in Table 48. They appear to be a useful
basis for plume control during at-sea incinerations.
In these experiments the ship was positioned in a particular attitude
(heading) to the wind, the wind speed measured with an anemometer, and tests
made for HC1 on the downwind part of the ship. HC1 was used as a convenient
tracer for the plume.
When HC1 was noted on the ship, even at the detection limit of 0.1 ppm,
the contemporary conditions of ship heading, wind speed, and propeller rpm were
considered unacceptable. The following observations were made:
i Drifting with the wind at 90 degrees directly abeam showed no
HC1 and thus no plume impingement onboard at wind speeds up
to and including 10 m/s (20 knots). Incineration under these
conditions may, therefore, be permitted.
108
image:
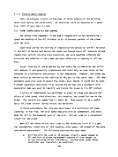 TABLE 48. HYDROGEN CHLORIDE (HC1) IN AIR ONBOARD M/T VULCANUS
Date
inum
7/15/77
7/16/77
7/17/77 '
7/18/77
7/19/77
7/20/77
7/21/77
7/22/77
7/23/77
Time
1600
2000
0800
1000
0800
1600
0940
1600
1020
1020
2030
2040
2400
1000
1010
1400
1410
0800
2200
0800
2000
0800
1800
0800
1800
1810
.1820
1830
1840
1850
1900
Location
Port, Comb Deck
Port, Main Deck
Port, Comb. Deck
Port, Comb. Deck
Port, Comb. Deck
Comb. Rm Fwd
Comb. Rm Rear
Port, Main Deck
Port, Comb. Deck
Port, Main Deck
Comb. Room
Fantall
Fantall
Fantall
Fantall
Fantall
Fantall
Fantall
Port, Main Deck
Port, Main Deck
Port, Comb. Deck
Port, Comb. Deck
Port, Boat Deck
Port, Boat Deck
Port, Comb. Deck
Starboard,
Comb. Deck
Starboard,
Comb. Deck
Fantall
Starboard,
Comb. Deck
Starboard,
Comb. Deck
Starboard,
Comb. Deck
Starboard,
Comb. Deck
Relative
Humidity
%
84
80
88
84
88
84
84
88
80
82
82
84
84
84
82
82
78
78
86
88
86
82
84
84
84
84
84
84
84
84
84
84
Ship
Heading
340°
340°
360°
005°
348°
350°
350°
360°
360°
360°
360°
150°
160°
160°
045°
035°
040°
030°
350°
360°
350°
345°
330°
350°
005°
140°
150°
150°
155°
150°
150°
150°
Wind Dir.
and Speed
080°-8 m/s
060-10 m/s
100°-12 m/s
100-10 m/s
075° -8 m/s
060°-8 m/s
060° -8 m/s
065°- 10 m/s
070-9 m/s
090°-11 to
20 m/s
090-11 to
20 m/s
1050-12 m/s
1050-12 m/s
1000-12 m/s
090°-16 m/s
090°-16 m/s
080°-12 m/s
080-12 m/s
080°-9 m/s
085-9 m/s
075° -8 m/s
055-9 m/s
050°-7 m/s
060-8 m/s
095°-8 ni/s
080-6 m/s
080° -6 m/s
080°-6 m/s
080-6 m/s
080°-6 m/s
080-6 m/s
080°-6 m/s
Temp
OC/OF
27.2/81
26.7/80
26.7/80
26.7/80
26.1/79
26.7/80
26.7/80
26.7/80
27.2/81
28.3/83
28.3/83
26.7/80
26.7/80
26.1/79
27.2/81
27.2/81
27.5/81.5
27.5/81.5
26.7/80
26.7/80
26.7/80
26.9/80.5
26.7/80
26.7/80
26.7/80
26.7/80
26.7/80
26.7/80
26.7/80
26.7/80
26.7/80
26.7/80
Barometer
(mb)
1012.2
1012.2
1012.5
1012.5
1014.5
1013.8
1013.8
1014.8
1013.0
1014.0
1014.0
1014.5
1014.5
1014.5
1014.0
1014.0
1014.0
1014.0
1015.3
1014.9
1015.0
1013.9
1014.5
1013.0
1014.3
1012.4
1012.4
1012.4
1012.4
1012.4
1012.4
1012.4
Cone.
HC1
(ppm)
0
0
2.0
0
0
0
0
0
0
0.5
0.5-
1.0
2.0
0
0
3.0
0
2.0
0
0
0
0
0
0
0
0
10.0
2.0
0
4.0
0
0
0
Notes
Drifting
Drifting
Drifting
Drifting
Drifting
Drifting
Drifting
Drifting
Drifting
Drifting
Drifting
40 RPH*
40 RPM
40 RPM
40 RPM
40 RPM
40 RPM
40 RPM
Drifting
Drifting
Drifting
Drifting
Drifting
Drifting
Drifting
103 RPM
103 RPM
103 RPM
103 RPM
75 RPM
75 RPM
75 RPM
*Sh1p propeller rotational velocity
Differences of from 50 to 90 degrees between the wind direction
and the ship's heading apparently avoided plume contact with
the ship when the propeller speed was held to 40 rpm and when
the wind speed was greater than 20 knots. This condition held
true for either side of the ship. Some degree of maneuverabil-
ity of the ship was thus possible while avoiding plume impingement.
In one limited set of experiments (Table 48), the plume was suc-
cessfully kept off the fantail by a 70-degree wind-heading dif-
ference, at a propeller speed of 103 rpm. However, based on HC1
measurements, the plume appeared to impinge on the usually
unoccupied combustion deck. This situation was not acceptable.
When the propeller speed was reduced to 75 rpm, the plume left
the ship entirely at a heading difference of 70 degrees.
109
image:
TABLE 48. HYDROGEN CHLORIDE (HC1) IN AIR ONBOARD M/T VULCANUS
Date
inum
7/15/77
7/16/77
7/17/77 '
7/18/77
7/19/77
7/20/77
7/21/77
7/22/77
7/23/77
Time
1600
2000
0800
1000
0800
1600
0940
1600
1020
1020
2030
2040
2400
1000
1010
1400
1410
0800
2200
0800
2000
0800
1800
0800
1800
1810
.1820
1830
1840
1850
1900
Location
Port, Comb Deck
Port, Main Deck
Port, Comb. Deck
Port, Comb. Deck
Port, Comb. Deck
Comb. Rm Fwd
Comb. Rm Rear
Port, Main Deck
Port, Comb. Deck
Port, Main Deck
Comb. Room
Fantall
Fantall
Fantall
Fantall
Fantall
Fantall
Fantall
Port, Main Deck
Port, Main Deck
Port, Comb. Deck
Port, Comb. Deck
Port, Boat Deck
Port, Boat Deck
Port, Comb. Deck
Starboard,
Comb. Deck
Starboard,
Comb. Deck
Fantall
Starboard,
Comb. Deck
Starboard,
Comb. Deck
Starboard,
Comb. Deck
Starboard,
Comb. Deck
Relative
Humidity
%
84
80
88
84
88
84
84
88
80
82
82
84
84
84
82
82
78
78
86
88
86
82
84
84
84
84
84
84
84
84
84
84
Ship
Heading
340°
340°
360°
005°
348°
350°
350°
360°
360°
360°
360°
150°
160°
160°
045°
035°
040°
030°
350°
360°
350°
345°
330°
350°
005°
140°
150°
150°
155°
150°
150°
150°
Wind Dir.
and Speed
080°-8 m/s
060-10 m/s
100°-12 m/s
100-10 m/s
075° -8 m/s
060°-8 m/s
060° -8 m/s
065°- 10 m/s
070-9 m/s
090°-11 to
20 m/s
090-11 to
20 m/s
1050-12 m/s
1050-12 m/s
1000-12 m/s
090°-16 m/s
090°-16 m/s
080°-12 m/s
080-12 m/s
080°-9 m/s
085-9 m/s
075° -8 m/s
055-9 m/s
050°-7 m/s
060-8 m/s
095°-8 ni/s
080-6 m/s
080° -6 m/s
080°-6 m/s
080-6 m/s
080°-6 m/s
080-6 m/s
080°-6 m/s
Temp
OC/OF
27.2/81
26.7/80
26.7/80
26.7/80
26.1/79
26.7/80
26.7/80
26.7/80
27.2/81
28.3/83
28.3/83
26.7/80
26.7/80
26.1/79
27.2/81
27.2/81
27.5/81.5
27.5/81.5
26.7/80
26.7/80
26.7/80
26.9/80.5
26.7/80
26.7/80
26.7/80
26.7/80
26.7/80
26.7/80
26.7/80
26.7/80
26.7/80
26.7/80
Barometer
(mb)
1012.2
1012.2
1012.5
1012.5
1014.5
1013.8
1013.8
1014.8
1013.0
1014.0
1014.0
1014.5
1014.5
1014.5
1014.0
1014.0
1014.0
1014.0
1015.3
1014.9
1015.0
1013.9
1014.5
1013.0
1014.3
1012.4
1012.4
1012.4
1012.4
1012.4
1012.4
1012.4
Cone.
HC1
(ppm)
0
0
2.0
0
0
0
0
0
0
0.5
0.5-
1.0
2.0
0
0
3.0
0
2.0
0
0
0
0
0
0
0
0
10.0
2.0
0
4.0
0
0
0
Notes
Drifting
Drifting
Drifting
Drifting
Drifting
Drifting
Drifting
Drifting
Drifting
Drifting
Drifting
40 RPH*
40 RPM
40 RPM
40 RPM
40 RPM
40 RPM
40 RPM
Drifting
Drifting
Drifting
Drifting
Drifting
Drifting
Drifting
103 RPM
103 RPM
103 RPM
103 RPM
75 RPM
75 RPM
75 RPM
*Sh1p propeller rotational velocity
Differences of from 50 to 90 degrees between the wind direction
and the ship's heading apparently avoided plume contact with
the ship when the propeller speed was held to 40 rpm and when
the wind speed was greater than 20 knots. This condition held
true for either side of the ship. Some degree of maneuverabil-
ity of the ship was thus possible while avoiding plume impingement.
In one limited set of experiments (Table 48), the plume was suc-
cessfully kept off the fantail by a 70-degree wind-heading dif-
ference, at a propeller speed of 103 rpm. However, based on HC1
measurements, the plume appeared to impinge on the usually
unoccupied combustion deck. This situation was not acceptable.
When the propeller speed was reduced to 75 rpm, the plume left
the ship entirely at a heading difference of 70 degrees.
109
image:
 Results of these experiments are summarized schematically in Figure 18
which shows ship headings relative to wind direction which avoided plume
impact. For example, with the wind direction off the port side of the ship,
relative headings from 50 to 90 degrees (wind directly abeam) avoided plume
impact. This figure was developed during the first burn and was used for
proper ship orientation during the second and third burns.
5.5 INCIDENTS
5.5.1 Plume Impingements
There were several occasions of plume impingement or eddying of the plume
on the ship. During the first burn, plume impingements resulted from flame
extinguishment by layers of water floating on top of the waste in certain
tanks. During the third burn, there were several occasions when the plume
partially eddied onto the ship because of high wind velocity and somewhat
erratic wind direction.
The first incident occurred at 9:50 a.m. on July 20 during the first burn.
It was caused by a flameout in both incinerators which resulted in the expul-
sion of dense white fumes from the incinerator stacks. The resultant vapors
10"
20°
WIND OFF STARBOARD SIDE
WIND OFF PORT SIDE
30°
50°
60-
RELATIVE HEADINGS WHICH RESULTED IN PLUME IMPACT
70°
CONDITIONS:
• WIND SPEED-20 KT (10 M/S) MAX.
• PROPELLER SPEED - 40 RPM MAX.
MA VULCANU5
Figure 18. Ship headings relative to wind direction
which avoided plume impact on ship.
110
image:
Results of these experiments are summarized schematically in Figure 18
which shows ship headings relative to wind direction which avoided plume
impact. For example, with the wind direction off the port side of the ship,
relative headings from 50 to 90 degrees (wind directly abeam) avoided plume
impact. This figure was developed during the first burn and was used for
proper ship orientation during the second and third burns.
5.5 INCIDENTS
5.5.1 Plume Impingements
There were several occasions of plume impingement or eddying of the plume
on the ship. During the first burn, plume impingements resulted from flame
extinguishment by layers of water floating on top of the waste in certain
tanks. During the third burn, there were several occasions when the plume
partially eddied onto the ship because of high wind velocity and somewhat
erratic wind direction.
The first incident occurred at 9:50 a.m. on July 20 during the first burn.
It was caused by a flameout in both incinerators which resulted in the expul-
sion of dense white fumes from the incinerator stacks. The resultant vapors
10"
20°
WIND OFF STARBOARD SIDE
WIND OFF PORT SIDE
30°
50°
60-
RELATIVE HEADINGS WHICH RESULTED IN PLUME IMPACT
70°
CONDITIONS:
• WIND SPEED-20 KT (10 M/S) MAX.
• PROPELLER SPEED - 40 RPM MAX.
MA VULCANU5
Figure 18. Ship headings relative to wind direction
which avoided plume impact on ship.
110
image:
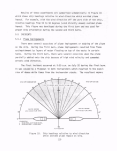 impacted the port side of the ship for approximately 30 to 60 seconds. Because
a porthole was open to the TRW quarters on the port side, the plume could have
entered this living area. Wipe and syringe samples were taken from the TRW
quarters and on the port side of the ship to determine the extent of contami-
nation from the white plume. The syringe sample taken from the TRW quarters
was negative for Herbicide Orange. Wipe samples were taken from the porthole
sill and on areas just below and to either side of the porthole (the face of
the refrigerator and the headboard of a bunk). The wipe taken from the port-
hole sill showed the presence of herbicide; all other areas tested negative.
Decontamination was initiated by using high pressure saltwater to hose down
the port companionway. The porthole sill in the TRW quarters was wiped with
acetone and water. After decontamination, a wipe sample taken from the port-
hole sill showed no evidence of herbicide.
The second incident occurred at 4:20 a.m. on 21 July. A TRW team member
was awakened by the odor of Herbicide Orange in the TRW quarters on the port
side. The odor was immediately eliminated by opening the door to the galley
which resulted in cross ventilation starboard to port. This incident was very
brief and it is not clear whether it was caused by a momentary flameout or
from the pump room vent.
A third incident occurred at 7:22 a.m. on 21 July as the result of a flame-
out. An oil-like fog was ejected from both stacks. The plume impinged on the
port side of the ship and lasted about 15 to 20 seconds before a tank switch-
over was made by the ship's crew. The cause was traced to an aqueous layer
floating on the top of the Herbicide Orange. Because of this incident, it was
requested that the ship's officer put the ship underway just prior to emptying
a tank. Wipe samples were taken, and the ship's crew repeated the hose-down of
all affected areas on the port side. Samples that were taken proved to be neg-
ative, and a complete decontamination of the living area was not initiated.
The final flameout occurred at 2:55 a.m. on 23 July. This flameout was
of very short duration (perhaps 5 seconds) and did not leave any measurable
contamination on the ship.
All personnel onboard the Vulcanus were referred to the dispensary on
Johnston Island at the end of the first burn. No effects were found.
Ill
image:
impacted the port side of the ship for approximately 30 to 60 seconds. Because
a porthole was open to the TRW quarters on the port side, the plume could have
entered this living area. Wipe and syringe samples were taken from the TRW
quarters and on the port side of the ship to determine the extent of contami-
nation from the white plume. The syringe sample taken from the TRW quarters
was negative for Herbicide Orange. Wipe samples were taken from the porthole
sill and on areas just below and to either side of the porthole (the face of
the refrigerator and the headboard of a bunk). The wipe taken from the port-
hole sill showed the presence of herbicide; all other areas tested negative.
Decontamination was initiated by using high pressure saltwater to hose down
the port companionway. The porthole sill in the TRW quarters was wiped with
acetone and water. After decontamination, a wipe sample taken from the port-
hole sill showed no evidence of herbicide.
The second incident occurred at 4:20 a.m. on 21 July. A TRW team member
was awakened by the odor of Herbicide Orange in the TRW quarters on the port
side. The odor was immediately eliminated by opening the door to the galley
which resulted in cross ventilation starboard to port. This incident was very
brief and it is not clear whether it was caused by a momentary flameout or
from the pump room vent.
A third incident occurred at 7:22 a.m. on 21 July as the result of a flame-
out. An oil-like fog was ejected from both stacks. The plume impinged on the
port side of the ship and lasted about 15 to 20 seconds before a tank switch-
over was made by the ship's crew. The cause was traced to an aqueous layer
floating on the top of the Herbicide Orange. Because of this incident, it was
requested that the ship's officer put the ship underway just prior to emptying
a tank. Wipe samples were taken, and the ship's crew repeated the hose-down of
all affected areas on the port side. Samples that were taken proved to be neg-
ative, and a complete decontamination of the living area was not initiated.
The final flameout occurred at 2:55 a.m. on 23 July. This flameout was
of very short duration (perhaps 5 seconds) and did not leave any measurable
contamination on the ship.
All personnel onboard the Vulcanus were referred to the dispensary on
Johnston Island at the end of the first burn. No effects were found.
Ill
image:
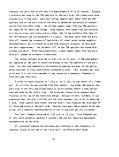 During the debriefing on Johnston Island after the first burn, the problem
of flameouts was discussed. Water layers that had caused the problem were anal-
yzed and found to be 99% water, about 1% sodium salts of 2,4-D and 2,4,5-T, and
about 80 ppm arsenic. All of this material remaining in the ship's tanks was
consolidated into Tank 6P. A procedure for flashing (evaporating) this material
during the second burn was developed and a stack gas sampling test was planned.
The procedure was:
• The test was to be performed on the starboard incinerator. The
burner nearest the wall thermocouples was to be shut off.
• Herbicide would be fed through the remaining two burners at a
rate consistent with optimum incinerator performance. The flame
temperature had to exceed the permit minimum of 1250°C.
t The water was to be fed into the third (off) burner, starting
with a minimum feed rate.
t The following 'parameters were to be checked before increasing
the water feed rate: flame temperature, wall thermocouple
temperature, on-line instrumentation data, and appearance of
the stack effluent.
In addition to the flashing procedure, a procedure to reduce the impact of
flameouts was developed during the debriefing. This procedure was in effect
during the second and third burns and called for:
t When nearing depletion of a tank, switch two of the three
burners in each incinerator to a full tank, leaving one burner
in each incinerator to complete emptying the first tank.
• Put the ship under power at a proper orientation to the wind
direction (Figure 18).
There were no plume impingements during the second burn. During the third
burn, there were several partial plume impingements when the plume eddied back
onto the ship. These impingements were of short duration (10 to 30 seconds)
and were caused by stormy weather during most of the burn. There was minimal
personnel exposure, and post-program physical exams showed no effects.
5.5.2 Spills
There were several minor spills of herbicide during onboard operations.
They were documented as they occurred. Figure 19 is a schematic of the Vul-
canus1 main deck showing cargo tank layout, tank hatches, and spill locations.
112
image:
During the debriefing on Johnston Island after the first burn, the problem
of flameouts was discussed. Water layers that had caused the problem were anal-
yzed and found to be 99% water, about 1% sodium salts of 2,4-D and 2,4,5-T, and
about 80 ppm arsenic. All of this material remaining in the ship's tanks was
consolidated into Tank 6P. A procedure for flashing (evaporating) this material
during the second burn was developed and a stack gas sampling test was planned.
The procedure was:
• The test was to be performed on the starboard incinerator. The
burner nearest the wall thermocouples was to be shut off.
• Herbicide would be fed through the remaining two burners at a
rate consistent with optimum incinerator performance. The flame
temperature had to exceed the permit minimum of 1250°C.
t The water was to be fed into the third (off) burner, starting
with a minimum feed rate.
t The following 'parameters were to be checked before increasing
the water feed rate: flame temperature, wall thermocouple
temperature, on-line instrumentation data, and appearance of
the stack effluent.
In addition to the flashing procedure, a procedure to reduce the impact of
flameouts was developed during the debriefing. This procedure was in effect
during the second and third burns and called for:
t When nearing depletion of a tank, switch two of the three
burners in each incinerator to a full tank, leaving one burner
in each incinerator to complete emptying the first tank.
• Put the ship under power at a proper orientation to the wind
direction (Figure 18).
There were no plume impingements during the second burn. During the third
burn, there were several partial plume impingements when the plume eddied back
onto the ship. These impingements were of short duration (10 to 30 seconds)
and were caused by stormy weather during most of the burn. There was minimal
personnel exposure, and post-program physical exams showed no effects.
5.5.2 Spills
There were several minor spills of herbicide during onboard operations.
They were documented as they occurred. Figure 19 is a schematic of the Vul-
canus1 main deck showing cargo tank layout, tank hatches, and spill locations.
112
image:
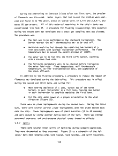 - SPILL No. 1
- SPILL No. 2
4P
3P
O
I
,-i.
2P
O
3C
2C
LJ
1C
n
4S
\
SPILL No. 3
\-WINGTANKHATCH
BUTTERWORTH HATCH, CENTER TANKS
Figure 19. Schematic of Vulcanus1 main deck
showing spill locations.
Solid lines in Figure 19 indicate above-deck-level platforms over the center
tanks. The dashed lines indicate that the port and starboard wing tanks do not
have these platforms.
No spills were observed during the first burn. At the time of sailing
(13 July) what appeared to be a spill was noted on the main deck by the hatch
cover of either Tank 4P or 5P. The area was sampled, cleaned, and resampled.
Neither wipe sample showed the presence of herbicide.
After loading and before sailing for the second burn, samples of waste
from the top, middle, and bottom of each tank were taken. A liter bottle was
placed in a wire cage from which lead fishing weights were hung. A cord was
attached to the neck of the bottle so it could be lowered into and raised from
the tanks. A plug was inserted into the neck of the bottle. A cord was
attached to the plug so the plug could be pulled when the bottle was in the
correct position. After a sample was taken, the bottle and plug were removed
from the tank. The cords were coiled on the deck around each hatch cover. The
cords were saturated with Herbicide Orange. Therefore, the area around each
113
image:
- SPILL No. 1
- SPILL No. 2
4P
3P
O
I
,-i.
2P
O
3C
2C
LJ
1C
n
4S
\
SPILL No. 3
\-WINGTANKHATCH
BUTTERWORTH HATCH, CENTER TANKS
Figure 19. Schematic of Vulcanus1 main deck
showing spill locations.
Solid lines in Figure 19 indicate above-deck-level platforms over the center
tanks. The dashed lines indicate that the port and starboard wing tanks do not
have these platforms.
No spills were observed during the first burn. At the time of sailing
(13 July) what appeared to be a spill was noted on the main deck by the hatch
cover of either Tank 4P or 5P. The area was sampled, cleaned, and resampled.
Neither wipe sample showed the presence of herbicide.
After loading and before sailing for the second burn, samples of waste
from the top, middle, and bottom of each tank were taken. A liter bottle was
placed in a wire cage from which lead fishing weights were hung. A cord was
attached to the neck of the bottle so it could be lowered into and raised from
the tanks. A plug was inserted into the neck of the bottle. A cord was
attached to the plug so the plug could be pulled when the bottle was in the
correct position. After a sample was taken, the bottle and plug were removed
from the tank. The cords were coiled on the deck around each hatch cover. The
cords were saturated with Herbicide Orange. Therefore, the area around each
113
image:
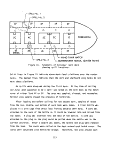 hatch was subjected to a spill, The amount involved in these spills is esti-
mated at 10 to 20 ml per spill,
A full, liter sample bottle was knocked off the port Butterworth hatch of
2
Tank 4C. It broke on the deck, and the spill covered an area of perhaps 0.5 m.
The spill was immediately covered with absorbant, which was later gathered,
bagged, and burned. The location is indicated in Figure 19 as Spill 1.
The amount of herbicide spilled during the tank sampling was small. How-
ever, the first set of wipe samples analyzed after sailing showed traces of
herbicide in the port and starboard companionways, the floor outside the dining
room, and the floor of the dining room. Intensive cleaning activities were
initiated, and herbicide in these areas was reduced below detectable levels.
It is possible that the pump room was the source of some part of the herbicide
found in living areas of the ship. During the loading operations, there was
considerable traffic into and out of the pump room. If the usual at-sea pre-
cautions (coveralls and boot covers or separate pairs of shoes) were not
observed during loading, then herbicide could have been carried out of the pump
room and into other areas of the ship.
The same tank sampling activity was required prior to sailing for the third
burn. Precautions to eliminate or reduce spills caused by tank sampling were
taken. The U.S. EPA observer indicated there were no spills from this tank
sampling.
TCDD-free herbicide (herbicide with a TCDD content below detection limits,
0.02 ppm) was stored in Tank 2C, the largest tank. During the third burn, each
tank, after having been drained of waste herbicide, was rinsed by filling with
TCDD-free herbicide. The waste tanks were rinsed serially. This procedure was
intended to reduce residual waste herbicide by dilution with TCDD-free herbicide.
The waste containing tanks were drained to dryness (observed by TRW and/or
U.S. Air Force personnel) before rinsing.
During loading the ship with waste, the venting system was capable of
equalizing pressure sufficiently rapidly so that hatch covers were dogged down
tightly. During incineration, however, hatch covers had to be partially open,
as the tank venting system apparently could not equalize pressure rapidly
enough. Similarly, tank access hatches had to be open during tank rinsing
operations.
114
image:
hatch was subjected to a spill, The amount involved in these spills is esti-
mated at 10 to 20 ml per spill,
A full, liter sample bottle was knocked off the port Butterworth hatch of
2
Tank 4C. It broke on the deck, and the spill covered an area of perhaps 0.5 m.
The spill was immediately covered with absorbant, which was later gathered,
bagged, and burned. The location is indicated in Figure 19 as Spill 1.
The amount of herbicide spilled during the tank sampling was small. How-
ever, the first set of wipe samples analyzed after sailing showed traces of
herbicide in the port and starboard companionways, the floor outside the dining
room, and the floor of the dining room. Intensive cleaning activities were
initiated, and herbicide in these areas was reduced below detectable levels.
It is possible that the pump room was the source of some part of the herbicide
found in living areas of the ship. During the loading operations, there was
considerable traffic into and out of the pump room. If the usual at-sea pre-
cautions (coveralls and boot covers or separate pairs of shoes) were not
observed during loading, then herbicide could have been carried out of the pump
room and into other areas of the ship.
The same tank sampling activity was required prior to sailing for the third
burn. Precautions to eliminate or reduce spills caused by tank sampling were
taken. The U.S. EPA observer indicated there were no spills from this tank
sampling.
TCDD-free herbicide (herbicide with a TCDD content below detection limits,
0.02 ppm) was stored in Tank 2C, the largest tank. During the third burn, each
tank, after having been drained of waste herbicide, was rinsed by filling with
TCDD-free herbicide. The waste tanks were rinsed serially. This procedure was
intended to reduce residual waste herbicide by dilution with TCDD-free herbicide.
The waste containing tanks were drained to dryness (observed by TRW and/or
U.S. Air Force personnel) before rinsing.
During loading the ship with waste, the venting system was capable of
equalizing pressure sufficiently rapidly so that hatch covers were dogged down
tightly. During incineration, however, hatch covers had to be partially open,
as the tank venting system apparently could not equalize pressure rapidly
enough. Similarly, tank access hatches had to be open during tank rinsing
operations.
114
image:
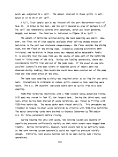 During the third burn, there was another spill of herbicide, indicated as
Spill 2 on Figure 19. At this time, the bow of the ship was riding high because
several forward tanks were empty. The ship also had been given a steep list to
port to help drain the tank which was then being emptied. The best recollection
is that the spill came from Tank 4C which was filled with TCDD-free herbicide.
The Butterworth hatch was open, and several sharp rolls spilled on the order of
10 to 20 liters of rinsate onto the deck. Because of the bow-high and port-list
attitude of the ship, the spilled rinsate ran toward the rear of the ship, stop-
ping at the entry to the port companionway. Shortly after the spill, the deck
was washed with seawater. Wipe samples taken after the spill showed traces of
herbicide (rinsate) in the designated clean areas of the ship. The living
quarters and the port and starboard companionways were cleaned and resampled.
A much smaller spill of TCDD-free herbicide rinsate occurred from the hatch
of Tank 5S. There was a slight list to starboard at the time. The tank was
overfilled for the rolling conditions. Perhaps 0.5 to 1 liter of rinsate spilled
onto the deck before filling could be stopped. The spill was flushed into the
sea. This spill is indicated as Spill 3 in Figure 19.
Because every tank was filled with TCDD-free herbicide during the third
burn, it is likely that the main deck around all hatch covers was contaminated.
The rolling of the ship (the weather was bad and the seas were high) caused the
tank contents to slosh vigorously. It is expected that small amounts of TCDD-
free herbicide rinsate spray could have escaped from tanks as they became nearly
full.
During all three burns, the waste tanks were gauged manually with a coiled
steel tape. Drips of herbicide occurred despite the use of a rag to wipe the
tape as it was removed from a tank.
The main deck thus appears to have been the source of contamination which
was spread into other areas of the ship (see wipe sample results for 2 August
and 29 August in Tables 46 and 47, respectively). The corrective action taken
after herbicide appeared in the living quarters was effective.
115
image:
During the third burn, there was another spill of herbicide, indicated as
Spill 2 on Figure 19. At this time, the bow of the ship was riding high because
several forward tanks were empty. The ship also had been given a steep list to
port to help drain the tank which was then being emptied. The best recollection
is that the spill came from Tank 4C which was filled with TCDD-free herbicide.
The Butterworth hatch was open, and several sharp rolls spilled on the order of
10 to 20 liters of rinsate onto the deck. Because of the bow-high and port-list
attitude of the ship, the spilled rinsate ran toward the rear of the ship, stop-
ping at the entry to the port companionway. Shortly after the spill, the deck
was washed with seawater. Wipe samples taken after the spill showed traces of
herbicide (rinsate) in the designated clean areas of the ship. The living
quarters and the port and starboard companionways were cleaned and resampled.
A much smaller spill of TCDD-free herbicide rinsate occurred from the hatch
of Tank 5S. There was a slight list to starboard at the time. The tank was
overfilled for the rolling conditions. Perhaps 0.5 to 1 liter of rinsate spilled
onto the deck before filling could be stopped. The spill was flushed into the
sea. This spill is indicated as Spill 3 in Figure 19.
Because every tank was filled with TCDD-free herbicide during the third
burn, it is likely that the main deck around all hatch covers was contaminated.
The rolling of the ship (the weather was bad and the seas were high) caused the
tank contents to slosh vigorously. It is expected that small amounts of TCDD-
free herbicide rinsate spray could have escaped from tanks as they became nearly
full.
During all three burns, the waste tanks were gauged manually with a coiled
steel tape. Drips of herbicide occurred despite the use of a rag to wipe the
tape as it was removed from a tank.
The main deck thus appears to have been the source of contamination which
was spread into other areas of the ship (see wipe sample results for 2 August
and 29 August in Tables 46 and 47, respectively). The corrective action taken
after herbicide appeared in the living quarters was effective.
115
image:
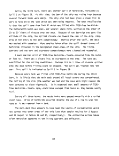 5.6 SUMMARY OF SHIP CLEANLINESS MAINTENANCE
During the three burns of Herbicide Orange onboard the M/T Vulcanus, the
following observations were made:
• Effective protection of operating and technical personnel from
Herbicide Orange exposure was achieved by isolating the mate-
rial from living areas and restricting it to operating areas.
Minor amounts of herbicide were detected in the living area
which was then readily decontaminated.
• There were no major exposures of personnel to Herbicide Orange
during the three incinerations.
• There were no large spills nor leaks.
• ' The walkways along the port and starboard main deck passageways
showed some contamination, which was easily hosed away.
• The principal source of contamination was the main deck about
the waste tank access hatches. As discussed in Section 5.5.2,
there were minor herbicide spills during tank sampling before
the second and third burns. Herbicide from these spills
apparently migrated into the living areas because of uncon-
trolled personnel movement.
t The disposable fiber coveralls and shoe covers appeared to be
effective. Disposal of these by burning in the furnace was
easily accomplished.
• The combustion room remained at a low level of contamination,
indicating excellent housekeeping and high quality engineer-
ing practice.
• The pump room was a source of Herbicide Orange vapors.
• The flameouts were a source of contamination, since vaporized
Herbicide Orange, left the stacks at a lower velocity and did
not behave as a normal plume because of its density and lower
temperature. Methods of controlling these flameouts were sug-
gested (Section 5.5.1) and put into operation successfully.
116
image:
5.6 SUMMARY OF SHIP CLEANLINESS MAINTENANCE
During the three burns of Herbicide Orange onboard the M/T Vulcanus, the
following observations were made:
• Effective protection of operating and technical personnel from
Herbicide Orange exposure was achieved by isolating the mate-
rial from living areas and restricting it to operating areas.
Minor amounts of herbicide were detected in the living area
which was then readily decontaminated.
• There were no major exposures of personnel to Herbicide Orange
during the three incinerations.
• There were no large spills nor leaks.
• ' The walkways along the port and starboard main deck passageways
showed some contamination, which was easily hosed away.
• The principal source of contamination was the main deck about
the waste tank access hatches. As discussed in Section 5.5.2,
there were minor herbicide spills during tank sampling before
the second and third burns. Herbicide from these spills
apparently migrated into the living areas because of uncon-
trolled personnel movement.
t The disposable fiber coveralls and shoe covers appeared to be
effective. Disposal of these by burning in the furnace was
easily accomplished.
• The combustion room remained at a low level of contamination,
indicating excellent housekeeping and high quality engineer-
ing practice.
• The pump room was a source of Herbicide Orange vapors.
• The flameouts were a source of contamination, since vaporized
Herbicide Orange, left the stacks at a lower velocity and did
not behave as a normal plume because of its density and lower
temperature. Methods of controlling these flameouts were sug-
gested (Section 5.5.1) and put into operation successfully.
116
image:
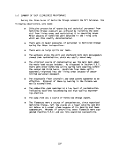 6. WASTE DESTRUCTION EFFICIENCIES AND EMISSIONS ASSESSMENT
6.1 WASTE DESTRUCTION EFFICIENCIES
Results of analyses for 2,4-D and 2,4,5-T in the Lear-Siegler train samples
are given in Table 30. Results of analyses by BCL for 2,4-D and 2,4,5-T in the
benzene impinger train samples are given in Table 41. WSU analysis results for
TCDD in the benzene impinger train samples are given in Table 38. These analy-
3
tical results are expressed in terms of emission concentrations, e.g., yg/m .
The usual engineering method of calculating destruction efficiencies is in
terms of rates,
nr - inn Y rate fed - rate emitted
ut " 1UU x rate fed
Instead of recalculating analytically determined emission concentrations as
emission rates, herbicide feed rates were converted to emission concentrations
for destruction efficiency calculations. Converting herbicide (or TCDD) feed
rates to emission concentrations was .done by (1) calculating combustion efflu-
ent flow rates from combustion stoichiometry, on-line monitoring data, and her-
bicide (or TCDD) feed rates as illustrated in Appendix F.2 and (2) dividing
herbicide (or TCDD) feed rates by combustion effluent flow rates as illustrated
in Appendix F.8. These values for maximum herbicide (or TCDD) emission concen-
trations are termed emission concentrations at 0% destruction efficiency.
Table 49 gives maximum emission concentrations at 0% destruction efficiency
for 2,4-D + 2,4,5-T and TCDD, waste feed rates, and combustion effluent flow
rates. A sample calculation is given in Appendix F-10. Destruction efficiencies
were calculated from:
C - C
DE = 100 x
Co
117
image:
6. WASTE DESTRUCTION EFFICIENCIES AND EMISSIONS ASSESSMENT
6.1 WASTE DESTRUCTION EFFICIENCIES
Results of analyses for 2,4-D and 2,4,5-T in the Lear-Siegler train samples
are given in Table 30. Results of analyses by BCL for 2,4-D and 2,4,5-T in the
benzene impinger train samples are given in Table 41. WSU analysis results for
TCDD in the benzene impinger train samples are given in Table 38. These analy-
3
tical results are expressed in terms of emission concentrations, e.g., yg/m .
The usual engineering method of calculating destruction efficiencies is in
terms of rates,
nr - inn Y rate fed - rate emitted
ut " 1UU x rate fed
Instead of recalculating analytically determined emission concentrations as
emission rates, herbicide feed rates were converted to emission concentrations
for destruction efficiency calculations. Converting herbicide (or TCDD) feed
rates to emission concentrations was .done by (1) calculating combustion efflu-
ent flow rates from combustion stoichiometry, on-line monitoring data, and her-
bicide (or TCDD) feed rates as illustrated in Appendix F.2 and (2) dividing
herbicide (or TCDD) feed rates by combustion effluent flow rates as illustrated
in Appendix F.8. These values for maximum herbicide (or TCDD) emission concen-
trations are termed emission concentrations at 0% destruction efficiency.
Table 49 gives maximum emission concentrations at 0% destruction efficiency
for 2,4-D + 2,4,5-T and TCDD, waste feed rates, and combustion effluent flow
rates. A sample calculation is given in Appendix F-10. Destruction efficiencies
were calculated from:
C - C
DE = 100 x
Co
117
image:
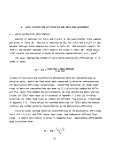 TABLE 49. EMISSION CONCENTRATIONS OF 2,4-D + 2,4,5-T AND TCDD
AT 0% DESTRUCTION EFFICIENCY*
CD
Emission Concentration at 0% DE
Burn
1
1
1
1
1
1
2
2
3
Date
7/14/77
7/15/77
7/16/77
7/18/77
7/19/77
7/23/77
8/08/77
8/13/77
8/28/77
Waste Feed,
Metric Tons/hrT
6.05
6.05
7.03
7.46
6.95
7.28
6,85
7.17
5.83*
Combustion Effluent
Flow Rate, m-Yhr
52,200
50,970
60,900
62,000
60,600
61,400
56,900
69,800
51,900
2,4-D + 2,4
g/m3
Fuel Oil
119
115
120
115
119
121
103
112
,5-T TCDD
yg/m3
Background Test
±
2.47
t
t
t
283
86.3
284
* o
Sample calculation in Appendix F.8. See Appendix F.12 for conversion of yg/m to ppb.
* Metric tons per hour per incinerator,
* These samples were not analyzed.
image:
TABLE 49. EMISSION CONCENTRATIONS OF 2,4-D + 2,4,5-T AND TCDD
AT 0% DESTRUCTION EFFICIENCY*
CD
Emission Concentration at 0% DE
Burn
1
1
1
1
1
1
2
2
3
Date
7/14/77
7/15/77
7/16/77
7/18/77
7/19/77
7/23/77
8/08/77
8/13/77
8/28/77
Waste Feed,
Metric Tons/hrT
6.05
6.05
7.03
7.46
6.95
7.28
6,85
7.17
5.83*
Combustion Effluent
Flow Rate, m-Yhr
52,200
50,970
60,900
62,000
60,600
61,400
56,900
69,800
51,900
2,4-D + 2,4
g/m3
Fuel Oil
119
115
120
115
119
121
103
112
,5-T TCDD
yg/m3
Background Test
±
2.47
t
t
t
283
86.3
284
* o
Sample calculation in Appendix F.8. See Appendix F.12 for conversion of yg/m to ppb.
* Metric tons per hour per incinerator,
* These samples were not analyzed.
image:
 where
C = emission concentration of 0% destruction efficiency
Cp = emission concentration determined from analyses
Table 50 presents destruction efficiencies for TCDD calculated from the
WSU analyses. Because TCDD was not detected in most of the samples, the
destruction efficiencies in Table 50 are, in fact, greater than the table
entries as indicated by the ">" character. It should be noted that the
entries for the tests of 8 and 13 August indicate that TCDD destruction effi-
ciencies were greater than 99.87% and 99.89%, respectively. Section 4.2.5
presented a discussion of the severe chemical interferences in the analyses
of these samples. These interferences prevented attaining minimum detectable
concentrations sufficiently low so that calculated destruction efficiencies
would exceed 99.9%. For example, if the minimum detectable concentration of
TCDD in the benzene impinger sample of 8 August had been <0.017 ng/ml rather
than <0.034 ng/ml, then the calculated destruction efficiency would have been
>99.9%.
Tables 51 and 52 present, respectively, destruction efficiencies for
2,4-D plus 2,4,5-T calculated from TRW and BCL analyses of combustion efflu-
ent samples. All calculated destruction efficiencies are greater than 99.999%,
indicative of incineration well in excess of permit requirements. It is
noteworthy that the TRW and BCL results for 2,4-D and 2,4,5-T were on samples
from different sampling trains using different analytical procedures as dis-
cussed in Sections 4.2.2 and 4.2.6, respectively. These high destruction effi-
ciencies for 2,4-D and 2,4,5-T give confidence that the destruction efficiency
for TCDD was in excess of permit requirements.
Because of the possibility that chlorinated constituents of the waste
could be degraded into and emitted as simpler organochlorine compounds, results
of the GC/MS analyses (Table 30) of the Lear-Siegler train samples were exam-
ined for organochlorine compounds. Concentrations of these compounds were
summed, and destruction efficiencies were calculated. Table 53 presents emis-
sion concentrations and destruction efficiencies of organochlorine compounds
found in the Lear-Siegler train samples. It was assumed that the waste was
totally composed of organochlorine compounds. It can be seen that the
119
image:
where
C = emission concentration of 0% destruction efficiency
Cp = emission concentration determined from analyses
Table 50 presents destruction efficiencies for TCDD calculated from the
WSU analyses. Because TCDD was not detected in most of the samples, the
destruction efficiencies in Table 50 are, in fact, greater than the table
entries as indicated by the ">" character. It should be noted that the
entries for the tests of 8 and 13 August indicate that TCDD destruction effi-
ciencies were greater than 99.87% and 99.89%, respectively. Section 4.2.5
presented a discussion of the severe chemical interferences in the analyses
of these samples. These interferences prevented attaining minimum detectable
concentrations sufficiently low so that calculated destruction efficiencies
would exceed 99.9%. For example, if the minimum detectable concentration of
TCDD in the benzene impinger sample of 8 August had been <0.017 ng/ml rather
than <0.034 ng/ml, then the calculated destruction efficiency would have been
>99.9%.
Tables 51 and 52 present, respectively, destruction efficiencies for
2,4-D plus 2,4,5-T calculated from TRW and BCL analyses of combustion efflu-
ent samples. All calculated destruction efficiencies are greater than 99.999%,
indicative of incineration well in excess of permit requirements. It is
noteworthy that the TRW and BCL results for 2,4-D and 2,4,5-T were on samples
from different sampling trains using different analytical procedures as dis-
cussed in Sections 4.2.2 and 4.2.6, respectively. These high destruction effi-
ciencies for 2,4-D and 2,4,5-T give confidence that the destruction efficiency
for TCDD was in excess of permit requirements.
Because of the possibility that chlorinated constituents of the waste
could be degraded into and emitted as simpler organochlorine compounds, results
of the GC/MS analyses (Table 30) of the Lear-Siegler train samples were exam-
ined for organochlorine compounds. Concentrations of these compounds were
summed, and destruction efficiencies were calculated. Table 53 presents emis-
sion concentrations and destruction efficiencies of organochlorine compounds
found in the Lear-Siegler train samples. It was assumed that the waste was
totally composed of organochlorine compounds. It can be seen that the
119
image:
 TABLE 50. DESTRUCTION EFFICIENCIES FOR TCDD FROM WSU ANALYSES
Sample
HO-1-CF-714-F (feed)
HO-1-BI-714-F
HO-1-LR-714-F
HO-1-PR-717-F/H
Total TCDD
HO-1-CF-716-H (feed)
HO-1-8I-716-H
HO-1-LR-716-H
HO-1-PR-717-F/H
Total TCDD
HO-Z-CF-808-H (feed)
HO-2-BI-808-H
HO-2-LR-808-H
HO-2-PR-808-H
Total TCDD
HO-2-CF-813-H (feed)
HO-2-BI-813-H
HO-2-LR-813-H
HO-2-PR-813-H
Total TCDD
HO-3-CF-828-H (feed)
HO-3-BI-828-H
HO-3-LR-828-H
HO-3-PR-828-H
Total TCDD
Sample Gas
Volume Volume
mi m3t
725 0.1129
60.4
2.2
725 0.1179
42.5
2.3
600 0.1 9G2
57.4
10.7
600 0.3249
37.9
14.6
570 0.2266
48.9
12.6
TCOD
Concentration
ng/ml*
Fuel
2.5 x 10³
< 0.00094
<0.045
< 0.086
2.8xlO+3
<0.034
0.136
3.34
l.OxlO*3
<0.047
<0.11
<0.30
2.8xlO*3
<0.040
<0.012
<0.048
TCDD Emission
Concentration
ng/m3
011 Background Test
<5.8
<16
<1.7
<24
<102
39.8
182
<324
<86.1
<12.6
<13.5
<112
<101
< 2.7
< 2.7
<106
Destruction
Efficiency
%
>99.99
>99.89
>99.87
>99.96
Sample calculation in Appendix F;9. See Appendix F.12 for conversion of ng/m3 to ppt.
TVolume of stack gas sampled at 20°C and 1013.2 mbar.
* Concentration of TCDD 1n sample. A less than ("<") indicates TCDD was not detected. The values are
minimum detectable quantities.
destruction efficiency of the waste in terms of organochlorine compounds
emitted was greater than 99.999%.
6.2 EMISSIONS ASSESSMENT
Emissions of volatile hydrocarbons were estimated from the C7-C16 GC anal-
ysis of the Lear-Siegler train samples, while the GC/MS analyses of these sam-
ples showed the presence of phthalate esters and/or silicones. These compounds
were present in negligible amounts. Despite the uncertainties in the analyti-
cal data, the C7-C16 GC analytical results can be used with some degree of con-
fidence to give estimates of the emissions of volatile hydrocarbons during the
120
image:
TABLE 50. DESTRUCTION EFFICIENCIES FOR TCDD FROM WSU ANALYSES
Sample
HO-1-CF-714-F (feed)
HO-1-BI-714-F
HO-1-LR-714-F
HO-1-PR-717-F/H
Total TCDD
HO-1-CF-716-H (feed)
HO-1-8I-716-H
HO-1-LR-716-H
HO-1-PR-717-F/H
Total TCDD
HO-Z-CF-808-H (feed)
HO-2-BI-808-H
HO-2-LR-808-H
HO-2-PR-808-H
Total TCDD
HO-2-CF-813-H (feed)
HO-2-BI-813-H
HO-2-LR-813-H
HO-2-PR-813-H
Total TCDD
HO-3-CF-828-H (feed)
HO-3-BI-828-H
HO-3-LR-828-H
HO-3-PR-828-H
Total TCDD
Sample Gas
Volume Volume
mi m3t
725 0.1129
60.4
2.2
725 0.1179
42.5
2.3
600 0.1 9G2
57.4
10.7
600 0.3249
37.9
14.6
570 0.2266
48.9
12.6
TCOD
Concentration
ng/ml*
Fuel
2.5 x 10³
< 0.00094
<0.045
< 0.086
2.8xlO+3
<0.034
0.136
3.34
l.OxlO*3
<0.047
<0.11
<0.30
2.8xlO*3
<0.040
<0.012
<0.048
TCDD Emission
Concentration
ng/m3
011 Background Test
<5.8
<16
<1.7
<24
<102
39.8
182
<324
<86.1
<12.6
<13.5
<112
<101
< 2.7
< 2.7
<106
Destruction
Efficiency
%
>99.99
>99.89
>99.87
>99.96
Sample calculation in Appendix F;9. See Appendix F.12 for conversion of ng/m3 to ppt.
TVolume of stack gas sampled at 20°C and 1013.2 mbar.
* Concentration of TCDD 1n sample. A less than ("<") indicates TCDD was not detected. The values are
minimum detectable quantities.
destruction efficiency of the waste in terms of organochlorine compounds
emitted was greater than 99.999%.
6.2 EMISSIONS ASSESSMENT
Emissions of volatile hydrocarbons were estimated from the C7-C16 GC anal-
ysis of the Lear-Siegler train samples, while the GC/MS analyses of these sam-
ples showed the presence of phthalate esters and/or silicones. These compounds
were present in negligible amounts. Despite the uncertainties in the analyti-
cal data, the C7-C16 GC analytical results can be used with some degree of con-
fidence to give estimates of the emissions of volatile hydrocarbons during the
120
image:
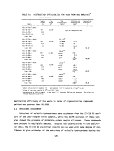 TABLE 51. DESTRUCTION EFFICIENCIES FOR 2,4-D AND 2,4,5-T FROM LEAR-SIEGLER TRAIN ANALYSES*
ro
Sample
Volume
Sample mi
HO-1-ST-714-F
HO-1-LR-714-F 2098
HQ-1-PR-717-F/H 75
Total
HO-1-ST-716-H
HO-1-LR-716-H 2191
HO-1-PR-717-F/H 116
Total
HO-2-ST-813-H
HO-2-LR-813-H 1031
HO-2-PR-813-H 398
Total
HO-3-ST-828-H
HO-3-LR-828-H 1485
HO-3-PR-828-H 383
Total
Concentration
Gas Total
Volume 2,4-D 2,4,5-T 2,4-D/2,4,5-T
m3t yg/m3 yg/m3 yg/m3
3.9262
Fuel Oil Background Test
6.0914 <0.3 <0.3 <0.6
<3 <3 <6
<0.2 <0.2 <0.4
<7
8.8333 <0.2 • <0.2 <0.4
<0.9 <0.9 <1.8
<0.4 <0.4 <0.8
<3
6.8847 <0.3 <0.3 <0.6
<4 <4 <8
<60 <60 <120
<130
Destruction
Efficiency
> 99. 999
>99.999
> 99. 999
Sample calculation given in Appendix F.10. See Appendix F.12 for conversion of yg/m3 to ppb.
Volume of combustion effluent sampled, dry gas at 20°C and 1013.2 mbar.
'Indicates not detected.
image:
TABLE 51. DESTRUCTION EFFICIENCIES FOR 2,4-D AND 2,4,5-T FROM LEAR-SIEGLER TRAIN ANALYSES*
ro
Sample
Volume
Sample mi
HO-1-ST-714-F
HO-1-LR-714-F 2098
HQ-1-PR-717-F/H 75
Total
HO-1-ST-716-H
HO-1-LR-716-H 2191
HO-1-PR-717-F/H 116
Total
HO-2-ST-813-H
HO-2-LR-813-H 1031
HO-2-PR-813-H 398
Total
HO-3-ST-828-H
HO-3-LR-828-H 1485
HO-3-PR-828-H 383
Total
Concentration
Gas Total
Volume 2,4-D 2,4,5-T 2,4-D/2,4,5-T
m3t yg/m3 yg/m3 yg/m3
3.9262
Fuel Oil Background Test
6.0914 <0.3 <0.3 <0.6
<3 <3 <6
<0.2 <0.2 <0.4
<7
8.8333 <0.2 • <0.2 <0.4
<0.9 <0.9 <1.8
<0.4 <0.4 <0.8
<3
6.8847 <0.3 <0.3 <0.6
<4 <4 <8
<60 <60 <120
<130
Destruction
Efficiency
> 99. 999
>99.999
> 99. 999
Sample calculation given in Appendix F.10. See Appendix F.12 for conversion of yg/m3 to ppb.
Volume of combustion effluent sampled, dry gas at 20°C and 1013.2 mbar.
'Indicates not detected.
image:
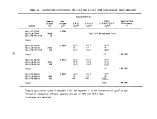 TABLE 52. DESTRUCTION EFFICIENCIES FOR 2,4-D AND
2,4,5-T FROM BCL ANALYSES*
Sample
HO-1-BI-714-F
HO-1-LR-714-F
HO-1-PR-717-F
Total
HO-1-BI-715-H
HO-1-LR-715-H
HO-1-PR-717-H
Total
HO-1-BI-716-H
HO-1-LR-716-H
HO-1-PR-717-H
Total
HO-1-BI-718-H
HO-1-LR-718-H
HO-1-PR-722-H
Total
HO-1-BI-719-H
HO-1-LR-719-H
HO-1-PR-722-H
Total
HO-1-BI-723-H
HO-1-LR-723-H
HO-1-PR-725-H
Total
HO-2-BI-813-H
HO-2-LR-813-H
HO-2-PR-813-H
Total
HO-3-BI-828-H
HO-3-LR-828-H
HO-3-PR-828-H
Total
Sample
Volume
mt
600
59.74
2.13
600
42.14
2.41
600
43.62
3.08
600
43.28
3.08
600
40.78
2.65
600
29.74
6.46
600
32.5
12.5
610
46
11
Gas
Volume 2.4-0 2,4,5-T
m3t uQ/ro p9/m
°-1116 Fuel 011
0.1262 <380 <190
<6.8 <3.3
* *
0.1211 <400 <200
<7.2 <3.6
* *
0.1235 <390 <190
<7.0 <3.5
<1.5 <0.8
0.1059 <450 <230
<7.7 <3.9
<1.5 <0.8
0.1058 <450 <230
<5.6 <2.8
<3.7 <1.8
0.2788 <170 <86
<2.3 <1.2
<4.5 <1.3
0.2811 <170 <87
<3.3 <1.6
<1.6 <0.8
2,4-0 + 2,4,5-T
ug/m3
Background Test
<570
<10
_
<580
<600
<11
.
<610
<580
<11
<2.2
<590
<680
<12
<2.3
<690
<680
<8.4
<5.5
<690
<260
<3.5
S5.8
<270
<260
<4.9
<2.3
<270
Destruction
Efficiency
> 99. 999
> 99. 999
> 99. 999
> 99. 999
> 99. 999
> 99. 999
> 99. 999
Sample calculation In Appendix F.ll. See Appendix F.12 for conversion of ug/m to ppb.
Volume gas sampled at 20°C and 1013.2 mbar.
sample was Inadvertantly not given to BCL for analysis.
122
image:
TABLE 52. DESTRUCTION EFFICIENCIES FOR 2,4-D AND
2,4,5-T FROM BCL ANALYSES*
Sample
HO-1-BI-714-F
HO-1-LR-714-F
HO-1-PR-717-F
Total
HO-1-BI-715-H
HO-1-LR-715-H
HO-1-PR-717-H
Total
HO-1-BI-716-H
HO-1-LR-716-H
HO-1-PR-717-H
Total
HO-1-BI-718-H
HO-1-LR-718-H
HO-1-PR-722-H
Total
HO-1-BI-719-H
HO-1-LR-719-H
HO-1-PR-722-H
Total
HO-1-BI-723-H
HO-1-LR-723-H
HO-1-PR-725-H
Total
HO-2-BI-813-H
HO-2-LR-813-H
HO-2-PR-813-H
Total
HO-3-BI-828-H
HO-3-LR-828-H
HO-3-PR-828-H
Total
Sample
Volume
mt
600
59.74
2.13
600
42.14
2.41
600
43.62
3.08
600
43.28
3.08
600
40.78
2.65
600
29.74
6.46
600
32.5
12.5
610
46
11
Gas
Volume 2.4-0 2,4,5-T
m3t uQ/ro p9/m
°-1116 Fuel 011
0.1262 <380 <190
<6.8 <3.3
* *
0.1211 <400 <200
<7.2 <3.6
* *
0.1235 <390 <190
<7.0 <3.5
<1.5 <0.8
0.1059 <450 <230
<7.7 <3.9
<1.5 <0.8
0.1058 <450 <230
<5.6 <2.8
<3.7 <1.8
0.2788 <170 <86
<2.3 <1.2
<4.5 <1.3
0.2811 <170 <87
<3.3 <1.6
<1.6 <0.8
2,4-0 + 2,4,5-T
ug/m3
Background Test
<570
<10
_
<580
<600
<11
.
<610
<580
<11
<2.2
<590
<680
<12
<2.3
<690
<680
<8.4
<5.5
<690
<260
<3.5
S5.8
<270
<260
<4.9
<2.3
<270
Destruction
Efficiency
> 99. 999
> 99. 999
> 99. 999
> 99. 999
> 99. 999
> 99. 999
> 99. 999
Sample calculation In Appendix F.ll. See Appendix F.12 for conversion of ug/m to ppb.
Volume gas sampled at 20°C and 1013.2 mbar.
sample was Inadvertantly not given to BCL for analysis.
122
image:
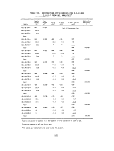 TABLE 53. DESTRUCTION EFFICIENCIES OF ORGANOCHLORINE COMPOUNDS
Samp] e
HO-1-ST-714-F
HO-1-LR-714-F
TOTAL
HO-1-ST-716-H
HO-1-LR-716-H
HO-1-PR-716-H
TOTAL
HO-2-ST-813-H
HO-2-LR-813-H
HO-2-PR-813-H
TOTAL
HO-3-ST-828-H
HO-3-LR-828-H
HO-3-PR-828-H
TOTAL
Emission
Concentration
wg/m
<0.5
<4
<4
6
<18
<0.2
<24
30
<1
<0.2
<31
66
<2
50
<120
Destruction
Efficiency
%
Fuel Oil
Background Test
> 99. 999
> 99. 999
> 99. 999
"<" means not detected.
four tests from which samples were analyzed. These estimates are given in
Table 54. They, should be considered upper bounds, that is, overestimates of
emissions of volatile hydrocarbons.
Analyses of the Lear-Siegler train samples (Table 30) showed that they
were quite complex. Trichlorophenol, a minor herbicide constituent, was found
in the sorbent trap of 13 August 1977 and was the only herbicide constituent
found in any Lear-Siegler train sample.
Aromatic hydrocarbons were shown to be present in the combustion efflu-
ent samples by the GC/MS analyses. The only reasonable source of these com-
pounds was synthesis in the flame because they were not constituents of the
123
image:
TABLE 53. DESTRUCTION EFFICIENCIES OF ORGANOCHLORINE COMPOUNDS
Samp] e
HO-1-ST-714-F
HO-1-LR-714-F
TOTAL
HO-1-ST-716-H
HO-1-LR-716-H
HO-1-PR-716-H
TOTAL
HO-2-ST-813-H
HO-2-LR-813-H
HO-2-PR-813-H
TOTAL
HO-3-ST-828-H
HO-3-LR-828-H
HO-3-PR-828-H
TOTAL
Emission
Concentration
wg/m
<0.5
<4
<4
6
<18
<0.2
<24
30
<1
<0.2
<31
66
<2
50
<120
Destruction
Efficiency
%
Fuel Oil
Background Test
> 99. 999
> 99. 999
> 99. 999
"<" means not detected.
four tests from which samples were analyzed. These estimates are given in
Table 54. They, should be considered upper bounds, that is, overestimates of
emissions of volatile hydrocarbons.
Analyses of the Lear-Siegler train samples (Table 30) showed that they
were quite complex. Trichlorophenol, a minor herbicide constituent, was found
in the sorbent trap of 13 August 1977 and was the only herbicide constituent
found in any Lear-Siegler train sample.
Aromatic hydrocarbons were shown to be present in the combustion efflu-
ent samples by the GC/MS analyses. The only reasonable source of these com-
pounds was synthesis in the flame because they were not constituents of the
123
image:
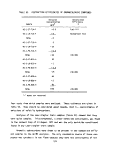 TABLE 54. ESTIMATES OF VOLATILE HYDROCARBON EMISSIONS*
Sample
HO-1-ST-716-H
HO-1-LR-716-H
HQ-1-PR-716-H
HO-2-ST-813-H
HO-2-LR-813-H
HO-2-PR-813-H
HO-3-ST-828-H
HO-3-LR-828-H
HO-3-PR-828-H
Total for
Emissions Test, Destruction
mg/m3 mg/m^ Efficiency, %
0.35
12.1
7.8
14 99.98
0.85
3
26
30 99.97
<0.2
11
3.4
14 99.99
See Appendix F.I2 for conversion of mg/m^ to ppm.
waste nor are they common contaminants. Quantitation of the GC/MS data was
accurate to ± factor of 10. Greater quantitative accuracy was not planned.
Estimates of emissions of aromatic hydrocarbons can be obtained from the GC/MS
analyses. Table 55 presents these estimates.
Destruction efficiencies for 2,4-D plus 2,4,5-T were all in excess of
99.999%, indicative of highly efficient incineration. Destruction efficiencies
for TCDD were greater than 99.9% for two of the tests and greater than 99.87%
and 99.89% for two other tests. Because of the very high destruction efficien-
cies for 2,4-D and 2,4,5-T and the chemical interferences in the TCDD analyses,
it is probable that the destruction efficiencies for TCDD were similarly very
high and certainly in excess of 99.9%.
124
image:
TABLE 54. ESTIMATES OF VOLATILE HYDROCARBON EMISSIONS*
Sample
HO-1-ST-716-H
HO-1-LR-716-H
HQ-1-PR-716-H
HO-2-ST-813-H
HO-2-LR-813-H
HO-2-PR-813-H
HO-3-ST-828-H
HO-3-LR-828-H
HO-3-PR-828-H
Total for
Emissions Test, Destruction
mg/m3 mg/m^ Efficiency, %
0.35
12.1
7.8
14 99.98
0.85
3
26
30 99.97
<0.2
11
3.4
14 99.99
See Appendix F.I2 for conversion of mg/m^ to ppm.
waste nor are they common contaminants. Quantitation of the GC/MS data was
accurate to ± factor of 10. Greater quantitative accuracy was not planned.
Estimates of emissions of aromatic hydrocarbons can be obtained from the GC/MS
analyses. Table 55 presents these estimates.
Destruction efficiencies for 2,4-D plus 2,4,5-T were all in excess of
99.999%, indicative of highly efficient incineration. Destruction efficiencies
for TCDD were greater than 99.9% for two of the tests and greater than 99.87%
and 99.89% for two other tests. Because of the very high destruction efficien-
cies for 2,4-D and 2,4,5-T and the chemical interferences in the TCDD analyses,
it is probable that the destruction efficiencies for TCDD were similarly very
high and certainly in excess of 99.9%.
124
image:
 TABLE 55. ESTIMATES OF EMISSIONS OF AROMATIC HYDROCARBONS*
Total for
Emissions Test Destruction
Sample gg/m3 ug/m3 Efficiency, %
HO-1-ST-716-H <0.3
HO-1-LR-716-H 130
HO-1-PR-716-H <0.1
130 >99.999
HO-2-ST-813-H 27
HO-2-LR-813-H 0.9
HO-2-PR-813-H <0.4
30 >99.999
HO-3-ST-828-H 29
HO-3-LR-828-H 240
HO-3-PR-828-H 190
460 >99.999
it
See Appendix F.12 for conversion of yg/m3 to ppb.
125
image:
TABLE 55. ESTIMATES OF EMISSIONS OF AROMATIC HYDROCARBONS*
Total for
Emissions Test Destruction
Sample gg/m3 ug/m3 Efficiency, %
HO-1-ST-716-H <0.3
HO-1-LR-716-H 130
HO-1-PR-716-H <0.1
130 >99.999
HO-2-ST-813-H 27
HO-2-LR-813-H 0.9
HO-2-PR-813-H <0.4
30 >99.999
HO-3-ST-828-H 29
HO-3-LR-828-H 240
HO-3-PR-828-H 190
460 >99.999
it
See Appendix F.12 for conversion of yg/m3 to ppb.
125
image:
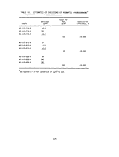 7. ERROR PROPAGATION ANALYSIS OF DESTRUCTION EFFICIENCY CALCULATIONS
This section briefly summarizes a detailed error propagation analysis,
presented in Appendix G, of destruction efficiency calculations used in this
report. The error analysis shows that destruction efficiencies are determined
by the following variables: oxygen, carbon dioxide, and carbon monoxide in
the combustion effluent; composition of the waste feed; and emission concen-
trations of waste constituents determined by laboratory analyses of combustion
effluent samples. Appendix G also shows that as long as there is excess air,
minor variations in combustion air and waste feed rates do not affect destruc-
tion efficiency because it is a dimensionless ratio. Variances in destruction
efficiencies for 2,4-D + 2,4,5-T and TCDD were calculated from the variances
in the factors listed above. Average values and standard deviations of the
variables are presented in Table 56.
Results of the error propagation analysis in Appendix G are summarized as
follows:
• For 2,4-D + 2,4,5-T
1) The mean, DE~, and standard deviation, s(DE), in destruction
efficiency for 2,4-D + 2,4,5-T are:
DE~ = 99.999971%
s(DE) = 4.5 x 10~5%
2) A conservative statistical analysis shows that there is 95%
confidence that not more than 1 measured destruction effi-
ciency in 1000 would be less than 99.99935%.
126
image:
7. ERROR PROPAGATION ANALYSIS OF DESTRUCTION EFFICIENCY CALCULATIONS
This section briefly summarizes a detailed error propagation analysis,
presented in Appendix G, of destruction efficiency calculations used in this
report. The error analysis shows that destruction efficiencies are determined
by the following variables: oxygen, carbon dioxide, and carbon monoxide in
the combustion effluent; composition of the waste feed; and emission concen-
trations of waste constituents determined by laboratory analyses of combustion
effluent samples. Appendix G also shows that as long as there is excess air,
minor variations in combustion air and waste feed rates do not affect destruc-
tion efficiency because it is a dimensionless ratio. Variances in destruction
efficiencies for 2,4-D + 2,4,5-T and TCDD were calculated from the variances
in the factors listed above. Average values and standard deviations of the
variables are presented in Table 56.
Results of the error propagation analysis in Appendix G are summarized as
follows:
• For 2,4-D + 2,4,5-T
1) The mean, DE~, and standard deviation, s(DE), in destruction
efficiency for 2,4-D + 2,4,5-T are:
DE~ = 99.999971%
s(DE) = 4.5 x 10~5%
2) A conservative statistical analysis shows that there is 95%
confidence that not more than 1 measured destruction effi-
ciency in 1000 would be less than 99.99935%.
126
image:
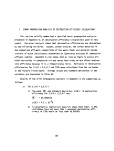 TABLE 56. SUMMARY OF VARIABLES FOR ERROR ANALYSIS*
a
b
d
e
Ci/C
%o2
%co2
K
K1
Variable
Weight fraction 2,4-0+2,4,5-T in herbicide
Emission concentration of 2,4-0+2, 4, 5-T
Height fraction TCDD in herbicide
Emission concentration of TCDD
Chlorine/carbon ratio in waste
Oxygen content of combustion effluent
Carbon dioxide content of combustion effluent
Second order variable
Second order variable
Units
dlmenslonless
metric ton/m
dimensionless
metric ton/m
dlmenslonless
«
»
moles
moles
Mean
0.8599
46.7xlO"12
1.91 6x1 0"6
1. 859x1 0"13
0.5834
8.9
10.3
0.4144
21.57
Standard
Deviation
0.0547
72.2xlO"12
7.23X10'7
1.42X10'13
0.0018
1.4
1.7
-
-
For TCDD
1) The mean, DE", and standard deviation, s(DE) in destruction
efficiency for TCDD are:
W = 99.948%
s(DE) = 0.044%
2) A conservative statistical analysis shows that there is 95%
confidence that not more than 1 measured destruction effi-
ciency in 1000 would be less than 99.54%.
127
image:
TABLE 56. SUMMARY OF VARIABLES FOR ERROR ANALYSIS*
a
b
d
e
Ci/C
%o2
%co2
K
K1
Variable
Weight fraction 2,4-0+2,4,5-T in herbicide
Emission concentration of 2,4-0+2, 4, 5-T
Height fraction TCDD in herbicide
Emission concentration of TCDD
Chlorine/carbon ratio in waste
Oxygen content of combustion effluent
Carbon dioxide content of combustion effluent
Second order variable
Second order variable
Units
dlmenslonless
metric ton/m
dimensionless
metric ton/m
dlmenslonless
«
»
moles
moles
Mean
0.8599
46.7xlO"12
1.91 6x1 0"6
1. 859x1 0"13
0.5834
8.9
10.3
0.4144
21.57
Standard
Deviation
0.0547
72.2xlO"12
7.23X10'7
1.42X10'13
0.0018
1.4
1.7
-
-
For TCDD
1) The mean, DE", and standard deviation, s(DE) in destruction
efficiency for TCDD are:
W = 99.948%
s(DE) = 0.044%
2) A conservative statistical analysis shows that there is 95%
confidence that not more than 1 measured destruction effi-
ciency in 1000 would be less than 99.54%.
127
image:
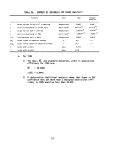 REFERENCES
1. From U.S. EPA Special Permit No. 770DH001S.
2. "Final Environmental Statement on Disposition of Orange Herbicide by
Incineration," U.S. Department of the Air Force, November 1974.
3. "Selection and Evaluation of Sorbent Resins for the Collection of Organic
Compounds," Report No. EPA-600/7-77-044, April 1977.
4. "Destroying Chemical Wastes in Commercial Scale Incinerators," Final
Report to U.S. EPA, November 1977, to be published under NTIS.
5. J.F. Clausen, H.J. Fisher, R.J. Johnson, E.L. Moon, C.C. Shih, R.F. Tobias,
and C.A. Zee, "At-Sea Incineration of Organochlorine Wastes on Board the
M/T Vulcanus," Document No. EPA-600/2-77-196, September 1977.
6. B.M. Hughes, D.C. Fee, M.L. Taylor, T.O. Tiernan, C.E. Hill, Jr., and
R.L.C. Wu, "Analytical Methodology for Herbicide Orange, Volume 1. Deter-
mination of Chemical Composition," from Tables XVI to XIX, pp. 73-79,
Final Report to U.S. Air Force Systems Command, No. ARL TR 75-0110,
May 1975.
7. Addendum to U.S. EPA Special Permit No. 770DH001S.
8. "IERL-RTP Procedures Manual: Level 1 Environment Assessment," U.S. EPA
Document No. EPA-600/2-76-160a, June 1976.
9. "Combustion Source Assessment. Methods and Procedures Manual for Sampling
and Analysis," TRW Report to U.S. EPA, September 1977.
128
image:
REFERENCES
1. From U.S. EPA Special Permit No. 770DH001S.
2. "Final Environmental Statement on Disposition of Orange Herbicide by
Incineration," U.S. Department of the Air Force, November 1974.
3. "Selection and Evaluation of Sorbent Resins for the Collection of Organic
Compounds," Report No. EPA-600/7-77-044, April 1977.
4. "Destroying Chemical Wastes in Commercial Scale Incinerators," Final
Report to U.S. EPA, November 1977, to be published under NTIS.
5. J.F. Clausen, H.J. Fisher, R.J. Johnson, E.L. Moon, C.C. Shih, R.F. Tobias,
and C.A. Zee, "At-Sea Incineration of Organochlorine Wastes on Board the
M/T Vulcanus," Document No. EPA-600/2-77-196, September 1977.
6. B.M. Hughes, D.C. Fee, M.L. Taylor, T.O. Tiernan, C.E. Hill, Jr., and
R.L.C. Wu, "Analytical Methodology for Herbicide Orange, Volume 1. Deter-
mination of Chemical Composition," from Tables XVI to XIX, pp. 73-79,
Final Report to U.S. Air Force Systems Command, No. ARL TR 75-0110,
May 1975.
7. Addendum to U.S. EPA Special Permit No. 770DH001S.
8. "IERL-RTP Procedures Manual: Level 1 Environment Assessment," U.S. EPA
Document No. EPA-600/2-76-160a, June 1976.
9. "Combustion Source Assessment. Methods and Procedures Manual for Sampling
and Analysis," TRW Report to U.S. EPA, September 1977.
128
image:
 APPENDIX A
SAFETY PLAN
FOR
INCINERATION OF HERBICIDE ORANGE
ON BOARD THE M/T VULCANUS
129
image:
APPENDIX A
SAFETY PLAN
FOR
INCINERATION OF HERBICIDE ORANGE
ON BOARD THE M/T VULCANUS
129
image:
 SAFETY PLAN
FOR
INCINERATION OF HERBICIDE ORANGE
ON BOARD THE M/T VULCANUS
Prepared by:
TRW Inc.
Contract No. 68-10-2966
EPA Project Officer: Dr. Ronald Venezia
Revision No. 2: 5 May 1977
Approved by:
B.J. Matthews, Program Manager
Approved by:
R.G. Kellehar, Health and Safety
Approved by:
B. Dubrow, Manager
Chemistry and Chemical
Engineering Laboratory
130
image:
SAFETY PLAN
FOR
INCINERATION OF HERBICIDE ORANGE
ON BOARD THE M/T VULCANUS
Prepared by:
TRW Inc.
Contract No. 68-10-2966
EPA Project Officer: Dr. Ronald Venezia
Revision No. 2: 5 May 1977
Approved by:
B.J. Matthews, Program Manager
Approved by:
R.G. Kellehar, Health and Safety
Approved by:
B. Dubrow, Manager
Chemistry and Chemical
Engineering Laboratory
130
image:
 SAFETY PLAN
FOR
INCINERATION OF HERBICIDE ORANGE
ON BOARD THE M/T VULCANUS
EPA Permit No. 770DH001R
Dated 25 April 1977
REVISED: 5 May 1977
U.S. Environmental Protection Agency
Washington, D.C.
131
image:
SAFETY PLAN
FOR
INCINERATION OF HERBICIDE ORANGE
ON BOARD THE M/T VULCANUS
EPA Permit No. 770DH001R
Dated 25 April 1977
REVISED: 5 May 1977
U.S. Environmental Protection Agency
Washington, D.C.
131
image:
 PREFACE
The draft Comprehensive Safety Plan, set forth in Appendix 14 of the Herbi-
cide Orange hearing record of April 7, 1977, was reviewed and revised at a
joint EPA, U.S.A.F., TRW and OCS meeting which was held at Gulfport, Mississippi,
on May 5, 1977. This document which includes the modifications agreed to at
the Gulfport meeting is the final plan and has been entered into the record as
Appendix 14. Verbal approval of the final Safety Plan was given by Lt. Col.
John Gokelman, U.S.A.F., on May 17 and by Dr. Ronald A. Venezia, EPA on
May 16, 1977.
If newly acquired scientific data indicate that additional safety provi-
sions or criteria should be included in the plan, EPA, after consultation with
the U.S.A.F. and TRW, will establish such additional provisions or criteria.
Russel H. Wyer, P.E.
Deputy Director
Oil & Special Materials Control
Division
May 19, 1977
132
image:
PREFACE
The draft Comprehensive Safety Plan, set forth in Appendix 14 of the Herbi-
cide Orange hearing record of April 7, 1977, was reviewed and revised at a
joint EPA, U.S.A.F., TRW and OCS meeting which was held at Gulfport, Mississippi,
on May 5, 1977. This document which includes the modifications agreed to at
the Gulfport meeting is the final plan and has been entered into the record as
Appendix 14. Verbal approval of the final Safety Plan was given by Lt. Col.
John Gokelman, U.S.A.F., on May 17 and by Dr. Ronald A. Venezia, EPA on
May 16, 1977.
If newly acquired scientific data indicate that additional safety provi-
sions or criteria should be included in the plan, EPA, after consultation with
the U.S.A.F. and TRW, will establish such additional provisions or criteria.
Russel H. Wyer, P.E.
Deputy Director
Oil & Special Materials Control
Division
May 19, 1977
132
image:
 TABLE OF CONTENTS
1. PURPOSE AND SCOPE 134
2. POTENTIAL HAZARDS 135
3. CRITERIA FOR TERMINATION OF A BURN 137
4. PERSONNEL PROTECTIVE EQUIPMENT 140
5. PERSONAL HYGIENE 142
6. SAFETY PROCEDURES AND MONITORING 146
ATTACHMENT A, FIRST AID 150
133
image:
TABLE OF CONTENTS
1. PURPOSE AND SCOPE 134
2. POTENTIAL HAZARDS 135
3. CRITERIA FOR TERMINATION OF A BURN 137
4. PERSONNEL PROTECTIVE EQUIPMENT 140
5. PERSONAL HYGIENE 142
6. SAFETY PROCEDURES AND MONITORING 146
ATTACHMENT A, FIRST AID 150
133
image:
 SAFETY PLAN
FOR
INCINERATION OF HERBICIDE ORANGE
ON BOARD THE M/T VULCANUS
1. PURPOSE AND SCOPE
The purpose of this document is to define a plan to ensure the safety of
personnel participating in the incineration of Herbicide Orange on board the
M/T Vulcanus. All personnel on board ship will adhere to the provisions of
this plan during all phases of the anticipated three incineration burns. TRW
will brief officers and crew members of the M/T Vulcanus with this safety plan
data and procedures. This is particularly important with regard to personal
hygiene, equipment malfunctions, spills and criteria for terminating a given
burn. Due to the inherent confinement while at sea, and required interaction
of TRW and Vulcanus personnel, a thorough understanding of the contents of this
document is mandatory on the part of all concerned.
The scope of the safety plan is limited to shipboard operations. Specifi-
cally excluded are the safety requirements for Herbicide Orange de-drumming,
drum cleaning and ship loading operations, which are covered by U.S. Air Force,
U.S. Coast Guard and M/T Vulcanus standard procedures.
To assist in establishing and maintaining safety procedures and routines,
TRW will designate a Safety Director for ocean incineration operations. This
individual will be a member of the TRW sampling and monitoring team. His duties
will include: safety procedure briefing of all ship's personnel; monitoring the
implementation of this safety plan; and advising the TRW crew leader, ship's
master and Air Force representative regarding corrective action for unsafe con-
ditions or incidents.
134
image:
SAFETY PLAN
FOR
INCINERATION OF HERBICIDE ORANGE
ON BOARD THE M/T VULCANUS
1. PURPOSE AND SCOPE
The purpose of this document is to define a plan to ensure the safety of
personnel participating in the incineration of Herbicide Orange on board the
M/T Vulcanus. All personnel on board ship will adhere to the provisions of
this plan during all phases of the anticipated three incineration burns. TRW
will brief officers and crew members of the M/T Vulcanus with this safety plan
data and procedures. This is particularly important with regard to personal
hygiene, equipment malfunctions, spills and criteria for terminating a given
burn. Due to the inherent confinement while at sea, and required interaction
of TRW and Vulcanus personnel, a thorough understanding of the contents of this
document is mandatory on the part of all concerned.
The scope of the safety plan is limited to shipboard operations. Specifi-
cally excluded are the safety requirements for Herbicide Orange de-drumming,
drum cleaning and ship loading operations, which are covered by U.S. Air Force,
U.S. Coast Guard and M/T Vulcanus standard procedures.
To assist in establishing and maintaining safety procedures and routines,
TRW will designate a Safety Director for ocean incineration operations. This
individual will be a member of the TRW sampling and monitoring team. His duties
will include: safety procedure briefing of all ship's personnel; monitoring the
implementation of this safety plan; and advising the TRW crew leader, ship's
master and Air Force representative regarding corrective action for unsafe con-
ditions or incidents.
134
image:
 2. POTENTIAL HAZARDS
The Herbicide Orange requiring disposal is a viscous, clear amber orange
liquid containing 50 percent (±1.5%) by volume of the'normal butyl ester of
2,4-dichlorophenoxyacetic acid (2,4-D) and 50 percent (±1.5%) by volume of the
normal butyl ester of 2,4,5-trichlorophenoxyacetic acid (2,4,5-T). The highly
toxic contaminant present in Herbicide Orange is 2,3,7,8-tetrachlorodibenzo-p-
dioxin (TCDD). The U.S. Air Force has analyzed the Herbicide Orange stocks and
found TCDD concentrations ranging from 0.05 to 47.0 ppmw. Statistical evalua-
tion of these data indicated that pooled stocks would have an estimated average
TCDD concentration of 1.9 ppmw (±0.7 ppmw) at 95 percent confidence level.
The principal Herbicide Orange constituent of concern, TCDD, has been
found to be highly embryotoxic, teratogenic and acnegenic and is lethal in
the microgram-per-kilogram of body weight range. The detailed toxicological
properties of TCDD, as compiled by the U.S. Air Force, are described in Refer-
ence 1. The no-effect TCDD dose levels for embryotoxicity and chick endema are
0.03 to 0.1 yg/kg/day respectively. Assuming that a person inhales 30 m of
air in a 24-hr day and a body weight of 60 kg for an average person, the amount
of TCDD absorbed into the blood stream of a person will be less than 0.03 yg/kg X
60 kg = 1.8 yg if the ambient concentration of TCDD is less than 1.8/30 =
3
0.06 yg/m , even if the efficiency of pulmonary absorption is 100 percent.
3
Thus an ambient TCDD concentration of 0.06 yg/m may be considered as the no
effect level for humans. With the application of an additional safety factor
of 10, it is proposed that 6 ng/m be considered as the safe ambient concentra-
tion for TCDD for all personnel on board the M/T Vulcanus.
Teratogenic - tending to cause developmental malfunctions and monstrosities.
1. U.S. Air Force Report, "Amendment to Final Environmental Statement on the
Disposition of Herbicide Orarfge by Incineration," October 1976.
135
image:
2. POTENTIAL HAZARDS
The Herbicide Orange requiring disposal is a viscous, clear amber orange
liquid containing 50 percent (±1.5%) by volume of the'normal butyl ester of
2,4-dichlorophenoxyacetic acid (2,4-D) and 50 percent (±1.5%) by volume of the
normal butyl ester of 2,4,5-trichlorophenoxyacetic acid (2,4,5-T). The highly
toxic contaminant present in Herbicide Orange is 2,3,7,8-tetrachlorodibenzo-p-
dioxin (TCDD). The U.S. Air Force has analyzed the Herbicide Orange stocks and
found TCDD concentrations ranging from 0.05 to 47.0 ppmw. Statistical evalua-
tion of these data indicated that pooled stocks would have an estimated average
TCDD concentration of 1.9 ppmw (±0.7 ppmw) at 95 percent confidence level.
The principal Herbicide Orange constituent of concern, TCDD, has been
found to be highly embryotoxic, teratogenic and acnegenic and is lethal in
the microgram-per-kilogram of body weight range. The detailed toxicological
properties of TCDD, as compiled by the U.S. Air Force, are described in Refer-
ence 1. The no-effect TCDD dose levels for embryotoxicity and chick endema are
0.03 to 0.1 yg/kg/day respectively. Assuming that a person inhales 30 m of
air in a 24-hr day and a body weight of 60 kg for an average person, the amount
of TCDD absorbed into the blood stream of a person will be less than 0.03 yg/kg X
60 kg = 1.8 yg if the ambient concentration of TCDD is less than 1.8/30 =
3
0.06 yg/m , even if the efficiency of pulmonary absorption is 100 percent.
3
Thus an ambient TCDD concentration of 0.06 yg/m may be considered as the no
effect level for humans. With the application of an additional safety factor
of 10, it is proposed that 6 ng/m be considered as the safe ambient concentra-
tion for TCDD for all personnel on board the M/T Vulcanus.
Teratogenic - tending to cause developmental malfunctions and monstrosities.
1. U.S. Air Force Report, "Amendment to Final Environmental Statement on the
Disposition of Herbicide Orarfge by Incineration," October 1976.
135
image:
 The two major constituents of Herbicide Orange, the butyl esters of 2,4,-D
and 2,4,5-T, are of moderate toxicity to mammals. The acute oral and dermal
LDcn values of the 2,4-D acid to the rat have been reported to be 375 and
bu
1500 mg/kg body weight respectively. The acute oral LD™ of mixed butyl esters
of 2,4-D to rats is 620 mg/kg. The acute oral LDrg of the 2,4,5-T acid to rats
is 500 mg/kg. Chronically, both 2,4-D and 2,4,5-T are of low toxicity, because
of the highly developed kidney function possessed by mammals that will rapidly
eliminate 2,4-D and 2,4,5-T by active tubular secretion. Thus, the cumulative
effects of 2,4-D and 2,4,5-T are minimal. The American Conference of Govern-
mental Industrial Hygienists (ACGIH) recommended Threshold Limit Values (TLV)
o
for either 2,4-D or 2,4,5-T is 10 mg/m . The TLV is a time-weighted safe air
concentration for an 8-hour work day or 40-hour work week. Based upon the TLV,
a range of time limited ambient (personnel breathing zone) concentrations con-
sidered safe exposure levels for personnel on board the M/T Vulcanus is as
follows:
Combined Concentrations of Butyl Esters of 2,4-D, 2,4,5-T
2.0 mg/m for samples taken periodically over 16 hours, or
3
10.0 mg/m for samples taken periodically over 8 hours.
The detailed toxicological properties of 2,4-D and 2,4,5-T, as compiled
by the U.S. Air Force, are described in Reference 1. In addition to the toxi-
cological hazards, Herbicide Orange is also flammable.
- Lethal dose fifty. A calculated dose of a chemical substance which is
expected to cause the death of 50% of an entire population of an experi-
mental animal species, as determined from the exposure to the substance,
by any route other than inhalation, of a significant number from that
population.
136
image:
The two major constituents of Herbicide Orange, the butyl esters of 2,4,-D
and 2,4,5-T, are of moderate toxicity to mammals. The acute oral and dermal
LDcn values of the 2,4-D acid to the rat have been reported to be 375 and
bu
1500 mg/kg body weight respectively. The acute oral LD™ of mixed butyl esters
of 2,4-D to rats is 620 mg/kg. The acute oral LDrg of the 2,4,5-T acid to rats
is 500 mg/kg. Chronically, both 2,4-D and 2,4,5-T are of low toxicity, because
of the highly developed kidney function possessed by mammals that will rapidly
eliminate 2,4-D and 2,4,5-T by active tubular secretion. Thus, the cumulative
effects of 2,4-D and 2,4,5-T are minimal. The American Conference of Govern-
mental Industrial Hygienists (ACGIH) recommended Threshold Limit Values (TLV)
o
for either 2,4-D or 2,4,5-T is 10 mg/m . The TLV is a time-weighted safe air
concentration for an 8-hour work day or 40-hour work week. Based upon the TLV,
a range of time limited ambient (personnel breathing zone) concentrations con-
sidered safe exposure levels for personnel on board the M/T Vulcanus is as
follows:
Combined Concentrations of Butyl Esters of 2,4-D, 2,4,5-T
2.0 mg/m for samples taken periodically over 16 hours, or
3
10.0 mg/m for samples taken periodically over 8 hours.
The detailed toxicological properties of 2,4-D and 2,4,5-T, as compiled
by the U.S. Air Force, are described in Reference 1. In addition to the toxi-
cological hazards, Herbicide Orange is also flammable.
- Lethal dose fifty. A calculated dose of a chemical substance which is
expected to cause the death of 50% of an entire population of an experi-
mental animal species, as determined from the exposure to the substance,
by any route other than inhalation, of a significant number from that
population.
136
image:
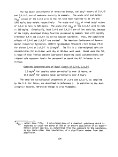 3. CRITERIA FOR TERMINATION OF A BURN
Due to the highly toxic nature of the TCDD contaminant present in Herbicide
Orange, the TRW team leader acting on behalf of the U.S. Environmental Protec-
tion Agency, shall, in consultation with the cognizant U.S. Air Force represen-
tative, retain the authority to terminate and/or initiate incineration. The
criteria that will be used by the TRW team leader to measure safe shipboard
operation are summarized in Table 3.1 and discussed in the following sections.
These criteria will only be used as guidelines. It should be recognized that,
in addition to the TRW team leader, authority to terminate any individual incin-
eration test shall also rest with any one of the following personnel: U.S. Air
Force designate, or the captain of the M/T Vulcanus.
3.1 PLUME IMPINGEMENT
The plume arising from the incinerator stacks will be injected with ammonia
as required to make it visible as necessary. Incineration with Herbicide Orange
will be terminated and shipboard personnel will be withdrawn to a safe area, if
at any time during the test, the plume is observed to remain on the deck of the
M/T Vulcanus even after corrective measures have been attempted.
3.2 HERBICIDE ORANGE SPILLS
Incineration will be terminated if a spill occurs on board the M/T Vulcanus
and cannot be readily contained or cleaned.
3.3 COMBUSTION EFFICIENCY
The CO and CO^ levels determined at or near the exit plane will be used as
an indication of overall combustion efficiency using the following equation:
COp concentration - CO concentration
% Combustion Efficiency = C02 concentration X 10°
Combustion efficiencies in excess of 99.9 percent are deemed necessary as an
indication that high destruction efficiencies for Herbicide Orange constituents
137
image:
3. CRITERIA FOR TERMINATION OF A BURN
Due to the highly toxic nature of the TCDD contaminant present in Herbicide
Orange, the TRW team leader acting on behalf of the U.S. Environmental Protec-
tion Agency, shall, in consultation with the cognizant U.S. Air Force represen-
tative, retain the authority to terminate and/or initiate incineration. The
criteria that will be used by the TRW team leader to measure safe shipboard
operation are summarized in Table 3.1 and discussed in the following sections.
These criteria will only be used as guidelines. It should be recognized that,
in addition to the TRW team leader, authority to terminate any individual incin-
eration test shall also rest with any one of the following personnel: U.S. Air
Force designate, or the captain of the M/T Vulcanus.
3.1 PLUME IMPINGEMENT
The plume arising from the incinerator stacks will be injected with ammonia
as required to make it visible as necessary. Incineration with Herbicide Orange
will be terminated and shipboard personnel will be withdrawn to a safe area, if
at any time during the test, the plume is observed to remain on the deck of the
M/T Vulcanus even after corrective measures have been attempted.
3.2 HERBICIDE ORANGE SPILLS
Incineration will be terminated if a spill occurs on board the M/T Vulcanus
and cannot be readily contained or cleaned.
3.3 COMBUSTION EFFICIENCY
The CO and CO^ levels determined at or near the exit plane will be used as
an indication of overall combustion efficiency using the following equation:
COp concentration - CO concentration
% Combustion Efficiency = C02 concentration X 10°
Combustion efficiencies in excess of 99.9 percent are deemed necessary as an
indication that high destruction efficiencies for Herbicide Orange constituents
137
image:
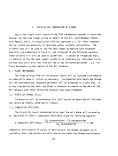 TABLE A-l. CRITERIA FOR TERMINATION OF A BURN*
Observation/
Measurement
Decision Criteria
Action to be Taken
Plume Impingement
Herbicide Orange
Spills
Combustion Efficiency
On Board Determination
of 2,4-D/2,4,5-T in
Stack Gas
On Board Determination
of Ambient Level for
2,4-D/2,4,5-T
Plume is observed to
remain on the deck of the
M/T Vulcanus even after
evasive action
Large spills that cannot
be readily contained.
Termination of incin-
eration and withdrawal
of shipboard personnel
to a safe area.
Termination of incin-
eration and withdrawal
of shipboard personnel
to a safe area.
Combustion efficiency less Termination of
than 99.9% incineration.
Combined 2,4-0/2,4,5-T
concentration in excess of
130 mg/m3 in the stack
gas.
Combined ambient (person-
nel breathing zone) level
of 2,4-0/2,4,5-T in excess
of 2.0 mg/m3 over 16 hr.
or 10 mg/m3 over 8 hr.
Termination of
incineration
Termination of incin-.,
eration and/or imme-
diate withdrawal of
shipboard personnel to
a safe area.
The TRW team leader will consult with the U.S. Air Force designate before
taking any action to terminate incineration. If appropriate, fuel oil
may be substituted as a fuel while corrective action is being taken.
may be anticipated. The 99.9 percent combustion efficiency corresponds to
approximately 100 ppm CO in the combustion product gas. The detection of large
amounts of CO in the stack gas (and hence lower combustion efficiency) is an
indication that incomplete combustion is taking place in the incinerator.
Incineration will be terminated if the combustion efficiency is less than
99.9 percent.
138
image:
TABLE A-l. CRITERIA FOR TERMINATION OF A BURN*
Observation/
Measurement
Decision Criteria
Action to be Taken
Plume Impingement
Herbicide Orange
Spills
Combustion Efficiency
On Board Determination
of 2,4-D/2,4,5-T in
Stack Gas
On Board Determination
of Ambient Level for
2,4-D/2,4,5-T
Plume is observed to
remain on the deck of the
M/T Vulcanus even after
evasive action
Large spills that cannot
be readily contained.
Termination of incin-
eration and withdrawal
of shipboard personnel
to a safe area.
Termination of incin-
eration and withdrawal
of shipboard personnel
to a safe area.
Combustion efficiency less Termination of
than 99.9% incineration.
Combined 2,4-0/2,4,5-T
concentration in excess of
130 mg/m3 in the stack
gas.
Combined ambient (person-
nel breathing zone) level
of 2,4-0/2,4,5-T in excess
of 2.0 mg/m3 over 16 hr.
or 10 mg/m3 over 8 hr.
Termination of
incineration
Termination of incin-.,
eration and/or imme-
diate withdrawal of
shipboard personnel to
a safe area.
The TRW team leader will consult with the U.S. Air Force designate before
taking any action to terminate incineration. If appropriate, fuel oil
may be substituted as a fuel while corrective action is being taken.
may be anticipated. The 99.9 percent combustion efficiency corresponds to
approximately 100 ppm CO in the combustion product gas. The detection of large
amounts of CO in the stack gas (and hence lower combustion efficiency) is an
indication that incomplete combustion is taking place in the incinerator.
Incineration will be terminated if the combustion efficiency is less than
99.9 percent.
138
image:
 3.4 ON BOARD DETERMINATION OF STACK EMISSIONS OF
HERBICIDE ORANGE CONSTITUENTS
In addition to monitoring the CO and C02 levels in the stack gas, grab
samples collected from the benzene impinger will also be directly injected into
a GC equipped with a FID for 2,4-D and 2,4,5-T analyses by TRW. The GC/FID
combination provides a lower detection limit of approximately 1.0 mg/m for
2,4-D or 2,4,5-T in the stack gas. For on-board safety requirements, the
allowable limit for combined 2,4-0/2,4,5-T concentration in the stack gas will
3
be 130 mg/m based upon a 99.9 percent destruction efficiency. The TLV for
either 2,4-D or 2,4,5-T is 10 mg/m3.
Incineration will be terminated if the combined 2,4-0/2,4,5-T concentration
3
in the stack gas is in excess of 130 mg/m.
3.5 ONBOARD DETERMINATION OF AMBIENT LEVEL OF
HERBICIDE ORANGE CONSTITUENTS
Ambient 2,4-0/2,4,5-T concentrations result from atmospheric dispersion of
stack emissions as well as any fugitive emissions onboard the M/T Vulcanus.
The TRW team leader will alert shipboard personnel and direct the location and
elimination of such emission sources. Incineration will be terminated and/or
shipboard personnel withdrawn if the combined ambient (personnel breathing zone)
level of 2,4-0/2,4,5-T is in excess of 2.0 mg/m3 over a 16-hour period, or in
3
excess of 10 mg/m over an 8-hour period.
139
image:
3.4 ON BOARD DETERMINATION OF STACK EMISSIONS OF
HERBICIDE ORANGE CONSTITUENTS
In addition to monitoring the CO and C02 levels in the stack gas, grab
samples collected from the benzene impinger will also be directly injected into
a GC equipped with a FID for 2,4-D and 2,4,5-T analyses by TRW. The GC/FID
combination provides a lower detection limit of approximately 1.0 mg/m for
2,4-D or 2,4,5-T in the stack gas. For on-board safety requirements, the
allowable limit for combined 2,4-0/2,4,5-T concentration in the stack gas will
3
be 130 mg/m based upon a 99.9 percent destruction efficiency. The TLV for
either 2,4-D or 2,4,5-T is 10 mg/m3.
Incineration will be terminated if the combined 2,4-0/2,4,5-T concentration
3
in the stack gas is in excess of 130 mg/m.
3.5 ONBOARD DETERMINATION OF AMBIENT LEVEL OF
HERBICIDE ORANGE CONSTITUENTS
Ambient 2,4-0/2,4,5-T concentrations result from atmospheric dispersion of
stack emissions as well as any fugitive emissions onboard the M/T Vulcanus.
The TRW team leader will alert shipboard personnel and direct the location and
elimination of such emission sources. Incineration will be terminated and/or
shipboard personnel withdrawn if the combined ambient (personnel breathing zone)
level of 2,4-0/2,4,5-T is in excess of 2.0 mg/m3 over a 16-hour period, or in
3
excess of 10 mg/m over an 8-hour period.
139
image:
 4. PERSONNEL PROTECTIVE EQUIPMENT
Due to the potential health hazard relating to the sampling and monitoring
of the incineration of Herbicide Orange aboard the M/T Vulcanus, special safety
requirements have been established for all personnel to ensure that no hazards
exist. To assure adequate protection, issued coveralls will be worn as appro-
priate during set-up, operation, and clean up of all sampling and/or monitoring
equipment.
In addition to the normal equipment used in this type of activity, the
following items will be provided.
1) NIOSH approved pesticide gas respirator.
2) Portable monitors, MSA Model 5 or S pumps fitted with sample
tubes containing Chromosorb 102
3) Fire extinguishers
Ansul - Model CD-5
Sentry - Model SY-1012
4) Fire fighter entry suits
5) Scott air pak
6) Portable emergency eye baths
All personnel that will be onboard the M/T Vulcanus and may enter a potentially
contaminated area will be duly trained on the proper use and operation of the
above equipment.
Other general safety requirements that will be adhered to are the following:
1) All personnel within the incinerator area and/or sampling area
during the incineration of Herbicide Orange will have an
approved gas mask available for immediate use.
2) If an emergency condition is detected, all personnel will be
notified to don masks and to evacuate a given area if necessary.
140
image:
4. PERSONNEL PROTECTIVE EQUIPMENT
Due to the potential health hazard relating to the sampling and monitoring
of the incineration of Herbicide Orange aboard the M/T Vulcanus, special safety
requirements have been established for all personnel to ensure that no hazards
exist. To assure adequate protection, issued coveralls will be worn as appro-
priate during set-up, operation, and clean up of all sampling and/or monitoring
equipment.
In addition to the normal equipment used in this type of activity, the
following items will be provided.
1) NIOSH approved pesticide gas respirator.
2) Portable monitors, MSA Model 5 or S pumps fitted with sample
tubes containing Chromosorb 102
3) Fire extinguishers
Ansul - Model CD-5
Sentry - Model SY-1012
4) Fire fighter entry suits
5) Scott air pak
6) Portable emergency eye baths
All personnel that will be onboard the M/T Vulcanus and may enter a potentially
contaminated area will be duly trained on the proper use and operation of the
above equipment.
Other general safety requirements that will be adhered to are the following:
1) All personnel within the incinerator area and/or sampling area
during the incineration of Herbicide Orange will have an
approved gas mask available for immediate use.
2) If an emergency condition is detected, all personnel will be
notified to don masks and to evacuate a given area if necessary.
140
image:
 3) Personnel exposed to high temperatures and/or direct thermal
radiation will wear entry suits.
4) Confirmed or suspected spills will be reported to the ship's
master and the Safety Director for proper clean up.
141
image:
3) Personnel exposed to high temperatures and/or direct thermal
radiation will wear entry suits.
4) Confirmed or suspected spills will be reported to the ship's
master and the Safety Director for proper clean up.
141
image:
 5. PERSONAL HYGIENE
The observed effects on animals of tetrachlorodibenzo-p-dioxin (TCDD) or
of 2,4,5-trichlorophenoxyacetic and n-butyl ester (2,4,5-T) containing TCDD are
described in detail in Reference 1. The effects observed on workers are sum-
marized below, to emphasize the need for personnel hygiene.
• Chloracne (moderate to severe skin irritation, with swelling,
hardening, blackheads, pustules and pimples)
• Hyperpigmentation (skin discoloration)
• Hirsutism
• Eye irritation
• Muscular pain (legs, arms, back, breast)
• Decreased libido
• Fatigue
• Nervous irritability
• Intolerance to cold
• Destruction of nerve fibers and nerve sheaths
In addition, some effects on exposed test animals were observed. These
may be considered possible effects on the human system, especially when the
metabolism of the animal is similar to that of man. These effects include
toxicity to embryos, birth defects, possible carcinogenicity, and even death.
It should also be noted that the greatest hazard is to pregnant females and
their fetuses, especially in the first third of the pregnancy period.
142
image:
5. PERSONAL HYGIENE
The observed effects on animals of tetrachlorodibenzo-p-dioxin (TCDD) or
of 2,4,5-trichlorophenoxyacetic and n-butyl ester (2,4,5-T) containing TCDD are
described in detail in Reference 1. The effects observed on workers are sum-
marized below, to emphasize the need for personnel hygiene.
• Chloracne (moderate to severe skin irritation, with swelling,
hardening, blackheads, pustules and pimples)
• Hyperpigmentation (skin discoloration)
• Hirsutism
• Eye irritation
• Muscular pain (legs, arms, back, breast)
• Decreased libido
• Fatigue
• Nervous irritability
• Intolerance to cold
• Destruction of nerve fibers and nerve sheaths
In addition, some effects on exposed test animals were observed. These
may be considered possible effects on the human system, especially when the
metabolism of the animal is similar to that of man. These effects include
toxicity to embryos, birth defects, possible carcinogenicity, and even death.
It should also be noted that the greatest hazard is to pregnant females and
their fetuses, especially in the first third of the pregnancy period.
142
image:
 The need for personal cleanliness is pointed up by the methods of entry
of TCDD into the body. These are:
• Through the mouth (ingestion)
• Through the skin (percutaneous)
• Through the lungs and eyes
Thus, eating, drinking, and smoking in working areas; wearing contaminated
clothes; leaving liquids on the skin, failure to shower frequently and, espe-
cially, immediately after exposure; and breathing contaminated air must be
avoided.
Discussions have been held with Col. Walter W. Melvin, Jr., M.D., USAF
Environmental Health Laboratory, Kelly AFB, Texas, and Dr. V.K. Rowe, Corporate
Offices, Dow Chemical Co., Midland, Michigan, concerning methods of personnel
hygiene. They concur with the concepts of personal cleanliness, isolation of
contaminated areas, and preservation of "clean" areas which are described
herein.
Most procedures designed to protect personnel from hazards are a compro-
mise between the ideal of complete avoidance of exposure and the reality of
providing safe conditions and areas in which work can be done.
In the present case, good personal hygiene practices are of prime impor-
tance in preventing exposure of personnel to materials containing TCDD. Of
equal importance is the establishment of "clean" areas, in which personnel can
co-exist normally; the isolation of the hazard in areas where contamination is
expected and can be dealt with; and the maintenance of an interface between
the two areas which can be crossed while maintaining the integrity of the clean
area and the safety of personnel therein.
It is anticipated that the first opportunity for exposure will come from
spills and leaks in the system. The exposed liquids will evaporate, especially
from hot decks and tankage areas below decks, and the very hot combustor room.
The liquids may be tracked over the decks and passageways, and may find
their way into the eating and living quarters unless an inviolate interface is
established between the two areas.
143
image:
The need for personal cleanliness is pointed up by the methods of entry
of TCDD into the body. These are:
• Through the mouth (ingestion)
• Through the skin (percutaneous)
• Through the lungs and eyes
Thus, eating, drinking, and smoking in working areas; wearing contaminated
clothes; leaving liquids on the skin, failure to shower frequently and, espe-
cially, immediately after exposure; and breathing contaminated air must be
avoided.
Discussions have been held with Col. Walter W. Melvin, Jr., M.D., USAF
Environmental Health Laboratory, Kelly AFB, Texas, and Dr. V.K. Rowe, Corporate
Offices, Dow Chemical Co., Midland, Michigan, concerning methods of personnel
hygiene. They concur with the concepts of personal cleanliness, isolation of
contaminated areas, and preservation of "clean" areas which are described
herein.
Most procedures designed to protect personnel from hazards are a compro-
mise between the ideal of complete avoidance of exposure and the reality of
providing safe conditions and areas in which work can be done.
In the present case, good personal hygiene practices are of prime impor-
tance in preventing exposure of personnel to materials containing TCDD. Of
equal importance is the establishment of "clean" areas, in which personnel can
co-exist normally; the isolation of the hazard in areas where contamination is
expected and can be dealt with; and the maintenance of an interface between
the two areas which can be crossed while maintaining the integrity of the clean
area and the safety of personnel therein.
It is anticipated that the first opportunity for exposure will come from
spills and leaks in the system. The exposed liquids will evaporate, especially
from hot decks and tankage areas below decks, and the very hot combustor room.
The liquids may be tracked over the decks and passageways, and may find
their way into the eating and living quarters unless an inviolate interface is
established between the two areas.
143
image:
 The basic requirements for effective personnel hygiene against TCDD-
containing materials are:
• Protection of personnel for vapor and liquid contact in the
contaminated areas by source control and protective gear
• Provision of disposable clothing and foot covers
• Provision of disposal facilities at the interface region
between the contaminated and clean areas
• Provision for a shower, hand, face and eye-washing facilities
at the interface region
• Provision of clean clothing and foot covering at the boundary
of the clean area upon return to working areas
• Instruction in the use of the cleaning and protective equip-
ment and in methods of personal cleansing
• Mandatory and enforced use of the above facilities and
concepts.
Smoking, eating or drinking from containers or cups should be avoided in
potentially contaminated areas. This also applies to personnel who have not
showered or otherwise cleansed themselves after being in potentially contami-
nated areas.
The routes by which personnel move should be so arranged that entrance to
the working area and exits from the working area are separate. Shoe covers
which can be disposed of must be provided at entrances, and provision for their
removal and disposal at exits must be made.
A monitoring system for ensuring that clean areas, such as the galley,
mess room, living quarters, bridge, toilets and passageways, should be devel-
oped and put into effect on a firm basis, A schedule of inspection of the
clean areas should be established, and the results of the monitoring made
known to the ship's master.
Finally, all working personnel should be made aware of the need for good
personal hygiene and of the consequences to themselves and others of poor per-
sonal cleanliness and poor housekeeping. A training program should be developed
and personnel should be trained in personal hygiene practices. The effectiveness
144
image:
The basic requirements for effective personnel hygiene against TCDD-
containing materials are:
• Protection of personnel for vapor and liquid contact in the
contaminated areas by source control and protective gear
• Provision of disposable clothing and foot covers
• Provision of disposal facilities at the interface region
between the contaminated and clean areas
• Provision for a shower, hand, face and eye-washing facilities
at the interface region
• Provision of clean clothing and foot covering at the boundary
of the clean area upon return to working areas
• Instruction in the use of the cleaning and protective equip-
ment and in methods of personal cleansing
• Mandatory and enforced use of the above facilities and
concepts.
Smoking, eating or drinking from containers or cups should be avoided in
potentially contaminated areas. This also applies to personnel who have not
showered or otherwise cleansed themselves after being in potentially contami-
nated areas.
The routes by which personnel move should be so arranged that entrance to
the working area and exits from the working area are separate. Shoe covers
which can be disposed of must be provided at entrances, and provision for their
removal and disposal at exits must be made.
A monitoring system for ensuring that clean areas, such as the galley,
mess room, living quarters, bridge, toilets and passageways, should be devel-
oped and put into effect on a firm basis, A schedule of inspection of the
clean areas should be established, and the results of the monitoring made
known to the ship's master.
Finally, all working personnel should be made aware of the need for good
personal hygiene and of the consequences to themselves and others of poor per-
sonal cleanliness and poor housekeeping. A training program should be developed
and personnel should be trained in personal hygiene practices. The effectiveness
144
image:
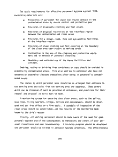 of the program will depend on the degree to which personnel accept the training,
willingly put the principles to use, and cooperate in preventing exposures.
Personnel who are unwilling or unable to accept and apply the personal hygiene
procedures should be excluded from contact with and entry to the working area
by direction of the ship's master.
145
image:
of the program will depend on the degree to which personnel accept the training,
willingly put the principles to use, and cooperate in preventing exposures.
Personnel who are unwilling or unable to accept and apply the personal hygiene
procedures should be excluded from contact with and entry to the working area
by direction of the ship's master.
145
image:
 6. SAFETY PROCEDURES AND MONITORING
The safety of all shipboard personnel will have top priority during the
incineration of Herbicide Orange onboard the M/T Vulcanus. As a minimum, the
following safety precautions are required as they apply before, during and after
burn operations. These safety precautions are grouped by participating organ-
izations to define and emphasize areas of responsibility.
M/T Vulcanus
1) All waste tank openings and viewing ports shall be closed.
A closed system shall be maintained such that vapors do not
escape into the atmosphere for the duration of the operation.
2) Any Herbicide Orange spills, leaks or residuals detected
shall be immediately contained and decontaminated.
3) Measuring the tankage contents shall be with a closed gaging
system. A schedule of tank content measurement and rate of
depletion shall be established.
4) The cause of apparently random and often severe vibrations
from the incinerators at frequent intervals during previous
waste burns shall be identified. Steps to eliminate this
condition shall be identified and implemented.
5) Fugitive Herbicide Orange emissions from the waste pumping
room or any other source shall be eliminated.
6) An automatic shut-off device shall be in operation on both
furnaces, set to turn off the flow of Herbicide Orange if
the flame temperature drops below 1250°C.
7) The furnaces may be brought up to operating temperature at
a rate consistent with ship's practice and experience, using
fuel oil. When a flame temperature of 1280°C has been
reached in the furnace (using correlated thermocouple or
optical pyrometer measurements) the feed stock may be switched
over to Herbicide Orange. The practice of converting to
Herbicide Orange feed by putting furnaces on stream succes-
sively should be followed. The temperature of the furnace
as read at the control panel should not be allowed to drop
146
image:
6. SAFETY PROCEDURES AND MONITORING
The safety of all shipboard personnel will have top priority during the
incineration of Herbicide Orange onboard the M/T Vulcanus. As a minimum, the
following safety precautions are required as they apply before, during and after
burn operations. These safety precautions are grouped by participating organ-
izations to define and emphasize areas of responsibility.
M/T Vulcanus
1) All waste tank openings and viewing ports shall be closed.
A closed system shall be maintained such that vapors do not
escape into the atmosphere for the duration of the operation.
2) Any Herbicide Orange spills, leaks or residuals detected
shall be immediately contained and decontaminated.
3) Measuring the tankage contents shall be with a closed gaging
system. A schedule of tank content measurement and rate of
depletion shall be established.
4) The cause of apparently random and often severe vibrations
from the incinerators at frequent intervals during previous
waste burns shall be identified. Steps to eliminate this
condition shall be identified and implemented.
5) Fugitive Herbicide Orange emissions from the waste pumping
room or any other source shall be eliminated.
6) An automatic shut-off device shall be in operation on both
furnaces, set to turn off the flow of Herbicide Orange if
the flame temperature drops below 1250°C.
7) The furnaces may be brought up to operating temperature at
a rate consistent with ship's practice and experience, using
fuel oil. When a flame temperature of 1280°C has been
reached in the furnace (using correlated thermocouple or
optical pyrometer measurements) the feed stock may be switched
over to Herbicide Orange. The practice of converting to
Herbicide Orange feed by putting furnaces on stream succes-
sively should be followed. The temperature of the furnace
as read at the control panel should not be allowed to drop
146
image:
 more than 20°C at this time and must be restored to at least
the original level of 1280°C before the next burner is changed
over to Herbicide Orange.
8) Monitoring of the furnaces for temperature, and for complete-
ness of combustion, shall be in effect during the changeover,
The continuous record of temperature shall also be maintained
during this time.
9) The operational controls and monitoring panels shall be manned
at all times by a responsible individual to ensure the incin-
erators are operating within desired combustion parameters.
10) An automatic sealed monitoring device (black box) will be
installed to record incineration activities and temperatures
and camera to photograph the control panel every 15-30 minutes.
In addition, a manual log will also be kept, including:
a) Time, date
b) "Black box" temperature
c) Controller temperature reading
d) Waste feed rates
e) Switching of waste tanks
f) Wind speed and direction
g) Location
11) A device for addition of ammonia to make a visible plume shall
be installed and operable.
12) The speed and direction of the M/T Vulcanus during waste
incineration shall be controlled in such a manner that the
incinerator plume does not contact any part of the ship at
any time because of wind (eddies) or any other reason. The
M/T Vulcanus shall stay under the main propulsion all the
time so that plume impingement on the ship may be avoided
by proper vectoring of the ship with respect to wind direc-
tion changes. Additionally, if the ship must assume a
course and speed to stay in the burn area and if that course
and speed result in undesirable plume conditions for safe
operation, then the incinerators shall be temporarily shut
down or revert to fuel oil until safe conditions can again
be met.
13) The Vulcanus should demonstrate the ability to remain in
constant 24-hour communication with the Johnston Island USAF
On Scene Coordinator by voice and by code, using frequencies
and channel appropriate to the area and to the conditions
of transmission and reception. The requirement supplements
but is not intended to supersede nor replace the existing
147
image:
more than 20°C at this time and must be restored to at least
the original level of 1280°C before the next burner is changed
over to Herbicide Orange.
8) Monitoring of the furnaces for temperature, and for complete-
ness of combustion, shall be in effect during the changeover,
The continuous record of temperature shall also be maintained
during this time.
9) The operational controls and monitoring panels shall be manned
at all times by a responsible individual to ensure the incin-
erators are operating within desired combustion parameters.
10) An automatic sealed monitoring device (black box) will be
installed to record incineration activities and temperatures
and camera to photograph the control panel every 15-30 minutes.
In addition, a manual log will also be kept, including:
a) Time, date
b) "Black box" temperature
c) Controller temperature reading
d) Waste feed rates
e) Switching of waste tanks
f) Wind speed and direction
g) Location
11) A device for addition of ammonia to make a visible plume shall
be installed and operable.
12) The speed and direction of the M/T Vulcanus during waste
incineration shall be controlled in such a manner that the
incinerator plume does not contact any part of the ship at
any time because of wind (eddies) or any other reason. The
M/T Vulcanus shall stay under the main propulsion all the
time so that plume impingement on the ship may be avoided
by proper vectoring of the ship with respect to wind direc-
tion changes. Additionally, if the ship must assume a
course and speed to stay in the burn area and if that course
and speed result in undesirable plume conditions for safe
operation, then the incinerators shall be temporarily shut
down or revert to fuel oil until safe conditions can again
be met.
13) The Vulcanus should demonstrate the ability to remain in
constant 24-hour communication with the Johnston Island USAF
On Scene Coordinator by voice and by code, using frequencies
and channel appropriate to the area and to the conditions
of transmission and reception. The requirement supplements
but is not intended to supersede nor replace the existing
147
image:
 communication equipment. Daily communication with the
Johnston Island USAF On Scene Coordinator shall be required
reporting test progress and conditions. Emergency condi-
tions shall be reported as soon as possible.
14) Personnel of the M/T Vulcanus shall give a briefing on ship
safety procedures and regulations. This shall include, but
not be limited to, the assignment of lifeboat seating posi-
tions and at least one lifeboat drill.
15} The M/T Vulcanus shall comply with all applicable U.S. Coast
Guard rules and regulations governing a ship of this class
and specification.
U.S. Air Force
1) Ambient air monitors shall be furnished to all members of
the TRW sampling/monitoring crew. These monitoring units
shall be analyzed at the Johnston Island Laboratory for
2,4-D, and 2,4,5-T. If TCDD analysis is required, this
shall be done by Wright State University.
2) Appropriate first aid and medical supplies and trained
medical personnel shall be available on Johnston Island to
respond to emergency situations on board the M/T Vulcanus.
Such facilities shall also be available to shipboard per-
sonnel while based on Johnston Island.
3) A plan shall be developed and available to cover emergency
rescue or medical requirements of TRW and Vulcanus person-
nel during operations at sea. An Air Force representative
shall brief all TRW personnel as well as key Vulcanus per-
sonnel (as determined by the ship's captain) regarding the
provisions of this plan.
TRW. Inc.
1) The M/T Vulcanus crew and any other shipboard personnel
boarding the M/T Vulcanus shall be briefed by USAF medical
personnel and the Project Safety Director.
2) Monitoring of the incinerator stacks for C0/C02 concentra-
tions shall be carried out by the TRW sampling/monitoring
crew. The CO/C02 determinations shall be used to assure
that the desired degree of combustion efficiency (99.9%)
is achieved during the incineration.
3) Sampling of the incinerator stacks for the determination of
2,4-D, 2,4,5-T and TCDD emissions, if any, shall be carried
out by the TRW sampling/monitoring crew. The 2,4-D and
2,4,5-T levels in the incinerator stacks shall be determined
onboard the M/T Vulcanus by the TRW sampling/monitoring
148
image:
communication equipment. Daily communication with the
Johnston Island USAF On Scene Coordinator shall be required
reporting test progress and conditions. Emergency condi-
tions shall be reported as soon as possible.
14) Personnel of the M/T Vulcanus shall give a briefing on ship
safety procedures and regulations. This shall include, but
not be limited to, the assignment of lifeboat seating posi-
tions and at least one lifeboat drill.
15} The M/T Vulcanus shall comply with all applicable U.S. Coast
Guard rules and regulations governing a ship of this class
and specification.
U.S. Air Force
1) Ambient air monitors shall be furnished to all members of
the TRW sampling/monitoring crew. These monitoring units
shall be analyzed at the Johnston Island Laboratory for
2,4-D, and 2,4,5-T. If TCDD analysis is required, this
shall be done by Wright State University.
2) Appropriate first aid and medical supplies and trained
medical personnel shall be available on Johnston Island to
respond to emergency situations on board the M/T Vulcanus.
Such facilities shall also be available to shipboard per-
sonnel while based on Johnston Island.
3) A plan shall be developed and available to cover emergency
rescue or medical requirements of TRW and Vulcanus person-
nel during operations at sea. An Air Force representative
shall brief all TRW personnel as well as key Vulcanus per-
sonnel (as determined by the ship's captain) regarding the
provisions of this plan.
TRW. Inc.
1) The M/T Vulcanus crew and any other shipboard personnel
boarding the M/T Vulcanus shall be briefed by USAF medical
personnel and the Project Safety Director.
2) Monitoring of the incinerator stacks for C0/C02 concentra-
tions shall be carried out by the TRW sampling/monitoring
crew. The CO/C02 determinations shall be used to assure
that the desired degree of combustion efficiency (99.9%)
is achieved during the incineration.
3) Sampling of the incinerator stacks for the determination of
2,4-D, 2,4,5-T and TCDD emissions, if any, shall be carried
out by the TRW sampling/monitoring crew. The 2,4-D and
2,4,5-T levels in the incinerator stacks shall be determined
onboard the M/T Vulcanus by the TRW sampling/monitoring
148
image:
 crew with the use of a benzene sampling train and a gas chro-
matograph. The maximum allowable combined 2, 4-0/2,4, 5-T
levels in the incinerator stacks shall be 130
4) An onboard ambient air monitoring system shall be used by
the TRW sampling/monitoring crew to monitor the 2,4-D/
2, 4, 5-T level in the galley, mess room and crews quarters,
the combustion room, and the deck areas to assure that the
atmosphere does not contain materials at or above a prohib-
ited level of concentration. These measurements shall not
be limited to only the times when sampling is taking place.
Measurements indicating the presence of combined 2, 4-0/2,4, 5-T
level above 2.0 mg/m^ shall be immediately reported and steps
shall be taken by the M/T Vulcanus personnel to correct the
situation.
149
image:
crew with the use of a benzene sampling train and a gas chro-
matograph. The maximum allowable combined 2, 4-0/2,4, 5-T
levels in the incinerator stacks shall be 130
4) An onboard ambient air monitoring system shall be used by
the TRW sampling/monitoring crew to monitor the 2,4-D/
2, 4, 5-T level in the galley, mess room and crews quarters,
the combustion room, and the deck areas to assure that the
atmosphere does not contain materials at or above a prohib-
ited level of concentration. These measurements shall not
be limited to only the times when sampling is taking place.
Measurements indicating the presence of combined 2, 4-0/2,4, 5-T
level above 2.0 mg/m^ shall be immediately reported and steps
shall be taken by the M/T Vulcanus personnel to correct the
situation.
149
image:
 ATTACHMENT A
FIRST AID
The first aid instructions in the event of chemical poisoning, as given in
J.B. Bailey and J.E. Swift "Pesticide Information and Safety Manual" (University
of California, Division of Agricultural Sciences, July 1968), are reproduced in
the next two pages. These first aid instructions are applicable to chemical
poisoning by Herbicide Orange.
150
image:
ATTACHMENT A
FIRST AID
The first aid instructions in the event of chemical poisoning, as given in
J.B. Bailey and J.E. Swift "Pesticide Information and Safety Manual" (University
of California, Division of Agricultural Sciences, July 1968), are reproduced in
the next two pages. These first aid instructions are applicable to chemical
poisoning by Herbicide Orange.
150
image:
 FIRST AID IN THE EVENT OF CHEMICAL POISONING
If You Are Along With the Victim...
FIRST — See that the victim is breathing; if not, give artificial
respiration.
SECOND — Decontaminate him immediately i.e., wash him off thoroughly.
Speed is essential!
THIRD - Call your physician.
NOTE: Do not substitute first aid for professional treatment.
First aid is only to relieve the patient before medical
help is reached.
If Another Person Is With You and the Victim...
Speed is essential; one person should begin first aid treatment while the
other calls a physician.
The physician will give you instructions. He will very likely tell you to
get the victim to the emergency room of a hospital. The equipment needed for
proper treatment is there. Only if this is impossible should the physician be
called to the site of the accident.
General
1. Give mouth-to-mouth artificial respiration if breathing has
stopped or is labored.
2. Stop exposure to the poison and if poison is on skin cleanse
the person, including hair and fingernails. If swallowed,
induce vomiting.
3. Save the pesticide container and material in it if any
remains; get readable label or name of chemical(s) for the
physician. If the poison is not known, save a sample of
the vomitus.
151
image:
FIRST AID IN THE EVENT OF CHEMICAL POISONING
If You Are Along With the Victim...
FIRST — See that the victim is breathing; if not, give artificial
respiration.
SECOND — Decontaminate him immediately i.e., wash him off thoroughly.
Speed is essential!
THIRD - Call your physician.
NOTE: Do not substitute first aid for professional treatment.
First aid is only to relieve the patient before medical
help is reached.
If Another Person Is With You and the Victim...
Speed is essential; one person should begin first aid treatment while the
other calls a physician.
The physician will give you instructions. He will very likely tell you to
get the victim to the emergency room of a hospital. The equipment needed for
proper treatment is there. Only if this is impossible should the physician be
called to the site of the accident.
General
1. Give mouth-to-mouth artificial respiration if breathing has
stopped or is labored.
2. Stop exposure to the poison and if poison is on skin cleanse
the person, including hair and fingernails. If swallowed,
induce vomiting.
3. Save the pesticide container and material in it if any
remains; get readable label or name of chemical(s) for the
physician. If the poison is not known, save a sample of
the vomitus.
151
image:
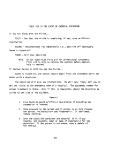 Specific
POISON ON SKIN
• Drench skin and clothing with water (shower, hose, faucet),
• Remove clothing.
• Cleanse skin and hair thoroughly with soap and water; rapidity
in washing is most important in reducing extent of injury.
• Dry and wrap in blanket.
POISON IN EYE
• Hold eyelids open, wash eyes with gentle stream of clean run-
ning water immediately. Use copious amounts. Delay of a
few seconds greatly increases extent of injury.
• Continue washing for 15 minutes or more.
• Do not use chemicals or drugs in wash water. They may
increase the extent of injury.
INHALED POISONS (Dusts, Vapors, Gases)
• If victim is in enclosed space, do not go in after him with-
out air-supplied respirator.
• Carry patient (do not let him walk) to fresh air immediately.
• Open all doors and windows, if any.
• Loosen all tight clothing.
• Apply artificial respiration if breathing has stopped or is
irregular.
• Call a physician.
• Prevent chilling (wrap patient in blankets but don't overheat
him).
• Keep patient as quiet as possible.
• If patient is convulsing, watch his breathing and protect him
from falling and striking his head on the floor or wall.
Keep his chin up so his air passage will remain free for
breating.
• Do not give alcohol in any form.
152
image:
Specific
POISON ON SKIN
• Drench skin and clothing with water (shower, hose, faucet),
• Remove clothing.
• Cleanse skin and hair thoroughly with soap and water; rapidity
in washing is most important in reducing extent of injury.
• Dry and wrap in blanket.
POISON IN EYE
• Hold eyelids open, wash eyes with gentle stream of clean run-
ning water immediately. Use copious amounts. Delay of a
few seconds greatly increases extent of injury.
• Continue washing for 15 minutes or more.
• Do not use chemicals or drugs in wash water. They may
increase the extent of injury.
INHALED POISONS (Dusts, Vapors, Gases)
• If victim is in enclosed space, do not go in after him with-
out air-supplied respirator.
• Carry patient (do not let him walk) to fresh air immediately.
• Open all doors and windows, if any.
• Loosen all tight clothing.
• Apply artificial respiration if breathing has stopped or is
irregular.
• Call a physician.
• Prevent chilling (wrap patient in blankets but don't overheat
him).
• Keep patient as quiet as possible.
• If patient is convulsing, watch his breathing and protect him
from falling and striking his head on the floor or wall.
Keep his chin up so his air passage will remain free for
breating.
• Do not give alcohol in any form.
152
image:
 SWALLOWED POISONS
• CALL A PHYSICIAN IMMEDIATELY
• DO NOT induce vomiting if;
1) Patient is in a coma or unconscious.
2) Patient is in convulsions
3) Patient has swallowed petroleum products (that is, kero-
sene, gasoline, lighter fluid).
4) Patient has swallowed a corrosive poison (strong acid or
alkaline products); symptoms: severe pain, burning sen-
sation in mouth and throat.
• If the patient can swallow after ingesting a corrosive poison,
give the following substances by mouth. A corrosive substance
is any material which in contact with living tissue will cause
destruction of tissue by chemical action such as lye, acids,
Lysol, etc.
For acids: milk, water, or milk of magnesia (1 tablespoon
to cup of water).
For alkali: milk or water; for patients 1-5 years old, 1 to
2 cups; for patients 5 years and older, up to 1 quart.
IF POSSIBLE INDUCE VOMITING WHEN NON-CORROSIVE
SUBSTANCE HAS BEEN SWALLOWED
• Give milk or water (for patient 1-5 years old - 1 to 2 cups;
for patients over 5 years — up to 1 quart).
• Induce vomiting by placing the blunt end of a spoon .not the
handle, or your finger at the back of the patient's throat,
or by use of this emetic - 2 tablespoons of salt in a glass
of warm water.
• When retching and vomiting begin, place patient face down
with head lowered, thus preventing vomitus from entering
lungs and causing further damage. Do not let him lie on
his back.
• Do not waste excessive time in inducing vomiting if the hos-
pital is a long distance away. It is better to spend the
time getting the patient to the hospital where drugs can be
administered to induce vomiting and/or stomach pumps are
available.
• Clean vomitus from person. Collect some in case physician
needs it for chemical tests.
153
image:
SWALLOWED POISONS
• CALL A PHYSICIAN IMMEDIATELY
• DO NOT induce vomiting if;
1) Patient is in a coma or unconscious.
2) Patient is in convulsions
3) Patient has swallowed petroleum products (that is, kero-
sene, gasoline, lighter fluid).
4) Patient has swallowed a corrosive poison (strong acid or
alkaline products); symptoms: severe pain, burning sen-
sation in mouth and throat.
• If the patient can swallow after ingesting a corrosive poison,
give the following substances by mouth. A corrosive substance
is any material which in contact with living tissue will cause
destruction of tissue by chemical action such as lye, acids,
Lysol, etc.
For acids: milk, water, or milk of magnesia (1 tablespoon
to cup of water).
For alkali: milk or water; for patients 1-5 years old, 1 to
2 cups; for patients 5 years and older, up to 1 quart.
IF POSSIBLE INDUCE VOMITING WHEN NON-CORROSIVE
SUBSTANCE HAS BEEN SWALLOWED
• Give milk or water (for patient 1-5 years old - 1 to 2 cups;
for patients over 5 years — up to 1 quart).
• Induce vomiting by placing the blunt end of a spoon .not the
handle, or your finger at the back of the patient's throat,
or by use of this emetic - 2 tablespoons of salt in a glass
of warm water.
• When retching and vomiting begin, place patient face down
with head lowered, thus preventing vomitus from entering
lungs and causing further damage. Do not let him lie on
his back.
• Do not waste excessive time in inducing vomiting if the hos-
pital is a long distance away. It is better to spend the
time getting the patient to the hospital where drugs can be
administered to induce vomiting and/or stomach pumps are
available.
• Clean vomitus from person. Collect some in case physician
needs it for chemical tests.
153
image:
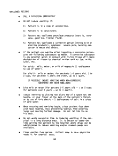 CHEMICAL BURNS OF SKIN
• Wash with large quantities of running water.
• Remove contaminated clothing.
• Immediately cover with loosely applied clean cloth, any kind
will do, depending on the size of the area burned.
• Avoid use of ointments, greases, powders, and other drugs in
first aid treatment of burns.
• Treat shock by keeping patient flat, keeping him warm, and
reassuring him until arrival of physician.
154
image:
CHEMICAL BURNS OF SKIN
• Wash with large quantities of running water.
• Remove contaminated clothing.
• Immediately cover with loosely applied clean cloth, any kind
will do, depending on the size of the area burned.
• Avoid use of ointments, greases, powders, and other drugs in
first aid treatment of burns.
• Treat shock by keeping patient flat, keeping him warm, and
reassuring him until arrival of physician.
154
image:
 APPENDIX B
TOXICOLOGICAL PROPERTIES OF
2,4-D, 2,4,5-T AND TCDD
155
image:
APPENDIX B
TOXICOLOGICAL PROPERTIES OF
2,4-D, 2,4,5-T AND TCDD
155
image:
 TOXICOLOGICAL PROPERTIES OF 2,4*0, 2,4,5-T AND TCDD
The toxicological properties of 2,4-D, 2,4,5-T and TCDD, as compiled by
the U.S. Air Force in the Report "Amendment to the Final Environmental State-
ment on the Disposition of Orange Herbicide by Incineration," October 1976,
are included in the following pages.
156
image:
TOXICOLOGICAL PROPERTIES OF 2,4*0, 2,4,5-T AND TCDD
The toxicological properties of 2,4-D, 2,4,5-T and TCDD, as compiled by
the U.S. Air Force in the Report "Amendment to the Final Environmental State-
ment on the Disposition of Orange Herbicide by Incineration," October 1976,
are included in the following pages.
156
image:
 4. TOXICOLOGICAL AND ECOLOGICAL CHARACTERISTICS OF CHLOROPHENOXY HERBI-
CIDES PERTINENT TO POTENTIAL BIOLOGICAL EFFECTS OF N-BUTYL ESTERS OF 2,4-D AND
2,4,5-T: There have been many scientific studies to determine the behavior of
chlorophenoxy herbicides in plant and animal systems under varied environmental
conditions. The following paragraphs are not meant to list all those studies.
Rather, the purpose is to logically describe the known and probable behavior of
Orange herbicide components in biological systems by utilizing the most current
and relative information obtainable from the literature and from studies at
EHL(K). It is important to note at the outset that in biological systems and
aquatic systems the N-butyl esters (NBE) of 2,4-D and 2,4,5-T can hydrolyze.
Thus, the behavior of the pure acids and their salts are also pertinent and
will be discussed in the following paragraphs along with characteristics of
ester forms. The differences in toxic effects produced by the various salts,
amines and esters of 2,4-D and 2,4,5-T can often be explained on a pharmaco-
kinetic basis in which the concentrations at the receptor sites in the organism
depends on the absorption and distribution rates in relation to the rates of
metabolism and excretion. The rate of absorption into plants or animals will
be dependent upon various interrelated factors such as route of entry and rate
of membrane transport. Specific membrane transport rate will depend upon the
characteristics of the membrane in relation to the size, shape, polarity and
lipid solubility of the particular herbicide molecule being considered in each
cited study.
a. Behavior in Terrestrial Animals
(1) Metabolism and Excretion Kinetics: Most of the data derived
from acute toxicity studies indicate that neither 2,4-D nor 2,4,5-T are partic-
ularly toxic. (Gleason £t al_., 1969; Bjorklund and Erne, 1966). In the rat,
the single dose, LD50 ranges from about 250-270 mg/kg depending on the forms of
chemical administered (Christensen, 1971). Several workers have suggested that
part of the reason for this lack of toxicity is that the excretion of the herbi-
cides is very rapid in most mammals (Clark e£ ajL, 1964; Khanna and Fang, 1966).
Most studies indicate that animals possessing highly developed renal function
will rapidly eliminate 2,4-D and 2,4,5-T by active tubular secretion. Cattle
and rabbits, which normally actively metabolize compounds mostly by acetylation,
excrete 2,4-D and 2,4,5-T in the urine mostly unchanged. Erne, (1966) found
157
image:
4. TOXICOLOGICAL AND ECOLOGICAL CHARACTERISTICS OF CHLOROPHENOXY HERBI-
CIDES PERTINENT TO POTENTIAL BIOLOGICAL EFFECTS OF N-BUTYL ESTERS OF 2,4-D AND
2,4,5-T: There have been many scientific studies to determine the behavior of
chlorophenoxy herbicides in plant and animal systems under varied environmental
conditions. The following paragraphs are not meant to list all those studies.
Rather, the purpose is to logically describe the known and probable behavior of
Orange herbicide components in biological systems by utilizing the most current
and relative information obtainable from the literature and from studies at
EHL(K). It is important to note at the outset that in biological systems and
aquatic systems the N-butyl esters (NBE) of 2,4-D and 2,4,5-T can hydrolyze.
Thus, the behavior of the pure acids and their salts are also pertinent and
will be discussed in the following paragraphs along with characteristics of
ester forms. The differences in toxic effects produced by the various salts,
amines and esters of 2,4-D and 2,4,5-T can often be explained on a pharmaco-
kinetic basis in which the concentrations at the receptor sites in the organism
depends on the absorption and distribution rates in relation to the rates of
metabolism and excretion. The rate of absorption into plants or animals will
be dependent upon various interrelated factors such as route of entry and rate
of membrane transport. Specific membrane transport rate will depend upon the
characteristics of the membrane in relation to the size, shape, polarity and
lipid solubility of the particular herbicide molecule being considered in each
cited study.
a. Behavior in Terrestrial Animals
(1) Metabolism and Excretion Kinetics: Most of the data derived
from acute toxicity studies indicate that neither 2,4-D nor 2,4,5-T are partic-
ularly toxic. (Gleason £t al_., 1969; Bjorklund and Erne, 1966). In the rat,
the single dose, LD50 ranges from about 250-270 mg/kg depending on the forms of
chemical administered (Christensen, 1971). Several workers have suggested that
part of the reason for this lack of toxicity is that the excretion of the herbi-
cides is very rapid in most mammals (Clark e£ ajL, 1964; Khanna and Fang, 1966).
Most studies indicate that animals possessing highly developed renal function
will rapidly eliminate 2,4-D and 2,4,5-T by active tubular secretion. Cattle
and rabbits, which normally actively metabolize compounds mostly by acetylation,
excrete 2,4-D and 2,4,5-T in the urine mostly unchanged. Erne, (1966) found
157
image:
 that in the rat, rabbit, calf and chicken, 2,4-D and 2,4,5-T had a biological
half-life varying from three to twelve hours and that urinary excretion was the
most common route of elimination. Data exist to indicate that only very small
amounts of 2,4-D are metabolized by the rabbit (Clark et^ aJL, 1964; Kahnna and
Fang, 1966). Berndt and Koschier (1973) studied the in vitro uptake of 2,4-D
and 2,4,5-T by the renal cortical tissue of rabbits and rats. Renal cortical
slices from both species accumulate 2,4-D and 2,4,5-T with greater uptake occur-
ring in rabbit tissue. Nitrogen and various metabolic inhibitors reduced the
uptake thus indicating that both of these organic acid herbicides are trans-
ported by the renal organic anion mechanism. Berndt and Koschier (1973) con-
cluded that renal tubular transport by the organic anion mechanism may account
for the relatively rapid disappearance of these compounds and this may account
for their low toxicity.
(2) Absorption and Distribution: The most common route of acci-
dental absorption of chlorophenoxy herbicide in terrestrial animals is via
ingestion. This is especially true in herbivores. However, absorption of toxic
doses via inhalation and cutaneous routes is possible, if uncommon. The liter-
ature indicates that gastric absorption of 2,4-D and 2,4,5-T and their amines
and alkali salts occur readily as would be predicted from classical Henderson-
Hasselbalch relationships. However, the gastro-intestinal absorption of 2,4-D
in the form of an ester may be incomplete. Erne (1966) administered 2,4-D ester
orally and found no detectable esters in the plasma. However, detection of low
levels of 2,4-D in the plasma indicated that some hydrolysis of the ester had
occurred. Erne (1966) in studies with rats, calves, chickens, and pigs found
that the highest tissue levels of 2,4-D and 2,4,5-T were found in liver, kidney,
lung and spleen, the levels sometimes exceeding the plasma level. In blood
cells, 10-20% of the plasma level was found. Penetration of 2,4-D into adipose
tissue and into the central nervous system was restricted, whereas a ready pla-
cental transfer was demonstrated in swine. The distribution pattern did not
show any significant species or — in rats — sex differences. Klingman et al.
(1966) measured ppb amounts of 2,4-D in the milk from cows grazing on pasture
probably sprayed with esters of 2,4-D. However, these levels dropped to unde-
tectable amounts (<1 ppb) on the third day after the pasture had been sprayed.
158
image:
that in the rat, rabbit, calf and chicken, 2,4-D and 2,4,5-T had a biological
half-life varying from three to twelve hours and that urinary excretion was the
most common route of elimination. Data exist to indicate that only very small
amounts of 2,4-D are metabolized by the rabbit (Clark et^ aJL, 1964; Kahnna and
Fang, 1966). Berndt and Koschier (1973) studied the in vitro uptake of 2,4-D
and 2,4,5-T by the renal cortical tissue of rabbits and rats. Renal cortical
slices from both species accumulate 2,4-D and 2,4,5-T with greater uptake occur-
ring in rabbit tissue. Nitrogen and various metabolic inhibitors reduced the
uptake thus indicating that both of these organic acid herbicides are trans-
ported by the renal organic anion mechanism. Berndt and Koschier (1973) con-
cluded that renal tubular transport by the organic anion mechanism may account
for the relatively rapid disappearance of these compounds and this may account
for their low toxicity.
(2) Absorption and Distribution: The most common route of acci-
dental absorption of chlorophenoxy herbicide in terrestrial animals is via
ingestion. This is especially true in herbivores. However, absorption of toxic
doses via inhalation and cutaneous routes is possible, if uncommon. The liter-
ature indicates that gastric absorption of 2,4-D and 2,4,5-T and their amines
and alkali salts occur readily as would be predicted from classical Henderson-
Hasselbalch relationships. However, the gastro-intestinal absorption of 2,4-D
in the form of an ester may be incomplete. Erne (1966) administered 2,4-D ester
orally and found no detectable esters in the plasma. However, detection of low
levels of 2,4-D in the plasma indicated that some hydrolysis of the ester had
occurred. Erne (1966) in studies with rats, calves, chickens, and pigs found
that the highest tissue levels of 2,4-D and 2,4,5-T were found in liver, kidney,
lung and spleen, the levels sometimes exceeding the plasma level. In blood
cells, 10-20% of the plasma level was found. Penetration of 2,4-D into adipose
tissue and into the central nervous system was restricted, whereas a ready pla-
cental transfer was demonstrated in swine. The distribution pattern did not
show any significant species or — in rats — sex differences. Klingman et al.
(1966) measured ppb amounts of 2,4-D in the milk from cows grazing on pasture
probably sprayed with esters of 2,4-D. However, these levels dropped to unde-
tectable amounts (<1 ppb) on the third day after the pasture had been sprayed.
158
image:
 (3) Acute Toxicity: One of the essential prerequisites in the
selection of a herbicide for defoliation programs is selective toxicity. Orange
herbicide is characterized by a low order of toxicity to man and terrestrial
animals. When properly applied, chlorophenoxy herbicides have presented very
minimal hazards to animal life in target areas. The acute oral toxicity of
Orange herbicide is summarized below. The data are expressed as LD5Qs in units
of mg of chemical per kg of body weight. This is the single oral dose which
was lethal for 50% of the test species. Orange herbicide ID™: rat 566,
sheep 250 and cattle 250. The oral toxicities of 2,4-D and 2,4,5-T are quite
similar to those of Orange herbicide (e.g., the acute oral LDcn of 2,4-D and
2,4,5-T in the rat are 620 and 480 mg/kg, respectively). Table B-l and B-2
summarize the results of several acute toxicity studies with various salt, ester
and amine forms of 2,4-D and 2,4,5-T.
(4) Chronic Toxicity: Because of the active secretion of chloro-
phenoxy herbicides, rather large amounts must be administered over a long period
of time to produce symptoms of toxicity. Enormous amounts of Orange herbicide
were applied to test plots at Eglin AFB without visible toxic effects or develop-
ment of herbicide residues in the native animals in the test plots (Young, 1973).
In :one study, (Palmer and Radeleff, 1964) sheep were given 2 gm of the acid
daily and sacrificed on the day following the final dose. Residues in the tis-
sues were less than 1 ppm in all tissues and usually less than 0.05 ppm, which
was the sensitivity of the analytical method. Mitchell and co-workers (1946)
pastured sheep and cattle on treated foliage without harmful effects to the
animals. They also fed a lactating cow 5.5 gm of 2,4-D daily for 106 days with-
out producing poisoning. Palmer (1963) found that cattle were not harmed by
112 daily doses (administered 5 days each week) of 5 mg/kg of alkanolamine salt
and that 44 daily doses of 200 mg/kg or 20 doses of 250 mg/kg were required to
produce fatal poisoning. Palmer Radeleff (1964) reported that sheep were given
481 daily doses of 100 mg/kg doses of 2,4-D without producing poisoning.
2,4,5-T has not been investigated as thoroughly as 2,4-D, but the reaction of
cattle and sheep to massive doses would indicate that absorption and excretion
must follow a similar pattern. A study by Palmer and Radeleff (1964) showed
that sheep required 369 doses of 100 mg/kg each to induce intoxication. The
above results are summarized in Table B-3.
159
image:
(3) Acute Toxicity: One of the essential prerequisites in the
selection of a herbicide for defoliation programs is selective toxicity. Orange
herbicide is characterized by a low order of toxicity to man and terrestrial
animals. When properly applied, chlorophenoxy herbicides have presented very
minimal hazards to animal life in target areas. The acute oral toxicity of
Orange herbicide is summarized below. The data are expressed as LD5Qs in units
of mg of chemical per kg of body weight. This is the single oral dose which
was lethal for 50% of the test species. Orange herbicide ID™: rat 566,
sheep 250 and cattle 250. The oral toxicities of 2,4-D and 2,4,5-T are quite
similar to those of Orange herbicide (e.g., the acute oral LDcn of 2,4-D and
2,4,5-T in the rat are 620 and 480 mg/kg, respectively). Table B-l and B-2
summarize the results of several acute toxicity studies with various salt, ester
and amine forms of 2,4-D and 2,4,5-T.
(4) Chronic Toxicity: Because of the active secretion of chloro-
phenoxy herbicides, rather large amounts must be administered over a long period
of time to produce symptoms of toxicity. Enormous amounts of Orange herbicide
were applied to test plots at Eglin AFB without visible toxic effects or develop-
ment of herbicide residues in the native animals in the test plots (Young, 1973).
In :one study, (Palmer and Radeleff, 1964) sheep were given 2 gm of the acid
daily and sacrificed on the day following the final dose. Residues in the tis-
sues were less than 1 ppm in all tissues and usually less than 0.05 ppm, which
was the sensitivity of the analytical method. Mitchell and co-workers (1946)
pastured sheep and cattle on treated foliage without harmful effects to the
animals. They also fed a lactating cow 5.5 gm of 2,4-D daily for 106 days with-
out producing poisoning. Palmer (1963) found that cattle were not harmed by
112 daily doses (administered 5 days each week) of 5 mg/kg of alkanolamine salt
and that 44 daily doses of 200 mg/kg or 20 doses of 250 mg/kg were required to
produce fatal poisoning. Palmer Radeleff (1964) reported that sheep were given
481 daily doses of 100 mg/kg doses of 2,4-D without producing poisoning.
2,4,5-T has not been investigated as thoroughly as 2,4-D, but the reaction of
cattle and sheep to massive doses would indicate that absorption and excretion
must follow a similar pattern. A study by Palmer and Radeleff (1964) showed
that sheep required 369 doses of 100 mg/kg each to induce intoxication. The
above results are summarized in Table B-3.
159
image:
 TABLE B-l, ACUTE TOXICITY OF 2,4-D DERIVATIVES
TO TERRESTRIAL ANIMALS
Derivative
Alkanolamine
Isopropyl ester
Isopropyl ester
Isopropyl ester
Butyl ester
Butyl ester
Butyl ester
PGBE
Acid
Acid
Triethanolamine
Triethanolamine
Butyl ester
Triethanolamine
Butyl ester
Isopropyl ester
Unspecified amine
Acid
Acid
Animal
Chick
Rat
Chicks
Guinea pig
Rat
Guinea pig
Chicks
Rat
Dog
Chick
Swine
Swine
Swine
Chicken
Rat
Rat
Mallard duck
Pheasant
Mule deer
Dose
380-765 mg/kg
700 mg/kg
1420 mg/kg
550 mg/kg
620 mg/kg
848 mg/kg
2000 mg/kg
570 mg/kg
100 mg/kg
541 mg/kg
50 mg/kg
500 mg/kg
100 mg/kg
300 mg/kg
620 mg/kg
700 mg/kg
2000 mg/kg
472 mg/kg
400-800 mg/kg
Effect
LD50
LD50
LD50
LD50
LD50
LD50
LD50
LD50
LD50
LD50
No effect
Lethal
No effect
No effect
LD50
LD50
LD™
ou
LD50
ou
LD50
DU
Reference
Rowe, e^aJL (1954)
Rowe, et al_. (1954)
Rowe, et_al_. (1954)
Rowe, et.al_. (9154)
Rowe, et_aj_. (1954)
Rowe, et al_. (1954)
Rowe, et_al_. (1954)
Rowe, et §1. (1954)
Rowe, et al_. (1954)
Rowe, et_al_. (1954)
Bjorklund & Erne
(1966)
Bjorklund & Erne
(1966)
Bjorklund & Erne
(1966)
Bjorklund & Erne
(1966)
Edson et al_. (1964)
Hayes, (1963)
Tucker & Crabtree
(1970)
Tucker & Crabtree
(1970)
tucker & Crabtree
(1970)
160
image:
TABLE B-l, ACUTE TOXICITY OF 2,4-D DERIVATIVES
TO TERRESTRIAL ANIMALS
Derivative
Alkanolamine
Isopropyl ester
Isopropyl ester
Isopropyl ester
Butyl ester
Butyl ester
Butyl ester
PGBE
Acid
Acid
Triethanolamine
Triethanolamine
Butyl ester
Triethanolamine
Butyl ester
Isopropyl ester
Unspecified amine
Acid
Acid
Animal
Chick
Rat
Chicks
Guinea pig
Rat
Guinea pig
Chicks
Rat
Dog
Chick
Swine
Swine
Swine
Chicken
Rat
Rat
Mallard duck
Pheasant
Mule deer
Dose
380-765 mg/kg
700 mg/kg
1420 mg/kg
550 mg/kg
620 mg/kg
848 mg/kg
2000 mg/kg
570 mg/kg
100 mg/kg
541 mg/kg
50 mg/kg
500 mg/kg
100 mg/kg
300 mg/kg
620 mg/kg
700 mg/kg
2000 mg/kg
472 mg/kg
400-800 mg/kg
Effect
LD50
LD50
LD50
LD50
LD50
LD50
LD50
LD50
LD50
LD50
No effect
Lethal
No effect
No effect
LD50
LD50
LD™
ou
LD50
ou
LD50
DU
Reference
Rowe, e^aJL (1954)
Rowe, et al_. (1954)
Rowe, et_al_. (1954)
Rowe, et.al_. (9154)
Rowe, et_aj_. (1954)
Rowe, et al_. (1954)
Rowe, et_al_. (1954)
Rowe, et §1. (1954)
Rowe, et al_. (1954)
Rowe, et_al_. (1954)
Bjorklund & Erne
(1966)
Bjorklund & Erne
(1966)
Bjorklund & Erne
(1966)
Bjorklund & Erne
(1966)
Edson et al_. (1964)
Hayes, (1963)
Tucker & Crabtree
(1970)
Tucker & Crabtree
(1970)
tucker & Crabtree
(1970)
160
image:
 TABLE B-2, ACUTE TOXICITY OF 2,4,5-T DERIVATIVES
TO TERRESTRIAL ANIMALS
Derivative
Acid
Isopropyl ester
Butyl ester
Amy! ester
Animal
Rat
Mice
Mice
Rat
Dose
500 rag/ kg
551 rag/ kg
940 rag/ kg
750 rag/ kg
Effect
LD50
LD50
LD50
LD50
Reference
Rowe & Hymas
(1954)
Rowe & Hymas
(1954)
Rowe & Hymas
(1954)
Rowe & Hymas
(1954)
b. Behavior in Humans: Gehring £t al_., (1973) studied the effects of
2,4,5-T at a dose level of 5 mg/kg ingested directly in a slurry of milk. Ana-
lytical grade 2,4,5-T having a purity of greater than 99% and containing less
than the detectable level 0.05 ppm, of TCDD was used. Complete medical histories,
physical and laboratory studies were accomplished before and repeated after the
study. It was found that the clearances of 2,4,5-T and the excretion from the
body were by first-order rate processes with half-lives of 23.10 and 23.06 hours,
respectively. Essentially all of the ingested 2,4,5-T was absorbed into the
body and was excreted unchanged in the urine. . Following ingestion, 65% of the
2,4,5-T remained in the plasma where 98% was reversibly bound to the plasma
proteins. "No untoward effects associated with the ingestion of 5 mg/kg,
2,4,5-T were detected in any of the subjects." (Gehring ejt al_., 1973) A metal-
lic taste lasting 1-2 hours following ingestion was reported by most of the sub-
jects. It was also concluded that essentially all of the ingested 2,4,5-T was
absorbed and then eliminated unchanged in the urine.
c. Behavior in Aquatic Systems and Aquatic Animals
(1) Metabolism and Distribution
(a) General Comparisons: The behavior of the chlorophenoxy
herbicides in non-mammalian aquatic animals is quite different than the behav-
ior described for terrestrial mammals and birds. The herbicides have a greater
toxic potential for aquatic animals. First, the route of entry is different in
161
image:
TABLE B-2, ACUTE TOXICITY OF 2,4,5-T DERIVATIVES
TO TERRESTRIAL ANIMALS
Derivative
Acid
Isopropyl ester
Butyl ester
Amy! ester
Animal
Rat
Mice
Mice
Rat
Dose
500 rag/ kg
551 rag/ kg
940 rag/ kg
750 rag/ kg
Effect
LD50
LD50
LD50
LD50
Reference
Rowe & Hymas
(1954)
Rowe & Hymas
(1954)
Rowe & Hymas
(1954)
Rowe & Hymas
(1954)
b. Behavior in Humans: Gehring £t al_., (1973) studied the effects of
2,4,5-T at a dose level of 5 mg/kg ingested directly in a slurry of milk. Ana-
lytical grade 2,4,5-T having a purity of greater than 99% and containing less
than the detectable level 0.05 ppm, of TCDD was used. Complete medical histories,
physical and laboratory studies were accomplished before and repeated after the
study. It was found that the clearances of 2,4,5-T and the excretion from the
body were by first-order rate processes with half-lives of 23.10 and 23.06 hours,
respectively. Essentially all of the ingested 2,4,5-T was absorbed into the
body and was excreted unchanged in the urine. . Following ingestion, 65% of the
2,4,5-T remained in the plasma where 98% was reversibly bound to the plasma
proteins. "No untoward effects associated with the ingestion of 5 mg/kg,
2,4,5-T were detected in any of the subjects." (Gehring ejt al_., 1973) A metal-
lic taste lasting 1-2 hours following ingestion was reported by most of the sub-
jects. It was also concluded that essentially all of the ingested 2,4,5-T was
absorbed and then eliminated unchanged in the urine.
c. Behavior in Aquatic Systems and Aquatic Animals
(1) Metabolism and Distribution
(a) General Comparisons: The behavior of the chlorophenoxy
herbicides in non-mammalian aquatic animals is quite different than the behav-
ior described for terrestrial mammals and birds. The herbicides have a greater
toxic potential for aquatic animals. First, the route of entry is different in
161
image:
 TABLE B-3. CHRONIC TOXICITY OF 2,4-D AND 2,4,5-T
DERIVATIVES TO TERRESTRIAL ANIMALS
o>
ro
Derivative Animal
Triethanolamine Swine
Triethanolamine Swine
Butyl ester Swine
Triethanolamine Swine
Triethanolamine Rats
Triethanolamine Chicken
Alkanolamine Sheep
Alkanolamine Cattle
Chronic Toxicity of 2,4-D
Dose Duration Effect
50/mg/ kg/day
50/mg/ kg/day
50/mg/kg/day
500 ppm in feed
1000 ppm in
water
1000 ppm in
water
100/mg/ kg/day
50/mg/kg/day
3 doses
8-10 doses
<5 doses
1 month
10 mos.
Daily from
hatching
through
first 2 mos.
of egg
production
481 days
112 days
None
Minor transient
effects
None
Some locomotory
disturbance,
depressed
growth rate, no
gross pathology
Depressed
growth rate, no
gross pathology
Egg size normal ,
production
reduced 30%
No effect
No effect
Reference
Bjorklund & Erne
(1966)
Bjorklund & Erne
(1966)
Bjorklund & Erne
(1966)
Bjorklund & Erne
(1966)
Bjorklund & Erne
(1966)
Bjorklund & Erne
(1966)
Palmer & Radeleff
(1964)
Palmer & Radeleff
(1964)
image:
TABLE B-3. CHRONIC TOXICITY OF 2,4-D AND 2,4,5-T
DERIVATIVES TO TERRESTRIAL ANIMALS
o>
ro
Derivative Animal
Triethanolamine Swine
Triethanolamine Swine
Butyl ester Swine
Triethanolamine Swine
Triethanolamine Rats
Triethanolamine Chicken
Alkanolamine Sheep
Alkanolamine Cattle
Chronic Toxicity of 2,4-D
Dose Duration Effect
50/mg/ kg/day
50/mg/ kg/day
50/mg/kg/day
500 ppm in feed
1000 ppm in
water
1000 ppm in
water
100/mg/ kg/day
50/mg/kg/day
3 doses
8-10 doses
<5 doses
1 month
10 mos.
Daily from
hatching
through
first 2 mos.
of egg
production
481 days
112 days
None
Minor transient
effects
None
Some locomotory
disturbance,
depressed
growth rate, no
gross pathology
Depressed
growth rate, no
gross pathology
Egg size normal ,
production
reduced 30%
No effect
No effect
Reference
Bjorklund & Erne
(1966)
Bjorklund & Erne
(1966)
Bjorklund & Erne
(1966)
Bjorklund & Erne
(1966)
Bjorklund & Erne
(1966)
Bjorklund & Erne
(1966)
Palmer & Radeleff
(1964)
Palmer & Radeleff
(1964)
image:
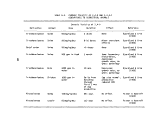 TABLE B-3. CHRONIC TOXICITY OF 2,4-D AND 2,4,5-T DERIVATIVES
TO TERRESTRIAL ANIMALS (Continued)
CO
Derivative
PGBE ester
Ethyl hexyl ester
Ethyl hexyl ester
Ethyl hexyl ester
Not specified
Not specified
Not specified
Alkanolamine
PGBE ester
Animal
Sheep
Cattle
Sheep
Sheep &
Cattle
Dog
Rat
Rat
Chicken
Chicken
Dose
100 mg/kg/day
250/mg/ kg/day
250/mg/ kg/day
100/mg/ kg/day
500 ppm in feed
1250 ppm in feed
500 ppm in feed
100 mg/kg/day
50 mg/kg/day
Duration
481 days
14 days
17 days
10 days
2 years
2 years
2 years
10 days
10 days
Effect
No effect
111 in 3 days,
survive and
recover from
9 doses. 14
doses lethal
111 in 3 days,
17 doses lethal
None to minor
effects
None
No effects on
growth, sur-
vival hermatol-
ogy or tumor
incidence
No effects in
reproduction
studies
No effect on
weight gain
No effect on
weight gain
Reference
Palmer & Radeleff
(1964)
Hunt, et al .
(T97DT
Hunt, et al .
(19707
Hunt, et al .
(19707
House, et al .
(1967F
House, et al .
(1967T
House, et al .
(196TT
Palmer & Radeleff
(1969)
Palmer & Radeleff
(1969)
image:
TABLE B-3. CHRONIC TOXICITY OF 2,4-D AND 2,4,5-T DERIVATIVES
TO TERRESTRIAL ANIMALS (Continued)
CO
Derivative
PGBE ester
Ethyl hexyl ester
Ethyl hexyl ester
Ethyl hexyl ester
Not specified
Not specified
Not specified
Alkanolamine
PGBE ester
Animal
Sheep
Cattle
Sheep
Sheep &
Cattle
Dog
Rat
Rat
Chicken
Chicken
Dose
100 mg/kg/day
250/mg/ kg/day
250/mg/ kg/day
100/mg/ kg/day
500 ppm in feed
1250 ppm in feed
500 ppm in feed
100 mg/kg/day
50 mg/kg/day
Duration
481 days
14 days
17 days
10 days
2 years
2 years
2 years
10 days
10 days
Effect
No effect
111 in 3 days,
survive and
recover from
9 doses. 14
doses lethal
111 in 3 days,
17 doses lethal
None to minor
effects
None
No effects on
growth, sur-
vival hermatol-
ogy or tumor
incidence
No effects in
reproduction
studies
No effect on
weight gain
No effect on
weight gain
Reference
Palmer & Radeleff
(1964)
Hunt, et al .
(T97DT
Hunt, et al .
(19707
Hunt, et al .
(19707
House, et al .
(1967F
House, et al .
(1967T
House, et al .
(196TT
Palmer & Radeleff
(1969)
Palmer & Radeleff
(1969)
image:
 TABLE B-3. CHRONIC TOXICITY OF 2,4-D AND 2,4,5-T DERIVATIVES
TO TERRESTRIAL ANIMALS (Continued)
cr>
Derivative Animal
PGBE ester Cattle
Acid Mule deer
Formulation Organism
Not specified Dog
Not specified Dog
PGBE ester Cattle
PGBE ester Sheep
PGBE ester Sheep
PGBE ester Chicken
Dose
100 mg/ kg/day
80 and 240
mg/kg/day
Chronic
Dose
10 mg/kg/day
20 mg/kg/day
100 mg/kg/day
50 mg/kg/day
100 mg/kg/day
100 mg/kg/day
Duration
10 days
30 days
Toxicity of 2,4,5-T
Duration
5 days per
wk. for 90
days
5 days per
wk. for 90
days
10 days
10 days
369 days
10 days
Effect
No effect
Minor symptoms
no weight loss
Effect
Minor weight
loss, no other
effects
Lethal between
11 and 75 days
None
None
(dosed by cap-
sule) 111 at
367 doses,
lethal at 369
No effect on
weight gain
Reference
Palmer & Radeleff
(1969)
Tucker and
Crabtree (1970)
Reference
Drill & Hiratzka
(1953)
Drill & Hiratzka
(1953)
Palmer & Radeleff
(1969)
Palmer & Radeleff
(1969)
Palmer & Radeleff
(1969)
Palmer & Radeleff
(1969)
image:
TABLE B-3. CHRONIC TOXICITY OF 2,4-D AND 2,4,5-T DERIVATIVES
TO TERRESTRIAL ANIMALS (Continued)
cr>
Derivative Animal
PGBE ester Cattle
Acid Mule deer
Formulation Organism
Not specified Dog
Not specified Dog
PGBE ester Cattle
PGBE ester Sheep
PGBE ester Sheep
PGBE ester Chicken
Dose
100 mg/ kg/day
80 and 240
mg/kg/day
Chronic
Dose
10 mg/kg/day
20 mg/kg/day
100 mg/kg/day
50 mg/kg/day
100 mg/kg/day
100 mg/kg/day
Duration
10 days
30 days
Toxicity of 2,4,5-T
Duration
5 days per
wk. for 90
days
5 days per
wk. for 90
days
10 days
10 days
369 days
10 days
Effect
No effect
Minor symptoms
no weight loss
Effect
Minor weight
loss, no other
effects
Lethal between
11 and 75 days
None
None
(dosed by cap-
sule) 111 at
367 doses,
lethal at 369
No effect on
weight gain
Reference
Palmer & Radeleff
(1969)
Tucker and
Crabtree (1970)
Reference
Drill & Hiratzka
(1953)
Drill & Hiratzka
(1953)
Palmer & Radeleff
(1969)
Palmer & Radeleff
(1969)
Palmer & Radeleff
(1969)
Palmer & Radeleff
(1969)
image:
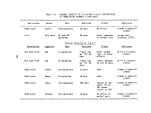 TABLE B-3. CHRONIC TOXICITY OF 2,4-D AND 2,4,5-T DERIVATIVES
TO TERRESTRIAL ANIMALS (Continued)
Formulation
Organism
Dose
Duration
Effect
Reference
Triethylamine Sheep
Not specified Mice
100 mg/kg/day
21 mg/kg/day
600 ppm in
diet.
481 days
4 weeks
18 months
No effect
No mortality
Palmer & Radeleff
(1964)
Innes, et al.
in
From Oregon E.I.S. (EIS-OR, 1973)
image:
TABLE B-3. CHRONIC TOXICITY OF 2,4-D AND 2,4,5-T DERIVATIVES
TO TERRESTRIAL ANIMALS (Continued)
Formulation
Organism
Dose
Duration
Effect
Reference
Triethylamine Sheep
Not specified Mice
100 mg/kg/day
21 mg/kg/day
600 ppm in
diet.
481 days
4 weeks
18 months
No effect
No mortality
Palmer & Radeleff
(1964)
Innes, et al.
in
From Oregon E.I.S. (EIS-OR, 1973)
image:
 most instances, The aquatic animal absorbs the herbicide which is distributed
throughout his total environment (.absorption is mainly via gills in fish),
Then, the differences in renal function must be considered, Generally, non-
mammlian aquatic animals do not have highly developed kidneys, Thus, once the
herbicide is in the aquatic animal's body, some metabolic changes must occur
in the molecule to make it more polar if it is to be excreted, Toxicity testing
is also necessarily different with aquatic animals. Usually, aquatic animals
are placed in a concentration of the toxicant to gradually absorb the material
at a rate depending on the animal's physiology and the behavior of the toxicant
in the particular water conditions. Therefore, the actual dose to each animal
is not known in most studies with aquatic animals. In contrast, toxicity stud-
ies with terrestrial animals usually allow calculation of a known dose per unit
weight of each animal. Thus, toxicities are often reported as "LD " (Lethal
4\f\ ^™
Dose) for terrestrial animals and "LC " (Lethal Concentration) for aquatic
XX
animals.
(b) Metabolism in Fish: Donald P. Shultz (Fish-Pesticide
Research Laboratory, Bureau of Sport Fisheries and Wildlife, 1973) studied the
14
uptake, distribution, and dissipation of C-label dimethyl amine salt of
2,4-D (DMA-2.4-D). Three species of fish were exposed to 0.5, 1.0 or 2.0 mg/1
concentrations of herbicide for up to 84 days exposure period. No mortalities
occurred, nor were adverse biological effects observed at these exposure levels.
The highest radioactive residue found in muscle tissue occurred in Bluegills
exposed to 2.0 mg/1 for 84 days (1.065 mg/kg). However, gas-liquid chromatog-
raphy indicated that over 90% of the radioactive residues consisted of metab-
olites of 2,4-D. The major metabolite in the fish was found to be 2,4-D glu-
curonic acid conjugate. Current investigations have found at least six
metabolites of 2,4-D in fish. Thus, in contrast to many of the organochlorine
pesticides which undergo biomagnification through the food chain, DMA-2,4-0 is
metabolized in fish without accumulation of the parent compound.
(.2) Behavior in Aquatic Systems
(a) Solubility Limits and Rates Vs. Hydrolysis Rates; The
esters of 2,4-D or 2,4,5-T found in Orange herbicide have a very limited solu-
bility in water. Because of this very low solubility, the actual concentrations
of esters produced in a body of water by accidental contamination would likely
166
image:
most instances, The aquatic animal absorbs the herbicide which is distributed
throughout his total environment (.absorption is mainly via gills in fish),
Then, the differences in renal function must be considered, Generally, non-
mammlian aquatic animals do not have highly developed kidneys, Thus, once the
herbicide is in the aquatic animal's body, some metabolic changes must occur
in the molecule to make it more polar if it is to be excreted, Toxicity testing
is also necessarily different with aquatic animals. Usually, aquatic animals
are placed in a concentration of the toxicant to gradually absorb the material
at a rate depending on the animal's physiology and the behavior of the toxicant
in the particular water conditions. Therefore, the actual dose to each animal
is not known in most studies with aquatic animals. In contrast, toxicity stud-
ies with terrestrial animals usually allow calculation of a known dose per unit
weight of each animal. Thus, toxicities are often reported as "LD " (Lethal
4\f\ ^™
Dose) for terrestrial animals and "LC " (Lethal Concentration) for aquatic
XX
animals.
(b) Metabolism in Fish: Donald P. Shultz (Fish-Pesticide
Research Laboratory, Bureau of Sport Fisheries and Wildlife, 1973) studied the
14
uptake, distribution, and dissipation of C-label dimethyl amine salt of
2,4-D (DMA-2.4-D). Three species of fish were exposed to 0.5, 1.0 or 2.0 mg/1
concentrations of herbicide for up to 84 days exposure period. No mortalities
occurred, nor were adverse biological effects observed at these exposure levels.
The highest radioactive residue found in muscle tissue occurred in Bluegills
exposed to 2.0 mg/1 for 84 days (1.065 mg/kg). However, gas-liquid chromatog-
raphy indicated that over 90% of the radioactive residues consisted of metab-
olites of 2,4-D. The major metabolite in the fish was found to be 2,4-D glu-
curonic acid conjugate. Current investigations have found at least six
metabolites of 2,4-D in fish. Thus, in contrast to many of the organochlorine
pesticides which undergo biomagnification through the food chain, DMA-2,4-0 is
metabolized in fish without accumulation of the parent compound.
(.2) Behavior in Aquatic Systems
(a) Solubility Limits and Rates Vs. Hydrolysis Rates; The
esters of 2,4-D or 2,4,5-T found in Orange herbicide have a very limited solu-
bility in water. Because of this very low solubility, the actual concentrations
of esters produced in a body of water by accidental contamination would likely
166
image:
 be much less than the "expected value" calculated from the volumes involved.
The USAF EHL(K) is in the process of studying the behavior of Orange herbicide
in aquatic systems especially sea water. In one study using artificial sea
water*, Orange herbicide was mixed into the water in an amount equal to 150 mg/1.
Had all components gone right into solution, by computation, ester concentrations
would have been 64 mg/1 C2.4-D NBE) and 61 mg/1 (2,4,5-T NBE). The actual,
measured concentrations were 2 mg/1 (2,4-D NBE) and 1.8 mg/1 (2,4,5-T NBE)
immediately after mixing. These increased to 18 and 22 mg/1 of 2,4-D NBE and
2,4,5-T NBE, respectively, at 24 hours and then started a rapid decline to 7.5
and 9.5 mg/1 at 48 hours after mixing. The rate of disappearance of the ester
of 2,4-D was fairly rapid and was assumed to be mainly a result of hydrolysis.
The half-life of the ester was 15 hours. The addition of natural biota such as
bacteria, algae and fish would be expected to produce an even faster disappear-
ance of 2,4-D NBE. Evidence that this occurs was observed in studies EHL(K) is
conducting with marine animals at the National Marine Fisheries Laboratory in
Port Aransas, Texas. In one of these studies, shrimp were exposed in five dif-
ferent concentrations of 2,4-D NBE and natural sea water. The average half-life
of the ester in the five concentrations was 5 hours. This was 1/3 of the half-
life observed in the situation where no biological systems existed.
(b) Circulation of Water in Relation to Availability of
Herbicide for Absorption: Some of the toxicity studies completed so far indi-
cate the complexity of trying to predict the ecological results of a planned
or accidental contamination of a body of water with phenoxy herbicides. At
EHL(K), Orange herbicide was mixed in a fish tank at a concentration that would
theoretically produce a 200 ppmv/v concentration if such a high concentration
were possible. Most of the herbicide rapidly sank to the bottom of the tank
after mixing. Fathead minnows placed in the tank showed no ill effects during
two weeks of exposure. Yet in a toxicity study under the same conditions but
with continuous agitation of the water by aeration, all of the fish died in a
"20 ppm concentration" of Orange herbicide water in 24 hours. Subsequent
studies revealed that some circulation of the water was essential if a dose-
related response was to be established in toxicity studies with the N-butyl
*
Instant Ocean Aquarium Systems, Inc., East Lake, Ohio,
167
image:
be much less than the "expected value" calculated from the volumes involved.
The USAF EHL(K) is in the process of studying the behavior of Orange herbicide
in aquatic systems especially sea water. In one study using artificial sea
water*, Orange herbicide was mixed into the water in an amount equal to 150 mg/1.
Had all components gone right into solution, by computation, ester concentrations
would have been 64 mg/1 C2.4-D NBE) and 61 mg/1 (2,4,5-T NBE). The actual,
measured concentrations were 2 mg/1 (2,4-D NBE) and 1.8 mg/1 (2,4,5-T NBE)
immediately after mixing. These increased to 18 and 22 mg/1 of 2,4-D NBE and
2,4,5-T NBE, respectively, at 24 hours and then started a rapid decline to 7.5
and 9.5 mg/1 at 48 hours after mixing. The rate of disappearance of the ester
of 2,4-D was fairly rapid and was assumed to be mainly a result of hydrolysis.
The half-life of the ester was 15 hours. The addition of natural biota such as
bacteria, algae and fish would be expected to produce an even faster disappear-
ance of 2,4-D NBE. Evidence that this occurs was observed in studies EHL(K) is
conducting with marine animals at the National Marine Fisheries Laboratory in
Port Aransas, Texas. In one of these studies, shrimp were exposed in five dif-
ferent concentrations of 2,4-D NBE and natural sea water. The average half-life
of the ester in the five concentrations was 5 hours. This was 1/3 of the half-
life observed in the situation where no biological systems existed.
(b) Circulation of Water in Relation to Availability of
Herbicide for Absorption: Some of the toxicity studies completed so far indi-
cate the complexity of trying to predict the ecological results of a planned
or accidental contamination of a body of water with phenoxy herbicides. At
EHL(K), Orange herbicide was mixed in a fish tank at a concentration that would
theoretically produce a 200 ppmv/v concentration if such a high concentration
were possible. Most of the herbicide rapidly sank to the bottom of the tank
after mixing. Fathead minnows placed in the tank showed no ill effects during
two weeks of exposure. Yet in a toxicity study under the same conditions but
with continuous agitation of the water by aeration, all of the fish died in a
"20 ppm concentration" of Orange herbicide water in 24 hours. Subsequent
studies revealed that some circulation of the water was essential if a dose-
related response was to be established in toxicity studies with the N-butyl
*
Instant Ocean Aquarium Systems, Inc., East Lake, Ohio,
167
image:
 esters of 2,4-D and 2,4,5-T, Thus, the actual effect seen in nature might
well depend on a factor such as the degree of mixing in the affected body of
water.
(c) Importance of Hydrolysis; It is important that when the
esters of 2,4-D and 2,4,5-T hydrolyze, their toxicity to aquatic animals is
decreased by almost a factor of 10 (paragraph (3)(b) below). In the static
situation described in the paragraph above (no aeration), the rate of hydroly-
sis was probably faster than the rate that the ester went into solution so
that lethal concentrations were never attained. Toxicity studies with fresh-
water and saltwater animals at EHL(K) have been the so-called "Static Bioassay"
in which no attempt is made to maintain a constant concentration of the herbi-
cide ester in each test chamber. "Concentrations" are theoretical and based
on volumes of herbicide and water mixed together rather than from analysis of
water to quantitate the herbicide. Most studies reported from literature are
of the same type. The toxicity tests at EHL(K) revealed that in both fresh-
water and saltwater, most of the test organisms had responded at twelve hours
of exposure. There was rarely any increase in mortality past 24 hours.
(d) Other Factors Affecting Actual Concentrations: Many other
factors can influence the concentration of N-butyl esters of 2,4-D and 2,4,5-T
in a body of water. In studies where large amounts of Orange herbicide were
placed in water, the globules of the herbicide appeared to become coated with
an opaque material that may have inhibited the ester from going into solution.
Cope (1970) treated ponds with 0.5 ppm to 10 ppm propylene glycol butyl ether
ester (PGBE) of 2,4-D. He was able to measure residues of herbicide absorbed
or adsorbed in vegetation and bottom sediment for 6 weeks after treatment in
the 10 ppm treated pond. Crosby (1966) reported that 2,4-D decomposes rapidly
in the presence of water and ultraviolet light.
(3) Toxicity
(a) Factors Affecting Toxicity; The toxicity of the chloro-
phenoxy herbicides to aquatic animals varies considerably with many factors
such as water chemistry variables, temperature, and the particular salt, ester
or amine form of the herbicide considered. Species susceptibility varies
168
image:
esters of 2,4-D and 2,4,5-T, Thus, the actual effect seen in nature might
well depend on a factor such as the degree of mixing in the affected body of
water.
(c) Importance of Hydrolysis; It is important that when the
esters of 2,4-D and 2,4,5-T hydrolyze, their toxicity to aquatic animals is
decreased by almost a factor of 10 (paragraph (3)(b) below). In the static
situation described in the paragraph above (no aeration), the rate of hydroly-
sis was probably faster than the rate that the ester went into solution so
that lethal concentrations were never attained. Toxicity studies with fresh-
water and saltwater animals at EHL(K) have been the so-called "Static Bioassay"
in which no attempt is made to maintain a constant concentration of the herbi-
cide ester in each test chamber. "Concentrations" are theoretical and based
on volumes of herbicide and water mixed together rather than from analysis of
water to quantitate the herbicide. Most studies reported from literature are
of the same type. The toxicity tests at EHL(K) revealed that in both fresh-
water and saltwater, most of the test organisms had responded at twelve hours
of exposure. There was rarely any increase in mortality past 24 hours.
(d) Other Factors Affecting Actual Concentrations: Many other
factors can influence the concentration of N-butyl esters of 2,4-D and 2,4,5-T
in a body of water. In studies where large amounts of Orange herbicide were
placed in water, the globules of the herbicide appeared to become coated with
an opaque material that may have inhibited the ester from going into solution.
Cope (1970) treated ponds with 0.5 ppm to 10 ppm propylene glycol butyl ether
ester (PGBE) of 2,4-D. He was able to measure residues of herbicide absorbed
or adsorbed in vegetation and bottom sediment for 6 weeks after treatment in
the 10 ppm treated pond. Crosby (1966) reported that 2,4-D decomposes rapidly
in the presence of water and ultraviolet light.
(3) Toxicity
(a) Factors Affecting Toxicity; The toxicity of the chloro-
phenoxy herbicides to aquatic animals varies considerably with many factors
such as water chemistry variables, temperature, and the particular salt, ester
or amine form of the herbicide considered. Species susceptibility varies
168
image:
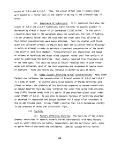 greatly. For example, the 96-hour TL^0* for fathead minnows exposed to DMA-
2,4-D was found to be 335 mg/1. Yet, for bluegills and channel catfish the
TL50 values were 177 and 193 respectively, A temperature increase from 17°C
to 20°C increased the relative toxicity to the catfish from TL5Q of 193 mg/1
to 125 mg/1 (Schultz, 1973).
(b) Toxicity Comparisons by EHL(K): The USAF EHL(K) (1974),
performed static toxicity studies with Orange herbicide. Also, toxicity studies
were performed using each individual N-butyl ester of 2,4-D and 2,4,5-T.
Freshwater bioassays using the fathead minnow (Pimephales promelas) resulted in
a 48 hr LC5Q of 3.4 ppm for Orange herbicide containing 14 ppm TCDD. The
48 hr LCrgS for esters of 2,4-D and 2,4,5-T were 2.8 ppm and 5 ppm respectively.
The 48 hr LC5Q for 2,4-D in the minnows was 270 ppm. The 2,4,5-T 48 hr LC5Q
concentration was 333 ppm. Note that the toxicity of ester formulations were
considerably more toxic than the respective acid. Also, EHL(K) found the
N-butyl ester of 2,4-D to be more toxic than the N-butyl ester of 2,4,5-T. In
saltwater studies by EHL(K), the 48 hr LCrg* values in the shrimp (Penaeus sp.)
were 5.6 ppm for 2,4-D NBE and 33 ppm for 2,4,5-T NBE. Oysters (Crassostrea
virginica) were exposed to "potential concentrations" of 2,4-D NBE ranging from
0.5 ppm to 85 ppm. The only acute effect observed was the death of one of the
oyster (10%) in the highest concentration at 48 hours.
(c) Other Animals and Other Effects; Many other aquatic
animals besides fish can be affected by phenoxy herbicides. Saunders (1971)
studied the effects of the propylene glycol butyl ether ester (PGBE) of 2,4-D
on six freshwater crusteceans. He found the following 48 hr TLgg* values:
Daphnia magna = 0.10 ppm, seed shrimp = 0.32 ppm, scud = 2.6 ppm, sowbug =
2.2 ppm, glass shrimp = 2.7 ppm, and crayfish had an unknown value larger than
100 ppm. Cope (1970) studied the chronic effects of PGBE ester of 2,4-D on the
TI-5Q and LCso (Tolerance LJmit and Lethal Concentration) are concentration
values statistically derived from the establishment of a dose-related response
of experimental organisms to a toxicant. The LC is based on a measured
response of death only, the TL is based on a count of unaffected organisms.
The subscript number for both indicates the percent response expected for the
calculated concentration. Therefore, in most cases, the TLso = LC5Q or the
concentration in which 50% death is expected. Note that a more toxic chemical
has a smaller LC$Q.
169
image:
greatly. For example, the 96-hour TL^0* for fathead minnows exposed to DMA-
2,4-D was found to be 335 mg/1. Yet, for bluegills and channel catfish the
TL50 values were 177 and 193 respectively, A temperature increase from 17°C
to 20°C increased the relative toxicity to the catfish from TL5Q of 193 mg/1
to 125 mg/1 (Schultz, 1973).
(b) Toxicity Comparisons by EHL(K): The USAF EHL(K) (1974),
performed static toxicity studies with Orange herbicide. Also, toxicity studies
were performed using each individual N-butyl ester of 2,4-D and 2,4,5-T.
Freshwater bioassays using the fathead minnow (Pimephales promelas) resulted in
a 48 hr LC5Q of 3.4 ppm for Orange herbicide containing 14 ppm TCDD. The
48 hr LCrgS for esters of 2,4-D and 2,4,5-T were 2.8 ppm and 5 ppm respectively.
The 48 hr LC5Q for 2,4-D in the minnows was 270 ppm. The 2,4,5-T 48 hr LC5Q
concentration was 333 ppm. Note that the toxicity of ester formulations were
considerably more toxic than the respective acid. Also, EHL(K) found the
N-butyl ester of 2,4-D to be more toxic than the N-butyl ester of 2,4,5-T. In
saltwater studies by EHL(K), the 48 hr LCrg* values in the shrimp (Penaeus sp.)
were 5.6 ppm for 2,4-D NBE and 33 ppm for 2,4,5-T NBE. Oysters (Crassostrea
virginica) were exposed to "potential concentrations" of 2,4-D NBE ranging from
0.5 ppm to 85 ppm. The only acute effect observed was the death of one of the
oyster (10%) in the highest concentration at 48 hours.
(c) Other Animals and Other Effects; Many other aquatic
animals besides fish can be affected by phenoxy herbicides. Saunders (1971)
studied the effects of the propylene glycol butyl ether ester (PGBE) of 2,4-D
on six freshwater crusteceans. He found the following 48 hr TLgg* values:
Daphnia magna = 0.10 ppm, seed shrimp = 0.32 ppm, scud = 2.6 ppm, sowbug =
2.2 ppm, glass shrimp = 2.7 ppm, and crayfish had an unknown value larger than
100 ppm. Cope (1970) studied the chronic effects of PGBE ester of 2,4-D on the
TI-5Q and LCso (Tolerance LJmit and Lethal Concentration) are concentration
values statistically derived from the establishment of a dose-related response
of experimental organisms to a toxicant. The LC is based on a measured
response of death only, the TL is based on a count of unaffected organisms.
The subscript number for both indicates the percent response expected for the
calculated concentration. Therefore, in most cases, the TLso = LC5Q or the
concentration in which 50% death is expected. Note that a more toxic chemical
has a smaller LC$Q.
169
image:
 bluegills. Survivors of ponds treated with high concentrations (10 and 5 ppm)
had a 2 week delay in spawning. For pathologic lesions, high-treatment fish
had earlier and more severe effects than did low-treatment fish. The pathology
involved the liver, vascular system and brain. Remarkably, growth of the fish
was faster in the ponds receiving the high-treatment than in the lower-treatment
ponds. Tables B-4 and B-5 were extracted from a U.S. Forest Service Environ-
mental Impact Statement (EIS-OR, 1973). The tables indicate the effects of
herbicides on other aquatic species and point out some toxic effects that can
be measured other than death of the organisms.
d. Behavior in Plants
(1) Distribution and Metabolism: Orange herbicide is a systematic
herbicide that affects plants by a hormonal type of action usually described
as "auxin-like" or "auxin-type." Auxins are any of a group of substances which
promote plant growth by cell elongation, bring about root formation, or cause
bud inhibition or other effects. 2,4-D and 2,4,5-T are compounds of this type.
When applied to leaves of a plant, chlorophenoxy herbicides are absorbed through
the cuticle into the plant system. The N-butyl ester forms of 2,4-D and 2,4,5-T
found in Orange herbicide are usually more effective than more polar forms
because of better absorption into the plant. This is also demonstrated in
Yamaguchi's work (1965) in which he found that 2,4-D moves into plant leaves
better from acidic solutions than from alkaline solutions. Approximately ten
times as much 2,4-D was absorbed from a medium having pH 3 than one with pH 11.
2,4-D has a pKa of 2.8 and would be highly disassociated at pH 11. Once the
herbicide is in the plant it is translocated to areas where food is being stored
as in rapidly growing new roots and shoots. The chlorophenoxy herbicides can
be stored in certain cells of the plant. Also, metabolism occurs through deg-
radation of the acetic acid side chain, hydroxylation of the aromatic ring, or
conjugation.
(2) Toxicity; Once in the plant, herbicides act by interfering
with the photosynthetic, respiratory, and other plant processes causing the
plant to lose its leaves and ultimately die. Plant susceptibility to sub-
lethal exposures of 2,4-D is markedly influenced by the growth condition of
the plant and by environmental factors. Since most of the injury is expressed
by growth response, the plant must be growing in order to show injury. In
170
image:
bluegills. Survivors of ponds treated with high concentrations (10 and 5 ppm)
had a 2 week delay in spawning. For pathologic lesions, high-treatment fish
had earlier and more severe effects than did low-treatment fish. The pathology
involved the liver, vascular system and brain. Remarkably, growth of the fish
was faster in the ponds receiving the high-treatment than in the lower-treatment
ponds. Tables B-4 and B-5 were extracted from a U.S. Forest Service Environ-
mental Impact Statement (EIS-OR, 1973). The tables indicate the effects of
herbicides on other aquatic species and point out some toxic effects that can
be measured other than death of the organisms.
d. Behavior in Plants
(1) Distribution and Metabolism: Orange herbicide is a systematic
herbicide that affects plants by a hormonal type of action usually described
as "auxin-like" or "auxin-type." Auxins are any of a group of substances which
promote plant growth by cell elongation, bring about root formation, or cause
bud inhibition or other effects. 2,4-D and 2,4,5-T are compounds of this type.
When applied to leaves of a plant, chlorophenoxy herbicides are absorbed through
the cuticle into the plant system. The N-butyl ester forms of 2,4-D and 2,4,5-T
found in Orange herbicide are usually more effective than more polar forms
because of better absorption into the plant. This is also demonstrated in
Yamaguchi's work (1965) in which he found that 2,4-D moves into plant leaves
better from acidic solutions than from alkaline solutions. Approximately ten
times as much 2,4-D was absorbed from a medium having pH 3 than one with pH 11.
2,4-D has a pKa of 2.8 and would be highly disassociated at pH 11. Once the
herbicide is in the plant it is translocated to areas where food is being stored
as in rapidly growing new roots and shoots. The chlorophenoxy herbicides can
be stored in certain cells of the plant. Also, metabolism occurs through deg-
radation of the acetic acid side chain, hydroxylation of the aromatic ring, or
conjugation.
(2) Toxicity; Once in the plant, herbicides act by interfering
with the photosynthetic, respiratory, and other plant processes causing the
plant to lose its leaves and ultimately die. Plant susceptibility to sub-
lethal exposures of 2,4-D is markedly influenced by the growth condition of
the plant and by environmental factors. Since most of the injury is expressed
by growth response, the plant must be growing in order to show injury. In
170
image:
 TABLE B-4. ACUTE EFFECTS OF 2,4-D DERIVATIVES UPON AQUATIC ANIMALS
Derivative
Isooctyl esters
(From 3
manufacturers )
PGBE ester
Butoxyethanol
ester
PGBE ester
PGBE ester
Alkanolanrine Salt
D i methyl am ine Salt
Isooctyl ester
Dimethyl ami ne Salt
Acetamide
Oil soluble amine
salt
PGBE Ester*
Butoxyethyl ester
Butyl and Isopro-
pyl esters, mixed
N,N-Dimethyl coco-
ami ne salt
Ethyl ester
Butyl Ester
Isopropyl ester
Animal
Bluegill
Bluegill
Bluegill
Shrimp
Fish
(saltwater)
Bluegill
Bluegill
Bluegill
Fathead
Minnow
Fathead
Minnow
Bluegill,
Fathead
Minnow
Bluegill,
Fathead
Minnow .
Bluegill &
Fathead
Bluegill
Bluegill
Bluegill
Bluegill
Bluegill
Concentration
10-31 ppm
17 ppm
1.4 ppm
1 ppm (48 hrs)
0.32 ppm
435-840 ppm
166-458 ppm
8.8-59.7 ppm
10 ppm
5 ppm
2 ppm
2 ppm
2 ppm
1.5-1.7 ppm
1.5 ppm
1.4 ppm
1,3 ppm
1.1 ppm
Effect
48 TLm
48 TLm
48 TLm
20% mortality
or paralysis
48 hr TLm
48 hr LC5Q
48 hr LC5Q
48 hr LC5Q
96 hr LC,n
Dl)
96 hr LC5Q
4 mo. LC1Q
4 mo. LC10
72 hr LC5Q
48 hr LC5Q
48 hr LC5Q
48 hr LCcn
ou
48 hr LC5Q
48 hr LC,n
DU
Reference
Hughes & Davis
(1963)
Hughes & Davis
(1963)
Hughes & Davis
(1963)
Butler (1965)
Butler (1965)
Lawrence (1966)
Lawrence (1966)
Lawrence (1966)
Lawrence (1966)
Lawrence (1966)
Lawrence (1966)
Lawrence (1966)
Lawrence (1966)
Lawrence (1966)
Lawrence (1966)
Lawrence (1966)
Lawrence (1966)
Lawrence (1966)
Propylene Glycol Butyl Ether
171
image:
TABLE B-4. ACUTE EFFECTS OF 2,4-D DERIVATIVES UPON AQUATIC ANIMALS
Derivative
Isooctyl esters
(From 3
manufacturers )
PGBE ester
Butoxyethanol
ester
PGBE ester
PGBE ester
Alkanolanrine Salt
D i methyl am ine Salt
Isooctyl ester
Dimethyl ami ne Salt
Acetamide
Oil soluble amine
salt
PGBE Ester*
Butoxyethyl ester
Butyl and Isopro-
pyl esters, mixed
N,N-Dimethyl coco-
ami ne salt
Ethyl ester
Butyl Ester
Isopropyl ester
Animal
Bluegill
Bluegill
Bluegill
Shrimp
Fish
(saltwater)
Bluegill
Bluegill
Bluegill
Fathead
Minnow
Fathead
Minnow
Bluegill,
Fathead
Minnow
Bluegill,
Fathead
Minnow .
Bluegill &
Fathead
Bluegill
Bluegill
Bluegill
Bluegill
Bluegill
Concentration
10-31 ppm
17 ppm
1.4 ppm
1 ppm (48 hrs)
0.32 ppm
435-840 ppm
166-458 ppm
8.8-59.7 ppm
10 ppm
5 ppm
2 ppm
2 ppm
2 ppm
1.5-1.7 ppm
1.5 ppm
1.4 ppm
1,3 ppm
1.1 ppm
Effect
48 TLm
48 TLm
48 TLm
20% mortality
or paralysis
48 hr TLm
48 hr LC5Q
48 hr LC5Q
48 hr LC5Q
96 hr LC,n
Dl)
96 hr LC5Q
4 mo. LC1Q
4 mo. LC10
72 hr LC5Q
48 hr LC5Q
48 hr LC5Q
48 hr LCcn
ou
48 hr LC5Q
48 hr LC,n
DU
Reference
Hughes & Davis
(1963)
Hughes & Davis
(1963)
Hughes & Davis
(1963)
Butler (1965)
Butler (1965)
Lawrence (1966)
Lawrence (1966)
Lawrence (1966)
Lawrence (1966)
Lawrence (1966)
Lawrence (1966)
Lawrence (1966)
Lawrence (1966)
Lawrence (1966)
Lawrence (1966)
Lawrence (1966)
Lawrence (1966)
Lawrence (1966)
Propylene Glycol Butyl Ether
171
image:
 TABLE B-5. NON-LETHAL EFFECTS OF 2,4-D DERIVATIVES
UPON AQUATIC ANIMALS
Derivative
Butoxyethanol
ester
Butoxyethanol
ester
Butoxyethanol
ester
Butoxyethanol
ester
Dime thy! ami ne
Dime thy 1 ami ne
Dimethyl ami ne
Dimethyl amine
Ethyl hexyl ester
Ethyl hexyl ester
Ethyl hexyl ester
Ethyl hexyl ester
PGBE IJ ester
PGBE I/ ester
PGBE I/ ester
Animal
Oyster
Shrimp
Fish
(saltwater)
Phyto-
plankton
Oyster
Shrimp
Fish
(saltwater)
Phyto-
plankton
Oyster
Shrimp
Fish
(saltwater)
Phyto-
plankton
Oyster
Shrimp
Fish
(saltwater)
Dose
3.75 ppm
(96 hrs)
1 ppm
(48 hrs)
5 ppm
1 ppm
2 ppm
(96 hrs)
2 ppm
(48 hrs)
15 ppm
(48 hrs)
1 ppm
(4 hrs)
5 ppm
(96 hrs)
2 ppm
(48 hrs)
10 ppm
(48 hrs)
1 ppm
(4 hrs)
1 ppm
(96 hrs)
1 ppm
(48 hrs)
4.5 ppm
Effect
50% decrease
in shell growth
No effect
48 hr. TLm
16% decrease
in C02 fixation
No effect on
shell growth
10% mortality
or paralysis
No effect
No effect on
C02 fixation
38% decrease
in shell growth
10% mortality
or paralysis
No effect
49% decrease
in C02 fixation
39% decrease
in shell growth
No effect
48 hr TLm
Reference
Butler (1965)
Butler (1965)
Butler (1965)
Butler (1965)
Butler (1965)
Butler (1965)
Butler (1965)
Butler (1965)
Butler (1965)
Butler (1965)
Butler (1965)
Butler (1965)
Butler (1965)
Butler (1965)
Butler (1965)
I/ PGBE is propylene glycol butyl ether.
172
image:
TABLE B-5. NON-LETHAL EFFECTS OF 2,4-D DERIVATIVES
UPON AQUATIC ANIMALS
Derivative
Butoxyethanol
ester
Butoxyethanol
ester
Butoxyethanol
ester
Butoxyethanol
ester
Dime thy! ami ne
Dime thy 1 ami ne
Dimethyl ami ne
Dimethyl amine
Ethyl hexyl ester
Ethyl hexyl ester
Ethyl hexyl ester
Ethyl hexyl ester
PGBE IJ ester
PGBE I/ ester
PGBE I/ ester
Animal
Oyster
Shrimp
Fish
(saltwater)
Phyto-
plankton
Oyster
Shrimp
Fish
(saltwater)
Phyto-
plankton
Oyster
Shrimp
Fish
(saltwater)
Phyto-
plankton
Oyster
Shrimp
Fish
(saltwater)
Dose
3.75 ppm
(96 hrs)
1 ppm
(48 hrs)
5 ppm
1 ppm
2 ppm
(96 hrs)
2 ppm
(48 hrs)
15 ppm
(48 hrs)
1 ppm
(4 hrs)
5 ppm
(96 hrs)
2 ppm
(48 hrs)
10 ppm
(48 hrs)
1 ppm
(4 hrs)
1 ppm
(96 hrs)
1 ppm
(48 hrs)
4.5 ppm
Effect
50% decrease
in shell growth
No effect
48 hr. TLm
16% decrease
in C02 fixation
No effect on
shell growth
10% mortality
or paralysis
No effect
No effect on
C02 fixation
38% decrease
in shell growth
10% mortality
or paralysis
No effect
49% decrease
in C02 fixation
39% decrease
in shell growth
No effect
48 hr TLm
Reference
Butler (1965)
Butler (1965)
Butler (1965)
Butler (1965)
Butler (1965)
Butler (1965)
Butler (1965)
Butler (1965)
Butler (1965)
Butler (1965)
Butler (1965)
Butler (1965)
Butler (1965)
Butler (1965)
Butler (1965)
I/ PGBE is propylene glycol butyl ether.
172
image:
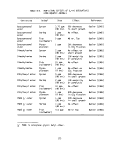 addition, plants in shaded areas respond more slowly than those exposed to
direct sunlight. Because of these various factors which affect plant response
to the 2,4-D type herbicide, differences in lists showing plant susceptibility
should be expected. Orange herbicide is effective on a wide variety of woody
and broadleaf plant species, Other lower plant forms can also be affected by
auxin-type herbicides. Even unicellular algae exhibit toxic effects or die when
exposed to 2,4-D or 2,4,5-T (Walsh, 1972). However, much higher doses of the
herbicides are required than for plants with a more complex structure.
(3) Herbicides as Air Pollutants: Although herbicides have long
been accepted as environmental pollutants which affect sensitive vegetation,
the air pollution aspects of volatile herbicides have not been widely explored.
However, there is growing evidence that some 2,4-D compounds may be present in
the ambient atmosphere in some parts of the United States at levels sufficient
to cause adverse growth effects on sensitive vegetation. During 1962 through
1964, Vernetti and Freed measured 2,4-D concentrations in air samples taken in
an agricultural area of eastern Oregon. Concurrently, they surveyed for auxin-
like plant damage in the areas where the air samples were taken. In the spring
of 1962, measured concentrations of the isopropyl ester of 2,4-D in the air
ranged from 0.015 ppm to 0.64 ppm. This was during the time of year when the
huge wheat fields of the area were being treated for weeds by aerial application
of the isopropyl ester. Plant damage to tomato crops appeared to coincide with
periods of highest measured concentrations of the isopropyl ester. Other plants,
especially locust trees, also showed growth regulator symptoms. Legislation
in the state curtailed the use of the isopropyl ester and decidedly reduced the
contamination and resulting plant damage. Laboratory studies by Vernetti and
Freed indicated that 0.015 ppm would be the threshold concentration of isopropyl
ester that tomato plants could be exposed to and still survive under the condi-
tions of the experiment. Volatility studies by the same workers demonstrated
that the isopropyl ester was three times more volatile than the butyl ester.
In fact, complex analyses of the air samples ruled out butyl and other esters
of 2,4-D as principal contaminants.
(4) Relative Species Sensitivity: Different researchers vary in
their results of relative plant sensitivity to phenoxy herbicides. From field
observations, grapevines and box elder appear to be among the most sensitive
173
image:
addition, plants in shaded areas respond more slowly than those exposed to
direct sunlight. Because of these various factors which affect plant response
to the 2,4-D type herbicide, differences in lists showing plant susceptibility
should be expected. Orange herbicide is effective on a wide variety of woody
and broadleaf plant species, Other lower plant forms can also be affected by
auxin-type herbicides. Even unicellular algae exhibit toxic effects or die when
exposed to 2,4-D or 2,4,5-T (Walsh, 1972). However, much higher doses of the
herbicides are required than for plants with a more complex structure.
(3) Herbicides as Air Pollutants: Although herbicides have long
been accepted as environmental pollutants which affect sensitive vegetation,
the air pollution aspects of volatile herbicides have not been widely explored.
However, there is growing evidence that some 2,4-D compounds may be present in
the ambient atmosphere in some parts of the United States at levels sufficient
to cause adverse growth effects on sensitive vegetation. During 1962 through
1964, Vernetti and Freed measured 2,4-D concentrations in air samples taken in
an agricultural area of eastern Oregon. Concurrently, they surveyed for auxin-
like plant damage in the areas where the air samples were taken. In the spring
of 1962, measured concentrations of the isopropyl ester of 2,4-D in the air
ranged from 0.015 ppm to 0.64 ppm. This was during the time of year when the
huge wheat fields of the area were being treated for weeds by aerial application
of the isopropyl ester. Plant damage to tomato crops appeared to coincide with
periods of highest measured concentrations of the isopropyl ester. Other plants,
especially locust trees, also showed growth regulator symptoms. Legislation
in the state curtailed the use of the isopropyl ester and decidedly reduced the
contamination and resulting plant damage. Laboratory studies by Vernetti and
Freed indicated that 0.015 ppm would be the threshold concentration of isopropyl
ester that tomato plants could be exposed to and still survive under the condi-
tions of the experiment. Volatility studies by the same workers demonstrated
that the isopropyl ester was three times more volatile than the butyl ester.
In fact, complex analyses of the air samples ruled out butyl and other esters
of 2,4-D as principal contaminants.
(4) Relative Species Sensitivity: Different researchers vary in
their results of relative plant sensitivity to phenoxy herbicides. From field
observations, grapevines and box elder appear to be among the most sensitive
173
image:
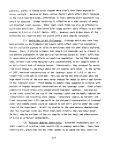 since they respond to 2,4-D air pollution when other plants showed no evidence
of injury. Injury to grapevines may result from exposure to levels in the ppb
range. Other workers report tomato plant damage in the ppt range. Walsh (1972)
reports a 50% reduction in growth of unicellur marine algae exposed to phenoxy
herbicide concentrations of 50 to 300 ppm. Other relative sensitivities are
indicated in Table B-6.
5. TOXICOLOGICAL CHARACTERISTICS OF TCDD: The word teratology has rather
recently become quite familiar to biologists, chemists and certain other per-
sons working in various scientific disciplines. It was applied to 2,4,5-T when
studies by Bionetics Research Laboratory, Division of Litton Industries,
Bethseda MD in 1969-70 implied that 2,4,5-T was teratogenic in mice and rats
(Courtney e_t al_., 1970). Subsequently, studies revealed that a toxic contami-
nant was responsible for the findings originally attributed to 2,4,5-T. The
sample of 2,4,5-T employed in the Bionetics study contained 27 ±8 ppm TCDD.
Some studies have shown that oral administration of 2,4,5-T containing <1 ppm
TCDD produces no teratogenic effects on rats, rabbits, mice and other species.
a. Toxicity to Animals: TCDD was found to be the most toxic chloro-
dibenzo-p-dioxin studied. It was found to have LD5Qs in the yg/kg range for
several species of animals and was acnegenic, highly embryotoxic and positive
for the chick edema factor. "The no-effect dose levels for embryotoxicity and
chick edema were 0.03 to 0.1 ug/kg/day respectively" (Schwetz e_t al_., 1973).
(1) Acute Toxicity; Studies performed on TCDD by the Biochemical
Research Laboratory, Dow Chemical Co., can be summarized as follows with the
data presented as the LDgQ in pg/kg of body weight for several species: rats
20-40; mice, males >64, females 130; guinea pig 0.6-2.0; rabbits =30; dogs >30
(Rowe et al_.> n.d.). The signs of intoxication are characterized by a chronic
illness and liver damage. Half of the deaths occur more than two weeks after
treatment while some animals died after 48 hours. Excretion is primarily by
way of feces and is very slow. The highest concentrations are found in the
liver and fat with a smaller amount being found in the testes. The LD5Q for
the rabbit is about the same whether administered intraperitoneally or applied
to the skin. In the eye it does not cause corneal injury but does produce
thickening of the lids. It does cause severe chloracne when applied to the
ears of rabbits in pg quantities.
174
image:
since they respond to 2,4-D air pollution when other plants showed no evidence
of injury. Injury to grapevines may result from exposure to levels in the ppb
range. Other workers report tomato plant damage in the ppt range. Walsh (1972)
reports a 50% reduction in growth of unicellur marine algae exposed to phenoxy
herbicide concentrations of 50 to 300 ppm. Other relative sensitivities are
indicated in Table B-6.
5. TOXICOLOGICAL CHARACTERISTICS OF TCDD: The word teratology has rather
recently become quite familiar to biologists, chemists and certain other per-
sons working in various scientific disciplines. It was applied to 2,4,5-T when
studies by Bionetics Research Laboratory, Division of Litton Industries,
Bethseda MD in 1969-70 implied that 2,4,5-T was teratogenic in mice and rats
(Courtney e_t al_., 1970). Subsequently, studies revealed that a toxic contami-
nant was responsible for the findings originally attributed to 2,4,5-T. The
sample of 2,4,5-T employed in the Bionetics study contained 27 ±8 ppm TCDD.
Some studies have shown that oral administration of 2,4,5-T containing <1 ppm
TCDD produces no teratogenic effects on rats, rabbits, mice and other species.
a. Toxicity to Animals: TCDD was found to be the most toxic chloro-
dibenzo-p-dioxin studied. It was found to have LD5Qs in the yg/kg range for
several species of animals and was acnegenic, highly embryotoxic and positive
for the chick edema factor. "The no-effect dose levels for embryotoxicity and
chick edema were 0.03 to 0.1 ug/kg/day respectively" (Schwetz e_t al_., 1973).
(1) Acute Toxicity; Studies performed on TCDD by the Biochemical
Research Laboratory, Dow Chemical Co., can be summarized as follows with the
data presented as the LDgQ in pg/kg of body weight for several species: rats
20-40; mice, males >64, females 130; guinea pig 0.6-2.0; rabbits =30; dogs >30
(Rowe et al_.> n.d.). The signs of intoxication are characterized by a chronic
illness and liver damage. Half of the deaths occur more than two weeks after
treatment while some animals died after 48 hours. Excretion is primarily by
way of feces and is very slow. The highest concentrations are found in the
liver and fat with a smaller amount being found in the testes. The LD5Q for
the rabbit is about the same whether administered intraperitoneally or applied
to the skin. In the eye it does not cause corneal injury but does produce
thickening of the lids. It does cause severe chloracne when applied to the
ears of rabbits in pg quantities.
174
image:
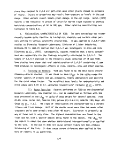 TABLE B-6. SENSITIVITY OF SELECTED PLANTS TO 2,4-DICHLOROPHENOXYACETIC ACID*
Sensitive
Apple
Malus, sp.
Hickory
Carya, sp.
Sumac
Rhus, sp.
Birch
Betula, sp.
Boxelder
Acer nee/undo, L.
Dogwood
Cornus, sp.
Elderberry
Sambucus, sp.
Forsythia
Forsythia, sp.
Grape
Vitis, sp.
Aster, wild
Aster, sp.
Cedar Cherry
Prunus, sp.
Cherry, choke
Prunus virginiana, L.
Corn
Zea mays, L.
Lambs-quarters
Chenopodium album* L.
Linden
Tilia, sp.
London plane tree
Platanus aacrifolia ( Ai t . ) Wi 1 1 d ,
Maple, Norway
Aaer platanoides, L.
Oak, black
Quercus velutina. Lam.
Sorrel 1
sp.
Intermediate
Mulberry
Hovus 3 sp .
Oak, pin
Querous paluatris, L.
Oak, red
Queraus
L.
Peach
Primus persica^ Sieb. & Zucc.
Tobacco
Niaotianaj sp.
Tomato
Lycopersicon esculentum. Mill
Treeofheaven
Ailanthus alti.ssimaf Mill.
Wisteria
Wisteria^ sp.
Yellow wood
Cladrastis lutea, Kock
Zinnia
Zinnia, sp.
Ragweed, giant
Ambrosia trifida, L.
Rhododendron
Rhododendron, sp.
Rose
Rosa, sp.
Spruce, Colorado blue
Piaea pungens, Englm.
image:
TABLE B-6. SENSITIVITY OF SELECTED PLANTS TO 2,4-DICHLOROPHENOXYACETIC ACID*
Sensitive
Apple
Malus, sp.
Hickory
Carya, sp.
Sumac
Rhus, sp.
Birch
Betula, sp.
Boxelder
Acer nee/undo, L.
Dogwood
Cornus, sp.
Elderberry
Sambucus, sp.
Forsythia
Forsythia, sp.
Grape
Vitis, sp.
Aster, wild
Aster, sp.
Cedar Cherry
Prunus, sp.
Cherry, choke
Prunus virginiana, L.
Corn
Zea mays, L.
Lambs-quarters
Chenopodium album* L.
Linden
Tilia, sp.
London plane tree
Platanus aacrifolia ( Ai t . ) Wi 1 1 d ,
Maple, Norway
Aaer platanoides, L.
Oak, black
Quercus velutina. Lam.
Sorrel 1
sp.
Intermediate
Mulberry
Hovus 3 sp .
Oak, pin
Querous paluatris, L.
Oak, red
Queraus
L.
Peach
Primus persica^ Sieb. & Zucc.
Tobacco
Niaotianaj sp.
Tomato
Lycopersicon esculentum. Mill
Treeofheaven
Ailanthus alti.ssimaf Mill.
Wisteria
Wisteria^ sp.
Yellow wood
Cladrastis lutea, Kock
Zinnia
Zinnia, sp.
Ragweed, giant
Ambrosia trifida, L.
Rhododendron
Rhododendron, sp.
Rose
Rosa, sp.
Spruce, Colorado blue
Piaea pungens, Englm.
image:
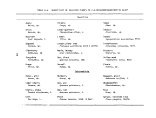 TABLE B-6. SENSITIVITY OF SELECTED PLANTS TO 2,4-DICHLOROPHENOXYACETIC ACID* (Continued)
Gladiolus
Gladiolus3 sp.
Hemlock
Tsuga, sp.
Ash
Fraxinus, sp.
Bean, bush
Potato
Sotanum tuberosumj L.
Privet
Ligustrum, sp.
Resistant
Eggplant
Solarium melongena^ L.
Pear
Phaseolus vulgaris^ L. Pyrus aornmunis, L.
Peony
Cabbage
Brassica oleraeea, L.
j sp.
Sweetgum
Liqu-idambar styraeiflua, L.
Yew
., sp
Rhubarb
Rheum rhaponticumf L.
Sorghum
Sorghum vulgare, Pers.
From Air Pollution Control Association Report No. 1
image:
TABLE B-6. SENSITIVITY OF SELECTED PLANTS TO 2,4-DICHLOROPHENOXYACETIC ACID* (Continued)
Gladiolus
Gladiolus3 sp.
Hemlock
Tsuga, sp.
Ash
Fraxinus, sp.
Bean, bush
Potato
Sotanum tuberosumj L.
Privet
Ligustrum, sp.
Resistant
Eggplant
Solarium melongena^ L.
Pear
Phaseolus vulgaris^ L. Pyrus aornmunis, L.
Peony
Cabbage
Brassica oleraeea, L.
j sp.
Sweetgum
Liqu-idambar styraeiflua, L.
Yew
., sp
Rhubarb
Rheum rhaponticumf L.
Sorghum
Sorghum vulgare, Pers.
From Air Pollution Control Association Report No. 1
image:
 (2) Toxic Effects on the fetus
(a) Hamsters; Commercial samples of 2,4,5-T were shown by
Collins and Williams C1971) to be feticidal and teratogenic in the golden Syrian
hamster. Dose levels of 2,4,5-T ranged from 20 to 100 mg/kg/day while TCDD
content varied from 0.1 to 45 ppm. Doses of 100 mg/kg/day of 2,4,5-T approach
levels causing maternal mortality,
(b) Rats; TCDD is highly embryotoxic in the rat. No effect
was seen at a dose level of 0.03 yg/kg/day but at the 0.125 yg/kg/day dose
level there was a significant incidence of fetuses with intestinal hemorrhage;
fetal deaths and resorptions increased. Delayed skeletal maturation was seen.
At 2 yg/kg/day there were few viable fetuses and the survivors had a high inci-
dence of anomalies. At 8 yg/kg/day there was severe maternal toxicity and
there were no viable fetuses. King et^al_. (1971) studied the effect of 2,4,5-T
and 2,4-D administered by gavage and an intrauterine. technique using Sprague-
Dawley rats as the test species. "Purified" and "technical" grade 2,4,5-T were
applied to Millipore filters that were then placed on the amniotic sac of the
embryo. "Purified" 2,4,5-T intrauterinely applied to 93 embryos on any one day
of gestation from day 12 to 16 at a dose range of 50 to 120 yg per embryo
resulted in no cleft palates. Substituting the technical for purified grade
and using the same technique on 118 embryos resulted in two cleft palates.
Oral administration of 2,4-D and 2,4,5-T at a total dose range of 60 to 120 mg/kg
to 245 rats yielded 2,231 fetuses, nine of which had cleft palates. Again,
these are high dose levels.
b. Industrial Exposure: Dow Chemical Co. prepared an extensive health
inventory of 126 manufacturing personnel in an effort to identify harmful
effects of inhaled 2,4,5-T. The inhalation rate of the agent was estimated to
be from 1.6 to 8.1 mg/day/worker, depending on work assignment, for periods of
up to three years. The survey indicates that no illness was associated with
2,4,5-T intake. In plants where 2,4,5-T contained a high proportion of TCDD,
Bleiberg e_t aK (1964) found 18% of the exposed employees suffered from moderate
to severe chloracne, the intensity of which correlated significantly with the
presence of hyperpigmentation, hirsutism and eye irritation. In the late 1940's
a pressure overload resulted in the accidental rupture of a vessel containing
the sodium salt of 2,4,5-trichlorophenol, a precursor of 2,4,5-T. During the
177
image:
(2) Toxic Effects on the fetus
(a) Hamsters; Commercial samples of 2,4,5-T were shown by
Collins and Williams C1971) to be feticidal and teratogenic in the golden Syrian
hamster. Dose levels of 2,4,5-T ranged from 20 to 100 mg/kg/day while TCDD
content varied from 0.1 to 45 ppm. Doses of 100 mg/kg/day of 2,4,5-T approach
levels causing maternal mortality,
(b) Rats; TCDD is highly embryotoxic in the rat. No effect
was seen at a dose level of 0.03 yg/kg/day but at the 0.125 yg/kg/day dose
level there was a significant incidence of fetuses with intestinal hemorrhage;
fetal deaths and resorptions increased. Delayed skeletal maturation was seen.
At 2 yg/kg/day there were few viable fetuses and the survivors had a high inci-
dence of anomalies. At 8 yg/kg/day there was severe maternal toxicity and
there were no viable fetuses. King et^al_. (1971) studied the effect of 2,4,5-T
and 2,4-D administered by gavage and an intrauterine. technique using Sprague-
Dawley rats as the test species. "Purified" and "technical" grade 2,4,5-T were
applied to Millipore filters that were then placed on the amniotic sac of the
embryo. "Purified" 2,4,5-T intrauterinely applied to 93 embryos on any one day
of gestation from day 12 to 16 at a dose range of 50 to 120 yg per embryo
resulted in no cleft palates. Substituting the technical for purified grade
and using the same technique on 118 embryos resulted in two cleft palates.
Oral administration of 2,4-D and 2,4,5-T at a total dose range of 60 to 120 mg/kg
to 245 rats yielded 2,231 fetuses, nine of which had cleft palates. Again,
these are high dose levels.
b. Industrial Exposure: Dow Chemical Co. prepared an extensive health
inventory of 126 manufacturing personnel in an effort to identify harmful
effects of inhaled 2,4,5-T. The inhalation rate of the agent was estimated to
be from 1.6 to 8.1 mg/day/worker, depending on work assignment, for periods of
up to three years. The survey indicates that no illness was associated with
2,4,5-T intake. In plants where 2,4,5-T contained a high proportion of TCDD,
Bleiberg e_t aK (1964) found 18% of the exposed employees suffered from moderate
to severe chloracne, the intensity of which correlated significantly with the
presence of hyperpigmentation, hirsutism and eye irritation. In the late 1940's
a pressure overload resulted in the accidental rupture of a vessel containing
the sodium salt of 2,4,5-trichlorophenol, a precursor of 2,4,5-T. During the
177
image:
 following months, 228 persons developed chloracne, not only plant employees,
but members of their families including wives and children. In workers more
intensively exposed as a result of the accident, chloracne appeared about two
weeks followed by moderate to severe pain in the skeletal muscles of the legs,
arms, back and breath, decreased libido and intolerance to cold. Comedones
appeared in areas of adult hair which is not typical of juvenile acne. There
were pustules on the face, neck, abdomen, back and scrotum. Serum lipids,
prothrombin time and glucuronates were all elevated. Biopsy of peripheral
nerves revealed destruction of myelin sheaths and in some instances nerve fibers.
Hyperpigmentation, fatigue and marked nervous irritability appeared. Over a
period of several months, all of the symptoms and findings, except the scars of
acne, returned to normal after removal from exposure. Cases in the families of
the workers probably resulted from contaminated clothing and poor personal
hygiene. The causative agent was not identified at the time. However, in the
light of current knowledge, it was almost certainly a polychlorinated dibenzodi-
oxin and possibly TCDD (Suskind, 1973).
c. Evaluation of Toxicological Testing
(1) Requirement for Establishing Dose-Related Response: Insistence
on administering a "maximum tolerated dose" may be terribly misleading if this
is the only dose tested, as in the Bionetics study (Innes, e_t al_., 1969). There
is no justification for abrogating the need to establish a dose-response rela-
tionship, which is fundamental to all toxicological experimentation. The route
of administration is all important in tests for teratogenesis. We are told that
"Parenteral administration is an appropriate test route for pesticides to which
humans are exposed by inhalation, or for pesticides which are systemically
absorbed, following ingestion" (USDHEW, 1969). It is safe to predict that, by
appropriate choice of dose, concentration of solution and frequency of adminis-
tration by subcutaneous route, any chemical agent can be shown to be a carcinogen
or a teratogen in the rat and probably in other laboratory rodents (Goldberg,
1971).
(2) Bionetics Study; The Bionetics study began with the observa-
tion that 2,4,5-T was teratogenic and feticidal in two strains of mice when
administered either subcutaneously or orally and in one strain of rats when
administered orally (Courtney et_ aj_., 1970). Analyses of the sample of 2,4,5-T
178
image:
following months, 228 persons developed chloracne, not only plant employees,
but members of their families including wives and children. In workers more
intensively exposed as a result of the accident, chloracne appeared about two
weeks followed by moderate to severe pain in the skeletal muscles of the legs,
arms, back and breath, decreased libido and intolerance to cold. Comedones
appeared in areas of adult hair which is not typical of juvenile acne. There
were pustules on the face, neck, abdomen, back and scrotum. Serum lipids,
prothrombin time and glucuronates were all elevated. Biopsy of peripheral
nerves revealed destruction of myelin sheaths and in some instances nerve fibers.
Hyperpigmentation, fatigue and marked nervous irritability appeared. Over a
period of several months, all of the symptoms and findings, except the scars of
acne, returned to normal after removal from exposure. Cases in the families of
the workers probably resulted from contaminated clothing and poor personal
hygiene. The causative agent was not identified at the time. However, in the
light of current knowledge, it was almost certainly a polychlorinated dibenzodi-
oxin and possibly TCDD (Suskind, 1973).
c. Evaluation of Toxicological Testing
(1) Requirement for Establishing Dose-Related Response: Insistence
on administering a "maximum tolerated dose" may be terribly misleading if this
is the only dose tested, as in the Bionetics study (Innes, e_t al_., 1969). There
is no justification for abrogating the need to establish a dose-response rela-
tionship, which is fundamental to all toxicological experimentation. The route
of administration is all important in tests for teratogenesis. We are told that
"Parenteral administration is an appropriate test route for pesticides to which
humans are exposed by inhalation, or for pesticides which are systemically
absorbed, following ingestion" (USDHEW, 1969). It is safe to predict that, by
appropriate choice of dose, concentration of solution and frequency of adminis-
tration by subcutaneous route, any chemical agent can be shown to be a carcinogen
or a teratogen in the rat and probably in other laboratory rodents (Goldberg,
1971).
(2) Bionetics Study; The Bionetics study began with the observa-
tion that 2,4,5-T was teratogenic and feticidal in two strains of mice when
administered either subcutaneously or orally and in one strain of rats when
administered orally (Courtney et_ aj_., 1970). Analyses of the sample of 2,4,5-T
178
image:
 that had been tested against the animals revealed the presence of 27 ±8 ppm
TCDD. Subsequent study of standard 2,4,5-T containing less than 1 ppm TCDD
given to rats by gavage in doses up to 24 mg/kg daily, failed to reveal evi-
dence of teratogenic or embryotoxic effects C&nerson e£ a_K > 1970). Under
similar conditions, TCDD produced no effect at a dose of 0.03 vg/kg/day while
doses of 0.125 yg/kg/day or greater manifested toxicity to the fetus and at
8.0 yg/kg/day to the mother also (Sparschu et^aj_., 1970).
C3) Evaluating Data from Animal Models: The metabolism of a test
compound is a highly relevant consideration in teratogenesis. If the metabolic
pathway in the test animal differs radically from that in man, then the results
of a study are unlikely to be useful for the assessment of hazards arising from
trace contaminants. The findings of teratogenesis or embryotoxicity has mean-
ing only in the appropriate animal species (Goldberg, 1971). Theodor D. Sterling
(1971) of the Department of Applied Mathematics and Computer Science, Washington
University, St Louis, examined the difficulty of evaluating the toxicity and
teratogenicity of 2,4,5-T from existing animal data. He notes that the question
has been raised as to whether the herbicide 2,4,5-T is toxic and teratogenic to
an extent to preclude its use, in this country at least. Sterling states,
"Although we can learn a great deal from animal experiments, toxicological and
teratological information from animal experiments turns out to be much less
useful, especially for making broad policy decisions, than is commonly thought."
(4) Design of Recent 2,4,5-T Toxicity Studies: To quote Sterling
(1971) again, "...there are less than a dozen key reports...of study on toxicity
of 2,4,5-T, dating back to the early 1950's for the most part, and on its ter-
atogenicity, mostly done in the last two years. Whereas the toxicity studies
were done at some leisure and the teratogenicity studies had some aspect of
emergency about them, they are indistinguishable in their lack of adequate
statistical experimental design and analysis of data."
6. EVALUATION OF ENVIRONMENTAL CONTAMINATION POSSIBILITY: The possibility
that an extraordinarily toxic contaminant of a widely used herbicide may be
sufficiently stable in the environment and soluble in fat or other tissues to
enter food chains and ultimately the human diet is worthy of consideration.
It was known, of course, that 2,4,5-T does not accumulate to any significant
degree in animal tissues, but data on tissue storage of dioxin were not
179
image:
that had been tested against the animals revealed the presence of 27 ±8 ppm
TCDD. Subsequent study of standard 2,4,5-T containing less than 1 ppm TCDD
given to rats by gavage in doses up to 24 mg/kg daily, failed to reveal evi-
dence of teratogenic or embryotoxic effects C&nerson e£ a_K > 1970). Under
similar conditions, TCDD produced no effect at a dose of 0.03 vg/kg/day while
doses of 0.125 yg/kg/day or greater manifested toxicity to the fetus and at
8.0 yg/kg/day to the mother also (Sparschu et^aj_., 1970).
C3) Evaluating Data from Animal Models: The metabolism of a test
compound is a highly relevant consideration in teratogenesis. If the metabolic
pathway in the test animal differs radically from that in man, then the results
of a study are unlikely to be useful for the assessment of hazards arising from
trace contaminants. The findings of teratogenesis or embryotoxicity has mean-
ing only in the appropriate animal species (Goldberg, 1971). Theodor D. Sterling
(1971) of the Department of Applied Mathematics and Computer Science, Washington
University, St Louis, examined the difficulty of evaluating the toxicity and
teratogenicity of 2,4,5-T from existing animal data. He notes that the question
has been raised as to whether the herbicide 2,4,5-T is toxic and teratogenic to
an extent to preclude its use, in this country at least. Sterling states,
"Although we can learn a great deal from animal experiments, toxicological and
teratological information from animal experiments turns out to be much less
useful, especially for making broad policy decisions, than is commonly thought."
(4) Design of Recent 2,4,5-T Toxicity Studies: To quote Sterling
(1971) again, "...there are less than a dozen key reports...of study on toxicity
of 2,4,5-T, dating back to the early 1950's for the most part, and on its ter-
atogenicity, mostly done in the last two years. Whereas the toxicity studies
were done at some leisure and the teratogenicity studies had some aspect of
emergency about them, they are indistinguishable in their lack of adequate
statistical experimental design and analysis of data."
6. EVALUATION OF ENVIRONMENTAL CONTAMINATION POSSIBILITY: The possibility
that an extraordinarily toxic contaminant of a widely used herbicide may be
sufficiently stable in the environment and soluble in fat or other tissues to
enter food chains and ultimately the human diet is worthy of consideration.
It was known, of course, that 2,4,5-T does not accumulate to any significant
degree in animal tissues, but data on tissue storage of dioxin were not
179
image:
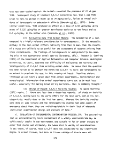 available. Chlorinated dibenzo-p-dioxins long have been recognized as
by-products from the manufacture of certain chlorinated phenols, For example,
2,4,5-trichlorophenol is prepared industrially by the hydrolysis of 1,2,4,5-
tetrachlorobenzene at elevated temperatures and pressures, a process which can
also result in the formation of traces of heterocyclic impurities including
2,3,7,8-tetrachlorodibenzo-p-dioxin if temperatures are permitted to exceed
160°C and if the reaction becomes alkaline. This dioxin is toxic, teratogem'c
and acnegenic and its presence appears to account satisfactorily for the
alleged teratogem'c effects of trichlorophenol derivatives such as the herbicide
2,4,5-T.
a. Knowledge Available from Use: No proven instance of toxicity asso-
ciated with 2,4,5-T intake in man has been found in agricultural or industrial
workers known to have had repeated, relatively high levels of exposure to
2,4,5-T of low dioxin content. The safety factor for the general population is
estimated to be several orders of magnitude greater than that for 2,4,5-T fac-
tory workers. Data are too limited for a firm conclusion, but there is no evi-
dence to suggest that TCDD as a contaminant in 2,4,5-T is likely to be encoun-
tered by animal or man in sufficient dosage to cause toxic reactions (Advisory
Committee, 1971).
b. Application of Testing: "Since most chemicals under suitable lab-
oratory conditions could probably be demonstrated to have teratogenic effects,
and certainly all could be shown to produce some toxic effects if dosage were
raised high enough, it would not be reasonable to consider the demonstration .
of toxic effects under conditions of greatly elevated dosage sufficient grounds
for prohibiting further use of a particular chemical," (Goldberg, 1971).
c. Possibility of Pyrolytically Produced Contamination; The question
of the formation of TCDD as a result of the pyrolysis or burning of wood,
including brush treated with 2,4,5-T, has been a matter of some concern.
Langer (1973) states, "The derivatives of 2,4-D, 2,4,5-T and Silvex as well as
their sodium salts and esters have not produced dioxins in pyrolytic reactions
whether carried out in the solid state, in the melt, or in solution. Even
after conditions of extreme hydrolysis, followed by pyrolysis we could observe
only trace amounts of dioxins." Langer (1973) further stated, "Even extreme
conditions such as burning of treated wood or vegetation after the use of
180
image:
available. Chlorinated dibenzo-p-dioxins long have been recognized as
by-products from the manufacture of certain chlorinated phenols, For example,
2,4,5-trichlorophenol is prepared industrially by the hydrolysis of 1,2,4,5-
tetrachlorobenzene at elevated temperatures and pressures, a process which can
also result in the formation of traces of heterocyclic impurities including
2,3,7,8-tetrachlorodibenzo-p-dioxin if temperatures are permitted to exceed
160°C and if the reaction becomes alkaline. This dioxin is toxic, teratogem'c
and acnegenic and its presence appears to account satisfactorily for the
alleged teratogem'c effects of trichlorophenol derivatives such as the herbicide
2,4,5-T.
a. Knowledge Available from Use: No proven instance of toxicity asso-
ciated with 2,4,5-T intake in man has been found in agricultural or industrial
workers known to have had repeated, relatively high levels of exposure to
2,4,5-T of low dioxin content. The safety factor for the general population is
estimated to be several orders of magnitude greater than that for 2,4,5-T fac-
tory workers. Data are too limited for a firm conclusion, but there is no evi-
dence to suggest that TCDD as a contaminant in 2,4,5-T is likely to be encoun-
tered by animal or man in sufficient dosage to cause toxic reactions (Advisory
Committee, 1971).
b. Application of Testing: "Since most chemicals under suitable lab-
oratory conditions could probably be demonstrated to have teratogenic effects,
and certainly all could be shown to produce some toxic effects if dosage were
raised high enough, it would not be reasonable to consider the demonstration .
of toxic effects under conditions of greatly elevated dosage sufficient grounds
for prohibiting further use of a particular chemical," (Goldberg, 1971).
c. Possibility of Pyrolytically Produced Contamination; The question
of the formation of TCDD as a result of the pyrolysis or burning of wood,
including brush treated with 2,4,5-T, has been a matter of some concern.
Langer (1973) states, "The derivatives of 2,4-D, 2,4,5-T and Silvex as well as
their sodium salts and esters have not produced dioxins in pyrolytic reactions
whether carried out in the solid state, in the melt, or in solution. Even
after conditions of extreme hydrolysis, followed by pyrolysis we could observe
only trace amounts of dioxins." Langer (1973) further stated, "Even extreme
conditions such as burning of treated wood or vegetation after the use of
180
image:
 2,4-D, 2,4,5-T, Silvex or their derivatives is not expected to produce detectable
amounts of dioxins or dibenzofuran," However, in a memorandum dated July 30,
1973, Baughman and Meselson (1973) reported that the pyrolysis of the sodium
salt of 2,4,5-T at temperatures from 300 to 450°C for 30 minutes to 12 hours
caused the formation TCDD ranging in concentrations from 0.1 to 0.3% (1,000
to 3,000 ppm).
d. Evaluation by EPA Advisory Committee: The data are indeed very
limited. Nevertheless, certain conclusions can be made and these as made by
the Advisory Committee on 2,4,5-T to the Administrator of the Environmental
Protection Agency are, in part, as follows:
(1) The herbicide 2,4,5-T does not accumulate in any compartments
of the biosphere, nor does it accumulate in any animal tissues or products used
for human consumption.
(2) The risk of human exposure to 2,4,5-T in food, air and water
is negligible,
(3) There is no indication that TCDD accumulates in air, water or
plants, although it might accumulate and remain active for some time in soils
after heavy application of a highly contaminated sample of 2,4,5-T.
(4) Less than 0.2% of TCDD in soil is known to be absorbed into
plants.
(5) 2,4,5-T is rapidly excreted in animals studied using doses in
the range of those likely to be encountered in the environment.
(6) Limited data indicate that TCDD is also eliminated, at least
some by metabolic breakdown, with a half-life of 20 days.
(7) The solubility of TCDD in fat is limited which would preclude
appreciable accumulation in body fat.
181
image:
2,4-D, 2,4,5-T, Silvex or their derivatives is not expected to produce detectable
amounts of dioxins or dibenzofuran," However, in a memorandum dated July 30,
1973, Baughman and Meselson (1973) reported that the pyrolysis of the sodium
salt of 2,4,5-T at temperatures from 300 to 450°C for 30 minutes to 12 hours
caused the formation TCDD ranging in concentrations from 0.1 to 0.3% (1,000
to 3,000 ppm).
d. Evaluation by EPA Advisory Committee: The data are indeed very
limited. Nevertheless, certain conclusions can be made and these as made by
the Advisory Committee on 2,4,5-T to the Administrator of the Environmental
Protection Agency are, in part, as follows:
(1) The herbicide 2,4,5-T does not accumulate in any compartments
of the biosphere, nor does it accumulate in any animal tissues or products used
for human consumption.
(2) The risk of human exposure to 2,4,5-T in food, air and water
is negligible,
(3) There is no indication that TCDD accumulates in air, water or
plants, although it might accumulate and remain active for some time in soils
after heavy application of a highly contaminated sample of 2,4,5-T.
(4) Less than 0.2% of TCDD in soil is known to be absorbed into
plants.
(5) 2,4,5-T is rapidly excreted in animals studied using doses in
the range of those likely to be encountered in the environment.
(6) Limited data indicate that TCDD is also eliminated, at least
some by metabolic breakdown, with a half-life of 20 days.
(7) The solubility of TCDD in fat is limited which would preclude
appreciable accumulation in body fat.
181
image:
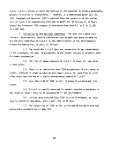 APPENDIX C
ANALYTICAL PROCEDURES USED BY TRW
182
image:
APPENDIX C
ANALYTICAL PROCEDURES USED BY TRW
182
image:
 APPENDIX C - INDEX
PAGE
1. INTRODUCTION 184
2. EXTRACTION OF SOLID SAMPLES FOR ORGANICS 185
3. CONCENTRATION OF ORGANIC SAMPLES 188
4. GRAVIMETRIC DETERMINATIONS FOR ORGANICS 190
5. C7-C16 GAS CHROMATOGRAPHIC ANALYSIS 191
6. LIQUID CHROMATOGRAPHIC SEPARATIONS 199
7. INFRARED ANALYSIS 203
8. LOW RESOLUTION MASS SPECTROMETRIC ANALYSIS 206
9. QUALITATIVE ANALYSIS BY GC/MS 212
183
image:
APPENDIX C - INDEX
PAGE
1. INTRODUCTION 184
2. EXTRACTION OF SOLID SAMPLES FOR ORGANICS 185
3. CONCENTRATION OF ORGANIC SAMPLES 188
4. GRAVIMETRIC DETERMINATIONS FOR ORGANICS 190
5. C7-C16 GAS CHROMATOGRAPHIC ANALYSIS 191
6. LIQUID CHROMATOGRAPHIC SEPARATIONS 199
7. INFRARED ANALYSIS 203
8. LOW RESOLUTION MASS SPECTROMETRIC ANALYSIS 206
9. QUALITATIVE ANALYSIS BY GC/MS 212
183
image:
 APPENDIX C
1. INTRODUCTION
The TRW analyses of samples acquired during the incineration of Herbicide
Orange were intended to characterize the environmental acceptability of the
incineration. The analytical plan discussed below is basically a Level I
organic analysis. It is intended to provide quantitative information on emis-
sions of classes of organic compounds so that important emissions do not go
undetected and to provide information on the destruction efficiency of the
incineration. Full documentation of Level I sampling and analysis is found in:
• "Level I Environmental Assessment," IERL Procedures Manual,
Document No. EPA-60012-76-160a.
• "Combustion Source Assessment: Method and Procedures Manual
for Sampling and Analysis," Draft Report to EPA-IERL-RTP,
January 1977.
An overview of the methodology used for the Level I organic analyses is
shown in Figure 16. This methodology deals with the preparation of the sam-
ples to provide forms suitable for analysis and with the subsequent analyses.
As indicated in this Figure, the extent of sample preparation required
varies with sample type. The low molecular weight hydrocarbons, boiling at
<90°C and reported as C1-C6 n-alkanes, are determined by gas chromatography
and require no preparation. Organic liquids, such as fuel oil, also require
no preparation and are placed directly into the analysis scheme. Other sam-
ples, such as the sorbent trap and burner residue, will require preparation
by solvent extraction prior to analysis. Solvent extraction will separate
the organic from the inorganic portions of the samples so that analysis can
proceed without complications.
184
image:
APPENDIX C
1. INTRODUCTION
The TRW analyses of samples acquired during the incineration of Herbicide
Orange were intended to characterize the environmental acceptability of the
incineration. The analytical plan discussed below is basically a Level I
organic analysis. It is intended to provide quantitative information on emis-
sions of classes of organic compounds so that important emissions do not go
undetected and to provide information on the destruction efficiency of the
incineration. Full documentation of Level I sampling and analysis is found in:
• "Level I Environmental Assessment," IERL Procedures Manual,
Document No. EPA-60012-76-160a.
• "Combustion Source Assessment: Method and Procedures Manual
for Sampling and Analysis," Draft Report to EPA-IERL-RTP,
January 1977.
An overview of the methodology used for the Level I organic analyses is
shown in Figure 16. This methodology deals with the preparation of the sam-
ples to provide forms suitable for analysis and with the subsequent analyses.
As indicated in this Figure, the extent of sample preparation required
varies with sample type. The low molecular weight hydrocarbons, boiling at
<90°C and reported as C1-C6 n-alkanes, are determined by gas chromatography
and require no preparation. Organic liquids, such as fuel oil, also require
no preparation and are placed directly into the analysis scheme. Other sam-
ples, such as the sorbent trap and burner residue, will require preparation
by solvent extraction prior to analysis. Solvent extraction will separate
the organic from the inorganic portions of the samples so that analysis can
proceed without complications.
184
image:
 After extraction, the analysis of the extract or neat organic liquid pro-
ceeds in several steps. An aliquot is taken for GC analysis of hydrocarbons
boiling in the range of the C7-C16 n-alkanes (90-300°C). The remainder of the
extract is then concentrated to 2 ml. A 0.25-ml aliquot is set aside for
qualitative GC/MS analysis, and a 0.5-ml aliquot is taken and evaporated for
gravimetric and IR analysis. The GC analysis provides information on the
quantity of higher boiling hydrocarbons in the sample. The infrared spectrum
provides information on the major types of functional groups present in the
sample. The data obtained in the GC and IR analyses are complementary: most
compounds detected in the GC analyses are too volatile to remain for the IR
analysis, and compounds seen in the IR analysis are too involatile to be
detected in the GC analysis. This complementarity also applies between the
GC and LC analyses. All functional groups identified in the total sample must
be accounted for in succeeding analyses. If there is sufficient material in
the concentrated extracts, a portion of the extract providing not less than
50 mg is taken for liquid chromatographic separation into eight fractions. An
IR spectrum is obtained on each fraction. If there is sufficient material in
the LC fraction, a low resolution mass spectrum (LRMS) is measured. A low
resolution mass spectrum will provide more information on compound types and,
in some cases, may permit the analyst to identify specific compounds.
The remaining sections of this appendix contain procedures for sample
preparation, analyses, and handling of samples for the various analyses. A
separate document will address safety aspects of handling these samples.
2. EXTRACTION OF SOLID SAMPLES FOR ORGANICS
Scope and Application
The purpose of this procedure is to prepare solid samples for subsequent
Level I analyses for organics. The solid samples that may be generated on this
program are XAD-2 resin samples and burner head residues. Various sizes of
Soxhlet extractors may be used for this procedure depending upon the size of
the sample and the estimated concentration of organics in the sample. Thus,
before this procedure is begun, there is a decision point to select the appro-
priate size of Soxhlet extractor to be used.
185
image:
After extraction, the analysis of the extract or neat organic liquid pro-
ceeds in several steps. An aliquot is taken for GC analysis of hydrocarbons
boiling in the range of the C7-C16 n-alkanes (90-300°C). The remainder of the
extract is then concentrated to 2 ml. A 0.25-ml aliquot is set aside for
qualitative GC/MS analysis, and a 0.5-ml aliquot is taken and evaporated for
gravimetric and IR analysis. The GC analysis provides information on the
quantity of higher boiling hydrocarbons in the sample. The infrared spectrum
provides information on the major types of functional groups present in the
sample. The data obtained in the GC and IR analyses are complementary: most
compounds detected in the GC analyses are too volatile to remain for the IR
analysis, and compounds seen in the IR analysis are too involatile to be
detected in the GC analysis. This complementarity also applies between the
GC and LC analyses. All functional groups identified in the total sample must
be accounted for in succeeding analyses. If there is sufficient material in
the concentrated extracts, a portion of the extract providing not less than
50 mg is taken for liquid chromatographic separation into eight fractions. An
IR spectrum is obtained on each fraction. If there is sufficient material in
the LC fraction, a low resolution mass spectrum (LRMS) is measured. A low
resolution mass spectrum will provide more information on compound types and,
in some cases, may permit the analyst to identify specific compounds.
The remaining sections of this appendix contain procedures for sample
preparation, analyses, and handling of samples for the various analyses. A
separate document will address safety aspects of handling these samples.
2. EXTRACTION OF SOLID SAMPLES FOR ORGANICS
Scope and Application
The purpose of this procedure is to prepare solid samples for subsequent
Level I analyses for organics. The solid samples that may be generated on this
program are XAD-2 resin samples and burner head residues. Various sizes of
Soxhlet extractors may be used for this procedure depending upon the size of
the sample and the estimated concentration of organics in the sample. Thus,
before this procedure is begun, there is a decision point to select the appro-
priate size of Soxhlet extractor to be used.
185
image:
 Summary of Method
The sample is placed or weighed into glass thimbles and extracted for
24 hours with high purity solvent. Pentane will be used to extract all sam-
ples. The resulting extracts are made to a standard volume and a small ali-
quot taken and set aside for GC analysis.
Sample Handling
All equipment (i.e., sample containers, spatulas, tweezers, etc.) that
contacts either the solid samples or the solvent extracts is to be glass,
Teflon, or stainless steel. No grease or lubricant of any kind is to be used
on the ground glass joints of the extraction apparatus.
All glassware is to be rinsed with the same high purity solvent used for
the sample extraction (i.e., pentane).
Apparatus
Reagents
Procedure
Soxhlet extractors in a range of sizes (Ace Glass sizes A to E)
with glass thimbles and condensers.
Boiling flasks in a range of sizes from 125 ml to 500 ml with
stoppers.
Volumetric flasks in a range of sizes from 100 to 500 ml.
Heating mantles to fit boiling flasks and variable transformers,
or steam baths.
Volumetric pipette, 2 ml, class A.
Liquid scintillation vial with aluminum foil cap liner.
Glass beads, 3 mm, plain.
Filter paper, Whatman No. 1.
Pentane, distilled-in-glass or Nanograde.
1, Place the sample to be extracted in the glass thimble, cover
with pre-extracted glass wool. If the resin is wet with water,
allow to air dry in a clean, covered glass dish.
186
image:
Summary of Method
The sample is placed or weighed into glass thimbles and extracted for
24 hours with high purity solvent. Pentane will be used to extract all sam-
ples. The resulting extracts are made to a standard volume and a small ali-
quot taken and set aside for GC analysis.
Sample Handling
All equipment (i.e., sample containers, spatulas, tweezers, etc.) that
contacts either the solid samples or the solvent extracts is to be glass,
Teflon, or stainless steel. No grease or lubricant of any kind is to be used
on the ground glass joints of the extraction apparatus.
All glassware is to be rinsed with the same high purity solvent used for
the sample extraction (i.e., pentane).
Apparatus
Reagents
Procedure
Soxhlet extractors in a range of sizes (Ace Glass sizes A to E)
with glass thimbles and condensers.
Boiling flasks in a range of sizes from 125 ml to 500 ml with
stoppers.
Volumetric flasks in a range of sizes from 100 to 500 ml.
Heating mantles to fit boiling flasks and variable transformers,
or steam baths.
Volumetric pipette, 2 ml, class A.
Liquid scintillation vial with aluminum foil cap liner.
Glass beads, 3 mm, plain.
Filter paper, Whatman No. 1.
Pentane, distilled-in-glass or Nanograde.
1, Place the sample to be extracted in the glass thimble, cover
with pre-extracted glass wool. If the resin is wet with water,
allow to air dry in a clean, covered glass dish.
186
image:
 a) XAD-2 resin; weigh directly into thimble.
b) Burner residue; weigh onto pre-extracted Whatman filter
discs, fold into cone shape and place in thimble.
2. Place 5-6 glass beads in the boiling flask and fill ^1/2 full
with Pentane.
3. Fit extractor onto flask and insert thimble into extractor.
Label the extractor with the sample code identification.
Complete assembly by attaching condenser and clamping entire
apparatus in position in steam bath.
4. Supply power to the heating mantle through the variable trans-
former. There should be sufficient heat to result in one dis-
charge cycle about every ten minutes. Extract each sample for
24 hours. During the first cycle, check the seating of the
ground glass joints by rotating the joints while pushing the
condenser/extractor and extractor/flask together. Check for
solvent loss periodically throughout the extraction. Also
check that the solvent is wetting the resin bed.
5. At the completion of the extraction, turn off power to the
heating mantle and allow the extractor to cool. Remove the
condenser. Pull out the thimble allowing all remaining sol-
vent to drain into the extractor. Transfer the extracted sam-
ple to a glass bottle; label with the sample code identifica-
tion and return to the sample bank.
6. Siphon off any solvent in the extractor into the boiling flask.
Remove the extractor. Transfer the contents (minus the glass
beads) of the boiling flask to an appropriate size volumetric
flask. Rinse the boiling flask with three 10 ml rinses of the
extraction solvent and add these rinsings to the volumetric
flask. Make the volumetric flask to standard volume with the
extraction solvent, label with the sample code identification,
stopper and shake to blend.
7. Remove 2 ml of the extract sample with a pipette and transfer
to a liquid scintillation vial. Label the flask with the sam-
ple code identification. Place both the extract sample and the
2 ml aliquot in the sample bank.
8. With every set of samples extracted, prepare a blank by follow-
ing steps 2 through 7. Leave the glass thimble empty, except
for the glass wool. If Whatman No. 1 filters are used in the
extraction of a set of samples, then the blank is prepared by
adding a pre-extracted Whatman No. 1 to the glass thimble.
187
image:
a) XAD-2 resin; weigh directly into thimble.
b) Burner residue; weigh onto pre-extracted Whatman filter
discs, fold into cone shape and place in thimble.
2. Place 5-6 glass beads in the boiling flask and fill ^1/2 full
with Pentane.
3. Fit extractor onto flask and insert thimble into extractor.
Label the extractor with the sample code identification.
Complete assembly by attaching condenser and clamping entire
apparatus in position in steam bath.
4. Supply power to the heating mantle through the variable trans-
former. There should be sufficient heat to result in one dis-
charge cycle about every ten minutes. Extract each sample for
24 hours. During the first cycle, check the seating of the
ground glass joints by rotating the joints while pushing the
condenser/extractor and extractor/flask together. Check for
solvent loss periodically throughout the extraction. Also
check that the solvent is wetting the resin bed.
5. At the completion of the extraction, turn off power to the
heating mantle and allow the extractor to cool. Remove the
condenser. Pull out the thimble allowing all remaining sol-
vent to drain into the extractor. Transfer the extracted sam-
ple to a glass bottle; label with the sample code identifica-
tion and return to the sample bank.
6. Siphon off any solvent in the extractor into the boiling flask.
Remove the extractor. Transfer the contents (minus the glass
beads) of the boiling flask to an appropriate size volumetric
flask. Rinse the boiling flask with three 10 ml rinses of the
extraction solvent and add these rinsings to the volumetric
flask. Make the volumetric flask to standard volume with the
extraction solvent, label with the sample code identification,
stopper and shake to blend.
7. Remove 2 ml of the extract sample with a pipette and transfer
to a liquid scintillation vial. Label the flask with the sam-
ple code identification. Place both the extract sample and the
2 ml aliquot in the sample bank.
8. With every set of samples extracted, prepare a blank by follow-
ing steps 2 through 7. Leave the glass thimble empty, except
for the glass wool. If Whatman No. 1 filters are used in the
extraction of a set of samples, then the blank is prepared by
adding a pre-extracted Whatman No. 1 to the glass thimble.
187
image:
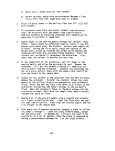 3. CONCENTRATION OF ORGANIC SAMPLES
Scope and Application
The purpose of this procedure is to concentrate samples for Level 1 and
Level 2 organic analyses. These samples will be in the form of solvent
extracts of solid field samples and of solvent rinses of sampling hardware.
During concentration volatile organic species may be lost, and thus these com-
pounds must be determined in the aliquot samples of the neat extracts and
rinses taken before concentration. The concentrations will be performed with
Kuderna-Danish evaporators. Various sizes of evaporators may be used depend-
ing upon the size of the sample to be concentrated. Thus, before this proce-
dure is begun, there is a decision point to select the appropriate size of
Kuderna-Danish evaporator to be used. The extracts are dried with anhydrous
sodium sulfate before concentration.
Summary of Method
The solvent extract or rinse sample is transferred to a Kuderna-Danish
evaporator. The evaporator apparatus is heated on a steam bath to drive off
the solvent. When the sample is sufficiently concentrated, the evaporator is
removed from the steam bath and allowed to cool. The sample is then trans-
ferred to a volumetric flask.
Definitions
K-D - Kuderna-Danish evaporator
MeOH - Methanol
Sample Handling
All equipment .(i.e., sample containers, flasks, etc.) that contacts either
the solvent extracts and rinses or the concentrates is to be glass, Teflon, or
stainless steel. No grease or lubricant of any kind is to be used on the
ground glass joints of the concentration apparatus.
All glassware is to be rinsed with the same high-purity solvent with
which the sample was extracted (i.e., Pentane).
188
image:
3. CONCENTRATION OF ORGANIC SAMPLES
Scope and Application
The purpose of this procedure is to concentrate samples for Level 1 and
Level 2 organic analyses. These samples will be in the form of solvent
extracts of solid field samples and of solvent rinses of sampling hardware.
During concentration volatile organic species may be lost, and thus these com-
pounds must be determined in the aliquot samples of the neat extracts and
rinses taken before concentration. The concentrations will be performed with
Kuderna-Danish evaporators. Various sizes of evaporators may be used depend-
ing upon the size of the sample to be concentrated. Thus, before this proce-
dure is begun, there is a decision point to select the appropriate size of
Kuderna-Danish evaporator to be used. The extracts are dried with anhydrous
sodium sulfate before concentration.
Summary of Method
The solvent extract or rinse sample is transferred to a Kuderna-Danish
evaporator. The evaporator apparatus is heated on a steam bath to drive off
the solvent. When the sample is sufficiently concentrated, the evaporator is
removed from the steam bath and allowed to cool. The sample is then trans-
ferred to a volumetric flask.
Definitions
K-D - Kuderna-Danish evaporator
MeOH - Methanol
Sample Handling
All equipment .(i.e., sample containers, flasks, etc.) that contacts either
the solvent extracts and rinses or the concentrates is to be glass, Teflon, or
stainless steel. No grease or lubricant of any kind is to be used on the
ground glass joints of the concentration apparatus.
All glassware is to be rinsed with the same high-purity solvent with
which the sample was extracted (i.e., Pentane).
188
image:
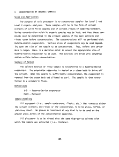 Apparatus
1. Steam bath,
2, Kuderna-Danish concentrators consisting of flasks (125, 250,
and 50 ml), Snyder columns, steel springs, concentrator tubes
(2 ml) and adaptors as needed.
3. Glass beads, 3 mm, plain.
4. Vortex mixer.
5. Disposable Pasteur pipettes.
6. Class A pipette, 2 ml.
7. Volumetric flask, 2 ml, hexagonal base.
Reagents
• Pentane, distilled-in-glass or Nanograde.
Procedure
1. Select an appropriate size of K-D flask and attach a concentra-
tor tube with the steel springs. Place one 3 mm glass bead in
the bottom of the tube. Label the K-D flask with the sample
code identification.
2. Transfer the sample to the K-D flask. Rinse the sample con-
tainer with three 10 ml portions of the same high purity sol-
vent that the sample is in. Add the rinsings to the K-D flask.
3. Attach a Snyder column to the K-D flask and clamp the flask in
position over the steam bath. The solvent should boil at such
a rate that the top ball of the Snyder column bounces lightly.
4. Concentrate the solvent sample to %5 ml.
5. Remove the K-D assembly from the bath and allow to cool. With
disposable pipette, add ^0.5 ml of the same solvent that the
sample was in to the top of the Snyder column. Allow to drain
into K-D flask and then remove column.
6. Rinse the sides of the K-D flask with another 0.5 ml of solvent.
Remove the flask, stopper the concentrator tube and mix the
tube vigorously on the Vortex mixer for 1 minute.
7. Transfer the contents of the concentrator tube to a 2 ml vol-
umetric flask. Rinse the tube and stopper with 0.5 ml more of
solvent; add these rinsings to the flask and make the flask to
standard volume. Label the flask with the sample code
identification.
189
image:
Apparatus
1. Steam bath,
2, Kuderna-Danish concentrators consisting of flasks (125, 250,
and 50 ml), Snyder columns, steel springs, concentrator tubes
(2 ml) and adaptors as needed.
3. Glass beads, 3 mm, plain.
4. Vortex mixer.
5. Disposable Pasteur pipettes.
6. Class A pipette, 2 ml.
7. Volumetric flask, 2 ml, hexagonal base.
Reagents
• Pentane, distilled-in-glass or Nanograde.
Procedure
1. Select an appropriate size of K-D flask and attach a concentra-
tor tube with the steel springs. Place one 3 mm glass bead in
the bottom of the tube. Label the K-D flask with the sample
code identification.
2. Transfer the sample to the K-D flask. Rinse the sample con-
tainer with three 10 ml portions of the same high purity sol-
vent that the sample is in. Add the rinsings to the K-D flask.
3. Attach a Snyder column to the K-D flask and clamp the flask in
position over the steam bath. The solvent should boil at such
a rate that the top ball of the Snyder column bounces lightly.
4. Concentrate the solvent sample to %5 ml.
5. Remove the K-D assembly from the bath and allow to cool. With
disposable pipette, add ^0.5 ml of the same solvent that the
sample was in to the top of the Snyder column. Allow to drain
into K-D flask and then remove column.
6. Rinse the sides of the K-D flask with another 0.5 ml of solvent.
Remove the flask, stopper the concentrator tube and mix the
tube vigorously on the Vortex mixer for 1 minute.
7. Transfer the contents of the concentrator tube to a 2 ml vol-
umetric flask. Rinse the tube and stopper with 0.5 ml more of
solvent; add these rinsings to the flask and make the flask to
standard volume. Label the flask with the sample code
identification.
189
image:
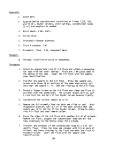 8. With a micropipette, transfer 0.25 ml of the concentrate to
a vial. This aliquot is for the qualitative GC/MS analyses.
Label the vial appropriately (e.g., run No., date, next
analyses).
9. Return the vial to the sample bank.
4. GRAVIMETRIC DETERMINATIONS FOR ORGANICS
Scope and Application
The purpose of this procedure is to determine the weight of nonvolatile
organic species in samples for Level I organic analyses. The procedure is
performed on the concentrates obtained from the Kuderna-Danish concentrations
of solvent extract and rinse samples. Weights of organic residues down to
0.001 mg can be measured.
Summary of Method
An 0.5 ml aliquot of the concentrate sample is transferred with a pipette
to a tared aluminum weighing dish. The sample is allowed to evaporate to dry-
ness, stored in a desiccator overnight and weighed.
Sample Handling
All equipment that contacts either the concentrate or evaporated residue
samples is to be glass, Teflon, or stainless steel. Evaporation of the sam-
ples is to be carried out in an area free from airborne dust and/or organic
vapors that could contaminate the samples.
Apparatus
t Microbalance, Mettler M5 or equivalent.
t Stainless steel disiccating cabinet with gasket sealed closure.
t 500 yl syringe.
0 Aluminum weighing dishes.
Reagents
• Phosphorus pentoxide, granular, reagent grade.
• Pentane, distilled-in-glass or Nanograde.
190
image:
8. With a micropipette, transfer 0.25 ml of the concentrate to
a vial. This aliquot is for the qualitative GC/MS analyses.
Label the vial appropriately (e.g., run No., date, next
analyses).
9. Return the vial to the sample bank.
4. GRAVIMETRIC DETERMINATIONS FOR ORGANICS
Scope and Application
The purpose of this procedure is to determine the weight of nonvolatile
organic species in samples for Level I organic analyses. The procedure is
performed on the concentrates obtained from the Kuderna-Danish concentrations
of solvent extract and rinse samples. Weights of organic residues down to
0.001 mg can be measured.
Summary of Method
An 0.5 ml aliquot of the concentrate sample is transferred with a pipette
to a tared aluminum weighing dish. The sample is allowed to evaporate to dry-
ness, stored in a desiccator overnight and weighed.
Sample Handling
All equipment that contacts either the concentrate or evaporated residue
samples is to be glass, Teflon, or stainless steel. Evaporation of the sam-
ples is to be carried out in an area free from airborne dust and/or organic
vapors that could contaminate the samples.
Apparatus
t Microbalance, Mettler M5 or equivalent.
t Stainless steel disiccating cabinet with gasket sealed closure.
t 500 yl syringe.
0 Aluminum weighing dishes.
Reagents
• Phosphorus pentoxide, granular, reagent grade.
• Pentane, distilled-in-glass or Nanograde.
190
image:
 Procedure
1. Rinse the weighing dishes with the high purity Pentane. Allow
them to air dry, store overnight in a stainless steel desic-
cator charged with P205, label with the sample code identifi-
cation of the samples to be determined, weigh on the micro-
balance and record the tare weights.
2. Rinse a 0.5 ml pipette with methylene chloride and dry with a
stream of pressurized nitrogen.
3. With the pipette, transfer 0.5 ml of the concentrate sample
from its volumetric flask to the appropriately labeled weigh-
ing dish. Record the volume of the concentrate sample before
removing the 0.5 ml aliquot. Repeat Step 2 before pipetting
each sample.
4. Return the concentrate samples to the sample bank.
5. Allow the samples in the weighing dishes to evaporate at
ambient conditions in a clean fume hood until visually dry.
Store overnight in the desiccator and then weigh on the micro-
balance. Record this weight.
6. Place the samples in the sample bank.
Calculations
Subtract the tare weight from the final sample weight for each sample.
This gives the weight of the organic residue. Multiply the residue weight by
the aliquot factor to obtain the total organic residue in the concentrate
sample.
(Final weight- Total concentrate volume _ Total organic
tare weight) Aliquot.volume residue (mg)
5. C7-C16 GAS CHROMATOGRAPHIC ANALYSIS
Scope and Application
Scope
This procedure defines the Level 1 analysis of environmental samples for
volatile hydrocarbons. This procedure assumes an appropriate sample given to
the analyst. No sample preparation is discussed.
191
image:
Procedure
1. Rinse the weighing dishes with the high purity Pentane. Allow
them to air dry, store overnight in a stainless steel desic-
cator charged with P205, label with the sample code identifi-
cation of the samples to be determined, weigh on the micro-
balance and record the tare weights.
2. Rinse a 0.5 ml pipette with methylene chloride and dry with a
stream of pressurized nitrogen.
3. With the pipette, transfer 0.5 ml of the concentrate sample
from its volumetric flask to the appropriately labeled weigh-
ing dish. Record the volume of the concentrate sample before
removing the 0.5 ml aliquot. Repeat Step 2 before pipetting
each sample.
4. Return the concentrate samples to the sample bank.
5. Allow the samples in the weighing dishes to evaporate at
ambient conditions in a clean fume hood until visually dry.
Store overnight in the desiccator and then weigh on the micro-
balance. Record this weight.
6. Place the samples in the sample bank.
Calculations
Subtract the tare weight from the final sample weight for each sample.
This gives the weight of the organic residue. Multiply the residue weight by
the aliquot factor to obtain the total organic residue in the concentrate
sample.
(Final weight- Total concentrate volume _ Total organic
tare weight) Aliquot.volume residue (mg)
5. C7-C16 GAS CHROMATOGRAPHIC ANALYSIS
Scope and Application
Scope
This procedure defines the Level 1 analysis of environmental samples for
volatile hydrocarbons. This procedure assumes an appropriate sample given to
the analyst. No sample preparation is discussed.
191
image:
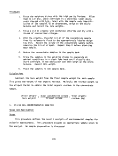 This analysis is semi quantitative and semi qualitative. Calibrations are
replicated, but analyses are not. Thus, the results are semiquantitative. The
identity of peaks is not established; peaks are identified with the appropriate
n-alkane.
Application
This procedure applies solely to the Level 1 C7-C16 gas chromatographic
analysis of extracts or neat organic liquids. This procedure applies when the
analyst has received a sample.
This procedure will provide for detection of components as n-alkanes in
concentrations down to 1 ng/yl with 1 yl injections.
Sensitivity
The sensitivity is defined as the shape of a plot of response (yV • sec)
versus amount injected (ng/yl) and has units of yV • sec • yl/ng. The sensi-
tivity of the procedure is 77-78 yV • sec • yl/ng for the n-alkanes heptane to
hexadecane.
Detection Limit
The detection limit of this procedure as written is 0.7 ng/yl for a lyl
injection of n-decane. This limit is arbitrarily based on defining the minimum
detectable as 100 yV • sec. This is an easier operational definition than
defining the minimum detection limit to be that amount of material which yields
a signal twice the noise level.
It should be noted that the instrument is capable of perhaps one hundred-
fold greater sensitivity. The level specified here is sufficient for Level 1
analysis.
Interferences
There are no interferences.
Limitations
Reporting Limitations — It should be noted that a typical environmental
sample will contain compounds which: (a) will not elute in the specified boil-
ing ranges and thus will not be reported and/or (b) will not elute from the
192
image:
This analysis is semi quantitative and semi qualitative. Calibrations are
replicated, but analyses are not. Thus, the results are semiquantitative. The
identity of peaks is not established; peaks are identified with the appropriate
n-alkane.
Application
This procedure applies solely to the Level 1 C7-C16 gas chromatographic
analysis of extracts or neat organic liquids. This procedure applies when the
analyst has received a sample.
This procedure will provide for detection of components as n-alkanes in
concentrations down to 1 ng/yl with 1 yl injections.
Sensitivity
The sensitivity is defined as the shape of a plot of response (yV • sec)
versus amount injected (ng/yl) and has units of yV • sec • yl/ng. The sensi-
tivity of the procedure is 77-78 yV • sec • yl/ng for the n-alkanes heptane to
hexadecane.
Detection Limit
The detection limit of this procedure as written is 0.7 ng/yl for a lyl
injection of n-decane. This limit is arbitrarily based on defining the minimum
detectable as 100 yV • sec. This is an easier operational definition than
defining the minimum detection limit to be that amount of material which yields
a signal twice the noise level.
It should be noted that the instrument is capable of perhaps one hundred-
fold greater sensitivity. The level specified here is sufficient for Level 1
analysis.
Interferences
There are no interferences.
Limitations
Reporting Limitations — It should be noted that a typical environmental
sample will contain compounds which: (a) will not elute in the specified boil-
ing ranges and thus will not be reported and/or (b) will not elute from the
192
image:
 column at all and will not be reported. Consequently, the other phases of
Level I analysis scheme must be performed to obtain full information on the
sample. Species boiling below 90°C are determined in the C1-C6 GC analysis,
and species boiling above 300°C are determined in the LC analysis.
Calibration Limitations - Quantitation is based on calibration with
n-decane. Data should therefore be reported as, e.g., mg C8/m as n-decane.
Since response varies linearly with carbon number (over a wide range the
assumption may involve a 20% error), it is clear that heptane (C7) detected in
a sample and quantitated as decane will be overestimated. Likewise, dodecane
(C12) quantitated as decane will be underestimated. From previous data, it is
estimated the error involved is of the order of 2-3%.
Detection Limitations - The sensitivity of the flame ionization detector
varies from compound to compound. However, n-alkanes as a class have a greater
response than other classes. Consequently, using a n-alkane as a calibrant
and assuming equal responses of all other compounds tends to give low reported
values.
Summary of Method
A sample (unconcentrated extract or neat organic liquid) is analyzed by
gas chromatography. With boiling point-retention time and response-amount cal-
ibration curves, the data (peak retention times and peak areas) are interpreted
thusly: peak areas in boiling point ranges obtained from the boiling point-
retention time calibration are summed. With the response-amount calibration
curve, the area sums are converted to amounts of material in the reporting
ranges.
After the instrument is set up, the boiling point-retention time calibra-
tion is effected by injecting a mixture of n-C7 through n-C16 hydrocarbons and
running the standard temperature program. Response-amount calibration is
effected from the n-decane peak areas obtained above.
Definitions
• C7-C16 - n-alkanes: heptane through hexadecane
• Temperature program: room temperature to 150°C at 10°C/min.
193
image:
column at all and will not be reported. Consequently, the other phases of
Level I analysis scheme must be performed to obtain full information on the
sample. Species boiling below 90°C are determined in the C1-C6 GC analysis,
and species boiling above 300°C are determined in the LC analysis.
Calibration Limitations - Quantitation is based on calibration with
n-decane. Data should therefore be reported as, e.g., mg C8/m as n-decane.
Since response varies linearly with carbon number (over a wide range the
assumption may involve a 20% error), it is clear that heptane (C7) detected in
a sample and quantitated as decane will be overestimated. Likewise, dodecane
(C12) quantitated as decane will be underestimated. From previous data, it is
estimated the error involved is of the order of 2-3%.
Detection Limitations - The sensitivity of the flame ionization detector
varies from compound to compound. However, n-alkanes as a class have a greater
response than other classes. Consequently, using a n-alkane as a calibrant
and assuming equal responses of all other compounds tends to give low reported
values.
Summary of Method
A sample (unconcentrated extract or neat organic liquid) is analyzed by
gas chromatography. With boiling point-retention time and response-amount cal-
ibration curves, the data (peak retention times and peak areas) are interpreted
thusly: peak areas in boiling point ranges obtained from the boiling point-
retention time calibration are summed. With the response-amount calibration
curve, the area sums are converted to amounts of material in the reporting
ranges.
After the instrument is set up, the boiling point-retention time calibra-
tion is effected by injecting a mixture of n-C7 through n-C16 hydrocarbons and
running the standard temperature program. Response-amount calibration is
effected from the n-decane peak areas obtained above.
Definitions
• C7-C16 - n-alkanes: heptane through hexadecane
• Temperature program: room temperature to 150°C at 10°C/min.
193
image:
 Sample Handling and Preservation
After extraction, a 2 ml aliquot of each sample is set aside in the sample
bank. For each C7rC12 GC analysis, obtain the sample far enough ahead of time
for it to warm to room temperature. For example, after one analysis is started,
return that sample to the sample bank and obtain the next sample.
Apparatus
A Varian 1860 gas chromatograph, equipped with dual flame ionization
detectors and a linear temperature programmer is used in this procedure. Any
equivalent instrument can be used provided that electrometer settings, etc.,.
be changed appropriately. A 6-ft x 1/8-in. OD stainless steel column of 10%
OV-101 on 100/120 mesh supelcoport® is used.
Procedures
Setup and Checkout —
Each day, the operator will verify the following:
1. Carrier gas first-stage regulator >100 psig.
2. Carrier gas second-stage regulator >100 psig.
3. Air first-stage regulator >100 psig.
4. Air second-stage regulator 50 ±5 psig.
5. Hydrogen first-stage regulator >100 psig.
6. Hydrogen second-stage regulator 50 ±5 psig. If any first-stage
regulator indicates <100 psig, the cylinder is considered empty
and will be replaced. After replacing a cylinder, all connec-
tions will be leak checked up to and including the connection
to the chromatograph.
7. Verify carrier gas flow rate is 30 ±2 ml/min. Flow rate is
checked at analytical column outlet after disconnection from
the instrument.
8. Verify hydrogen flow rate is 30 ±2 ml/min. Flow rate is
checked at gas control panel on the GC.
9. Verify air flow rate is 300 ±20 ml/min. Flow rate is checked
at gas control panel on the GC.
194
image:
Sample Handling and Preservation
After extraction, a 2 ml aliquot of each sample is set aside in the sample
bank. For each C7rC12 GC analysis, obtain the sample far enough ahead of time
for it to warm to room temperature. For example, after one analysis is started,
return that sample to the sample bank and obtain the next sample.
Apparatus
A Varian 1860 gas chromatograph, equipped with dual flame ionization
detectors and a linear temperature programmer is used in this procedure. Any
equivalent instrument can be used provided that electrometer settings, etc.,.
be changed appropriately. A 6-ft x 1/8-in. OD stainless steel column of 10%
OV-101 on 100/120 mesh supelcoport® is used.
Procedures
Setup and Checkout —
Each day, the operator will verify the following:
1. Carrier gas first-stage regulator >100 psig.
2. Carrier gas second-stage regulator >100 psig.
3. Air first-stage regulator >100 psig.
4. Air second-stage regulator 50 ±5 psig.
5. Hydrogen first-stage regulator >100 psig.
6. Hydrogen second-stage regulator 50 ±5 psig. If any first-stage
regulator indicates <100 psig, the cylinder is considered empty
and will be replaced. After replacing a cylinder, all connec-
tions will be leak checked up to and including the connection
to the chromatograph.
7. Verify carrier gas flow rate is 30 ±2 ml/min. Flow rate is
checked at analytical column outlet after disconnection from
the instrument.
8. Verify hydrogen flow rate is 30 ±2 ml/min. Flow rate is
checked at gas control panel on the GC.
9. Verify air flow rate is 300 ±20 ml/min. Flow rate is checked
at gas control panel on the GC.
194
image:
 10. Verify the electrometer is functioning properly, The electrom-
eter will be balanced at least once each day, Bucking controls
will be set as required,
11. Verify recorder and integrator are functioning properly,
12. Leak check the septa. Leak checking is effected by placing
the soap bubble flow meter inlet tube over the injection port
adpators. Septa are replaced after two days use.
13. Obtain list of samples to be run.
Retention Time Calibration —
To obtain the temperature ranges for reporting the results of the analyses,
the chromatograph is given a normal boiling point-retention time calibration.
The n-alkanes, their boiling points, and data reporting ranges are given in
Table C-l.
TABLE C-l. REPORTING PROCEDURE RANGES FOR C7-C16 GC PROCEDURE
n-heptane
n-octane
n-nonane
n-decane
n-undecane
n-dodecane
n-tridecane
n-tetradecane
n-pentadecane
n-hexadecane
NBP, °C
98
126
151
174
197
216
Reporting Range, °C
90-110
110-140
140-160
160-180
180-200
200-220
220-240
240-260
260-280
280-300
Report as
C7
C8
C9
CIO
Cll
C12
C13
C14
C15
C16
195
image:
10. Verify the electrometer is functioning properly, The electrom-
eter will be balanced at least once each day, Bucking controls
will be set as required,
11. Verify recorder and integrator are functioning properly,
12. Leak check the septa. Leak checking is effected by placing
the soap bubble flow meter inlet tube over the injection port
adpators. Septa are replaced after two days use.
13. Obtain list of samples to be run.
Retention Time Calibration —
To obtain the temperature ranges for reporting the results of the analyses,
the chromatograph is given a normal boiling point-retention time calibration.
The n-alkanes, their boiling points, and data reporting ranges are given in
Table C-l.
TABLE C-l. REPORTING PROCEDURE RANGES FOR C7-C16 GC PROCEDURE
n-heptane
n-octane
n-nonane
n-decane
n-undecane
n-dodecane
n-tridecane
n-tetradecane
n-pentadecane
n-hexadecane
NBP, °C
98
126
151
174
197
216
Reporting Range, °C
90-110
110-140
140-160
160-180
180-200
200-220
220-240
240-260
260-280
280-300
Report as
C7
C8
C9
CIO
Cll
C12
C13
C14
C15
C16
195
image:
 Preparation of Standard -A series of standard n-alkane solutions may be
prepared thusly. Take 10 yl each of the pure n-C7 through n-C16 alkanes and
dilute to 10 ml in a volumetric flask with pentane. Prepare three additional
standards, each 10-fold more dilute than the preceding one. Use densities at
20°C.
Procedure
1. The programmer Upper Limit is set at 150°C. (If this setting
does not produce a column temperature of 150°C, find the cor-
rect setting.)
2. The programmer Lower Limit is set at 20°C.
3. Verify the instrument and samples at room temperature.
4. Inject 1 pi of the n-alkane mixture.
5. Start the integrator.
6. Start the recorder.
7. Shut the oven door.
8. Change mode to Automatic; turn Lower Limit dial to 30°C to
start the program.
9. Repeat Steps 1-8 a sufficient number of times so that the
relative standard deviation of the retention times for each
peak is <5%.
To attain the required retention time precision, both the carrier gas flow
rate and temperature program specifications must be followed.
This calibration is performed at the start of an analytical program. The
mixture is chromatographed at the start of each day.
Response Calibration
For the purpose of a Level 1 analysis the peak area data obtained above
for n-decane is adequate.
C7-C16 GC Analysis
Apparatus
« Gas chromatograph set up and working.
• Recorder, integrator working.
196
image:
Preparation of Standard -A series of standard n-alkane solutions may be
prepared thusly. Take 10 yl each of the pure n-C7 through n-C16 alkanes and
dilute to 10 ml in a volumetric flask with pentane. Prepare three additional
standards, each 10-fold more dilute than the preceding one. Use densities at
20°C.
Procedure
1. The programmer Upper Limit is set at 150°C. (If this setting
does not produce a column temperature of 150°C, find the cor-
rect setting.)
2. The programmer Lower Limit is set at 20°C.
3. Verify the instrument and samples at room temperature.
4. Inject 1 pi of the n-alkane mixture.
5. Start the integrator.
6. Start the recorder.
7. Shut the oven door.
8. Change mode to Automatic; turn Lower Limit dial to 30°C to
start the program.
9. Repeat Steps 1-8 a sufficient number of times so that the
relative standard deviation of the retention times for each
peak is <5%.
To attain the required retention time precision, both the carrier gas flow
rate and temperature program specifications must be followed.
This calibration is performed at the start of an analytical program. The
mixture is chromatographed at the start of each day.
Response Calibration
For the purpose of a Level 1 analysis the peak area data obtained above
for n-decane is adequate.
C7-C16 GC Analysis
Apparatus
« Gas chromatograph set up and working.
• Recorder, integrator working.
196
image:
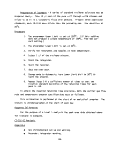 Syringe and syringe cleaning apparatus.
Parameters: Electrometer setting is 1 j
is set at 1-in/min and 1 mV full-scale.
• Parameters: Electrometer setting is 1 x 10 A/mV; recorder
Procedure
1. Label chromatogram: date, sample number, etc.
2. Inject sample.
3. Start integrator, recorder, temperature.
4. Clean syringe.
5. Return sample: obtain new sample.
6. When analysis is finished allow instrument to cool. Turn
chromatograph and integrator output and data sheet over to
data analyst.
Syringe Cleaning
Apparatus
• Hamilton syringe cleaner connected to water aspirator.
• Reagent grade pentane and methylene chloride.
• Disposable pipettes and medicine dropper bulbs.
Procedure
1. Remove plunger from syringe.
2. Insert syringe into cleaner; turn on aspirator.
3. Fill pipette with pentane; run pentane through syringe.
4. Repeat with methylene chloride from a separate pipette.
5. Fill pipette with pentane; flush plunger with pentane.
6. Repeat with methylene chloride.
Calculations
Boiling Point — Retention Time Calibration
The required data for this calibration are on the data sheet. The data
reduction is performed thusly:
1. Average the retention times and calculate relative standard
deviations for each n-hydrocarbon.
197
image:
Syringe and syringe cleaning apparatus.
Parameters: Electrometer setting is 1 j
is set at 1-in/min and 1 mV full-scale.
• Parameters: Electrometer setting is 1 x 10 A/mV; recorder
Procedure
1. Label chromatogram: date, sample number, etc.
2. Inject sample.
3. Start integrator, recorder, temperature.
4. Clean syringe.
5. Return sample: obtain new sample.
6. When analysis is finished allow instrument to cool. Turn
chromatograph and integrator output and data sheet over to
data analyst.
Syringe Cleaning
Apparatus
• Hamilton syringe cleaner connected to water aspirator.
• Reagent grade pentane and methylene chloride.
• Disposable pipettes and medicine dropper bulbs.
Procedure
1. Remove plunger from syringe.
2. Insert syringe into cleaner; turn on aspirator.
3. Fill pipette with pentane; run pentane through syringe.
4. Repeat with methylene chloride from a separate pipette.
5. Fill pipette with pentane; flush plunger with pentane.
6. Repeat with methylene chloride.
Calculations
Boiling Point — Retention Time Calibration
The required data for this calibration are on the data sheet. The data
reduction is performed thusly:
1. Average the retention times and calculate relative standard
deviations for each n-hydrocarbon.
197
image:
 2. Plot average retention times as abscissae versus normal boil-
ing points as ordinates.
3. Draw in calibration curve.
4. Locate and record retention times corresponding to boiling
ranges (90-110°, 110-140°, 140-160°, 160-180°, 180-200°,
200-220°, 220-240°, 240-260°, 260-280°, 280-300°C).
Response-Amount Calibration
The required data for this calibration are on the data sheet. The data
reduction is performed thusly:
1. Average the area response of decane from each standard and
calculate relative standard deviations.
2. Plot response (yV • sec) as ordinate versus ng/yl as
abscissae.
3. Draw in the curve. Perform least squares regression and
obtain slope (yV • sec • yl/ng).
C7-C16 Analysis
The required data from the analyses are on the data sheet. The data reduc-
tion is performed thusly:
1. Sum the areas of peaks in the proper retention time ranges.
2. Convert areas (yV • sec) to ng/yl by dividing by the proper
weight response (yV • sec • yl/ng).
3. Obtain total volume of extract. Multiply each weight by total
extract volume to get weight of species in each range in the
sample.
4. If the volume of gas sampled or the total weight of sample
acquired is available, convert result of Step 3 above to
mg/nr.
Precision and Accuracy
Even a crude error propagation analysis is beyond the scope of this proce-
dure. With reasonable care, peak area reproducibility of a standard should be
of the order of 1% RSD. The relative standard deviation of the sum of all
peaks in a fairly complex waste might be of the order of 5-10%. Accuracy is
more difficult to assess. With good analytical technique, accuracy and preci-
sion should be of the order of 10-20%.
198
image:
2. Plot average retention times as abscissae versus normal boil-
ing points as ordinates.
3. Draw in calibration curve.
4. Locate and record retention times corresponding to boiling
ranges (90-110°, 110-140°, 140-160°, 160-180°, 180-200°,
200-220°, 220-240°, 240-260°, 260-280°, 280-300°C).
Response-Amount Calibration
The required data for this calibration are on the data sheet. The data
reduction is performed thusly:
1. Average the area response of decane from each standard and
calculate relative standard deviations.
2. Plot response (yV • sec) as ordinate versus ng/yl as
abscissae.
3. Draw in the curve. Perform least squares regression and
obtain slope (yV • sec • yl/ng).
C7-C16 Analysis
The required data from the analyses are on the data sheet. The data reduc-
tion is performed thusly:
1. Sum the areas of peaks in the proper retention time ranges.
2. Convert areas (yV • sec) to ng/yl by dividing by the proper
weight response (yV • sec • yl/ng).
3. Obtain total volume of extract. Multiply each weight by total
extract volume to get weight of species in each range in the
sample.
4. If the volume of gas sampled or the total weight of sample
acquired is available, convert result of Step 3 above to
mg/nr.
Precision and Accuracy
Even a crude error propagation analysis is beyond the scope of this proce-
dure. With reasonable care, peak area reproducibility of a standard should be
of the order of 1% RSD. The relative standard deviation of the sum of all
peaks in a fairly complex waste might be of the order of 5-10%. Accuracy is
more difficult to assess. With good analytical technique, accuracy and preci-
sion should be of the order of 10-20%.
198
image:
 6. LIQUID CHROMATOGRAPHIC SEPARATIONS
Scope and Application
Scope
This procedure is designed to give a separation of a sample into eight
reasonably distinct classes of compounds.
Application
This procedure applies to Level 1 analyses and to those samples which con-
tain a minimum of 50 mg of nonvolatile organics.
Range
Samples may range from 50 to 100 mg. The optimum size is considered to
be 100 mg.
Sensitivity
As defined, this procedure will permit the analyst to measure as low as
1 yg of residue.
Detection Limit
The detection limit is 1 yg of residue.
Interferences
There are no interferences.
Limitations
Compounds of too high polarity or molecular weight will not be eluted from
the column since this procedure is a compromise between cost and data acquisi-
tion. Also, compounds of too low molecular weight will be evaporated along
with the sample solvent during sample preparation.
Summary of Method
A sample of weighing from 50-100 mg is placed on a silica gel liquid
chromatographic column. A series of eight (8) eluents are employed to sepa-
rate the sample into eight nominally distinct classes of compounds for further
analyses.
199
image:
6. LIQUID CHROMATOGRAPHIC SEPARATIONS
Scope and Application
Scope
This procedure is designed to give a separation of a sample into eight
reasonably distinct classes of compounds.
Application
This procedure applies to Level 1 analyses and to those samples which con-
tain a minimum of 50 mg of nonvolatile organics.
Range
Samples may range from 50 to 100 mg. The optimum size is considered to
be 100 mg.
Sensitivity
As defined, this procedure will permit the analyst to measure as low as
1 yg of residue.
Detection Limit
The detection limit is 1 yg of residue.
Interferences
There are no interferences.
Limitations
Compounds of too high polarity or molecular weight will not be eluted from
the column since this procedure is a compromise between cost and data acquisi-
tion. Also, compounds of too low molecular weight will be evaporated along
with the sample solvent during sample preparation.
Summary of Method
A sample of weighing from 50-100 mg is placed on a silica gel liquid
chromatographic column. A series of eight (8) eluents are employed to sepa-
rate the sample into eight nominally distinct classes of compounds for further
analyses.
199
image:
 Sample Handling and Preservation
The traveler for this analysis will specify the volume of concentrated
extract to be taken to give an appropriate weight of material for the separa-
tion. This specified volume is withdrawn with a graduated pipette. Then the
sample is returned to storage.
Apparatus
Reagents
Column: 200 mm x 10.5 mm ID, glass with Teflon stopcock.
Adsorbent: Davison Silica Gel, 60-200 mesh, Grade 950
Graduated cylinders: 25 ml and 10 ml.
Aluminum weighing dishes: precleaned.
Volumetric Flasks: 2-25 ml and 6-10 ml, precleaned.
Beakers: size depends on sample size.
Microspatula.
Disposable pipettes, medicine droppers.
Glass wool.
Funnel.
• Solvents are all "reagent" grade or better.
Eluents
1-pentane Collect 25 ml
2-20% CH2Cl2/Pentane Collect 10 ml
3-50% CH2Cl2/Pentane Collect 10 ml
4-CH2Cl2 Collect 10 ml
5-5% CH3OH/CH2C12 Collect 10 ml
6-20% CH3OH/CH2C12 Collect 10 ml
7-50% CH2OH/CH2C12 Collect 10 ml
8-conc. HC1/CH3OH/CH2C12 (5+70+30) Collect 25 ml
Procedure
The volume of samples expected during the Source Assessment program means
that a reasonable number of LC separations will be performed. Six columns is
the maximum that will be operated by any single analyst. Of these six columns,
one will be a blank (no sample added to column).
200
image:
Sample Handling and Preservation
The traveler for this analysis will specify the volume of concentrated
extract to be taken to give an appropriate weight of material for the separa-
tion. This specified volume is withdrawn with a graduated pipette. Then the
sample is returned to storage.
Apparatus
Reagents
Column: 200 mm x 10.5 mm ID, glass with Teflon stopcock.
Adsorbent: Davison Silica Gel, 60-200 mesh, Grade 950
Graduated cylinders: 25 ml and 10 ml.
Aluminum weighing dishes: precleaned.
Volumetric Flasks: 2-25 ml and 6-10 ml, precleaned.
Beakers: size depends on sample size.
Microspatula.
Disposable pipettes, medicine droppers.
Glass wool.
Funnel.
• Solvents are all "reagent" grade or better.
Eluents
1-pentane Collect 25 ml
2-20% CH2Cl2/Pentane Collect 10 ml
3-50% CH2Cl2/Pentane Collect 10 ml
4-CH2Cl2 Collect 10 ml
5-5% CH3OH/CH2C12 Collect 10 ml
6-20% CH3OH/CH2C12 Collect 10 ml
7-50% CH2OH/CH2C12 Collect 10 ml
8-conc. HC1/CH3OH/CH2C12 (5+70+30) Collect 25 ml
Procedure
The volume of samples expected during the Source Assessment program means
that a reasonable number of LC separations will be performed. Six columns is
the maximum that will be operated by any single analyst. Of these six columns,
one will be a blank (no sample added to column).
200
image:
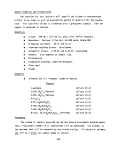 The data to be obtained are:
• Weight of sample added to column.
• Weights of fractions after they have been evaporated in
aluminum dishes to constant weight.
Data are indicated on the data sheet.
Sample Preparation —
1. Obtain volume of sample extract calculated to give either the
optimum weight, 100 mg or a weight not less than 50 mg.
2. Obtain a precleaned and labeled beaker of at least 30% greater
capacity than the required volume of sample. Pipette the sam-
ple into the beaker, cover loosely with a watch glass, set in
hood and allow solvent to come to near dryness.
3. Quantitatively transfer the near-dry sample into a clean,
tared, and labeled glass weighing boat. Rinse the beaker with
methylene chloride into boat.
4. Check the weight of the boat twice daily until the weight
is stable. This is the sample weight.
5. Add 0.5-1.0 g of freshly activated silica gel to the weigh-
ing boat and mix thoroughly with a sample using a microspatula.
Activation of Silica Gel
Activate the silica gel for 2 hours in a drying oven at 110°C. Cool and
store in a desiccator.
Column Packing
1. Plug the outlet of the precleaned column with glass wool. Pack
the column with 6.5 grams of freshly activated silica gel. For
freshly activated silica gel, this weight occupies 9 ml in a
10 ml graduated cylinder. Tap the column briefly with the
microspatula to compact the bed.
2. Take a 50 ml volume of pentane and pour it through the column
until the bed is homogeneous, free of any cracks, and free of
any air bubbles. Continue pentane flow until the 50 ml volume
is used. The pentane level should be at the top of the bed,
hereafter called the origin. NEVER ALLOW THE TOP OF THE BED
TO 60 DRY.
201
image:
The data to be obtained are:
• Weight of sample added to column.
• Weights of fractions after they have been evaporated in
aluminum dishes to constant weight.
Data are indicated on the data sheet.
Sample Preparation —
1. Obtain volume of sample extract calculated to give either the
optimum weight, 100 mg or a weight not less than 50 mg.
2. Obtain a precleaned and labeled beaker of at least 30% greater
capacity than the required volume of sample. Pipette the sam-
ple into the beaker, cover loosely with a watch glass, set in
hood and allow solvent to come to near dryness.
3. Quantitatively transfer the near-dry sample into a clean,
tared, and labeled glass weighing boat. Rinse the beaker with
methylene chloride into boat.
4. Check the weight of the boat twice daily until the weight
is stable. This is the sample weight.
5. Add 0.5-1.0 g of freshly activated silica gel to the weigh-
ing boat and mix thoroughly with a sample using a microspatula.
Activation of Silica Gel
Activate the silica gel for 2 hours in a drying oven at 110°C. Cool and
store in a desiccator.
Column Packing
1. Plug the outlet of the precleaned column with glass wool. Pack
the column with 6.5 grams of freshly activated silica gel. For
freshly activated silica gel, this weight occupies 9 ml in a
10 ml graduated cylinder. Tap the column briefly with the
microspatula to compact the bed.
2. Take a 50 ml volume of pentane and pour it through the column
until the bed is homogeneous, free of any cracks, and free of
any air bubbles. Continue pentane flow until the 50 ml volume
is used. The pentane level should be at the top of the bed,
hereafter called the origin. NEVER ALLOW THE TOP OF THE BED
TO 60 DRY.
201
image:
 Elution of Sample
1. Position a 25-ml graduated cylinder as a receiver under the
column. Transfer the prepared sample into the column. Rinse
weighing funnel into the column three times with 1 ml of
pentane each time. Begin adding 22 ml of pentane, and start
elution at a flow rate not greater than 1 ml/min. Collect
22 ml of pentane, adding more to the column if necessary. Do
not allow pentane to go below the top of the bed.
2. When 22 ml of pentane are collected, the pentane level is at
the top of the bed. In a graduated cylinder, take 10 ml of
Eluent No. 2. Rinse the glass weighing boat with 2 ml of
Eluent No. 2 into the column. Add the remaining 8 ml of Eluent
No. 2 into the column and start eluting. Collect 3 ml of
eluent in the 25 ml receiver. Stop elution. This is the first
fraction. Label this and succeeding fractions as they are
collected.
3. After the first fraction has been collected, place a 10 ml
volumetric flask under the column as receiver. Start elution
and collect 10 ml of Fraction 2, adding small amount of Eluent
No. 2, 20% CHoCl2 in pentane, as necessary. At the end of
collection, the solvent level must be at the origin. This is
fraction No. 2.
4. Replace the receiver with another 10-ml volumetric flask.
Take 10 ml of Eluent No. 3, 50% CH2Cl2/pentane in a graduated
cylinder. Rinse glass weighing boat with 2 ml into the col-
umn. Start elution, adding remaining solvent. Collect 10 ml
of Fraction No. 3, adding small amounts of the solvent if nec-
essary. Again, the solvent level must be at the origin.
5. Repeat step 4 with the remaining eluents:
• CH2C12, 10 ml
t 5% CH30H/CH2C12, 10 ml
• 20% CH30H/CH2Cl2, 10 ml
• 50% CH30H/CH2C12, 10 ml
• Cone. HCl/CH3/OH/CH2Cl2 (5:70:30), 25 ml
6. In the area specified for solvent evaporation, quantitatively
transfer sample Fractions 1-7 into precleaned, tared, and
labeled aluminum microweighing dishes. Fraction 8 is trans-
ferred into a small tared and labeled glass petri dish. Quan-
titative transfer is finally effected by rinsing each sample
fraction receiver two times with 2-ml volumes of methylene
chloride.
202
image:
Elution of Sample
1. Position a 25-ml graduated cylinder as a receiver under the
column. Transfer the prepared sample into the column. Rinse
weighing funnel into the column three times with 1 ml of
pentane each time. Begin adding 22 ml of pentane, and start
elution at a flow rate not greater than 1 ml/min. Collect
22 ml of pentane, adding more to the column if necessary. Do
not allow pentane to go below the top of the bed.
2. When 22 ml of pentane are collected, the pentane level is at
the top of the bed. In a graduated cylinder, take 10 ml of
Eluent No. 2. Rinse the glass weighing boat with 2 ml of
Eluent No. 2 into the column. Add the remaining 8 ml of Eluent
No. 2 into the column and start eluting. Collect 3 ml of
eluent in the 25 ml receiver. Stop elution. This is the first
fraction. Label this and succeeding fractions as they are
collected.
3. After the first fraction has been collected, place a 10 ml
volumetric flask under the column as receiver. Start elution
and collect 10 ml of Fraction 2, adding small amount of Eluent
No. 2, 20% CHoCl2 in pentane, as necessary. At the end of
collection, the solvent level must be at the origin. This is
fraction No. 2.
4. Replace the receiver with another 10-ml volumetric flask.
Take 10 ml of Eluent No. 3, 50% CH2Cl2/pentane in a graduated
cylinder. Rinse glass weighing boat with 2 ml into the col-
umn. Start elution, adding remaining solvent. Collect 10 ml
of Fraction No. 3, adding small amounts of the solvent if nec-
essary. Again, the solvent level must be at the origin.
5. Repeat step 4 with the remaining eluents:
• CH2C12, 10 ml
t 5% CH30H/CH2C12, 10 ml
• 20% CH30H/CH2Cl2, 10 ml
• 50% CH30H/CH2C12, 10 ml
• Cone. HCl/CH3/OH/CH2Cl2 (5:70:30), 25 ml
6. In the area specified for solvent evaporation, quantitatively
transfer sample Fractions 1-7 into precleaned, tared, and
labeled aluminum microweighing dishes. Fraction 8 is trans-
ferred into a small tared and labeled glass petri dish. Quan-
titative transfer is finally effected by rinsing each sample
fraction receiver two times with 2-ml volumes of methylene
chloride.
202
image:
 7. The solvents are allowed to evaporate. When Fraction 8 appears
dry, dissolve it in CH2C12 and transfer to a second tared and
labeled glass petri dish. This transfer is intended to sepa-
rate organics from silica from the column. When all fractions
appear dry, weigh twice daily until stability occurs: ±0.002 mg.
8. After final weights are obtained, store the dishes in a desic-
cator and return to sample controller.
Calculations
Data collected are:
t Weights of sample until constant weight was achieved.
• Weights of the fraction until constant weights were achieved.
• Weights of the blank fractions until constant weights were
achieved.
The weights of the sample fraction are corrected for the weights of the
corresponding blank fractions.
Data transmitted to program management will be the corrected fraction
weights. For internal use, the percentage overall recovery and weight per-
centage distribution in the fractions will also be calculated.
Accuracy and Precision
Presently there are no data by which this procedure can be evaluated.
Accuracy and -precision appear to be sufficient for Level 1 analyses.
7. INFRARED ANALYSIS
Scope and Application
This procedure is used to determine the functional group types present in
an organic sample of LC fraction of a partitioned sample. The IR data, when
interpreted, provide information on functionality, e.g., carbonyl, aromatic
hydrocarbon, alcohol, amine, aliphatic hydrocarbon, halogenated organic, etc.
Compound information is possible only when that compound is known to be pres-
ent as a dominant constituent in the sample. However, such foreknowledge is
normally unlikely.
Sample amounts required for this analysis are in the milligram (mg) range.
A compound must be present in the sample at about 5%-10% (w/w) or more in order
203
image:
7. The solvents are allowed to evaporate. When Fraction 8 appears
dry, dissolve it in CH2C12 and transfer to a second tared and
labeled glass petri dish. This transfer is intended to sepa-
rate organics from silica from the column. When all fractions
appear dry, weigh twice daily until stability occurs: ±0.002 mg.
8. After final weights are obtained, store the dishes in a desic-
cator and return to sample controller.
Calculations
Data collected are:
t Weights of sample until constant weight was achieved.
• Weights of the fraction until constant weights were achieved.
• Weights of the blank fractions until constant weights were
achieved.
The weights of the sample fraction are corrected for the weights of the
corresponding blank fractions.
Data transmitted to program management will be the corrected fraction
weights. For internal use, the percentage overall recovery and weight per-
centage distribution in the fractions will also be calculated.
Accuracy and Precision
Presently there are no data by which this procedure can be evaluated.
Accuracy and -precision appear to be sufficient for Level 1 analyses.
7. INFRARED ANALYSIS
Scope and Application
This procedure is used to determine the functional group types present in
an organic sample of LC fraction of a partitioned sample. The IR data, when
interpreted, provide information on functionality, e.g., carbonyl, aromatic
hydrocarbon, alcohol, amine, aliphatic hydrocarbon, halogenated organic, etc.
Compound information is possible only when that compound is known to be pres-
ent as a dominant constituent in the sample. However, such foreknowledge is
normally unlikely.
Sample amounts required for this analysis are in the milligram (mg) range.
A compound must be present in the sample at about 5%-10% (w/w) or more in order
203
image:
 for the stronger functional groups of the compound to become apparent for inter-
pretive purposes. Organic solvents, water and some inorganic materials cause
interferences. Water and other substances may also cause a decrease in the
quality (e.g., resolution of a spectrum, sensitivity) of the analysis.
Summary of Method
The sample or LC fraction, after evaporation, is either (1) taken up in a
small amount of methylene chloride and transferred to a KBr salt plate, or (2)
mixed in a KBr mull and pressed into a pellet. A grating IR spectrophotometer
is used to scan the sample in the IR region from 2.5 to 25 microns. The spec-
trum is then interpreted to determine functional groups types in the sample.
Definitions
Sample cell -Two KBr salt plates with the sample sandwiched in between.
Sample Handling and Preservation
These samples are typically found in the aluminum weighing dishes in which
solvent, water or other volatile matter has been removed by evaporation or des-
iccation. The samples should be covered and stored in a refrigerator when not
being used. All glassware, implements, etc., should be carefully cleaned, sol-
vent rinsed, and dried before use in this procedure. Contact of sample with
hands, fingers and other sources of outside contamination shall be avoided.
Equipment
• Infrared (IR) spectrophotometer, grating dispersion. Perkin-
Elmer 521 or equivalent.
• KBr salt plates —Configured to fit sample holder of spectro-
photometer. Transparent to the IR in the 2.5 to 15 micron
region.
• KBr pellet press - Hydraulic type is preferred (Carver Model C
or equivalent) but hand-held devices are acceptable, e.g.,
Perkin-Elmer 186-0436 or equivalent.
• KBr pellet die —To prepare 13 mm diameter or equivalent pellet
to contain approximately 1 mg of sample. Perkin-Elmer 186-00250
or equivalent.
• Pipette, Pasteur, disposable - Sargent S-69647-30 or equivalent.
• Standard polystyrene film sample -Normally supplied by
instrument manufacturer.
204
image:
for the stronger functional groups of the compound to become apparent for inter-
pretive purposes. Organic solvents, water and some inorganic materials cause
interferences. Water and other substances may also cause a decrease in the
quality (e.g., resolution of a spectrum, sensitivity) of the analysis.
Summary of Method
The sample or LC fraction, after evaporation, is either (1) taken up in a
small amount of methylene chloride and transferred to a KBr salt plate, or (2)
mixed in a KBr mull and pressed into a pellet. A grating IR spectrophotometer
is used to scan the sample in the IR region from 2.5 to 25 microns. The spec-
trum is then interpreted to determine functional groups types in the sample.
Definitions
Sample cell -Two KBr salt plates with the sample sandwiched in between.
Sample Handling and Preservation
These samples are typically found in the aluminum weighing dishes in which
solvent, water or other volatile matter has been removed by evaporation or des-
iccation. The samples should be covered and stored in a refrigerator when not
being used. All glassware, implements, etc., should be carefully cleaned, sol-
vent rinsed, and dried before use in this procedure. Contact of sample with
hands, fingers and other sources of outside contamination shall be avoided.
Equipment
• Infrared (IR) spectrophotometer, grating dispersion. Perkin-
Elmer 521 or equivalent.
• KBr salt plates —Configured to fit sample holder of spectro-
photometer. Transparent to the IR in the 2.5 to 15 micron
region.
• KBr pellet press - Hydraulic type is preferred (Carver Model C
or equivalent) but hand-held devices are acceptable, e.g.,
Perkin-Elmer 186-0436 or equivalent.
• KBr pellet die —To prepare 13 mm diameter or equivalent pellet
to contain approximately 1 mg of sample. Perkin-Elmer 186-00250
or equivalent.
• Pipette, Pasteur, disposable - Sargent S-69647-30 or equivalent.
• Standard polystyrene film sample -Normally supplied by
instrument manufacturer.
204
image:
 Reagents
• Methylene Chloride - Spectrophotometric grade
• KBr powder - spectrograde
Procedure
It is possible that two sample forms will occur: (1) an amorphous mass
(expected to be the typical sample) and (2) a crystalline or powdery mass.
Separate procedures are desirable for these two forms in order to obtain the
best available spectra.
Procedure for Amorphous Material
Add a few drops of methylene chloride to solubilize the sample slightly
and mix with the tip of a disposable Pasteur pipette. Then using the pipette,
take a few drops of this material and transfer to a clean KBr salt plate.
Allow the solvent to evaporate at ambient temperature, and then press the other
salt plate to spread the sample throughout the area where the IR beam impinges
on the plate. Mount the sample cell in the sample compartment of the spectro-
photometer previously prepared according to the manufacturer's manual and check
for resolution (see Note on Resolution). Scan the region from 2.5 to 15 microns
using the parameters in Table C-2. The sample size should be adjusted so that
the most intense peak in the spectrum has a percent transmission of between
5 to 15 percent. If the spectrum is too weak, more sample must be added, the
solvent evaporated, the plates re-assembled, and the spectrum rerun as above.
If the spectrum is too strong, i.e., peaks with less than 5 percent, excess
sample must be removed by wiping the plates and rerun as above.
TABLE C-2. INSTRUMENT SCANNING PARAMETERS
Scan time for 2.5 - 15 microns 8-10 minutes
Scale expansion IX
Transmittance/absorbance mode switch Transmittance
205
image:
Reagents
• Methylene Chloride - Spectrophotometric grade
• KBr powder - spectrograde
Procedure
It is possible that two sample forms will occur: (1) an amorphous mass
(expected to be the typical sample) and (2) a crystalline or powdery mass.
Separate procedures are desirable for these two forms in order to obtain the
best available spectra.
Procedure for Amorphous Material
Add a few drops of methylene chloride to solubilize the sample slightly
and mix with the tip of a disposable Pasteur pipette. Then using the pipette,
take a few drops of this material and transfer to a clean KBr salt plate.
Allow the solvent to evaporate at ambient temperature, and then press the other
salt plate to spread the sample throughout the area where the IR beam impinges
on the plate. Mount the sample cell in the sample compartment of the spectro-
photometer previously prepared according to the manufacturer's manual and check
for resolution (see Note on Resolution). Scan the region from 2.5 to 15 microns
using the parameters in Table C-2. The sample size should be adjusted so that
the most intense peak in the spectrum has a percent transmission of between
5 to 15 percent. If the spectrum is too weak, more sample must be added, the
solvent evaporated, the plates re-assembled, and the spectrum rerun as above.
If the spectrum is too strong, i.e., peaks with less than 5 percent, excess
sample must be removed by wiping the plates and rerun as above.
TABLE C-2. INSTRUMENT SCANNING PARAMETERS
Scan time for 2.5 - 15 microns 8-10 minutes
Scale expansion IX
Transmittance/absorbance mode switch Transmittance
205
image:
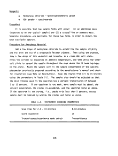 Procedure for Crystalline Material -
The preferable IR sample preparation for crystalline or powdery materials
is a KBr pellet. Mix the sample thoroughly to ensure homogeneity. Take about
1 mg of sample and mix with typically 300 mg of KBr powder (amounts can be
adjusted to meet specifications of the KBr pellet die used). A small mortar
and pestle can be used to mix the sample, but the use of a sample amalgamator
or motorized grinder is probably preferable. Add the mixture to the pellet die,
assemble and press the pellet according to the manufacturer's instructions, and
check for resolution (see Note below). The resulting pellet is placed in the
instrument's sample stage, and it is scanned using the parameters in Table C-l.
Normally, the ratio of 1 mg to 300 mg KBr powder yields a spectrum of the
proper intensity. However, more sample can be added, or the pellet diluted
with more KBr, reground, and rerun as required.
Note on Resolution
The instrument settings affecting resolution will vary somewhat with dif-
ferent instrument manufacturers and models. The instrument preparation shall
include a test scan using a standard polystyrene film. Comparison of the
obtained spectra with an acceptably resolved standard spectra for the standard
will demonstrate that the instrument is performing acceptably. This resolution
check shall be performed at least once each day that samples are analyzed.
The resulting spectra are interpreted by one with training and experience
in this field. Access to the several general and special literature sources
on IR interpretation are assumed.
Calculations
Calculations are not required in this qualitative technique.
Accuracy and Precision
Values cannot be given owing to (1) the variable nature of the sample and
(2) the qualitative, not quantitative, nature of the analyses.
8. LOW RESOLUTION MASS SPECTROMETRIC ANALYSIS
Scope and Application
This procedure is a survey analysis used to determine compound types in an
organic sample or in an LC fraction of a sample. The analyst is specifically
206
image:
Procedure for Crystalline Material -
The preferable IR sample preparation for crystalline or powdery materials
is a KBr pellet. Mix the sample thoroughly to ensure homogeneity. Take about
1 mg of sample and mix with typically 300 mg of KBr powder (amounts can be
adjusted to meet specifications of the KBr pellet die used). A small mortar
and pestle can be used to mix the sample, but the use of a sample amalgamator
or motorized grinder is probably preferable. Add the mixture to the pellet die,
assemble and press the pellet according to the manufacturer's instructions, and
check for resolution (see Note below). The resulting pellet is placed in the
instrument's sample stage, and it is scanned using the parameters in Table C-l.
Normally, the ratio of 1 mg to 300 mg KBr powder yields a spectrum of the
proper intensity. However, more sample can be added, or the pellet diluted
with more KBr, reground, and rerun as required.
Note on Resolution
The instrument settings affecting resolution will vary somewhat with dif-
ferent instrument manufacturers and models. The instrument preparation shall
include a test scan using a standard polystyrene film. Comparison of the
obtained spectra with an acceptably resolved standard spectra for the standard
will demonstrate that the instrument is performing acceptably. This resolution
check shall be performed at least once each day that samples are analyzed.
The resulting spectra are interpreted by one with training and experience
in this field. Access to the several general and special literature sources
on IR interpretation are assumed.
Calculations
Calculations are not required in this qualitative technique.
Accuracy and Precision
Values cannot be given owing to (1) the variable nature of the sample and
(2) the qualitative, not quantitative, nature of the analyses.
8. LOW RESOLUTION MASS SPECTROMETRIC ANALYSIS
Scope and Application
This procedure is a survey analysis used to determine compound types in an
organic sample or in an LC fraction of a sample. The analyst is specifically
206
image:
 searching for hazardous compounds or compounds which may be generally consid-
ered toxic. Examples are aromatic hydrocarbons and chlorinated organics. Anal-
ysis using different sample ionizing parameters results in molecular weight
data which, combined with IR and sample data, can provide specific compound
category identifications on a "most probable" basis.
The MS instrument when used in this procedure has a sensitivity such that
1 nanogram or less presented to the ionizing chamber can result in a full
spectrum with a signal to noise ratio of 10:1. A dynamic range of 250,000 or
better is achievable.
However, the detection limit for a specific compound related to the size
of an air sample or liquid sample will vary widely depending on the types and
amounts of species in the mixture. This is because of the interfering effect
that each compound has on the spectral data. The impact of this interference
phenomenon can be reduced by lowering the ionization voltage resulting in spec-
tra containing largely molecular ions. This is discussed later.
Summary of Method
The samples are dissolved in a small amount of solvent and placed in a
sample cup or capillary of the direct insertion probe using a syringe. More
volatile samples are weighed into a cuvette for assembly into a batch or liquid
inlet system. The probe or cuvette is temperature programmed from ambient
temperature up to 300°C. Periodic MS scans are taken of the volatilized sam-
ple during the program using either an ionizing voltage of 70eV or a lower
range (10-15eV) or both. This is at the discretion of the operator depending
upon the real time data he is observing. The resulting spectra are interpreted
using reference compound spectra libraries, IR data, and other chemical infor-
mation known about the sample. The result is compound type information, groups
of homologous compounds, and in some cases specific compounds.
Definitions
• LRMS — Low resolution mass spectrometry. Low resolution in
this sense means that typically only unit mass data are used,
and the instrument resolution can separate adjacent peaks
differing by one atomic mass unit (AMU).
• LC — Liquid Chromatography
207
image:
searching for hazardous compounds or compounds which may be generally consid-
ered toxic. Examples are aromatic hydrocarbons and chlorinated organics. Anal-
ysis using different sample ionizing parameters results in molecular weight
data which, combined with IR and sample data, can provide specific compound
category identifications on a "most probable" basis.
The MS instrument when used in this procedure has a sensitivity such that
1 nanogram or less presented to the ionizing chamber can result in a full
spectrum with a signal to noise ratio of 10:1. A dynamic range of 250,000 or
better is achievable.
However, the detection limit for a specific compound related to the size
of an air sample or liquid sample will vary widely depending on the types and
amounts of species in the mixture. This is because of the interfering effect
that each compound has on the spectral data. The impact of this interference
phenomenon can be reduced by lowering the ionization voltage resulting in spec-
tra containing largely molecular ions. This is discussed later.
Summary of Method
The samples are dissolved in a small amount of solvent and placed in a
sample cup or capillary of the direct insertion probe using a syringe. More
volatile samples are weighed into a cuvette for assembly into a batch or liquid
inlet system. The probe or cuvette is temperature programmed from ambient
temperature up to 300°C. Periodic MS scans are taken of the volatilized sam-
ple during the program using either an ionizing voltage of 70eV or a lower
range (10-15eV) or both. This is at the discretion of the operator depending
upon the real time data he is observing. The resulting spectra are interpreted
using reference compound spectra libraries, IR data, and other chemical infor-
mation known about the sample. The result is compound type information, groups
of homologous compounds, and in some cases specific compounds.
Definitions
• LRMS — Low resolution mass spectrometry. Low resolution in
this sense means that typically only unit mass data are used,
and the instrument resolution can separate adjacent peaks
differing by one atomic mass unit (AMU).
• LC — Liquid Chromatography
207
image:
 • MS - Mass Spectrometer
• Molecular ion —The ionized molecule, unfragmented, which when
detected, provides the molecular weight of the molecule.
• "Most probable" - This term refers to the confidence in a com-
pound identification based upon all chemical and spectroscopic
information known about the sample.
Sample Handling and Preservation
These samples are usually found as residues in aluminum dishes, from which
extraction and separation solvents have been removed, along with water, by
evaporation and desiccation. On some occasions, the residue is somewhat fluid
due to a rather nonvolatile liquid being present. These samples should be
stored in a refrigerator when not being used. All dishes and implements must
be carefully washed in warm soapy water, rinsed several times with water,
rinsed in pure organic solvents such as hexane, acetone, or methylene chloride
and dried. Contact of the sample with hands, fingers and other sources of out-
side contamination must be avoided.
Apparatus
Finnigan - Model 4023 Automated GC/MS
Several other quadrupole or magnetic sector MS instruments, automated or
manual, are available to perform this analysis. Minimum requirements are:
• Resolution of at least 1000 over the 40 to 1000 AMU range.
• A solid inlet system.
t A batch inlet system for liquid samples. (This can be the
gas chromatograph.)
• Variable ionization voltages from zero to at least 70 eV.
• Electron multiplier detection system.
Reagents
Supplies of the following solvents, Pesticide Grade, Distilled-in-Glass ,
or equivalent should be kept in 1- or 2-liter quantities. These solvents will
be used to solubilize the residues as required for homogenization of the sample
and its placement in the solid probe capillary. The choice of the proper
208
image:
• MS - Mass Spectrometer
• Molecular ion —The ionized molecule, unfragmented, which when
detected, provides the molecular weight of the molecule.
• "Most probable" - This term refers to the confidence in a com-
pound identification based upon all chemical and spectroscopic
information known about the sample.
Sample Handling and Preservation
These samples are usually found as residues in aluminum dishes, from which
extraction and separation solvents have been removed, along with water, by
evaporation and desiccation. On some occasions, the residue is somewhat fluid
due to a rather nonvolatile liquid being present. These samples should be
stored in a refrigerator when not being used. All dishes and implements must
be carefully washed in warm soapy water, rinsed several times with water,
rinsed in pure organic solvents such as hexane, acetone, or methylene chloride
and dried. Contact of the sample with hands, fingers and other sources of out-
side contamination must be avoided.
Apparatus
Finnigan - Model 4023 Automated GC/MS
Several other quadrupole or magnetic sector MS instruments, automated or
manual, are available to perform this analysis. Minimum requirements are:
• Resolution of at least 1000 over the 40 to 1000 AMU range.
• A solid inlet system.
t A batch inlet system for liquid samples. (This can be the
gas chromatograph.)
• Variable ionization voltages from zero to at least 70 eV.
• Electron multiplier detection system.
Reagents
Supplies of the following solvents, Pesticide Grade, Distilled-in-Glass ,
or equivalent should be kept in 1- or 2-liter quantities. These solvents will
be used to solubilize the residues as required for homogenization of the sample
and its placement in the solid probe capillary. The choice of the proper
208
image:
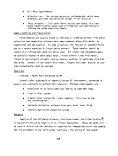 solvent(s) rests with the operator and his knowledge of the sample (e.g., which
LC fraction, IR data, solubilities, etc.);
• Pentane
• Methylene chloride
• Methanol
• Petroleum ether
§ D1ethyl ether
Procedure
Instrument Preparation
The procedure assumes that the MS has been activated per the manufacturer's
manual and is prepared to gather and record data. Briefly summarized this pro-
cedure includes:
• Monitoring all applicable pressures and confirming that proper
vacuum levels are being achieved.
• Checking all applicable temperatures and making adjustments
as necessary.
• Checking performance of ionizer.
t Optimizing resolution/sensitivity.
t Confirming that all electronics associated with data gathering
are functioning properly.
When all the necessary checks have been performed, then proceed with the anal-
ysis of a sample.
Analysis of the Sample
1. Place 1 microgram or less of the sample under test in a solid
probe glass capillary. The sample may be inserted as a solid
but it is preferable to first dissolve it in a solvent. Both
techniques, described in steps (a) and (b) below, ensure con-
trolled evaporation of the sample into the ion source. Avoid
touching or otherwise contaminating the solid probe tip or the
glass capillary. Always wear clean nylon gloves or equivalent
when handling the solid probe tip, and use forceps to handle
the glass capillaries.
a. If the sample is in solution, the solvent must be evapo-
rated prior to inserting the sample into the mass spec-
trometer. Do this by gently heating the glass capillary.
209
image:
solvent(s) rests with the operator and his knowledge of the sample (e.g., which
LC fraction, IR data, solubilities, etc.);
• Pentane
• Methylene chloride
• Methanol
• Petroleum ether
§ D1ethyl ether
Procedure
Instrument Preparation
The procedure assumes that the MS has been activated per the manufacturer's
manual and is prepared to gather and record data. Briefly summarized this pro-
cedure includes:
• Monitoring all applicable pressures and confirming that proper
vacuum levels are being achieved.
• Checking all applicable temperatures and making adjustments
as necessary.
• Checking performance of ionizer.
t Optimizing resolution/sensitivity.
t Confirming that all electronics associated with data gathering
are functioning properly.
When all the necessary checks have been performed, then proceed with the anal-
ysis of a sample.
Analysis of the Sample
1. Place 1 microgram or less of the sample under test in a solid
probe glass capillary. The sample may be inserted as a solid
but it is preferable to first dissolve it in a solvent. Both
techniques, described in steps (a) and (b) below, ensure con-
trolled evaporation of the sample into the ion source. Avoid
touching or otherwise contaminating the solid probe tip or the
glass capillary. Always wear clean nylon gloves or equivalent
when handling the solid probe tip, and use forceps to handle
the glass capillaries.
a. If the sample is in solution, the solvent must be evapo-
rated prior to inserting the sample into the mass spec-
trometer. Do this by gently heating the glass capillary.
209
image:
 Placing the capillary under a heat lamp or appliance such
as a hair dryer is acceptable.
b. If the sample is inserted as a solid, it may occasionally
blow out of the capillary when heated too quickly. To
prevent this, place the solid at the bottom of the glass
capillary and then insert a small quantity of silanized
glass wool (pyrex) over the sample.
CAUTION: Sample size should be 1 yg or less to minimize
contamination of the ion source.
2. Place the capillary tube into the end of the solid probe by
pushing the retaining spring aside then releasing it to hold
the capillary tube in place.
3. Insert the solid probe tip into the slip vacuum seal at the
entrance of the solid inlet, and push the solid probe in
until the index pin in the guide rod snaps into the hold in
the tube.
4. Tighten the slip vacuum seal by turning the black knob
clockwise.
5. Evacuate the inlet solid and monitor the inlet pressure, and
when it is reduced to 0.04 torr stop the evacuation.
6. Open the solid probe valve by rotating the crank
counterclockwise.
7. Depress the locking button on the guide rod, and slowly push
in the solid probe to the full length of travel.
8. Connect one end of the solid probe heating cable to the
socket in the handle of the probe. Connect the other end of
the cable to the connector labeled Program.
9. Prepare the mass spectrometer for acquiring data. The param-
eters which must be entered into the MS controller include
the following:
Solid probe temperature — Program rate
Mass range - 40-600
Scan time for mass range —
Time interval between scanning —
Record this data in the instrument log book.
210
image:
Placing the capillary under a heat lamp or appliance such
as a hair dryer is acceptable.
b. If the sample is inserted as a solid, it may occasionally
blow out of the capillary when heated too quickly. To
prevent this, place the solid at the bottom of the glass
capillary and then insert a small quantity of silanized
glass wool (pyrex) over the sample.
CAUTION: Sample size should be 1 yg or less to minimize
contamination of the ion source.
2. Place the capillary tube into the end of the solid probe by
pushing the retaining spring aside then releasing it to hold
the capillary tube in place.
3. Insert the solid probe tip into the slip vacuum seal at the
entrance of the solid inlet, and push the solid probe in
until the index pin in the guide rod snaps into the hold in
the tube.
4. Tighten the slip vacuum seal by turning the black knob
clockwise.
5. Evacuate the inlet solid and monitor the inlet pressure, and
when it is reduced to 0.04 torr stop the evacuation.
6. Open the solid probe valve by rotating the crank
counterclockwise.
7. Depress the locking button on the guide rod, and slowly push
in the solid probe to the full length of travel.
8. Connect one end of the solid probe heating cable to the
socket in the handle of the probe. Connect the other end of
the cable to the connector labeled Program.
9. Prepare the mass spectrometer for acquiring data. The param-
eters which must be entered into the MS controller include
the following:
Solid probe temperature — Program rate
Mass range - 40-600
Scan time for mass range —
Time interval between scanning —
Record this data in the instrument log book.
210
image:
 10. Set the temperature control for the temperature range from
ambient to 300°C and the desired temperature program rate.
The rate may be adjusted by the operator at his discretion
to control sample sputtering, etc. Depress the Solid Probe
Selector push-button under the temperature readout to moni-
tor the probe temperature.
11. Start the scanning sequence and data acquisition of the mass
spec/computer to acquire data in accordance with the param-
eters set in Step 9. Then depress the Solid Probe push-
button to start the heating cycle. The probe will now heat
at the selected rate while MS data is acquired, processed,
and stored in the computer.
12. When the probe temperature reaches 300°C, stop data acquisi-
tion by pressing the appropriate computer stops. Turn the
solid probe heater off and allow the probe to cool. Then
disconnect the cable from the probe handle and pull the probe
out to the stop. Close the solid inlet valve by turning the
handle clockwise. Loosen the slip vacuum seal knob. Push
down on the stop pin in the guide rod and withdraw the probe.
Elements of data interpretation are presented here as a checklist of things
to consider.
1. Study all available information about the sample.
2. Verify that the mass counter is accurate.
3. Study the general appearance of the spectrum, e.g., molecular
stability, isotopic abundances indicating some heteroatoms,
rings plus double bonds, characteristic ions.
4. Identify neutral fragments accompanying high mass in forma-
tion (including metastable peaks, if available).
5. Postulate classes of compounds and test against reference
spectra for the same or similar compounds, or spectra pre-
dicted from mechanisms of ion decompositions. Examine the
data from analyses run with the low ionization potentials.
In the analysis mode where low ionization voltages are used (10-15 eV),
the intensity of the peaks caused by apparent molecular ions of "most probable"
identified compounds can be examined to provide an estimate of the abundances
of identified species. Only an estimate can be given because the production
and stability of molecular ions are not equal for all compounds. This type of
estimation is significantly more error prone when 70 eV ionization energies are
used. The estimation procedure is carried out by normalizing all of the
211
image:
10. Set the temperature control for the temperature range from
ambient to 300°C and the desired temperature program rate.
The rate may be adjusted by the operator at his discretion
to control sample sputtering, etc. Depress the Solid Probe
Selector push-button under the temperature readout to moni-
tor the probe temperature.
11. Start the scanning sequence and data acquisition of the mass
spec/computer to acquire data in accordance with the param-
eters set in Step 9. Then depress the Solid Probe push-
button to start the heating cycle. The probe will now heat
at the selected rate while MS data is acquired, processed,
and stored in the computer.
12. When the probe temperature reaches 300°C, stop data acquisi-
tion by pressing the appropriate computer stops. Turn the
solid probe heater off and allow the probe to cool. Then
disconnect the cable from the probe handle and pull the probe
out to the stop. Close the solid inlet valve by turning the
handle clockwise. Loosen the slip vacuum seal knob. Push
down on the stop pin in the guide rod and withdraw the probe.
Elements of data interpretation are presented here as a checklist of things
to consider.
1. Study all available information about the sample.
2. Verify that the mass counter is accurate.
3. Study the general appearance of the spectrum, e.g., molecular
stability, isotopic abundances indicating some heteroatoms,
rings plus double bonds, characteristic ions.
4. Identify neutral fragments accompanying high mass in forma-
tion (including metastable peaks, if available).
5. Postulate classes of compounds and test against reference
spectra for the same or similar compounds, or spectra pre-
dicted from mechanisms of ion decompositions. Examine the
data from analyses run with the low ionization potentials.
In the analysis mode where low ionization voltages are used (10-15 eV),
the intensity of the peaks caused by apparent molecular ions of "most probable"
identified compounds can be examined to provide an estimate of the abundances
of identified species. Only an estimate can be given because the production
and stability of molecular ions are not equal for all compounds. This type of
estimation is significantly more error prone when 70 eV ionization energies are
used. The estimation procedure is carried out by normalizing all of the
211
image:
 molecular ion peaks and reporting each species as a fraction of the total.
Reported levels are limited to major, minor, and trace designations.
Calculation of Approximate Intensities
Estimates of compound classes, group types or "most probable" identified
compounds are made using the following calculation based on normalization:
hxf*
%X = * x (100)
1 hnfn
where:
%X = Mole percent composition of a compound or group of com-
pounds making up a class
h = Sum of intensities and/or peak height(s) caused by
compound(s)
hn = All observed peak heights and/or intensities
f and f = Instrument response factors which shall be considered
n to be equal to 1.
Accuracy and Precision
This qualitative method is only roughly quantitative. The precision asso-
ciated with an LRMS analysis of a solid sample has not been established. The
true value of a quantitative estimate should be expected to vary by a factor of
plus or minus 3. That is, the true value of X lies somewhere between one-third
and three times the reported value.
9. QUALITATIVE ANALYSIS BY GC/MS
Scope and Application
Scope
This method is for the qualitative analysis of samples derived from the
incineration of Herbicide Orange. The quantisation of 2,4-D and 2,4,5-T butyl
esters is provided; the quantitation of any other species found in the analysis
of these samples will be estimates. The manner in which the GC/MS data is
gathered and stored will enable the analyst to search for compounds known to be
212
image:
molecular ion peaks and reporting each species as a fraction of the total.
Reported levels are limited to major, minor, and trace designations.
Calculation of Approximate Intensities
Estimates of compound classes, group types or "most probable" identified
compounds are made using the following calculation based on normalization:
hxf*
%X = * x (100)
1 hnfn
where:
%X = Mole percent composition of a compound or group of com-
pounds making up a class
h = Sum of intensities and/or peak height(s) caused by
compound(s)
hn = All observed peak heights and/or intensities
f and f = Instrument response factors which shall be considered
n to be equal to 1.
Accuracy and Precision
This qualitative method is only roughly quantitative. The precision asso-
ciated with an LRMS analysis of a solid sample has not been established. The
true value of a quantitative estimate should be expected to vary by a factor of
plus or minus 3. That is, the true value of X lies somewhere between one-third
and three times the reported value.
9. QUALITATIVE ANALYSIS BY GC/MS
Scope and Application
Scope
This method is for the qualitative analysis of samples derived from the
incineration of Herbicide Orange. The quantisation of 2,4-D and 2,4,5-T butyl
esters is provided; the quantitation of any other species found in the analysis
of these samples will be estimates. The manner in which the GC/MS data is
gathered and stored will enable the analyst to search for compounds known to be
212
image:
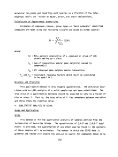 present in Herbicide Orange (and which elute from the GC) and to identify any
other compound found. Table 11 shows the average composition of four lots of
(o\
Herbicide Orange.v '
Sensitivity
The GC/MS sensitivity varies with several parameters including the type of
compound, instrument internal cleanliness, resolution of closely eluting peaks,
etc. Under "everyday" operating conditions 10 nanograms (ng) eluting in a peak
about 5 seconds wide will yield an MS signal with a usable signal-to-noise ratio
of greater than 10 to 1. A dynamic range of greater than 100,000 is achievable.
Detection Limit
There will typically have to be at least 100 pg of material extracted from
a sample and concentrated to 10 ml of solution. This presumes a lyl sample
injection volume and the typical instrument sensitivity specified above.
Interferences
This analysis is performed using the MS in a Total Ion Monitoring mode
(TIM). In this mode, all ion fragments in a specified mass range are monitored
and, as a result, all compounds are detected if they elute from the GC in
detectable quantities. Because 2,4-D and 2,4,5-T are expected to be present in
higher quantities than other species, some spectral interference may result if
other species elute at or near the same time as 2,4-D and 2,4,5-T. Computer
data manipulation techniques, such as ion mapping, can minimize interferences.
Information exists on the chemical composition of Herbicide Orange, and the
known herbicide components will be specifically sought.
Summary of Method
This is a combined gas chromotography/mass spectrometry method (GC/MS).
Microliter quantities of concentrated sample extracts are used for this analy-
sis. The concentrated extracts result from the extraction of the various sam-
ples obtained from the sampling activity. The extraction and concentration
procedures are specified elsewhere in this document.
Microliter sized samples are injected onto a gas chromatographic column
and are separated by the differences in the retention characteristics between
the sample components and the column material. As the mixture components elute
213
image:
present in Herbicide Orange (and which elute from the GC) and to identify any
other compound found. Table 11 shows the average composition of four lots of
(o\
Herbicide Orange.v '
Sensitivity
The GC/MS sensitivity varies with several parameters including the type of
compound, instrument internal cleanliness, resolution of closely eluting peaks,
etc. Under "everyday" operating conditions 10 nanograms (ng) eluting in a peak
about 5 seconds wide will yield an MS signal with a usable signal-to-noise ratio
of greater than 10 to 1. A dynamic range of greater than 100,000 is achievable.
Detection Limit
There will typically have to be at least 100 pg of material extracted from
a sample and concentrated to 10 ml of solution. This presumes a lyl sample
injection volume and the typical instrument sensitivity specified above.
Interferences
This analysis is performed using the MS in a Total Ion Monitoring mode
(TIM). In this mode, all ion fragments in a specified mass range are monitored
and, as a result, all compounds are detected if they elute from the GC in
detectable quantities. Because 2,4-D and 2,4,5-T are expected to be present in
higher quantities than other species, some spectral interference may result if
other species elute at or near the same time as 2,4-D and 2,4,5-T. Computer
data manipulation techniques, such as ion mapping, can minimize interferences.
Information exists on the chemical composition of Herbicide Orange, and the
known herbicide components will be specifically sought.
Summary of Method
This is a combined gas chromotography/mass spectrometry method (GC/MS).
Microliter quantities of concentrated sample extracts are used for this analy-
sis. The concentrated extracts result from the extraction of the various sam-
ples obtained from the sampling activity. The extraction and concentration
procedures are specified elsewhere in this document.
Microliter sized samples are injected onto a gas chromatographic column
and are separated by the differences in the retention characteristics between
the sample components and the column material. As the mixture components elute
213
image:
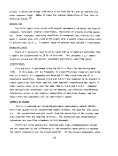 from the column, they are transported via an instrument interface to the mass
spectrometer. The MS ionizes the components and analyzes the fragments in a
60-650 AMU range. The signal from the mass spectrometer is stored in the mem-
ory of a computer. The computer than searches the stored spectra for close
matches to a library set of spectra. Peaks other than 2,4-D and 2,4,5-T are
not specifically quantitated, but relative abudance estimates are reported.
Definitions
ES - External Standard
TIM - Total Ion Monitoring
Sample Handling and Preservation
These samples are organic solutions resulting from extraction and concen-
tration. They are contained in stoppered or septum sealed vials and are 0.25 ml
in volume. These samples are presumed to contain toxic materials, so due care
shall be used in handling all samples and standards. Gloves and fume hoods are
appropriate considerations.
Apparatus
This section specifies the major pieces of required apparatus. A normal
complement of glassware and implements is assumed.
Automated GC/MS - Finnigan Corporation, Model 4023 - Several other qua-
druple or magnetic sector instruments, computer driven, are available to per-
form this analysis. Basic required capabilities include:
• Resolution sufficient to obtain unit mass peaks in the
50-650 range (typically 1000)
• Capability for 6-mm ID glass packed columns and a sample
enrichment device to achieve yields and efficiencies such
that the 10 ng total instrument sensitivity is achieved.
t Electron multiplier detection system.
• Total Ion Monitoring capability in the 50-650 range.
Interactive Data System —Capable of gathering and storing TIM data,
enhancing data, generating total ion chromatograms, and spectral searching for
library spectra of known compounds.
214
image:
from the column, they are transported via an instrument interface to the mass
spectrometer. The MS ionizes the components and analyzes the fragments in a
60-650 AMU range. The signal from the mass spectrometer is stored in the mem-
ory of a computer. The computer than searches the stored spectra for close
matches to a library set of spectra. Peaks other than 2,4-D and 2,4,5-T are
not specifically quantitated, but relative abudance estimates are reported.
Definitions
ES - External Standard
TIM - Total Ion Monitoring
Sample Handling and Preservation
These samples are organic solutions resulting from extraction and concen-
tration. They are contained in stoppered or septum sealed vials and are 0.25 ml
in volume. These samples are presumed to contain toxic materials, so due care
shall be used in handling all samples and standards. Gloves and fume hoods are
appropriate considerations.
Apparatus
This section specifies the major pieces of required apparatus. A normal
complement of glassware and implements is assumed.
Automated GC/MS - Finnigan Corporation, Model 4023 - Several other qua-
druple or magnetic sector instruments, computer driven, are available to per-
form this analysis. Basic required capabilities include:
• Resolution sufficient to obtain unit mass peaks in the
50-650 range (typically 1000)
• Capability for 6-mm ID glass packed columns and a sample
enrichment device to achieve yields and efficiencies such
that the 10 ng total instrument sensitivity is achieved.
t Electron multiplier detection system.
• Total Ion Monitoring capability in the 50-650 range.
Interactive Data System —Capable of gathering and storing TIM data,
enhancing data, generating total ion chromatograms, and spectral searching for
library spectra of known compounds.
214
image:
 GC column -6-foot, glass column containing 3% OV-101 on 100-120 mesh
Chromosorb WHP, or equivalent.
GC injection syringes — 10 yl with 0.2 yl graduations.
Analytical balance - capable of weighing ±0.05 mg.
Reagents
/B)
Supplies of the following solvents, pesticide grade, Distilled-in-Glass ,
©
Nanograde or equivalent should be kept at hand in 1- or 2-liter quantities.
These solvents will be used to prepare analytical standards, make dilutions, do
solvent replacement or other similar activities as required.
• Benzene
• Pentane
• Methylene chloride
• Methanol
• Acetone
• Petroleum ether
• Hexane
• Diethyl ether
t 2,4-D butyl ester, EPA Reference Standard No. 2980
• 2,4,5-T butyl ester, EPA Reference Standard No. 6870.
Procedure
The samples will have been concentrated as greatly as practicable. The
samples, 0.25 ml, will have been placed in vials at the end of the concentra-
tion procedure (Section 5.4) and are then available for analysis.
Preparation of Standard Solutions
It is intended to quantitate only 2,4-D and 2,4,5-T mixed esters in these
samples. At the required destruction efficiency, the sorbent traps are expected
to yield extracts having 2,4-D and 2,4,5-T concentrations of about 200 yg/yl
each. These samples may be diluted. Reference materials (2,4-D and 2,4,5-T
butyl esters) are obtained from the U.S. EPA. Standards will be prepared in
benzene at levels of 200, 20, 2, and 0.2 yg/yl. The GC/MS will be calibrated
with these standards, and a curve of peak area versus weight of standard will
be prepared.
215
image:
GC column -6-foot, glass column containing 3% OV-101 on 100-120 mesh
Chromosorb WHP, or equivalent.
GC injection syringes — 10 yl with 0.2 yl graduations.
Analytical balance - capable of weighing ±0.05 mg.
Reagents
/B)
Supplies of the following solvents, pesticide grade, Distilled-in-Glass ,
©
Nanograde or equivalent should be kept at hand in 1- or 2-liter quantities.
These solvents will be used to prepare analytical standards, make dilutions, do
solvent replacement or other similar activities as required.
• Benzene
• Pentane
• Methylene chloride
• Methanol
• Acetone
• Petroleum ether
• Hexane
• Diethyl ether
t 2,4-D butyl ester, EPA Reference Standard No. 2980
• 2,4,5-T butyl ester, EPA Reference Standard No. 6870.
Procedure
The samples will have been concentrated as greatly as practicable. The
samples, 0.25 ml, will have been placed in vials at the end of the concentra-
tion procedure (Section 5.4) and are then available for analysis.
Preparation of Standard Solutions
It is intended to quantitate only 2,4-D and 2,4,5-T mixed esters in these
samples. At the required destruction efficiency, the sorbent traps are expected
to yield extracts having 2,4-D and 2,4,5-T concentrations of about 200 yg/yl
each. These samples may be diluted. Reference materials (2,4-D and 2,4,5-T
butyl esters) are obtained from the U.S. EPA. Standards will be prepared in
benzene at levels of 200, 20, 2, and 0.2 yg/yl. The GC/MS will be calibrated
with these standards, and a curve of peak area versus weight of standard will
be prepared.
215
image:
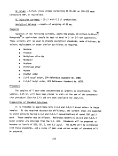 Preparation of the GC/MS Instrument
The gas chromatograph shall be prepared according to the manufacturer's
operating manual. Key operating parameters to be used are as follows:
Column - 3% OV-101 on 100-120 mesh Chromo-
sorb WHP, 6-ft x 2-mm ID,
glass 100-120
Carrier Gas - Heliums zero grade at 20 ml/min
Oven Temperature - 50-280°C programmed at 4°C/min
Injector Temperature - TBD
Transfer Lines and Separator - 200° - 220°C
The mass spectrometer (MS) will be prepared according to the manufac-
turer's operating manual. Briefly summarized, this procedure includes:
• Monitoring all applicable pressures and confirming that proper
vacuum levels are being achieved. Proper levels are specified
in the manual.
• Checking all applicable temperatures and making adjustments as
necessary:
Ionizer - TBD
Main chamber - TBD
Electron multiplier - TBD
• Checking performance of ionizer.
• Optimizing resolution/sensitivity.
•- Confirming that all electronics associated with data gathering
are functioning properly.
Important MS parameters to.be set are as follows:
Electron energy 70 eV
Ionizing energy 1 mi Hi amp, may be changed to 0.2 mA
Electron multiplier 2.5 kV, or as required to optimize
signal-to-noise ratio
Sensitivity 10 amps/volt
Source pressure 5 x 10 torr or less
Data and record parameters in instrument log book.
216
image:
Preparation of the GC/MS Instrument
The gas chromatograph shall be prepared according to the manufacturer's
operating manual. Key operating parameters to be used are as follows:
Column - 3% OV-101 on 100-120 mesh Chromo-
sorb WHP, 6-ft x 2-mm ID,
glass 100-120
Carrier Gas - Heliums zero grade at 20 ml/min
Oven Temperature - 50-280°C programmed at 4°C/min
Injector Temperature - TBD
Transfer Lines and Separator - 200° - 220°C
The mass spectrometer (MS) will be prepared according to the manufac-
turer's operating manual. Briefly summarized, this procedure includes:
• Monitoring all applicable pressures and confirming that proper
vacuum levels are being achieved. Proper levels are specified
in the manual.
• Checking all applicable temperatures and making adjustments as
necessary:
Ionizer - TBD
Main chamber - TBD
Electron multiplier - TBD
• Checking performance of ionizer.
• Optimizing resolution/sensitivity.
•- Confirming that all electronics associated with data gathering
are functioning properly.
Important MS parameters to.be set are as follows:
Electron energy 70 eV
Ionizing energy 1 mi Hi amp, may be changed to 0.2 mA
Electron multiplier 2.5 kV, or as required to optimize
signal-to-noise ratio
Sensitivity 10 amps/volt
Source pressure 5 x 10 torr or less
Data and record parameters in instrument log book.
216
image:
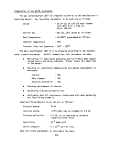 Preparation of Computer/Data Acquisition System —Use the Operating Manual
for the computer to select the operating parameters for data collection, stor-
age and processing time.
Mass range 40 - 400 AMU
Spectral scan time ^5 sec.
Ion abundance
threshold TBD
Starting the Analysis
When all preparations have been completed, inject the sample into the gas
chromatograph which is in the solvent divert mode. At a given time after injec-
tion, the solvent divert valve directs the sample components eluting from the
GC into the MS. Concurrently, a signal is set to start the MS scanning sequence
and data acquisition of the mass spec/computer to acquire and store data in
accordance with the pre-programmed parameters. The instrument will then gather
and store data over the time interval during which the individual in the sample
will elute. The analysis will continue for a pre-set duration or until the
operator intervenes. The system will be programmed to stop the analysis after
^50 minutes have elapsed from time of injection. The elution time and tempera-
ture program may be changed as required by the species present in the sample.
Data Processing
The data system is directed to construct a total ion chromatogram from the
acquired data. Moreover, the system is ordered to enhance the data and/or to
perform background subtractions as required and then to search the mass spec-
tral library for matches to peaks in the reconstructed chromatogram. All
matches are evaluated visually by the operator. Butyl esters of 2,4-D and
2,4,5-T will be quantitated by comparison with the standards. Other species
will be quantitated by inference.
217
image:
Preparation of Computer/Data Acquisition System —Use the Operating Manual
for the computer to select the operating parameters for data collection, stor-
age and processing time.
Mass range 40 - 400 AMU
Spectral scan time ^5 sec.
Ion abundance
threshold TBD
Starting the Analysis
When all preparations have been completed, inject the sample into the gas
chromatograph which is in the solvent divert mode. At a given time after injec-
tion, the solvent divert valve directs the sample components eluting from the
GC into the MS. Concurrently, a signal is set to start the MS scanning sequence
and data acquisition of the mass spec/computer to acquire and store data in
accordance with the pre-programmed parameters. The instrument will then gather
and store data over the time interval during which the individual in the sample
will elute. The analysis will continue for a pre-set duration or until the
operator intervenes. The system will be programmed to stop the analysis after
^50 minutes have elapsed from time of injection. The elution time and tempera-
ture program may be changed as required by the species present in the sample.
Data Processing
The data system is directed to construct a total ion chromatogram from the
acquired data. Moreover, the system is ordered to enhance the data and/or to
perform background subtractions as required and then to search the mass spec-
tral library for matches to peaks in the reconstructed chromatogram. All
matches are evaluated visually by the operator. Butyl esters of 2,4-D and
2,4,5-T will be quantitated by comparison with the standards. Other species
will be quantitated by inference.
217
image:
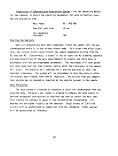 APPENDIX D
THERMOCHEMICAL ANALYSIS AND ESTIMATION
OF EMISSION LEVELS
218
image:
APPENDIX D
THERMOCHEMICAL ANALYSIS AND ESTIMATION
OF EMISSION LEVELS
218
image:
 APPENDIX D - INDEX
PAGE
1. EQUILIBRIUM PRODUCT DISTRIBUTION ANALYSES 220
2. ESTIMATION OF EMISSION LEVELS 224
219
image:
APPENDIX D - INDEX
PAGE
1. EQUILIBRIUM PRODUCT DISTRIBUTION ANALYSES 220
2. ESTIMATION OF EMISSION LEVELS 224
219
image:
 APPENDIX D
1. EQUILIBRIUM PRODUCT DISTRIBUTION ANALYSES
The purpose of the equilibrium product theoretical computation is to define
the practical bounds for the safe operation of the Vulcanus incinerators during
the destruction of Herbicide Orange. In the combustion studies, Herbicide
Orange was assumed to have the following composition: c, 49.1 wt %; H, 4.6 wt %;
0, 16.4 wt %; Cl 29.9 wt %. The equilibrium product distributions from Herbi-
cide Orange incineration were examined at four temperature levels (1000°C,
1250°C, 1500°C, and adiabatic flame temperature) and for four air/waste ratios.
As indicated in Table D-l, the four air/waste ratios examined correspond to
approximately 3.0, 6.5, and 10.0 mole percent of oxygen in the stack gas and to
a case where only 80 percent of the air required for stoichiometric combustion
is fed. The 80 percent stoichiometric air case was designed to determine the
equilibrium product distribution under oxygen deficient conditions.
TABLE D-l. AIR/HERBICIDE ORANGE RATIOS EXAMINED IN
EQUILIBRIUM PRODUCT DISTRIBUTION ANALYSIS
Mole % 02
in Stack
<3.0%
%6.5%
vLO.0%
0%
% Excess
Air*
18.44%
49.61%
100.60%
-20%
M3 Airf
Kg Orange
6.235
7.876
10.560
4.211
Excess air =
_ /Actual amount of air fed-stoichiometric air req'd
\
x 100%
Stoichiometric amount of air req'd
air at 25°C (77°F)
220
image:
APPENDIX D
1. EQUILIBRIUM PRODUCT DISTRIBUTION ANALYSES
The purpose of the equilibrium product theoretical computation is to define
the practical bounds for the safe operation of the Vulcanus incinerators during
the destruction of Herbicide Orange. In the combustion studies, Herbicide
Orange was assumed to have the following composition: c, 49.1 wt %; H, 4.6 wt %;
0, 16.4 wt %; Cl 29.9 wt %. The equilibrium product distributions from Herbi-
cide Orange incineration were examined at four temperature levels (1000°C,
1250°C, 1500°C, and adiabatic flame temperature) and for four air/waste ratios.
As indicated in Table D-l, the four air/waste ratios examined correspond to
approximately 3.0, 6.5, and 10.0 mole percent of oxygen in the stack gas and to
a case where only 80 percent of the air required for stoichiometric combustion
is fed. The 80 percent stoichiometric air case was designed to determine the
equilibrium product distribution under oxygen deficient conditions.
TABLE D-l. AIR/HERBICIDE ORANGE RATIOS EXAMINED IN
EQUILIBRIUM PRODUCT DISTRIBUTION ANALYSIS
Mole % 02
in Stack
<3.0%
%6.5%
vLO.0%
0%
% Excess
Air*
18.44%
49.61%
100.60%
-20%
M3 Airf
Kg Orange
6.235
7.876
10.560
4.211
Excess air =
_ /Actual amount of air fed-stoichiometric air req'd
\
x 100%
Stoichiometric amount of air req'd
air at 25°C (77°F)
220
image:
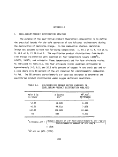 The equilibrium product distribution from the combustion of Herbicide
Orange was determined using the TRW Chemical Analysis Program (CAP). This pro-
gram is capable of simultaneously considering a maximum of 200 gaseous products
together with a maximum of 20 condensed species, and is based on solving a sys-
tem of simultaneous equations of elemental mass balances and a pressure match
which satisfies equilibrium relationships for all reactions and minimizes the
system free energy. The results of the thermochemical computations are sum-
marized in Table D-2. The effects of air/waste ratio and temperature on the
equilibrium product distribution are discussed below.
Effects of Air/Waste Ratio
As indicated in Table D-2, the major equilibrium products under excess air
conditions are C02, H20, HC1, N2 and $2' Tne maj°r equilibrium products under
oxygen deficient conditions are CO, C02, H2, H20, HC1, N2 and 02. In addition,
the formation of C02, Cl, C12, H20, 02 and OH is favored at higher air/waste
ratios, and the formation of CO and H2 is favored at lower air/waste ratios.
In particular, CO will appear in considerable concentrations when the air supply
is below the stoichiometric requirement. At an air/Herbicide Orange feed ratio
of 4.211, for example, the equilibrium CO concentrations are in the 6.6 to
7.9 mole percent range. Even under excess air conditions, however, improper
mixing of combustibles such as CO and air will lead to localized air deficient
pockets and result in high CO emission levels. Thus measured CO concentrations
at the incinerator exit can be used to provide a good indication of the degree
of mixing between combustibles and air in the incinerator. Since the percent
combustion efficient = (1 - CO concentration/C02 concentration) x 100, the
requirement for high combustion efficiency also implies low CO concentration
and a high degree of mixing between combustibles and air. In this sense, com-
bustion efficiency as defined here can also be interpreted as a measure of the
degree of mixing between combustibles and air.
Effects of Temperature
The results of the thermochemical calculations indicate that the formation
of CO, Cl, NO and OH is favored by increasing the reaction temperature, whereas
the formation of C02 and C12 is favored by decreasing the reaction temperature.
Increasing the reaction temperature also favors the formation of H2 under excess
air conditions and the formation of H20 under oxygen deficient conditions. In
221
image:
The equilibrium product distribution from the combustion of Herbicide
Orange was determined using the TRW Chemical Analysis Program (CAP). This pro-
gram is capable of simultaneously considering a maximum of 200 gaseous products
together with a maximum of 20 condensed species, and is based on solving a sys-
tem of simultaneous equations of elemental mass balances and a pressure match
which satisfies equilibrium relationships for all reactions and minimizes the
system free energy. The results of the thermochemical computations are sum-
marized in Table D-2. The effects of air/waste ratio and temperature on the
equilibrium product distribution are discussed below.
Effects of Air/Waste Ratio
As indicated in Table D-2, the major equilibrium products under excess air
conditions are C02, H20, HC1, N2 and $2' Tne maj°r equilibrium products under
oxygen deficient conditions are CO, C02, H2, H20, HC1, N2 and 02. In addition,
the formation of C02, Cl, C12, H20, 02 and OH is favored at higher air/waste
ratios, and the formation of CO and H2 is favored at lower air/waste ratios.
In particular, CO will appear in considerable concentrations when the air supply
is below the stoichiometric requirement. At an air/Herbicide Orange feed ratio
of 4.211, for example, the equilibrium CO concentrations are in the 6.6 to
7.9 mole percent range. Even under excess air conditions, however, improper
mixing of combustibles such as CO and air will lead to localized air deficient
pockets and result in high CO emission levels. Thus measured CO concentrations
at the incinerator exit can be used to provide a good indication of the degree
of mixing between combustibles and air in the incinerator. Since the percent
combustion efficient = (1 - CO concentration/C02 concentration) x 100, the
requirement for high combustion efficiency also implies low CO concentration
and a high degree of mixing between combustibles and air. In this sense, com-
bustion efficiency as defined here can also be interpreted as a measure of the
degree of mixing between combustibles and air.
Effects of Temperature
The results of the thermochemical calculations indicate that the formation
of CO, Cl, NO and OH is favored by increasing the reaction temperature, whereas
the formation of C02 and C12 is favored by decreasing the reaction temperature.
Increasing the reaction temperature also favors the formation of H2 under excess
air conditions and the formation of H20 under oxygen deficient conditions. In
221
image:
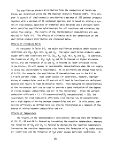 TABLE D-2. EQUILIBRIUM PRODUCT FROM THE COMBUSTION OF HERBICIDE ORANGE
Air/Orange
Ratio
, M3 Air ,
^kg waste' Temperature
6.235 1000°C
1250°C
1500°C
1841°Cf
7.876 1000°C
1250°C
1500°C
1568°Cf
10.560 1000°C
1250°C
1500°C
12530Cf
4.211 1000°C
1250°C
1500°C
1900°^
Species Concentration in Gas Phase, Mole Fraction
CO
7.437-8
5.820-6
1.323-4
2.776-3
4.065-8
3.176-6
7.191-5
1.454-4
2.485-8
1.940-6
4.386-5
2.038-6
6.696-2
7.240-2
7.554-2
7.900-2
co2
1.472-1
1.471-1
1 .469-1
1.439-1
1.185-1
1.185-1
1.184-1
1.183-1
8.993-2
8.991-2
8.984-2
8.991-2
1.333-1
1.279-1
1.247-1
1.210-1
H2
2.089-8
1.009-6
1.671-5
2.678-4
1.144-8
5.517-7
9.113-6
1.723-5
6.998-9
3.376-7
5.575-6
3.528-7
2.158-2
1.615-2
1.303-2
1.044-2
H20
6.803-2
6.811-2
6.840-2
6.845-2
5.488-2
5.495-2
5.527-2
5.537-2
4.168-2
4.176-2
4.207-2
4.176-2
7.069-2
7.613-2
7.925-2
8.189-2
HC1
2.984-2
2.962-2
2.869-2
2.619-2
2.388-2
2.366-2
2.268-2
2.228-2
1.802-2
1.780-2
1.688-2
1.779-2
4.124-2
4.123-2
4.115-2
3.982-2
N2
7.247-1
7.244-1
7.237-1
7.206-1
7.374-1
7.370-1
7.360-1
7.356-1
7.500-1
7.495-1
7.484-1
7.495-1
6.662-1
6.662-1
6.662-1
6.652-1
Cl
1.244-4
5.424-4
1.520-3
3.971-3
1.346-4
5.861-4
1.627-3
2.033-3
1.298-4
5.637-4
1.548-3
5.730-4
1.692-7
5.971-6
7.809-5
1.360-3
ci2
1.658-4
6.432-5
3.043-5
1.286-5
1.940-4
7.509-5
3489-5
2.870-5
1.805-4
6.947-5
3.158-5
6.868-5
3.067-10
7.793-9
8.032-8
1.022-6
NO
1.314-4
5.322-4
1.440-3
3.814-3
1.954-4
7.924-4
2.152-3
2.694 3
2.446-4
9.923-4
2.700-3
1.008-3
1.268-10
3.566-8
2.053-6
1.899-4
°2
2.982-2
2.955-2
2.886-2
2.797-2
6.477-2
6.439-2
6.341-2
6.301-2
9.975-2
9.930-2
9.812-2
9.929-2
3.018-14
1.442-10
6.375-8
5.698-5
OH
3.722-6
4.670-5
2.865-4
1.701-3
4.058-6
5.096-5
3.135-4
4.725-4
3.940-6
4.950-5
3.050-4
5.094-5
3.805-9
4.127-7
1.189-5
5.075-4
PO
f\i
rva
In the data format used for this table, X.XXX-Y is equivalent to X.XXX * 10"Y
Adiabatic flame temperatures.
image:
TABLE D-2. EQUILIBRIUM PRODUCT FROM THE COMBUSTION OF HERBICIDE ORANGE
Air/Orange
Ratio
, M3 Air ,
^kg waste' Temperature
6.235 1000°C
1250°C
1500°C
1841°Cf
7.876 1000°C
1250°C
1500°C
1568°Cf
10.560 1000°C
1250°C
1500°C
12530Cf
4.211 1000°C
1250°C
1500°C
1900°^
Species Concentration in Gas Phase, Mole Fraction
CO
7.437-8
5.820-6
1.323-4
2.776-3
4.065-8
3.176-6
7.191-5
1.454-4
2.485-8
1.940-6
4.386-5
2.038-6
6.696-2
7.240-2
7.554-2
7.900-2
co2
1.472-1
1.471-1
1 .469-1
1.439-1
1.185-1
1.185-1
1.184-1
1.183-1
8.993-2
8.991-2
8.984-2
8.991-2
1.333-1
1.279-1
1.247-1
1.210-1
H2
2.089-8
1.009-6
1.671-5
2.678-4
1.144-8
5.517-7
9.113-6
1.723-5
6.998-9
3.376-7
5.575-6
3.528-7
2.158-2
1.615-2
1.303-2
1.044-2
H20
6.803-2
6.811-2
6.840-2
6.845-2
5.488-2
5.495-2
5.527-2
5.537-2
4.168-2
4.176-2
4.207-2
4.176-2
7.069-2
7.613-2
7.925-2
8.189-2
HC1
2.984-2
2.962-2
2.869-2
2.619-2
2.388-2
2.366-2
2.268-2
2.228-2
1.802-2
1.780-2
1.688-2
1.779-2
4.124-2
4.123-2
4.115-2
3.982-2
N2
7.247-1
7.244-1
7.237-1
7.206-1
7.374-1
7.370-1
7.360-1
7.356-1
7.500-1
7.495-1
7.484-1
7.495-1
6.662-1
6.662-1
6.662-1
6.652-1
Cl
1.244-4
5.424-4
1.520-3
3.971-3
1.346-4
5.861-4
1.627-3
2.033-3
1.298-4
5.637-4
1.548-3
5.730-4
1.692-7
5.971-6
7.809-5
1.360-3
ci2
1.658-4
6.432-5
3.043-5
1.286-5
1.940-4
7.509-5
3489-5
2.870-5
1.805-4
6.947-5
3.158-5
6.868-5
3.067-10
7.793-9
8.032-8
1.022-6
NO
1.314-4
5.322-4
1.440-3
3.814-3
1.954-4
7.924-4
2.152-3
2.694 3
2.446-4
9.923-4
2.700-3
1.008-3
1.268-10
3.566-8
2.053-6
1.899-4
°2
2.982-2
2.955-2
2.886-2
2.797-2
6.477-2
6.439-2
6.341-2
6.301-2
9.975-2
9.930-2
9.812-2
9.929-2
3.018-14
1.442-10
6.375-8
5.698-5
OH
3.722-6
4.670-5
2.865-4
1.701-3
4.058-6
5.096-5
3.135-4
4.725-4
3.940-6
4.950-5
3.050-4
5.094-5
3.805-9
4.127-7
1.189-5
5.075-4
PO
f\i
rva
In the data format used for this table, X.XXX-Y is equivalent to X.XXX * 10"Y
Adiabatic flame temperatures.
image:
 addition, thermochemical analysis also predicts that HC1 formation is highly
favored at Herbicide Orange incineration temperatures (1000°C to 1500°C range),
and that C12, Cl , CIO and HOC1 are found in only trace quantities. The HC1
concentrations to be expected from the incineration of Herbicide Orange are in
the 1.6 to 2.4 mole percent range.
It may be noted from Table D-2 that the equilibrium CO concentration can
be as high as 2800 ppm at 1841°C when the oxygen concentration is 2.8 mole per-
cent. The high equilibrium CO concentration under excess air conditions results
from the equilibration of C02 according to the water gas shift reaction:
Since the water gas shift reaction is known to be a relatively slow reaction,
the C02 equilibration process may not be complete in the incinerator environ-
ment, and the actual CO concentration at high incineration temperatures may be
considerably lower than the equilibrium CO concentration. It may also be noted
from Table D-2 that at air/Herbicide Orange feed ratios between 7.88 and 10.56,
and incineration temperatures between 1000°C and 1500°C (the recommended oper-
ating region for the destruction of Herbicide Orange, as will be discussed in
Section D-2), the maximum equilibrium CO concentration is 72 ppm. At 99.9%
combustion efficiency, the allowable CO concentration is 118 ppm (since the
C02 concentration is 11.8 mole %). Thus the stipulation of a 99.9% combustion
efficiency is not limited by equilibrium CO concentrations in the recommended
operating region for the destruction of Herbicide Orange.
Adiabatic Flame Temperature
The adiabatic flame temperature is the highest attainable flame temperature
when Herbicide Orange is burned in air without loss of heat. The actual flame
temperature, depending on the construction of the burner and combustion chamber
and heat losses, would be of the order of a hundred degrees lower than the adi-
abatic flame temperature. For Herbicide Orange, the adiabatic flame tempera-
tures were calculated at four air/waste ratios by using the TRW Chemical Analy-
sis Program, a heat of formation of -152,000 cal/g mole for the normal butyl
ester of 2,4-D, and a heat of formation of -159,000 cal/g mole for the normal
223
image:
addition, thermochemical analysis also predicts that HC1 formation is highly
favored at Herbicide Orange incineration temperatures (1000°C to 1500°C range),
and that C12, Cl , CIO and HOC1 are found in only trace quantities. The HC1
concentrations to be expected from the incineration of Herbicide Orange are in
the 1.6 to 2.4 mole percent range.
It may be noted from Table D-2 that the equilibrium CO concentration can
be as high as 2800 ppm at 1841°C when the oxygen concentration is 2.8 mole per-
cent. The high equilibrium CO concentration under excess air conditions results
from the equilibration of C02 according to the water gas shift reaction:
Since the water gas shift reaction is known to be a relatively slow reaction,
the C02 equilibration process may not be complete in the incinerator environ-
ment, and the actual CO concentration at high incineration temperatures may be
considerably lower than the equilibrium CO concentration. It may also be noted
from Table D-2 that at air/Herbicide Orange feed ratios between 7.88 and 10.56,
and incineration temperatures between 1000°C and 1500°C (the recommended oper-
ating region for the destruction of Herbicide Orange, as will be discussed in
Section D-2), the maximum equilibrium CO concentration is 72 ppm. At 99.9%
combustion efficiency, the allowable CO concentration is 118 ppm (since the
C02 concentration is 11.8 mole %). Thus the stipulation of a 99.9% combustion
efficiency is not limited by equilibrium CO concentrations in the recommended
operating region for the destruction of Herbicide Orange.
Adiabatic Flame Temperature
The adiabatic flame temperature is the highest attainable flame temperature
when Herbicide Orange is burned in air without loss of heat. The actual flame
temperature, depending on the construction of the burner and combustion chamber
and heat losses, would be of the order of a hundred degrees lower than the adi-
abatic flame temperature. For Herbicide Orange, the adiabatic flame tempera-
tures were calculated at four air/waste ratios by using the TRW Chemical Analy-
sis Program, a heat of formation of -152,000 cal/g mole for the normal butyl
ester of 2,4-D, and a heat of formation of -159,000 cal/g mole for the normal
223
image:
 butyl ester of 2,4,5-T. The results of these calculations are presented in
Table D-3, and indicate that the adiabatic flame temperature would be between
1568 and 1253°C (corresponding to an estimated actual flame temperature of
1470 to 1150°C) when the oxygen level in the product gas is between 6.3 and
9.9 mole percent and the air to Herbicide Orange feed ratio is between 7.9 and
10.6 M3 air/kg Herbicide Orange.
In Figure D-l, the calculated adiabatic flame temperatures are presented
as a function of the air to Herbicide Orange feed ratio. It may be noted that
the adiabatic flame temperature can be as high as 1900°C under oxygen deficient
conditions, and hence temperature control alone is inadequate to ensure com-
plete combustion.
2. ESTIMATION OF EMISSION LEVELS
The thermochemical analysis discussed in the previous section provides
information on the equilibrium product distribution from the incineration of
Herbicide Orange. These thermochemical calculations, however, cannot be used
to estimate the emission levels of 2,4-D, 2,4,5-T or TCDD. The free energies
of 2,4-D, 2,4,5-T or TCDD are considerably higher than the free energies
TABLE D-3. ADIABATIC FLAME TEMPERATURE OF
HERBICIDE ORANGE AS A FUNCTION
OF AIR/HERBICIDE ORANGE FEED
RATIO
Air/Orange Ratio
M3 Air
kg Orange
4.211
6.235
7.876
10.560
Adiabatic
Flame
Temperature
1900°C
1841°C
1568°C
1253°C
224
image:
butyl ester of 2,4,5-T. The results of these calculations are presented in
Table D-3, and indicate that the adiabatic flame temperature would be between
1568 and 1253°C (corresponding to an estimated actual flame temperature of
1470 to 1150°C) when the oxygen level in the product gas is between 6.3 and
9.9 mole percent and the air to Herbicide Orange feed ratio is between 7.9 and
10.6 M3 air/kg Herbicide Orange.
In Figure D-l, the calculated adiabatic flame temperatures are presented
as a function of the air to Herbicide Orange feed ratio. It may be noted that
the adiabatic flame temperature can be as high as 1900°C under oxygen deficient
conditions, and hence temperature control alone is inadequate to ensure com-
plete combustion.
2. ESTIMATION OF EMISSION LEVELS
The thermochemical analysis discussed in the previous section provides
information on the equilibrium product distribution from the incineration of
Herbicide Orange. These thermochemical calculations, however, cannot be used
to estimate the emission levels of 2,4-D, 2,4,5-T or TCDD. The free energies
of 2,4-D, 2,4,5-T or TCDD are considerably higher than the free energies
TABLE D-3. ADIABATIC FLAME TEMPERATURE OF
HERBICIDE ORANGE AS A FUNCTION
OF AIR/HERBICIDE ORANGE FEED
RATIO
Air/Orange Ratio
M3 Air
kg Orange
4.211
6.235
7.876
10.560
Adiabatic
Flame
Temperature
1900°C
1841°C
1568°C
1253°C
224
image:
 2000
1800
U
0
1600
a.
LU
i
u_
U
1400
1200
1000
2.0
Figure D-l,
4.0
6.0
8.0
10.0
12.0
AIR/HERBICIDE ORANGE FEED RATIO
(M3/KG) .
Adiabatic flame temperature of Herbicide Orange as
a function of air/Herbicide Orange feed ratio.
225
image:
2000
1800
U
0
1600
a.
LU
i
u_
U
1400
1200
1000
2.0
Figure D-l,
4.0
6.0
8.0
10.0
12.0
AIR/HERBICIDE ORANGE FEED RATIO
(M3/KG) .
Adiabatic flame temperature of Herbicide Orange as
a function of air/Herbicide Orange feed ratio.
225
image:
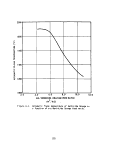 of the stable combustion products COg, ^0 and HC1, and none of the Herbicide
Orange constituents can theoretically exist in the incinerator environment
under equilibrium conditions.
In Table D-4, existing experimental data on the incineration of Herbicide
Orange, 2,4-D ester, 2,4,5-T ester, as well as the theoretical analysis for the
(1 2 1}
incineration of Herbicide Orange onboard Vulcanus are presentedv'5'. The
test data indicate that the destruction efficiency for either 2,4-D or 2,4,5-T
should be greater than 99.99% with the Vulcanus incinerator, when the flame
temperature is above 1000°C and the oxygen level in the combustion product gas
is above 5%. The Marquardt test data also show that the TCDD destruction effi-
®
ciency was greater than 99.9% in the Sue burner, when the flame temperature
was in the 1450-1850°C range and the oxygen level in the combustion product gas
was above 4.7%. Utilizing theoretical models of droplet evaporation and com-
bustion gas mixing and extrapolating from the data base to the Vulcanus incin-
eration operation, Arthur D. Little has estimated that the TCDD destruction
efficiency with the Vulcanus incinerator will exceed 99% and is most likely to
be near 99.9%.
The Vulcanus is equipped with two identical furnaces, each with a combus-
o
tion air feed rate of 75,000 m/hr and a maximum liquid waste feed rate of
12 tonnes/hr. Since the air feed rate is normally maintained constant, the
1. J.E. Hutson, "Report on the Destruction of Orange Herbicide by Incineration,"
Marquardt Company report to U.S. Air Force Occupational and Environmental
Health Laboratory, April 1974.
2. C.C. Shih, R.F. Tobias, J.F. Clausen, and R.J. Johnson, "Thermal Degradation
of Military Standard Pesticide Formulations," TRW Systems and Energy report
to U.S. Army Medical Research and Development Command, Report No. 24768-
6019-RU-OO, March 1975.
3. "Review of Proposed Action to Dispose of Orange Herbicide by Incineration,"
Report prepared by Arthur D. Little, Inc., for U.S. Air Force occupational
and Environmental Health Laboratory, June 1975.
4. B.J. Stojanovic, M.V. Kennedy, and W.C. Shaw, "Thermal Decomposition of
Orange Herbicides," Mississippi State University and U.S. Department of
Agriculture, June 1972.
226
image:
of the stable combustion products COg, ^0 and HC1, and none of the Herbicide
Orange constituents can theoretically exist in the incinerator environment
under equilibrium conditions.
In Table D-4, existing experimental data on the incineration of Herbicide
Orange, 2,4-D ester, 2,4,5-T ester, as well as the theoretical analysis for the
(1 2 1}
incineration of Herbicide Orange onboard Vulcanus are presentedv'5'. The
test data indicate that the destruction efficiency for either 2,4-D or 2,4,5-T
should be greater than 99.99% with the Vulcanus incinerator, when the flame
temperature is above 1000°C and the oxygen level in the combustion product gas
is above 5%. The Marquardt test data also show that the TCDD destruction effi-
®
ciency was greater than 99.9% in the Sue burner, when the flame temperature
was in the 1450-1850°C range and the oxygen level in the combustion product gas
was above 4.7%. Utilizing theoretical models of droplet evaporation and com-
bustion gas mixing and extrapolating from the data base to the Vulcanus incin-
eration operation, Arthur D. Little has estimated that the TCDD destruction
efficiency with the Vulcanus incinerator will exceed 99% and is most likely to
be near 99.9%.
The Vulcanus is equipped with two identical furnaces, each with a combus-
o
tion air feed rate of 75,000 m/hr and a maximum liquid waste feed rate of
12 tonnes/hr. Since the air feed rate is normally maintained constant, the
1. J.E. Hutson, "Report on the Destruction of Orange Herbicide by Incineration,"
Marquardt Company report to U.S. Air Force Occupational and Environmental
Health Laboratory, April 1974.
2. C.C. Shih, R.F. Tobias, J.F. Clausen, and R.J. Johnson, "Thermal Degradation
of Military Standard Pesticide Formulations," TRW Systems and Energy report
to U.S. Army Medical Research and Development Command, Report No. 24768-
6019-RU-OO, March 1975.
3. "Review of Proposed Action to Dispose of Orange Herbicide by Incineration,"
Report prepared by Arthur D. Little, Inc., for U.S. Air Force occupational
and Environmental Health Laboratory, June 1975.
4. B.J. Stojanovic, M.V. Kennedy, and W.C. Shaw, "Thermal Decomposition of
Orange Herbicides," Mississippi State University and U.S. Department of
Agriculture, June 1972.
226
image:
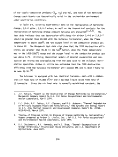 TABLE D-4. INCINERATOR DESTRUCTION EFFICIENCY FOR CHLORINATED
HYDROCARBONS AND HERBICIDE ORANGE
Test
Organization
Karquardt/USAFEHL
Marquardf'.jbAFEHL
TRW
TRU
TRU
Arthur 0. Little
Theoretical
Analysis
Test
6
Nov. 1973 Sue Burner
Nov. 1973 Sue Burner
Aug. 1974 Pesticide
Incinerator
Aug. 1974 Pesticide
Incinerator
Aug. 1974 Pesticide
Incinerator
197.- Vulcanus
* Cotrbustuo efficiency is defined as (C0£
t Host likely to be
near the 99.9*. level.
Herbicide
240 kg/hr
270 kg/hr
4.3 kg/hr
4.5 Vg/nr
3.6 kg/hr
11.5 tonnes/hr
concentration -
Injection
Eauipment
Spray Atomizer
Slot Nozzle
Air Assisted
Radial Spray
Air Assisted
Radial Spray
Air Assisted
Radial Spray
Rotary Cup
CO concentration)
Note: Percent destruction efficiencies are expressed as >99.9" or >99.999*
found In the combustion product gas Is below the detection limit for
ro
no
°2 Conc' ln Residence
Temperature Stack Gas Time
1450 - 1750°C 6.6 - 9.7; 0.14 - 0.16 sec
1680 - 1850°C 4.7 - 4.9J 0.14 - 0.18 sec
MOOO°C 6.7-. 0.6 sec
•<• 975°C 6.8S 0.65 sec
M120°C 7.2; 0.45 sec
1350°C 7.4'. 0.61 sec
* 100/C02 concentration.
when the amount of the chemical species
the species.
Material
Burned
Herbicide Orange
Herbicide Orange
2, 4-D Ester
2, 4, 5-T Ester
2. 4-0 Ester
2,4, 5-T Ester
and Mo. 2 Oil
(1:1:6 Volume
Ratio)
"erbicide Orange
Combustion " °«"""»">" Efficiency
Efficiency HC Chlorinated HC 2, 4-0 2, 4, 5-T TCDO
99.6 - 99.99 - >99.999 >99.999 >99.96
99,84 - 99.96 - >99.999 >99.999 >99.92
99.99151 >99.99 - 99.9995
99.97981 >99.99 - - 99.9995
99.9905% >99.99 - 99.9992 99.9992
99.97 - >99.97 >99.97 >99",*
image:
TABLE D-4. INCINERATOR DESTRUCTION EFFICIENCY FOR CHLORINATED
HYDROCARBONS AND HERBICIDE ORANGE
Test
Organization
Karquardt/USAFEHL
Marquardf'.jbAFEHL
TRW
TRU
TRU
Arthur 0. Little
Theoretical
Analysis
Test
6
Nov. 1973 Sue Burner
Nov. 1973 Sue Burner
Aug. 1974 Pesticide
Incinerator
Aug. 1974 Pesticide
Incinerator
Aug. 1974 Pesticide
Incinerator
197.- Vulcanus
* Cotrbustuo efficiency is defined as (C0£
t Host likely to be
near the 99.9*. level.
Herbicide
240 kg/hr
270 kg/hr
4.3 kg/hr
4.5 Vg/nr
3.6 kg/hr
11.5 tonnes/hr
concentration -
Injection
Eauipment
Spray Atomizer
Slot Nozzle
Air Assisted
Radial Spray
Air Assisted
Radial Spray
Air Assisted
Radial Spray
Rotary Cup
CO concentration)
Note: Percent destruction efficiencies are expressed as >99.9" or >99.999*
found In the combustion product gas Is below the detection limit for
ro
no
°2 Conc' ln Residence
Temperature Stack Gas Time
1450 - 1750°C 6.6 - 9.7; 0.14 - 0.16 sec
1680 - 1850°C 4.7 - 4.9J 0.14 - 0.18 sec
MOOO°C 6.7-. 0.6 sec
•<• 975°C 6.8S 0.65 sec
M120°C 7.2; 0.45 sec
1350°C 7.4'. 0.61 sec
* 100/C02 concentration.
when the amount of the chemical species
the species.
Material
Burned
Herbicide Orange
Herbicide Orange
2, 4-D Ester
2, 4, 5-T Ester
2. 4-0 Ester
2,4, 5-T Ester
and Mo. 2 Oil
(1:1:6 Volume
Ratio)
"erbicide Orange
Combustion " °«"""»">" Efficiency
Efficiency HC Chlorinated HC 2, 4-0 2, 4, 5-T TCDO
99.6 - 99.99 - >99.999 >99.999 >99.96
99,84 - 99.96 - >99.999 >99.999 >99.92
99.99151 >99.99 - 99.9995
99.97981 >99.99 - - 99.9995
99.9905% >99.99 - 99.9992 99.9992
99.97 - >99.97 >99.97 >99",*
image:
 maximum liquid waste rate of 12 tonnes/hr stipulates a minimum air/Herbicide
o
Orange feed ratio of 6,25 m air per kg of Herbicide Orange. It has been
pointed out that this minimum air/Herbicide Orange feed ratio corresponds to
an estimated flame temperature of 1840°C and oxygen level of 3.0% in the com-
bustion product gas. At higher air/Herbicide Orange feed ratios, the estimated
flame temperature decreases and the oxygen level in the combustion product gas
increases. At an air/Herbicide Orange feed ratio of 10.56 m3 air per kg of
Herbicide Orange, the estimated flame temperature is 1150°C and the oxygen
level in the combustion product gas is approximately 9.9%. Since a minimum
temperature of 1000°C is necessary to ensure the near complete destruction of
3
TCDD, ' air/Herbicide Orange feed ratios exceeding 10.56 m air per kg of
Herbicide Orange should not be considered for Herbicide Orange incineration.
At an air feed rate of 75,000 m /hr, the recommended Herbicide Orange feed rate
to each Vulcanus incinerator is 7.1 to 9.6 tonnes/hr. The higher Herbicide
Orange feed rate is the preferred mode of operation because the resulting higher
flame temperature would lead to more rapid evaporation of the liquid herbicide
droplets as well as faster chemical reaction rates.
In Table D-5, the estimated emission rates and concentrations for 2,4-D,
2,4,5-T and TCDD from Herbicide Orange incineration on Vulcanus are presented.
The 2,4-D and 2,4,5-T emission rates were estimated on the basis of 99.99%
destruction efficiency for these herbicide components. The TCDD emission rates
were estimated at both 99 and 99.9% destruction efficiency, for TCDD concentra-
tions of 2 to 47 ppmw in Herbicide Orange. As shown in Table D-5, the estimated
TCDD concentration in the incinerator effluent is in the 0.14 to 4.23 ppb range
at 99% destruction efficiency, and the estimated 2,4-D or 2,4,5-T concentration
in the incinerator effluent is 350 to 520 ppb.
In summary, the analysis of existing test data and the theoretical analysis
performed by Arthur D. Little have shown that the TCDD present in Herbicide
Orange can be successfully destroyed with the Vulcanus incinerator. The best
estimate for the TCDD destruction efficiency is 99.9%. To assure high TCDD
destruction efficiencies, combustion efficiencies in excess of 99.9% are deemed
necessary as an indication that there is adequate mixing between combustibles
and air and the combustion process is complete.
228
image:
maximum liquid waste rate of 12 tonnes/hr stipulates a minimum air/Herbicide
o
Orange feed ratio of 6,25 m air per kg of Herbicide Orange. It has been
pointed out that this minimum air/Herbicide Orange feed ratio corresponds to
an estimated flame temperature of 1840°C and oxygen level of 3.0% in the com-
bustion product gas. At higher air/Herbicide Orange feed ratios, the estimated
flame temperature decreases and the oxygen level in the combustion product gas
increases. At an air/Herbicide Orange feed ratio of 10.56 m3 air per kg of
Herbicide Orange, the estimated flame temperature is 1150°C and the oxygen
level in the combustion product gas is approximately 9.9%. Since a minimum
temperature of 1000°C is necessary to ensure the near complete destruction of
3
TCDD, ' air/Herbicide Orange feed ratios exceeding 10.56 m air per kg of
Herbicide Orange should not be considered for Herbicide Orange incineration.
At an air feed rate of 75,000 m /hr, the recommended Herbicide Orange feed rate
to each Vulcanus incinerator is 7.1 to 9.6 tonnes/hr. The higher Herbicide
Orange feed rate is the preferred mode of operation because the resulting higher
flame temperature would lead to more rapid evaporation of the liquid herbicide
droplets as well as faster chemical reaction rates.
In Table D-5, the estimated emission rates and concentrations for 2,4-D,
2,4,5-T and TCDD from Herbicide Orange incineration on Vulcanus are presented.
The 2,4-D and 2,4,5-T emission rates were estimated on the basis of 99.99%
destruction efficiency for these herbicide components. The TCDD emission rates
were estimated at both 99 and 99.9% destruction efficiency, for TCDD concentra-
tions of 2 to 47 ppmw in Herbicide Orange. As shown in Table D-5, the estimated
TCDD concentration in the incinerator effluent is in the 0.14 to 4.23 ppb range
at 99% destruction efficiency, and the estimated 2,4-D or 2,4,5-T concentration
in the incinerator effluent is 350 to 520 ppb.
In summary, the analysis of existing test data and the theoretical analysis
performed by Arthur D. Little have shown that the TCDD present in Herbicide
Orange can be successfully destroyed with the Vulcanus incinerator. The best
estimate for the TCDD destruction efficiency is 99.9%. To assure high TCDD
destruction efficiencies, combustion efficiencies in excess of 99.9% are deemed
necessary as an indication that there is adequate mixing between combustibles
and air and the combustion process is complete.
228
image:
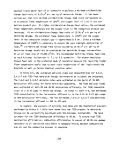 TABLE D-5. ESTIMATED EMISSION RATES AND CONCENTRATIONS FOR HERBICIDE ORANGE
DESTRUCTION AT TWO AIR/HERBICIDE ORANGE FEED RATIOS
AVteed °-Sc^d *«-*" °2 Level
3 e Rate Flame in Comb.
(m /hr) (tonnes/hr) Temperature Product
75, 00^ 9.522 -vl4700C ^6.5?
75,000 7.102 M150°C MO.O'
Emission Rate (g/hr) Emission Concentration
TCDD at TCDD at TCDD at TCDD at
2,4-D 2,4,5-T 99% O.E. 99. 9T D.E. 2,4-D 2,4,5-T 99% D.E. 99.9% D.E.
476 476 0.19-4.47 0.019-0.447 520 ppb 460 ppb 0.18-4. 23 ppb 0.018-0.423 ppb
355 355 0.14-3.34 0.014-0.334 400 ppb 350 ppb 0.14-3. 21 ppb 0.014-0.321 ppb
vo
Note: Estimated flame temperature is assumed to be 100°C lower than the calculated adiabatic flame temperature.
The ?.4-D and 2,4,5-T emission rates are based on 99.99% destruction efficiency of these herbicide
components. The lower range of estimated TCDD emissions corresponds to a 2 ppmw of TCDD in Herbicide
Orange, and the upper range corresponds to a 47 ppmw of TCDD in Herbicide Orange.
image:
TABLE D-5. ESTIMATED EMISSION RATES AND CONCENTRATIONS FOR HERBICIDE ORANGE
DESTRUCTION AT TWO AIR/HERBICIDE ORANGE FEED RATIOS
AVteed °-Sc^d *«-*" °2 Level
3 e Rate Flame in Comb.
(m /hr) (tonnes/hr) Temperature Product
75, 00^ 9.522 -vl4700C ^6.5?
75,000 7.102 M150°C MO.O'
Emission Rate (g/hr) Emission Concentration
TCDD at TCDD at TCDD at TCDD at
2,4-D 2,4,5-T 99% O.E. 99. 9T D.E. 2,4-D 2,4,5-T 99% D.E. 99.9% D.E.
476 476 0.19-4.47 0.019-0.447 520 ppb 460 ppb 0.18-4. 23 ppb 0.018-0.423 ppb
355 355 0.14-3.34 0.014-0.334 400 ppb 350 ppb 0.14-3. 21 ppb 0.014-0.321 ppb
vo
Note: Estimated flame temperature is assumed to be 100°C lower than the calculated adiabatic flame temperature.
The ?.4-D and 2,4,5-T emission rates are based on 99.99% destruction efficiency of these herbicide
components. The lower range of estimated TCDD emissions corresponds to a 2 ppmw of TCDD in Herbicide
Orange, and the upper range corresponds to a 47 ppmw of TCDD in Herbicide Orange.
image:
 APPENDIX E
TRAPPING EFFICIENCY STUDY OF
THE LEAR-SIEGLER TRAIN SORBENT TRAP
230
image:
APPENDIX E
TRAPPING EFFICIENCY STUDY OF
THE LEAR-SIEGLER TRAIN SORBENT TRAP
230
image:
 APPENDIX E
1. INTRODUCTION
The Lear-Siegler sorbent trap system was used in the Herbicide Orange
program for two purposes. First, this sampling train was intended to acquire
combustion effluent samples for the purposes of assessing the emission burden
from the incineration. Secondly, the Lear-Siegler train was intended as a
back-up to the primary USAF-OEHL train for measurement of TCDD emissions.
Since the Lear-Siegler train had not been used to trap TCDD before this pro-
gram, it was required to test the trapping efficiency of the system.
2. TEST APPARATUS
A schematic of the test apparatus is shown in Figure E-l. The apparatus
consisted of a tube furnace with a special designed tubular glass chamber which
extended beyond both ends of the furnace. Specially designed glass boats for
containing test samples could be placed in the center of the glass chamber. A
thermocouple was placed directly over the glass boat.
The exit end of the glass chamber was connected to an all-glass sampling
train consisting of the following parts in series:
• The Lear-Siegler sorbent trap
• Two benzene filled impingers
• One empty impinger
• One activated charcoal filled impinger
• One silica gell filled impinger
The last impinger was connected to a vacuum pump in order to maintain a
slight negative pressure in the entire system. The glass tubing between exit
end of the chamber and the sorbent trap was wrapped in heating tape and main-
tained at 190°C.
The upstream end of the glass chamber was connected to a nitrogen cylinder.
With a rotameter and needle valve, a constant nitrogen flow through the system
231
image:
APPENDIX E
1. INTRODUCTION
The Lear-Siegler sorbent trap system was used in the Herbicide Orange
program for two purposes. First, this sampling train was intended to acquire
combustion effluent samples for the purposes of assessing the emission burden
from the incineration. Secondly, the Lear-Siegler train was intended as a
back-up to the primary USAF-OEHL train for measurement of TCDD emissions.
Since the Lear-Siegler train had not been used to trap TCDD before this pro-
gram, it was required to test the trapping efficiency of the system.
2. TEST APPARATUS
A schematic of the test apparatus is shown in Figure E-l. The apparatus
consisted of a tube furnace with a special designed tubular glass chamber which
extended beyond both ends of the furnace. Specially designed glass boats for
containing test samples could be placed in the center of the glass chamber. A
thermocouple was placed directly over the glass boat.
The exit end of the glass chamber was connected to an all-glass sampling
train consisting of the following parts in series:
• The Lear-Siegler sorbent trap
• Two benzene filled impingers
• One empty impinger
• One activated charcoal filled impinger
• One silica gell filled impinger
The last impinger was connected to a vacuum pump in order to maintain a
slight negative pressure in the entire system. The glass tubing between exit
end of the chamber and the sorbent trap was wrapped in heating tape and main-
tained at 190°C.
The upstream end of the glass chamber was connected to a nitrogen cylinder.
With a rotameter and needle valve, a constant nitrogen flow through the system
231
image:
 NITROGEN
PRESSURE
VACUUM
GAUGE
TUBE FURNACE
THERMOCOUPLE
BOAT
THREE WAY
BALL VALVE
r\>
OJ
ro
RECIRCULATION
PUMP
\/
BENZENE
THERMOMETERS
O3IFICE
/
EMPTY
ACTIVATED /
CHARCOAL SILICA GEL
BY-PASS
I VALVE <
LINE
0 VACUUM
GAUGE
I
MAIN
VALVE
AIR-TIGHT
PUMP
DRY TEST
METER
Figure E-l. Schematic for sorbent trap efficiency test.
image:
NITROGEN
PRESSURE
VACUUM
GAUGE
TUBE FURNACE
THERMOCOUPLE
BOAT
THREE WAY
BALL VALVE
r\>
OJ
ro
RECIRCULATION
PUMP
\/
BENZENE
THERMOMETERS
O3IFICE
/
EMPTY
ACTIVATED /
CHARCOAL SILICA GEL
BY-PASS
I VALVE <
LINE
0 VACUUM
GAUGE
I
MAIN
VALVE
AIR-TIGHT
PUMP
DRY TEST
METER
Figure E-l. Schematic for sorbent trap efficiency test.
image:
 could be maintained. All glass parts outside the tube furnace were wrapped with
aluminum foil to prevent degradation of the 2,3,7,8-TCDD (TCDD) samples by
uv radiation.
3. PROCEDURE
The procedure was the same for all tests. The apparatus was first leak
tested. The sample was added to the glass boat which was then moved to the
center of the furnace. The nitrogen purge was started at the same time as the
vacuum pump. The flow rate was adjusted to 0.5 liters per minute, and the
vacuum was adjusted to maintain an interior pressure of 14 psia. The furnace
was then turned on and maintained at 100°C for 30 minutes to evaporate the
benzene solvent. Then the oven was brought slowly to 400°C, at which tempera-
ture it was kept for 2 hours. The system was then allowed to cool under the
nitrogen purge. After cooling, it was disassembled for sample recovery.
Four tests were performed. The first test was a blank in which benzene
alone rather than TCDD standards were used. In the second test, 30 yg of TCDD
were used. In the third and fourth tests, 60 yg of TCDD were used.
4. SAMPLE RECOVERY
The sample boat was placed in an amber colored glass bottle containing
100 ml of pentane and allowed to soak for 30 minutes. The boat was removed
and rinsed into the bottle. The glass chamber and connecting line to the
inlet of the sorbent trap were filled with pentane and allowed to stand for
5 minutes. This wash was collected. The chamber and lines were rinsed with
additional pentane. The washes and rinses of the boat, chamber, and connect-
ing line were combined as one sample.
Each of the two benzene impingers downstream of the sorbent trap was
treated as a separate sample. The benzene contents were recovered. Each
impinger was rinsed with benzene, and the rinsings were combined with the
recovered contents.
The sorbent trap resin was extracted with pentane in a soxhlet apparatus
using standard procedures described in detail in Appendix C. After the resin
was removed from the trap, the trap interior was rinsed with pentane, and these
rinses were added to the extraction flask. An extraction blank was prepared
in an identical manner.
233
image:
could be maintained. All glass parts outside the tube furnace were wrapped with
aluminum foil to prevent degradation of the 2,3,7,8-TCDD (TCDD) samples by
uv radiation.
3. PROCEDURE
The procedure was the same for all tests. The apparatus was first leak
tested. The sample was added to the glass boat which was then moved to the
center of the furnace. The nitrogen purge was started at the same time as the
vacuum pump. The flow rate was adjusted to 0.5 liters per minute, and the
vacuum was adjusted to maintain an interior pressure of 14 psia. The furnace
was then turned on and maintained at 100°C for 30 minutes to evaporate the
benzene solvent. Then the oven was brought slowly to 400°C, at which tempera-
ture it was kept for 2 hours. The system was then allowed to cool under the
nitrogen purge. After cooling, it was disassembled for sample recovery.
Four tests were performed. The first test was a blank in which benzene
alone rather than TCDD standards were used. In the second test, 30 yg of TCDD
were used. In the third and fourth tests, 60 yg of TCDD were used.
4. SAMPLE RECOVERY
The sample boat was placed in an amber colored glass bottle containing
100 ml of pentane and allowed to soak for 30 minutes. The boat was removed
and rinsed into the bottle. The glass chamber and connecting line to the
inlet of the sorbent trap were filled with pentane and allowed to stand for
5 minutes. This wash was collected. The chamber and lines were rinsed with
additional pentane. The washes and rinses of the boat, chamber, and connect-
ing line were combined as one sample.
Each of the two benzene impingers downstream of the sorbent trap was
treated as a separate sample. The benzene contents were recovered. Each
impinger was rinsed with benzene, and the rinsings were combined with the
recovered contents.
The sorbent trap resin was extracted with pentane in a soxhlet apparatus
using standard procedures described in detail in Appendix C. After the resin
was removed from the trap, the trap interior was rinsed with pentane, and these
rinses were added to the extraction flask. An extraction blank was prepared
in an identical manner.
233
image:
 The samples from the tests (sorbent trap extract, the apparatus rinses,
and the two benzene impingers) were reduced in volume to 2 ml using Kuderna-
Danish concentrators.
5. ANALYSIS
The concentrated samples (and blanks) from the tests were analyzed using
a Finnigan 4000 gas chromatograph-mass spectrometer. The analytical and oper-
ating parameters were similar to these recommended by WSU and were as
follows:
• GC column: 6-ft X 2-mm ID glass column, 3% OV-101 on
100/120 mesh Gas Chrom Q R
• Carrier gas: helium at 50 ml/min
• Column temperature: 180°C
• Injector: 300°
• Jet separator: 275°C
• Filament current: 0.2 mA
• Multiplier voltage: 200V
t Analyzer pressure: 1-3 X 10 torr
The m/e 322 ion was monitored and used for quantisation. Calibration
standards were the same as used for the tests.
6. RESULTS AND CONCLUSIONS
The results of the analyses are given in Table E-l. On the basis of these
results an average minimum efficiency of the sorbent trap for collecting and
releasing TCDD is calculated to be 62%.
In a report by A.D. Little, Inc.,^ the sorbent trap was tested by adding
TCDD standards directly into the sorbent resin rather than by vaporizing the
TCDD and passing the vapor into the trap. Their average recovery was 65%.
234
image:
The samples from the tests (sorbent trap extract, the apparatus rinses,
and the two benzene impingers) were reduced in volume to 2 ml using Kuderna-
Danish concentrators.
5. ANALYSIS
The concentrated samples (and blanks) from the tests were analyzed using
a Finnigan 4000 gas chromatograph-mass spectrometer. The analytical and oper-
ating parameters were similar to these recommended by WSU and were as
follows:
• GC column: 6-ft X 2-mm ID glass column, 3% OV-101 on
100/120 mesh Gas Chrom Q R
• Carrier gas: helium at 50 ml/min
• Column temperature: 180°C
• Injector: 300°
• Jet separator: 275°C
• Filament current: 0.2 mA
• Multiplier voltage: 200V
t Analyzer pressure: 1-3 X 10 torr
The m/e 322 ion was monitored and used for quantisation. Calibration
standards were the same as used for the tests.
6. RESULTS AND CONCLUSIONS
The results of the analyses are given in Table E-l. On the basis of these
results an average minimum efficiency of the sorbent trap for collecting and
releasing TCDD is calculated to be 62%.
In a report by A.D. Little, Inc.,^ the sorbent trap was tested by adding
TCDD standards directly into the sorbent resin rather than by vaporizing the
TCDD and passing the vapor into the trap. Their average recovery was 65%.
234
image:
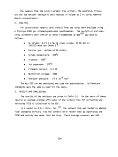 TABLE E-l. RESULTS OF EFFICIENCY STUDY OF THE LEAR-SIEGLER SORBENT TRAP
Test
1
2
3
4
Sampl e
Boat, Lines
Sorbent Trap
Impinger #1
Impinger #2
Total
Boat, Lines
Sorbent Trap
Impinger #1
Impinger #2
Total
Boat, Lines
Sorbent Trap
Impinger #1
Impinger #2
Total
Boat, Lines
Sorbent Trap
Impinger #1 .
Impinger #2
Total
ug TCDD % TCDD
lag TCDD Taken Found
ND
ND
ND
ND
<0.1 0.0 0.0
ND
20 67
ND
ND
20 30 67
ND
44 73
ND
ND
44 60 73
ND
27 45
ND
ND
1Z 60 41
ND indicates not detected.
The similarity of these results leads to the conclusion that the sorbent
trap is probably nearly 100% efficient at trapping TCDD but is 62-65% efficient
at releasing trapped TCDD by soxhlet extraction.
235
image:
TABLE E-l. RESULTS OF EFFICIENCY STUDY OF THE LEAR-SIEGLER SORBENT TRAP
Test
1
2
3
4
Sampl e
Boat, Lines
Sorbent Trap
Impinger #1
Impinger #2
Total
Boat, Lines
Sorbent Trap
Impinger #1
Impinger #2
Total
Boat, Lines
Sorbent Trap
Impinger #1
Impinger #2
Total
Boat, Lines
Sorbent Trap
Impinger #1 .
Impinger #2
Total
ug TCDD % TCDD
lag TCDD Taken Found
ND
ND
ND
ND
<0.1 0.0 0.0
ND
20 67
ND
ND
20 30 67
ND
44 73
ND
ND
44 60 73
ND
27 45
ND
ND
1Z 60 41
ND indicates not detected.
The similarity of these results leads to the conclusion that the sorbent
trap is probably nearly 100% efficient at trapping TCDD but is 62-65% efficient
at releasing trapped TCDD by soxhlet extraction.
235
image:
 APPENDIX F
SAMPLE CALCULATIONS
236
image:
APPENDIX F
SAMPLE CALCULATIONS
236
image:
 APPENDIX F - INDEX
Page
1. PROBE AND LINE RINSE APPORTIONMENT 238
2. CALCULATIONS FROM GAS COMPOSITION DATA 238
3. CALCULATION OF STACK GAS COMPONENT EMISSIONS 239
4. INCINERATOR RESIDENCE TIME 240
5. GRAVIMETRIC ANALYSES 241
6. VOLATILE HYDROCARBON EMISSIONS 241
7. GC/MS ANALYSES OF LEAR-SIEGLER TRAIN SAMPLES 241
8. EMISSION CONCENTRATIONS OF 2,4-D, 2,4,5-T, AND
TCDD AT 0% DESTRUCTION EFFICIENCY 242
9.' DESTRUCTION EFFICIENCIES FOR TCDD FROM WSU ANALYSES 245
10. DESTRUCTION EFFICIENCIES FOR 2,4-D and 2,4,5-T FROM
LEAR-SIEGLER TRAIN ANALYSES 245
11. DESTRUCTION EFFICIENCIES FOR 2,4-D and 2,4,5-T FROM
BCL ANALYSES 246
12. CONVERSION OF CONCENTRATIONS 246
237
image:
APPENDIX F - INDEX
Page
1. PROBE AND LINE RINSE APPORTIONMENT 238
2. CALCULATIONS FROM GAS COMPOSITION DATA 238
3. CALCULATION OF STACK GAS COMPONENT EMISSIONS 239
4. INCINERATOR RESIDENCE TIME 240
5. GRAVIMETRIC ANALYSES 241
6. VOLATILE HYDROCARBON EMISSIONS 241
7. GC/MS ANALYSES OF LEAR-SIEGLER TRAIN SAMPLES 241
8. EMISSION CONCENTRATIONS OF 2,4-D, 2,4,5-T, AND
TCDD AT 0% DESTRUCTION EFFICIENCY 242
9.' DESTRUCTION EFFICIENCIES FOR TCDD FROM WSU ANALYSES 245
10. DESTRUCTION EFFICIENCIES FOR 2,4-D and 2,4,5-T FROM
LEAR-SIEGLER TRAIN ANALYSES 245
11. DESTRUCTION EFFICIENCIES FOR 2,4-D and 2,4,5-T FROM
BCL ANALYSES 246
12. CONVERSION OF CONCENTRATIONS 246
237
image:
 APPENDIX F
1. PROBE AND LINE RINSE APPORTIONMENT
For the test of 7/16/77, the Lear-Siegler train sampled 6.0914 m3. The
3
benzene impinger train took three samples, one for WSU of 0.1179 m, one for
TRW of 0.1209 m3, and one for BCL/USAF of 0.1211 m3. These four samples
o
totaled 6.4513 m . Each sample represents the following fraction of the total.
• Lear-Siegler - 94.42%
• WSU impinger - 1.83%
• TRW impinger - 1.87%
a BCL/USAF impinger - 1.88%
To apportion the line rinses properly to each sample, the total line rinse
volume of 2320 ml was multiplied by the fraction of gas taken in each sample.
Thus, 94.42% of 2320 ml is 2191 ml.
The probe rinse split was complicated by the fact that three days of test-
ing were performed before rinsing the probe. Thus 330 ml of probe rinse was
o
obtained and a total of 17.2883 m of gas had been sampled (tests of 14, 15,
and 16 July). The Lear-Siegler train sample of 7/16 was 6.0914 m or 35.23%
of 17.2883 m3, and 35.23% of the 330 ml probe rinse was 116 ml.
2. CALCULATIONS FROM GAS COMPOSITION DATA
2.1 Volume Percent HC1 in Combustion Effluent
From the data given in Table 13 for test day 2, the volume percent HC1 is
Vni t HH - % Cl/mol wt Cl y , - rn
Vo1 % HC1 " wt % Cl mol wt C x Vo1 % C02
= (29.87/35.453)/(49.11/12.Oil) x 10.7
= 2.20%
238
image:
APPENDIX F
1. PROBE AND LINE RINSE APPORTIONMENT
For the test of 7/16/77, the Lear-Siegler train sampled 6.0914 m3. The
3
benzene impinger train took three samples, one for WSU of 0.1179 m, one for
TRW of 0.1209 m3, and one for BCL/USAF of 0.1211 m3. These four samples
o
totaled 6.4513 m . Each sample represents the following fraction of the total.
• Lear-Siegler - 94.42%
• WSU impinger - 1.83%
• TRW impinger - 1.87%
a BCL/USAF impinger - 1.88%
To apportion the line rinses properly to each sample, the total line rinse
volume of 2320 ml was multiplied by the fraction of gas taken in each sample.
Thus, 94.42% of 2320 ml is 2191 ml.
The probe rinse split was complicated by the fact that three days of test-
ing were performed before rinsing the probe. Thus 330 ml of probe rinse was
o
obtained and a total of 17.2883 m of gas had been sampled (tests of 14, 15,
and 16 July). The Lear-Siegler train sample of 7/16 was 6.0914 m or 35.23%
of 17.2883 m3, and 35.23% of the 330 ml probe rinse was 116 ml.
2. CALCULATIONS FROM GAS COMPOSITION DATA
2.1 Volume Percent HC1 in Combustion Effluent
From the data given in Table 13 for test day 2, the volume percent HC1 is
Vni t HH - % Cl/mol wt Cl y , - rn
Vo1 % HC1 " wt % Cl mol wt C x Vo1 % C02
= (29.87/35.453)/(49.11/12.Oil) x 10.7
= 2.20%
238
image:
 2.2 Percent Combustion Efficiency
From the data given in Table 13 for test day 2, the percent combustion
efficiency, % CE, is
% CE = 100 (X C02 - % CO)/% C02
= 100 (10.7 - 0.0005)/10.7
= 99.995%
2.3 Percent Excess Air - EPA Method 3
From data given in Table 13 for test day 2, the percent excess air, % EA,
in the combustion effluent is
% EA = 100 (% 02 - 0.5% C0)/(0.264% N2 - (X 02 - 0.5% CO))
= 100 (8.1 - 0.5 (0.0005)/(0.264 x 79.0 - (8.1 - 0.5 (0.0005)))
= 63.496%
3. CALCULATION OF STACK GAS COMPONENT EMISSIONS
3.1 Volumes of Components Emitted Per Metric Ton of Herbicide
The following definitions are used:
C = Weight fraction carbon in herbicide, 0.4911
Cl = Weight fraction chlorine in herbicide, 0.2987
0 = Weight fraction oxygen in herbicide, 0.1637
H = Weight fraction hydrogen in herbicide, 0.0465
mt = Metric ton
EA = Excess air
• V(C02) = (C/12..Oil) x 106 g/mt x 0.02406 m3/mole at 20°C
V(C02) = 983.5 m3/mt at 20°C, or 916.4 m3/mt at 0°C
t V(HC1) = (Cl/35.453) x 106 g/mt x 0.02406 m3/mole at 20°C
V(HC1) = 202.7 m3/mt at 20°C, or 188.8 m3/mt at 0°C
• V(02) = V(C02) x % 02/% C02
V(02) = 983.5 (% 02/% C02) m3/mt at 20°C, or
916.4 (% 02/% C02) m3/mt at 0°C
239
image:
2.2 Percent Combustion Efficiency
From the data given in Table 13 for test day 2, the percent combustion
efficiency, % CE, is
% CE = 100 (X C02 - % CO)/% C02
= 100 (10.7 - 0.0005)/10.7
= 99.995%
2.3 Percent Excess Air - EPA Method 3
From data given in Table 13 for test day 2, the percent excess air, % EA,
in the combustion effluent is
% EA = 100 (% 02 - 0.5% C0)/(0.264% N2 - (X 02 - 0.5% CO))
= 100 (8.1 - 0.5 (0.0005)/(0.264 x 79.0 - (8.1 - 0.5 (0.0005)))
= 63.496%
3. CALCULATION OF STACK GAS COMPONENT EMISSIONS
3.1 Volumes of Components Emitted Per Metric Ton of Herbicide
The following definitions are used:
C = Weight fraction carbon in herbicide, 0.4911
Cl = Weight fraction chlorine in herbicide, 0.2987
0 = Weight fraction oxygen in herbicide, 0.1637
H = Weight fraction hydrogen in herbicide, 0.0465
mt = Metric ton
EA = Excess air
• V(C02) = (C/12..Oil) x 106 g/mt x 0.02406 m3/mole at 20°C
V(C02) = 983.5 m3/mt at 20°C, or 916.4 m3/mt at 0°C
t V(HC1) = (Cl/35.453) x 106 g/mt x 0.02406 m3/mole at 20°C
V(HC1) = 202.7 m3/mt at 20°C, or 188.8 m3/mt at 0°C
• V(02) = V(C02) x % 02/% C02
V(02) = 983.5 (% 02/% C02) m3/mt at 20°C, or
916.4 (% 02/% C02) m3/mt at 0°C
239
image:
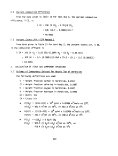 0.02406 m3/mole x (0.7809/0.2095) ( 1+ EA) m3/mt at 20°C
V(N2) = 3984 (1 + EA) m3/mt at 20°C, or 3712 (1 + EA) m3/mt at 0°C
, combustion)
(1/2) (
at 20°C
= (1/2) (H/1.008 - Cl/35.453) x 106 g/mt x 0.02406 m3/mole
= 453.5 m3/mt at 20°C, or 422.6 m3/mt at 0°C
• V(H20, air)
= (V(N2)/0.7809) (PH Q/760 mm)
A typical ambient temperature was 80°F (26.7°C), and a typical
relative humidity was 84%. Under these conditions, Pu n was
22.04 mm. H2U
V(H20, air)
= 0.0372 V(N2)
3.2 Volume Rates of Emission
Using averages for all three burns (% 02 = 8.9, % C02 = 10.3, excess air =
74%, feed rate =7.3 metric tons per hour), the following average volume flow
rates at 0°C were calculated:
• V(C02) = 916.4 m3/mt x 7.3 mt/hr = 6,690 m3/hr
t
V(HC1) = 188.8 m3/mt x 7.3 mt/hr = 1,378 m3/hr
• V(02) = V(C02) x (8.9% 02/10.3% C02) x 7.3 mt/hr = 5,781 m3/hr
• V(N2) = 3,712 (1 + 0.74) m3/mt x 7.3 mt/hr = 47,150 m3/hr
•
V(H20, combustion)
= 422.6 m3/mt x 7.3 mt/hr = 3,085 m3/hr
t V(H20, air)
= 0.0372 V(N2) = 1,745 m3/hr
The total average combustion effluent flow rate per incinerator was 65,838 m/hr.
4. INCINERATOR RESIDENCE TIME
furnace volume
t =
emission rate x T/273.16
240
image:
0.02406 m3/mole x (0.7809/0.2095) ( 1+ EA) m3/mt at 20°C
V(N2) = 3984 (1 + EA) m3/mt at 20°C, or 3712 (1 + EA) m3/mt at 0°C
, combustion)
(1/2) (
at 20°C
= (1/2) (H/1.008 - Cl/35.453) x 106 g/mt x 0.02406 m3/mole
= 453.5 m3/mt at 20°C, or 422.6 m3/mt at 0°C
• V(H20, air)
= (V(N2)/0.7809) (PH Q/760 mm)
A typical ambient temperature was 80°F (26.7°C), and a typical
relative humidity was 84%. Under these conditions, Pu n was
22.04 mm. H2U
V(H20, air)
= 0.0372 V(N2)
3.2 Volume Rates of Emission
Using averages for all three burns (% 02 = 8.9, % C02 = 10.3, excess air =
74%, feed rate =7.3 metric tons per hour), the following average volume flow
rates at 0°C were calculated:
• V(C02) = 916.4 m3/mt x 7.3 mt/hr = 6,690 m3/hr
t
V(HC1) = 188.8 m3/mt x 7.3 mt/hr = 1,378 m3/hr
• V(02) = V(C02) x (8.9% 02/10.3% C02) x 7.3 mt/hr = 5,781 m3/hr
• V(N2) = 3,712 (1 + 0.74) m3/mt x 7.3 mt/hr = 47,150 m3/hr
•
V(H20, combustion)
= 422.6 m3/mt x 7.3 mt/hr = 3,085 m3/hr
t V(H20, air)
= 0.0372 V(N2) = 1,745 m3/hr
The total average combustion effluent flow rate per incinerator was 65,838 m/hr.
4. INCINERATOR RESIDENCE TIME
furnace volume
t =
emission rate x T/273.16
240
image:
 The furnace volume was 120 m , the average emission rate was calculated
to be 65,838 m3/hr, and the average flame temperature, T, was 1500°C (1773°K).
Therefore, the average incinerator residence time for all three burns was
+ 120 m3 _ , n,
1 ~ 65,838 m^/hr 1773°K ~ llU1 sec
3600 sec/hr ' 273<>K
5. GRAVIMETRIC ANALYSES
For sample HO-1-ST-714-F, the pentane extract was made to 300 ml. A 2-ml
aliquot was taken for the C7-C16 GC analysis, the remaining 298 ml volume was
concentrated to 2 ml. A 0.5 ml aliquot of the concentrate was used for the
gravimetric analysis, and a residue weight of 0.561 mg was obtained. A 300-ml
aliquot of pentane gave a nonvolatile residue weight of 0.422 mg
0.561 mg X 2 ml/0.5 ml X 300 ml/298 ml - 0.422 mg = 1.837 mg residue
6. VOLATILE HYDROCARBON EMISSIONS
A 2-ml aliquot of the line rinse of 7/14/77 was taken for the C7-C16 GC
analysis. The volume of line rinse attributable to the Lear-Siegler train sam-
ple was 2098 ml. The analysis of this sample indicated a concentration of
14 ng/yl of species in the C8 boiling point range
14 ng/yl X 103 yl/ml X 2098 ml X (1/6.2012 m3) X 10"6 mg/ng =7.5 mg/m3
7. GC/MS ANALYSES OF LEAR-SIEGLER TRAIN SAMPLES
In the sample HO-1-ST-716-H, dichlorobiphenyl was detected at 10 ng/yl.
The volume of this sorbent trap extract was 350 ml, of which 348 ml were concen-
trated to 2 ml (Table 25). GC/MS analysis was performed on the concentrate.
The volume of gas sampled by that sorbent trap was 6.0914 m3 (Table 6). The
emission concentration of dichlorobiphenyl was
10 ng/yl X 103 yl/ml X 10"3 yg/ng X 2 ml X 350 ml/348 ml X 1/6.0914 m3
= 3 yg/m3
241
image:
The furnace volume was 120 m , the average emission rate was calculated
to be 65,838 m3/hr, and the average flame temperature, T, was 1500°C (1773°K).
Therefore, the average incinerator residence time for all three burns was
+ 120 m3 _ , n,
1 ~ 65,838 m^/hr 1773°K ~ llU1 sec
3600 sec/hr ' 273<>K
5. GRAVIMETRIC ANALYSES
For sample HO-1-ST-714-F, the pentane extract was made to 300 ml. A 2-ml
aliquot was taken for the C7-C16 GC analysis, the remaining 298 ml volume was
concentrated to 2 ml. A 0.5 ml aliquot of the concentrate was used for the
gravimetric analysis, and a residue weight of 0.561 mg was obtained. A 300-ml
aliquot of pentane gave a nonvolatile residue weight of 0.422 mg
0.561 mg X 2 ml/0.5 ml X 300 ml/298 ml - 0.422 mg = 1.837 mg residue
6. VOLATILE HYDROCARBON EMISSIONS
A 2-ml aliquot of the line rinse of 7/14/77 was taken for the C7-C16 GC
analysis. The volume of line rinse attributable to the Lear-Siegler train sam-
ple was 2098 ml. The analysis of this sample indicated a concentration of
14 ng/yl of species in the C8 boiling point range
14 ng/yl X 103 yl/ml X 2098 ml X (1/6.2012 m3) X 10"6 mg/ng =7.5 mg/m3
7. GC/MS ANALYSES OF LEAR-SIEGLER TRAIN SAMPLES
In the sample HO-1-ST-716-H, dichlorobiphenyl was detected at 10 ng/yl.
The volume of this sorbent trap extract was 350 ml, of which 348 ml were concen-
trated to 2 ml (Table 25). GC/MS analysis was performed on the concentrate.
The volume of gas sampled by that sorbent trap was 6.0914 m3 (Table 6). The
emission concentration of dichlorobiphenyl was
10 ng/yl X 103 yl/ml X 10"3 yg/ng X 2 ml X 350 ml/348 ml X 1/6.0914 m3
= 3 yg/m3
241
image:
 8. EMISSION CONCENTRATIONS OF 2,4-D, 2,4,5-T, AND TCDD AT
0% DESTRUCTION EFFICIENCY
For the test of 7/16/77, the waste feed rate was 7.03 metric tons per hour
per incinerator (Table 17). From the on-line monitoring instruments, the con-
centrations of Q£ and C02 were measured (Table 13) at 8.4% and 10.5%, respec-
tively. The effluent flow rate was calculated to be 60,900 dry m3/hr at 20°C
from the following equations. Per metric ton of herbicide per hour
(Appendix F.3):
VT - VC02 + VHC1 + \ + V02
VCQ = 983.5 dry m3/hr
VHCL = 202.7 dry m3/hr
VN = 3984 (1 + XS air) dry m3/hr
2
V0 = VCO x % °2/% C02 = 983'5% Q2/% C02 dry
Vy = 60,900 m3/hr at 20°C.
If the destruction efficiency for 2,4-D + 2,4,5-T were zero, then the
emission concentration of 2,4-D + 2,4,5-T would be:
7.03 X 10³ kg/hr X 103 g/kg X (1/60,900 m3/hr) = 115 g/m3
The TCDD concentration in the composite feed sample of 7/16/77 was deter-
mined to be (Table 38) 2.5 jig/ml. If the destruction efficiency for TCDD were
zero, then the emission concentration of TCDD would be:
7.03 mt/hr x 106 g/mt x 2.5 yg/mi x (1/1.17 g/m) x (1/60,900 m3/hr)
= 247 pg/m3
242
image:
8. EMISSION CONCENTRATIONS OF 2,4-D, 2,4,5-T, AND TCDD AT
0% DESTRUCTION EFFICIENCY
For the test of 7/16/77, the waste feed rate was 7.03 metric tons per hour
per incinerator (Table 17). From the on-line monitoring instruments, the con-
centrations of Q£ and C02 were measured (Table 13) at 8.4% and 10.5%, respec-
tively. The effluent flow rate was calculated to be 60,900 dry m3/hr at 20°C
from the following equations. Per metric ton of herbicide per hour
(Appendix F.3):
VT - VC02 + VHC1 + \ + V02
VCQ = 983.5 dry m3/hr
VHCL = 202.7 dry m3/hr
VN = 3984 (1 + XS air) dry m3/hr
2
V0 = VCO x % °2/% C02 = 983'5% Q2/% C02 dry
Vy = 60,900 m3/hr at 20°C.
If the destruction efficiency for 2,4-D + 2,4,5-T were zero, then the
emission concentration of 2,4-D + 2,4,5-T would be:
7.03 X 10³ kg/hr X 103 g/kg X (1/60,900 m3/hr) = 115 g/m3
The TCDD concentration in the composite feed sample of 7/16/77 was deter-
mined to be (Table 38) 2.5 jig/ml. If the destruction efficiency for TCDD were
zero, then the emission concentration of TCDD would be:
7.03 mt/hr x 106 g/mt x 2.5 yg/mi x (1/1.17 g/m) x (1/60,900 m3/hr)
= 247 pg/m3
242
image:
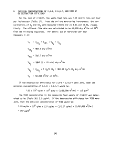 The samples of 8/28/77 were acquired while flashing the water in Tank 6P
during the third burn (Section 3.2.3). Flashing was performed through the star-
board incinerator. The contents of Tank 6P were fed into burner No. 4, and
herbicide from other tanks was fed into burners 5 and 6 (see Figure 5). The
composite feed sample of 8/28/77 was acquired at burner No. 4, the only burner
fitted with a valve for drawing samples. Therefore, this composite feed sample
was not representative of the waste being burned during the test. It is necessary
to assume a representative composite feed sample in order to determine destruction
efficiencies for 2,4-D + 2,4,5-T and TCDD. Details of the assumed representative
composite feed are described below.
The composite feed sample of 8/28/77 consisted of two layers. WSU made
the following measurements on this sample:
• Top layer - water
1) specific gravity 1.02 g/cm
2) TCDD concentration 0.77 ug/cm
3) volume percent 70%
• Bottom layer - herbicide
3
1) specific gravity 1.2 g/cm
2) TCDD concentration 2.8 yg/cm3
3) volume percent 30%
Because feed rates by tank could not be determined during the third burn
(Section 4.1.2), the average waste flow rate was used in the calculations. The
overall waste feed rate for the third burn was 15.2 metric tons per hour or
2.53 metric tons per burner per hour (6 burners). The specific gravity
o
(Section 4.1.2) was 1.19 g/cm , so that the average volume flow rate was 2.13
m /hr per burner. Thus, burners 5 and 6 were fed herbicide at an assumed rate
of 2.53 metric tons per hour each; and burner 4 was fed a mixture of 70% water
and 30% herbicide at an assumed rate of 2.13 cubic meters per hour. From these
243
image:
The samples of 8/28/77 were acquired while flashing the water in Tank 6P
during the third burn (Section 3.2.3). Flashing was performed through the star-
board incinerator. The contents of Tank 6P were fed into burner No. 4, and
herbicide from other tanks was fed into burners 5 and 6 (see Figure 5). The
composite feed sample of 8/28/77 was acquired at burner No. 4, the only burner
fitted with a valve for drawing samples. Therefore, this composite feed sample
was not representative of the waste being burned during the test. It is necessary
to assume a representative composite feed sample in order to determine destruction
efficiencies for 2,4-D + 2,4,5-T and TCDD. Details of the assumed representative
composite feed are described below.
The composite feed sample of 8/28/77 consisted of two layers. WSU made
the following measurements on this sample:
• Top layer - water
1) specific gravity 1.02 g/cm
2) TCDD concentration 0.77 ug/cm
3) volume percent 70%
• Bottom layer - herbicide
3
1) specific gravity 1.2 g/cm
2) TCDD concentration 2.8 yg/cm3
3) volume percent 30%
Because feed rates by tank could not be determined during the third burn
(Section 4.1.2), the average waste flow rate was used in the calculations. The
overall waste feed rate for the third burn was 15.2 metric tons per hour or
2.53 metric tons per burner per hour (6 burners). The specific gravity
o
(Section 4.1.2) was 1.19 g/cm , so that the average volume flow rate was 2.13
m /hr per burner. Thus, burners 5 and 6 were fed herbicide at an assumed rate
of 2.53 metric tons per hour each; and burner 4 was fed a mixture of 70% water
and 30% herbicide at an assumed rate of 2.13 cubic meters per hour. From these
243
image:
 feed rates and the WSU data above, herbicide and TCDD feed rates can be
calculated:
• Burner No. 4
1) water
70% x 2.13 m3/hr x 106 cm3/m3 x 1.02 g/cm3 x 10"6 g/mt
=1.52 mt/hr
2) herbicide
30% x 2.13 m3/hr x 106 cm3/m3 x 1.2 g/cm3 x 10"6 g/mt
= 0.77 mt/hr
3) TCDD, sum of TCDD in water and herbicide
70% x 2.13 m3/hr x 106 cm3/m3 x 0.77 x 10"6 g/cm3 = 1.15 g/hr
30% x 2.13 m3/hr x 106 cm3/m3 x 2.8 x 10"6 g/cm3 = 1.79 g/hr
• Burners 5 and 6
1) herbicide
2 x 2.53 mt/hr = 5.06 mt/hr
2) TCDD
5.06 mt/hr x 106 g/mt x 2.8 x 10"6 g/cm3 x 1/1.2 g/cm3
= 11.8 g/hr
• The total herbicide feed rate is the sum of feeds through burners
4, 5, and 6: 5.83 mt/hr
• The combustion effluent flow rate calculated from the herbicide
feed rate of 5.83 mt/hr is 51,900 nT/hr (20°C)
t The emission concentration at 0% destruction efficiency of 2,4-D
+ 2,4,5-T is 112 g/m3
• The total TCDD feed rate is the sum of feeds through burners
4, 5, and 6: 14.7 g/hr
t The emission concentration at 0% destruction efficiency of TCDD
is 284 pg/m3
244
image:
feed rates and the WSU data above, herbicide and TCDD feed rates can be
calculated:
• Burner No. 4
1) water
70% x 2.13 m3/hr x 106 cm3/m3 x 1.02 g/cm3 x 10"6 g/mt
=1.52 mt/hr
2) herbicide
30% x 2.13 m3/hr x 106 cm3/m3 x 1.2 g/cm3 x 10"6 g/mt
= 0.77 mt/hr
3) TCDD, sum of TCDD in water and herbicide
70% x 2.13 m3/hr x 106 cm3/m3 x 0.77 x 10"6 g/cm3 = 1.15 g/hr
30% x 2.13 m3/hr x 106 cm3/m3 x 2.8 x 10"6 g/cm3 = 1.79 g/hr
• Burners 5 and 6
1) herbicide
2 x 2.53 mt/hr = 5.06 mt/hr
2) TCDD
5.06 mt/hr x 106 g/mt x 2.8 x 10"6 g/cm3 x 1/1.2 g/cm3
= 11.8 g/hr
• The total herbicide feed rate is the sum of feeds through burners
4, 5, and 6: 5.83 mt/hr
• The combustion effluent flow rate calculated from the herbicide
feed rate of 5.83 mt/hr is 51,900 nT/hr (20°C)
t The emission concentration at 0% destruction efficiency of 2,4-D
+ 2,4,5-T is 112 g/m3
• The total TCDD feed rate is the sum of feeds through burners
4, 5, and 6: 14.7 g/hr
t The emission concentration at 0% destruction efficiency of TCDD
is 284 pg/m3
244
image:
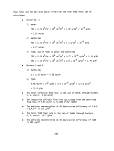 9. DESTRUCTION EFFICIENCIES FOR TCDD FROM WSU ANALYSES
In the sample of 7/16/77, WSU found no TCDD. The minimum detectable con-
centrations (MDC) from Table 38 are used to calculate the maximum possible
amount of TCDD in the sample:
• Impinger: MDC = 0.68 ng in 725 ml = <0.68 ng
• Line rinse: MDC = 0.045 ng/ml x 42.5 ml = <1.91 ng
• Probe rinse: MDC = 0.086 ng/ml x 2.3 ml = <0.2 ng
3
The gas volume sampled was 0.1179 m . Thus, the emission concentration
of TCDD was:
<2.79 ng/0.1179 m3 = <23.6 ng/m3
From Table 49, the emission concentration of TCDD at 0% destruction effi-
y
thus,
ciency was calculated to be 247 yg/m . The destruction efficiency for TCDD was
(247 yg/m3 - <0.0236 yg/m3)/247 yg/m3 = >0.9999
10. DESTRUCTION EFFICIENCIES FOR 2,4-D AND 2,4,5-T FROM
LEAR-SIEGLER TRAIN ANALYSES
Destruction efficiencies for the waste or specific waste constituents are
based on comparing the input rate to the emission rate. That is,
nF _ waste input - waste output ,nn
utwaste waste inputx u
An equivalent method was used in this report. Emission concentrations at
0% destruction efficiency were calculated from waste feed rates and combustion
effluent flow rates (Table 49). These values were compared with emission con-
centrations of, for example, 2,4-D and 2,4,5-T calculated from the laboratory
analyses.
For the test of 7/16/77, neither 2,4-D nor 2,4,5-T was detected in the
sorbent trap, line rinse, or probe rinse samples. Considering the line rinse
only, 248 ml of a sample of 2191 ml (Table 25) were concentrated to 2 ml and
then analyzed by GC/MS. The GC/MS detection limit was 1 ng/yl. The volume of
245
image:
9. DESTRUCTION EFFICIENCIES FOR TCDD FROM WSU ANALYSES
In the sample of 7/16/77, WSU found no TCDD. The minimum detectable con-
centrations (MDC) from Table 38 are used to calculate the maximum possible
amount of TCDD in the sample:
• Impinger: MDC = 0.68 ng in 725 ml = <0.68 ng
• Line rinse: MDC = 0.045 ng/ml x 42.5 ml = <1.91 ng
• Probe rinse: MDC = 0.086 ng/ml x 2.3 ml = <0.2 ng
3
The gas volume sampled was 0.1179 m . Thus, the emission concentration
of TCDD was:
<2.79 ng/0.1179 m3 = <23.6 ng/m3
From Table 49, the emission concentration of TCDD at 0% destruction effi-
y
thus,
ciency was calculated to be 247 yg/m . The destruction efficiency for TCDD was
(247 yg/m3 - <0.0236 yg/m3)/247 yg/m3 = >0.9999
10. DESTRUCTION EFFICIENCIES FOR 2,4-D AND 2,4,5-T FROM
LEAR-SIEGLER TRAIN ANALYSES
Destruction efficiencies for the waste or specific waste constituents are
based on comparing the input rate to the emission rate. That is,
nF _ waste input - waste output ,nn
utwaste waste inputx u
An equivalent method was used in this report. Emission concentrations at
0% destruction efficiency were calculated from waste feed rates and combustion
effluent flow rates (Table 49). These values were compared with emission con-
centrations of, for example, 2,4-D and 2,4,5-T calculated from the laboratory
analyses.
For the test of 7/16/77, neither 2,4-D nor 2,4,5-T was detected in the
sorbent trap, line rinse, or probe rinse samples. Considering the line rinse
only, 248 ml of a sample of 2191 ml (Table 25) were concentrated to 2 ml and
then analyzed by GC/MS. The GC/MS detection limit was 1 ng/yl. The volume of
245
image:
 3
gas sampled was 6.0914 m . The emission concentration of 2,4-D plus 2,4,5-T
was
<1 ng/yl x 103 yl/ml x 2 ml x 2191 ml/248 ml x (1/6.0914 m3) x 10~3 yg/ng
= <3 yg/m •
A similar calculation was performed for the sorbent trap and probe rinse samples
of 7/16/77. The total 2,4-D + 2,4,5-T emission concentration in the sample of
3
7/16/77 was <7 yg/m . The calculated emission concentration of 2,4-D + 2,4,5-T
at 0% destruction efficiency is (Table 45) 115 g/m . The destruction efficiency
for 2,4-D + 2,4,5-T was
(115 x 106 yg/m3 - <7 yg/m3)/175 x 106 yg/m3 = >0.99999993
11. DESTRUCTION EFFICIENCIES FOR 2,4-D AND 2,4,5-T FROM BCL ANALYSES
Neither 2,4-D nor 2,4,5-T was detected in the benzene impinger sample of
7/18/77 (Table 41). The impinger volume was 600 ml, and the volume of gas
sampled was 0.1235 m (Table 52). The detection limits for 2,4-D and 2,4,5-T
were 0.08 yg/ml and 0.04 yg/ml, respectively, and were used to calculate the
maximum possible amounts in the sample:
<0.08 yg/ml x 600 ml x 1/0.1235 m3 = <390 yg/m3 2,5-D
<0.04 y/ml x 600 ml x 1/0.1235 m3 = <190 yg/m3 2,4,5-T
Similar calculations were made for the probe and line rinses. The sample
set of 7/18/77 was found to contain:
<590 yg/m3 of 2,4-D + 2,4,5-T.
The emission concentration at 0% destruction efficiency for 2,4-D +
2,4,5-T on 7/18/77 was 120 g/m (Table 49). The destruction efficiency for
2,4-D + 2,4,5-T was,
(120 g/m3 - <590 yg/m3)/120 g/m3 = >0.99999
12. CONVERSION OF CONCENTRATIONS
Emission concentrations in this report are given exclusively in terms of
3
weight per unit volume, e.g., mg/m . This form of presentation was used rather
than, e.g., ppm, (1) for ease of comparison of measured levels of 2,4-D and
2,4,5-T with the 8 hour TLV of 10 mg/m and (2) because it is necessary to know
246
image:
3
gas sampled was 6.0914 m . The emission concentration of 2,4-D plus 2,4,5-T
was
<1 ng/yl x 103 yl/ml x 2 ml x 2191 ml/248 ml x (1/6.0914 m3) x 10~3 yg/ng
= <3 yg/m •
A similar calculation was performed for the sorbent trap and probe rinse samples
of 7/16/77. The total 2,4-D + 2,4,5-T emission concentration in the sample of
3
7/16/77 was <7 yg/m . The calculated emission concentration of 2,4-D + 2,4,5-T
at 0% destruction efficiency is (Table 45) 115 g/m . The destruction efficiency
for 2,4-D + 2,4,5-T was
(115 x 106 yg/m3 - <7 yg/m3)/175 x 106 yg/m3 = >0.99999993
11. DESTRUCTION EFFICIENCIES FOR 2,4-D AND 2,4,5-T FROM BCL ANALYSES
Neither 2,4-D nor 2,4,5-T was detected in the benzene impinger sample of
7/18/77 (Table 41). The impinger volume was 600 ml, and the volume of gas
sampled was 0.1235 m (Table 52). The detection limits for 2,4-D and 2,4,5-T
were 0.08 yg/ml and 0.04 yg/ml, respectively, and were used to calculate the
maximum possible amounts in the sample:
<0.08 yg/ml x 600 ml x 1/0.1235 m3 = <390 yg/m3 2,5-D
<0.04 y/ml x 600 ml x 1/0.1235 m3 = <190 yg/m3 2,4,5-T
Similar calculations were made for the probe and line rinses. The sample
set of 7/18/77 was found to contain:
<590 yg/m3 of 2,4-D + 2,4,5-T.
The emission concentration at 0% destruction efficiency for 2,4-D +
2,4,5-T on 7/18/77 was 120 g/m (Table 49). The destruction efficiency for
2,4-D + 2,4,5-T was,
(120 g/m3 - <590 yg/m3)/120 g/m3 = >0.99999
12. CONVERSION OF CONCENTRATIONS
Emission concentrations in this report are given exclusively in terms of
3
weight per unit volume, e.g., mg/m . This form of presentation was used rather
than, e.g., ppm, (1) for ease of comparison of measured levels of 2,4-D and
2,4,5-T with the 8 hour TLV of 10 mg/m and (2) because it is necessary to know
246
image:
 o
molecular weight in order to convert to ppm. Conversions of mg/m to ppm,
yg/m to ppb, and ng/m to parts per trillion (ppt) are illustrated below.
Sample HO-1-ST-714-F was found (Table 27) to have 0.23 mg/m3 of hydrocarbons
quantitated as CIO (n-decane, 144 g/mole). The sample gas volumes were corrected
to 20°C, at which temperature one mole of gas occupies 0.02406 m . To convert
3
0.23 mg/m to ppm:
0.23 mg/m3 x 10"3 g/mg x (1/144 g/mole) x 0.02406 m3/mole x 106 = 0.038 ppm
Sample HO-l-ST-716 was found (Table 30) to have 3 yg/m3 (20°C) of
dichlorobiphenyl (223.1 g/mole). To convert 3 pg/m3 to ppb;
3 yg/m3 x 10"6 yg/g x (1/223.1 g/mole) x 0.02406 m3/mole x 109 = 0.32 ppb
TCDD (322.0 g/mole) was not detected in sample HO-l-BI-716 (Table 50).,
The detection limit was used to calculate a maximum possible TCDD concentration
o - o
of <5.8 ng/m (20 C). To convert <5.8 ng/m to ppt:
<5.8 ng/m3 x 10"9 ng/g x (1/322 g/mole) x 0.02406 m3/mole x 1012
= <0.43 ppt
247
image:
o
molecular weight in order to convert to ppm. Conversions of mg/m to ppm,
yg/m to ppb, and ng/m to parts per trillion (ppt) are illustrated below.
Sample HO-1-ST-714-F was found (Table 27) to have 0.23 mg/m3 of hydrocarbons
quantitated as CIO (n-decane, 144 g/mole). The sample gas volumes were corrected
to 20°C, at which temperature one mole of gas occupies 0.02406 m . To convert
3
0.23 mg/m to ppm:
0.23 mg/m3 x 10"3 g/mg x (1/144 g/mole) x 0.02406 m3/mole x 106 = 0.038 ppm
Sample HO-l-ST-716 was found (Table 30) to have 3 yg/m3 (20°C) of
dichlorobiphenyl (223.1 g/mole). To convert 3 pg/m3 to ppb;
3 yg/m3 x 10"6 yg/g x (1/223.1 g/mole) x 0.02406 m3/mole x 109 = 0.32 ppb
TCDD (322.0 g/mole) was not detected in sample HO-l-BI-716 (Table 50).,
The detection limit was used to calculate a maximum possible TCDD concentration
o - o
of <5.8 ng/m (20 C). To convert <5.8 ng/m to ppt:
<5.8 ng/m3 x 10"9 ng/g x (1/322 g/mole) x 0.02406 m3/mole x 1012
= <0.43 ppt
247
image:
 APPENDIX G
ANALYSIS OF VARIANCE
OF DESTRUCTION EFFICIENCY CALCULATIONS
248
image:
APPENDIX G
ANALYSIS OF VARIANCE
OF DESTRUCTION EFFICIENCY CALCULATIONS
248
image:
 TABLE OF CONTENTS
1. DERIVATION OF VARIANCE OF DESTRUCTION EFFICIENCY 250
2. MEAN AND VARIANCE OF DESTRUCTION EFFICIENCIES 260
249
image:
TABLE OF CONTENTS
1. DERIVATION OF VARIANCE OF DESTRUCTION EFFICIENCY 250
2. MEAN AND VARIANCE OF DESTRUCTION EFFICIENCIES 260
249
image:
 G. ANALYSIS OF VARIANCE OF DESTRUCTION EFFICIENCY CALCULATIONS
The calculation of destruction efficiency (DE) during this program was
based on the measurement of oxygen, carbon dioxide, and carbon monoxide in the
combustion effluent; the composition and concentrations of waste feed material;
and laboratory analyses of combustion effluent samples.
It is shown in the derivation in this appendix that these factors are suf-
ficient to identify the destruction efficiency without the use of oxygen and
waste feed rates because the destruction efficiency is a dimensionless ratio.
The variance in destruction efficiency was calculated from the variance in the
factors above and their effect on the DE calculation.
1. DERIVATION OF VARIANCE OF DESTRUCTION EFFICIENCY
Let:
W = herbicide feed rate to each incinerator, metric tons per hour
A = air feed rate to each incinerator, dry m /hr at 20°C
3
P = combustion product flow rate from each incinerator, dry m /hr
at 20°C
E = % excess air
C = weight % carbon in Herbicide Orange
H = weight % hydrogen in Herbicide Orange
0 = weight % oxygen in Herbicide Orange
Cx, = weight % chlorine in Herbicide Orange
S = stoichiometric oxygen requirement for 100 g herbicide, moles
a = weight fraction 2,4-D + 2,4,5-T in herbicide
•5
b = emission concentration of 2,4-D + 2,4,5-T, metric tons/m
d = weight fraction TCDD in herbicide
•3
e = emission concentration of TCDD, metric tons/m
250
image:
G. ANALYSIS OF VARIANCE OF DESTRUCTION EFFICIENCY CALCULATIONS
The calculation of destruction efficiency (DE) during this program was
based on the measurement of oxygen, carbon dioxide, and carbon monoxide in the
combustion effluent; the composition and concentrations of waste feed material;
and laboratory analyses of combustion effluent samples.
It is shown in the derivation in this appendix that these factors are suf-
ficient to identify the destruction efficiency without the use of oxygen and
waste feed rates because the destruction efficiency is a dimensionless ratio.
The variance in destruction efficiency was calculated from the variance in the
factors above and their effect on the DE calculation.
1. DERIVATION OF VARIANCE OF DESTRUCTION EFFICIENCY
Let:
W = herbicide feed rate to each incinerator, metric tons per hour
A = air feed rate to each incinerator, dry m /hr at 20°C
3
P = combustion product flow rate from each incinerator, dry m /hr
at 20°C
E = % excess air
C = weight % carbon in Herbicide Orange
H = weight % hydrogen in Herbicide Orange
0 = weight % oxygen in Herbicide Orange
Cx, = weight % chlorine in Herbicide Orange
S = stoichiometric oxygen requirement for 100 g herbicide, moles
a = weight fraction 2,4-D + 2,4,5-T in herbicide
•5
b = emission concentration of 2,4-D + 2,4,5-T, metric tons/m
d = weight fraction TCDD in herbicide
•3
e = emission concentration of TCDD, metric tons/m
250
image:
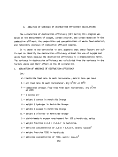 At high combustion efficiencies, only traces of CO, hydrocarbons, and waste
will be present in the combustion effluent and can be ignored as contributors
to the combustion effluent flow rate.
The dry volumetric flow rate for W metric tons per hour of herbicide and
per hour air feed is derived from stoichiometry as follows:
• The moles of combustion product formed (dry basis) are
moles product = moles (XL + moles HC& + moles 02 + moles N2
t The combustion of 100 grams of herbicide will produce
C/ 12. Oil moles C02
Ca/35.453 moles HCi
1/2 (H/1.008 - U/35.453) moles H0
t If there are 0/32 moles of oxygen present in the herbicide,
then the stoichiometric requirement for oxygen from the air
feed is
S = C/12.011 + 1/4 (H/1.008 - Q/35.453) - 0/32 moles)/ m
100 g herbicide Uj
• If the combustion effluent contains an excess of air Y% over
the stoichiometric requirement, the moles of oxygen in the
combustion effluent are:
S x Y/100 moles 02/100 g herbicide (2)
t The nitrogen content of the product gas follows directly from
the composition of feed air, i.e.,
0.7809S/0.2095 moles N2 from oxygen requirement
and
0.7809S Y/(0.2095 x 100) moles N2 present in the excess air
251
image:
At high combustion efficiencies, only traces of CO, hydrocarbons, and waste
will be present in the combustion effluent and can be ignored as contributors
to the combustion effluent flow rate.
The dry volumetric flow rate for W metric tons per hour of herbicide and
per hour air feed is derived from stoichiometry as follows:
• The moles of combustion product formed (dry basis) are
moles product = moles (XL + moles HC& + moles 02 + moles N2
t The combustion of 100 grams of herbicide will produce
C/ 12. Oil moles C02
Ca/35.453 moles HCi
1/2 (H/1.008 - U/35.453) moles H0
t If there are 0/32 moles of oxygen present in the herbicide,
then the stoichiometric requirement for oxygen from the air
feed is
S = C/12.011 + 1/4 (H/1.008 - Q/35.453) - 0/32 moles)/ m
100 g herbicide Uj
• If the combustion effluent contains an excess of air Y% over
the stoichiometric requirement, the moles of oxygen in the
combustion effluent are:
S x Y/100 moles 02/100 g herbicide (2)
t The nitrogen content of the product gas follows directly from
the composition of feed air, i.e.,
0.7809S/0.2095 moles N2 from oxygen requirement
and
0.7809S Y/(0.2095 x 100) moles N2 present in the excess air
251
image:
 or
(0.7809S/0.2095)(1 + Y/100) moles N2 per 100 g herbicide (3)
0
where 0.7809 and 0.2095 are the fractional composition of
N2 and 02, respectively, in a standard dry atmosphere.
t On a dry basis, the moles of combustion effluent produced
per 100 g herbicide are
C/12.011 + CA/35.453 + SY/100
(4)
+ (0,78095/0.2095)(1 + Y/100)
• The stoichiometric air flow requirement per 100 g herbicide
is
S/0.2095 moles = K1
-«
Now, one mole of dry gas occupies 0.02406 m at 20°C. The
derivation up to this point has been based on 100 g herbicide.
A waste feed of W metric tons per hour is W x 10^/100 or
W x 104 times greater than 100 g. Thus, the stoichiometric
air flow rate requirement in dry m3/hr for W metric tons per
hour of herbicide is:
240.6S W/0.2095 m3/hr at 20°C (5)
• By definition, from Equation (2), the fraction of excess air
is
Y/ioo = air flow - stoichiometric air flow
' " stoichiometric air flow
or
Y/100 - (A - 240.6S W/0.2095)/(240.6S W/0.2095)
Y/100 = (0.2095A/240.6SW) - 1
252
image:
or
(0.7809S/0.2095)(1 + Y/100) moles N2 per 100 g herbicide (3)
0
where 0.7809 and 0.2095 are the fractional composition of
N2 and 02, respectively, in a standard dry atmosphere.
t On a dry basis, the moles of combustion effluent produced
per 100 g herbicide are
C/12.011 + CA/35.453 + SY/100
(4)
+ (0,78095/0.2095)(1 + Y/100)
• The stoichiometric air flow requirement per 100 g herbicide
is
S/0.2095 moles = K1
-«
Now, one mole of dry gas occupies 0.02406 m at 20°C. The
derivation up to this point has been based on 100 g herbicide.
A waste feed of W metric tons per hour is W x 10^/100 or
W x 104 times greater than 100 g. Thus, the stoichiometric
air flow rate requirement in dry m3/hr for W metric tons per
hour of herbicide is:
240.6S W/0.2095 m3/hr at 20°C (5)
• By definition, from Equation (2), the fraction of excess air
is
Y/ioo = air flow - stoichiometric air flow
' " stoichiometric air flow
or
Y/100 - (A - 240.6S W/0.2095)/(240.6S W/0.2095)
Y/100 = (0.2095A/240.6SW) - 1
252
image:
 Therefore,
1 + Y/100 = 0.2095A/240.6SW
t Equation (4) becomes
C ^ Q ./0.2095A i\ c x OJ809S |0^2095A\mn, c/.
12.011 35.453 \240.6SW ~1) * * 0.2095 \240.6SW /moies/nr
• Thus the total flow of combustion effluent per incinerator in
dry moles/hr at 20°C for W metric tons per hour herbicide feed
is
P = [C/12.011 + Cfc/35.453 + (A/240.6W) - S] 104W
• Substituting for S from Equation (1) and collecting terms
p - f__A . _ Ca 1 / H _C&_ \. Ol In4n
Y ~ 240.6W 35.453 4 \T7im ~ 35.453) f 3T 10 w
(6)
= A + 240.6W (0132 + C&/28.362 + H/4.032) m3/hr
t Total 2,4-D + 2,4,5-T fed is Wa metric tons/hour
Total 2,4-D + 2,4,5-T emitted is Pb metric tons/hour
Total TCDD fed is Wd metric tons/hour
Total TCDD emitted is Pe metric tons/hour
• The destruction efficiency (DE) for 2,4-D + 2,4,5-T is
DE = Wa Pb x 100
or
DE • (1 ' x 10°
253
image:
Therefore,
1 + Y/100 = 0.2095A/240.6SW
t Equation (4) becomes
C ^ Q ./0.2095A i\ c x OJ809S |0^2095A\mn, c/.
12.011 35.453 \240.6SW ~1) * * 0.2095 \240.6SW /moies/nr
• Thus the total flow of combustion effluent per incinerator in
dry moles/hr at 20°C for W metric tons per hour herbicide feed
is
P = [C/12.011 + Cfc/35.453 + (A/240.6W) - S] 104W
• Substituting for S from Equation (1) and collecting terms
p - f__A . _ Ca 1 / H _C&_ \. Ol In4n
Y ~ 240.6W 35.453 4 \T7im ~ 35.453) f 3T 10 w
(6)
= A + 240.6W (0132 + C&/28.362 + H/4.032) m3/hr
t Total 2,4-D + 2,4,5-T fed is Wa metric tons/hour
Total 2,4-D + 2,4,5-T emitted is Pb metric tons/hour
Total TCDD fed is Wd metric tons/hour
Total TCDD emitted is Pe metric tons/hour
• The destruction efficiency (DE) for 2,4-D + 2,4,5-T is
DE = Wa Pb x 100
or
DE • (1 ' x 10°
253
image:
 • From Equation (5), the air feed rate is proportional to the
nitrogen content of the combustion effluent, so
_ 240. 6SN / Y
+ ISO
t Therefore, from Equations (6) and (8)
P/u - 240-6S /i 4- Y \ + j»An fi / ° + c& H
P/W "O395 1 + T00/ + 240>6\32 + 2O62 " 4TU32
• Substituting Equation (9) into Equation (6) gives
DE/100 =
where
K = 0/32 + CA/28.362 - H/4.032
• Excess air, Y in Equation (10), is defined as
% 02 - 0.5% CO
Y =
0.264% N2 - (% 02 - 0.5% CO)
Since CO in the combustion effluent is very small (ppm con-
centrations compared to percent concentrations for 0, and
N2), 2
Y = % 02/ (0.264% N2 - % 02) (12)
• The percentage of nitrogen can be inferred as the balance of
the product stream after 02 and C02 are measured and HC£ is
calculated, i.e.,
= 100 - % 02 - % C02 - % HC£ - % CO - % hydrocarbons
254
image:
• From Equation (5), the air feed rate is proportional to the
nitrogen content of the combustion effluent, so
_ 240. 6SN / Y
+ ISO
t Therefore, from Equations (6) and (8)
P/u - 240-6S /i 4- Y \ + j»An fi / ° + c& H
P/W "O395 1 + T00/ + 240>6\32 + 2O62 " 4TU32
• Substituting Equation (9) into Equation (6) gives
DE/100 =
where
K = 0/32 + CA/28.362 - H/4.032
• Excess air, Y in Equation (10), is defined as
% 02 - 0.5% CO
Y =
0.264% N2 - (% 02 - 0.5% CO)
Since CO in the combustion effluent is very small (ppm con-
centrations compared to percent concentrations for 0, and
N2), 2
Y = % 02/ (0.264% N2 - % 02) (12)
• The percentage of nitrogen can be inferred as the balance of
the product stream after 02 and C02 are measured and HC£ is
calculated, i.e.,
= 100 - % 02 - % C02 - % HC£ - % CO - % hydrocarbons
254
image:
 Now, CO and hydrocarbons are trace quantitites, so
% N2 a 100 - % 02 - % C02 - % HCi (13)
t The HCi content of the combustion effluent can be deduced from
the carbon-to-chlorine ratio in the herbicide because all but
trace quantities of Cx, go to HC£ and all but trace quantities
of C go to C02 product. Since •
% HCji = (CA/C) % C02
then, substituting into Equation (13)
% N2 s 100 - % 02 - (1 + CA/C) % C02 (14)
• Therefore, excess air, Y, is obtained from Equations (12)
and (14)
Y = % 02/[0.264 (100 - * 02 - (1+ CA/C) % C02)- % 02] (15)
or
Y = % 02/[26.4 - 1.264* 02 - 0.264 (1 + C£/C) % C02] (16)
• Substituting into Equation (10) the expression for Y from
Equation (16) and the expression for S in Equation (1),
gives
DE/100 =
1 -
100 (26.4 - 1.264% 0~ - 0.264 (1 + CA/C)%
where
, (C/12.011 + (1/4) (H/1.008 - Ct/35.453)'-- 0/32
- 0.2095!
255
(17)
image:
Now, CO and hydrocarbons are trace quantitites, so
% N2 a 100 - % 02 - % C02 - % HCi (13)
t The HCi content of the combustion effluent can be deduced from
the carbon-to-chlorine ratio in the herbicide because all but
trace quantities of Cx, go to HC£ and all but trace quantities
of C go to C02 product. Since •
% HCji = (CA/C) % C02
then, substituting into Equation (13)
% N2 s 100 - % 02 - (1 + CA/C) % C02 (14)
• Therefore, excess air, Y, is obtained from Equations (12)
and (14)
Y = % 02/[0.264 (100 - * 02 - (1+ CA/C) % C02)- % 02] (15)
or
Y = % 02/[26.4 - 1.264* 02 - 0.264 (1 + C£/C) % C02] (16)
• Substituting into Equation (10) the expression for Y from
Equation (16) and the expression for S in Equation (1),
gives
DE/100 =
1 -
100 (26.4 - 1.264% 0~ - 0.264 (1 + CA/C)%
where
, (C/12.011 + (1/4) (H/1.008 - Ct/35.453)'-- 0/32
- 0.2095!
255
(17)
image:
 and
K = 0/32 + CZ/28.362 - H/4.032
Now, the quantities K and K1 can be assumed to be second-order
variations related to the herbicide composition because of the
similarity in composition of 2,4-D and 2,4,5-T in the waste.
They are neglected. Variances in the C£/C ratio, used in the
% N2 calculation, Equation (14), are of more concern because
of the magnitude of the N2 content in the combustion effluent.
Variance in the C&/C ratio must be considered if the herbicide
is diluted subsequent to the determination of a (the weight
fraction of 2,4-D + 2,4,5-T in herbicide). This is especially
true if the diluent is quite different in composition from the
herbicide, such as the diesel fuel used to rinse drums and
other equipment involved in loading herbicide on the ship.
Equation (17) is the final expression for the destruction effi-
ciency of 2,4-D + 2,4,5-T. A similar expression results for
the destruction efficiency of TCDD by substituting d for a and
e for b, where d and e are, respectively, the weight fraction
of TCDD in the herbicide and the emission rate of TCDD in the
combustion effluent.
The variation in DE/100 can be approximated in the region of
the average values for the variables 02, C02, Cfc/C, a, b, d,
and e by Taylor's expansion. Thus, for the variance in
destruction efficiency for 2,4-D + 2,4,5-T
V (DE/100) = V(.) * ¥(b)
V(0)
The variance in destruction efficiency for TCDD is obtained
by substituting d for a and e for b in Equation (18).
• Approximate expressions for the partial derivatives in Equa-
tion (18) are
256
image:
and
K = 0/32 + CZ/28.362 - H/4.032
Now, the quantities K and K1 can be assumed to be second-order
variations related to the herbicide composition because of the
similarity in composition of 2,4-D and 2,4,5-T in the waste.
They are neglected. Variances in the C£/C ratio, used in the
% N2 calculation, Equation (14), are of more concern because
of the magnitude of the N2 content in the combustion effluent.
Variance in the C&/C ratio must be considered if the herbicide
is diluted subsequent to the determination of a (the weight
fraction of 2,4-D + 2,4,5-T in herbicide). This is especially
true if the diluent is quite different in composition from the
herbicide, such as the diesel fuel used to rinse drums and
other equipment involved in loading herbicide on the ship.
Equation (17) is the final expression for the destruction effi-
ciency of 2,4-D + 2,4,5-T. A similar expression results for
the destruction efficiency of TCDD by substituting d for a and
e for b, where d and e are, respectively, the weight fraction
of TCDD in the herbicide and the emission rate of TCDD in the
combustion effluent.
The variation in DE/100 can be approximated in the region of
the average values for the variables 02, C02, Cfc/C, a, b, d,
and e by Taylor's expansion. Thus, for the variance in
destruction efficiency for 2,4-D + 2,4,5-T
V (DE/100) = V(.) * ¥(b)
V(0)
The variance in destruction efficiency for TCDD is obtained
by substituting d for a and e for b in Equation (18).
• Approximate expressions for the partial derivatives in Equa-
tion (18) are
256
image:
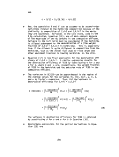 3 (DE/100) a 240.6b
3a
:• i +
100 (26.4 - 1.264% 02 - 0.264 (1 + CA/C) % C02
(19)
3 (DE/100) _ -240.6
3b a
K' 1 +
% 0,
IUCTT26.4 - 1.2641 " °-264 vl + CA/C) %
(20)
3 (DE/100) . -240'6b K' % °2 <°-264* C02)
3 (C&/CT lOOa (26.4 - 1.264% 02 - 0.264 (1 + CA/C) %
(21)
3 (DE/100) -240.6b K'
3 (% 02) a
26.4 x 100 + 26.4 (1 + CA/C)
(l/% 02)2 [(!/% 02)(26.4 x 100 (1 + CA/(
% co2
:) % co2)
- 126. 4]2
(22)
3 (DE/100)
3 (% C02) "
240.6b K' % 02 (0.264 CA/C)
lOOa (26.4 - 1.264% 02 - 0.264 (1 + CA/C) % C02)'
(23)
The variances in d and e are obtained by substituting d for a
and e for b in Equations (19) through (23),
The means and variances of the variables in Equations (19)
through (23) are obtained as follows.
257
image:
3 (DE/100) a 240.6b
3a
:• i +
100 (26.4 - 1.264% 02 - 0.264 (1 + CA/C) % C02
(19)
3 (DE/100) _ -240.6
3b a
K' 1 +
% 0,
IUCTT26.4 - 1.2641 " °-264 vl + CA/C) %
(20)
3 (DE/100) . -240'6b K' % °2 <°-264* C02)
3 (C&/CT lOOa (26.4 - 1.264% 02 - 0.264 (1 + CA/C) %
(21)
3 (DE/100) -240.6b K'
3 (% 02) a
26.4 x 100 + 26.4 (1 + CA/C)
(l/% 02)2 [(!/% 02)(26.4 x 100 (1 + CA/(
% co2
:) % co2)
- 126. 4]2
(22)
3 (DE/100)
3 (% C02) "
240.6b K' % 02 (0.264 CA/C)
lOOa (26.4 - 1.264% 02 - 0.264 (1 + CA/C) % C02)'
(23)
The variances in d and e are obtained by substituting d for a
and e for b in Equations (19) through (23),
The means and variances of the variables in Equations (19)
through (23) are obtained as follows.
257
image:
 1) V(a), variance in weight percent of 2,4-D and 2,4,5-T in
herbicide
From data presented in Table 11 giving the composition of
four Gulfport lots of herbicide, the mean and standard
deviation in the total of 2,4-D and 2,4,5-T in the herbicide
were calculated to be
a = 0.8599*
sa = 0.0547%
a
2) V(b), variance in emission concentration of 2,4-D and
2,4,5-T
From data presented in Table 5.1 giving the emission con-
centrations of 2,4-D and 2,4,5-T calculated from analyses
at TRW, the mean and standard deviation emission concen-
tration of 2,4-D + 2,4,5-T were calculated to be
F = 46.7 yg/m3 = 46.7 x 10"12 metric tons/m3
sb = 72.2 yg/m3 = 72.2 x 10"12 metric tons/m3
3) V(d), variance in TCDD content of herbicide
The mean and standard deviation in TCDD content of the
herbicide were calculated from data presented in
Table 50.
d~= 1.916 x 10"6
s = 7,238 x 10"7
4) V(e), variance in emission concentration of TCDD
Table 50 presents emission concentrations of TCDD calcu-
lated from the WSU analyses. The mean and standard devi-
ation are
e~ = 186 ng/m3 = 1.86 x 10"13 metric tons/m3
sa = 142 ng/m3 = 1.42 x 10"13 metric tons/m3
258
image:
1) V(a), variance in weight percent of 2,4-D and 2,4,5-T in
herbicide
From data presented in Table 11 giving the composition of
four Gulfport lots of herbicide, the mean and standard
deviation in the total of 2,4-D and 2,4,5-T in the herbicide
were calculated to be
a = 0.8599*
sa = 0.0547%
a
2) V(b), variance in emission concentration of 2,4-D and
2,4,5-T
From data presented in Table 5.1 giving the emission con-
centrations of 2,4-D and 2,4,5-T calculated from analyses
at TRW, the mean and standard deviation emission concen-
tration of 2,4-D + 2,4,5-T were calculated to be
F = 46.7 yg/m3 = 46.7 x 10"12 metric tons/m3
sb = 72.2 yg/m3 = 72.2 x 10"12 metric tons/m3
3) V(d), variance in TCDD content of herbicide
The mean and standard deviation in TCDD content of the
herbicide were calculated from data presented in
Table 50.
d~= 1.916 x 10"6
s = 7,238 x 10"7
4) V(e), variance in emission concentration of TCDD
Table 50 presents emission concentrations of TCDD calcu-
lated from the WSU analyses. The mean and standard devi-
ation are
e~ = 186 ng/m3 = 1.86 x 10"13 metric tons/m3
sa = 142 ng/m3 = 1.42 x 10"13 metric tons/m3
258
image:
 5) V(Cji/C}> variance in chlorine-to-carbon ratio in waste
After drums containing herbicide were drained, they were
rinsed. During Johnston Island dedrumming operations,
drums averaged 50 gallons of herbicide, and drum rinses
averaged 2 ±0.3 gallons of diesel fuel. The carbon con-
tent of diesel fuel was taken as 84.9% and its specific
gravity as 0.778. From Table 8, the carbon and chlorine
contents of the herbicide were 49,11 and 29,87%, respec-
tively. From these data, the ±2s range for the C«,/C
ratio is 0.5798 to 0.5870. Therefore,
= 0.5834
sCt/C = °«0018
6) VCO^) variance in oxygen content of combustion effluent
Table 16 presents gas composition data for all three burns,
From these data, the average and standard deviation of % 02
were calculated:
t = 8.9
* 02
s 00 = 1.4
7) V(C02), variance in carbon dioxide content of combustion
effluent
From data presented in Table 16, the average and standard
deviation at % (XL were calculated:
% C02 = 10.3
s% 2
C0
8) Values for K and K1 were obtained from the average herbi
cide composition. From Table 8,
carbon - 49,11%
chlorine = 29.87%
259
image:
5) V(Cji/C}> variance in chlorine-to-carbon ratio in waste
After drums containing herbicide were drained, they were
rinsed. During Johnston Island dedrumming operations,
drums averaged 50 gallons of herbicide, and drum rinses
averaged 2 ±0.3 gallons of diesel fuel. The carbon con-
tent of diesel fuel was taken as 84.9% and its specific
gravity as 0.778. From Table 8, the carbon and chlorine
contents of the herbicide were 49,11 and 29,87%, respec-
tively. From these data, the ±2s range for the C«,/C
ratio is 0.5798 to 0.5870. Therefore,
= 0.5834
sCt/C = °«0018
6) VCO^) variance in oxygen content of combustion effluent
Table 16 presents gas composition data for all three burns,
From these data, the average and standard deviation of % 02
were calculated:
t = 8.9
* 02
s 00 = 1.4
7) V(C02), variance in carbon dioxide content of combustion
effluent
From data presented in Table 16, the average and standard
deviation at % (XL were calculated:
% C02 = 10.3
s% 2
C0
8) Values for K and K1 were obtained from the average herbi
cide composition. From Table 8,
carbon - 49,11%
chlorine = 29.87%
259
image:
 oxygen = 16,37%
hydrogen = 4.65%
K = 16,37/32 + 29,87/28,362 - 4,65/4.032 = 0.4114
= (49.11/12.011 + 4.65/4.032 - 5.974/28.362 - 16.37/32)
0.2095
= 21.5744
In summary, the values needed to solve Equations (17) through
(23) are given in Table 56.
TABLE 56. SUMMARY_.QF_ERRQR ANALYSIS VARIANCES
a
b
d
e
Cl/C
JO,
JCO,
K
K'
Weight fraction 2,4-D + 2,4, 5-T
In herbicide
Emission concentration of 2,4-D
' 2, 4, 5-T
Weight fraction TCDD In herbicide
Emission concentration of TCDO
Chlorine/carbon ratio 1n waste
Oxygen content of combustion
effluent
Carbon dioxide content of
combustion effluent
Second order variable
Second order variable
dlmenslonless
metric ton/m
dlmenslonless
metric ton/m
dlmenslonless
percent
percent
moles
moles
0.8599
4.67X10"11
1.916xlO"6
1.859xlO"13
0.5834
8.9
10.3
0.4144
21.57
[» (DE/100) 1Z
[^(Variable)!
Deviation 2,4-0+2,4, 5-T TCOO
0.0547 I.l3x10"13
7.22X10"11 3.85xlO*7
7.23X10'7 — 7.30xlO+4
1.42xlO"13 — 7.75X10*'8
0.0018 3.36xlO"19 1.07xlO~'2
1.4 7.05xlO"18 1.12xlO~22
1.7 l.OBxlO"21 3.45xlO"15
...
2. MEAN AND VARIANCE OF DESTRUCTION EFFICIENCIES
2.1 2.4-D and 2,4,5-T
• Solving Equation (18) with the values in Table 56, the variance
and standard deviation of (DE/100) of 2,4-D + 2,4,5-T are:
V (DE/100) = 2.009 x 10"13
s (DE/100) = 4.482 x 10"7
t From Equation (17), the mean destruction efficiency for
2,4-D + 2,4,5-T is
DE/100 = 0.99999971
260
image:
oxygen = 16,37%
hydrogen = 4.65%
K = 16,37/32 + 29,87/28,362 - 4,65/4.032 = 0.4114
= (49.11/12.011 + 4.65/4.032 - 5.974/28.362 - 16.37/32)
0.2095
= 21.5744
In summary, the values needed to solve Equations (17) through
(23) are given in Table 56.
TABLE 56. SUMMARY_.QF_ERRQR ANALYSIS VARIANCES
a
b
d
e
Cl/C
JO,
JCO,
K
K'
Weight fraction 2,4-D + 2,4, 5-T
In herbicide
Emission concentration of 2,4-D
' 2, 4, 5-T
Weight fraction TCDD In herbicide
Emission concentration of TCDO
Chlorine/carbon ratio 1n waste
Oxygen content of combustion
effluent
Carbon dioxide content of
combustion effluent
Second order variable
Second order variable
dlmenslonless
metric ton/m
dlmenslonless
metric ton/m
dlmenslonless
percent
percent
moles
moles
0.8599
4.67X10"11
1.916xlO"6
1.859xlO"13
0.5834
8.9
10.3
0.4144
21.57
[» (DE/100) 1Z
[^(Variable)!
Deviation 2,4-0+2,4, 5-T TCOO
0.0547 I.l3x10"13
7.22X10"11 3.85xlO*7
7.23X10'7 — 7.30xlO+4
1.42xlO"13 — 7.75X10*'8
0.0018 3.36xlO"19 1.07xlO~'2
1.4 7.05xlO"18 1.12xlO~22
1.7 l.OBxlO"21 3.45xlO"15
...
2. MEAN AND VARIANCE OF DESTRUCTION EFFICIENCIES
2.1 2.4-D and 2,4,5-T
• Solving Equation (18) with the values in Table 56, the variance
and standard deviation of (DE/100) of 2,4-D + 2,4,5-T are:
V (DE/100) = 2.009 x 10"13
s (DE/100) = 4.482 x 10"7
t From Equation (17), the mean destruction efficiency for
2,4-D + 2,4,5-T is
DE/100 = 0.99999971
260
image:
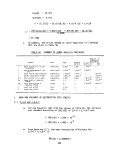 It is assumed that calculations of destruction efficiency are
normally distributed. The question asked is what percent of
a group of destruction efficiency calculations will be less
than some specified value and what degree of confidence is
there in that estimate of the percentage.
There are three values for emission rates of 2,4-D + 2,4,5-T
given in Table 51. Safety considerations dictate considera-
tion of destruction efficiencies less than some specified
value. This value is defined as the one-sided tolerance
limit. The value for the one-sided tolerance factor was
selected(l) for the population of three analyses such that
there would be 95% confidence that not more than 0.1% of
2,4-D + 2,4,5-T destruction efficiencies would be less than
the tolerance limit. In other words, the tolerance limit
is such that there is 95% confidence that only one 2,4-D +
2,4,5-T destruction efficiency in 1000 would be smaller in
value.
K = 13.86, one-sided tolerance factor for
n = 3 at 95% confidence
The tolerance limit is
DE/100 - sK = 0.99999971 - 13.86 x 4.482 x 10"7
= 0.9999935
• Therefore, this conservative statistical analysis shows that
there is 95% confidence that not more than 1 measured destruc-
tion efficiency in 1000 would be less than 99.99935%.
2.2 TCDD
• Solving Equation (18) with the values in Table 56, the vari-
ance and standard deviation of (DE/100) of TCDD are:
V(DE/100) = 1.944 x 10"7
s(DE/100) = 4.409 x 10"4
t Prom Equation (17) the mean destruction efficiency-for TCDDr.is
DE/100 = 0.99948
1."Handbook of Statistical Tables," D.B. Owen, Addison-Wesley, New York,
p. 117, 1962.
261
image:
It is assumed that calculations of destruction efficiency are
normally distributed. The question asked is what percent of
a group of destruction efficiency calculations will be less
than some specified value and what degree of confidence is
there in that estimate of the percentage.
There are three values for emission rates of 2,4-D + 2,4,5-T
given in Table 51. Safety considerations dictate considera-
tion of destruction efficiencies less than some specified
value. This value is defined as the one-sided tolerance
limit. The value for the one-sided tolerance factor was
selected(l) for the population of three analyses such that
there would be 95% confidence that not more than 0.1% of
2,4-D + 2,4,5-T destruction efficiencies would be less than
the tolerance limit. In other words, the tolerance limit
is such that there is 95% confidence that only one 2,4-D +
2,4,5-T destruction efficiency in 1000 would be smaller in
value.
K = 13.86, one-sided tolerance factor for
n = 3 at 95% confidence
The tolerance limit is
DE/100 - sK = 0.99999971 - 13.86 x 4.482 x 10"7
= 0.9999935
• Therefore, this conservative statistical analysis shows that
there is 95% confidence that not more than 1 measured destruc-
tion efficiency in 1000 would be less than 99.99935%.
2.2 TCDD
• Solving Equation (18) with the values in Table 56, the vari-
ance and standard deviation of (DE/100) of TCDD are:
V(DE/100) = 1.944 x 10"7
s(DE/100) = 4.409 x 10"4
t Prom Equation (17) the mean destruction efficiency-for TCDDr.is
DE/100 = 0.99948
1."Handbook of Statistical Tables," D.B. Owen, Addison-Wesley, New York,
p. 117, 1962.
261
image:
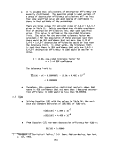 It is assumed that calculations of destruction efficiency for
TCDD are normally distributed. The questions asked is what
percentage of a group of dioxin destruction efficiency cal-
culations will be less than some specified value and what
degree of confidence is there in that estimate of the
percentage.
There are four values for emission rates of TCDD given in
Table 50. Safety considerations dictate consideration of
destruction efficiencies less than some specified value.
This value is defined by the one-sided tolerance limit. /,N
The value for the one-sided tolerance factor was selected* ;
for the population of four analyses such that there would be
95% confidence that not more than 0.1% of TCDD destruction
efficiencies would be less than the tolerance limit. In
other words, the tolerance limit is such that there is 95%
confidence that only one TCDD destruction efficiency in 1000
would be smaller in value.
K = 9.21, one-sided tolerance factor for n = 4
at 95% confidence
The tolerance limit is
DE/100 - sK = 0.99948 - 9,21 x 4.409 x 10"4
= 0.9954
Therefore, this conservative statistical analysis shows that
there is 95% confidence that not more than 1 measured destruc-
tion efficiency for TCDD in 1000 would be less than 99.54%.
262
image:
It is assumed that calculations of destruction efficiency for
TCDD are normally distributed. The questions asked is what
percentage of a group of dioxin destruction efficiency cal-
culations will be less than some specified value and what
degree of confidence is there in that estimate of the
percentage.
There are four values for emission rates of TCDD given in
Table 50. Safety considerations dictate consideration of
destruction efficiencies less than some specified value.
This value is defined by the one-sided tolerance limit. /,N
The value for the one-sided tolerance factor was selected* ;
for the population of four analyses such that there would be
95% confidence that not more than 0.1% of TCDD destruction
efficiencies would be less than the tolerance limit. In
other words, the tolerance limit is such that there is 95%
confidence that only one TCDD destruction efficiency in 1000
would be smaller in value.
K = 9.21, one-sided tolerance factor for n = 4
at 95% confidence
The tolerance limit is
DE/100 - sK = 0.99948 - 9,21 x 4.409 x 10"4
= 0.9954
Therefore, this conservative statistical analysis shows that
there is 95% confidence that not more than 1 measured destruc-
tion efficiency for TCDD in 1000 would be less than 99.54%.
262
image:
 TECHNICAL REPORT DATA
(Please read Instructions on the reverse before completing)
1. REPORT NO.
EPA-600/2-78-086
2.
3. RECIPIENT'S ACCESSION NO.
4. TITLE AND SUBTITLE
At-Sea Incineration of Herbicide Orange Onboard
the M/T Vulcanus
5. REPORT DATE
April 1978
6. PERFORMING ORGANIZATION CODE
D.Ackerman, H.Fisher, R.Johnson,
R. Maddalone, B. Matthews, E. Moon, K. Scheyer,
C.SMh, and R.Tobias
8. PERFORMING ORGANIZATION REPORT NO.
<•» a *-r H.*H i fcVAAV* -^ V • J. \^f*f AWU
, PERFORMING ORGANIZATION NAME AND ADDRESS
TRW, Inc.
One Space Park
Redondo Beach, California 90278
10. PROGRAM ELEMENT NO.
1AB604
11. CONTRACT/GRANT NO.
68-01-2966
12. SPONSORING AGENCY NAME AND ADDRESS
13. TYPE OF REPORT AND PERIOD COVERED
EPA, Office of Research and Development*
Industrial Environmental Research Laboratory
Research Triangle Park, NC 27711
13. TYPE OF REPORT AND
Final; 4/77-2/78
14. SPONSORING AGENCY CODE
EPA/600/13
is. SUPPLEMENTARY NOTES JERL-RTP project officer is Ronald A. Venezia, Mail Drop 62,
919/541-2547. (*) Cosponsored by the U.S. Air Force.
. ABSTRACT
repOrt describes the at-sea incineration of three shiploads (approxi-
mately 10,400 metric tons) of U.S. Air Force-owned Herbicide Orange onboard the
incinerator ship M/T Vulcanus , within an EPA-designated Pacific Ocean burn zone ,
west of Johnston Atoll. The first shipload, transported to the burn zone from the
U.S. Naval Construction Battalion Base, Gulf port, Mississippi, was incinerated
under EPA research permit. Shiploads 2 and 3 were taken onboard M/T Vulcanus
at Johnston Island and incinerated under EPA special permit. The incineration was
monitored, sampled, and analyzed to ensure compliance with EPA permit operating
and safety conditions related to at-sea operations. An EPA representative was.
onboard M/T Vulcanus during the initial burn. A U.S. Air Force representative
participated in monitoring all three burns . Monitoring utilized on-line instrumen-
tation to measure CO and CO2, oxygen concentration, and total hydrocarbons from
both incinerators. These parameters served as a measure of overall combustion
efficiency with primary emphasis on the CO2/CO ratio in the effluent gases. Com-
bustion efficiency exceeded 99.9% during all three burns. Destruction and combustion
efficiencies measured during all burns met or exceeded requirements. All other
conditions of the permits related to at-sea incineration operations were met.
17.
KEY WORDS AND DOCUMENT ANALYSIS
DESCRIPTORS
b.lDENTIFIERS/OPEN ENDED TERMS
c. COSATI Field/Croup
Pollution
Incinerators
Herbicides
Waste Disposal
Ships
Sea Water
Carbon Monoxide
Carbon Dioxide
Hydrocarbons
Oxygen
Butyl Acetates
Pollution Control
At-Sea Incineration
Herbicide Orange
Dioxin
13B
06F
13J
08J
07B
07C
13. DISTRIBUTION STATEMENT
Unlimited
19. SECURITY CLASS (ThisReport)
Unclassified
21. NO. OF PAGES
273
20. SECURITY CLASS (Thispage)
Unclassified
22. PRICE
EPA Form 2220-1 (9-73)
263
image:
TECHNICAL REPORT DATA
(Please read Instructions on the reverse before completing)
1. REPORT NO.
EPA-600/2-78-086
2.
3. RECIPIENT'S ACCESSION NO.
4. TITLE AND SUBTITLE
At-Sea Incineration of Herbicide Orange Onboard
the M/T Vulcanus
5. REPORT DATE
April 1978
6. PERFORMING ORGANIZATION CODE
D.Ackerman, H.Fisher, R.Johnson,
R. Maddalone, B. Matthews, E. Moon, K. Scheyer,
C.SMh, and R.Tobias
8. PERFORMING ORGANIZATION REPORT NO.
<•» a *-r H.*H i fcVAAV* -^ V • J. \^f*f AWU
, PERFORMING ORGANIZATION NAME AND ADDRESS
TRW, Inc.
One Space Park
Redondo Beach, California 90278
10. PROGRAM ELEMENT NO.
1AB604
11. CONTRACT/GRANT NO.
68-01-2966
12. SPONSORING AGENCY NAME AND ADDRESS
13. TYPE OF REPORT AND PERIOD COVERED
EPA, Office of Research and Development*
Industrial Environmental Research Laboratory
Research Triangle Park, NC 27711
13. TYPE OF REPORT AND
Final; 4/77-2/78
14. SPONSORING AGENCY CODE
EPA/600/13
is. SUPPLEMENTARY NOTES JERL-RTP project officer is Ronald A. Venezia, Mail Drop 62,
919/541-2547. (*) Cosponsored by the U.S. Air Force.
. ABSTRACT
repOrt describes the at-sea incineration of three shiploads (approxi-
mately 10,400 metric tons) of U.S. Air Force-owned Herbicide Orange onboard the
incinerator ship M/T Vulcanus , within an EPA-designated Pacific Ocean burn zone ,
west of Johnston Atoll. The first shipload, transported to the burn zone from the
U.S. Naval Construction Battalion Base, Gulf port, Mississippi, was incinerated
under EPA research permit. Shiploads 2 and 3 were taken onboard M/T Vulcanus
at Johnston Island and incinerated under EPA special permit. The incineration was
monitored, sampled, and analyzed to ensure compliance with EPA permit operating
and safety conditions related to at-sea operations. An EPA representative was.
onboard M/T Vulcanus during the initial burn. A U.S. Air Force representative
participated in monitoring all three burns . Monitoring utilized on-line instrumen-
tation to measure CO and CO2, oxygen concentration, and total hydrocarbons from
both incinerators. These parameters served as a measure of overall combustion
efficiency with primary emphasis on the CO2/CO ratio in the effluent gases. Com-
bustion efficiency exceeded 99.9% during all three burns. Destruction and combustion
efficiencies measured during all burns met or exceeded requirements. All other
conditions of the permits related to at-sea incineration operations were met.
17.
KEY WORDS AND DOCUMENT ANALYSIS
DESCRIPTORS
b.lDENTIFIERS/OPEN ENDED TERMS
c. COSATI Field/Croup
Pollution
Incinerators
Herbicides
Waste Disposal
Ships
Sea Water
Carbon Monoxide
Carbon Dioxide
Hydrocarbons
Oxygen
Butyl Acetates
Pollution Control
At-Sea Incineration
Herbicide Orange
Dioxin
13B
06F
13J
08J
07B
07C
13. DISTRIBUTION STATEMENT
Unlimited
19. SECURITY CLASS (ThisReport)
Unclassified
21. NO. OF PAGES
273
20. SECURITY CLASS (Thispage)
Unclassified
22. PRICE
EPA Form 2220-1 (9-73)
263
image: