<pubnumber> 908B95001
 </pubnumber>
<title>Effects of Land Application of Biosolids in Arid and Semi-Arid Environments</title>
<pages>301</pages>
<pubyear>1995</pubyear>
<provider>NEPIS</provider>
<access>online</access>
<origin>PDF</origin>
<author>United States. Environmental Protection Agency. Office of Water.</author>
<publisher>United States Environmental Protection Agency, Office of Water,</publisher>
<subject>Sewage sludge ; Sewage disposal ; Water quality management</subject>
<abstract></abstract>
<operator>mja</operator>
<scandate>03/04/09</scandate>
<type>single page tiff</type>
<keyword></keyword>
ppffpT^Ts OF *' ^^SSSi.-^ y
LABfD APPLICATION OF BIOSOLIDS
iN ARID AND SEMI-ARID
;: .-:;:x>.-..
-- , 'ENVIRONMENTS ' *
image:
</pubnumber>
<title>Effects of Land Application of Biosolids in Arid and Semi-Arid Environments</title>
<pages>301</pages>
<pubyear>1995</pubyear>
<provider>NEPIS</provider>
<access>online</access>
<origin>PDF</origin>
<author>United States. Environmental Protection Agency. Office of Water.</author>
<publisher>United States Environmental Protection Agency, Office of Water,</publisher>
<subject>Sewage sludge ; Sewage disposal ; Water quality management</subject>
<abstract></abstract>
<operator>mja</operator>
<scandate>03/04/09</scandate>
<type>single page tiff</type>
<keyword></keyword>
ppffpT^Ts OF *' ^^SSSi.-^ y
LABfD APPLICATION OF BIOSOLIDS
iN ARID AND SEMI-ARID
;: .-:;:x>.-..
-- , 'ENVIRONMENTS ' *
image:
 EFFECTS OF LAND APPLICATION OF
BIOSOLIDS IN ARID AND
SEMI-ARID ENVIRONMENTS
MAY 16 -19
1995
SPONSORED BY
U.S.E.P.A.
COLORADO STATE UNIVERSITY
COLORADO DEPARTMENT OF PUBLIC HEALTH & ENVIRONMENT
and
RBD, Inc,
University
ftut'iy MOIHUUW
WATER ENVIRONMENT ASSOCIATION, INC
G>lotado Department
ofPublicHealth
and Environment
image:
EFFECTS OF LAND APPLICATION OF
BIOSOLIDS IN ARID AND
SEMI-ARID ENVIRONMENTS
MAY 16 -19
1995
SPONSORED BY
U.S.E.P.A.
COLORADO STATE UNIVERSITY
COLORADO DEPARTMENT OF PUBLIC HEALTH & ENVIRONMENT
and
RBD, Inc,
University
ftut'iy MOIHUUW
WATER ENVIRONMENT ASSOCIATION, INC
G>lotado Department
ofPublicHealth
and Environment
image:
 PROGRAM
Effects of Land Application of Biosolids in the Arid and Semi-Arid West
Fort Collins, Colorado
May 16-19, 1995
Tuesday May 16, 1995
8:00-8:15 Registration
8:15 - 8:30 Welcome by Bob Brobst
Session I - Vegetative Response
8:30 - 9:15 Rangeland Restoration with Surface-applied Biosolids: Effects on Soils and
Vegetation of the Rio Puerco Watershed, Northcentral New Mexico
S.R. Loftin, R. Aguilar, R.R. Fresquez, and Francis
915-10:00 Tobosagrass and Alkali Sacaton Growth Responses to Topically Applied Biosolids
in a Chihuahuan Desert Grassland
D.B. Wester, M.W. Benton, P. Jurado, R.G. Gatewood, andR.E. Sosebee
10:00 - 10:15 Coffee Break
10:15-11:00 Evaluation of Sewage Sludge Products for use in Extensive Sheep Production
Systems in Australia
D.L. Michalk, presented by G. King
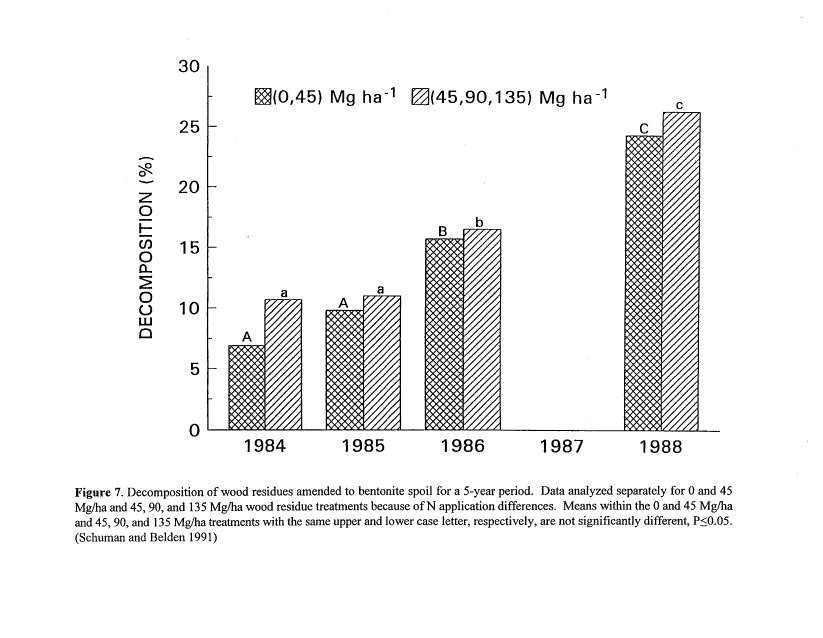
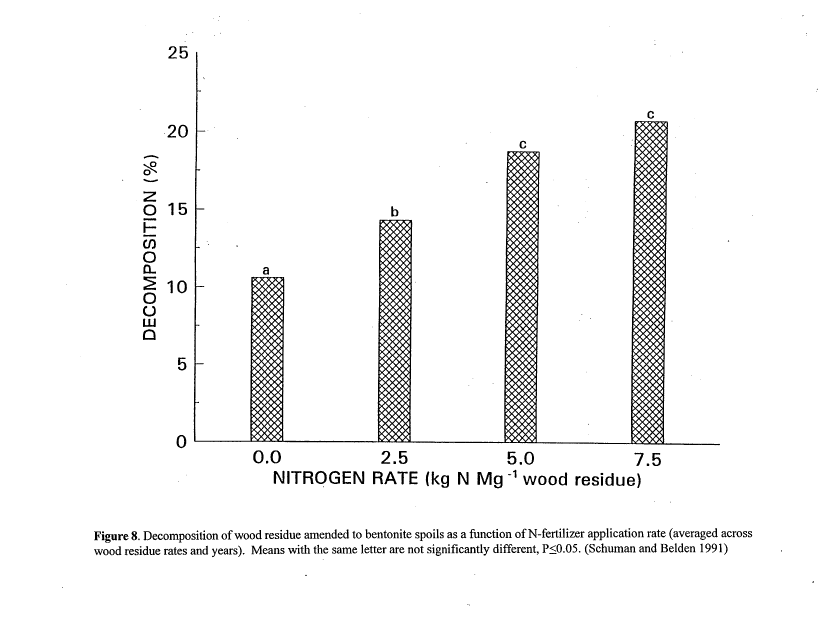
11:00 - 11:45 Sawmill Waste Utilization for Reclaiming Bentonite Mine Lands
G.E. Schuman, and EM. Taylor, Jr.
11:45 - 1:00 Lunch Break
Session II - Crop Benefits
1:00 - 1:45 11 Years of Biosolids Application to Dryland Winter Wheat
K.A. Barbarick, J.A. Ippolito, D.G. Westfall, and R. Jepson
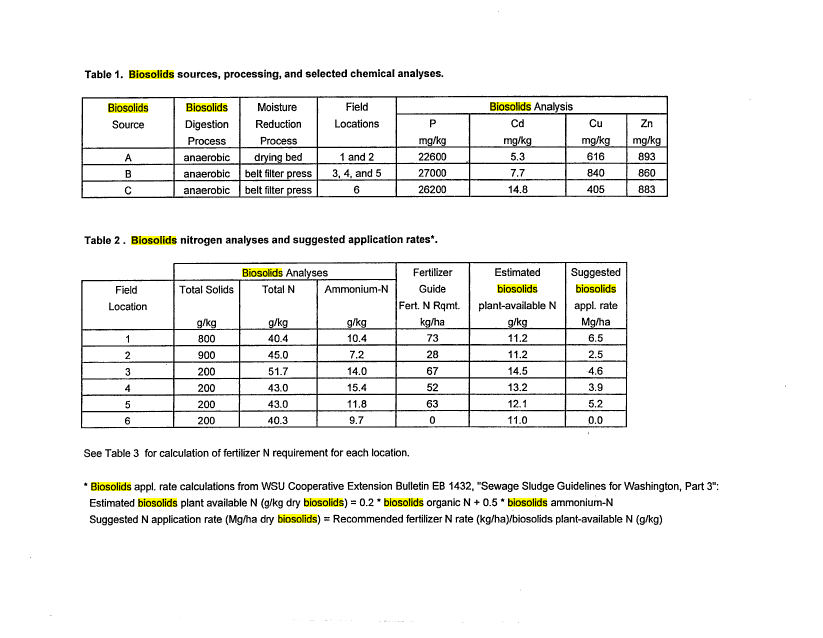
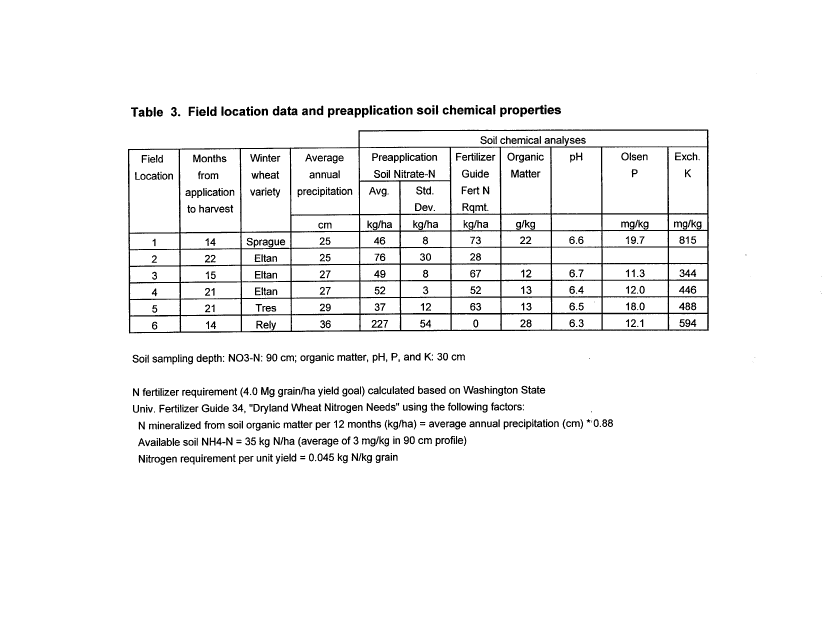
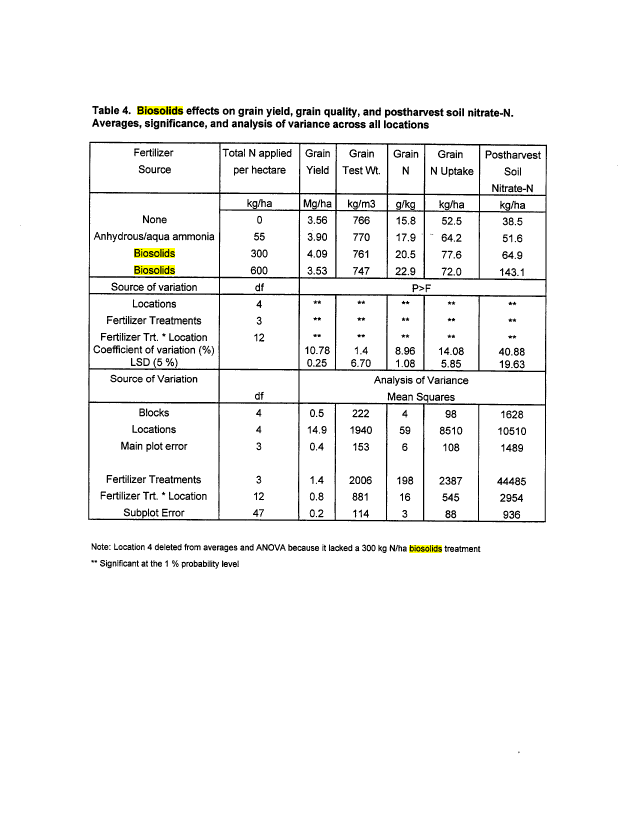
1:45 - 2:30 Biosolids Fertilization For Dryland Pacific Northwest Wheat Production
D.M. Sullivan, A.I. Bary, J.A. Kropf, and DM. Granatstein
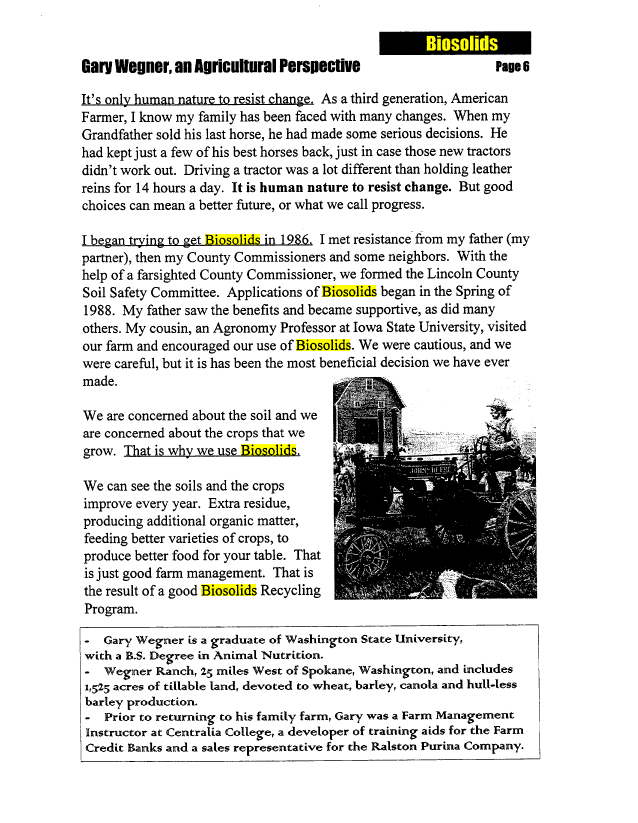
2:30 - 3:15 Biosolids from an Agricultural Perspective
G. Wegner
3:15-3:30 Coffee Break
3:30 - 4:15 N-viro Soil as a Gypsum Replacement in Cotton Production on a Sodic/Alkali Soil
B. McCullough-Sanden, H. McCuchin, R. Bailey, T. Logan, and B. Harrison
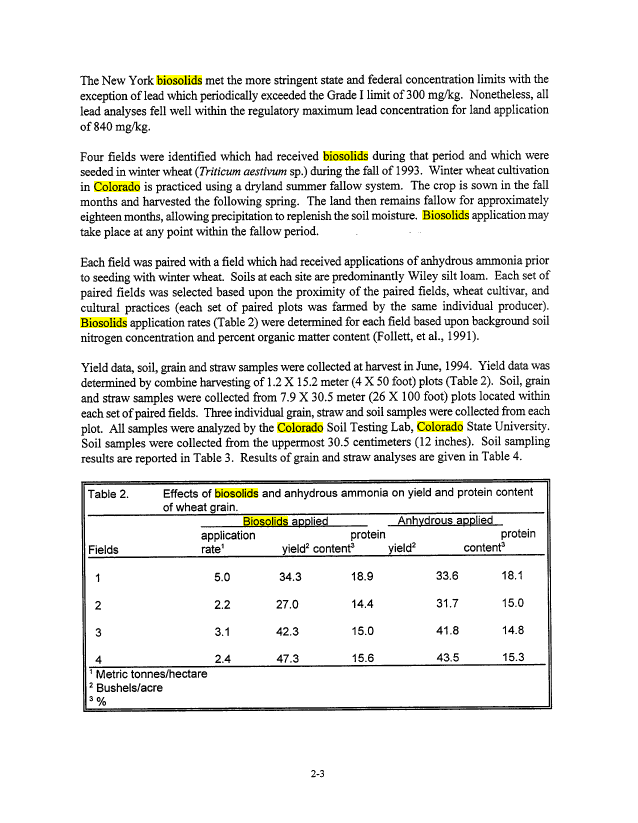
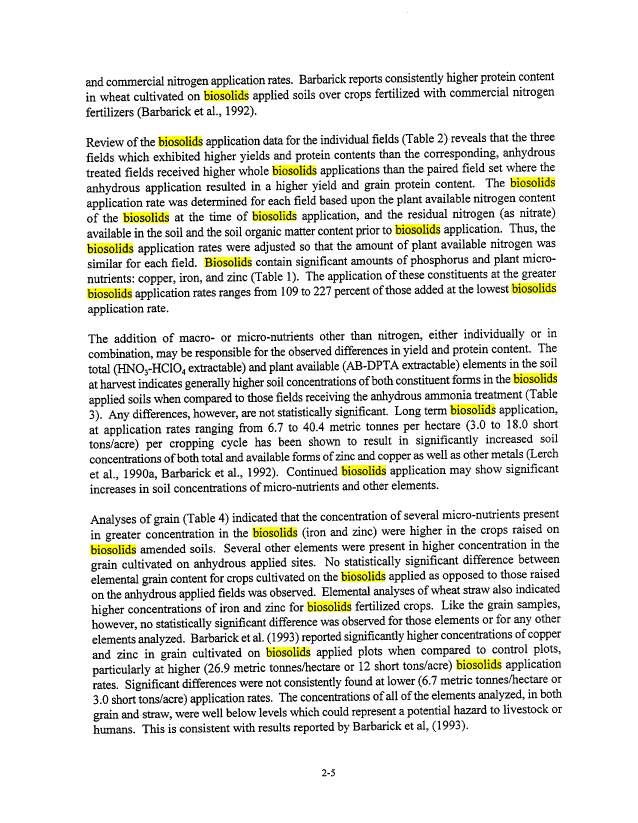
4:15 - 5:00 A Comparison of Production of Dryland Wheat Between Use of Anhydrous
Ammonia and Biosolids in Southeastern Colorado
R.B. Brobst and P. Hegeman
Wednesday May 17, 1995
8:00 - 1:00 Attendees will take a field trip to the Fort Collins' Meadow Springs Ranch. A
Box lunch will be provided.
image:
PROGRAM
Effects of Land Application of Biosolids in the Arid and Semi-Arid West
Fort Collins, Colorado
May 16-19, 1995
Tuesday May 16, 1995
8:00-8:15 Registration
8:15 - 8:30 Welcome by Bob Brobst
Session I - Vegetative Response
8:30 - 9:15 Rangeland Restoration with Surface-applied Biosolids: Effects on Soils and
Vegetation of the Rio Puerco Watershed, Northcentral New Mexico
S.R. Loftin, R. Aguilar, R.R. Fresquez, and Francis
915-10:00 Tobosagrass and Alkali Sacaton Growth Responses to Topically Applied Biosolids
in a Chihuahuan Desert Grassland
D.B. Wester, M.W. Benton, P. Jurado, R.G. Gatewood, andR.E. Sosebee
10:00 - 10:15 Coffee Break
10:15-11:00 Evaluation of Sewage Sludge Products for use in Extensive Sheep Production
Systems in Australia
D.L. Michalk, presented by G. King
11:00 - 11:45 Sawmill Waste Utilization for Reclaiming Bentonite Mine Lands
G.E. Schuman, and EM. Taylor, Jr.
11:45 - 1:00 Lunch Break
Session II - Crop Benefits
1:00 - 1:45 11 Years of Biosolids Application to Dryland Winter Wheat
K.A. Barbarick, J.A. Ippolito, D.G. Westfall, and R. Jepson
1:45 - 2:30 Biosolids Fertilization For Dryland Pacific Northwest Wheat Production
D.M. Sullivan, A.I. Bary, J.A. Kropf, and DM. Granatstein
2:30 - 3:15 Biosolids from an Agricultural Perspective
G. Wegner
3:15-3:30 Coffee Break
3:30 - 4:15 N-viro Soil as a Gypsum Replacement in Cotton Production on a Sodic/Alkali Soil
B. McCullough-Sanden, H. McCuchin, R. Bailey, T. Logan, and B. Harrison
4:15 - 5:00 A Comparison of Production of Dryland Wheat Between Use of Anhydrous
Ammonia and Biosolids in Southeastern Colorado
R.B. Brobst and P. Hegeman
Wednesday May 17, 1995
8:00 - 1:00 Attendees will take a field trip to the Fort Collins' Meadow Springs Ranch. A
Box lunch will be provided.
image:
 Rangeland Restoration with Surface-applied Biosolids:
Effects on Soils and Vegetation of the Rio Puerco Watershed,
Northcentral New Mexico
Loftin, S.R., R. Aguilar, and P.R. Fresquez
Abstract
The Rocky Mountain Forest and Range Experiment Station began a project in 1985 to study the
effects of surface applications of dried municipal wastewater biosolids on degraded rangeland
in the Rio Puerco Watershed Research Area in Northcentral New Mexico. Albuquerque
biosolids were applied at rates of 22.4,45, and 90 Mg/ha, (10,20, and 40 tons/acre) to replicated
3 X 20 m plots. Vegetation was monitored for changes in cover and nutrient (total nitrogen) and
heavy metal content (cadmium, copper, lead, and zinc) of aboveground tissues. Soils were
monitored for changes in nutrient (organic matter, nitrogen, and phosphorus) and heavy metal
content. In general, vegetation cover and biomass increased with increasing biosolids
application, as did soil nutrient and heavy metal content. Treatment effects on total nitrogen and
heavy metal concentrations of aboveground plant tissues had diminished by the fifth growing
season after biosolids application. Extractable Cu in soils receiving the highest biosolids
application attained potentially phytotoxic levels, although no phytotoxic effects were observed.
Therefore, we concluded that the intermediate rate of 45 Mg/ha was the optimum balance
between nutrient input and heavy metal loading for this soil/plant system.
Keywords: Rangeland restoration, biosolids, sewage sludge, vegetation, soils, heavy metals.
Introduction
Rangeland degradation is a serious problem affecting the sustainability and productivity of
rangelands throughout the western United States (Sheridan 1981). Although much of the
damage occurred during the livestock heyday of the late nineteenth and early twentieth centuries,
many areas have still not recovered their original productivity. Experience, observation, and
research indicate that many areas will not recover even with removal of livestock. Traditional
successional pathways appear to have been altered by the loss of soil resources and change in
plant species composition to the point that grassland restoration may not be possible without
some active land management intervention.
This alteration of traditional Clementsian successional processes is a common occurrence on arid
and semiarid lands worldwide Westoby et al. 1989; Johnson and Mayeus 1992). In the
traditional model of ecosystem succession, ecosystems are described as having one stable state,
the climatic climax. Disturbance to the ecosystem would result in an altered state which would
l-l
image:
Rangeland Restoration with Surface-applied Biosolids:
Effects on Soils and Vegetation of the Rio Puerco Watershed,
Northcentral New Mexico
Loftin, S.R., R. Aguilar, and P.R. Fresquez
Abstract
The Rocky Mountain Forest and Range Experiment Station began a project in 1985 to study the
effects of surface applications of dried municipal wastewater biosolids on degraded rangeland
in the Rio Puerco Watershed Research Area in Northcentral New Mexico. Albuquerque
biosolids were applied at rates of 22.4,45, and 90 Mg/ha, (10,20, and 40 tons/acre) to replicated
3 X 20 m plots. Vegetation was monitored for changes in cover and nutrient (total nitrogen) and
heavy metal content (cadmium, copper, lead, and zinc) of aboveground tissues. Soils were
monitored for changes in nutrient (organic matter, nitrogen, and phosphorus) and heavy metal
content. In general, vegetation cover and biomass increased with increasing biosolids
application, as did soil nutrient and heavy metal content. Treatment effects on total nitrogen and
heavy metal concentrations of aboveground plant tissues had diminished by the fifth growing
season after biosolids application. Extractable Cu in soils receiving the highest biosolids
application attained potentially phytotoxic levels, although no phytotoxic effects were observed.
Therefore, we concluded that the intermediate rate of 45 Mg/ha was the optimum balance
between nutrient input and heavy metal loading for this soil/plant system.
Keywords: Rangeland restoration, biosolids, sewage sludge, vegetation, soils, heavy metals.
Introduction
Rangeland degradation is a serious problem affecting the sustainability and productivity of
rangelands throughout the western United States (Sheridan 1981). Although much of the
damage occurred during the livestock heyday of the late nineteenth and early twentieth centuries,
many areas have still not recovered their original productivity. Experience, observation, and
research indicate that many areas will not recover even with removal of livestock. Traditional
successional pathways appear to have been altered by the loss of soil resources and change in
plant species composition to the point that grassland restoration may not be possible without
some active land management intervention.
This alteration of traditional Clementsian successional processes is a common occurrence on arid
and semiarid lands worldwide Westoby et al. 1989; Johnson and Mayeus 1992). In the
traditional model of ecosystem succession, ecosystems are described as having one stable state,
the climatic climax. Disturbance to the ecosystem would result in an altered state which would
l-l
image:
 proceed along a predictable linear pathway back to the climax state. It is now generally
recognized that the traditional linear model does not adequately represent the
disturbance/recovery dynamics observed in many arid and semiarid regions. In arid regions,
particularly grasslands, disturbance often leads to shrub invasion and redistribution of soil
resources (Schlesinger et al., 1990; Grover and Musik, 1990). These post-disturbance
ecosystems are often very stable and it is this observation that has lead to the emergence of a new
model of arid ecosystem succession which is often referred to as the multiple stable states model
(Westoby, 1989; Tausch et al. 1993). This model states that stable ecosystem states are
separated by thresholds of disturbance. If a disturbance is great enough to force an ecosystem
over this threshold the system will stabilize in a new state. If the disturbance is not great enough
to cross the threshold then traditional Clementsian successional processes will return the system
to its original state. For example, periodic drought or grazing may only temporarily alter the
abundance and species composition of an ecosystem, whereas prolonged drought coupled with
grazing and fire suppression can eventually convert a grassland to a shrubland. An ecosystem
that has crossed a threshold of disturbance will theoretically require an equal or greater amount
of energy to restore the system back to its original state. We believe that the combined fertilizer
and mulching effects of surface-applied biosolids should provide the "force" necessary to "push"
a degraded rangeland site over the threshold towards a productive semiarid grassland.
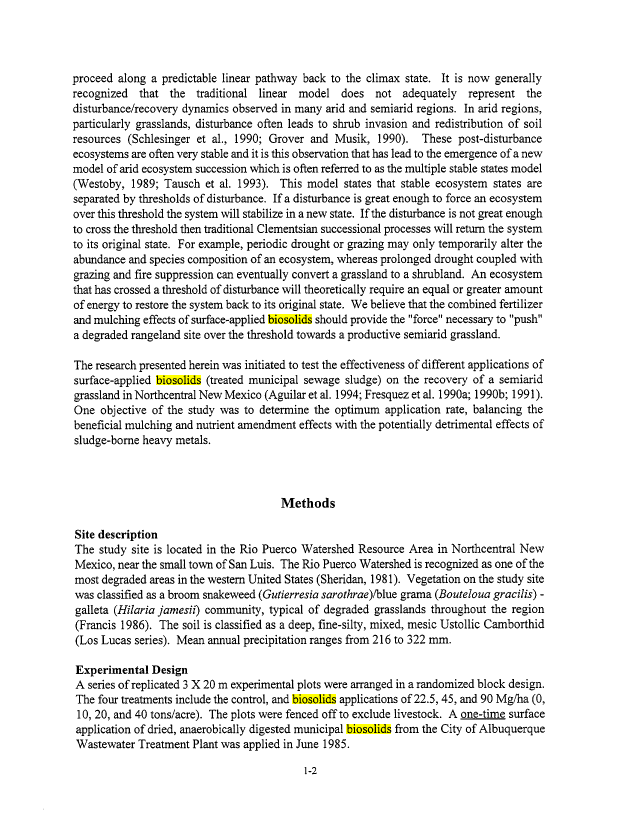
The research presented herein was initiated to test the effectiveness of different applications of
surface-applied biosolids (treated municipal sewage sludge) on the recovery of a semiarid
grassland in Northcentral New Mexico (Aguilar et al. 1994;Fresquezetal. 1990a; 1990b; 1991).
One objective of the study was to determine the optimum application rate, balancing the
beneficial mulching and nutrient amendment effects with the potentially detrimental effects of
sludge-borne heavy metals.
Methods
Site description
The study site is located in the Rio Puerco Watershed Resource Area in Northcentral New
Mexico, near the small town of San Luis. The Rio Puerco Watershed is recognized as one of the
most degraded areas in the western United States (Sheridan, 1981). Vegetation on the study site
was classified as a broom snakeweed (Gutierresia sarothrae)/blue grama (Bouteloua gracilis) -
galleta (Hilaria jamesii) community, typical of degraded grasslands throughout the region
(Francis 1986). The soil is classified as a deep, fme-silty, mixed, mesic Ustollic Camborthid
(Los Lucas series). Mean annual precipitation ranges from 216 to 322 mm.
Experimental Design
A series of replicated 3 X 20 m experimental plots were arranged in a randomized block design.
The four treatments include the control, and biosolids applications of 22.5,45, and 90 Mg/ha (0,
10, 20, and 40 tons/acre). The plots were fenced off to exclude livestock. A one-time surface
application of dried, anaerobically digested municipal biosolids from the City of Albuquerque
Wastewater Treatment Plant was applied in June 1985.
1-2
image:
proceed along a predictable linear pathway back to the climax state. It is now generally
recognized that the traditional linear model does not adequately represent the
disturbance/recovery dynamics observed in many arid and semiarid regions. In arid regions,
particularly grasslands, disturbance often leads to shrub invasion and redistribution of soil
resources (Schlesinger et al., 1990; Grover and Musik, 1990). These post-disturbance
ecosystems are often very stable and it is this observation that has lead to the emergence of a new
model of arid ecosystem succession which is often referred to as the multiple stable states model
(Westoby, 1989; Tausch et al. 1993). This model states that stable ecosystem states are
separated by thresholds of disturbance. If a disturbance is great enough to force an ecosystem
over this threshold the system will stabilize in a new state. If the disturbance is not great enough
to cross the threshold then traditional Clementsian successional processes will return the system
to its original state. For example, periodic drought or grazing may only temporarily alter the
abundance and species composition of an ecosystem, whereas prolonged drought coupled with
grazing and fire suppression can eventually convert a grassland to a shrubland. An ecosystem
that has crossed a threshold of disturbance will theoretically require an equal or greater amount
of energy to restore the system back to its original state. We believe that the combined fertilizer
and mulching effects of surface-applied biosolids should provide the "force" necessary to "push"
a degraded rangeland site over the threshold towards a productive semiarid grassland.
The research presented herein was initiated to test the effectiveness of different applications of
surface-applied biosolids (treated municipal sewage sludge) on the recovery of a semiarid
grassland in Northcentral New Mexico (Aguilar et al. 1994;Fresquezetal. 1990a; 1990b; 1991).
One objective of the study was to determine the optimum application rate, balancing the
beneficial mulching and nutrient amendment effects with the potentially detrimental effects of
sludge-borne heavy metals.
Methods
Site description
The study site is located in the Rio Puerco Watershed Resource Area in Northcentral New
Mexico, near the small town of San Luis. The Rio Puerco Watershed is recognized as one of the
most degraded areas in the western United States (Sheridan, 1981). Vegetation on the study site
was classified as a broom snakeweed (Gutierresia sarothrae)/blue grama (Bouteloua gracilis) -
galleta (Hilaria jamesii) community, typical of degraded grasslands throughout the region
(Francis 1986). The soil is classified as a deep, fme-silty, mixed, mesic Ustollic Camborthid
(Los Lucas series). Mean annual precipitation ranges from 216 to 322 mm.
Experimental Design
A series of replicated 3 X 20 m experimental plots were arranged in a randomized block design.
The four treatments include the control, and biosolids applications of 22.5,45, and 90 Mg/ha (0,
10, 20, and 40 tons/acre). The plots were fenced off to exclude livestock. A one-time surface
application of dried, anaerobically digested municipal biosolids from the City of Albuquerque
Wastewater Treatment Plant was applied in June 1985.
1-2
image:
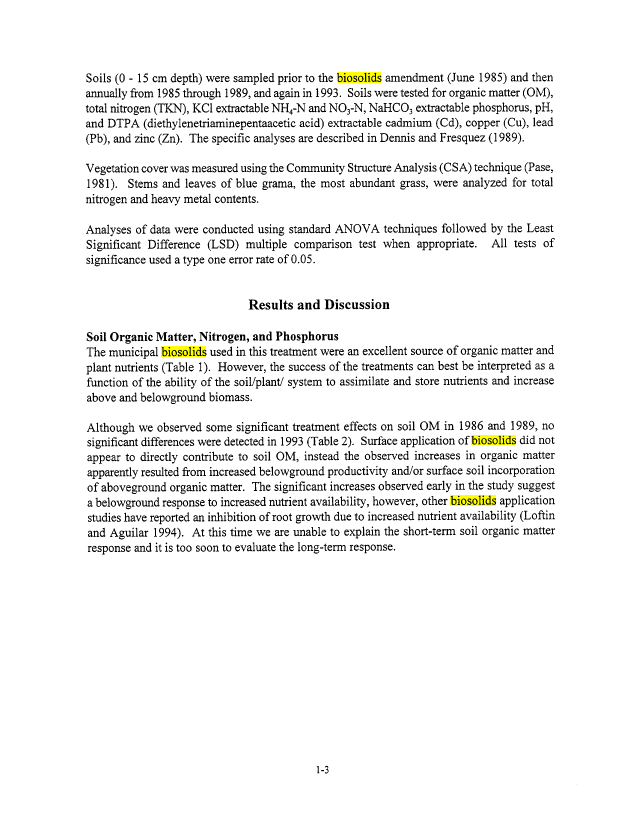
 Soils (0 - 15 cm depth) were sampled prior to the biosolids amendment (June 1985) and then
annually from 1985 through 1989, and again in 1993. Soils were tested for organic matter (OM),
total nitrogen (TKN), KC1 extractable NH4-N and N03-N, NaHC03 extractable phosphorus, pH,
and DTPA (diethylenetriaminepentaacetic acid) extractable cadmium (Cd), copper (Cu), lead
(Pb), and zinc (Zn). The specific analyses are described in Dennis and Fresquez (1989).
Vegetation cover was measured using the Community Structure Analysis (CSA) technique (Pase,
1981). Stems and leaves of blue grama, the most abundant grass, were analyzed for total
nitrogen and heavy metal contents.
Analyses of data were conducted using standard ANOVA techniques followed by the Least
Significant Difference (LSD) multiple comparison test when appropriate. All tests of
significance used a type one error rate of 0.05.
Results and Discussion
Soil Organic Matter, Nitrogen, and Phosphorus
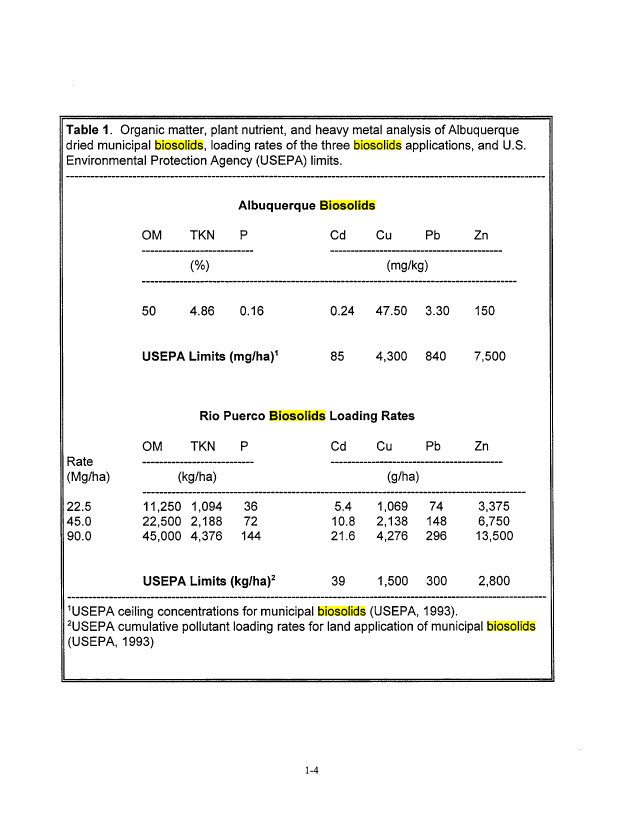
The municipal biosolids used in this treatment were an excellent source of organic matter and
plant nutrients (Table 1). However, the success of the treatments can best be interpreted as a
function of the ability of the soil/plant/ system to assimilate and store nutrients and increase
above and belowground biomass.
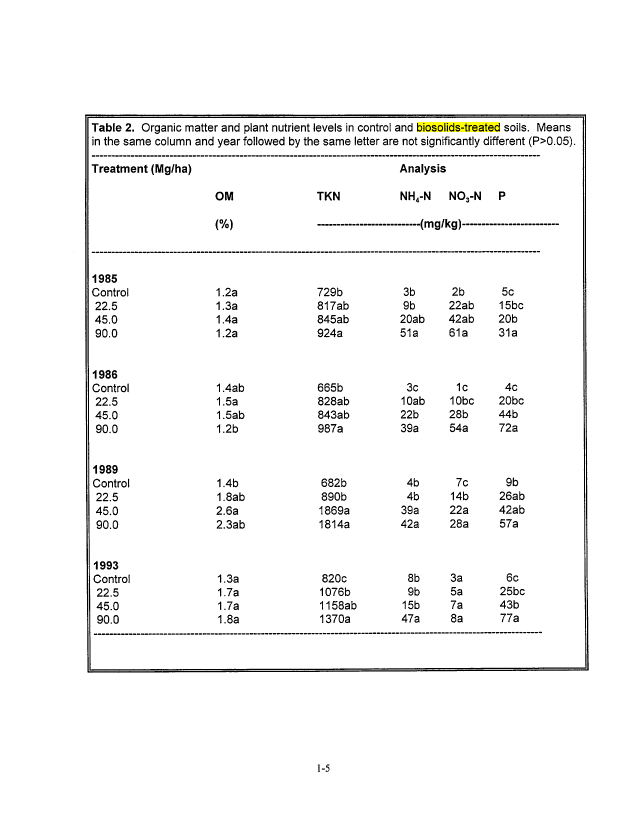
Although we observed some significant treatment effects on soil OM in 1986 and 1989, no
significant differences were detected in 1993 (Table 2). Surface application of biosolids did not
appear to directly contribute to soil OM, instead the observed increases in organic matter
apparently resulted from increased belowground productivity and/or surface soil incorporation
of aboveground organic matter. The significant increases observed early in the study suggest
a belowground response to increased nutrient availability, however, other biosolids application
studies have reported an inhibition of root growth due to increased nutrient availability (Loftin
and Aguilar 1994). At this time we are unable to explain the short-term soil organic matter
response and it is too soon to evaluate the long-term response.
1-3
image:
Soils (0 - 15 cm depth) were sampled prior to the biosolids amendment (June 1985) and then
annually from 1985 through 1989, and again in 1993. Soils were tested for organic matter (OM),
total nitrogen (TKN), KC1 extractable NH4-N and N03-N, NaHC03 extractable phosphorus, pH,
and DTPA (diethylenetriaminepentaacetic acid) extractable cadmium (Cd), copper (Cu), lead
(Pb), and zinc (Zn). The specific analyses are described in Dennis and Fresquez (1989).
Vegetation cover was measured using the Community Structure Analysis (CSA) technique (Pase,
1981). Stems and leaves of blue grama, the most abundant grass, were analyzed for total
nitrogen and heavy metal contents.
Analyses of data were conducted using standard ANOVA techniques followed by the Least
Significant Difference (LSD) multiple comparison test when appropriate. All tests of
significance used a type one error rate of 0.05.
Results and Discussion
Soil Organic Matter, Nitrogen, and Phosphorus
The municipal biosolids used in this treatment were an excellent source of organic matter and
plant nutrients (Table 1). However, the success of the treatments can best be interpreted as a
function of the ability of the soil/plant/ system to assimilate and store nutrients and increase
above and belowground biomass.
Although we observed some significant treatment effects on soil OM in 1986 and 1989, no
significant differences were detected in 1993 (Table 2). Surface application of biosolids did not
appear to directly contribute to soil OM, instead the observed increases in organic matter
apparently resulted from increased belowground productivity and/or surface soil incorporation
of aboveground organic matter. The significant increases observed early in the study suggest
a belowground response to increased nutrient availability, however, other biosolids application
studies have reported an inhibition of root growth due to increased nutrient availability (Loftin
and Aguilar 1994). At this time we are unable to explain the short-term soil organic matter
response and it is too soon to evaluate the long-term response.
1-3
image:
 Table 1. Organic matter, plant nutrient, and heavy metal analysis of Albuquerque
dried municipal biosolids, loading rates of the three biosolids applications, and U.S.
Environmental Protection Agency (USEPA) limits.
(Mg/ha)
22.5
45.0
90.0
Albuquerque Biosolids
OM TKN P Cd Cu Pb Zn
(mg/kg)
50 4.86 0.16
USEPA Limits (mg/ha)1
0.24 47.50 3.30 150
85 4,300 840 7,500
Rio Puerco Biosolids Loading Rates
OM TKN P Cd Cu Pb
Zn
(kg/ha)
(g/ha)
11,250 1,094 36
22,500 2,188 72
45,000 4,376 144
USEPA Limits (kg/ha)2
5.4 1,069 74
10.8 2,138 148
21.6 4,276 296
39
1,500 300
3,375
6,750
13,500
2,800
1USEPA ceiling concentrations for municipal biosolids (USEPA, 1993).
2USEPA cumulative pollutant loading rates for land application of municipal biosolids
(USEPA, 1993)
1-4
image:
Table 1. Organic matter, plant nutrient, and heavy metal analysis of Albuquerque
dried municipal biosolids, loading rates of the three biosolids applications, and U.S.
Environmental Protection Agency (USEPA) limits.
(Mg/ha)
22.5
45.0
90.0
Albuquerque Biosolids
OM TKN P Cd Cu Pb Zn
(mg/kg)
50 4.86 0.16
USEPA Limits (mg/ha)1
0.24 47.50 3.30 150
85 4,300 840 7,500
Rio Puerco Biosolids Loading Rates
OM TKN P Cd Cu Pb
Zn
(kg/ha)
(g/ha)
11,250 1,094 36
22,500 2,188 72
45,000 4,376 144
USEPA Limits (kg/ha)2
5.4 1,069 74
10.8 2,138 148
21.6 4,276 296
39
1,500 300
3,375
6,750
13,500
2,800
1USEPA ceiling concentrations for municipal biosolids (USEPA, 1993).
2USEPA cumulative pollutant loading rates for land application of municipal biosolids
(USEPA, 1993)
1-4
image:
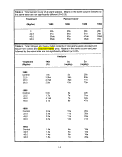
 Table 2. Organic matter and plant nutrient levels in control and biosolids-treated soils. Means
in the same column
Treatment (Mg/ha)
1985
Control
22.5
45.0
90.0
1986
Control
22.5
45.0
90.0
1989
Control
22.5
45.0
90.0
1993
Control
22.5
45.0
90.0
and year followed
OM
(%)
1.2a
1.3a
1.4a
1.2a
1.4ab
1.5a
1.5ab
1.2b
1.4b
1.8ab
2.6a
2.3ab
1.3a
1.7a
1.7a
1.8a
by the same letter
TKN
729b
817ab
845ab
924a
665b
828ab
843ab
987a
682b
890b
1869a
1814a
820c
1076b
1158ab
1370a
are not significantly
Analysis
NH4-N NO3-N
(mg/kg) —
3b 2b
9b 22ab
20ab 42ab
51a 61a
3c 1c
10ab 10bc
22b 28b
39a 54a
4b 7c
4b 14b
39a 22a
42a 28a
8b 3a
9b 5a
15b 7a
47a 8a
different (P>0.05).
P
5c
15bc
20b
31a
4c
20bc
44b
72a
9b
26ab
42ab
57a
6c
25bc
43b
77a
1-5
image:
Table 2. Organic matter and plant nutrient levels in control and biosolids-treated soils. Means
in the same column
Treatment (Mg/ha)
1985
Control
22.5
45.0
90.0
1986
Control
22.5
45.0
90.0
1989
Control
22.5
45.0
90.0
1993
Control
22.5
45.0
90.0
and year followed
OM
(%)
1.2a
1.3a
1.4a
1.2a
1.4ab
1.5a
1.5ab
1.2b
1.4b
1.8ab
2.6a
2.3ab
1.3a
1.7a
1.7a
1.8a
by the same letter
TKN
729b
817ab
845ab
924a
665b
828ab
843ab
987a
682b
890b
1869a
1814a
820c
1076b
1158ab
1370a
are not significantly
Analysis
NH4-N NO3-N
(mg/kg) —
3b 2b
9b 22ab
20ab 42ab
51a 61a
3c 1c
10ab 10bc
22b 28b
39a 54a
4b 7c
4b 14b
39a 22a
42a 28a
8b 3a
9b 5a
15b 7a
47a 8a
different (P>0.05).
P
5c
15bc
20b
31a
4c
20bc
44b
72a
9b
26ab
42ab
57a
6c
25bc
43b
77a
1-5
image:
 For the first five years of the study (1985 to 1989) soil mineral nitrogen (NH4-N and N03-N) was
rarely significantly greater than control levels for the 22.5 Mg/ha treatment, but the two highest
biosolids treatments (45 and 90 Mg/ha) were often significantly greater than control levels (Table
2). However, by 1993 only the 90.0 Mg/ha treatment had significantly greater soil mineral
nitrogen. In contrast, only the 90.0 Mg/ha application had significantly greater soil TKN than
controls in 1985 and 1986. By 1993, all three treatments had significantly greater soil TKN.
The increase in soil TKN reflects an increase in organic nitrogen, which is an indication of the
success of the treatment. Organic nitrogen represents an important source of nitrogen which will
become available for plant uptake following decomposition of the organic matter. The more
nitrogen fixed into organic form, the greater the nitrogen reserve for future productivity.
Phosphorus, another important and often limiting plant nutrient, was significantly greater in the
45.0 and 90.0 Mg/ha treatments than control levels for most sampling dates, but soil P from the
22.5 Mg/ha treatment has never been significantly greater than controls.
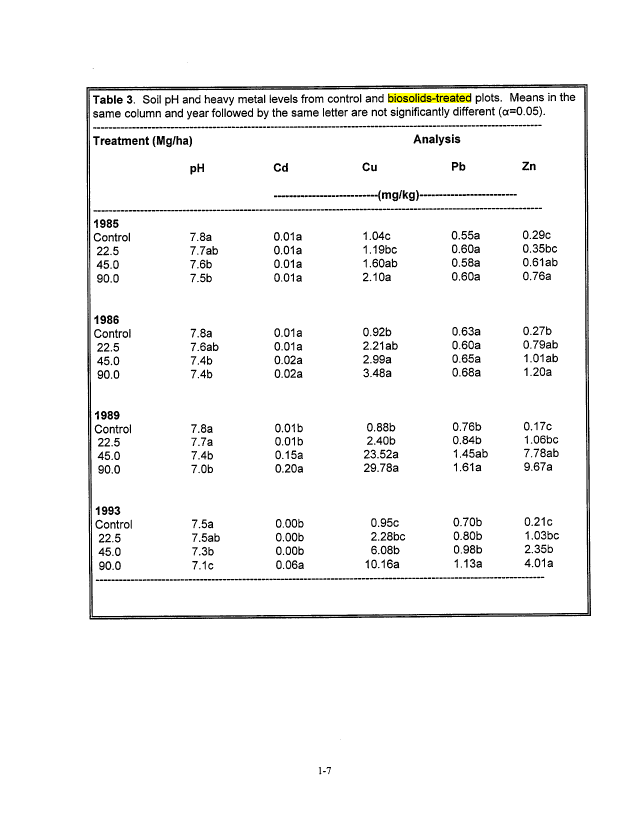
Soil pH and Heavy Metals
Soil pH is an important factor in determining the availability of plant nutrients and, of more
concern for this project, the availability of heavy metals. In general, heavy metal mobility in
soils increases with increasing acidity. Acids produced during decomposition of organic
biosolids and through nitrification of mineral nitrogen, can increase soil acidity. The 22.5 Mg/ha
treatment had no significant effect on soil pH, however, soil pH from the 45.0 and 90.0 Mg/ha
treatments was consistently significantly lower than controls (Table 3). Metals are relatively
immobile and unavailable for biological assimilation in soils with a pH of 7.0 or above (Chang
et al., 1984) and treated soil pH levels have remained above 7.0. Furthermore, "Cu, Zn, Ni, and
Cr toxicities to even very sensitive plants have not been observed in any municipal sludge land
application experiments with pH > 5.5" (Chang et al. 1992). Levels of heavy metals in the
biosolids used for this project were well below USEPA (1993) maximum limits (Table 1).
Heavy metal loading rates for all treatments were also well below established USEPA limits.
No problems with heavy metal accumulation in soils or plant tissues is likely due to the
combination of high soil pH and low heavy metal loading rates.
Soil heavy metal concentrations did not increase significantly above control levels at any
sampling period for the 22.5 Mg/ha treatment and, therefore, should not present any problems
(Table 3). Soil Cu levels were perhaps the most problematic, with levels significantly above
controls for all sampling periods for the 45.0 and 90.0 treatments. In 1989 DTPA extractable
Cu levels were above 20 mg/kg which is considered to be potentially phytotoxic (Tiedemann and
Lopez, 1982) although no evidence of phytotoxicity was observed. Soil Zn responded in much
the same way as Cu. However, Zn is not as phytotoxic as Cu and Zn concentrations in treated
soils remained below 10.0 mg/kg. Soil Pb, which is relatively immobile in alkaline soils, did
increase significantly in the 90.0 Mg/ha treatment but levels were below 2.0 mg/kg and should
not be a problem.
1-6
image:
For the first five years of the study (1985 to 1989) soil mineral nitrogen (NH4-N and N03-N) was
rarely significantly greater than control levels for the 22.5 Mg/ha treatment, but the two highest
biosolids treatments (45 and 90 Mg/ha) were often significantly greater than control levels (Table
2). However, by 1993 only the 90.0 Mg/ha treatment had significantly greater soil mineral
nitrogen. In contrast, only the 90.0 Mg/ha application had significantly greater soil TKN than
controls in 1985 and 1986. By 1993, all three treatments had significantly greater soil TKN.
The increase in soil TKN reflects an increase in organic nitrogen, which is an indication of the
success of the treatment. Organic nitrogen represents an important source of nitrogen which will
become available for plant uptake following decomposition of the organic matter. The more
nitrogen fixed into organic form, the greater the nitrogen reserve for future productivity.
Phosphorus, another important and often limiting plant nutrient, was significantly greater in the
45.0 and 90.0 Mg/ha treatments than control levels for most sampling dates, but soil P from the
22.5 Mg/ha treatment has never been significantly greater than controls.
Soil pH and Heavy Metals
Soil pH is an important factor in determining the availability of plant nutrients and, of more
concern for this project, the availability of heavy metals. In general, heavy metal mobility in
soils increases with increasing acidity. Acids produced during decomposition of organic
biosolids and through nitrification of mineral nitrogen, can increase soil acidity. The 22.5 Mg/ha
treatment had no significant effect on soil pH, however, soil pH from the 45.0 and 90.0 Mg/ha
treatments was consistently significantly lower than controls (Table 3). Metals are relatively
immobile and unavailable for biological assimilation in soils with a pH of 7.0 or above (Chang
et al., 1984) and treated soil pH levels have remained above 7.0. Furthermore, "Cu, Zn, Ni, and
Cr toxicities to even very sensitive plants have not been observed in any municipal sludge land
application experiments with pH > 5.5" (Chang et al. 1992). Levels of heavy metals in the
biosolids used for this project were well below USEPA (1993) maximum limits (Table 1).
Heavy metal loading rates for all treatments were also well below established USEPA limits.
No problems with heavy metal accumulation in soils or plant tissues is likely due to the
combination of high soil pH and low heavy metal loading rates.
Soil heavy metal concentrations did not increase significantly above control levels at any
sampling period for the 22.5 Mg/ha treatment and, therefore, should not present any problems
(Table 3). Soil Cu levels were perhaps the most problematic, with levels significantly above
controls for all sampling periods for the 45.0 and 90.0 treatments. In 1989 DTPA extractable
Cu levels were above 20 mg/kg which is considered to be potentially phytotoxic (Tiedemann and
Lopez, 1982) although no evidence of phytotoxicity was observed. Soil Zn responded in much
the same way as Cu. However, Zn is not as phytotoxic as Cu and Zn concentrations in treated
soils remained below 10.0 mg/kg. Soil Pb, which is relatively immobile in alkaline soils, did
increase significantly in the 90.0 Mg/ha treatment but levels were below 2.0 mg/kg and should
not be a problem.
1-6
image:
 Table 3. Soil pH and heavy metal levels from control and biosolids-treated plots. Means in the
same column and year followed by the same letter are not significantly different (cc=0.05).
Treatment (Mg/ha)
1985
Control
22.5
45.0
90.0
1986
Control
22.5
45.0
90.0
1989
Control
22.5
45.0
90.0
1993
Control
22.5
45.0
90.0
PH
7.8a
7.7ab
7.6b
7.5b
7.8a
7.6ab
7.4b
7.4b
7.8a
7.7a
7.4b
7.0b
7.5a
7.5ab
7.3b
7.1c
Cd
0.01a
0.01a
0.01a
0.01a
0.01a
0.01a
0.02a
0.02a
0.01 b
0.01 b
0.1 5a
0.20a
O.OOb
O.OOb
O.OOb
0.06a
Analysis
Cu
(mg/kg)™
1.04c
1.19bc
1.60ab
2.10a
0.92b
2.21 ab
2.99a
3.48a
0.88b
2.40b
23.52a
29.78a
0.95c
2.28bc
6.08b
10.16a
Pb
0.55a
0.60a
0.58a
0.60a
0.63a
0.60a
0.65a
0.68a
0.76b
0.84b
1.45ab
1.61a
OJOb
0.80b
0.98b
1.13a
Zn
0.29c
0.35bc
0.61ab
0.76a
0.27b
0.79ab
1.01ab
1.20a
0.1 7c
1.06bc
7.78ab
9.67a
0.21c
1.03bc
2.35b
4.01 a
1-7
image:
Table 3. Soil pH and heavy metal levels from control and biosolids-treated plots. Means in the
same column and year followed by the same letter are not significantly different (cc=0.05).
Treatment (Mg/ha)
1985
Control
22.5
45.0
90.0
1986
Control
22.5
45.0
90.0
1989
Control
22.5
45.0
90.0
1993
Control
22.5
45.0
90.0
PH
7.8a
7.7ab
7.6b
7.5b
7.8a
7.6ab
7.4b
7.4b
7.8a
7.7a
7.4b
7.0b
7.5a
7.5ab
7.3b
7.1c
Cd
0.01a
0.01a
0.01a
0.01a
0.01a
0.01a
0.02a
0.02a
0.01 b
0.01 b
0.1 5a
0.20a
O.OOb
O.OOb
O.OOb
0.06a
Analysis
Cu
(mg/kg)™
1.04c
1.19bc
1.60ab
2.10a
0.92b
2.21 ab
2.99a
3.48a
0.88b
2.40b
23.52a
29.78a
0.95c
2.28bc
6.08b
10.16a
Pb
0.55a
0.60a
0.58a
0.60a
0.63a
0.60a
0.65a
0.68a
0.76b
0.84b
1.45ab
1.61a
OJOb
0.80b
0.98b
1.13a
Zn
0.29c
0.35bc
0.61ab
0.76a
0.27b
0.79ab
1.01ab
1.20a
0.1 7c
1.06bc
7.78ab
9.67a
0.21c
1.03bc
2.35b
4.01 a
1-7
image:
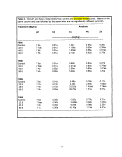 Table 4. Total percent cover of all plant species. Means in the same column followed by
the same letter are not significantly different (P>0.05).
Treatment
(Mg/ha)
0
22.5
45.0
90.0
1985
30b
37a
35ab
36ab
Percent Cover
1986
35b
54a
52a
55a
1989
30b
51 a
47ab
45ab
1993
26b
34a
33ab
35a
Table 5. Total nitrogen and heavy metal contents in blue grama grass aboveground
tissue from control and biosolids-treated plots. Means in the same column and year
followed by the same letter are not significantly different (a=0.05).
Treatment
(Mg/ha)
1985
Control
22.5
45.0
90.0
1986
Control
22.5
45.0
90.0
1989
Control
22.5
45.0
90.0
1993
Control
22.5
45.0
90.0
TKN
(%)
1.6c
2.2bc
2.7ab
2.8a
0.8c
1.7b
2.1ab
2.1a
2.0a
2.4a
2.5a
2.5a
1.3a
1.3a
1.4a
1.5a
Analysis
Cu
(mg/kg)
3c
5bc
Sab
10a
5a
7a
7a
8a
10a
13a
6a
6a
6a
7a
Zn
(mg/kg)
26b
83a
77a
73a
22b
31a
42a
47a
26a
26a
23a
21a
19a
15a
18a
25a-
1-8
image:
Table 4. Total percent cover of all plant species. Means in the same column followed by
the same letter are not significantly different (P>0.05).
Treatment
(Mg/ha)
0
22.5
45.0
90.0
1985
30b
37a
35ab
36ab
Percent Cover
1986
35b
54a
52a
55a
1989
30b
51 a
47ab
45ab
1993
26b
34a
33ab
35a
Table 5. Total nitrogen and heavy metal contents in blue grama grass aboveground
tissue from control and biosolids-treated plots. Means in the same column and year
followed by the same letter are not significantly different (a=0.05).
Treatment
(Mg/ha)
1985
Control
22.5
45.0
90.0
1986
Control
22.5
45.0
90.0
1989
Control
22.5
45.0
90.0
1993
Control
22.5
45.0
90.0
TKN
(%)
1.6c
2.2bc
2.7ab
2.8a
0.8c
1.7b
2.1ab
2.1a
2.0a
2.4a
2.5a
2.5a
1.3a
1.3a
1.4a
1.5a
Analysis
Cu
(mg/kg)
3c
5bc
Sab
10a
5a
7a
7a
8a
10a
13a
6a
6a
6a
7a
Zn
(mg/kg)
26b
83a
77a
73a
22b
31a
42a
47a
26a
26a
23a
21a
19a
15a
18a
25a-
1-8
image:
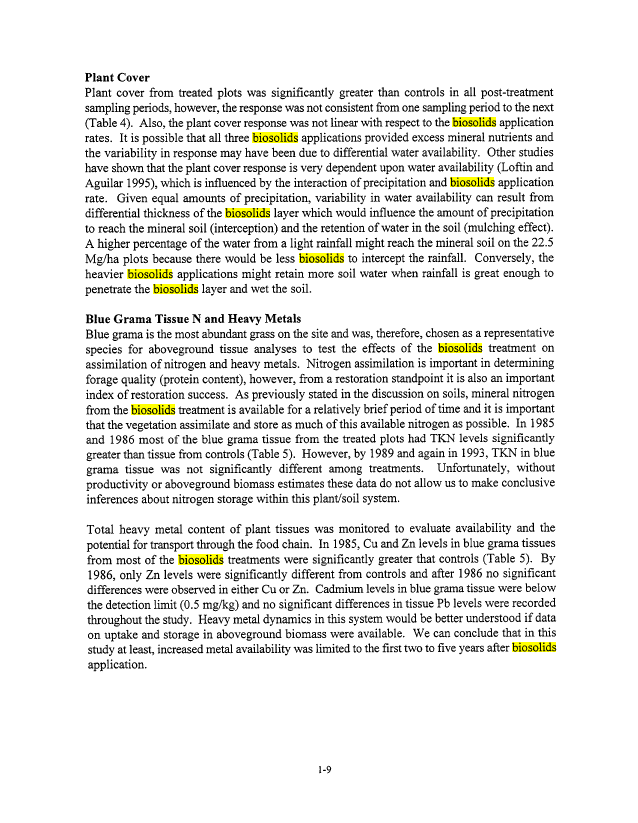
 Plant Cover
Plant cover from treated plots was significantly greater than controls in all post-treatment
sampling periods, however, the response was not consistent from one sampling period to the next
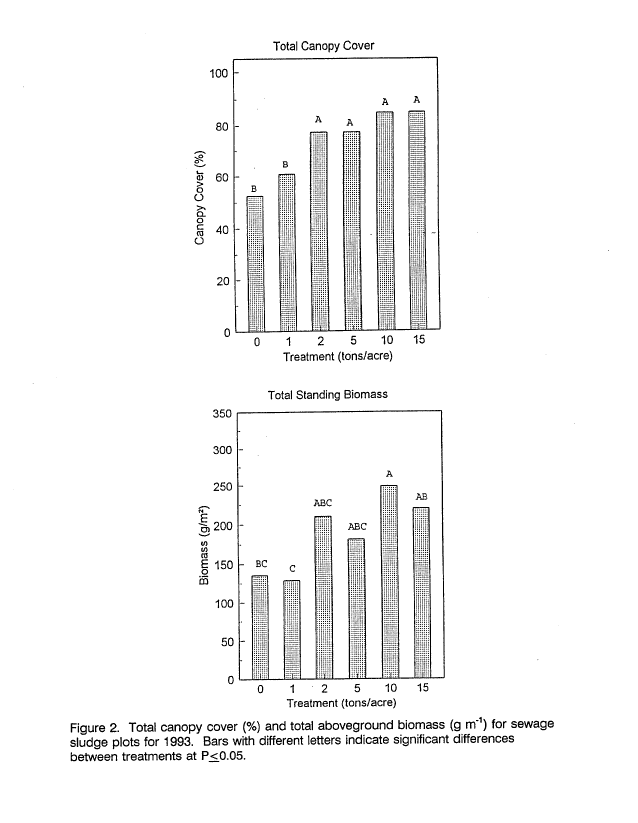
(Table 4). Also, the plant cover response was not linear with respect to the biosolids application
rates. It is possible that all three biosolids applications provided excess mineral nutrients and
the variability in response may have been due to differential water availability. Other studies
have shown that the plant cover response is very dependent upon water availability (Loftin and
Aguilar 1995), which is influenced by the interaction of precipitation and biosolids application
rate. Given equal amounts of precipitation, variability in water availability can result from
differential thickness of the biosolids layer which would influence the amount of precipitation
to reach the mineral soil (interception) and the retention of water in the soil (mulching effect).
A higher percentage of the water from a light rainfall might reach the mineral soil on the 22.5
Mg/ha plots because there would be less biosolids to intercept the rainfall. Conversely, the
heavier biosolids applications might retain more soil water when rainfall is great enough to
penetrate the biosolids layer and wet the soil.
Blue Grama Tissue N and Heavy Metals
Blue grama is the most abundant grass on the site and was, therefore, chosen as a representative
species for aboveground tissue analyses to test the effects of the biosolids treatment on
assimilation of nitrogen and heavy metals. Nitrogen assimilation is important in determining
forage quality (protein content), however, from a restoration standpoint it is also an important
index of restoration success. As previously stated in the discussion on soils, mineral nitrogen
from the biosolids treatment is available for a relatively brief period of time and it is important
that the vegetation assimilate and store as much of this available nitrogen as possible. In 1985
and 1986 most of the blue grama tissue from the treated plots had TKN levels significantly
greater than tissue from controls (Table 5). However, by 1989 and again in 1993, TKN in blue
grama tissue was not significantly different among treatments. Unfortunately, without
productivity or aboveground biomass estimates these data do not allow us to make conclusive
inferences about nitrogen storage within this plant/soil system.
Total heavy metal content of plant tissues was monitored to evaluate availability and the
potential for transport through the food chain. In 1985, Cu and Zn levels in blue grama tissues
from most of the biosolids treatments were significantly greater that controls (Table 5). By
1986, only Zn levels were significantly different from controls and after 1986 no significant
differences were observed in either Cu or Zn. Cadmium levels in blue grama tissue were below
the detection limit (0.5 mg/kg) and no significant differences in tissue Pb levels were recorded
throughout the study. Heavy metal dynamics in this system would be better understood if data
on uptake and storage in aboveground biomass were available. We can conclude that in this
study at least, increased metal availability was limited to the first two to five years after biosolids
application.
1-9
image:
Plant Cover
Plant cover from treated plots was significantly greater than controls in all post-treatment
sampling periods, however, the response was not consistent from one sampling period to the next
(Table 4). Also, the plant cover response was not linear with respect to the biosolids application
rates. It is possible that all three biosolids applications provided excess mineral nutrients and
the variability in response may have been due to differential water availability. Other studies
have shown that the plant cover response is very dependent upon water availability (Loftin and
Aguilar 1995), which is influenced by the interaction of precipitation and biosolids application
rate. Given equal amounts of precipitation, variability in water availability can result from
differential thickness of the biosolids layer which would influence the amount of precipitation
to reach the mineral soil (interception) and the retention of water in the soil (mulching effect).
A higher percentage of the water from a light rainfall might reach the mineral soil on the 22.5
Mg/ha plots because there would be less biosolids to intercept the rainfall. Conversely, the
heavier biosolids applications might retain more soil water when rainfall is great enough to
penetrate the biosolids layer and wet the soil.
Blue Grama Tissue N and Heavy Metals
Blue grama is the most abundant grass on the site and was, therefore, chosen as a representative
species for aboveground tissue analyses to test the effects of the biosolids treatment on
assimilation of nitrogen and heavy metals. Nitrogen assimilation is important in determining
forage quality (protein content), however, from a restoration standpoint it is also an important
index of restoration success. As previously stated in the discussion on soils, mineral nitrogen
from the biosolids treatment is available for a relatively brief period of time and it is important
that the vegetation assimilate and store as much of this available nitrogen as possible. In 1985
and 1986 most of the blue grama tissue from the treated plots had TKN levels significantly
greater than tissue from controls (Table 5). However, by 1989 and again in 1993, TKN in blue
grama tissue was not significantly different among treatments. Unfortunately, without
productivity or aboveground biomass estimates these data do not allow us to make conclusive
inferences about nitrogen storage within this plant/soil system.
Total heavy metal content of plant tissues was monitored to evaluate availability and the
potential for transport through the food chain. In 1985, Cu and Zn levels in blue grama tissues
from most of the biosolids treatments were significantly greater that controls (Table 5). By
1986, only Zn levels were significantly different from controls and after 1986 no significant
differences were observed in either Cu or Zn. Cadmium levels in blue grama tissue were below
the detection limit (0.5 mg/kg) and no significant differences in tissue Pb levels were recorded
throughout the study. Heavy metal dynamics in this system would be better understood if data
on uptake and storage in aboveground biomass were available. We can conclude that in this
study at least, increased metal availability was limited to the first two to five years after biosolids
application.
1-9
image:
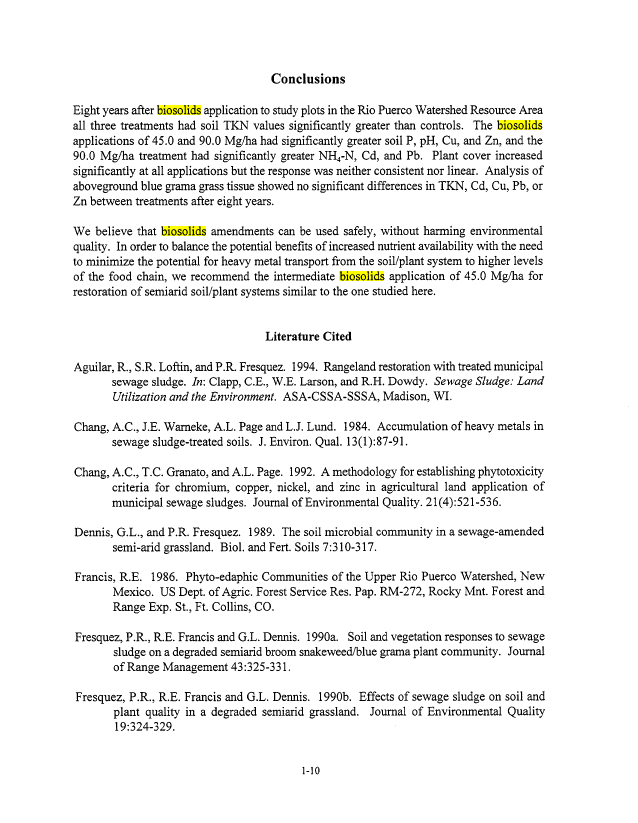
 Conclusions
Eight years after biosolids application to study plots in the Rio Puerco Watershed Resource Area
all three treatments had soil TKN values significantly greater than controls. The biosolids
applications of 45.0 and 90.0 Mg/ha had significantly greater soil P, pH, Cu, and Zn, and the
90.0 Mg/ha treatment had significantly greater NH4-N, Cd, and Pb. Plant cover increased
significantly at all applications but the response was neither consistent nor linear. Analysis of
aboveground blue grama grass tissue showed no significant differences in TKN, Cd, Cu, Pb, or
Zn between treatments after eight years.
We believe that biosolids amendments can be used safely, without harming environmental
quality. In order to balance the potential benefits of increased nutrient availability with the need
to minimize the potential for heavy metal transport from the soil/plant system to higher levels
of the food chain, we recommend the intermediate biosolids application of 45.0 Mg/ha for
restoration of semiarid soil/plant systems similar to the one studied here.
Literature Cited
Aguilar, R., S.R. Loftin, and P.R. Fresquez. 1994. Rangeland restoration with treated municipal
sewage sludge. In: Clapp, C.E., W.E. Larson, and R.H. Dowdy. Sewage Sludge: Land
Utilization and the Environment. ASA-CSSA-SSSA, Madison, WI.
Chang, A.C., J.E. Warneke, A.L. Page and LJ. Lund. 1984. Accumulation of heavy metals in
sewage sludge-treated soils. J. Environ. Qual. 13(1):87-91.
Chang, A.C., T.C. Granato, and A.L. Page. 1992. A methodology for establishing phytotoxicity
criteria for chromium, copper, nickel, and zinc in agricultural land application of
municipal sewage sludges. Journal of Environmental Quality. 21(4):521-536.
Dennis, G.L., and P.R. Fresquez. 1989. The soil microbial community in a sewage-amended
semi-arid grassland. Biol. and Pert. Soils 7:310-317.
Francis, R.E. 1986. Phyto-edaphic Communities of the Upper Rio Puerco Watershed, New
Mexico. US Dept. of Agric. Forest Service Res. Pap. RM-272, Rocky Mnt. Forest and
Range Exp. St., Ft. Collins, CO.
Fresquez, P.R., R.E. Francis and G.L. Dennis. 1990a. Soil and vegetation responses to sewage
sludge on a degraded semiarid broom snakeweed/blue grama plant community. Journal
of Range Management 43:325-331.
Fresquez, P.R., R.E. Francis and G.L. Dennis. 1990b. Effects of sewage sludge on soil and
plant quality in a degraded semiarid grassland. Journal of Environmental Quality
19:324-329.
1-10
image:
Conclusions
Eight years after biosolids application to study plots in the Rio Puerco Watershed Resource Area
all three treatments had soil TKN values significantly greater than controls. The biosolids
applications of 45.0 and 90.0 Mg/ha had significantly greater soil P, pH, Cu, and Zn, and the
90.0 Mg/ha treatment had significantly greater NH4-N, Cd, and Pb. Plant cover increased
significantly at all applications but the response was neither consistent nor linear. Analysis of
aboveground blue grama grass tissue showed no significant differences in TKN, Cd, Cu, Pb, or
Zn between treatments after eight years.
We believe that biosolids amendments can be used safely, without harming environmental
quality. In order to balance the potential benefits of increased nutrient availability with the need
to minimize the potential for heavy metal transport from the soil/plant system to higher levels
of the food chain, we recommend the intermediate biosolids application of 45.0 Mg/ha for
restoration of semiarid soil/plant systems similar to the one studied here.
Literature Cited
Aguilar, R., S.R. Loftin, and P.R. Fresquez. 1994. Rangeland restoration with treated municipal
sewage sludge. In: Clapp, C.E., W.E. Larson, and R.H. Dowdy. Sewage Sludge: Land
Utilization and the Environment. ASA-CSSA-SSSA, Madison, WI.
Chang, A.C., J.E. Warneke, A.L. Page and LJ. Lund. 1984. Accumulation of heavy metals in
sewage sludge-treated soils. J. Environ. Qual. 13(1):87-91.
Chang, A.C., T.C. Granato, and A.L. Page. 1992. A methodology for establishing phytotoxicity
criteria for chromium, copper, nickel, and zinc in agricultural land application of
municipal sewage sludges. Journal of Environmental Quality. 21(4):521-536.
Dennis, G.L., and P.R. Fresquez. 1989. The soil microbial community in a sewage-amended
semi-arid grassland. Biol. and Pert. Soils 7:310-317.
Francis, R.E. 1986. Phyto-edaphic Communities of the Upper Rio Puerco Watershed, New
Mexico. US Dept. of Agric. Forest Service Res. Pap. RM-272, Rocky Mnt. Forest and
Range Exp. St., Ft. Collins, CO.
Fresquez, P.R., R.E. Francis and G.L. Dennis. 1990a. Soil and vegetation responses to sewage
sludge on a degraded semiarid broom snakeweed/blue grama plant community. Journal
of Range Management 43:325-331.
Fresquez, P.R., R.E. Francis and G.L. Dennis. 1990b. Effects of sewage sludge on soil and
plant quality in a degraded semiarid grassland. Journal of Environmental Quality
19:324-329.
1-10
image:
 Fresquez, P.R., R. Aguilar, R.E. Francis and E.F. Aldon. 1991. Heavy metal uptake by blue
grama growing in a degraded semiarid soil amended with sewage sludge. Journal of
Water, Air and Soil Pollution 57-58:903-912.
Grover, H.D. and H.B. Musik. 1990. Shrubland encroachment in southern New Mexico,
U.S.A.: an analysis of desertification processes in the American Southwest. Climatic
Change 17:305-330.
Loftin, S.R. and R. Aguilar. 1994. Semiarid rangeland response to municipal sewage sludge:
plant growth and litter decomposition, pp 221-229. In: Clapp, C.E., W.E. Larson, and
R.H. Dowdy. Sewage Sludge: Land Utilization and the Environment. ASA-CSSA-
SSSA, Madison, WI.
Pase, C.P. 1981. Community structure analysis-a rapid, effective range condition estimator for
semi-arid ranges. In: H.G. Lund, et at. (tech. coord.). Arid land resource inventories:
Developing cost-efficient methods. USDA Forest Service Gen. Tech. Rep. WO-28,
Washington D.C.
Schlesinger, W.H., J.F. Reynolds, G.L. Cunningham, L.F. Huenneke, W.M. Jarrell, R.A.
Virginia and W.G. Whitford. 1990. Biological feedbacks in global desertification.
Science 247:1043-1048.
Sheridan, D. 1981. Desertification of the United States. Council on Environmental Quality.
U.S. Government Publishing Office. Washington D.C.
Tausch, R.J., P.E. Wigand and J.W. Burkhardt. 1993. Viewpoint: Plant community thresholds,
multiple steady states, and multiple successional pathways: legacy of the Quaternary?
Journal of Range Management 46(5):439-447.
Tiedemann, A.R. and C.F. Lopez. 1982. Soil nutrient assessments of mine spoils. In: Aldon,
E.F. and W.R. Oaks. Reclamation of Mined Lands in the Southwest Symposium
Proceedings. October 20-22,1982. Albuquerque, NM.
U.S. Environmental Protection Agency. 1993. 40 CFR - Parts 257 and 503, Standards for the
disposal of sewage sludge; final rule. Washington, DC.
W-170 Peer Review Committee. 1989. Peer review of standards for the disposal of sewage
sludge (USEPA Proposed Rule 40 CFR Parts 257 & 503) USDA-CSRS W-170 Regional
Research Committee. USDA, Washington, DC.
Westoby, M., B. Walker and I. Noy-Meir. 1989. Opportunistic management for rangelands not
at equilibrium. J. Range Manage. 42(4):266-274.
1-11
image:
Fresquez, P.R., R. Aguilar, R.E. Francis and E.F. Aldon. 1991. Heavy metal uptake by blue
grama growing in a degraded semiarid soil amended with sewage sludge. Journal of
Water, Air and Soil Pollution 57-58:903-912.
Grover, H.D. and H.B. Musik. 1990. Shrubland encroachment in southern New Mexico,
U.S.A.: an analysis of desertification processes in the American Southwest. Climatic
Change 17:305-330.
Loftin, S.R. and R. Aguilar. 1994. Semiarid rangeland response to municipal sewage sludge:
plant growth and litter decomposition, pp 221-229. In: Clapp, C.E., W.E. Larson, and
R.H. Dowdy. Sewage Sludge: Land Utilization and the Environment. ASA-CSSA-
SSSA, Madison, WI.
Pase, C.P. 1981. Community structure analysis-a rapid, effective range condition estimator for
semi-arid ranges. In: H.G. Lund, et at. (tech. coord.). Arid land resource inventories:
Developing cost-efficient methods. USDA Forest Service Gen. Tech. Rep. WO-28,
Washington D.C.
Schlesinger, W.H., J.F. Reynolds, G.L. Cunningham, L.F. Huenneke, W.M. Jarrell, R.A.
Virginia and W.G. Whitford. 1990. Biological feedbacks in global desertification.
Science 247:1043-1048.
Sheridan, D. 1981. Desertification of the United States. Council on Environmental Quality.
U.S. Government Publishing Office. Washington D.C.
Tausch, R.J., P.E. Wigand and J.W. Burkhardt. 1993. Viewpoint: Plant community thresholds,
multiple steady states, and multiple successional pathways: legacy of the Quaternary?
Journal of Range Management 46(5):439-447.
Tiedemann, A.R. and C.F. Lopez. 1982. Soil nutrient assessments of mine spoils. In: Aldon,
E.F. and W.R. Oaks. Reclamation of Mined Lands in the Southwest Symposium
Proceedings. October 20-22,1982. Albuquerque, NM.
U.S. Environmental Protection Agency. 1993. 40 CFR - Parts 257 and 503, Standards for the
disposal of sewage sludge; final rule. Washington, DC.
W-170 Peer Review Committee. 1989. Peer review of standards for the disposal of sewage
sludge (USEPA Proposed Rule 40 CFR Parts 257 & 503) USDA-CSRS W-170 Regional
Research Committee. USDA, Washington, DC.
Westoby, M., B. Walker and I. Noy-Meir. 1989. Opportunistic management for rangelands not
at equilibrium. J. Range Manage. 42(4):266-274.
1-11
image:
 Tobosagrass and Alkali Sacaton Growth Responses
to Topically Applied Biosolids
in a Chihuahuan Desert Grassland
David B. Wester, Mark W. Benton, Pedro Jurado,
Richard G. Gatewood, and Ronald E. Sosebee
Abstract
Objectives of this research were to investigate responses of tobosagrass (Hilaria muticd) and
alkali sacaton (Sporobolus airoides) to biosolids topically applied during autumn, dormant, or
growing seasons with and without supplemental irrigation; multiple yearly or seasonal
applications also were studied. Application rates ranged from 0 to 89.7 Mg/ha. Standing crop
at the end of the growing season was measured. Season and rate of application as well as
irrigation effects were important factors affecting plant response. Plant response was species-
specific. In general, plants provided with biosolids in the dormant season produced more
standing crop than plants provided with biosolids immediately prior to the onset of the growing
season. Additionally, standing crop generally increased at biosolids rates up to 17.9 Mg/ha.
Keywords: Biosolids, standing crop, Chihuahuan desert, beneficial use.
Introduction
Land application of biosolids will be an increasingly common method of disposal as
environmental concerns and costs associated with ocean disposal, incineration and landfilling
grow. Although there has been much research on the effects of biosolids on agronomic crops,
particularly in relatively humid areas, less information is available on biosolids effects on native
rangeland in arid and semiarid environments.
Fresquez et al. (1990a,b; 1991) conducted extensive research on the effects of a one-time only
(July) application of biosolids (at rates up to 90 Mg/ha) to semiarid rangeland dominated by blue
grama (Bouteloua gracilis), galleta (Hilaria jamesif) and snakeweed (Gutierrezia sarothrae}.
Soil and vegetation responses were followed for several growing seasons after application (see
Aguilar et al. (1994) for a summary). Blue grama production was increased by biosolids
application for up to 5 growing seasons after application at 45 and 90 Mg/ha. Also, blue grama
forage quality was improved by biosolids application without accompanying heavymetal uptake.
Aguilar et al. (1994) also studied a one-time only(April) application of biosolids (45 Mg/ha) on
semiarid rangeland. Aboveground plant cover was higher in treated plots only during one
sampling period, and root growth was less in treated plots. Plant tissue in treated plots had
higher TKN and Cu than in control plots.
l-l
image:
Tobosagrass and Alkali Sacaton Growth Responses
to Topically Applied Biosolids
in a Chihuahuan Desert Grassland
David B. Wester, Mark W. Benton, Pedro Jurado,
Richard G. Gatewood, and Ronald E. Sosebee
Abstract
Objectives of this research were to investigate responses of tobosagrass (Hilaria muticd) and
alkali sacaton (Sporobolus airoides) to biosolids topically applied during autumn, dormant, or
growing seasons with and without supplemental irrigation; multiple yearly or seasonal
applications also were studied. Application rates ranged from 0 to 89.7 Mg/ha. Standing crop
at the end of the growing season was measured. Season and rate of application as well as
irrigation effects were important factors affecting plant response. Plant response was species-
specific. In general, plants provided with biosolids in the dormant season produced more
standing crop than plants provided with biosolids immediately prior to the onset of the growing
season. Additionally, standing crop generally increased at biosolids rates up to 17.9 Mg/ha.
Keywords: Biosolids, standing crop, Chihuahuan desert, beneficial use.
Introduction
Land application of biosolids will be an increasingly common method of disposal as
environmental concerns and costs associated with ocean disposal, incineration and landfilling
grow. Although there has been much research on the effects of biosolids on agronomic crops,
particularly in relatively humid areas, less information is available on biosolids effects on native
rangeland in arid and semiarid environments.
Fresquez et al. (1990a,b; 1991) conducted extensive research on the effects of a one-time only
(July) application of biosolids (at rates up to 90 Mg/ha) to semiarid rangeland dominated by blue
grama (Bouteloua gracilis), galleta (Hilaria jamesif) and snakeweed (Gutierrezia sarothrae}.
Soil and vegetation responses were followed for several growing seasons after application (see
Aguilar et al. (1994) for a summary). Blue grama production was increased by biosolids
application for up to 5 growing seasons after application at 45 and 90 Mg/ha. Also, blue grama
forage quality was improved by biosolids application without accompanying heavymetal uptake.
Aguilar et al. (1994) also studied a one-time only(April) application of biosolids (45 Mg/ha) on
semiarid rangeland. Aboveground plant cover was higher in treated plots only during one
sampling period, and root growth was less in treated plots. Plant tissue in treated plots had
higher TKN and Cu than in control plots.
l-l
image:
 Despite the extensive findings of Fresquez et al. (1990a, b; 1991) and the ongoing work of
Aguilar et al. (1994), there are many aspects of land application of biosolids to semiarid
rangelands that have not received adequate attention. The objectives of this research were to
investigate effects of topically-applied biosolids on desert grassland vegetation. Tobosagrass
(Hilaria muticd) and alkali sacaton (Sporobolus airoides), two widely distributed grasses
common throughout the arid and semiarid southwestern United States, were studied. Factors
investigated included rate and season of biosolids application, supplemental irrigation, and
consecutive seasonal or yearly application.
Methods
Experiment I: (One-time only autumn application) Experimental units were 48,0.5-m2
plots in relatively homogeneous tobosograss vegetation on a Stellar sandy clay loam soil. Plots
were established in August, 1992. Soils were sampled and analyzed for a suite of nutrients and
metals prior to application of biosolids. Initial standing crop was harvested by hand clipping to
a 5-cm stubble height; forage samples were oven dried and weighed to the nearest 0.01 g.
Biosolids were applied in September, 1992. Treatments included 4 rates of biosolids (0, 6.7,
33.6, and 89.7 Mg/ha) and 2 levels of irrigation (supplemental irrigation provided or not
provided) in a factorial arrangement of a completely randomized design with 6 replications.
Supplemental irrigation was provided on 3 occasions during the fall of 1992, on 3 occasions
during the 1993 growing season, and on 6 occasions during the 1994 growing season (1.25
cm/application).
Standing crop was harvested at the end of the 1993 and 1994 growing seasons by hand clipping
to a 5-cm stubble height. Forage samples were oven dried and weighed to the nearest 0.01 g.
Experiment II: (Once per year seasonal application)
Experimental units were 960, 1-m2 plots, established in tobosograss (n=480) or alkali sacaton
(n=480) vegetation on a Stellar sandy clay loam soil. In each plot, biosolids were applied to a
0.85 m2 area. Plots were established in winter 1993. Initial standing crop was harvested as in
Experiment I.
Treatments included biosolids rates (0, 6.7,17.9, and 89.7 Mg/ha), supplemental irrigation (as
in Experiment I), season of application (dormant or growing season), and number of years of
consecutive application (1, 2, 3, or 4 years). The experiment was setup as a split plot design,
with season and years of application as main plot factors (in a factorial combination) and
biosolids rate and irrigation as subplot factors (in a factorial combination) with 6 replications.
Biosolids were applied in early March 1993 and late January 1994 in dormant season
applications, and in early July 1993 and 1994 in growing season applications. Data from the first
2 years of the study are reported here. Standing crop was harvested in 1993 and 1994 as in
Experiment I.
1-2
image:
Despite the extensive findings of Fresquez et al. (1990a, b; 1991) and the ongoing work of
Aguilar et al. (1994), there are many aspects of land application of biosolids to semiarid
rangelands that have not received adequate attention. The objectives of this research were to
investigate effects of topically-applied biosolids on desert grassland vegetation. Tobosagrass
(Hilaria muticd) and alkali sacaton (Sporobolus airoides), two widely distributed grasses
common throughout the arid and semiarid southwestern United States, were studied. Factors
investigated included rate and season of biosolids application, supplemental irrigation, and
consecutive seasonal or yearly application.
Methods
Experiment I: (One-time only autumn application) Experimental units were 48,0.5-m2
plots in relatively homogeneous tobosograss vegetation on a Stellar sandy clay loam soil. Plots
were established in August, 1992. Soils were sampled and analyzed for a suite of nutrients and
metals prior to application of biosolids. Initial standing crop was harvested by hand clipping to
a 5-cm stubble height; forage samples were oven dried and weighed to the nearest 0.01 g.
Biosolids were applied in September, 1992. Treatments included 4 rates of biosolids (0, 6.7,
33.6, and 89.7 Mg/ha) and 2 levels of irrigation (supplemental irrigation provided or not
provided) in a factorial arrangement of a completely randomized design with 6 replications.
Supplemental irrigation was provided on 3 occasions during the fall of 1992, on 3 occasions
during the 1993 growing season, and on 6 occasions during the 1994 growing season (1.25
cm/application).
Standing crop was harvested at the end of the 1993 and 1994 growing seasons by hand clipping
to a 5-cm stubble height. Forage samples were oven dried and weighed to the nearest 0.01 g.
Experiment II: (Once per year seasonal application)
Experimental units were 960, 1-m2 plots, established in tobosograss (n=480) or alkali sacaton
(n=480) vegetation on a Stellar sandy clay loam soil. In each plot, biosolids were applied to a
0.85 m2 area. Plots were established in winter 1993. Initial standing crop was harvested as in
Experiment I.
Treatments included biosolids rates (0, 6.7,17.9, and 89.7 Mg/ha), supplemental irrigation (as
in Experiment I), season of application (dormant or growing season), and number of years of
consecutive application (1, 2, 3, or 4 years). The experiment was setup as a split plot design,
with season and years of application as main plot factors (in a factorial combination) and
biosolids rate and irrigation as subplot factors (in a factorial combination) with 6 replications.
Biosolids were applied in early March 1993 and late January 1994 in dormant season
applications, and in early July 1993 and 1994 in growing season applications. Data from the first
2 years of the study are reported here. Standing crop was harvested in 1993 and 1994 as in
Experiment I.
1-2
image:
 Experiment III: (Twice per year seasonal applications)
Experimental units were 384, 1-m2 plots established in relatively homogeneous tobosograss
vegetation in a Stellar sandy clay loam. Plots were established in winter 1994. Initial standing
crop was harvested as in Experiment I.
Treatments included biosolids rate (0, 6.7,17.9 or 33.7 Mg/ha), supplemental irrigation (as in
Experiment I), season of application (dormant and growing season or spring and growing
season), and number of years of consecutive application (1,2,3 or 4 years). The experiment was
set up as a split plot design, with season and years of application as main plot factors (in a
factorial combination) and biosolids rate and irrigation as subsplot factors (in a factorial
combination) with 6 replications. Biosolids were applied in late January, 1994; mid-April, 1994;
and early July 1994. Standing crop in 1994 was harvested as in Experiment I.
Statistical Analyses
Standing crop data from each experiment were analyzed with analysis of variance. Standing
crop data for Experiments I and II were nonnormally distributed on the observed scale but
normally distributed on a logarithmic scale (normality tested with the Shapino-Wilk (1965)
Test). Homogeneity of variance was tested with Levene's (1960) test. Statistical analyses were
completed on the log scale; however, back-transformed (geometric) means are presented.
Fisher's LSD test was used to separate treatment means.
Results
Biosolids Analyses
Biosolids analyses used in this research are summarized in Table 1. Each biosolids application
necessarily used a different batch of biosolids. In general, however, biosolids used in these
experiments were similar in quality.
Rainfall Conditions
Monthly precipitation during 1993 equalled or exceeded long term averages throughout the year.
In contrast, monthly rainfall during 1994 was below average throughout the year. Thus, 1993
and 1994 represent favorable and unfavorable conditions, respectively, with respect to soil
moisture and plant growth.
Experiment I: One-Time-Only Autumn Application Initial Soil Analyses
At the beginning of the study, experimental units were homogeneous with respect to soil pH, EC,
Na, Ca, Mg, SAR, exchangeable Na, organic matter, P, K, TKN, NH4-N, Cd, Pb, B, Mn, Cu,
Ni and Zn in the surface horizon. In the B horizon, plots that were to receive 0 and 6.7 Mg/ha
of biosolids had higher Ni, and plots that were to receive 0 Mg/ha had higher Zn. These few
differences were present in the soil prior to biosolids application.
1-3
image:
Experiment III: (Twice per year seasonal applications)
Experimental units were 384, 1-m2 plots established in relatively homogeneous tobosograss
vegetation in a Stellar sandy clay loam. Plots were established in winter 1994. Initial standing
crop was harvested as in Experiment I.
Treatments included biosolids rate (0, 6.7,17.9 or 33.7 Mg/ha), supplemental irrigation (as in
Experiment I), season of application (dormant and growing season or spring and growing
season), and number of years of consecutive application (1,2,3 or 4 years). The experiment was
set up as a split plot design, with season and years of application as main plot factors (in a
factorial combination) and biosolids rate and irrigation as subsplot factors (in a factorial
combination) with 6 replications. Biosolids were applied in late January, 1994; mid-April, 1994;
and early July 1994. Standing crop in 1994 was harvested as in Experiment I.
Statistical Analyses
Standing crop data from each experiment were analyzed with analysis of variance. Standing
crop data for Experiments I and II were nonnormally distributed on the observed scale but
normally distributed on a logarithmic scale (normality tested with the Shapino-Wilk (1965)
Test). Homogeneity of variance was tested with Levene's (1960) test. Statistical analyses were
completed on the log scale; however, back-transformed (geometric) means are presented.
Fisher's LSD test was used to separate treatment means.
Results
Biosolids Analyses
Biosolids analyses used in this research are summarized in Table 1. Each biosolids application
necessarily used a different batch of biosolids. In general, however, biosolids used in these
experiments were similar in quality.
Rainfall Conditions
Monthly precipitation during 1993 equalled or exceeded long term averages throughout the year.
In contrast, monthly rainfall during 1994 was below average throughout the year. Thus, 1993
and 1994 represent favorable and unfavorable conditions, respectively, with respect to soil
moisture and plant growth.
Experiment I: One-Time-Only Autumn Application Initial Soil Analyses
At the beginning of the study, experimental units were homogeneous with respect to soil pH, EC,
Na, Ca, Mg, SAR, exchangeable Na, organic matter, P, K, TKN, NH4-N, Cd, Pb, B, Mn, Cu,
Ni and Zn in the surface horizon. In the B horizon, plots that were to receive 0 and 6.7 Mg/ha
of biosolids had higher Ni, and plots that were to receive 0 Mg/ha had higher Zn. These few
differences were present in the soil prior to biosolids application.
1-3
image:
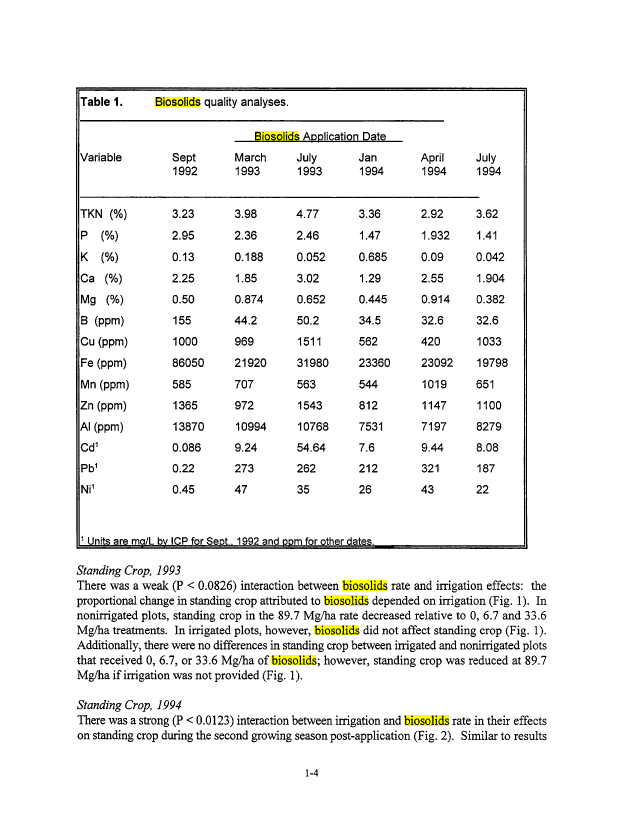
 Table 1.
Biosolids quality analyses.
Biosolids AoDlication Date
Variable
TKN (%)
P (%)
K (%)
Ca (%)
Mg (%)
B (ppm)
Cu (ppm)
Fe (ppm)
Mn (ppm)
Zn (ppm)
Al (ppm)
Cd1
Pb1
Ni1
1 Units are ma/L
Sept
1992
3.23
2.95
0.13
2.25
0.50
155
1000
86050
585
1365
13870
0.086
0.22
0.45
bv ICP for Sect.
March
1993
3.98
2.36
0.188
1.85
0.874
44.2
969
21920
707
972
10994
9.24
273
47
1992 and
July
1993
4.77
2.46
0.052
3.02
0.652
50.2
1511
31980
563
1543
10768
54.64
262
35
Dom for other
Jan
1994
3.36
1.47
0.685
1.29
0.445
34.5
562
23360
544
812
7531
7.6
212
26
dates.
April
1994
2.92
1.932
0.09
2.55
0.914
32.6
420
23092
1019
1147
7197
9.44
321
43
July
1994
3.62
1.41
0.042
1.904
0.382
32.6
1033
19798
651
1100
8279
8.08
187
22
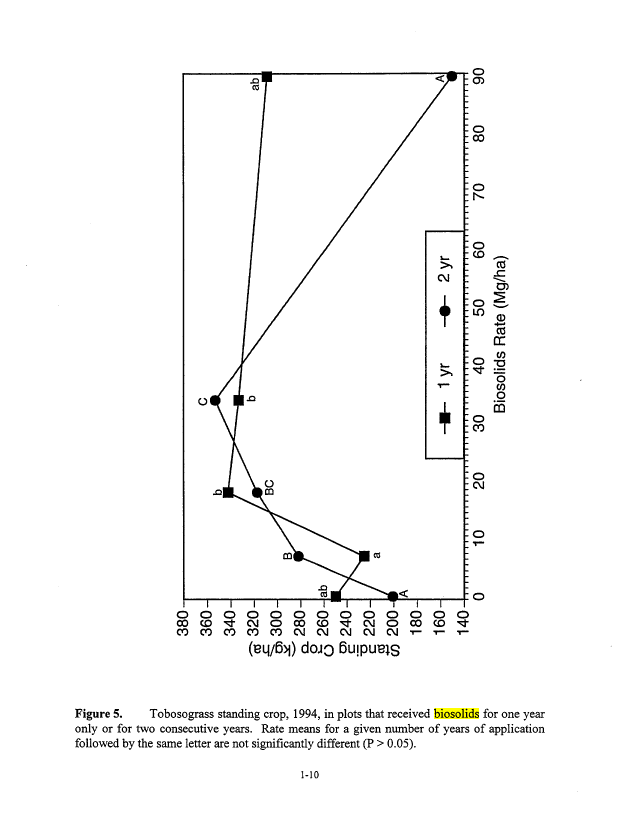
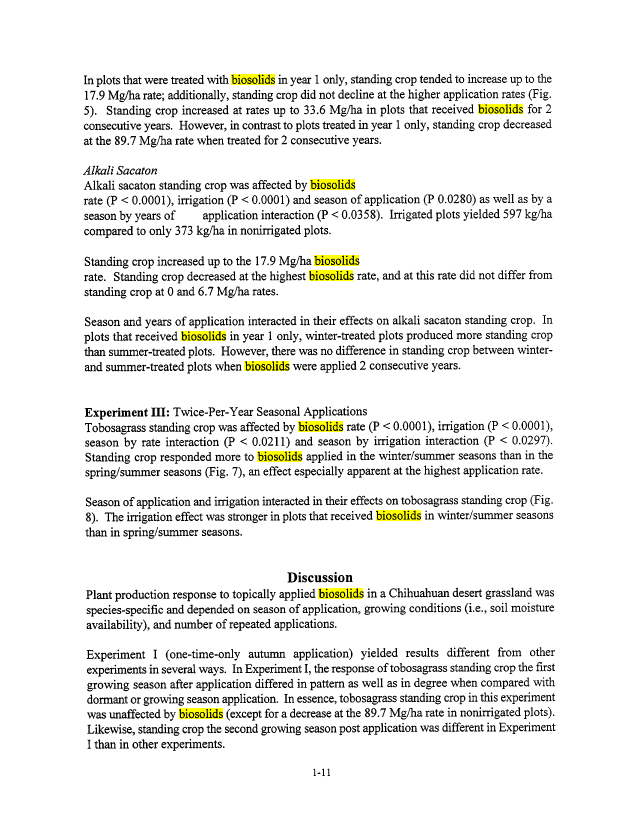
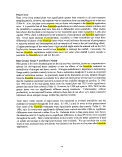
Standing Crop, 1993
There was a weak (P < 0.0826) interaction between biosolids rate and irrigation effects: the
proportional change in standing crop attributed to biosolids depended on irrigation (Fig. 1). In
nonirrigated plots, standing crop in the 89.7 Mg/ha rate decreased relative to 0, 6.7 and 33.6
Mg/ha treatments. In irrigated plots, however, biosolids did not affect standing crop (Fig. 1).
Additionally, there were no differences in standing crop between irrigated and nonirrigated plots
that received 0, 6.7, or 33.6 Mg/ha of biosolids; however, standing crop was reduced at 89.7
Mg/ha if irrigation was not provided (Fig. 1).
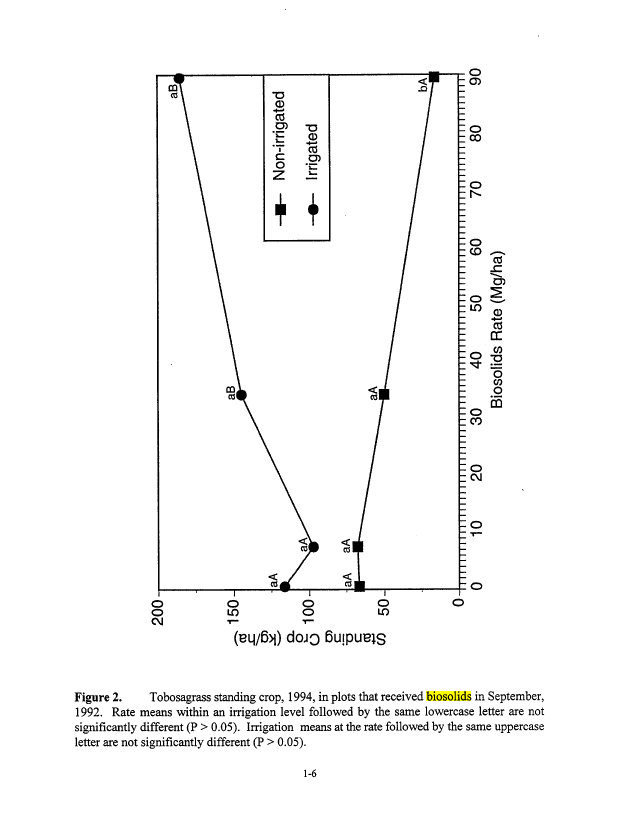
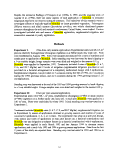
Standing Crop, 1994
There was a strong (P < 0.0123) interaction between irrigation and biosolids rate in their effects
on standing crop during the second growing season post-application (Fig. 2). Similar to results
1-4
image:
Table 1.
Biosolids quality analyses.
Biosolids AoDlication Date
Variable
TKN (%)
P (%)
K (%)
Ca (%)
Mg (%)
B (ppm)
Cu (ppm)
Fe (ppm)
Mn (ppm)
Zn (ppm)
Al (ppm)
Cd1
Pb1
Ni1
1 Units are ma/L
Sept
1992
3.23
2.95
0.13
2.25
0.50
155
1000
86050
585
1365
13870
0.086
0.22
0.45
bv ICP for Sect.
March
1993
3.98
2.36
0.188
1.85
0.874
44.2
969
21920
707
972
10994
9.24
273
47
1992 and
July
1993
4.77
2.46
0.052
3.02
0.652
50.2
1511
31980
563
1543
10768
54.64
262
35
Dom for other
Jan
1994
3.36
1.47
0.685
1.29
0.445
34.5
562
23360
544
812
7531
7.6
212
26
dates.
April
1994
2.92
1.932
0.09
2.55
0.914
32.6
420
23092
1019
1147
7197
9.44
321
43
July
1994
3.62
1.41
0.042
1.904
0.382
32.6
1033
19798
651
1100
8279
8.08
187
22
Standing Crop, 1993
There was a weak (P < 0.0826) interaction between biosolids rate and irrigation effects: the
proportional change in standing crop attributed to biosolids depended on irrigation (Fig. 1). In
nonirrigated plots, standing crop in the 89.7 Mg/ha rate decreased relative to 0, 6.7 and 33.6
Mg/ha treatments. In irrigated plots, however, biosolids did not affect standing crop (Fig. 1).
Additionally, there were no differences in standing crop between irrigated and nonirrigated plots
that received 0, 6.7, or 33.6 Mg/ha of biosolids; however, standing crop was reduced at 89.7
Mg/ha if irrigation was not provided (Fig. 1).
Standing Crop, 1994
There was a strong (P < 0.0123) interaction between irrigation and biosolids rate in their effects
on standing crop during the second growing season post-application (Fig. 2). Similar to results
1-4
image:
 Figure 1. Tobosagrass standing crop, 1993, in plots that received biosolids in September,
1992. Rate means within an irrigation level followed by the same lowercase letter are not
significantly different (P > 0.05). Irrigation means at the rate followed by the same uppercase
letter are not significantly different (P > 0.05).
1-5
image:
Figure 1. Tobosagrass standing crop, 1993, in plots that received biosolids in September,
1992. Rate means within an irrigation level followed by the same lowercase letter are not
significantly different (P > 0.05). Irrigation means at the rate followed by the same uppercase
letter are not significantly different (P > 0.05).
1-5
image:
 CD
TS
DC
CO
!2
"o
CO
g
CD
(ei|/6>|)
Figure 2. Tobosagrass standing crop, 1994, in plots that received biosolids in September,
1992. Rate means within an irrigation level followed by the same lowercase letter are not
significantly different (P > 0.05). Irrigation means at the rate followed by the same uppercase
letter are not significantly different (P > 0.05).
1-6
image:
CD
TS
DC
CO
!2
"o
CO
g
CD
(ei|/6>|)
Figure 2. Tobosagrass standing crop, 1994, in plots that received biosolids in September,
1992. Rate means within an irrigation level followed by the same lowercase letter are not
significantly different (P > 0.05). Irrigation means at the rate followed by the same uppercase
letter are not significantly different (P > 0.05).
1-6
image:
 in 1993, standing crop was reduced in nonirrigated plots at the 89.7 Mg/ha rate compared to 0,
6.7 and 33.6 Mg/ha treatments. Also, biosolids did not affect standing crop in irrigated plots.
Additionally, there were no differences in standing crop between irrigated and nonirrigated plots
that received 0 or 6.7 Mg/ha of biosolids. However, standing crop was increased under irrigated
conditions when 33.6 or 89.7 Mg/ha rates were applied compared to nonirrigated conditioned.
Comparison of Standing Crop Between 1993 and 1994
Standing crop in nonirrigated control plots was 22 times greater in 1993 than in 1994, a result
attributed to the relatively poor precipitation conditions in 1994. During 1994 the proportional
change in standing crop as biosolids increased was more strongly dependent on irrigation than
in 1993. Also, the effect of irrigation in increasing standing crop was stronger (P < 0.0001) in
1994 than in 1993 (P < 0.2638).
Experiment II: Once-Per-Year Seasonal Applications First Growing Season Post Application
Tobosagrass
Biosolids rate (P < 0.0001), season of application (P < 0.0013), and irrigation (P < 0.0001)
affected tobosagrass standing crop the first growing season after biosolids application;
additionally, season and rate of application interacted in their effects on standing crop (Fig. 3).
Irrigated plots produced 1,979 kg/ha of standing crop whereas nonirrigated plots produced only
1,736 kg/ha.
In plots that received biosolids in the summer of 1993, standing crop was similar in 0 and 6.7
Mg/ha treatment; additionally, standing crop at these rates was less than standing crop at
17.9, 33.6 or 89.7 Mg/ha (Fig. 3). In plots that received biosolids in the winter of 1993,
however, standing crop was successively increased by 6.7,17.9 and 33.6 Mg/ha of biosolids.
Also, standing crop at 89.7 Mg/ha did not differ from standing crop at 17.9 or 33.6 Mg/ha rates.
Alkali Sacaton
Biosolids rate (P < 0.0001), season of application (P < 0.0001), and irrigation (P < 0.0001)
affected alkali sacaton standing crop in the first growing season after biosolid application; also,
season and rate of application interacted (P < 0.0001) in their effects on standing crop (Fig. 4).
Irrigated plots produced 1,921 kg/ha whereas nonirrigated plots produced 1,748 kg/ha.
There was not a strong rate response to biosolids application in plots that were treated in the
summer of 1993 (Fig. 4). In contrast, there was a strong rate response in plots that received
biosolids in winter, 1993. Standing crop was successively increased by 6.7 and 17.9 Mg/ha;
additionally, standing crop at the 89.7 Mg/ha rate did not differ from standing crop at the 33.6
Mg/ha rate.
Second Growing Season Post-Application
Tobosagrass
Tobosagrass standing crop in 1994 was affected by biosolids rate (P < 0.0001) and irrigation (P
< 0.0001) effects; additionally, there was a rate of application by years of application interaction
(P < 0.0349) (Fig. 5). Irrigated plots produced 393 kg/ha of standing crop compared to only 197
kg/ha in nonirrigated plots.
1-7
image:
in 1993, standing crop was reduced in nonirrigated plots at the 89.7 Mg/ha rate compared to 0,
6.7 and 33.6 Mg/ha treatments. Also, biosolids did not affect standing crop in irrigated plots.
Additionally, there were no differences in standing crop between irrigated and nonirrigated plots
that received 0 or 6.7 Mg/ha of biosolids. However, standing crop was increased under irrigated
conditions when 33.6 or 89.7 Mg/ha rates were applied compared to nonirrigated conditioned.
Comparison of Standing Crop Between 1993 and 1994
Standing crop in nonirrigated control plots was 22 times greater in 1993 than in 1994, a result
attributed to the relatively poor precipitation conditions in 1994. During 1994 the proportional
change in standing crop as biosolids increased was more strongly dependent on irrigation than
in 1993. Also, the effect of irrigation in increasing standing crop was stronger (P < 0.0001) in
1994 than in 1993 (P < 0.2638).
Experiment II: Once-Per-Year Seasonal Applications First Growing Season Post Application
Tobosagrass
Biosolids rate (P < 0.0001), season of application (P < 0.0013), and irrigation (P < 0.0001)
affected tobosagrass standing crop the first growing season after biosolids application;
additionally, season and rate of application interacted in their effects on standing crop (Fig. 3).
Irrigated plots produced 1,979 kg/ha of standing crop whereas nonirrigated plots produced only
1,736 kg/ha.
In plots that received biosolids in the summer of 1993, standing crop was similar in 0 and 6.7
Mg/ha treatment; additionally, standing crop at these rates was less than standing crop at
17.9, 33.6 or 89.7 Mg/ha (Fig. 3). In plots that received biosolids in the winter of 1993,
however, standing crop was successively increased by 6.7,17.9 and 33.6 Mg/ha of biosolids.
Also, standing crop at 89.7 Mg/ha did not differ from standing crop at 17.9 or 33.6 Mg/ha rates.
Alkali Sacaton
Biosolids rate (P < 0.0001), season of application (P < 0.0001), and irrigation (P < 0.0001)
affected alkali sacaton standing crop in the first growing season after biosolid application; also,
season and rate of application interacted (P < 0.0001) in their effects on standing crop (Fig. 4).
Irrigated plots produced 1,921 kg/ha whereas nonirrigated plots produced 1,748 kg/ha.
There was not a strong rate response to biosolids application in plots that were treated in the
summer of 1993 (Fig. 4). In contrast, there was a strong rate response in plots that received
biosolids in winter, 1993. Standing crop was successively increased by 6.7 and 17.9 Mg/ha;
additionally, standing crop at the 89.7 Mg/ha rate did not differ from standing crop at the 33.6
Mg/ha rate.
Second Growing Season Post-Application
Tobosagrass
Tobosagrass standing crop in 1994 was affected by biosolids rate (P < 0.0001) and irrigation (P
< 0.0001) effects; additionally, there was a rate of application by years of application interaction
(P < 0.0349) (Fig. 5). Irrigated plots produced 393 kg/ha of standing crop compared to only 197
kg/ha in nonirrigated plots.
1-7
image:
 CM CM T
(BL|/6>j) dOJQ 6UJPUBJS
Figure 3. Tobosagrass standing crop, 1993, in plots that received biosolids in winter or
summer, 1993. Rate means within a season of application followed by the same letter are not
significantly different (P > 0.05).
1-8
image:
CM CM T
(BL|/6>j) dOJQ 6UJPUBJS
Figure 3. Tobosagrass standing crop, 1993, in plots that received biosolids in winter or
summer, 1993. Rate means within a season of application followed by the same letter are not
significantly different (P > 0.05).
1-8
image:
 Figure 4. Alkali sacaton standing crop, 1993, in plots that received biosolids in winter or
summer, 1993. Rate means within a season of application followed by the same letter are not
significantly different (P > 0.05).
1-9
image:
Figure 4. Alkali sacaton standing crop, 1993, in plots that received biosolids in winter or
summer, 1993. Rate means within a season of application followed by the same letter are not
significantly different (P > 0.05).
1-9
image:
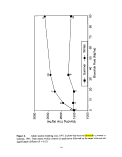 OOOOOOCOCO(MC\ICV]C\10j
dOJQ BUj
Figure 5. Tobosograss standing crop, 1994, in plots that received biosolids for one year
only or for two consecutive years. Rate means for a given number of years of application
followed by the same letter are not significantly different (P > 0.05).
1-10
image:
OOOOOOCOCO(MC\ICV]C\10j
dOJQ BUj
Figure 5. Tobosograss standing crop, 1994, in plots that received biosolids for one year
only or for two consecutive years. Rate means for a given number of years of application
followed by the same letter are not significantly different (P > 0.05).
1-10
image:
 In plots that were treated with biosolids in year 1 only, standing crop tended to increase up to the
17.9 Mg/ha rate; additionally, standing crop did not decline at the higher application rates (Fig.
5). Standing crop increased at rates up to 33.6 Mg/ha in plots that received biosolids for 2
consecutive years. However, in contrast to plots treated in year 1 only, standing crop decreased
at the 89.7 Mg/ha rate when treated for 2 consecutive years.
Alkali Sacaton
Alkali sacaton standing crop was affected by biosolids
rate (P < 0.0001), irrigation (P < 0.0001) and season of application (P 0.0280) as well as by a
season by years of application interaction (P < 0.0358). Irrigated plots yielded 597 kg/ha
compared to only 373 kg/ha in nonirrigated plots.
Standing crop increased up to the 17.9 Mg/ha biosolids
rate. Standing crop decreased at the highest biosolids rate, and at this rate did not differ from
standing crop at 0 and 6.7 Mg/ha rates.
Season and years of application interacted in their effects on alkali sacaton standing crop. In
plots that received biosolids in year 1 only, winter-treated plots produced more standing crop
than summer-treated plots. However, there was no difference in standing crop between winter-
and summer-treated plots when biosolids were applied 2 consecutive years.
Experiment III: Twice-Per-Year Seasonal Applications
Tobosagrass standing crop was affected by biosolids rate (P < 0.0001), irrigation (P < 0.0001),
season by rate interaction (P < 0.0211) and season by irrigation interaction (P < 0.0297).
Standing crop responded more to biosolids applied in the winter/summer seasons than in the
spring/summer seasons (Fig. 7), an effect especially apparent at the highest application rate.
Season of application and irrigation interacted in their effects on tobosagrass standing crop (Fig.
8). The irrigation effect was stronger in plots that received biosolids in winter/summer seasons
than in spring/summer seasons.
Discussion
Plant production response to topically applied biosolids in a Chihuahuan desert grassland was
species-specific and depended on season of application, growing conditions (i.e., soil moisture
availability), and number of repeated applications.
Experiment I (one-time-only autumn application) yielded results different from other
experiments in several ways. In Experiment I, the response of tobosagrass standing crop the first
growing season after application differed in pattern as well as in degree when compared with
dormant or growing season application. In essence, tobosagrass standing crop in this experiment
was unaffected by biosolids (except for a decrease at the 89.7 Mg/ha rate in nonirrigated plots).
Likewise, standing crop the second growing season post application was different in Experiment
I than in other experiments.
i-ll
image:
In plots that were treated with biosolids in year 1 only, standing crop tended to increase up to the
17.9 Mg/ha rate; additionally, standing crop did not decline at the higher application rates (Fig.
5). Standing crop increased at rates up to 33.6 Mg/ha in plots that received biosolids for 2
consecutive years. However, in contrast to plots treated in year 1 only, standing crop decreased
at the 89.7 Mg/ha rate when treated for 2 consecutive years.
Alkali Sacaton
Alkali sacaton standing crop was affected by biosolids
rate (P < 0.0001), irrigation (P < 0.0001) and season of application (P 0.0280) as well as by a
season by years of application interaction (P < 0.0358). Irrigated plots yielded 597 kg/ha
compared to only 373 kg/ha in nonirrigated plots.
Standing crop increased up to the 17.9 Mg/ha biosolids
rate. Standing crop decreased at the highest biosolids rate, and at this rate did not differ from
standing crop at 0 and 6.7 Mg/ha rates.
Season and years of application interacted in their effects on alkali sacaton standing crop. In
plots that received biosolids in year 1 only, winter-treated plots produced more standing crop
than summer-treated plots. However, there was no difference in standing crop between winter-
and summer-treated plots when biosolids were applied 2 consecutive years.
Experiment III: Twice-Per-Year Seasonal Applications
Tobosagrass standing crop was affected by biosolids rate (P < 0.0001), irrigation (P < 0.0001),
season by rate interaction (P < 0.0211) and season by irrigation interaction (P < 0.0297).
Standing crop responded more to biosolids applied in the winter/summer seasons than in the
spring/summer seasons (Fig. 7), an effect especially apparent at the highest application rate.
Season of application and irrigation interacted in their effects on tobosagrass standing crop (Fig.
8). The irrigation effect was stronger in plots that received biosolids in winter/summer seasons
than in spring/summer seasons.
Discussion
Plant production response to topically applied biosolids in a Chihuahuan desert grassland was
species-specific and depended on season of application, growing conditions (i.e., soil moisture
availability), and number of repeated applications.
Experiment I (one-time-only autumn application) yielded results different from other
experiments in several ways. In Experiment I, the response of tobosagrass standing crop the first
growing season after application differed in pattern as well as in degree when compared with
dormant or growing season application. In essence, tobosagrass standing crop in this experiment
was unaffected by biosolids (except for a decrease at the 89.7 Mg/ha rate in nonirrigated plots).
Likewise, standing crop the second growing season post application was different in Experiment
I than in other experiments.
i-ll
image:
 CO
0
15
DC
CO
CO
g
to
Figure 6. Alkali sacaton standing crop, 1994. Rate means followed by the same letter are
not significantly different (P > 0.05).
1-12
image:
CO
0
15
DC
CO
CO
g
to
Figure 6. Alkali sacaton standing crop, 1994. Rate means followed by the same letter are
not significantly different (P > 0.05).
1-12
image:
 I I I 1 I I I
ooooooooooo
CQ^j-OJOCOCO'tfCJOOOCQ
OOOOCOOOOJCM<N<NC\IT-T-
dOJQ 6U|
Figure?. Tobosagrass standing crop, 1994, in plots that received biosolids in
winter/summer or spring/summer seasons. Rate means within a seasonal application treatment
followed by the same letter are not significantly different (P > 0.05).
1-13
image:
I I I 1 I I I
ooooooooooo
CQ^j-OJOCOCO'tfCJOOOCQ
OOOOCOOOOJCM<N<NC\IT-T-
dOJQ 6U|
Figure?. Tobosagrass standing crop, 1994, in plots that received biosolids in
winter/summer or spring/summer seasons. Rate means within a seasonal application treatment
followed by the same letter are not significantly different (P > 0.05).
1-13
image:
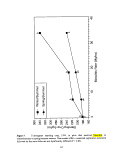 Figure 8. Tobosagrass standing crop, 1994. Irrigation means within a seasonal application
treatment followed by the same letter are not significantly different (P > 0.05).
1-14
image:
Figure 8. Tobosagrass standing crop, 1994. Irrigation means within a seasonal application
treatment followed by the same letter are not significantly different (P > 0.05).
1-14
image:
 Several factors probably contribute to these differences. In Experiment I, experimental units
were 0.5 m2 whereas in Experiments II and III, plots 0.85 m2 in area were treated with biosolids.
Although application rates were similar (e.g., 6.7 Mg/ha were applied in both studies), the actual
amount of surface area treated with biosolids was less in Experiment I. This "treated area effect"
(which is currently being investigated in a separate experiment) may have influenced results.
In addition, experimental units in Experiment I were in an area approximately 0.5 acre in
size. As a precaution against accidental range fire, a fire line was bladed around this
experimental area. This line effectively prevented any overland flow of water from natural
rainfall events from reaching the experimental plots: in a sense, these plots were physically
located in a "rain shadow".
Finally, Experiment I was a smaller experiment than Experiment II: a biosolids rate/irrigation
treatment mean was based on n=6 observations in Experiment I. In contrast, in year 1 a biosolids
rate/irrigation mean was based on n=24 observations in Experiment II (because this study was
designed to investigate up to 4 consecutive years of application). Standing crop was lognormally
distributed, and empirical observations suggested that means may be expected to increase as
sample size increases. This effect, however, is likely to be complicated by the "treated area
effect" discussed above.
Both tobosagrass and alkali sacaton responded more strongly the first growing season after
dormant season application than after growing season application of biosolids. In fact, there was
very little alkali sacaton response to summer-applied biosolids in the first year. Although
irrigation effects were significant, irrigation was not involved in any interactions. Thus, the
response of these species to biosolids was independent of irrigation effects.
Although the reasons underlying the more positive response to dormant season application are
unclear, and this research was not designed to elucidate mechanisms involved in this
phenomenon, it is likely that both physical and chemical (i.e. nutritional) effects are involved.
From a physical standpoint, topically applied biosolids may act as a mulch, reducing soil
moisture loss during the spring between dormant season application and the onset of the growing
season. Additionally, with a C:N ratio of approximately 12:1, topically applied biosolids may
act to stimulate soil microflora, the net effect of which is more available soil nutrients at the
beginning of the growing season. This effect may be greater for plots treated with biosolids 6
months before the onset of the growing season than for plots treated 1-2 weeks before the onset
of the growing season.
For rates up to 33.6 Mg/ha, there was little difference in second-year tobosagrass standing crop
for plots treated one year only or for 2 consecutive years. However, second-year standing crop
was significantly reduced by 2 consecutive years at the 89.7 Mg/ha rate. The physical barrier
created by 2 consecutive years of biosolids at this rate may have prevented precipitation from
reaching the soil surface, an effect especially detrimental during a dry year. Similar results were
shown by alkali sacaton.
When biosolids were applied twice per year, tobosagrass standing crop was greater under
dormant/growing season application than under spring/growing season application. In addition,
1-15
image:
Several factors probably contribute to these differences. In Experiment I, experimental units
were 0.5 m2 whereas in Experiments II and III, plots 0.85 m2 in area were treated with biosolids.
Although application rates were similar (e.g., 6.7 Mg/ha were applied in both studies), the actual
amount of surface area treated with biosolids was less in Experiment I. This "treated area effect"
(which is currently being investigated in a separate experiment) may have influenced results.
In addition, experimental units in Experiment I were in an area approximately 0.5 acre in
size. As a precaution against accidental range fire, a fire line was bladed around this
experimental area. This line effectively prevented any overland flow of water from natural
rainfall events from reaching the experimental plots: in a sense, these plots were physically
located in a "rain shadow".
Finally, Experiment I was a smaller experiment than Experiment II: a biosolids rate/irrigation
treatment mean was based on n=6 observations in Experiment I. In contrast, in year 1 a biosolids
rate/irrigation mean was based on n=24 observations in Experiment II (because this study was
designed to investigate up to 4 consecutive years of application). Standing crop was lognormally
distributed, and empirical observations suggested that means may be expected to increase as
sample size increases. This effect, however, is likely to be complicated by the "treated area
effect" discussed above.
Both tobosagrass and alkali sacaton responded more strongly the first growing season after
dormant season application than after growing season application of biosolids. In fact, there was
very little alkali sacaton response to summer-applied biosolids in the first year. Although
irrigation effects were significant, irrigation was not involved in any interactions. Thus, the
response of these species to biosolids was independent of irrigation effects.
Although the reasons underlying the more positive response to dormant season application are
unclear, and this research was not designed to elucidate mechanisms involved in this
phenomenon, it is likely that both physical and chemical (i.e. nutritional) effects are involved.
From a physical standpoint, topically applied biosolids may act as a mulch, reducing soil
moisture loss during the spring between dormant season application and the onset of the growing
season. Additionally, with a C:N ratio of approximately 12:1, topically applied biosolids may
act to stimulate soil microflora, the net effect of which is more available soil nutrients at the
beginning of the growing season. This effect may be greater for plots treated with biosolids 6
months before the onset of the growing season than for plots treated 1-2 weeks before the onset
of the growing season.
For rates up to 33.6 Mg/ha, there was little difference in second-year tobosagrass standing crop
for plots treated one year only or for 2 consecutive years. However, second-year standing crop
was significantly reduced by 2 consecutive years at the 89.7 Mg/ha rate. The physical barrier
created by 2 consecutive years of biosolids at this rate may have prevented precipitation from
reaching the soil surface, an effect especially detrimental during a dry year. Similar results were
shown by alkali sacaton.
When biosolids were applied twice per year, tobosagrass standing crop was greater under
dormant/growing season application than under spring/growing season application. In addition,
1-15
image:
 there was a greater response to irrigation in plots that received biosolids in dormant/growing than
in spring/growing season applications. These results are generally consistent with findings from
the once/year applications (Experiment II).
Conclusions
Topically applied biosolids generally increased standing crop of tobosagrass and alkali sacaton.
This effect was more pronounced when biosolids were applied in the dormant season than when
they were applied just prior to the onset of growth. Two consecutive years of annual biosolids
application at 89.7 Mg/ha reduced plant growth. This effect was probably related to physical
consequences of 10 cm of biosolids laying on the soil surface where incoming rainfall may be
intercepted and thereby prevented from reaching the soil surface. In plots that received biosolids
twice per year, standing crop was greater with dormant/growing applications than with
spring/growing season applications. In general, these results suggest that there is a positive
production response for tobosagrass and alkali sacaton applied at rates up to 17.9 Mg/ha.
1-16
image:
there was a greater response to irrigation in plots that received biosolids in dormant/growing than
in spring/growing season applications. These results are generally consistent with findings from
the once/year applications (Experiment II).
Conclusions
Topically applied biosolids generally increased standing crop of tobosagrass and alkali sacaton.
This effect was more pronounced when biosolids were applied in the dormant season than when
they were applied just prior to the onset of growth. Two consecutive years of annual biosolids
application at 89.7 Mg/ha reduced plant growth. This effect was probably related to physical
consequences of 10 cm of biosolids laying on the soil surface where incoming rainfall may be
intercepted and thereby prevented from reaching the soil surface. In plots that received biosolids
twice per year, standing crop was greater with dormant/growing applications than with
spring/growing season applications. In general, these results suggest that there is a positive
production response for tobosagrass and alkali sacaton applied at rates up to 17.9 Mg/ha.
1-16
image:
 Acknowledgements
MERCO-A Joint Venture provided access to study areas and partial funding for this
research.
David B. Wester, Associate Professor, Mark W. Benton, Pedro Jurado, Graduate
Research Assistants, Richard G. Gatewood, former Graduate Research Assistant, and Ronald E.
Sosebee, Professor, Department of Range and Wildlife Management, Texas Tech University,
Lubbock, Texas, 79409. This is contribution number T-9-732, College of Agricultural Sciences
and Natural Resources, Texas Tech University.
Literature Cited
Aguilar, R., S.R. Loftin, T.J. Ward, K.A. Stevens, and J.R. Gosz. 1994.
Sewage sludge application in semiarid grasslands: effects vegetation and water quality.
New Mexico Water Resources Research Institute Tech. Completion Report, Acct. No.
013456999.
Fresquez, P.R., R. Aguilar, R.E. Francis, and E.F. Aldon.
1991. Heavy metal uptake by blue grama growing in degraded semiarid soil amended
with sewage sludge. Water, Air, and Soil Pollution 57-58:903-912.
Fresquez, P.R., R.E. Francis, and G.L. Dennis. 1990a.
Sewage sludge effects on soil and plant quality in a degraded, semiarid grassland. J.
Environ. Qual. 19:423-429.
Fresquez, P.R., R.E. Francis, and G.L. Dennis. 1990b.
Soil and vegetation responses to sewage sludge on a degraded semiarid broom
snakeweed/blue grama plant community. J. Range Manage. 43:325-331.
Levene, H. 1960. Robust tests for equality of variance.
In: Contributions to Probability and Statistics, I. Olkin (ed.), Stanford Univ.
Press, Palo Alto.
Shapiro, S.S. and M.B. Wilk. 1965. An analysis of variance test for nonnormality
(complete samples) Biometrika 52:591-611.
1-17
image:
Acknowledgements
MERCO-A Joint Venture provided access to study areas and partial funding for this
research.
David B. Wester, Associate Professor, Mark W. Benton, Pedro Jurado, Graduate
Research Assistants, Richard G. Gatewood, former Graduate Research Assistant, and Ronald E.
Sosebee, Professor, Department of Range and Wildlife Management, Texas Tech University,
Lubbock, Texas, 79409. This is contribution number T-9-732, College of Agricultural Sciences
and Natural Resources, Texas Tech University.
Literature Cited
Aguilar, R., S.R. Loftin, T.J. Ward, K.A. Stevens, and J.R. Gosz. 1994.
Sewage sludge application in semiarid grasslands: effects vegetation and water quality.
New Mexico Water Resources Research Institute Tech. Completion Report, Acct. No.
013456999.
Fresquez, P.R., R. Aguilar, R.E. Francis, and E.F. Aldon.
1991. Heavy metal uptake by blue grama growing in degraded semiarid soil amended
with sewage sludge. Water, Air, and Soil Pollution 57-58:903-912.
Fresquez, P.R., R.E. Francis, and G.L. Dennis. 1990a.
Sewage sludge effects on soil and plant quality in a degraded, semiarid grassland. J.
Environ. Qual. 19:423-429.
Fresquez, P.R., R.E. Francis, and G.L. Dennis. 1990b.
Soil and vegetation responses to sewage sludge on a degraded semiarid broom
snakeweed/blue grama plant community. J. Range Manage. 43:325-331.
Levene, H. 1960. Robust tests for equality of variance.
In: Contributions to Probability and Statistics, I. Olkin (ed.), Stanford Univ.
Press, Palo Alto.
Shapiro, S.S. and M.B. Wilk. 1965. An analysis of variance test for nonnormality
(complete samples) Biometrika 52:591-611.
1-17
image:
 Evaluation of Sewage Sludge Products for use in sheep
production in Australia: Some preliminary results
D.L.Michalk , LH.Curtis, J.Seaman,
C.M.Langford and GJ.Osborne
Abstract
A grazing experiment was commenced in 1992 in southern New South Wales, Australia,
to assess the benefits and risks associated with the application of sewage waste products
(dewatered cake and N-Viro Soil) to pastures grown on poor soils which are grazed by
sheep. Preliminary results indicate that N, P, Zn, Cu and Ni are the most mobile elements
in these acid (pH[salt]<4.7) soils, and that the concentration of these are most likely to de-
termine the commercial application rate of dewatered cake to pastoral land. Sewage waste
equalled or improved the P, S, Ca and Mg content in plant tops relative to fertilizer, and
also increased Zn and Ni concentrations, but not to phytotoxic levels. Biosolid contami-
nants have not been detected in ground water. Sheep production, product quality and live-
stock health have not been affected by these sewage-induced changes in soil and pasture
after one year of exposure.
Key words: Biosolids, dewatered cake, N-Viro Soil, heavy metals, zinc, copper, sheep,
pastures, acid soil, Australia.
Introduction
The disposal of sewage biosolids is becoming a major economic and environmental prob-
lem, and countries around the world are committing increasing resources to find effective
long-term solutions. In New South Wales (NSW), Australia's most populous state, the
production of residual products from the treatment of sewage and drinking water already
exceeds 150 t (dry weight) per day, with Sydney accounting for almost half of this
biosolids output. In 1990, Finney and Rawlinson reported that 60% of Sydney's wastewa-
ter solids was disposed into the ocean with the balance either incinerated (8%), used for
coal dump rehabilitation (7%) or converted into products for agricultural use (25%). This
level of agricultural use is low compared to some other countries. For example, 1970 sta-
tistics indicated that 40% of biosolids from inland sewage plants in the United Kingdom
was applied to agricultural land (Sterritt and Lester 1980). However, this situation should
change in Australia as disposal of biosolids into the ocean is now prohibited by new anti-
Authors are Senior Research Scientist, Technical Officer, QIC Regional Veterinary
Laboratory, District Livestock Officer and Research Director of Organic Waste Recycling
Unit located at various institutes of NSW Agriculture. Contact address for the senior
author is: Agricultural Research & Veterinary Centre, Forest Road, Orange, NSW, 2800,
Australia.
image:
Evaluation of Sewage Sludge Products for use in sheep
production in Australia: Some preliminary results
D.L.Michalk , LH.Curtis, J.Seaman,
C.M.Langford and GJ.Osborne
Abstract
A grazing experiment was commenced in 1992 in southern New South Wales, Australia,
to assess the benefits and risks associated with the application of sewage waste products
(dewatered cake and N-Viro Soil) to pastures grown on poor soils which are grazed by
sheep. Preliminary results indicate that N, P, Zn, Cu and Ni are the most mobile elements
in these acid (pH[salt]<4.7) soils, and that the concentration of these are most likely to de-
termine the commercial application rate of dewatered cake to pastoral land. Sewage waste
equalled or improved the P, S, Ca and Mg content in plant tops relative to fertilizer, and
also increased Zn and Ni concentrations, but not to phytotoxic levels. Biosolid contami-
nants have not been detected in ground water. Sheep production, product quality and live-
stock health have not been affected by these sewage-induced changes in soil and pasture
after one year of exposure.
Key words: Biosolids, dewatered cake, N-Viro Soil, heavy metals, zinc, copper, sheep,
pastures, acid soil, Australia.
Introduction
The disposal of sewage biosolids is becoming a major economic and environmental prob-
lem, and countries around the world are committing increasing resources to find effective
long-term solutions. In New South Wales (NSW), Australia's most populous state, the
production of residual products from the treatment of sewage and drinking water already
exceeds 150 t (dry weight) per day, with Sydney accounting for almost half of this
biosolids output. In 1990, Finney and Rawlinson reported that 60% of Sydney's wastewa-
ter solids was disposed into the ocean with the balance either incinerated (8%), used for
coal dump rehabilitation (7%) or converted into products for agricultural use (25%). This
level of agricultural use is low compared to some other countries. For example, 1970 sta-
tistics indicated that 40% of biosolids from inland sewage plants in the United Kingdom
was applied to agricultural land (Sterritt and Lester 1980). However, this situation should
change in Australia as disposal of biosolids into the ocean is now prohibited by new anti-
Authors are Senior Research Scientist, Technical Officer, QIC Regional Veterinary
Laboratory, District Livestock Officer and Research Director of Organic Waste Recycling
Unit located at various institutes of NSW Agriculture. Contact address for the senior
author is: Agricultural Research & Veterinary Centre, Forest Road, Orange, NSW, 2800,
Australia.
image:
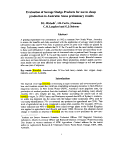 pollution regulations which has forced wastewater treatment authorities to find alternative
low-risk disposal methods.
Application of liquid, dewatered and alkali-treated biosolids to agricultural land is an at-
tractive, cost effective disposal option which recycles organic matter and nutrients back to
the soil in an environmentally acceptable manner. This method is widely practised over-
seas, but it is only recently that it has been considered as a feasible option for sewage
waste disposal even though biosolids produced in NSW have an estimated fertilizer value
of about $10 million/year (Ross et al. 1989). However, while applying sewage products to
agricultural land provides a unique opportunity to improve the physical and chemical
properties of poor soils, the concentrations of nutrients, trace elements, heavy metals and
persistent organics contained in biosolids pose a severe hazard if applied injudiciously
(Chaney et al 1987; Lindsay 1983).
Heavy metals in large quantities may inhibit plant growth, adversely affect long-term pro-
ductivity, and lead to accumulation of metals in the food chain. Some of these accumula-
tions may be detrimental to human health with arsenic (As), cadmium (Cd), lead (Pb),
mercury (Hg) and nickel (Ni) the most frequently identified as posing risk to human
health (Seiler et al. 1988). Cd and Cu are of particular concern in Australia. A long history
of applying superphosphate containing variable levels of Cd has increased soil Cd from
0.016 to 0.114 mg/kg in unfertilized soils to a range of 0.076 to 0.342 mg/kg in highly fer-
tilized soils (Williams and David 1976). These elevated Cd levels have caused violations
in residue limits in some livestock products (Langlands et al. 1988). This means that the
scope for applying sewage products containing further Cd is limited and must be closely
controlled (Ross et al. 1989). Cu poisoning is also a regular occurrence in Australian
sheep and cattle, usually after incorrect supplementation for copper deficiency, indicating
that the margin for safety for Cu is slim (Seawright 1989).
The bioavailability of metal contaminants can be reduced by applying lime to soil or pre-
treating dewatered solids with pH amendment agents. However, this may increase the cost
of sewage waste and reduce availability of important plant nutrients. The latter may be ad-
vantageous in some cases as plant nutrients applied in excess of requirements also pose an
important potential risk to the environment. Nitrogen (N) derived from sewage waste can
contaminate ground and surface water supplies (Addiscott 1988), while excess levels of
phosphorus (P) can result in the eutrophication of dams and waterways (Curran 1991).
Significant downward movement of Zn and Cu to >1 m depth has also been reported on
light acid soils with low cation exchange capacity (Sidle and Kardos 1977; Taylor et al.
1982;Lawrieefa/. 1991).
The potential to pollute agricultural ecosystems by land application of biosolids is deter-
mined by the concentration of contaminants in the sewage product, the amount and fre-
quency of application, the nutrient requirements of target crops and pastures, and the
properties of the soils to which they are applied. For Sydney's wastewater solids, De Vries
(1983) and Copeland (1990) reported relatively low levels of heavy metals in raw sewage
from residential areas compared with other more highly industrialized parts of the city,
but did note elevated Cu, Zn and Pb levels (Table 1). While biosolids produced from the
image:
pollution regulations which has forced wastewater treatment authorities to find alternative
low-risk disposal methods.
Application of liquid, dewatered and alkali-treated biosolids to agricultural land is an at-
tractive, cost effective disposal option which recycles organic matter and nutrients back to
the soil in an environmentally acceptable manner. This method is widely practised over-
seas, but it is only recently that it has been considered as a feasible option for sewage
waste disposal even though biosolids produced in NSW have an estimated fertilizer value
of about $10 million/year (Ross et al. 1989). However, while applying sewage products to
agricultural land provides a unique opportunity to improve the physical and chemical
properties of poor soils, the concentrations of nutrients, trace elements, heavy metals and
persistent organics contained in biosolids pose a severe hazard if applied injudiciously
(Chaney et al 1987; Lindsay 1983).
Heavy metals in large quantities may inhibit plant growth, adversely affect long-term pro-
ductivity, and lead to accumulation of metals in the food chain. Some of these accumula-
tions may be detrimental to human health with arsenic (As), cadmium (Cd), lead (Pb),
mercury (Hg) and nickel (Ni) the most frequently identified as posing risk to human
health (Seiler et al. 1988). Cd and Cu are of particular concern in Australia. A long history
of applying superphosphate containing variable levels of Cd has increased soil Cd from
0.016 to 0.114 mg/kg in unfertilized soils to a range of 0.076 to 0.342 mg/kg in highly fer-
tilized soils (Williams and David 1976). These elevated Cd levels have caused violations
in residue limits in some livestock products (Langlands et al. 1988). This means that the
scope for applying sewage products containing further Cd is limited and must be closely
controlled (Ross et al. 1989). Cu poisoning is also a regular occurrence in Australian
sheep and cattle, usually after incorrect supplementation for copper deficiency, indicating
that the margin for safety for Cu is slim (Seawright 1989).
The bioavailability of metal contaminants can be reduced by applying lime to soil or pre-
treating dewatered solids with pH amendment agents. However, this may increase the cost
of sewage waste and reduce availability of important plant nutrients. The latter may be ad-
vantageous in some cases as plant nutrients applied in excess of requirements also pose an
important potential risk to the environment. Nitrogen (N) derived from sewage waste can
contaminate ground and surface water supplies (Addiscott 1988), while excess levels of
phosphorus (P) can result in the eutrophication of dams and waterways (Curran 1991).
Significant downward movement of Zn and Cu to >1 m depth has also been reported on
light acid soils with low cation exchange capacity (Sidle and Kardos 1977; Taylor et al.
1982;Lawrieefa/. 1991).
The potential to pollute agricultural ecosystems by land application of biosolids is deter-
mined by the concentration of contaminants in the sewage product, the amount and fre-
quency of application, the nutrient requirements of target crops and pastures, and the
properties of the soils to which they are applied. For Sydney's wastewater solids, De Vries
(1983) and Copeland (1990) reported relatively low levels of heavy metals in raw sewage
from residential areas compared with other more highly industrialized parts of the city,
but did note elevated Cu, Zn and Pb levels (Table 1). While biosolids produced from the
image:
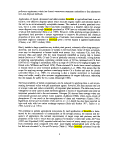 Table 1. Concentration of some elements in sewage from industrial and residential
sectors of Sydney (de Vries 1983).
Nutrient/metal
Total N (%)
Total P (%)
Total Ca (%)
Total K(%)
Total Mg (%)
Total Na (%)
Cu (mg/kg)
Zn (mg/kg)
Mn (mg/kg)
Cd (mg/kg)
Ni (mg/kg)
Pb (mg/kg)
Industrial
(Malabar)
2.6
0.9
1.9
0.1
1.9
0.1
872
2190
214
32
156
173
Residential
(Warragamba)
3.8
0.6
2.1
0.1
1.9
0.1
396
1900
114
3
25
156
Sydney Water Corporation's treatment facilities in the non-industrial sectors of the city
appear to be suitable for use in agricultural production on soils with pH >6.0, especially in
regard to Cd, there is little local information available to frame regulations regarding rates
and frequency of application to commercial crop and pasture systems grown on the major-
ity of Australian soils which are highly degraded, infertile and acidic.
In fact, the initial guidelines specifying annual and maximum cumulative loadings of nu-
trients and contaminants (Ross et al. 1991) for sludge usage in Australia were based
largely on overseas regulations and experiences. This was unsatisfactory as Australian
soils are sufficiently different from those used for recycling sewage products in other parts
of the world to preclude direct comparison and extrapolation from overseas research. To
foster safe and sustainable use of biosolids in Australia, it is important that we develop
guidelines appropriate to our environmental conditions and agricultural systems based on
local research.
The development of such guidelines requires assessment of the benefits accrued from the
nutrient and organic matter inputs and the risk of environmental pollution and product
spoilage associated with heavy metal and organic contaminants resident in different
biosolid products. The fourteen risk pathways identified by the United States Environ-
mental Protection Agency (USEPA 1989a, 1989b) to assess the hazards of transferring
sewage-applied contaminants to the environment and to the foodchains of livestock and
man provide an excellent scientific framework (Logan and Page 1989) for evaluating the
impact of biosolids usage in the Australian context. In 1991, the Sydney Water Corpora-
tion provided NSW Agriculture with an $8 million grant to establish a comprehensive re-
search program to assess the risks associated with a range of potential uses of biosolids in
NSW.
One area of potential use targeted in NSW is the 8 million hectares of highly degraded, in-
image:
Table 1. Concentration of some elements in sewage from industrial and residential
sectors of Sydney (de Vries 1983).
Nutrient/metal
Total N (%)
Total P (%)
Total Ca (%)
Total K(%)
Total Mg (%)
Total Na (%)
Cu (mg/kg)
Zn (mg/kg)
Mn (mg/kg)
Cd (mg/kg)
Ni (mg/kg)
Pb (mg/kg)
Industrial
(Malabar)
2.6
0.9
1.9
0.1
1.9
0.1
872
2190
214
32
156
173
Residential
(Warragamba)
3.8
0.6
2.1
0.1
1.9
0.1
396
1900
114
3
25
156
Sydney Water Corporation's treatment facilities in the non-industrial sectors of the city
appear to be suitable for use in agricultural production on soils with pH >6.0, especially in
regard to Cd, there is little local information available to frame regulations regarding rates
and frequency of application to commercial crop and pasture systems grown on the major-
ity of Australian soils which are highly degraded, infertile and acidic.
In fact, the initial guidelines specifying annual and maximum cumulative loadings of nu-
trients and contaminants (Ross et al. 1991) for sludge usage in Australia were based
largely on overseas regulations and experiences. This was unsatisfactory as Australian
soils are sufficiently different from those used for recycling sewage products in other parts
of the world to preclude direct comparison and extrapolation from overseas research. To
foster safe and sustainable use of biosolids in Australia, it is important that we develop
guidelines appropriate to our environmental conditions and agricultural systems based on
local research.
The development of such guidelines requires assessment of the benefits accrued from the
nutrient and organic matter inputs and the risk of environmental pollution and product
spoilage associated with heavy metal and organic contaminants resident in different
biosolid products. The fourteen risk pathways identified by the United States Environ-
mental Protection Agency (USEPA 1989a, 1989b) to assess the hazards of transferring
sewage-applied contaminants to the environment and to the foodchains of livestock and
man provide an excellent scientific framework (Logan and Page 1989) for evaluating the
impact of biosolids usage in the Australian context. In 1991, the Sydney Water Corpora-
tion provided NSW Agriculture with an $8 million grant to establish a comprehensive re-
search program to assess the risks associated with a range of potential uses of biosolids in
NSW.
One area of potential use targeted in NSW is the 8 million hectares of highly degraded, in-
image:
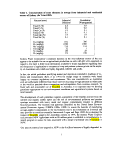 Figure 1. Risk pathways for contamination of a pasture based livestock production
system by heavy metals and organics derived from sewage sludge.
fertile, acid (pH[CaC12]<5.0) soils (Helyar et al. 1990) which have low productivity in their
present state. Extensive wool and sheep meat production which is often the only viable
agricultural use possible on these soils, are significant agricultural enterprises. In the
Southern Tablelands region where these soils account for the majority of the grazing
lands, sheep enterprises generate an annual revenue exceeding $380 million which repre-
sents 76% of the total agricultural production. In general, these soils have low cation ex-
change (5-10 meq %), low organic matter (<2%), P and N deficiencies, and light-textured,
shallow top-soil (35-50 cm) overlaying heavier clay subsoil which severely restrict root-
ing depth. The physical and chemical characteristics of these soils could be rapidly im-
proved by the nutrients and organic matter contained in sewage products provided the
risks of environmental pollution and possible contamination of pasture, meat and wool
can be minimized by selecting appropriate sewage products and application rates.
Formulation of regulations to achieve these objectives for land application of low metal
biosolids to such soils which are used for livestock production is a formidable task which
requires well-designed, long-term field experiments. In 1992, a large-scale grazing experi-
ment was established at Goulburn (34°47'S; 149°43'E) on the Southern Tablelands of
NSW to investigate the impacts of sewage waste products on a pasture-based sheep graz-
ing ecosystem. The two main aims of the program were: (1) to assess the potential of
biosolids as an economic and sustainable soil ameliorant and fertilizer for sheep produc-
tion systems; and (2) to measure the effects of metal and organic contaminants of sewage
products on the water, soil, plant and livestock components of the pasture ecosystem using
the USEPA risk pathway model. The risk pathways addressed in this project are shown in
Figure 1.
Materials and Methods
Site characteristics. The 100 ha experimental site selected is typical of the land class
used for low-input sheep grazing enterprises in NSW. The site covers a series of three hill
image:
Figure 1. Risk pathways for contamination of a pasture based livestock production
system by heavy metals and organics derived from sewage sludge.
fertile, acid (pH[CaC12]<5.0) soils (Helyar et al. 1990) which have low productivity in their
present state. Extensive wool and sheep meat production which is often the only viable
agricultural use possible on these soils, are significant agricultural enterprises. In the
Southern Tablelands region where these soils account for the majority of the grazing
lands, sheep enterprises generate an annual revenue exceeding $380 million which repre-
sents 76% of the total agricultural production. In general, these soils have low cation ex-
change (5-10 meq %), low organic matter (<2%), P and N deficiencies, and light-textured,
shallow top-soil (35-50 cm) overlaying heavier clay subsoil which severely restrict root-
ing depth. The physical and chemical characteristics of these soils could be rapidly im-
proved by the nutrients and organic matter contained in sewage products provided the
risks of environmental pollution and possible contamination of pasture, meat and wool
can be minimized by selecting appropriate sewage products and application rates.
Formulation of regulations to achieve these objectives for land application of low metal
biosolids to such soils which are used for livestock production is a formidable task which
requires well-designed, long-term field experiments. In 1992, a large-scale grazing experi-
ment was established at Goulburn (34°47'S; 149°43'E) on the Southern Tablelands of
NSW to investigate the impacts of sewage waste products on a pasture-based sheep graz-
ing ecosystem. The two main aims of the program were: (1) to assess the potential of
biosolids as an economic and sustainable soil ameliorant and fertilizer for sheep produc-
tion systems; and (2) to measure the effects of metal and organic contaminants of sewage
products on the water, soil, plant and livestock components of the pasture ecosystem using
the USEPA risk pathway model. The risk pathways addressed in this project are shown in
Figure 1.
Materials and Methods
Site characteristics. The 100 ha experimental site selected is typical of the land class
used for low-input sheep grazing enterprises in NSW. The site covers a series of three hill
image:
 formations with altitude ranging from 640 to 680 m. Hill A which is located at the southern end
of the site is undulating (slopes «10 %) with a maximum relief of 35 m. Hill B is an undulating
low rise with a maximum relief of less than 10 m. Hill C is located at the northern end of the site
and is the steepest area with maximum relief of more than 40 m and small areas exceeding 10%.
Ten plots of approximately 1.1 ha each were laid out on each of the three major soil types
identified by an extensive preparatory soil survey taken at fixed 100 m intervals over the entire
area. These soils which represent 70% of the soils of the region and which roughly correspond
with the hill formations differ in texture and clay content, but have similar chemical properties
to those of the sandy loam duplex soil (Aerie Kandiaqualfs in Soil Taxonomy) described in Table
3 found on Hill A.
The site was an unimproved pastoral area dominated by red grass (Bothriochloa macro) with a
small percentage of spear grass (Stipa spp.), wallaby grass (Danthonia spp.) and weeping grass
(Microlaena spp.). Some subterranean clover (Trifolium subterraneum) (cv. Mt Barker) was
present, but was not a major pasture component. Prior to clearing, the native vegetation was a
savanna woodland of yellow box (Eucalyptus melliodord) and red gum (E. camaldulensis).
Pre-treatment earth works. The Soil Conservation Service of NSW designed and implemented
a series of detention structures to minimise the movement of suspended sediment off the
experimental site. These structures included a series of banks, dams, sediment traps and "silt
stop" fencing. Since these structures were installed in January 1993, no runoff has escaped from
the experimental site.
Treatments. A control and four biosolid treatments were duplicated on each soil type. The
control was based on best agricultural practice for pasture development recommended by local
agronomists for these soil types. This consisted of the broadcast application and incorporation
of 2.5 t/ha of lime in summer prior to pasture sowing in autumn. Lime plus superphosphate
(50:50) was applied at 400 kg/ha at sowing with annual maintenance input of 250 kg/ha
superphosphate.
N-Viro Soil (alkali-treated sludge designed to reduce availability of heavy metals) was applied
at 7.5 t/ha which was the equivalent neutralizing rate of lime applied in the control. Dewatered
sludge cake (28% solid) obtained from the Malabar Sewage Treatment Plant (STP) was applied
at 30, 60 and 120 t/ha as a one-time application and incorporated with offset discs within 24
hours of application as specified in the "Interim Guidelines for Land Application of Sewage
Waste Products in NSW" (Ross et al 1991). Malabar STP sewage waste which was also the
biosolid source used in the manufacture of N-Viro Soil, was chosen to ensure that the maximum
cumulative loading (MCL) for at least some heavy metals was approached at the highest
application rate (Table 2).
A total of 1827 dry tonne of dewatered sewage waste was applied to the Goulburn site during
the period December 15,1992 and April 8,1993. Samples were randomly collected during the
application phase and were analysed to determine the loadings of nutrients, heavy metals and
organochlorines on each treatment (Table 2).
image:
formations with altitude ranging from 640 to 680 m. Hill A which is located at the southern end
of the site is undulating (slopes «10 %) with a maximum relief of 35 m. Hill B is an undulating
low rise with a maximum relief of less than 10 m. Hill C is located at the northern end of the site
and is the steepest area with maximum relief of more than 40 m and small areas exceeding 10%.
Ten plots of approximately 1.1 ha each were laid out on each of the three major soil types
identified by an extensive preparatory soil survey taken at fixed 100 m intervals over the entire
area. These soils which represent 70% of the soils of the region and which roughly correspond
with the hill formations differ in texture and clay content, but have similar chemical properties
to those of the sandy loam duplex soil (Aerie Kandiaqualfs in Soil Taxonomy) described in Table
3 found on Hill A.
The site was an unimproved pastoral area dominated by red grass (Bothriochloa macro) with a
small percentage of spear grass (Stipa spp.), wallaby grass (Danthonia spp.) and weeping grass
(Microlaena spp.). Some subterranean clover (Trifolium subterraneum) (cv. Mt Barker) was
present, but was not a major pasture component. Prior to clearing, the native vegetation was a
savanna woodland of yellow box (Eucalyptus melliodord) and red gum (E. camaldulensis).
Pre-treatment earth works. The Soil Conservation Service of NSW designed and implemented
a series of detention structures to minimise the movement of suspended sediment off the
experimental site. These structures included a series of banks, dams, sediment traps and "silt
stop" fencing. Since these structures were installed in January 1993, no runoff has escaped from
the experimental site.
Treatments. A control and four biosolid treatments were duplicated on each soil type. The
control was based on best agricultural practice for pasture development recommended by local
agronomists for these soil types. This consisted of the broadcast application and incorporation
of 2.5 t/ha of lime in summer prior to pasture sowing in autumn. Lime plus superphosphate
(50:50) was applied at 400 kg/ha at sowing with annual maintenance input of 250 kg/ha
superphosphate.
N-Viro Soil (alkali-treated sludge designed to reduce availability of heavy metals) was applied
at 7.5 t/ha which was the equivalent neutralizing rate of lime applied in the control. Dewatered
sludge cake (28% solid) obtained from the Malabar Sewage Treatment Plant (STP) was applied
at 30, 60 and 120 t/ha as a one-time application and incorporated with offset discs within 24
hours of application as specified in the "Interim Guidelines for Land Application of Sewage
Waste Products in NSW" (Ross et al 1991). Malabar STP sewage waste which was also the
biosolid source used in the manufacture of N-Viro Soil, was chosen to ensure that the maximum
cumulative loading (MCL) for at least some heavy metals was approached at the highest
application rate (Table 2).
A total of 1827 dry tonne of dewatered sewage waste was applied to the Goulburn site during
the period December 15,1992 and April 8,1993. Samples were randomly collected during the
application phase and were analysed to determine the loadings of nutrients, heavy metals and
organochlorines on each treatment (Table 2).
image:
 Table 2. Loading rates (kg/ha) of nutrients,heavy metals and organics contained in
fertilizers and sludge products applied to Hill A at Goulburn.
Loading rate
of nutrients
(kg/ha)
Treatments
Control N-Viro Dewatered cake
Soil 30t/ha 60t/ha 120t/ha
Maximum
cumulative
loading
Total Nitrogen NM 90 744. 1715. 3528. 4002
Total Phosphorus 21 584 4784 9664 19034 NR
Total Calcium 1099 15034 915 1729 3984 NR
Total Potassium NM 255 37 76. 126. NR
Total Magnesium 10 314 934 1974 4164 NR
Total Sulphur 37 864 4524 9074 16564 NR
Heavy metal or
organics loading
rate (kg/ha)
Arsenic 0.01 0.08 0.11 0.35 0.54 203
Cadmium 0.01 0.05 0.42 0.79 1.56 33
Chromium 0.02 1.34 9.72 18.70 36.48 1003
Copper 0.01 4.32 56.79 74.55 145.11 1003
Manganese 0.41 2.89 6.01 12.32 23.28 NR
Mercury 0.01 0.01 0.17 0.35 0.66 I3
Nickel 0.02 0.62 5.24 10.10 19.56 603
Lead 0.05 1.99 10.15 20.35 38.88 1503
Selenium 0.02 0.14 0.65 1.37 2.55 53
Zinc 0.14 7.0 84.94 177.42 332.04 2003
Dieldrin NM BD 0.01 0.02 0.05 0.023
Chlordane NM BD 0.02 0.03 0.06 0.023
DDT/DDD/DDE NM BD BD BD 0.03 0.53
Levels specified in "Interim Code of Practice for Use and Disposal of Biosolid Products",
Draft, June 1994, NSW Environmetal Protection Authority; 2Crop nitrogen requirement given
kg total N/ha/year; 3MCL given as kg/ha assuming incorporation to 0.075 m in soil with bulk
density of 1.33 dry t/m3; Nutrient loadings for N-Viro Soil and sludge includes basal fertilizer
applied at sowing; NM = not measured; NR = no restriction; BD = below detection.
ents, heavy metals and organochlorines on each treatment (Table 2).
Assessment of water quality. Background samples of water from appropriate areas
downstream from the sludge application site were analysed for bacteria, chemicals and
metals which are common contaminants of sewage waste to identify ambient levels in the
watershed before sewage products were applied. Following application of biosolids, water
quality was monitored regularly over a 12 month period at 24 fixed locations in the two
catchments. Also, in accordance with EPA requirements, piezometers were installed at 15
and 30 m to assess and monitor quality of deep groundwater.
Pastures and sheep. In autumn 1993, all plots were sown with a pasture mixture which
included subterranean clover (Trifolium subterraneum), white clover (T. repens),
image:
Table 2. Loading rates (kg/ha) of nutrients,heavy metals and organics contained in
fertilizers and sludge products applied to Hill A at Goulburn.
Loading rate
of nutrients
(kg/ha)
Treatments
Control N-Viro Dewatered cake
Soil 30t/ha 60t/ha 120t/ha
Maximum
cumulative
loading
Total Nitrogen NM 90 744. 1715. 3528. 4002
Total Phosphorus 21 584 4784 9664 19034 NR
Total Calcium 1099 15034 915 1729 3984 NR
Total Potassium NM 255 37 76. 126. NR
Total Magnesium 10 314 934 1974 4164 NR
Total Sulphur 37 864 4524 9074 16564 NR
Heavy metal or
organics loading
rate (kg/ha)
Arsenic 0.01 0.08 0.11 0.35 0.54 203
Cadmium 0.01 0.05 0.42 0.79 1.56 33
Chromium 0.02 1.34 9.72 18.70 36.48 1003
Copper 0.01 4.32 56.79 74.55 145.11 1003
Manganese 0.41 2.89 6.01 12.32 23.28 NR
Mercury 0.01 0.01 0.17 0.35 0.66 I3
Nickel 0.02 0.62 5.24 10.10 19.56 603
Lead 0.05 1.99 10.15 20.35 38.88 1503
Selenium 0.02 0.14 0.65 1.37 2.55 53
Zinc 0.14 7.0 84.94 177.42 332.04 2003
Dieldrin NM BD 0.01 0.02 0.05 0.023
Chlordane NM BD 0.02 0.03 0.06 0.023
DDT/DDD/DDE NM BD BD BD 0.03 0.53
Levels specified in "Interim Code of Practice for Use and Disposal of Biosolid Products",
Draft, June 1994, NSW Environmetal Protection Authority; 2Crop nitrogen requirement given
kg total N/ha/year; 3MCL given as kg/ha assuming incorporation to 0.075 m in soil with bulk
density of 1.33 dry t/m3; Nutrient loadings for N-Viro Soil and sludge includes basal fertilizer
applied at sowing; NM = not measured; NR = no restriction; BD = below detection.
ents, heavy metals and organochlorines on each treatment (Table 2).
Assessment of water quality. Background samples of water from appropriate areas
downstream from the sludge application site were analysed for bacteria, chemicals and
metals which are common contaminants of sewage waste to identify ambient levels in the
watershed before sewage products were applied. Following application of biosolids, water
quality was monitored regularly over a 12 month period at 24 fixed locations in the two
catchments. Also, in accordance with EPA requirements, piezometers were installed at 15
and 30 m to assess and monitor quality of deep groundwater.
Pastures and sheep. In autumn 1993, all plots were sown with a pasture mixture which
included subterranean clover (Trifolium subterraneum), white clover (T. repens),
image:
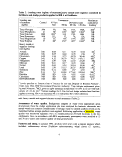 Table 3. Chemical characteristics of a duplex soil (0-30 cm) at Goulburn before and
after application of fertilizer and lime (Control), N-Viro Soil and dewatered cake at
three rates (After Michalk et al. in press).
Treatment/
soil depth (cm)
pH1 BrayP
(mg/kg)
Total C
Total N
Exchangeable cations
Ca
Mg
K
Na
Al
Total
CEC
Prior to treatment
Depth: 0-10
10-20
20-30
After treatment
Control
Depth: 0-10
10-20
20-30
N-Viro Soil
Depth: 0-10
10-20
20-30
Dewatered cake
30 t/ha cake
Depth: 0-10
10-20
20-30
60 t/ha cake
Depth: 0-10
10-20
20-30
120 t/ha cake
Depth: 0-10
10-20
20-30
^H measured in
4.7
4.9
4.9
2
1
0
2.1
1.1
1.0
0.1
0.1
0.1
2.8
2.2
2.4
2.4
2.9
6.6
0.3
0.3
0.3
0.2
0.2
0.6
0.3
0.1
0.1
6.0
6.7
10.0
- Spring 1993
6.0
5.0
5.2
5.7
5.1
5.1
4.7
4.7
5.0
4.8
4.6
4.7
5.4
5.0
5.1
CaCl2;
24
3
<3
16
3
<3
69
21
23
126
23
13
304
81
31
2.9
0.7
0.5
1.5
0.9
0.5
2.1
1.0
0.9
2.6
0.8
0.7
5.9
1.3
0.7
0.1
0.1
0.1
0.1
0.1
0.1
0.2
0.1
0.1
0.2
0.1
0.1
0.4
0.2
0.1
5.0
2.0
2.1
4.1
2.3
1.8
4.0
2.8
3.0
5.3
2.2
2.3
13.0
4.3
3.0
1.0
1.7
4.6
0.7
1.3
3.0
1.3
2.3
4.4
1.0
1.0
4.5
2.1
1.6
5.2
0.3
0.3
0.2
0.6
0.3
0.2
0.4
0.4
0.3
0.4
0.2
0.3
0.4
0.3
0.3
0.1
0.2
0.7
0.1
0.1
0.1
0.1
0.0
0.2
0.1
0.0
0.3
0.2
0.0
0.1
0.0
0.1
0.0
0.0
0.0
0.0
0.1
0.1
0.0
0.1
0.1
0.2
0.0
0.0
0.0
6.4
4.3
7.6
5.5
4.0
5.1
5.9
5.6
7.9
6.9
3.5
7.6
15.7
6.2
8.6
Exchangeable cations expressed in meq %.
cocksfoot (Dactylis glomeratd), phalaris (Phalaris aquaticd), perennial ryegrass (Lolium
perenne) and ryecorn (Secale cereale). A basal dressing of lime/super (250 kg/ha) was ap-
plied at sowing to all plots.
Pasture yield and botanical composition are monitored at six weekly periods along fixed
transects using the dry weight rank and estimation procedures in BOTANAL (Tothill et
al. 1992). At each sampling, forage tops are analysed for P and N. In autumn and spring
each species present is sampled and analysed for heavy metals and organic pollutants.
Fine wool (<19 micron fibre diameter) Merino ewes commenced grazing the plots in
spring 1993 initially at 5 ewes/plot, but stocking rate was increased to 10/plot in spring
1994. Ewes are joined in February and commence lambing in July. Lambs are weaned in
image:
Table 3. Chemical characteristics of a duplex soil (0-30 cm) at Goulburn before and
after application of fertilizer and lime (Control), N-Viro Soil and dewatered cake at
three rates (After Michalk et al. in press).
Treatment/
soil depth (cm)
pH1 BrayP
(mg/kg)
Total C
Total N
Exchangeable cations
Ca
Mg
K
Na
Al
Total
CEC
Prior to treatment
Depth: 0-10
10-20
20-30
After treatment
Control
Depth: 0-10
10-20
20-30
N-Viro Soil
Depth: 0-10
10-20
20-30
Dewatered cake
30 t/ha cake
Depth: 0-10
10-20
20-30
60 t/ha cake
Depth: 0-10
10-20
20-30
120 t/ha cake
Depth: 0-10
10-20
20-30
^H measured in
4.7
4.9
4.9
2
1
0
2.1
1.1
1.0
0.1
0.1
0.1
2.8
2.2
2.4
2.4
2.9
6.6
0.3
0.3
0.3
0.2
0.2
0.6
0.3
0.1
0.1
6.0
6.7
10.0
- Spring 1993
6.0
5.0
5.2
5.7
5.1
5.1
4.7
4.7
5.0
4.8
4.6
4.7
5.4
5.0
5.1
CaCl2;
24
3
<3
16
3
<3
69
21
23
126
23
13
304
81
31
2.9
0.7
0.5
1.5
0.9
0.5
2.1
1.0
0.9
2.6
0.8
0.7
5.9
1.3
0.7
0.1
0.1
0.1
0.1
0.1
0.1
0.2
0.1
0.1
0.2
0.1
0.1
0.4
0.2
0.1
5.0
2.0
2.1
4.1
2.3
1.8
4.0
2.8
3.0
5.3
2.2
2.3
13.0
4.3
3.0
1.0
1.7
4.6
0.7
1.3
3.0
1.3
2.3
4.4
1.0
1.0
4.5
2.1
1.6
5.2
0.3
0.3
0.2
0.6
0.3
0.2
0.4
0.4
0.3
0.4
0.2
0.3
0.4
0.3
0.3
0.1
0.2
0.7
0.1
0.1
0.1
0.1
0.0
0.2
0.1
0.0
0.3
0.2
0.0
0.1
0.0
0.1
0.0
0.0
0.0
0.0
0.1
0.1
0.0
0.1
0.1
0.2
0.0
0.0
0.0
6.4
4.3
7.6
5.5
4.0
5.1
5.9
5.6
7.9
6.9
3.5
7.6
15.7
6.2
8.6
Exchangeable cations expressed in meq %.
cocksfoot (Dactylis glomeratd), phalaris (Phalaris aquaticd), perennial ryegrass (Lolium
perenne) and ryecorn (Secale cereale). A basal dressing of lime/super (250 kg/ha) was ap-
plied at sowing to all plots.
Pasture yield and botanical composition are monitored at six weekly periods along fixed
transects using the dry weight rank and estimation procedures in BOTANAL (Tothill et
al. 1992). At each sampling, forage tops are analysed for P and N. In autumn and spring
each species present is sampled and analysed for heavy metals and organic pollutants.
Fine wool (<19 micron fibre diameter) Merino ewes commenced grazing the plots in
spring 1993 initially at 5 ewes/plot, but stocking rate was increased to 10/plot in spring
1994. Ewes are joined in February and commence lambing in July. Lambs are weaned in
image:
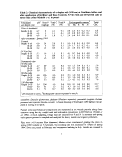 November and relocated to another replicate of the same treatment to replace ewes slaugh-
tered for tissue assays.
Liveweight gain of ewes and lambs, and ewe condition are measured at six weekly inter-
vals. Wool production and quality is measured annually. Fresh tissue samples from 10
ewes purchased in 1993 and 5 ewes purchased in 1994 were analysed to provide baseline
levels of heavy metals and organics present in the liver, kidney, muscle and fat of sheep
prior to exposure to sewage contaminants. One ewe per plot and one wether lamb per
treatment are slaughtered in December each year to monitor changes in heavy metal and
pesticide levels in tissues. Wool grease and fibres are analysed for heavy metals and or-
ganic pollutants. Milk samples are taken in spring and tested for heavy metals.
Supplementary feed is provided to sheep during times of feed deficit. Sheep nuts or grain
is fed on the ground which is the feeding method used by local producers. This provides
maximum opportunity for sheep to ingest soil (and thereby sewage contaminants) along
with supplementary feed supplied. However, the amount of sewage product ingested di-
rectly by sheep was not measured in this study. Uptake of pollutants via water was elimi-
nated by providing stock water in a trough system sourced from dams isolated from
possible contamination by sewage products.
Monitoring movement of nutrients and sewage contaminants in soil and water. Run-
off and exclusion plots established on each treatment at the start of the program provide
the means to monitor downward and lateral (both surface and sub-surface) movement of
nutrients and heavy metals in soil and water. Runoff after rainfall events is measured from
standard 42 x 2 m plots located in a down-slope position. To prevent inflow from outside
sources, the runoff plots are surrounded by a 20 cm timber barrier partly embedded in the
soil. Runoff (including both water and solids) is collected in plastic repositories and meas-
ured after each rainfall event. Samples are analysed for nitrogen and heavy metal content.
The 2 x 2 m exclusion plots, which have received no sludge or fertiliser treatment, are also
located in each treatment. Similar barriers isolate these exclosures from the surrounding
pasture. However, on the down-slope side the barrier has an opening through which sur-
face runoff from within the plot can pass to avoid waterlogging effects. Collection cups
have been installed just above the clay layer (30 to 40 cm) within these exclusion plots to
monitor lateral movement of N. To monitor downward and lateral movement of nutrients
and sludge contaminants, soil samples are taken on the up-slope and down-slope sides
within the exclusion plots as well as in adjacent positions outside. Stock are excluded
from the exclosures but have access to the runoff plots. A general soil sampling is also un-
dertaken in each treatment plot in autumn and spring each year.
Results
This paper reports some preliminary results of the effects of the applied sewage products
on the water, soil, pasture and livestock components measured on the sandy loam duplex
soil (Hill A) described in Table 3. It is anticipated that the monitoring program will con-
tinue for the next 5 to 8 years to enable the impact of sewage to be assessed for two full
image:
November and relocated to another replicate of the same treatment to replace ewes slaugh-
tered for tissue assays.
Liveweight gain of ewes and lambs, and ewe condition are measured at six weekly inter-
vals. Wool production and quality is measured annually. Fresh tissue samples from 10
ewes purchased in 1993 and 5 ewes purchased in 1994 were analysed to provide baseline
levels of heavy metals and organics present in the liver, kidney, muscle and fat of sheep
prior to exposure to sewage contaminants. One ewe per plot and one wether lamb per
treatment are slaughtered in December each year to monitor changes in heavy metal and
pesticide levels in tissues. Wool grease and fibres are analysed for heavy metals and or-
ganic pollutants. Milk samples are taken in spring and tested for heavy metals.
Supplementary feed is provided to sheep during times of feed deficit. Sheep nuts or grain
is fed on the ground which is the feeding method used by local producers. This provides
maximum opportunity for sheep to ingest soil (and thereby sewage contaminants) along
with supplementary feed supplied. However, the amount of sewage product ingested di-
rectly by sheep was not measured in this study. Uptake of pollutants via water was elimi-
nated by providing stock water in a trough system sourced from dams isolated from
possible contamination by sewage products.
Monitoring movement of nutrients and sewage contaminants in soil and water. Run-
off and exclusion plots established on each treatment at the start of the program provide
the means to monitor downward and lateral (both surface and sub-surface) movement of
nutrients and heavy metals in soil and water. Runoff after rainfall events is measured from
standard 42 x 2 m plots located in a down-slope position. To prevent inflow from outside
sources, the runoff plots are surrounded by a 20 cm timber barrier partly embedded in the
soil. Runoff (including both water and solids) is collected in plastic repositories and meas-
ured after each rainfall event. Samples are analysed for nitrogen and heavy metal content.
The 2 x 2 m exclusion plots, which have received no sludge or fertiliser treatment, are also
located in each treatment. Similar barriers isolate these exclosures from the surrounding
pasture. However, on the down-slope side the barrier has an opening through which sur-
face runoff from within the plot can pass to avoid waterlogging effects. Collection cups
have been installed just above the clay layer (30 to 40 cm) within these exclusion plots to
monitor lateral movement of N. To monitor downward and lateral movement of nutrients
and sludge contaminants, soil samples are taken on the up-slope and down-slope sides
within the exclusion plots as well as in adjacent positions outside. Stock are excluded
from the exclosures but have access to the runoff plots. A general soil sampling is also un-
dertaken in each treatment plot in autumn and spring each year.
Results
This paper reports some preliminary results of the effects of the applied sewage products
on the water, soil, pasture and livestock components measured on the sandy loam duplex
soil (Hill A) described in Table 3. It is anticipated that the monitoring program will con-
tinue for the next 5 to 8 years to enable the impact of sewage to be assessed for two full
image:
 cycles of the sheep production system.
Loadings of nutrients, metals and organics in treatments. The biosolid products and
chemical fertilizers contained a range of plant nutrients, but were also contaminated with
heavy metals and pesticides (Table 2). All rates of dewatered cake contained N in excess
of the 400 kg total N/ha/year currently allowable for use on crops and pastures. Of the
metals present, only Cu and Zn exceeded the maximum cumulative loadings (MCL) per-
missible under the interim guidelines (EPANSW, 1994) at the 120 t/ha rate. However, all
metals except As, Mn, and Se, exceeded the maximum annual loading (MAL) (Awad et
al. 1989) at the 60 t/ha rate. This provided a good range of metal loadings to test the risk
of accumulation in grazing sheep. Loadings of dieldrin and chlordane also exceeded the
MCL (Table 2). No nutrients and contaminants in the control fertilizer or N-Viro Soil
exceeded the MAL or MCL (Table 2).
Water quality monitoring. Testing of water quality undertaken prior to application of
sewage products showed that the levels of N and P in farm dams around the Boxers Creek
and Murray's Flat catchments were sufficiently high to stimulate aquatic growth. One
sample site located downstream from a piggery had the highest concentration of N (0.7
mg/L), fluoride and selenium, as well as high levels of faecal coliforms and E.coli. In gen-
eral, metals and pesticides were present only in trace quantities throughout the catchment.
However, there were some sites where elevated concentrations of Cd, Cr and Pb were re-
corded although the sources of these 'spikes' is not known.
The post-treatment monitoring of surface water during 1993 indicated that the water qual-
ity in the catchment surrounding the experiment was not affected by the application of
sewage waste. There was no difference between nutrient and heavy metal levels in the
Boxers Creek and Murrays Flat catchment and those taken from the Gundarry catchment,
a nearby area with similar land uses, but to which no biosolids had been applied.
Due to drought conditions, no water has been collected from the shallow piezometer (15
m), but groundwater samples from the deep piezometer (30 m) showed that selenium (Se),
molybdenum (Mo) and manganese (Mn) exceeded guidelines for stock water. However, it
is unlikely that sewage waste is the contaminating source as the total N and P levels in the
groundwater were low. Given the high N loading of the 120 t/ha treatment and the mobil-
ity of N in light textured soil, one would expect elevated N levels in the shallow and deep
piezometers to accompany any increase in the groundwater of Contaminants derived from
biosolid application.
Movement of nutrients and sewage contaminants in soil.
Nutrients: Fertilizers and sewage products both produced changes to soil chemistry meas-
ured in the spring following treatment. Lime and lime/super increased pH in the 0-10 cm
layer of control plots, doubled exchangeable Ca and increased available P (Bray test) by
22 mg/kg (Table 3) from the 21 kg/ha of P applied (Table 2). N-Viro Soil increased pH by
1 unit, and increased available P to 16 mg/kg in topsoil. Due to the composition of the kiln
dust used in its manufacture, N-Viro Soil was more effective than fertilizer or dewatered
cake in increasing exchangeable K.
image:
cycles of the sheep production system.
Loadings of nutrients, metals and organics in treatments. The biosolid products and
chemical fertilizers contained a range of plant nutrients, but were also contaminated with
heavy metals and pesticides (Table 2). All rates of dewatered cake contained N in excess
of the 400 kg total N/ha/year currently allowable for use on crops and pastures. Of the
metals present, only Cu and Zn exceeded the maximum cumulative loadings (MCL) per-
missible under the interim guidelines (EPANSW, 1994) at the 120 t/ha rate. However, all
metals except As, Mn, and Se, exceeded the maximum annual loading (MAL) (Awad et
al. 1989) at the 60 t/ha rate. This provided a good range of metal loadings to test the risk
of accumulation in grazing sheep. Loadings of dieldrin and chlordane also exceeded the
MCL (Table 2). No nutrients and contaminants in the control fertilizer or N-Viro Soil
exceeded the MAL or MCL (Table 2).
Water quality monitoring. Testing of water quality undertaken prior to application of
sewage products showed that the levels of N and P in farm dams around the Boxers Creek
and Murray's Flat catchments were sufficiently high to stimulate aquatic growth. One
sample site located downstream from a piggery had the highest concentration of N (0.7
mg/L), fluoride and selenium, as well as high levels of faecal coliforms and E.coli. In gen-
eral, metals and pesticides were present only in trace quantities throughout the catchment.
However, there were some sites where elevated concentrations of Cd, Cr and Pb were re-
corded although the sources of these 'spikes' is not known.
The post-treatment monitoring of surface water during 1993 indicated that the water qual-
ity in the catchment surrounding the experiment was not affected by the application of
sewage waste. There was no difference between nutrient and heavy metal levels in the
Boxers Creek and Murrays Flat catchment and those taken from the Gundarry catchment,
a nearby area with similar land uses, but to which no biosolids had been applied.
Due to drought conditions, no water has been collected from the shallow piezometer (15
m), but groundwater samples from the deep piezometer (30 m) showed that selenium (Se),
molybdenum (Mo) and manganese (Mn) exceeded guidelines for stock water. However, it
is unlikely that sewage waste is the contaminating source as the total N and P levels in the
groundwater were low. Given the high N loading of the 120 t/ha treatment and the mobil-
ity of N in light textured soil, one would expect elevated N levels in the shallow and deep
piezometers to accompany any increase in the groundwater of Contaminants derived from
biosolid application.
Movement of nutrients and sewage contaminants in soil.
Nutrients: Fertilizers and sewage products both produced changes to soil chemistry meas-
ured in the spring following treatment. Lime and lime/super increased pH in the 0-10 cm
layer of control plots, doubled exchangeable Ca and increased available P (Bray test) by
22 mg/kg (Table 3) from the 21 kg/ha of P applied (Table 2). N-Viro Soil increased pH by
1 unit, and increased available P to 16 mg/kg in topsoil. Due to the composition of the kiln
dust used in its manufacture, N-Viro Soil was more effective than fertilizer or dewatered
cake in increasing exchangeable K.
image:
 Nitrate (mg/kg)
Spring 1993
0 10 20
30
40
Spring 1994
0 10
20
30
40
0-10
10-20
20-30
S.
CD
TJ
= 30-50
50-70
60 t/ha -B-
120 t/ha-e-
0-10
10-20
20-30
30-50
50-70
Figure 2. Effect of sewage products on downward movement of nitrate on a duplex
soil (Hill A) at Goulburn.
The large amount of Ca supplied by dewatered cake (0.9 to 4 t/ha, depending on applica-
tion rate of cake) was not as effective as Ca applied in lime in increasing soil pH, but it
did increase exchangeable Ca (Table 3). Total C, CEC and total N were doubled by cake
application at the 120 t/ha rate. The increase in available P was linearly correlated with the
total P loading of each cake treatment (R = 0.96) with the gradient suggesting that about
22% of the total P applied became available in the first spring following incorporation of
dewatered cake.
Since only a small amount of the total N (<10%) and P (<2%) supplied was taken up by
the pasture, downward and lateral movement of these nutrients may constitute an impor-
tant source of surface and groundwater pollution over time. Mineralization and movement
of N occurred reasonably quickly after treatment with sewage waste. Soil tests undertaken
in spring 1993 and 1994 detected downward movement in plots treated with dewatered
cake with elevated nitrate levels measured at 30-50 cm in 1993 and 50-70 cm in 1994
(Figure 2). Nitrate concentration was proportional to the rate of sewage waste applied. The
70% increase in nitrate measured in the 0-10 cm layer between the two sampling dates is
consistent with the mineralisation rate of N in soils of this type. There was no significant
movement of the N supplied by N-Viro Soil (Figure 2).
Downward movement of P was also detected in the loamy topsoil with available P in the
10-20 and 20-30 cm depths being significantly higher in plots treated with dewatered cake
than the control and N-Viro Soil plots (Table 3). Like N, P concentration at depth was
proportional to the rate of sewage waste applied.
10
image:
Nitrate (mg/kg)
Spring 1993
0 10 20
30
40
Spring 1994
0 10
20
30
40
0-10
10-20
20-30
S.
CD
TJ
= 30-50
50-70
60 t/ha -B-
120 t/ha-e-
0-10
10-20
20-30
30-50
50-70
Figure 2. Effect of sewage products on downward movement of nitrate on a duplex
soil (Hill A) at Goulburn.
The large amount of Ca supplied by dewatered cake (0.9 to 4 t/ha, depending on applica-
tion rate of cake) was not as effective as Ca applied in lime in increasing soil pH, but it
did increase exchangeable Ca (Table 3). Total C, CEC and total N were doubled by cake
application at the 120 t/ha rate. The increase in available P was linearly correlated with the
total P loading of each cake treatment (R = 0.96) with the gradient suggesting that about
22% of the total P applied became available in the first spring following incorporation of
dewatered cake.
Since only a small amount of the total N (<10%) and P (<2%) supplied was taken up by
the pasture, downward and lateral movement of these nutrients may constitute an impor-
tant source of surface and groundwater pollution over time. Mineralization and movement
of N occurred reasonably quickly after treatment with sewage waste. Soil tests undertaken
in spring 1993 and 1994 detected downward movement in plots treated with dewatered
cake with elevated nitrate levels measured at 30-50 cm in 1993 and 50-70 cm in 1994
(Figure 2). Nitrate concentration was proportional to the rate of sewage waste applied. The
70% increase in nitrate measured in the 0-10 cm layer between the two sampling dates is
consistent with the mineralisation rate of N in soils of this type. There was no significant
movement of the N supplied by N-Viro Soil (Figure 2).
Downward movement of P was also detected in the loamy topsoil with available P in the
10-20 and 20-30 cm depths being significantly higher in plots treated with dewatered cake
than the control and N-Viro Soil plots (Table 3). Like N, P concentration at depth was
proportional to the rate of sewage waste applied.
10
image:
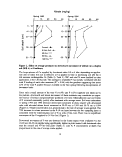 Table 4. Concentration and movement of heavy metals in a duplex soil at Goulburn
before and after application of fertilizer and lime (Control), N-Viro Soil and three
rates of dewatered cake.
Treatment/
Soil depth (cm)
Heavy metal
As
Cd
Cr
Cu
Mn
concentration (ms/kg)
Mo
Hg
Ni
Pb
Se
Zn
Prior to treatment
Depth: 0-10
After treatment -
Control
Depth: 0-10
10-20
20-30
N-Viro Soil
Depth: 0-10
10-20
20-30
Dewatered cake
30 t/ha cake
Depth: 0-10
10-20
20-30
60 t/ha cake
Depth: 0-10
10-20
20-30
120 t/ha cake
Depth: 0-10
10-20
20-30
10
Spring
10
13
12
14
15
15
14
17
13
14
18
15
12
13
11
0.6
1993
0.7
0.7
0.6
0.6
0.7
0.7
0.9
0.6
<0.6
0.7
0.8
<0.6
2.2
1.0
0.7
35
39
51
51
42
51
58
49
48
40
47
42
42
74
57
51
5
5
7
8
8
5
6
33
17
14
48
9
9
178
47
27
290
254
210
140
280
234
162
251
330
276
213
201
120
242
205
143
<3
<3
<3
<3
<3
<3
<3
<3
<3
<3
<3
<3
<3
<3
<3
<3
<2
<2
<2
<2
<2
<2
<2
<2
<2
<2
<2
<2
<2
<2
<2
<2
8
6
10
9
8
9
10
15
11
10
13
9
9
28
14
11
33
30
42
41
36
39
44
50
44
38
47
41
37
69
46
42
<7
<7
<7
<7
<7
<7
<7
<7
<7
<7
<7
<7
<7
<7
<7
<7
25
20
22
21
23
20
22
145
52
40
121
34
28
477
135
78
Further leaching of N and P into the B-horizon is not expected as the change in clay con-
tent (12 to 58%) provides a significant physical barrier to downward movement. However,
this creates conditions conducive to lateral movement. While soil tests undertaken inside
and outside exclusion plots in spring 1993 and 1994 did not detect any lateral movement,
saturation of the 30-50 cm soil layer has not occurred due to dry seasonal condition during
1994. Further monitoring will determine the importance of lateral movement in this soil
type.
Surface runoff collected from runoff plots in autumn 1993 detected elevated levels of N,
P, K, Ca, Mg, Na, and S in plots treated with dewatered cake compared to the controls.
However, once full ground cover was achieved in spring 1993, solutes and sediments in
runoff were reduced to levels unlikely to pose any problems of contamination. Overall,
lower runoff volumes were recorded where 60 and 120 t/ha of dewatered cake was ap-
plied. For example, a 50 mm rainfall event produced a runoff yield of 1566 L/ha on con-
trol plots, but only 219 L/ha in the 120 t/ha treatment.
11
image:
Table 4. Concentration and movement of heavy metals in a duplex soil at Goulburn
before and after application of fertilizer and lime (Control), N-Viro Soil and three
rates of dewatered cake.
Treatment/
Soil depth (cm)
Heavy metal
As
Cd
Cr
Cu
Mn
concentration (ms/kg)
Mo
Hg
Ni
Pb
Se
Zn
Prior to treatment
Depth: 0-10
After treatment -
Control
Depth: 0-10
10-20
20-30
N-Viro Soil
Depth: 0-10
10-20
20-30
Dewatered cake
30 t/ha cake
Depth: 0-10
10-20
20-30
60 t/ha cake
Depth: 0-10
10-20
20-30
120 t/ha cake
Depth: 0-10
10-20
20-30
10
Spring
10
13
12
14
15
15
14
17
13
14
18
15
12
13
11
0.6
1993
0.7
0.7
0.6
0.6
0.7
0.7
0.9
0.6
<0.6
0.7
0.8
<0.6
2.2
1.0
0.7
35
39
51
51
42
51
58
49
48
40
47
42
42
74
57
51
5
5
7
8
8
5
6
33
17
14
48
9
9
178
47
27
290
254
210
140
280
234
162
251
330
276
213
201
120
242
205
143
<3
<3
<3
<3
<3
<3
<3
<3
<3
<3
<3
<3
<3
<3
<3
<3
<2
<2
<2
<2
<2
<2
<2
<2
<2
<2
<2
<2
<2
<2
<2
<2
8
6
10
9
8
9
10
15
11
10
13
9
9
28
14
11
33
30
42
41
36
39
44
50
44
38
47
41
37
69
46
42
<7
<7
<7
<7
<7
<7
<7
<7
<7
<7
<7
<7
<7
<7
<7
<7
25
20
22
21
23
20
22
145
52
40
121
34
28
477
135
78
Further leaching of N and P into the B-horizon is not expected as the change in clay con-
tent (12 to 58%) provides a significant physical barrier to downward movement. However,
this creates conditions conducive to lateral movement. While soil tests undertaken inside
and outside exclusion plots in spring 1993 and 1994 did not detect any lateral movement,
saturation of the 30-50 cm soil layer has not occurred due to dry seasonal condition during
1994. Further monitoring will determine the importance of lateral movement in this soil
type.
Surface runoff collected from runoff plots in autumn 1993 detected elevated levels of N,
P, K, Ca, Mg, Na, and S in plots treated with dewatered cake compared to the controls.
However, once full ground cover was achieved in spring 1993, solutes and sediments in
runoff were reduced to levels unlikely to pose any problems of contamination. Overall,
lower runoff volumes were recorded where 60 and 120 t/ha of dewatered cake was ap-
plied. For example, a 50 mm rainfall event produced a runoff yield of 1566 L/ha on con-
trol plots, but only 219 L/ha in the 120 t/ha treatment.
11
image:
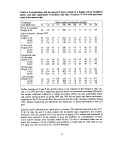 Sewage contaminants: Post-treatent soil analyses detected high concentrations of Zn, Cr,
Cd, Ni, Pb and Cu in the topsoil of plots treated with sewage cake compared to N-Viro
Soil which caused little change in metal content relative to the control (Table 4). Down-
ward movement of Cu and Zn was detected in cake treated plots where their concentra-
tions at 30 cm in the 120 t/ha plots were 3 times those of the control. No lateral movement
of Zn or Cu was detected in preliminary comparisons from outside and inside exclosure
on the 120 t/ha plots.
Effects of sewage products on pasture parameters.
Production and composition: Pasture production has responded significantly to the nutri-
ents provided either by conventional ferilizers or sewage products. Overall, plots treated
with dewatered cake produced slightly more dry matter, especially during droughty peri-
ods when pasture benefited from the improved infiltration and water holding capacity of
soil where >60 t/ha of cake was applied (Table 5). No ill effects of sewage contaminants
on the yield or composition observed over the 18 months since the pasture was sown.
Botanical composition has changed significantly since sowing (Figure 3). Ryecorn, an an-
nual cereal, accounted for >80% of total biomass during the establishment phase in 1993.
By June 1994, the composition of ryecorn declined to about 30% and perennial grasses in-
creased to 40 to 60% of standing biomass. The large proportion of ryecorn measured in
November 1994 and February 1995 was dry residue which had little feed value for graz-
ing sheep.
At present cocksfoot is the most abundant of the grasses sown accounting for 50 to 70%
of the perennial component with the higher proportions present in the control and N-Viro
Soil plots. Phalaris content increased with sewage application from <11% in the control to
>20% in the 120 t/ha treatment. Ryegrass accounted for <5% of production in all treat-
ments.
Legumes accounted for 27 to 35% of pasture yield in the control and N-Viro Soil, but
were a minor component of pasture where dewatered cake was applied (Figure 3). White
clover was the dominant legume until spring 1994, but declined over the summer due to
the dry conditions. This may caused high stolon mortality that will limit the ability of
white clover to respond to autumn rains.
Table 5. Effects of sewage products and fertilizer on available pasture yield (t/ha) on
Hill A at Goulburn.
Treatment
Control
N-Viro Soil
30 t/ha cake
60 t/ha cake
120 t/ha cake
Selected sampling dates
June
1993
3.44
3.09
4.55
5.55
5.65
Sept
1993
9.45
NM
11.4
9.1
9.9
June
1994
3.23
3.54
4.14
4.48
4.62
Aug
1994
3.12
4.27
3.05
2.76
3.04
Nov
1994
2.87
3.08
2.47
2.91
3.01
Feb
1995
2.32
3.01
2.37
2.56
2.76
12
image:
Sewage contaminants: Post-treatent soil analyses detected high concentrations of Zn, Cr,
Cd, Ni, Pb and Cu in the topsoil of plots treated with sewage cake compared to N-Viro
Soil which caused little change in metal content relative to the control (Table 4). Down-
ward movement of Cu and Zn was detected in cake treated plots where their concentra-
tions at 30 cm in the 120 t/ha plots were 3 times those of the control. No lateral movement
of Zn or Cu was detected in preliminary comparisons from outside and inside exclosure
on the 120 t/ha plots.
Effects of sewage products on pasture parameters.
Production and composition: Pasture production has responded significantly to the nutri-
ents provided either by conventional ferilizers or sewage products. Overall, plots treated
with dewatered cake produced slightly more dry matter, especially during droughty peri-
ods when pasture benefited from the improved infiltration and water holding capacity of
soil where >60 t/ha of cake was applied (Table 5). No ill effects of sewage contaminants
on the yield or composition observed over the 18 months since the pasture was sown.
Botanical composition has changed significantly since sowing (Figure 3). Ryecorn, an an-
nual cereal, accounted for >80% of total biomass during the establishment phase in 1993.
By June 1994, the composition of ryecorn declined to about 30% and perennial grasses in-
creased to 40 to 60% of standing biomass. The large proportion of ryecorn measured in
November 1994 and February 1995 was dry residue which had little feed value for graz-
ing sheep.
At present cocksfoot is the most abundant of the grasses sown accounting for 50 to 70%
of the perennial component with the higher proportions present in the control and N-Viro
Soil plots. Phalaris content increased with sewage application from <11% in the control to
>20% in the 120 t/ha treatment. Ryegrass accounted for <5% of production in all treat-
ments.
Legumes accounted for 27 to 35% of pasture yield in the control and N-Viro Soil, but
were a minor component of pasture where dewatered cake was applied (Figure 3). White
clover was the dominant legume until spring 1994, but declined over the summer due to
the dry conditions. This may caused high stolon mortality that will limit the ability of
white clover to respond to autumn rains.
Table 5. Effects of sewage products and fertilizer on available pasture yield (t/ha) on
Hill A at Goulburn.
Treatment
Control
N-Viro Soil
30 t/ha cake
60 t/ha cake
120 t/ha cake
Selected sampling dates
June
1993
3.44
3.09
4.55
5.55
5.65
Sept
1993
9.45
NM
11.4
9.1
9.9
June
1994
3.23
3.54
4.14
4.48
4.62
Aug
1994
3.12
4.27
3.05
2.76
3.04
Nov
1994
2.87
3.08
2.47
2.91
3.01
Feb
1995
2.32
3.01
2.37
2.56
2.76
12
image:
 I Perennial grass B Legume B Ryecorn D Forbs
100
,-s 80
O 60
'£
at
a. 40
S o g, §, g,
o
= = =
A .° « "35 "»
> (B (8 (8
z §g I
CO tD CM
September
1993
S
•
o •— m w w
^ (0 CO CO
CO § W
June
1994
o
O>
TJ
3
ooSH §0.1=1
Q.CWWW Q .£ « w «
^ co co CD ^ (0 co (0
z g g § . z i II
§88
•« :^ fl) (B CD
IcS^^-g1
60 -2 — —
-WWW
o o o
CO CD CM
T-
August
1994
o o o
CO <O CM
November
1994
February
1995
Figure 3. Effects of sewage products and fertilizers on composition of pastures grown
on duplex soil at Goulburn
Broadleaf weeds such as capeweed (Arctotheca calendula) and volunteer tomatoes (in de-
watered cake plots only) comprise 5 to 20% of pasture on offer (Figure 3). These species
are regarded as weeds of sown perennial grass based pastures that are unimportant for
livestock production, but they compete vigorously with desirable species.
Nutrient content of pastures: Application of dewatered cake significantly increased the
concentration of N, P, S, Ca and Mg in all pasture species when compared to the control
and N-Viro Soil treatments. This is illustrated by samples collected in August 1994 (Table
6). Boron was below the critical levels for ryecorn (5 mg/kg) in all treatments, but was not
deficient in other pasture components. Zinc levels were high in all pasture species in the
dewatered cake treated plots with the concentration increasing with application rate (Fig-
ure 4). Copper levels were only high in capeweed (Figure 4).
Content of contaminating metals: In general, the heavy metal contents of sown grasses,
legumes and ryecorn were below the maximum tolerable levels (MTLs) for livestock pro-
duction (Figure 4). In contrast, the 'other species' category which consisted mainly of
capeweed accumulated all heavy metals at extreme levels (Figure 4), and exceeded the
MTL (given in brackets) for Cd (0.5 mg/kg), Cu (15 mg/kg) and Fe (500 mg/kg). Nickel
content was elevated in all pasture species (except ryecorn) grown on plots treated with
dewatered cake, but the level was still below the MTL for sheep (50 mg/kg).
Effects of sewage products on sheep production.
Production parameters: There has been no significant difference in ewe condition be-
tween treatments, but ewes grazing the control and N-Viro Soil plots were at least 4 kg
13
image:
I Perennial grass B Legume B Ryecorn D Forbs
100
,-s 80
O 60
'£
at
a. 40
S o g, §, g,
o
= = =
A .° « "35 "»
> (B (8 (8
z §g I
CO tD CM
September
1993
S
•
o •— m w w
^ (0 CO CO
CO § W
June
1994
o
O>
TJ
3
ooSH §0.1=1
Q.CWWW Q .£ « w «
^ co co CD ^ (0 co (0
z g g § . z i II
§88
•« :^ fl) (B CD
IcS^^-g1
60 -2 — —
-WWW
o o o
CO CD CM
T-
August
1994
o o o
CO <O CM
November
1994
February
1995
Figure 3. Effects of sewage products and fertilizers on composition of pastures grown
on duplex soil at Goulburn
Broadleaf weeds such as capeweed (Arctotheca calendula) and volunteer tomatoes (in de-
watered cake plots only) comprise 5 to 20% of pasture on offer (Figure 3). These species
are regarded as weeds of sown perennial grass based pastures that are unimportant for
livestock production, but they compete vigorously with desirable species.
Nutrient content of pastures: Application of dewatered cake significantly increased the
concentration of N, P, S, Ca and Mg in all pasture species when compared to the control
and N-Viro Soil treatments. This is illustrated by samples collected in August 1994 (Table
6). Boron was below the critical levels for ryecorn (5 mg/kg) in all treatments, but was not
deficient in other pasture components. Zinc levels were high in all pasture species in the
dewatered cake treated plots with the concentration increasing with application rate (Fig-
ure 4). Copper levels were only high in capeweed (Figure 4).
Content of contaminating metals: In general, the heavy metal contents of sown grasses,
legumes and ryecorn were below the maximum tolerable levels (MTLs) for livestock pro-
duction (Figure 4). In contrast, the 'other species' category which consisted mainly of
capeweed accumulated all heavy metals at extreme levels (Figure 4), and exceeded the
MTL (given in brackets) for Cd (0.5 mg/kg), Cu (15 mg/kg) and Fe (500 mg/kg). Nickel
content was elevated in all pasture species (except ryecorn) grown on plots treated with
dewatered cake, but the level was still below the MTL for sheep (50 mg/kg).
Effects of sewage products on sheep production.
Production parameters: There has been no significant difference in ewe condition be-
tween treatments, but ewes grazing the control and N-Viro Soil plots were at least 4 kg
13
image:
 Table 6. Effect of sewage waste products on the macro-nutrient content of pasture
species at Goulburn (August, 1994).
Treatments
Control
N-Viro
30 t/ha cake
60t/ha
120 t/ha
Pasture
component
Grass
Ryecorn
Legume
Capeweed
Grass
Ryecorn
Legume
Capeweed
Grass
Ryecorn
Legume
Capeweed
Grass
Ryecorn
Legume
Capeweed
Grass
Ryecorn
Legume
Capeweed
Nutrient (%)
P
0.15
0.13
0.20
0.15
0.11
0.13
0.18
0.15
0.18
0.17
0.25
0.33
0.20
0.20
0.29
0.31
0.25
0.22
0.32
0.35
S
0.24
0.13
0.23
0.24
0.19
0.13
0.22
0.23
0.34
0.18
0.31
0.35
0.37
0.19
0.32
0.34
0.42
0.23
0.37
0.40
Ca
0.46
0.16
1.24
1.02
0.42
0.17
1.17
1.06
0.42
0.23
1.00
1.09
0.51
0.28
1.10
0.92
0.58
0.34
1.13
1.08
K
1.96
0.99
1.95
1.66
1.90
1.19
2.30
2.55
2.12
1.45
2.30
2.94
2.11
1.41
2.18
2.46
2.09
1.46
2.14
2.56
Mg
0.22
0.11
0.28
0.32
0.22
0.11
0.28
0.32
0.26
0.17
0.26
0.39
0.26
0.17
0.27
0.41
0.31
0.20
0.26
0.41
heavier than those grazing dewatered cake plots in all measurements since lambing in
June 1994. This difference reflected the better quality pasture available in control and N-
Viro Soil treatments where the legume content was higher and there was less carry-over of
ryecorn residue.
The effects of a better balanced diet was also reflected in wool production with ewes graz-
ing the control and N-Viro Soil areas producing 0.5 kg more wool than dewatered cake
treatments over the 12 month period (Table 7). There was also a trend toward better wool
quality in the control and N-Viro Soil plots where >87% of fleeces were classed in the su-
perior line (AAAA) whereas a high proportion of fleeces (>27%) from ewesgrazing 60
and 120 t/ha cake treatments were down graded due to tenderness or short staple length
(Table 7). An assessment of the economic impact of these differences in wool yield and
quality will be made when samples are analysed for fibre diameter and tenderness.
The 95% joining rate achieved from the January joining produced a 75% marking rate of
lambs measured in September, 1994. At weaning in October, lambs from the control and
N-Viro Soil treatments weighed 27.4 kg compared with only 22.2 kg for plots treated with
dewatered cake. This superiority in lamb growth rate on the control and N-Viro Soil plots
was continued in the post-weaning performance of lambs measured in November, 1994.
Differences in sward structure, pasture composition and pasture quality account for the
14
image:
Table 6. Effect of sewage waste products on the macro-nutrient content of pasture
species at Goulburn (August, 1994).
Treatments
Control
N-Viro
30 t/ha cake
60t/ha
120 t/ha
Pasture
component
Grass
Ryecorn
Legume
Capeweed
Grass
Ryecorn
Legume
Capeweed
Grass
Ryecorn
Legume
Capeweed
Grass
Ryecorn
Legume
Capeweed
Grass
Ryecorn
Legume
Capeweed
Nutrient (%)
P
0.15
0.13
0.20
0.15
0.11
0.13
0.18
0.15
0.18
0.17
0.25
0.33
0.20
0.20
0.29
0.31
0.25
0.22
0.32
0.35
S
0.24
0.13
0.23
0.24
0.19
0.13
0.22
0.23
0.34
0.18
0.31
0.35
0.37
0.19
0.32
0.34
0.42
0.23
0.37
0.40
Ca
0.46
0.16
1.24
1.02
0.42
0.17
1.17
1.06
0.42
0.23
1.00
1.09
0.51
0.28
1.10
0.92
0.58
0.34
1.13
1.08
K
1.96
0.99
1.95
1.66
1.90
1.19
2.30
2.55
2.12
1.45
2.30
2.94
2.11
1.41
2.18
2.46
2.09
1.46
2.14
2.56
Mg
0.22
0.11
0.28
0.32
0.22
0.11
0.28
0.32
0.26
0.17
0.26
0.39
0.26
0.17
0.27
0.41
0.31
0.20
0.26
0.41
heavier than those grazing dewatered cake plots in all measurements since lambing in
June 1994. This difference reflected the better quality pasture available in control and N-
Viro Soil treatments where the legume content was higher and there was less carry-over of
ryecorn residue.
The effects of a better balanced diet was also reflected in wool production with ewes graz-
ing the control and N-Viro Soil areas producing 0.5 kg more wool than dewatered cake
treatments over the 12 month period (Table 7). There was also a trend toward better wool
quality in the control and N-Viro Soil plots where >87% of fleeces were classed in the su-
perior line (AAAA) whereas a high proportion of fleeces (>27%) from ewesgrazing 60
and 120 t/ha cake treatments were down graded due to tenderness or short staple length
(Table 7). An assessment of the economic impact of these differences in wool yield and
quality will be made when samples are analysed for fibre diameter and tenderness.
The 95% joining rate achieved from the January joining produced a 75% marking rate of
lambs measured in September, 1994. At weaning in October, lambs from the control and
N-Viro Soil treatments weighed 27.4 kg compared with only 22.2 kg for plots treated with
dewatered cake. This superiority in lamb growth rate on the control and N-Viro Soil plots
was continued in the post-weaning performance of lambs measured in November, 1994.
Differences in sward structure, pasture composition and pasture quality account for the
14
image:
 ] Control g| N-ViroSoil • Dewatered sludge
(1 = 30 t/ha; 2 = 60 t/ha; 3 = 120 t/ha)
12
E.
¥
Pasture components
Figure 4. Effect of application of sewage products on the heavy metal content of pasture
components measured in August, 1994, at Goulburn.
differences in lamb and weaner performance. The lower pasture height and higher legume
content in the control and N-Viro Soil plots enabled ewes to produce more milk, and lambs and
weaners to select a better quality diet than animals grazing sludge treated plots, particularly in
the June to August period.
During dry periods when pasture production could not meet the requirements of the grazing
livestock, supplementary feed at a maintenance level was supplied at the same rate to all
treatments. Following local farmer practice, sheep nuts were fed directly onto the ground which
exposed animals to possible ingestion of soil, but soil intake was not measured.
Heavy metals and organochlorines in sheep: Fifteen ewes were slaughtered prior to exposure
to sewage products to establish background levels of heavy metals and organochlorines in tissues
and fat. All concentrations of As, Cd, Cu, Hg, Pb, Se, Ni and Zn in liver, kidney and muscle
samples were well below the maximum permissible concentracions (MFCs), and
organochlorines in fat samples were below detection.
15
image:
] Control g| N-ViroSoil • Dewatered sludge
(1 = 30 t/ha; 2 = 60 t/ha; 3 = 120 t/ha)
12
E.
¥
Pasture components
Figure 4. Effect of application of sewage products on the heavy metal content of pasture
components measured in August, 1994, at Goulburn.
differences in lamb and weaner performance. The lower pasture height and higher legume
content in the control and N-Viro Soil plots enabled ewes to produce more milk, and lambs and
weaners to select a better quality diet than animals grazing sludge treated plots, particularly in
the June to August period.
During dry periods when pasture production could not meet the requirements of the grazing
livestock, supplementary feed at a maintenance level was supplied at the same rate to all
treatments. Following local farmer practice, sheep nuts were fed directly onto the ground which
exposed animals to possible ingestion of soil, but soil intake was not measured.
Heavy metals and organochlorines in sheep: Fifteen ewes were slaughtered prior to exposure
to sewage products to establish background levels of heavy metals and organochlorines in tissues
and fat. All concentrations of As, Cd, Cu, Hg, Pb, Se, Ni and Zn in liver, kidney and muscle
samples were well below the maximum permissible concentracions (MFCs), and
organochlorines in fat samples were below detection.
15
image:
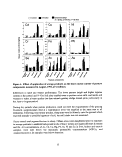 Table 7. Wool production from Merino ewes grazing pastures treated with sewage
products at Goulburn.
Treatments
Control
N-Viro Soil
30 t/ha cake
60 t/ha cake
120 t/ha cake
AAAA denotes
fleeces.
Wool cut
(kg/ewe)
3.77
3.65
3.22
3.19
3.20
superior fleeces, FLC
Wool production parameters
Fleece quality
AAAA FLC AA
(% in each category)
871 101 31
90 7 3
90 3 7
63 20 17
73 27 0
fleeces showing tenderness and
Skirting ratio
(Fleece:skirting)
6.1 : 1
6.4: 1
6.4: 1
6.2:1
6.0:1
AA shorter stapled
Analyses of milk samples collected in July, 1994, showed no consistent differences in
heavy metals attributable to application of sewage waste. All organic contaminants were
below detection level. Although milk samples were free from contamination, assay of tis-
sues from lambs slaughtered at weaning (October, 1994) showed a 3 to 7 fold increase in
Ni concentration in liver, kidney and muscle samples of lambs raised on dewatered cake
treatments compared to the control and N-Viro Soil where the Ni level was <0.05 mg/kg.
The selection of fresh, green pasture which was high in Ni (Figure 4) was the most likely
source of this contamination. Analyses of tissue samples collected in December, 1994, of
ewes with >12 months exposure to sewage contaminants are still to be analysed.
No change in heavy metal levels were detected by analysis of wool samples taken at
shearing in October, 1994. However, there were detectable levels of total DDT and total
PCBs, but since these were similar in all treatments, sheep management practices prior to
exposure to sewage products is the most likely source of these organics.
Discussion and Conclusion
Although sewage waste and farm-yard manures have been used for some time to produce
pastures and forage crops for consumption by livestock, the effects of contaminants on the
quality of products derived from livestock grazing sewage treated land need further inves-
tigation. The importance of such research was highlighted by the large number of missing
values for many of the important metal contaminants summarized by the USEPA (1989a)
for risk pathways associated with the transfer of sewage pollutants from sewage to live-
stock and thence to humans.
There is a particular need to validate key data in Australia where environmental conditions
(especially soils with unusual characteristics) and livestock production systems differ
from those in Europe and North America. The very low maximum residue limits on ex-
ported animal products is another reason that such research is required in Australia.
16
image:
Table 7. Wool production from Merino ewes grazing pastures treated with sewage
products at Goulburn.
Treatments
Control
N-Viro Soil
30 t/ha cake
60 t/ha cake
120 t/ha cake
AAAA denotes
fleeces.
Wool cut
(kg/ewe)
3.77
3.65
3.22
3.19
3.20
superior fleeces, FLC
Wool production parameters
Fleece quality
AAAA FLC AA
(% in each category)
871 101 31
90 7 3
90 3 7
63 20 17
73 27 0
fleeces showing tenderness and
Skirting ratio
(Fleece:skirting)
6.1 : 1
6.4: 1
6.4: 1
6.2:1
6.0:1
AA shorter stapled
Analyses of milk samples collected in July, 1994, showed no consistent differences in
heavy metals attributable to application of sewage waste. All organic contaminants were
below detection level. Although milk samples were free from contamination, assay of tis-
sues from lambs slaughtered at weaning (October, 1994) showed a 3 to 7 fold increase in
Ni concentration in liver, kidney and muscle samples of lambs raised on dewatered cake
treatments compared to the control and N-Viro Soil where the Ni level was <0.05 mg/kg.
The selection of fresh, green pasture which was high in Ni (Figure 4) was the most likely
source of this contamination. Analyses of tissue samples collected in December, 1994, of
ewes with >12 months exposure to sewage contaminants are still to be analysed.
No change in heavy metal levels were detected by analysis of wool samples taken at
shearing in October, 1994. However, there were detectable levels of total DDT and total
PCBs, but since these were similar in all treatments, sheep management practices prior to
exposure to sewage products is the most likely source of these organics.
Discussion and Conclusion
Although sewage waste and farm-yard manures have been used for some time to produce
pastures and forage crops for consumption by livestock, the effects of contaminants on the
quality of products derived from livestock grazing sewage treated land need further inves-
tigation. The importance of such research was highlighted by the large number of missing
values for many of the important metal contaminants summarized by the USEPA (1989a)
for risk pathways associated with the transfer of sewage pollutants from sewage to live-
stock and thence to humans.
There is a particular need to validate key data in Australia where environmental conditions
(especially soils with unusual characteristics) and livestock production systems differ
from those in Europe and North America. The very low maximum residue limits on ex-
ported animal products is another reason that such research is required in Australia.
16
image:
 Areas of interest for use of sewage products in pasture ecosystems in NSW include: (1)
determination of appropriate one-time application rates for pastures based on nutrient
loadings; and (2) the absorption in topsoil, loss through surface erosion, movement into
groundwater, uptake in plants and ingestion by livestock of contaminating metals and or-
ganics when sewage waste is applied to acidic, infertile, low cation exchange soils.
This project, which is planned to continue until 2002, was established to quantify the
benefits and risks involved in applying sewage waste to perennial grass pastures grown on
poor, acid soil and grazed year-round by breeding Merino sheep. In general, since uptake
of potentially toxic pollutants of sewage waste by livestock occurs through ingestion of
plants, soil and water, the combined effects of these three pathways needs to be assessed.
However, in this study the impact of uptake of pollutants via water was eliminated by pro-
viding wholesome stock water through an articulation system from an uncontaminated
source upstream from the project site. Such systems are common place in commercial
sheep enterprises in the Southern Tablelands region.
Transfer of biosolid pollutants from soil either directly to grazing livestock or via plants is
a function of factors such as: the contaminants present in the sewage; the cumulative
biosolid application rate; characteristics of the sewage product; the application method;
soil pH; climate; and plant species and cultivars grown (Chancy et al. 1987b). The results
presented, though equivocal at this point, highlight the changes in water, soil and plant
components that result when sewage products are applied at high rates to soils more acidic
than those used elsewhere in the world, and the risks they present to contaminate grazing
sheep.
Movement of contaminating metals within the pasture ecosystem was consistent with their
known bioavailability: Zn > Cu > Ni > Pb. Loadings of these metals covered a sufficient
range to provide a good test of their behavior under field conditions representative of 70%
of the target area for use of sewage waste. Based on the MCLs specified in the Interim
Code of Practice (1994), the concentration of Zn and Cu will determine the use rate in
pasture ecosystems for the majority of the sewage waste produced in NSW. However, as
is the case with all contaminants, the concentration of Zn and Cu varies widely according
to industrial processing on a day-to-day basis. In this study, concentrations in dewatered
cake ranged from 2216 to 4538 mg/kg for Zn and 1129 to 1552 mg/kg for Cu. This means
that if both metals were present at the low range, about 90 t/ha of dewatered cake could be
applied to remain within the MCL, but if both were present at the high range, only about
40 t/ha could be applied to keep the MCL for Zn below 200 kg/ha.
Cadmium which is a sewage contaminant of concern in Australia because of the low
maximum residue set for export products (Langlands et al. 1988) was present at a much
lower concentration (8-15 mg/kg) in the sewage waste applied at Goulburn than the 32
mg/kg reported as the average for the Malabar STP. However, even at this higher Cd con-
centration, the rate of dewatered cake application would still be determined by Zn and/or
Cu content. Only for sewage wastes from mining and highly industrialized areas such as
Mount Isa and Port Kembla would Cd content determine application rate (de Vries 1983).
The movement of metal contaminants reported here confirm previous studies (eg. Lund et
17
image:
Areas of interest for use of sewage products in pasture ecosystems in NSW include: (1)
determination of appropriate one-time application rates for pastures based on nutrient
loadings; and (2) the absorption in topsoil, loss through surface erosion, movement into
groundwater, uptake in plants and ingestion by livestock of contaminating metals and or-
ganics when sewage waste is applied to acidic, infertile, low cation exchange soils.
This project, which is planned to continue until 2002, was established to quantify the
benefits and risks involved in applying sewage waste to perennial grass pastures grown on
poor, acid soil and grazed year-round by breeding Merino sheep. In general, since uptake
of potentially toxic pollutants of sewage waste by livestock occurs through ingestion of
plants, soil and water, the combined effects of these three pathways needs to be assessed.
However, in this study the impact of uptake of pollutants via water was eliminated by pro-
viding wholesome stock water through an articulation system from an uncontaminated
source upstream from the project site. Such systems are common place in commercial
sheep enterprises in the Southern Tablelands region.
Transfer of biosolid pollutants from soil either directly to grazing livestock or via plants is
a function of factors such as: the contaminants present in the sewage; the cumulative
biosolid application rate; characteristics of the sewage product; the application method;
soil pH; climate; and plant species and cultivars grown (Chancy et al. 1987b). The results
presented, though equivocal at this point, highlight the changes in water, soil and plant
components that result when sewage products are applied at high rates to soils more acidic
than those used elsewhere in the world, and the risks they present to contaminate grazing
sheep.
Movement of contaminating metals within the pasture ecosystem was consistent with their
known bioavailability: Zn > Cu > Ni > Pb. Loadings of these metals covered a sufficient
range to provide a good test of their behavior under field conditions representative of 70%
of the target area for use of sewage waste. Based on the MCLs specified in the Interim
Code of Practice (1994), the concentration of Zn and Cu will determine the use rate in
pasture ecosystems for the majority of the sewage waste produced in NSW. However, as
is the case with all contaminants, the concentration of Zn and Cu varies widely according
to industrial processing on a day-to-day basis. In this study, concentrations in dewatered
cake ranged from 2216 to 4538 mg/kg for Zn and 1129 to 1552 mg/kg for Cu. This means
that if both metals were present at the low range, about 90 t/ha of dewatered cake could be
applied to remain within the MCL, but if both were present at the high range, only about
40 t/ha could be applied to keep the MCL for Zn below 200 kg/ha.
Cadmium which is a sewage contaminant of concern in Australia because of the low
maximum residue set for export products (Langlands et al. 1988) was present at a much
lower concentration (8-15 mg/kg) in the sewage waste applied at Goulburn than the 32
mg/kg reported as the average for the Malabar STP. However, even at this higher Cd con-
centration, the rate of dewatered cake application would still be determined by Zn and/or
Cu content. Only for sewage wastes from mining and highly industrialized areas such as
Mount Isa and Port Kembla would Cd content determine application rate (de Vries 1983).
The movement of metal contaminants reported here confirm previous studies (eg. Lund et
17
image:
 al. 1976; Lawrie et al. 1991) where Zn, Cu and Cd were detected down to a depth of >30
cm in soils with pH <5.5. Soil pH, CEC and texture are the soil properties influencing the
movement of heavy metals. Rapid leaching of metals in the light textured, acidic Goul-
burn soils highlights the importance of selecting the right soil types for sewage waste ap-
plication. The range of soil types under study at Goulburn will enable the most
appropriate soil type to be identified.
The movement of N and P in our study is also consistent with the physical characteristics
of the Goulburn soils which results in low nutrient retention in the A horizon. The dense
subsoil of low porosity (58% clay) may provide a barrier to pollution of ground water, but
lateral movement may occur given favourable moisture conditions. No lateral movement
has been measured to date, but this may reflect the very dry conditions experienced in
1993/4. Below average rainfall also limited the response of pasture production to the N
and P inputs derived from sewage waste. High rainfall variability in the Southern Table-
lands region highlights the need to continue the monitoring of this site to assess the long-
term bioavailability of sewage derived metals and the impact of nutrients on the
environment.
The addition of 7.5 t/ha of N-Viro Soil (alkali-stabilized sewage waste) increased soil pH
sufficiently to correct acidity. However, contrary to results reported by Willett et al.
(1984), N-Viro Soil was not superior to lime in promoting downward movement of Ca
and neutralization of sub-soil acidity. Nor did sewage derived Ca produce higher Ca in
plant tops relative to the lime-treated control as reported by Willett et al. (1984).
Due to the dry conditions encountered since July 1993, the effect of the large loadings of
all macro-nutrients except K has been smaller than expected. However, application of de-
watered cake significantly increased the content of all essential nurtients in sown grasses
and legumes. Although the total P loading was well above the requirements of pasture
species and could possibly lead to P toxicity (Kirkham 1982), the concentrations meas-
ured in tops of various pasture species were below toxic levels (Rueter and Robinson
1986).
In many studies, the benefical effects of nutrients is offset by the accumulation of toxic
elements in plant tops (Sterritt and Lester 1980). However, for many pasture species there
is little information on the accumulation of heavy metals and their effect on growth and
reproduction. Our results showed that the sown perennial grasses accumulated Zn and Ni,
and that Cd, Zn and Ni levels were elevated in clover tops. However, the concentrations
did not cause any observed phytotoxicity and did not pose a risk to sheep as they were
well below the MTLs. These were the same metals reported by Baxter et al. (1983) to ac-
cumulate in native pasture (mainly Buffalograss - Buchloe dactyloides) grown on a sew-
age disposal site in Denver, and by Lawrie et al. (1991) for sown pastures treated with
dewatered cake in NSW.
In contrast, capeweed accumulated all metals at high rates and exceeded the MTL for Cd,
Cu and Fe. Uptake rates were often four times those measured for legumes and grasses. In
Western Australia, capeweed has been implicated in the Cd accumulation in soft tissues of
18
image:
al. 1976; Lawrie et al. 1991) where Zn, Cu and Cd were detected down to a depth of >30
cm in soils with pH <5.5. Soil pH, CEC and texture are the soil properties influencing the
movement of heavy metals. Rapid leaching of metals in the light textured, acidic Goul-
burn soils highlights the importance of selecting the right soil types for sewage waste ap-
plication. The range of soil types under study at Goulburn will enable the most
appropriate soil type to be identified.
The movement of N and P in our study is also consistent with the physical characteristics
of the Goulburn soils which results in low nutrient retention in the A horizon. The dense
subsoil of low porosity (58% clay) may provide a barrier to pollution of ground water, but
lateral movement may occur given favourable moisture conditions. No lateral movement
has been measured to date, but this may reflect the very dry conditions experienced in
1993/4. Below average rainfall also limited the response of pasture production to the N
and P inputs derived from sewage waste. High rainfall variability in the Southern Table-
lands region highlights the need to continue the monitoring of this site to assess the long-
term bioavailability of sewage derived metals and the impact of nutrients on the
environment.
The addition of 7.5 t/ha of N-Viro Soil (alkali-stabilized sewage waste) increased soil pH
sufficiently to correct acidity. However, contrary to results reported by Willett et al.
(1984), N-Viro Soil was not superior to lime in promoting downward movement of Ca
and neutralization of sub-soil acidity. Nor did sewage derived Ca produce higher Ca in
plant tops relative to the lime-treated control as reported by Willett et al. (1984).
Due to the dry conditions encountered since July 1993, the effect of the large loadings of
all macro-nutrients except K has been smaller than expected. However, application of de-
watered cake significantly increased the content of all essential nurtients in sown grasses
and legumes. Although the total P loading was well above the requirements of pasture
species and could possibly lead to P toxicity (Kirkham 1982), the concentrations meas-
ured in tops of various pasture species were below toxic levels (Rueter and Robinson
1986).
In many studies, the benefical effects of nutrients is offset by the accumulation of toxic
elements in plant tops (Sterritt and Lester 1980). However, for many pasture species there
is little information on the accumulation of heavy metals and their effect on growth and
reproduction. Our results showed that the sown perennial grasses accumulated Zn and Ni,
and that Cd, Zn and Ni levels were elevated in clover tops. However, the concentrations
did not cause any observed phytotoxicity and did not pose a risk to sheep as they were
well below the MTLs. These were the same metals reported by Baxter et al. (1983) to ac-
cumulate in native pasture (mainly Buffalograss - Buchloe dactyloides) grown on a sew-
age disposal site in Denver, and by Lawrie et al. (1991) for sown pastures treated with
dewatered cake in NSW.
In contrast, capeweed accumulated all metals at high rates and exceeded the MTL for Cd,
Cu and Fe. Uptake rates were often four times those measured for legumes and grasses. In
Western Australia, capeweed has been implicated in the Cd accumulation in soft tissues of
18
image:
 sheep grazing pastures previously fertilized with superphosphate containing a high Cd content.
Based on our preliminary findings, we recommend that management should aim to keep such
broadleaf forbs at minimal levels in pastures grown on soils treated with sewage waste.
Provided phytotoxicty does not occur first, excessive animal residues from As, Hg, Fe, Ni, Co,
Mo, Zn and a range of organic compounds can occur. The two routes for the transfer of these
contaminants to sheep in this study were by ingestion of soil or through eating plants with
elevated levels of sewage pollutants. It is not possible to differentiate the importance of these two
pathways. However, Fleming (1986) calculated that about 14% of dry matter intake of sheep
maintained in all year grazing systems is ingested soil. Undoubtedly, this pathway may have
been an important source of contamination before full ground cover was achieve, particularly
in the 120 t/ha treatment where some biosolid remained on the surface. However, since the first
summer (1993/4), ground cover has exceeded 80% due to ryecorn stubble and perennial grasses,
and reduced the potential for soil ingestion even when sheep were fed supplement directly on
the ground.
This means that contaminants accumulated in plant tops has constituted the main hazard for
sheep in this study. However, after one year of exposure, production and health of ewes and lamb
has not been affected by grazing pastures treated with sewage products. The common sheep
production parameters of liveweight, wool production and marking percentage suggest that the
absence of legume from pastures in the dewatered cake treatment exerted a larger production
penalty than contaminants derived from sewage waste. However, accumulation of Cu and Zn are
likely to occur over time. For example, Ross and Short (1990) reported that it took 3 years for
metal residues to reach significant levels in sheep grazing similar pastures treated with Sydney
sewage waste. Continued monitoring of the current program is needed to elucidate possible risks
associated with metal accumulation in the pasture ecosystem.
Conclusion
Based on our findings, we suggest that 60 t/ha may be a feasible one-time application rate of
Malabar STP dewatered cake that maximizes benefits from organic matter and nutrients on soils
and pasture, and minimizes environmental pollution and spoilage of livestock products.
However, monitoring of this project will continue for at least another 5 years when a full
economic and environmental assessment of the effects of sewage waste application on a pasture
ecosystem will be possible.
Acknowledgments
We wish to thank the Sydney Water Corporation for providing funding for this project as part
of the joint arrangement with NSW Agriculture to investigate the potential and risks associated
with the use of sewage products in a range of agricultural activities in New South Wales. We
also acknowledge the significant contribution of Peter Simpson and John Rawle, in developing
the infrastructure at the Goulburn site, and Bob Sproule in his delicate handling of the public
relations aspects of the on-farm study.
19
image:
sheep grazing pastures previously fertilized with superphosphate containing a high Cd content.
Based on our preliminary findings, we recommend that management should aim to keep such
broadleaf forbs at minimal levels in pastures grown on soils treated with sewage waste.
Provided phytotoxicty does not occur first, excessive animal residues from As, Hg, Fe, Ni, Co,
Mo, Zn and a range of organic compounds can occur. The two routes for the transfer of these
contaminants to sheep in this study were by ingestion of soil or through eating plants with
elevated levels of sewage pollutants. It is not possible to differentiate the importance of these two
pathways. However, Fleming (1986) calculated that about 14% of dry matter intake of sheep
maintained in all year grazing systems is ingested soil. Undoubtedly, this pathway may have
been an important source of contamination before full ground cover was achieve, particularly
in the 120 t/ha treatment where some biosolid remained on the surface. However, since the first
summer (1993/4), ground cover has exceeded 80% due to ryecorn stubble and perennial grasses,
and reduced the potential for soil ingestion even when sheep were fed supplement directly on
the ground.
This means that contaminants accumulated in plant tops has constituted the main hazard for
sheep in this study. However, after one year of exposure, production and health of ewes and lamb
has not been affected by grazing pastures treated with sewage products. The common sheep
production parameters of liveweight, wool production and marking percentage suggest that the
absence of legume from pastures in the dewatered cake treatment exerted a larger production
penalty than contaminants derived from sewage waste. However, accumulation of Cu and Zn are
likely to occur over time. For example, Ross and Short (1990) reported that it took 3 years for
metal residues to reach significant levels in sheep grazing similar pastures treated with Sydney
sewage waste. Continued monitoring of the current program is needed to elucidate possible risks
associated with metal accumulation in the pasture ecosystem.
Conclusion
Based on our findings, we suggest that 60 t/ha may be a feasible one-time application rate of
Malabar STP dewatered cake that maximizes benefits from organic matter and nutrients on soils
and pasture, and minimizes environmental pollution and spoilage of livestock products.
However, monitoring of this project will continue for at least another 5 years when a full
economic and environmental assessment of the effects of sewage waste application on a pasture
ecosystem will be possible.
Acknowledgments
We wish to thank the Sydney Water Corporation for providing funding for this project as part
of the joint arrangement with NSW Agriculture to investigate the potential and risks associated
with the use of sewage products in a range of agricultural activities in New South Wales. We
also acknowledge the significant contribution of Peter Simpson and John Rawle, in developing
the infrastructure at the Goulburn site, and Bob Sproule in his delicate handling of the public
relations aspects of the on-farm study.
19
image:
 References
Addiscott, T. (1988) Farmers, fertilizers and the nitrate flood. New Scientist, 8: 50-54.
Awad, A.S., Ross, A.D. and Lawrie, R.A. (1989) Guidelines for die use of sewage sludge
on agricultural land. 1st Edition. NSW Agriculture & Fisheries, Sydney.
Baxter, J.C., Aguilar, M. and Brown K. (1983) Heavy metals and persistent organics at a
sludge disposal site. Journal of Environmental Quality, 12: 311-316.
Chaney, R.L., Bruins, R.J.F., Baker, D.E., Korcak, R.F., Smith, I.E. and Ryan, J.A.
(1987a) Effects of long-term sludge application on accumulation of trace elements
by crops. In: A.L.Page, T.J. Logan, and J.A. Ryan (Editors), "Land Application of
Sludge", pp 53-66, Lewis Publishers, Chelsea.
Chaney, R.L., Bruins, R.J.F., Baker, D.E., Korcah, R.F., Smith, I.E. and Cole, D. (1987b)
Transfer of sludge applied trace elements to the food chain. In: A.L.Page, T.J.
Logan, and J.A. Ryan (Editors), "Land Application of Sludge", pp 67-99, Lewis
Publishers, Chelsea.
Copeland, B. (1990) Domestic Catchment Sampling Programme Report. Trade Waste
Unit, Water Board, Sydney.
Curran, P. (1991) Scope of eutrophication problems. In: "Proceedings of Chemical Sum-
mit", Sydney
Finney, I., and Rawlinson, L. (1990) Sludge and wastewater re-use. In: D. Elmes and J.
Mallen-Cooper (Editors), "The Agricultural and Horticultural Use of Sewage Prod-
ucts", Australian Institute of Agricultural Science, Ocassional Paper No. 55.
Fleming, G.A. (1986) Soil ingestion by grazing animals: a factor in sludge-treated grass-
land. In: R.D.Davis, H.Hueni and P.L'Hermite (Editors), "Factors Influencing
Sludge Utilisation in Europe", pp. 43-50, Elsevier, London.
Kirkham, M.B. f1982) Agricultural use of phosphorus in sewage sludge. Advances in
Agronomy, 35: 129-163.
Langlands, J.P., Donald, G.E., and Bowles, J.E. (1988) Cadmium concentrations in liver,
kidney and muscle in Australian sheep and cattle. Australian Journal of Experimen-
tal Agriculture, 28: 291-297.
Lawrie, R.A., Awad, A.S. abd Short. C. (1991) Final Report: Utilisation of Sewage
Sludge on Agricultural Land. Project P86/03, NSW Agriculture, Orange.
Lindsay, D.G. (1983) Effects arising from the presence of persistent organic composunds
in sludge. In: R.D.Davis, G.Hucker, and P. L'Hermite (Editors), "Environmental Ef-
fects of Organic Contaminants in Sewage Sludge", D.Reidel Publishing Co., Dor-
drecht, pp. 19-26.
Logan, T.J., and Page, A.L. (1989) Peer review committee analysis of the proposed Rule
40 CFR parts 257 and 503; standards for the disposal of sewage sludge. Co-opera-
tive State Research Service Technical Committee W-170, University of California,
Riverside.
Lund, L.J., Page, A.L. and Nelson, C.O. (1976) Movement of heavy metals below sewage
disposal ponds. Journal of Environmental Quality, 5: 331-335.
Michalk, D.L., Curtis, I.H., Joshua, W.D., Bamforth, I.S., Salt, M. and Simpson, P.C. (in
20
image:
References
Addiscott, T. (1988) Farmers, fertilizers and the nitrate flood. New Scientist, 8: 50-54.
Awad, A.S., Ross, A.D. and Lawrie, R.A. (1989) Guidelines for die use of sewage sludge
on agricultural land. 1st Edition. NSW Agriculture & Fisheries, Sydney.
Baxter, J.C., Aguilar, M. and Brown K. (1983) Heavy metals and persistent organics at a
sludge disposal site. Journal of Environmental Quality, 12: 311-316.
Chaney, R.L., Bruins, R.J.F., Baker, D.E., Korcak, R.F., Smith, I.E. and Ryan, J.A.
(1987a) Effects of long-term sludge application on accumulation of trace elements
by crops. In: A.L.Page, T.J. Logan, and J.A. Ryan (Editors), "Land Application of
Sludge", pp 53-66, Lewis Publishers, Chelsea.
Chaney, R.L., Bruins, R.J.F., Baker, D.E., Korcah, R.F., Smith, I.E. and Cole, D. (1987b)
Transfer of sludge applied trace elements to the food chain. In: A.L.Page, T.J.
Logan, and J.A. Ryan (Editors), "Land Application of Sludge", pp 67-99, Lewis
Publishers, Chelsea.
Copeland, B. (1990) Domestic Catchment Sampling Programme Report. Trade Waste
Unit, Water Board, Sydney.
Curran, P. (1991) Scope of eutrophication problems. In: "Proceedings of Chemical Sum-
mit", Sydney
Finney, I., and Rawlinson, L. (1990) Sludge and wastewater re-use. In: D. Elmes and J.
Mallen-Cooper (Editors), "The Agricultural and Horticultural Use of Sewage Prod-
ucts", Australian Institute of Agricultural Science, Ocassional Paper No. 55.
Fleming, G.A. (1986) Soil ingestion by grazing animals: a factor in sludge-treated grass-
land. In: R.D.Davis, H.Hueni and P.L'Hermite (Editors), "Factors Influencing
Sludge Utilisation in Europe", pp. 43-50, Elsevier, London.
Kirkham, M.B. f1982) Agricultural use of phosphorus in sewage sludge. Advances in
Agronomy, 35: 129-163.
Langlands, J.P., Donald, G.E., and Bowles, J.E. (1988) Cadmium concentrations in liver,
kidney and muscle in Australian sheep and cattle. Australian Journal of Experimen-
tal Agriculture, 28: 291-297.
Lawrie, R.A., Awad, A.S. abd Short. C. (1991) Final Report: Utilisation of Sewage
Sludge on Agricultural Land. Project P86/03, NSW Agriculture, Orange.
Lindsay, D.G. (1983) Effects arising from the presence of persistent organic composunds
in sludge. In: R.D.Davis, G.Hucker, and P. L'Hermite (Editors), "Environmental Ef-
fects of Organic Contaminants in Sewage Sludge", D.Reidel Publishing Co., Dor-
drecht, pp. 19-26.
Logan, T.J., and Page, A.L. (1989) Peer review committee analysis of the proposed Rule
40 CFR parts 257 and 503; standards for the disposal of sewage sludge. Co-opera-
tive State Research Service Technical Committee W-170, University of California,
Riverside.
Lund, L.J., Page, A.L. and Nelson, C.O. (1976) Movement of heavy metals below sewage
disposal ponds. Journal of Environmental Quality, 5: 331-335.
Michalk, D.L., Curtis, I.H., Joshua, W.D., Bamforth, I.S., Salt, M. and Simpson, P.C. (in
20
image:
 press) Monitoring the effects of sewage sludge on a pasture ecosystem grazed by
sheep in south-eastern Australia - Preliminary results. In: "Watershed Management:
Planning for the 21st Century", American Society of Civil Engineers.
Ross, A.D. and Shrot, C. (1990) "Utilisation of Sewage Sludge on Agricultural Land -
Animal Trial", Final Report, Project P86/03, NSW Agriculture.
Ross, A.D., Awad, A.S., and Lawrie, R.A. (1989) Factors affecting the application of
sewage sludge to agricultural land in New South Wales. Proceedings AWWH Re-
gional Conference, Bowral, October, 1989.
Ross, A.D., Lawrie, R.A., Whatmuff, M.S., Keneally, J.P. and Awad, A.S. (1991) "Guide-
lines for the Use of Sewage Sludge on Agricultural Land", 3rd Edition, NSW Agri-
culture, Orange.
Rueter, D.J. and Robinson, J.B. (Editors) (1986) Plant Analysis: An Interpretation Man-
ual, Inkata Press, Melbourne.
Sidle, R.C., and Kardos, L.T. (1977) Transport of heavy metals in a sludge-treated for-
ested area. Journal of Environmental Quality, 5: 97-103.
Seawright, A.A. (1989) "Chemical and Plant Poisons" Animal Health in Australian Vol-
ume 2, 2nd Edition, Department of Primary Industry and Energy, Canberra.
Seiler, H.G., Sigel, H. and Sigel, A. (1988). "Handbook on Toxicity of Inorganic Com-
pounds", Marcel Dekker Inc., New York.
Sterritt, R.M., and Lester, J.N. (1980) The value of sewage sludge to agriculture and ef-
fects of the agricultural use of sludge contaminated with toxic elements: A review.
Science and the Total Environment, 16: 55-90.
Taylor, R.W., Duseja, D.R., and Thangudu, P.R. (1982) Sewage sludge effects on soil:
Heavy metal accumulation and movement. Journal of Environmental Science and
Health Association, 17: 427-441.
Tothill, J.C., Hargreaves, J.N.G., Jones, R.M. and McDonald, C.K. (1992) BOTANAL -
A comprehensive sampling and computing procedure for estimating pasture yield
and composition. 1. Field sampling. Tropical Agronomy Technical Memorandum,
CSIRO Division of Tropical Crops and Pastures, No. 78, pp 24.
U.S. Environmental Protection Agency (1989a) Standards for the disposal of sewage
sludge; proposed rule. 40 CFR parts 257 and 503. Federal Register, 54: 5746-5901.
de Vries, M.P.C. (1983) Investigations of twenty Australian sewage sludges - their evalu-
ation by chemical analysis. Fertilizer Research, 4: 75-87.
Willett, I.R., Jakobsen, P., Cunningham, R.B. and Gunthorpe, J.R. (1984) Effect of lime-
treated sewage sludge on soil properties and plant growth. 1. Report for 1981 to
1982. Division of Soils, Divisional report No. 67, CSIRO, Canberra
Williams, S.H., and David, D.J. (1976) The accumulation in soil of cadmium residues
from phosphate fertilizers and their effect on the cadmium content of plants. Soil
Science, 121: 86-93.
21
image:
press) Monitoring the effects of sewage sludge on a pasture ecosystem grazed by
sheep in south-eastern Australia - Preliminary results. In: "Watershed Management:
Planning for the 21st Century", American Society of Civil Engineers.
Ross, A.D. and Shrot, C. (1990) "Utilisation of Sewage Sludge on Agricultural Land -
Animal Trial", Final Report, Project P86/03, NSW Agriculture.
Ross, A.D., Awad, A.S., and Lawrie, R.A. (1989) Factors affecting the application of
sewage sludge to agricultural land in New South Wales. Proceedings AWWH Re-
gional Conference, Bowral, October, 1989.
Ross, A.D., Lawrie, R.A., Whatmuff, M.S., Keneally, J.P. and Awad, A.S. (1991) "Guide-
lines for the Use of Sewage Sludge on Agricultural Land", 3rd Edition, NSW Agri-
culture, Orange.
Rueter, D.J. and Robinson, J.B. (Editors) (1986) Plant Analysis: An Interpretation Man-
ual, Inkata Press, Melbourne.
Sidle, R.C., and Kardos, L.T. (1977) Transport of heavy metals in a sludge-treated for-
ested area. Journal of Environmental Quality, 5: 97-103.
Seawright, A.A. (1989) "Chemical and Plant Poisons" Animal Health in Australian Vol-
ume 2, 2nd Edition, Department of Primary Industry and Energy, Canberra.
Seiler, H.G., Sigel, H. and Sigel, A. (1988). "Handbook on Toxicity of Inorganic Com-
pounds", Marcel Dekker Inc., New York.
Sterritt, R.M., and Lester, J.N. (1980) The value of sewage sludge to agriculture and ef-
fects of the agricultural use of sludge contaminated with toxic elements: A review.
Science and the Total Environment, 16: 55-90.
Taylor, R.W., Duseja, D.R., and Thangudu, P.R. (1982) Sewage sludge effects on soil:
Heavy metal accumulation and movement. Journal of Environmental Science and
Health Association, 17: 427-441.
Tothill, J.C., Hargreaves, J.N.G., Jones, R.M. and McDonald, C.K. (1992) BOTANAL -
A comprehensive sampling and computing procedure for estimating pasture yield
and composition. 1. Field sampling. Tropical Agronomy Technical Memorandum,
CSIRO Division of Tropical Crops and Pastures, No. 78, pp 24.
U.S. Environmental Protection Agency (1989a) Standards for the disposal of sewage
sludge; proposed rule. 40 CFR parts 257 and 503. Federal Register, 54: 5746-5901.
de Vries, M.P.C. (1983) Investigations of twenty Australian sewage sludges - their evalu-
ation by chemical analysis. Fertilizer Research, 4: 75-87.
Willett, I.R., Jakobsen, P., Cunningham, R.B. and Gunthorpe, J.R. (1984) Effect of lime-
treated sewage sludge on soil properties and plant growth. 1. Report for 1981 to
1982. Division of Soils, Divisional report No. 67, CSIRO, Canberra
Williams, S.H., and David, D.J. (1976) The accumulation in soil of cadmium residues
from phosphate fertilizers and their effect on the cadmium content of plants. Soil
Science, 121: 86-93.
21
image:
 \ \
\1QA\3A\ 2/\ 1A
-
SEWAGE SLUDGE TREATED PASTURE
GRAZING TRIAL - Goulburn Australia
••.•a ^*
Conuol: Lime @ 2.5T/Ha plus Super @ 250Kg/ Ha Annually Plots 3A, 7A, 28,48,8C, IOC
N-ViroSoil@7.ST/Ha Plo1slA,BA.lB,9B, 1C,6C
Sludge@ 30 Dry T/ Ha P!o1s 6A, )OA( 58,108,2C. 4C
Sludgp® 60Diy T/ Ha Plots 4A, 9A, 7B, BB. 6C,9C
Sludge @ 120 Dry T/ Ha Plots 2A, 5A, 3Br 6B. 3C.7C
Spare Area
Trees (plnecl1 Sown & Tube Stock)
image:
\ \
\1QA\3A\ 2/\ 1A
-
SEWAGE SLUDGE TREATED PASTURE
GRAZING TRIAL - Goulburn Australia
••.•a ^*
Conuol: Lime @ 2.5T/Ha plus Super @ 250Kg/ Ha Annually Plots 3A, 7A, 28,48,8C, IOC
N-ViroSoil@7.ST/Ha Plo1slA,BA.lB,9B, 1C,6C
Sludge@ 30 Dry T/ Ha P!o1s 6A, )OA( 58,108,2C. 4C
Sludgp® 60Diy T/ Ha Plots 4A, 9A, 7B, BB. 6C,9C
Sludge @ 120 Dry T/ Ha Plots 2A, 5A, 3Br 6B. 3C.7C
Spare Area
Trees (plnecl1 Sown & Tube Stock)
image:
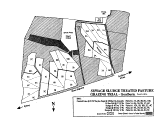 Sawmill Waste Utilization for
Reclaiming Bentonite Mine Lands1
G.E. Schuman and E.M. Taylor, Jr.2
Abstract
Large scale bentonite mining began in the Northern Great Plains in the 1930's; however, few
areas were reclaimed until enactment of reclamation laws in the 1970's. These abandoned
bentonite mined lands are extremely difficult to reclaim because of adverse chemical and
physical properties of the spoil material, the limited inherent topsoil resource, and the
arid/semiarid climate of the region. Wood residue and gypsum were found to be effective in
improving spoil physical and chemical properties. Wood residue improved water infiltration and
leaching of the salts from the root zone. Gypsum ameliorated the sodicity by supplying a calcium
source that could replace the sodium on the exchange complex of the spoil system. These
improvements in the spoil quality enabled vegetation establishment and the long-term
productivity of these lands. Technology was developed that led to the reclamation of about 6000
hectares of abandoned bentonite spoils in Wyoming alone.
Introduction
Lands disturbed by bentonite mining in the Northern Great Plains are difficult to reclaim because
of the adverse chemical and physical properties of the spoil material, the limited inherent topsoil,
the arid/semiarid climate of the area, and to some extent, the mining methods utilized. Although
large scale bentonite mining began in the region in the 1930's, few areas were reclaimed until
after enactment of reclamation laws in the early 1970's. Ninety percent of the United State's
supply of bentonite is mined in the Northern Great Plains states of Montana, South Dakota, and
Wyoming (Ampian, 1980).
Natural revegetation and man assisted reclamation plantings of non-topsoiled, non-amended
bentonite spoils have resulted in no to poor plant establishment (Dollhopf and Bauman, 1981;
Sieg et al., 1983), indicating that spoil modification is essential for successful revegetation of
these sodic, saline, high clay content spoils. Reclamation of abandoned bentonite spoils has met
with limited success (Hemmer, etal., 1977; Bjugstad et al., 1981; Dollhopf and Bauman, 1981)
unless organic amendments were utilized. Schuman and Sedbrook (1984) reported on the
effectiveness of sawmill wastes (bark, chips, and sawdust) in improving the physical
1 Contribution from the Rangeland Resources Research Unit,
Agricultural Research Service, USDA.
2 Soil Scientists, ARS, USDA, High Plains Grasslands Res. Stn.,
8408 Hildreth Rd, Cheyenne, WY 82009.
1-1
image:
Sawmill Waste Utilization for
Reclaiming Bentonite Mine Lands1
G.E. Schuman and E.M. Taylor, Jr.2
Abstract
Large scale bentonite mining began in the Northern Great Plains in the 1930's; however, few
areas were reclaimed until enactment of reclamation laws in the 1970's. These abandoned
bentonite mined lands are extremely difficult to reclaim because of adverse chemical and
physical properties of the spoil material, the limited inherent topsoil resource, and the
arid/semiarid climate of the region. Wood residue and gypsum were found to be effective in
improving spoil physical and chemical properties. Wood residue improved water infiltration and
leaching of the salts from the root zone. Gypsum ameliorated the sodicity by supplying a calcium
source that could replace the sodium on the exchange complex of the spoil system. These
improvements in the spoil quality enabled vegetation establishment and the long-term
productivity of these lands. Technology was developed that led to the reclamation of about 6000
hectares of abandoned bentonite spoils in Wyoming alone.
Introduction
Lands disturbed by bentonite mining in the Northern Great Plains are difficult to reclaim because
of the adverse chemical and physical properties of the spoil material, the limited inherent topsoil,
the arid/semiarid climate of the area, and to some extent, the mining methods utilized. Although
large scale bentonite mining began in the region in the 1930's, few areas were reclaimed until
after enactment of reclamation laws in the early 1970's. Ninety percent of the United State's
supply of bentonite is mined in the Northern Great Plains states of Montana, South Dakota, and
Wyoming (Ampian, 1980).
Natural revegetation and man assisted reclamation plantings of non-topsoiled, non-amended
bentonite spoils have resulted in no to poor plant establishment (Dollhopf and Bauman, 1981;
Sieg et al., 1983), indicating that spoil modification is essential for successful revegetation of
these sodic, saline, high clay content spoils. Reclamation of abandoned bentonite spoils has met
with limited success (Hemmer, etal., 1977; Bjugstad et al., 1981; Dollhopf and Bauman, 1981)
unless organic amendments were utilized. Schuman and Sedbrook (1984) reported on the
effectiveness of sawmill wastes (bark, chips, and sawdust) in improving the physical
1 Contribution from the Rangeland Resources Research Unit,
Agricultural Research Service, USDA.
2 Soil Scientists, ARS, USDA, High Plains Grasslands Res. Stn.,
8408 Hildreth Rd, Cheyenne, WY 82009.
1-1
image:
 characteristics of the spoil, greatly enhancing water infiltration, and promoting vegetation
establishment. Dollhopf and Bauman (1981) evaluated the use of woodchips and manure in
conjunction with straw mulch. They obtained good first year plant densities with woodchips;
however, the manure only resulted in about 23% of the density obtained with the woodchips.
They also evaluated the effectiveness of gypsum, calcium chloride, and sulfuric acid, but these
amendments resulted in poor initial seedling establishment. They concluded that the poor
establishment observed was because inorganic chemical amendments did not alter the physical
conditions of the spoil rapidly enough to enable successful seedling emergence, but that over
time these amendments may prove beneficial. These findings were not unexpected since
inorganic amendments used alone may require considerable time (perhaps years) to improve
spoil physical characteristics through the replacement and leaching of sodium under natural
precipitation conditions.
The research cited above demonstrates the importance of a bentonite spoil amendment program
to achieve rapid and successful reclamation where adequate topsoil resources are limited. To be
successful, the high clay spoil amendment program must immediately improve water infiltration
for vegetation establishment and establish leaching to ensure the effectiveness of any inorganic
amendment used to ameliorate sodicity problems. If both of these requirements are not met,
long-term reclamation may not be achieved or may require considerable time.
The purpose of this paper is to discuss the role of organic amendments for achieving immediate
improvement in water relationships of the spoil, and inorganic amendments for long-term
amelioration of the sodic properties of the spoil.
Evaluation of Organic Amendments
Study Design
A field study was initiated in 1981 on about 2 ha of leveled abandoned bentonite spoils near
Upton in northeastern Wyoming (Smith, 1984). These spoils were typical of the abandoned
spoils associated with the Mowry shale formation (Table 1). Soils overlying bentonite deposits
are formed from very fine clay and shale particles. The soils have low inherent fertility. The area
is characterized by broad, flat sagebrush (Artemisia tridentata ssp. wyomingensis) and grass
covered valleys separated by low Ponderosa pine (Pinus ponderosd) covered ridges. The long-
term average annual precipitation of this area is 370 mm, occurring mostly as spring and summer
rainfall. Approximately 60% of the precipitation occurs during April through July. The average
frost free period is 165 days.
The study involved the evaluation of the feasibility and effectiveness of Ponderosa pine sawmill
wood residue (woodchips, bark, and sawdust) as an amendment to improve the physical
characteristics of the spoil and thereby aid revegetation. The study was a split-plot design with
a split-block within the wood residue treatments (Figure 1). Four wood residue rates (0, 45, 90,
and 135 Mg/ha), four nitrogen fertilizer rates (0, 2.5, 5.0, and 7.5 kg N/Mg wood residue) and
two seed mixtures (native and introduced species) were established. Since nitrogen application
rate was based on wood residue amendment rate, nitrogen was applied at the rate of 0,112, 224,
and 336 kg N/ha on the 0 wood
1-2
image:
characteristics of the spoil, greatly enhancing water infiltration, and promoting vegetation
establishment. Dollhopf and Bauman (1981) evaluated the use of woodchips and manure in
conjunction with straw mulch. They obtained good first year plant densities with woodchips;
however, the manure only resulted in about 23% of the density obtained with the woodchips.
They also evaluated the effectiveness of gypsum, calcium chloride, and sulfuric acid, but these
amendments resulted in poor initial seedling establishment. They concluded that the poor
establishment observed was because inorganic chemical amendments did not alter the physical
conditions of the spoil rapidly enough to enable successful seedling emergence, but that over
time these amendments may prove beneficial. These findings were not unexpected since
inorganic amendments used alone may require considerable time (perhaps years) to improve
spoil physical characteristics through the replacement and leaching of sodium under natural
precipitation conditions.
The research cited above demonstrates the importance of a bentonite spoil amendment program
to achieve rapid and successful reclamation where adequate topsoil resources are limited. To be
successful, the high clay spoil amendment program must immediately improve water infiltration
for vegetation establishment and establish leaching to ensure the effectiveness of any inorganic
amendment used to ameliorate sodicity problems. If both of these requirements are not met,
long-term reclamation may not be achieved or may require considerable time.
The purpose of this paper is to discuss the role of organic amendments for achieving immediate
improvement in water relationships of the spoil, and inorganic amendments for long-term
amelioration of the sodic properties of the spoil.
Evaluation of Organic Amendments
Study Design
A field study was initiated in 1981 on about 2 ha of leveled abandoned bentonite spoils near
Upton in northeastern Wyoming (Smith, 1984). These spoils were typical of the abandoned
spoils associated with the Mowry shale formation (Table 1). Soils overlying bentonite deposits
are formed from very fine clay and shale particles. The soils have low inherent fertility. The area
is characterized by broad, flat sagebrush (Artemisia tridentata ssp. wyomingensis) and grass
covered valleys separated by low Ponderosa pine (Pinus ponderosd) covered ridges. The long-
term average annual precipitation of this area is 370 mm, occurring mostly as spring and summer
rainfall. Approximately 60% of the precipitation occurs during April through July. The average
frost free period is 165 days.
The study involved the evaluation of the feasibility and effectiveness of Ponderosa pine sawmill
wood residue (woodchips, bark, and sawdust) as an amendment to improve the physical
characteristics of the spoil and thereby aid revegetation. The study was a split-plot design with
a split-block within the wood residue treatments (Figure 1). Four wood residue rates (0, 45, 90,
and 135 Mg/ha), four nitrogen fertilizer rates (0, 2.5, 5.0, and 7.5 kg N/Mg wood residue) and
two seed mixtures (native and introduced species) were established. Since nitrogen application
rate was based on wood residue amendment rate, nitrogen was applied at the rate of 0,112, 224,
and 336 kg N/ha on the 0 wood
1-2
image:
 Table 1. Physical and chemical characteristics of pretreatment bentonite spoil samples,
Upton, WY, 1981. (Smith, 1984).
Parameter
Particle-size-separates (%)
Sand
Silt
Clay
Saturation Percentage (%)
N03-N (mg/kg)
NH4-N (mg/kg)
Total Kjeldahl-N (mg/kg)
P (mg/kg)
C (mg/kg)
PH
Electrical Conductivity (dS/m)
Water-Soluble Cations (mg/kg)
Ca
Mg
Na
K
Sodium-adsorption-ratio
•Particle-size-separates obtained from
of 144 samples.
Mean and
10.8
29.6
59.6
80.9
7.7
2.6
751.1
8.1
10.0
6.8
13.4
187.9
73.6
3613.7
32.0
63.1
Standard Error*
± 0.8
± 0.8
± 1.1
± 1.7
+ 0.4
± 0.1
+ 5.8
± 0.3
± 1.0
± 0.1
± 1.1
+ 9.2
± 4.2
+ 101.4
± 0.8
± 1-2
5 observations. All other parameters are a mean
residue treatment. These nitrogen rates were equal to those applied on the 45 Mg/ha wood
treatment. Phosphorus fertilizer was applied uniformly at the rate of 90 kg P/ha. The spoil
material was ripped to alleviate compaction and the wood residue and fertilizer amendment
applied and incorporated into the surface 30 cm of spoil using a large disk. The plots were drill
seeded at the rate of 682 PLS (pure live seeds)/m2 of the grass mixtures and 32 PLS/m2 of
Gardner saltbush (Atriplex gardneri). Smith et al. (1985) provide complete details on the grass
species and sampling methodology.
1-3
image:
Table 1. Physical and chemical characteristics of pretreatment bentonite spoil samples,
Upton, WY, 1981. (Smith, 1984).
Parameter
Particle-size-separates (%)
Sand
Silt
Clay
Saturation Percentage (%)
N03-N (mg/kg)
NH4-N (mg/kg)
Total Kjeldahl-N (mg/kg)
P (mg/kg)
C (mg/kg)
PH
Electrical Conductivity (dS/m)
Water-Soluble Cations (mg/kg)
Ca
Mg
Na
K
Sodium-adsorption-ratio
•Particle-size-separates obtained from
of 144 samples.
Mean and
10.8
29.6
59.6
80.9
7.7
2.6
751.1
8.1
10.0
6.8
13.4
187.9
73.6
3613.7
32.0
63.1
Standard Error*
± 0.8
± 0.8
± 1.1
± 1.7
+ 0.4
± 0.1
+ 5.8
± 0.3
± 1.0
± 0.1
± 1.1
+ 9.2
± 4.2
+ 101.4
± 0.8
± 1-2
5 observations. All other parameters are a mean
residue treatment. These nitrogen rates were equal to those applied on the 45 Mg/ha wood
treatment. Phosphorus fertilizer was applied uniformly at the rate of 90 kg P/ha. The spoil
material was ripped to alleviate compaction and the wood residue and fertilizer amendment
applied and incorporated into the surface 30 cm of spoil using a large disk. The plots were drill
seeded at the rate of 682 PLS (pure live seeds)/m2 of the grass mixtures and 32 PLS/m2 of
Gardner saltbush (Atriplex gardneri). Smith et al. (1985) provide complete details on the grass
species and sampling methodology.
1-3
image:
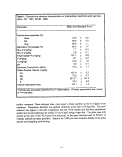 0 Mg/ha
45 Mg/ha
45 Mg/ha
135 Mg/ha
N3
NO
N2
135 Mg/ha
90 Mg/ha
N1
0 Mg/ha
90 Mg/ha
135 Mg/ha 45 Mg/ha
N2
N1
NO
N3
N1
NO
N3
N2
N3
LEGEND
Mg/ha = Wood residue level
NO » 0 N-fertilization
N1 =2.5 Kg-N/Mg residue
N2 = 5.0 Kg-N/Mg residue
N3 = 7.5 Kg-N/Mg residue
D- introduced species
H= native species
|= gypsum (56 Mg/ha)
N rates for 0 Mg/ha treatment
= kg/ha-N rates of the 45 Mg/ha
wood residue treatment
90 Mg/ha
0 Mg/ha
Figure 1. Field plot diagram of bentonite amendment project, Upton, WY.
1-4
image:
0 Mg/ha
45 Mg/ha
45 Mg/ha
135 Mg/ha
N3
NO
N2
135 Mg/ha
90 Mg/ha
N1
0 Mg/ha
90 Mg/ha
135 Mg/ha 45 Mg/ha
N2
N1
NO
N3
N1
NO
N3
N2
N3
LEGEND
Mg/ha = Wood residue level
NO » 0 N-fertilization
N1 =2.5 Kg-N/Mg residue
N2 = 5.0 Kg-N/Mg residue
N3 = 7.5 Kg-N/Mg residue
D- introduced species
H= native species
|= gypsum (56 Mg/ha)
N rates for 0 Mg/ha treatment
= kg/ha-N rates of the 45 Mg/ha
wood residue treatment
90 Mg/ha
0 Mg/ha
Figure 1. Field plot diagram of bentonite amendment project, Upton, WY.
1-4
image:
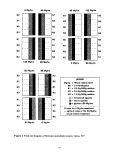 Spoil Responses . ,
Edaphic responses to wood residue amendment were exhibited in three ways: increased water
infiltration and storage, decreased salinity due to leaching, and increased sodicity. The addition
of 90 and 135 Mg/ha of wood residue significantly increased the spoil-water content in the
surface 30 cm of spoil (Table 2).
11
Table 2. Spoil-water content in 0, 45, 90, and 135 Mg/ha wood residue amended spoils
at three spoil depths, Upton, WY, June 1982.
Wood
(Mg/ha)
0
45
90
135
Spoil Depth (cm)
0-15 15-30. 30-45
Water Content (a/kg)
153a
167a
239b
249c
139a
137a
170ab
183b
140a
127a
129a
140a
Values within a spoil depth with the same letter are not significantly different, P<0.05.
The decreased effect of wood residue on spoil-water at the deeper spoil depth is related to the
fact that amendment incorporation only occurred to 30 cm; therefore, percolation below that
depth was limited in the early phase of the study. The increased water movement into the spoil
resulted in significant leaching of soluble salts from the surface 15 cm of the spoil from 1981 to
1984 (Figure 2). In 1985, a severe drought resulted in a significant upward migration of salts
in the surface 15 cm as a result of upward water movement in response to high
evapotranspiration demands. Although upward salt migration occurred during the drought year,
the electrical conductivity (EC) of the 0-15 cm spoil depth did not exceed the 1982 levels
observed before leaching occurred.
Leaching of soluble salts is desirable and necessary to encourage soil development and long-term
stability of these lands. However, the leaching process resulted in an increase in spoil sodium-
absorption-ratio (SAR) in the residue amended plots over time (Figure 3). The pool of soluble
sodium (91% of soluble cations) was so large that as leaching occurred, the relative proportion
of sodium in the system compared to calcium and magnesium became greater, thereby increasing
the SAR. This increase in SAR can have significant negative long-term effects on plant
nutrition, spoil physical qualities, and subsequent maintenance of the vegetation community
Increased SAR indicates that chemical amendments are necessary in addition to the wood
residue, to ensure long-term reclamation and revegetation success.
1-5
image:
Spoil Responses . ,
Edaphic responses to wood residue amendment were exhibited in three ways: increased water
infiltration and storage, decreased salinity due to leaching, and increased sodicity. The addition
of 90 and 135 Mg/ha of wood residue significantly increased the spoil-water content in the
surface 30 cm of spoil (Table 2).
11
Table 2. Spoil-water content in 0, 45, 90, and 135 Mg/ha wood residue amended spoils
at three spoil depths, Upton, WY, June 1982.
Wood
(Mg/ha)
0
45
90
135
Spoil Depth (cm)
0-15 15-30. 30-45
Water Content (a/kg)
153a
167a
239b
249c
139a
137a
170ab
183b
140a
127a
129a
140a
Values within a spoil depth with the same letter are not significantly different, P<0.05.
The decreased effect of wood residue on spoil-water at the deeper spoil depth is related to the
fact that amendment incorporation only occurred to 30 cm; therefore, percolation below that
depth was limited in the early phase of the study. The increased water movement into the spoil
resulted in significant leaching of soluble salts from the surface 15 cm of the spoil from 1981 to
1984 (Figure 2). In 1985, a severe drought resulted in a significant upward migration of salts
in the surface 15 cm as a result of upward water movement in response to high
evapotranspiration demands. Although upward salt migration occurred during the drought year,
the electrical conductivity (EC) of the 0-15 cm spoil depth did not exceed the 1982 levels
observed before leaching occurred.
Leaching of soluble salts is desirable and necessary to encourage soil development and long-term
stability of these lands. However, the leaching process resulted in an increase in spoil sodium-
absorption-ratio (SAR) in the residue amended plots over time (Figure 3). The pool of soluble
sodium (91% of soluble cations) was so large that as leaching occurred, the relative proportion
of sodium in the system compared to calcium and magnesium became greater, thereby increasing
the SAR. This increase in SAR can have significant negative long-term effects on plant
nutrition, spoil physical qualities, and subsequent maintenance of the vegetation community
Increased SAR indicates that chemical amendments are necessary in addition to the wood
residue, to ensure long-term reclamation and revegetation success.
1-5
image:
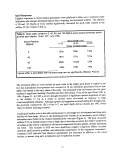 10
C/D
8
(J
ID
Q
•z.
o
u
y e
DC
O
LU
_J
LU 5
1982 £31983 ES]1984
aBC
0-15
bA
15-30
SAMPLE DEPTH (cm)
30-45
Figure 2. Mean electrical conductivity averaged across wood residue and N fertilizer treatments, 1982-1985, at three spoil depths.
Means within a year among spoil depths with the same letters (lower case) or among years within a spoil depth (upper case) are not
significantly different, P<0.05. (Belden 1987).
image:
10
C/D
8
(J
ID
Q
•z.
o
u
y e
DC
O
LU
_J
LU 5
1982 £31983 ES]1984
aBC
0-15
bA
15-30
SAMPLE DEPTH (cm)
30-45
Figure 2. Mean electrical conductivity averaged across wood residue and N fertilizer treatments, 1982-1985, at three spoil depths.
Means within a year among spoil depths with the same letters (lower case) or among years within a spoil depth (upper case) are not
significantly different, P<0.05. (Belden 1987).
image:
 65
g
<
a:
60
p 55
a.
a:
O
to
50
=2
Q 45
O
CO
0
0 Mg hff1 12445 Mg ha~1 fcSI 90 Mg hsr1 1*3135 Mg ha'1
a
a
a
1982
a
i
a
ab
1983 1984
YEAR
a
II
ii
1985
Figure 3. Mean sodium-adsorption-ratio averaged across N fertilizer treatments and spoil depths, at four wood residue levels, 1982-
1985. Means among years with the same lower case letter are not significantly different, P<0.05. (Belden 1987) success.
image:
65
g
<
a:
60
p 55
a.
a:
O
to
50
=2
Q 45
O
CO
0
0 Mg hff1 12445 Mg ha~1 fcSI 90 Mg hsr1 1*3135 Mg ha'1
a
a
a
1982
a
i
a
ab
1983 1984
YEAR
a
II
ii
1985
Figure 3. Mean sodium-adsorption-ratio averaged across N fertilizer treatments and spoil depths, at four wood residue levels, 1982-
1985. Means among years with the same lower case letter are not significantly different, P<0.05. (Belden 1987) success.
image:
 Plant Responses
Early seedling density exhibited little species mixture response with slightly greater seedling
densities for the native mixture at the 0 and 45 Mg/ha wood residue amendment and no
differences between the two species mixtures at the 90 and 135 Mg/ha treatments. Average
seedling density was significantly improved by wood residue amendments because of its positive
effect on spoil-water content, crusting, and bulk density. Seedling density was 14,41, 60, and
70 plants/m2, for the 0,45,90, and 135 Mg/ha wood residue treatments, respectively. Perennial
grass production increased as wood residue rates increased, with maximum production occurring
at the 135 Mg/ha wood residue level (Table 3). Production in 1985 was extremely
Table 3.
Perennial grass
production (averaged across species mixtures and nitrogen
fertilizer treatments) in response to wood residue
among wood residue rates within a year followed
different,
Year
1983
1984
1985
1986
P<0.05. (Smith,
0
59a
80a
lOa
15a
rate, Upton, WY, 1983-1986. (Means
by the same letter are not significantly
1984; Belden, 1987; and Schuman, unpublished
Wood Residue Rate
45
669b
361a
55a
116a
(Mg/ha)
90
1748c
1220b
148a
324a
data).
135
2550d
1956c
448a
886b
low compared to previous years because of the extreme drought that year. Precipitation from
August 1984 through June 1985 (17 cm) was approximately 60% of normal for the period.
However, normal precipitation occurred in late summer 1985 and throughout the 1986 growing
season, resulting in the improved production observed in 1986. Visual observation of the plant
community in 1986 indicated that some plant mortality had occurred as a result of the drought;
therefore, predrought production levels may not be reached again for several years. Perennial
grass production also responded to nitrogen fertilizer addition in 1983 and 1984 with peak
biomass occurring at the 2.5 and 5.0 kg N/Mg wood residue rates. In contrast, nitrogen had no
appreciable effect on production in 1985 and 1986. With the exception of tall wheatgrass
(Thinopyrum ponticum), all successfully established grass species were rhizomatous (see Smith
et al., 1986 for details of individual species response to the amendments). This suggests that
sod-forming grasses are generally better suited than bunchgrasses for revegetation of bentonite
spoils. The predominance of sod-forming grasses on clay soils in the region support this
observation (Weaver and Albertson, 1956). Rhizomes have been noted to exhibit physical
resistance to breakage and the capacity for regrowth and/or increased production if breakage
occurs in a high clay soil (White and Lewis, 1969). Findings have demonstrated that plant
species potentially useful and/or successful in revegetation of wood residue amended, abandoned
bentonite spoils should have at least some of the following characteristics: sod-forming
morphology, drought and salt tolerance, adaptation to clay texture, and adaptation to a shallow,
poorly drained spoil/soil environment (Smith et al., 1986).
1-8
image:
Plant Responses
Early seedling density exhibited little species mixture response with slightly greater seedling
densities for the native mixture at the 0 and 45 Mg/ha wood residue amendment and no
differences between the two species mixtures at the 90 and 135 Mg/ha treatments. Average
seedling density was significantly improved by wood residue amendments because of its positive
effect on spoil-water content, crusting, and bulk density. Seedling density was 14,41, 60, and
70 plants/m2, for the 0,45,90, and 135 Mg/ha wood residue treatments, respectively. Perennial
grass production increased as wood residue rates increased, with maximum production occurring
at the 135 Mg/ha wood residue level (Table 3). Production in 1985 was extremely
Table 3.
Perennial grass
production (averaged across species mixtures and nitrogen
fertilizer treatments) in response to wood residue
among wood residue rates within a year followed
different,
Year
1983
1984
1985
1986
P<0.05. (Smith,
0
59a
80a
lOa
15a
rate, Upton, WY, 1983-1986. (Means
by the same letter are not significantly
1984; Belden, 1987; and Schuman, unpublished
Wood Residue Rate
45
669b
361a
55a
116a
(Mg/ha)
90
1748c
1220b
148a
324a
data).
135
2550d
1956c
448a
886b
low compared to previous years because of the extreme drought that year. Precipitation from
August 1984 through June 1985 (17 cm) was approximately 60% of normal for the period.
However, normal precipitation occurred in late summer 1985 and throughout the 1986 growing
season, resulting in the improved production observed in 1986. Visual observation of the plant
community in 1986 indicated that some plant mortality had occurred as a result of the drought;
therefore, predrought production levels may not be reached again for several years. Perennial
grass production also responded to nitrogen fertilizer addition in 1983 and 1984 with peak
biomass occurring at the 2.5 and 5.0 kg N/Mg wood residue rates. In contrast, nitrogen had no
appreciable effect on production in 1985 and 1986. With the exception of tall wheatgrass
(Thinopyrum ponticum), all successfully established grass species were rhizomatous (see Smith
et al., 1986 for details of individual species response to the amendments). This suggests that
sod-forming grasses are generally better suited than bunchgrasses for revegetation of bentonite
spoils. The predominance of sod-forming grasses on clay soils in the region support this
observation (Weaver and Albertson, 1956). Rhizomes have been noted to exhibit physical
resistance to breakage and the capacity for regrowth and/or increased production if breakage
occurs in a high clay soil (White and Lewis, 1969). Findings have demonstrated that plant
species potentially useful and/or successful in revegetation of wood residue amended, abandoned
bentonite spoils should have at least some of the following characteristics: sod-forming
morphology, drought and salt tolerance, adaptation to clay texture, and adaptation to a shallow,
poorly drained spoil/soil environment (Smith et al., 1986).
1-8
image:
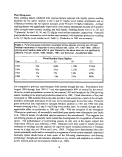 EVALUATION OF INORGANIC AMENDMENTS
An inorganic amendment study was designed to evaluate the feasibility and effectiveness of
amending previously revegetated bentonite mined lands. Gypsum was surface-applied, in April
1987, at the rate of 56 Mg/ha to approximately 40% of each of the native seed mixture plots on
the 1981 study (Figure 1). This level of gypsum amendment was calculated to reduce the
exchangeable-sodium-percentage (ESP) of the sodic spoil to 15.
Spoil samples were collected in October 1986 and in May 1988-1990 to evaluate the effects
of gypsum. Gypsum amendment significantly increased EC at all spoil depths (Figure 4). Such
increases in salinity could result in reduction of germination and seedling establishment if
applied during initial reclamation. Indeed, if gypsum had been applied during initial reclamation
of this site, the EC would have been even higher in these spoils, since by 1987, leaching from
the surface spoil depth had occurred over several years to an EC level that was considerably
below the initial 1981 EC of 13.4 dS/m (Table 1). However, the observed increase would have
been less had the gypsum been incorporated into 30 cm of spoil rather than surface applied.
Such a large increase in salinity may have influenced seedling establishment
in Dollhopf and Bauman's (1981) inorganic amendment study since they obtained fair-to-good
seedling establishment using organic amendments. Even though the EC increased in 1988, it
decreased significantly over the next two years. This decrease is attributed to leaching (Schuman
and Meining, 1993). Analysis of vegetation production data suggested no detrimental effects
of the increase in EC on the established plant community (Schuman, et al., 1994). Gypsum
amendment significantly reduced the ESP of the 60-cm spoil profile (Figure 5). These changes
began to become evident within 13 months after treatment. The gypsum amendment also
significantly increased the spoil-water storage in the 60-cm spoil profile (Figure 6). Therefore,
inorganic amendments, such as gypsum, can significantly improve the physical and chemical
properties of these spoils.
WOOD RESIDUE DECOMPOSITION
Sustained long-term success of these reclaimed lands depends on the continued improvement and
development of a 'soil'. These 'new soils' must develop active microbial functions to ensure
nutrient availability through sustained nutrient cycles. Evaluation of wood residue
decomposition, using an ashing technique, indicates that microbial functions have begun to
develop. Wood residue decomposition after 1,2,3, and 5 years was 10.7,11.0,16.5, and 26.3%,
respectively (Figure 7). The single nitrogen addition in 1981 had a pronounced effect on
decomposition during the 5-year period (Figure 8). Whitford et al. (1989) concluded that in
semiarid rangelands where moisture availability affects nitrogen immobilization and
mineralization, high C:N ratio amendments (such as wood residue) can be beneficial. They
suggested that more resistant sources of organic mulches are superior to readily decomposed
materials, such as crop residues because they provide a slow release of organic particles that
serve as energy sources for the microflora.
1-9
image:
EVALUATION OF INORGANIC AMENDMENTS
An inorganic amendment study was designed to evaluate the feasibility and effectiveness of
amending previously revegetated bentonite mined lands. Gypsum was surface-applied, in April
1987, at the rate of 56 Mg/ha to approximately 40% of each of the native seed mixture plots on
the 1981 study (Figure 1). This level of gypsum amendment was calculated to reduce the
exchangeable-sodium-percentage (ESP) of the sodic spoil to 15.
Spoil samples were collected in October 1986 and in May 1988-1990 to evaluate the effects
of gypsum. Gypsum amendment significantly increased EC at all spoil depths (Figure 4). Such
increases in salinity could result in reduction of germination and seedling establishment if
applied during initial reclamation. Indeed, if gypsum had been applied during initial reclamation
of this site, the EC would have been even higher in these spoils, since by 1987, leaching from
the surface spoil depth had occurred over several years to an EC level that was considerably
below the initial 1981 EC of 13.4 dS/m (Table 1). However, the observed increase would have
been less had the gypsum been incorporated into 30 cm of spoil rather than surface applied.
Such a large increase in salinity may have influenced seedling establishment
in Dollhopf and Bauman's (1981) inorganic amendment study since they obtained fair-to-good
seedling establishment using organic amendments. Even though the EC increased in 1988, it
decreased significantly over the next two years. This decrease is attributed to leaching (Schuman
and Meining, 1993). Analysis of vegetation production data suggested no detrimental effects
of the increase in EC on the established plant community (Schuman, et al., 1994). Gypsum
amendment significantly reduced the ESP of the 60-cm spoil profile (Figure 5). These changes
began to become evident within 13 months after treatment. The gypsum amendment also
significantly increased the spoil-water storage in the 60-cm spoil profile (Figure 6). Therefore,
inorganic amendments, such as gypsum, can significantly improve the physical and chemical
properties of these spoils.
WOOD RESIDUE DECOMPOSITION
Sustained long-term success of these reclaimed lands depends on the continued improvement and
development of a 'soil'. These 'new soils' must develop active microbial functions to ensure
nutrient availability through sustained nutrient cycles. Evaluation of wood residue
decomposition, using an ashing technique, indicates that microbial functions have begun to
develop. Wood residue decomposition after 1,2,3, and 5 years was 10.7,11.0,16.5, and 26.3%,
respectively (Figure 7). The single nitrogen addition in 1981 had a pronounced effect on
decomposition during the 5-year period (Figure 8). Whitford et al. (1989) concluded that in
semiarid rangelands where moisture availability affects nitrogen immobilization and
mineralization, high C:N ratio amendments (such as wood residue) can be beneficial. They
suggested that more resistant sources of organic mulches are superior to readily decomposed
materials, such as crop residues because they provide a slow release of organic particles that
serve as energy sources for the microflora.
1-9
image:
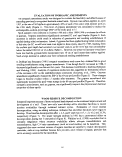 14
TJ
- 12
u
Q 10
z
o
u
I 8
u
LU
_l
LU
a A
aB
0-15
b A
b A
15-30 30-45
DEPTH (cm)
Control
Gypsum
b A
b B
45-60
Figure 4. The effect of gypsum amendment on the electrical conductivity of wood residue amended bentonite spoil at four spoil depths,
1988-1990. Means with the same letter within a treatment (lower case) or within a depth (upper case) are not significantly different,
P<0.10. (Schuman and Meining 1993).
image:
14
TJ
- 12
u
Q 10
z
o
u
I 8
u
LU
_l
LU
a A
aB
0-15
b A
b A
15-30 30-45
DEPTH (cm)
Control
Gypsum
b A
b B
45-60
Figure 4. The effect of gypsum amendment on the electrical conductivity of wood residue amended bentonite spoil at four spoil depths,
1988-1990. Means with the same letter within a treatment (lower case) or within a depth (upper case) are not significantly different,
P<0.10. (Schuman and Meining 1993).
image:
 - 50 r
LU
CD
<
Z
LU
U
cc
LU
OL
Q
O
°?
LU
_1
CD
U
X
LU
45
40
35
LU
<2 30
0
bB
b B
a B
a A
b A
c A
Control
Gypsum
bB
c A
0-15
15-30 30-45
DEPTH (cm)
45-60
Figure 5. The effect of gypsum amendment on the exchangeable sodium-percentage of wood residue amended bentonite spoil at four
depths, 1988-1990. Means with the same letter within a treatment (lower case) or within a depth (upper case) are not significantly
different, P<0.10. (Schuman and Meining 1993)
image:
- 50 r
LU
CD
<
Z
LU
U
cc
LU
OL
Q
O
°?
LU
_1
CD
U
X
LU
45
40
35
LU
<2 30
0
bB
b B
a B
a A
b A
c A
Control
Gypsum
bB
c A
0-15
15-30 30-45
DEPTH (cm)
45-60
Figure 5. The effect of gypsum amendment on the exchangeable sodium-percentage of wood residue amended bentonite spoil at four
depths, 1988-1990. Means with the same letter within a treatment (lower case) or within a depth (upper case) are not significantly
different, P<0.10. (Schuman and Meining 1993)
image:
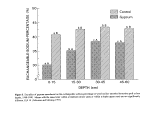 170
•v 160
CD
U)
LJJ
150
Z
8 140
oc
LLJ
^ 130
o
5) 120
0
0-15
a
15-30 30-45
DEPTH (cm)
Control
Gypsum
45-60
Figure 6. Response of spoil-water content of revegetated saline-sodic bentonite spoil to gypsum amendment, 1988-1990. Means within
a spoil depth with the same letter are not significantly different, P<0.10. (Schuman and Meining 1993)
image:
170
•v 160
CD
U)
LJJ
150
Z
8 140
oc
LLJ
^ 130
o
5) 120
0
0-15
a
15-30 30-45
DEPTH (cm)
Control
Gypsum
45-60
Figure 6. Response of spoil-water content of revegetated saline-sodic bentonite spoil to gypsum amendment, 1988-1990. Means within
a spoil depth with the same letter are not significantly different, P<0.10. (Schuman and Meining 1993)
image:
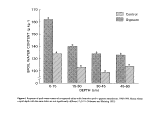 o
C/3
O
Du
^
O
O
LU
Q
30
25
20
15
10
0
1(0,45) Mg ha"1 0(45,90,135) Mg ha'1
B
a
a
1984
1985
1986
1987
1988
Figure 7. Decomposition of wood residues amended to bentonite spoil for a 5-year period. Data analyzed separately for 0 and 45
Mg/ha and 45, 90, and 135 Mg/ha wood residue treatments because of N application differences. Means within the 0 and 45 Mg/ha
and 45, 90, and 135 Mg/ha treatments with the same upper and lower case letter, respectively, are not significantly different, P<0.05.
(Schuman and Belden 1991)
image:
o
C/3
O
Du
^
O
O
LU
Q
30
25
20
15
10
0
1(0,45) Mg ha"1 0(45,90,135) Mg ha'1
B
a
a
1984
1985
1986
1987
1988
Figure 7. Decomposition of wood residues amended to bentonite spoil for a 5-year period. Data analyzed separately for 0 and 45
Mg/ha and 45, 90, and 135 Mg/ha wood residue treatments because of N application differences. Means within the 0 and 45 Mg/ha
and 45, 90, and 135 Mg/ha treatments with the same upper and lower case letter, respectively, are not significantly different, P<0.05.
(Schuman and Belden 1991)
image:
 25
20
O 15
H
O)
O
CL
§10
O
LU
Q
0
0.0
2.5
5.0
7.5
NITROGEN RATE (kg N Mg '1 wood residue)
Figure 8. Decomposition of wood residue amended to bentonite spoils as a function of N-fertilizer application rate (averaged across
wood residue rates and years). Means with the same letter are not significantly different, P<0.05. (Schuman and Belden 1991)
image:
25
20
O 15
H
O)
O
CL
§10
O
LU
Q
0
0.0
2.5
5.0
7.5
NITROGEN RATE (kg N Mg '1 wood residue)
Figure 8. Decomposition of wood residue amended to bentonite spoils as a function of N-fertilizer application rate (averaged across
wood residue rates and years). Means with the same letter are not significantly different, P<0.05. (Schuman and Belden 1991)
image:
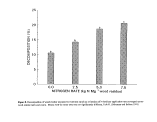 Summary
Wood residue amendment resulted in immediate improvement of the physical characteristics of
bentonite spoils, enabling improved water infiltration and storage, leaching of soluble salts, and
the concurrent establishment of a desirable and productive plant community. This research also
pointed out the need for inorganic amendments, such as gypsum, to be incorporated with the
wood residue to ameliorate spoil sodicity. Use of both organic and inorganic amendments are
necessary to enable immediate revegetation of these lands and ensure sustainability of the
reclaimed ecosystem. Organic amendments utilized should not be easily decomposed since they
play an important role improving the physical and biological conditions of the bentonite spoil
until natural soil development occurs and nutrient cycles become established.
This technology has been readily adapted to large scale reclamation of abandoned bentonite
spoils. Over 6000 hectares of abandoned spoils have been reclaimed using this technology.
Reclaiming abandoned bentonite lands in the Northern Great Plains eliminates significant
environmental problems and greatly enhances aesthetic and economic value of these lands.
Much of the information and technology described is directly applicable to active bentonite mine
land reclamation even when topsoil salvage is practiced, especially since topsoil quantities are
generally limited.
Acknowledgement
The authors wish to acknowledge the assistance of Dr. Edward J. DePuit, Scott E. Belden and
Jack A. Smith in this research. This research was partially funded by the Abandoned Mine Land
Program, Wyoming Department of Environmental Quality, Cheyenne, WY.
References
Ampian, S.G. 1980. Clays. In: Mineral facts and problems. USDI. Bureau of Mines Bull. 671.
U.S. Government Printing Office,Washington, D.C.
Belden, S.E. 1987. Edaphic responses to wood residue and nitrogen amendment of abandoned
bentonite spoil. M.S. Thesis. University of Wyoming, Laramie, WY.
Bjugstad, A.J., Yamamoto, T., and Uresk, D.W. 1981. Shrub establishment on coal and bentonite
clay mine spoils, p. 104-122. In: Shrub Establishment on Disturbed Arid and Semi-Arid Lands.
Wyoming Game and Fish Commission, Cheyenne, WY.
Dollhopf, D.J. and Bauman, B.J. 1981. Bentonite mine land reclamation in the Norther Great
Plains. Montana Agr. Exp. Stn. Res. Rept. 179.
1-15
image:
Summary
Wood residue amendment resulted in immediate improvement of the physical characteristics of
bentonite spoils, enabling improved water infiltration and storage, leaching of soluble salts, and
the concurrent establishment of a desirable and productive plant community. This research also
pointed out the need for inorganic amendments, such as gypsum, to be incorporated with the
wood residue to ameliorate spoil sodicity. Use of both organic and inorganic amendments are
necessary to enable immediate revegetation of these lands and ensure sustainability of the
reclaimed ecosystem. Organic amendments utilized should not be easily decomposed since they
play an important role improving the physical and biological conditions of the bentonite spoil
until natural soil development occurs and nutrient cycles become established.
This technology has been readily adapted to large scale reclamation of abandoned bentonite
spoils. Over 6000 hectares of abandoned spoils have been reclaimed using this technology.
Reclaiming abandoned bentonite lands in the Northern Great Plains eliminates significant
environmental problems and greatly enhances aesthetic and economic value of these lands.
Much of the information and technology described is directly applicable to active bentonite mine
land reclamation even when topsoil salvage is practiced, especially since topsoil quantities are
generally limited.
Acknowledgement
The authors wish to acknowledge the assistance of Dr. Edward J. DePuit, Scott E. Belden and
Jack A. Smith in this research. This research was partially funded by the Abandoned Mine Land
Program, Wyoming Department of Environmental Quality, Cheyenne, WY.
References
Ampian, S.G. 1980. Clays. In: Mineral facts and problems. USDI. Bureau of Mines Bull. 671.
U.S. Government Printing Office,Washington, D.C.
Belden, S.E. 1987. Edaphic responses to wood residue and nitrogen amendment of abandoned
bentonite spoil. M.S. Thesis. University of Wyoming, Laramie, WY.
Bjugstad, A.J., Yamamoto, T., and Uresk, D.W. 1981. Shrub establishment on coal and bentonite
clay mine spoils, p. 104-122. In: Shrub Establishment on Disturbed Arid and Semi-Arid Lands.
Wyoming Game and Fish Commission, Cheyenne, WY.
Dollhopf, D.J. and Bauman, B.J. 1981. Bentonite mine land reclamation in the Norther Great
Plains. Montana Agr. Exp. Stn. Res. Rept. 179.
1-15
image:
 Hemmer, D.S., Johnson, S., and Beck, R. 1977. Bentonite mine related reclamation problems
in the Northwestern States. Montana Dept. of Lands (Old West Regional Grant No. 10570164).
Schuman, G.E. and Belden, S.E. 1991. Decomposition of wood-residue amendments in
revegetated bentonite mine spoils. Soil Sci. Soc. Am. J. 55:76-80.
Schuman, G.E., DePuit, E.J., and Roadifer, K.M. 1994. Plant responses to gypsum amendment
of sodic bentonite mine spoil. J. Range Manage. 47:206-209.
Schuman, G.E. and Meining, J.L. 1993. Short-term effects of surface applied gypsum on
revegetated sodic bentonite spoil. Soil Sci. Soc. Am. J. 57:1083-1088.
Schuman, G.E. and Sedbrook, T.A. 1984. Sawmill wood residue for reclaiming bentonite spoils.
Forest Products J. 34:65-68.
Sieg, C.H., Uresk, D.W., and Hansen, R.M. 1983. Plant-soil relationships on bentonite mine
spoils and sagebrush-grassland in the northern high plains. J. Range Manage. 36:289-294.
Smith, J.A. 1984. Wood residue and fertilizer amendments for reclamation of orphan bentonite
mine spoils. M.S. Thesis, University of Wyoming, Laramie.
Smith, J.A., DePuit, E.J., and Schuman, G.E. 1986. Wood residue and fertilizer amendment of
bentonite mine spoils: II. Plant species responses. J. Environ. Qual. 15:427-435.
Smith, J.A., Schuman, G.E., DePuit, E.J., and Sedbrook, T.A. 1985. Wood residue and fertilizer
amendment of bentonite mine spoils: I. Spoil and general vegetation responses. J. Environ.
Qual. 14:575-580.
Weaver, J.E. and Albertson, F.W. 1956. Grasslands of the Great Plains. Johnson Publishing Co.,
Lincoln, NE.
White, E.M. and Lewis, J.K. 1969. Ecological effect of a clay soil's structure on some native
grass roots. J. Range Manage. 22:401-404.
Whitford, W.G., Aldon, E.F., Freckman, D.W., Steinberger, Y., and Parker, L.W. 1989. Effects
of organic amendments on soil biota on a degraded rangeland. J. Range Manage. 42:56-60.
1-16
image:
Hemmer, D.S., Johnson, S., and Beck, R. 1977. Bentonite mine related reclamation problems
in the Northwestern States. Montana Dept. of Lands (Old West Regional Grant No. 10570164).
Schuman, G.E. and Belden, S.E. 1991. Decomposition of wood-residue amendments in
revegetated bentonite mine spoils. Soil Sci. Soc. Am. J. 55:76-80.
Schuman, G.E., DePuit, E.J., and Roadifer, K.M. 1994. Plant responses to gypsum amendment
of sodic bentonite mine spoil. J. Range Manage. 47:206-209.
Schuman, G.E. and Meining, J.L. 1993. Short-term effects of surface applied gypsum on
revegetated sodic bentonite spoil. Soil Sci. Soc. Am. J. 57:1083-1088.
Schuman, G.E. and Sedbrook, T.A. 1984. Sawmill wood residue for reclaiming bentonite spoils.
Forest Products J. 34:65-68.
Sieg, C.H., Uresk, D.W., and Hansen, R.M. 1983. Plant-soil relationships on bentonite mine
spoils and sagebrush-grassland in the northern high plains. J. Range Manage. 36:289-294.
Smith, J.A. 1984. Wood residue and fertilizer amendments for reclamation of orphan bentonite
mine spoils. M.S. Thesis, University of Wyoming, Laramie.
Smith, J.A., DePuit, E.J., and Schuman, G.E. 1986. Wood residue and fertilizer amendment of
bentonite mine spoils: II. Plant species responses. J. Environ. Qual. 15:427-435.
Smith, J.A., Schuman, G.E., DePuit, E.J., and Sedbrook, T.A. 1985. Wood residue and fertilizer
amendment of bentonite mine spoils: I. Spoil and general vegetation responses. J. Environ.
Qual. 14:575-580.
Weaver, J.E. and Albertson, F.W. 1956. Grasslands of the Great Plains. Johnson Publishing Co.,
Lincoln, NE.
White, E.M. and Lewis, J.K. 1969. Ecological effect of a clay soil's structure on some native
grass roots. J. Range Manage. 22:401-404.
Whitford, W.G., Aldon, E.F., Freckman, D.W., Steinberger, Y., and Parker, L.W. 1989. Effects
of organic amendments on soil biota on a degraded rangeland. J. Range Manage. 42:56-60.
1-16
image:
 c
o
'«
V)
<D
V)
image:
c
o
'«
V)
<D
V)
image:
 image:
 Eleven Years of Biosolids Application to
Dryland Winter Wheat*
K.A. Barbarick, J.A. Ippolito, D.G. Westfall* and R. Jepson
Abstract
We established four study sites on two farms in eastern Adams County, Colorado in 1982 to
compare the effects of applying Littleton/Englewood biosolids (sewage sludge) to NH4N03 on
yields, protein, and elemental content of dryland hard red winter wheat (Triticum aestivum L.).
Biosolids application ranged from 0 to 27 Mg ha'1 and N fertilizer ranged from 0 to 134 kg ha'1.
We focused on the 0 and 56 or 67 kg N ha'1 and the 6.7 and 26.8 Mg ha'1 treatments. Following
summer dryland winter wheat management practices, we added the same N fertilizer or biosolids
rate every other year six times to one set of plots and five times to the other. Three sets of plots
consisted of Weld loam soils (Typic Argiustoll) and the fourth site contained a Platner loam soil
(Abruptic Argiustoll).
Results averaged over years showed that neither N fertilizer nor biosolids significantly affected
gram yields or grain Mo concentrations. Projected income averaged $333 ha"1 for the N fertilizer
treatment and $384 ha'1 for the 6.7 Mg biosolids ha'1 treatment. The higher biosolids rate (26.8
Mg ha'1) produced higher grain P levels at three sites and Cu at two sites than did N fertilizer.
The Ni grain concentrations were significantly different between some treatments and locations
but we did not notice a consistent trend. The most consistent biosolids effects were found for
grain protein, where both biosolids rates produced higher protein than the control (0 kg N ha'1)
at three sites, and Zn concentrations, where the higher biosolids rates produced higher
concentrations than the control and the 56 or 67 kg N ha'1 treatment at all sites. Biosolids appear
to be a viable alternative to N fertilizer if applied at an agronomic rate (6.7 Mg ha'1 or less).
Introduction
The application of sewage biosolids to agricultural land is the major method of biosolids
recycling or disposal in the USA (USEPA, 1983). Land application of biosolids allows cities
to beneficially use this waste material by recycling plant nutrients such as N and P. As land
available for landfills decreases and air quality restrictions prevent incineration, the beneficial
use of biosolids will increase. We must carefully manage land application of biosolids so as to
avoid excessive trace-metal uptake by plants or accumulation in soils of trace metals,
contamination of groundwater with NO3-N, and persistence of pathogenic organisms and toxic
organic compounds (Logan and Chancy, 1983; Sommers and Barbarick, 1986).
t This project was supported by the cities of Littleton and Englewood, Colorado and the Colorado
Agricultural Experiment Station (project # 15-2924).
* Professor, Research Associate, and Professor, Dep. of Soil and Crop Sciences, Colorado State
University
2-1
image:
Eleven Years of Biosolids Application to
Dryland Winter Wheat*
K.A. Barbarick, J.A. Ippolito, D.G. Westfall* and R. Jepson
Abstract
We established four study sites on two farms in eastern Adams County, Colorado in 1982 to
compare the effects of applying Littleton/Englewood biosolids (sewage sludge) to NH4N03 on
yields, protein, and elemental content of dryland hard red winter wheat (Triticum aestivum L.).
Biosolids application ranged from 0 to 27 Mg ha'1 and N fertilizer ranged from 0 to 134 kg ha'1.
We focused on the 0 and 56 or 67 kg N ha'1 and the 6.7 and 26.8 Mg ha'1 treatments. Following
summer dryland winter wheat management practices, we added the same N fertilizer or biosolids
rate every other year six times to one set of plots and five times to the other. Three sets of plots
consisted of Weld loam soils (Typic Argiustoll) and the fourth site contained a Platner loam soil
(Abruptic Argiustoll).
Results averaged over years showed that neither N fertilizer nor biosolids significantly affected
gram yields or grain Mo concentrations. Projected income averaged $333 ha"1 for the N fertilizer
treatment and $384 ha'1 for the 6.7 Mg biosolids ha'1 treatment. The higher biosolids rate (26.8
Mg ha'1) produced higher grain P levels at three sites and Cu at two sites than did N fertilizer.
The Ni grain concentrations were significantly different between some treatments and locations
but we did not notice a consistent trend. The most consistent biosolids effects were found for
grain protein, where both biosolids rates produced higher protein than the control (0 kg N ha'1)
at three sites, and Zn concentrations, where the higher biosolids rates produced higher
concentrations than the control and the 56 or 67 kg N ha'1 treatment at all sites. Biosolids appear
to be a viable alternative to N fertilizer if applied at an agronomic rate (6.7 Mg ha'1 or less).
Introduction
The application of sewage biosolids to agricultural land is the major method of biosolids
recycling or disposal in the USA (USEPA, 1983). Land application of biosolids allows cities
to beneficially use this waste material by recycling plant nutrients such as N and P. As land
available for landfills decreases and air quality restrictions prevent incineration, the beneficial
use of biosolids will increase. We must carefully manage land application of biosolids so as to
avoid excessive trace-metal uptake by plants or accumulation in soils of trace metals,
contamination of groundwater with NO3-N, and persistence of pathogenic organisms and toxic
organic compounds (Logan and Chancy, 1983; Sommers and Barbarick, 1986).
t This project was supported by the cities of Littleton and Englewood, Colorado and the Colorado
Agricultural Experiment Station (project # 15-2924).
* Professor, Research Associate, and Professor, Dep. of Soil and Crop Sciences, Colorado State
University
2-1
image:
 Our research objective is to compare the effect of Littleton/Englewood biosolids and N fertilizer
rates on dryland winter wheat (Triticum aestivum L., 'Vona') grain yield, elemental content of
the soil and wheat grain and straw, estimated income, and soil N03-N accumulation. Three
student theses (Lerch 1987,1991;Utschig, 1985), technical reports (Barbarick et al. 1984,1986a,
1986b, 1987a, 1987b, 1991,1992a, 1992b; Ippolito et al, 1992,1993,1994; Lerch et al. 1988,
1989,1990a; Utschig etal. 1985), and journal articles (Barbarick and Workman, 1987; Barbarick
et al., 1995; Lerch et al. 1990b, 1990c, 1992,1993a, 1993b; Utschig et al., 1986) detail the 11
years of results from this study. Rather than present all of the data, we will focus on the effects
of selected rates of N fertilizer and biosolids on selected plant parameters and on residual NO3-N
accumulation with depth.
Materials and Methods
Our long-term field study was initiated in August 1982 on two locations near Bennett, CO in
Adams County. We used two sets of plots (A for those established in 1982; B for those
established in 1983) on both the East and West Bennett sites, since we grew hard red winter
wheat in a dryland-summer-fallow-rotation system. Table 1 indicates the rotation used for
locations A and B at both sites.
Table 1. Crop rotation, biosolids, and N fertilizer application history at each location.
Crop Year Location A Location B
1982-83 Biosolids, N, Wheat Fallow
1983-84 Fallow Biosolids, N, Wheat
1984-85 Biosolids, N, Wheat Fallow
1985-86 Fallow Biosolids, N, Wheat
1986-87 Biosolids, N, Wheat Fallow
1987-88 Fallow Biosolids, N, Wheat
1988-89 Biosolids, N, Wheat Fallow
1989-90 Fallow Biosolids, N, Wheat
1990-91 Biosolids, N, Wheat Fallow
1991-92 Fallow Biosolids, N, Wheat
1899 Biosolids, N, Wheat Fallow
East Bennett site A consisted of a Weld loam soil (fine, montmorillonitic, mesic Aridic
Paleustoll); West Bennett site A consisted of a Plainer loam soil (fine, montmorillonitic,
mesicAbruptic Aridic Paleustoll). Weld loam soil constituted both experiments at site B.
Selected properties for baseline soils taken from 0-15,15-30, and 30-60 cm are listed in Table
2.
2-2
image:
Our research objective is to compare the effect of Littleton/Englewood biosolids and N fertilizer
rates on dryland winter wheat (Triticum aestivum L., 'Vona') grain yield, elemental content of
the soil and wheat grain and straw, estimated income, and soil N03-N accumulation. Three
student theses (Lerch 1987,1991;Utschig, 1985), technical reports (Barbarick et al. 1984,1986a,
1986b, 1987a, 1987b, 1991,1992a, 1992b; Ippolito et al, 1992,1993,1994; Lerch et al. 1988,
1989,1990a; Utschig etal. 1985), and journal articles (Barbarick and Workman, 1987; Barbarick
et al., 1995; Lerch et al. 1990b, 1990c, 1992,1993a, 1993b; Utschig et al., 1986) detail the 11
years of results from this study. Rather than present all of the data, we will focus on the effects
of selected rates of N fertilizer and biosolids on selected plant parameters and on residual NO3-N
accumulation with depth.
Materials and Methods
Our long-term field study was initiated in August 1982 on two locations near Bennett, CO in
Adams County. We used two sets of plots (A for those established in 1982; B for those
established in 1983) on both the East and West Bennett sites, since we grew hard red winter
wheat in a dryland-summer-fallow-rotation system. Table 1 indicates the rotation used for
locations A and B at both sites.
Table 1. Crop rotation, biosolids, and N fertilizer application history at each location.
Crop Year Location A Location B
1982-83 Biosolids, N, Wheat Fallow
1983-84 Fallow Biosolids, N, Wheat
1984-85 Biosolids, N, Wheat Fallow
1985-86 Fallow Biosolids, N, Wheat
1986-87 Biosolids, N, Wheat Fallow
1987-88 Fallow Biosolids, N, Wheat
1988-89 Biosolids, N, Wheat Fallow
1989-90 Fallow Biosolids, N, Wheat
1990-91 Biosolids, N, Wheat Fallow
1991-92 Fallow Biosolids, N, Wheat
1899 Biosolids, N, Wheat Fallow
East Bennett site A consisted of a Weld loam soil (fine, montmorillonitic, mesic Aridic
Paleustoll); West Bennett site A consisted of a Plainer loam soil (fine, montmorillonitic,
mesicAbruptic Aridic Paleustoll). Weld loam soil constituted both experiments at site B.
Selected properties for baseline soils taken from 0-15,15-30, and 30-60 cm are listed in Table
2.
2-2
image:
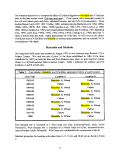 Table 2. Selected baseline soil chemical characteristics.
Property Depth cm East 1982
pH 0-15 6.7
15-30 6.9
30-60 7.8
E.C-.dsm-1 0-15 0.1
15-30 0.1
30-60 0.2
O.M., g kg'1 0-15 9
15-30 6
30-60 7
NO3-N, mgkg-1 0-15 3
15-30 1
30-60 1
AB-DTPA, mg kg'1
P 0-15 11
15-30 4
30-60 1
K 0-15 375
15-30 266
30-60 184
Zn 0-15 0.7
15-30 0.6
30-60 0.4
Fe 0-15 13
15-30 11
30-60 10
Mn 0-15 14
15-30 3
30-60 2
Cu 0-15 2.1
15-30 2.3
30-60 2.6
West 1982 East 1983 West 1982
6.5 6.6 7.5
6.6 7.4 7.3
7.5 7.1 7.5
0.1 0.3 0.4
0.2 0.5 0.4
0.3 0.5 0.4
10 10 10
9 9 11
8 11 10
244
732
1 4 4
9 11 18
4 3 17
1 8 18
462 383 343
438 388 316
356 382 335
1.6 0.9 0.7
0.6 0.6 0.6
0.3 1 0.8
18 11 7
14 8 9
9 16 10
11 27 13
4 12 10
2 28 14
2.5 2.6 2.7
2.5 3 2.6
3 2.6 2.4
2-3
image:
Table 2. Selected baseline soil chemical characteristics.
Property Depth cm East 1982
pH 0-15 6.7
15-30 6.9
30-60 7.8
E.C-.dsm-1 0-15 0.1
15-30 0.1
30-60 0.2
O.M., g kg'1 0-15 9
15-30 6
30-60 7
NO3-N, mgkg-1 0-15 3
15-30 1
30-60 1
AB-DTPA, mg kg'1
P 0-15 11
15-30 4
30-60 1
K 0-15 375
15-30 266
30-60 184
Zn 0-15 0.7
15-30 0.6
30-60 0.4
Fe 0-15 13
15-30 11
30-60 10
Mn 0-15 14
15-30 3
30-60 2
Cu 0-15 2.1
15-30 2.3
30-60 2.6
West 1982 East 1983 West 1982
6.5 6.6 7.5
6.6 7.4 7.3
7.5 7.1 7.5
0.1 0.3 0.4
0.2 0.5 0.4
0.3 0.5 0.4
10 10 10
9 9 11
8 11 10
244
732
1 4 4
9 11 18
4 3 17
1 8 18
462 383 343
438 388 316
356 382 335
1.6 0.9 0.7
0.6 0.6 0.6
0.3 1 0.8
18 11 7
14 8 9
9 16 10
11 27 13
4 12 10
2 28 14
2.5 2.6 2.7
2.5 3 2.6
3 2.6 2.4
2-3
image:
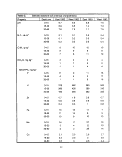 We applied biosolids and N fertilizer treatments (NH4NO3; 34-0-0) to plots of 4.4 by 17.1 m in
1982,1984,1986,1988,1990, and 1992 at site A. The dry biosolids application rates were 0,
7,14,28, and 42 Mg ha'1 and N fertilizer rates were 0,28, 56, and 112 kg N ha'1. In 1983,1985,
1987,1989, and 1991, we added the same rates of biosolids used at site A to plots of 3.3 by 17.1
m at site B; N fertilizer rates at site B were 0, 34, 67, 101, and 134 kg N ha'1. We used four
replications of all treatments at all experimental sites. In 1982 and 1983, we applied a more
liquid biosolids (35 and 42 g solids ha'1; Table 3) to our bermed plots by transfer from semi-
tanker trucks through fire hose. Our fanner cooperators disked the biosolids and N treatments
after the liquid biosolids had infiltrated into the soil and dried on the surface. The pre-weighed
NH4N03 treatments were spread uniformly by hand. In subsequent years, we weighed the drier
biosolids (528 to 850 g solids kg"1; Table 3), spread them evenly over the plots by a front-end
loader, and then hand raked to improve the uniformity of distribution. In the years that we used
dried biosolids, we roto-tilled all plots to a depth of 10 to 15 cm.
For this report we will present only the data for the control (0 kg N ha'1), a typical N fertilizer
rate (56 kg N ha"1 at site A; 67 kg N ha'1 at site B), our recommended rate of biosolids for
dryland wheat (6.7 Mg biosolids ha"1 per application), and an excessive rate of biosolids (26.8
Mg biosolids ha'1 per application). Properties of biosolids applied each year are given in Table
3. The biosolids were classified as Grade I for 3 years and as Grade II for 8 years (Colorado
Department of Health, 1985). Grade I biosolids, if dewatered and stored for one year prior to
application may be applied to any land for any beneficial use. Grade II biosolids can be used for
beneficial use on agricultural and disturbed lands only (Colorado Department of Health, 1993).
The Mo concentration would dictate whether the biosolids in any given year are either Grade I
(less than 18 mg kg"1) or Grade II (between 18 and 75 mg kg'1). The Grade I Mo limitation is
currently on hold until more information on Mo concentration effects on plant toxicity is
reported.
2-4
image:
We applied biosolids and N fertilizer treatments (NH4NO3; 34-0-0) to plots of 4.4 by 17.1 m in
1982,1984,1986,1988,1990, and 1992 at site A. The dry biosolids application rates were 0,
7,14,28, and 42 Mg ha'1 and N fertilizer rates were 0,28, 56, and 112 kg N ha'1. In 1983,1985,
1987,1989, and 1991, we added the same rates of biosolids used at site A to plots of 3.3 by 17.1
m at site B; N fertilizer rates at site B were 0, 34, 67, 101, and 134 kg N ha'1. We used four
replications of all treatments at all experimental sites. In 1982 and 1983, we applied a more
liquid biosolids (35 and 42 g solids ha'1; Table 3) to our bermed plots by transfer from semi-
tanker trucks through fire hose. Our fanner cooperators disked the biosolids and N treatments
after the liquid biosolids had infiltrated into the soil and dried on the surface. The pre-weighed
NH4N03 treatments were spread uniformly by hand. In subsequent years, we weighed the drier
biosolids (528 to 850 g solids kg"1; Table 3), spread them evenly over the plots by a front-end
loader, and then hand raked to improve the uniformity of distribution. In the years that we used
dried biosolids, we roto-tilled all plots to a depth of 10 to 15 cm.
For this report we will present only the data for the control (0 kg N ha'1), a typical N fertilizer
rate (56 kg N ha"1 at site A; 67 kg N ha'1 at site B), our recommended rate of biosolids for
dryland wheat (6.7 Mg biosolids ha"1 per application), and an excessive rate of biosolids (26.8
Mg biosolids ha'1 per application). Properties of biosolids applied each year are given in Table
3. The biosolids were classified as Grade I for 3 years and as Grade II for 8 years (Colorado
Department of Health, 1985). Grade I biosolids, if dewatered and stored for one year prior to
application may be applied to any land for any beneficial use. Grade II biosolids can be used for
beneficial use on agricultural and disturbed lands only (Colorado Department of Health, 1993).
The Mo concentration would dictate whether the biosolids in any given year are either Grade I
(less than 18 mg kg"1) or Grade II (between 18 and 75 mg kg'1). The Grade I Mo limitation is
currently on hold until more information on Mo concentration effects on plant toxicity is
reported.
2-4
image:
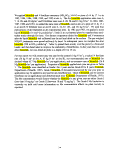 Characteristics of biosolids applied to East and West Bennett sites from 1982 to 1992 (year applied).
Parameter
Solids, g kg1
Total N, g kg'1
N03-N,gkg''
NH4-N,gkg'
P.gkg'
K,gkg'
Cu, mg kg'1
Zn, mg kg'1
Ni, mg kg'1
Pb, mg kg"'
Cd, mg kg'1
Mo, mg kg'1
Location
where
biosolids
were applied
1982
35
128
3
50
28
9
1O4O
1980
70
27O
D30
59
A
1983
42
90
2
57
21
7
877
1300
94
161
15
2O
B
1984
528
29
DI
8
11
3
462
751
56
531
8
12
A
1985
680
22
1
Dl
27
3
1159
2538
91
322
11
38
B
1986
850
10
Dl
2
8
2
359
618
47
206
10
7
A
1987
850
13
2
3
13
3
422
681
50
204
9
9
B
1988
780
9
Dl
Dl
16
3
917
1054
66
228
12
20
A
1989
760
38
Dl
6
21
3
884
1255
78
134
9
36
B
720
30
Dl
6
34
2
865
1303
93
134
9
32
A
560
50
Dl
11
33
4
807
1317
91
129
7
45
B
760
46
Dl
12
37
4
863
1303
177
20
7
22
A
avg.±sd
597±294
42±37
Dl
14±20
23±10
4±2
787±259
1282±56
6
83±36
213*133
10±2
27±16
Grain yields were determined by harvesting a 15.2 by 1.2 m area. We measured grain elemental concentrations of Cd, Cu, Mo, Ni, P, Pb,
and Zn in concentrated HNO3 digests (Havlin and Soltanpour, 1980) by the inductively coupled plasma-atomic emission spectrophotometer
(ICP-AES). We calculated mean concentrations for each treatment and each location. This allowed us to compare results from all four
locations even though the A plots received six applications while the B plots received five applications of biosolids. We compared these
means statistically using oneway analyses of variance. We calculated mean separation values only for those cases where the probability
level for the oneway analyses of variance were less than 0.10 (F-LSD).
For estimated income calculations, we based grain prices (including protein premiums when given) for each year on the most current quotes
for that harvest year. Nitrogen fertilizer costs were based on anhydrous NH3, since it is the most commonly used material in eastern
Colorado for dryland wheat production. The Littleton/Englewood biosolids and its application are currently free to farmers within a 65-km
radius of the waste treatment facility.
Immediately following each harvest, soil samples from 0-20 and 20-60 cm were taken. Proceeding the 1992 harvests, soil samples
from 60-90, 90-120, and 120-180 cm also were obtained. After the 1993 harvest, soil samples from 60-100,100-150, and 150-200 cm
2-5
image:
Characteristics of biosolids applied to East and West Bennett sites from 1982 to 1992 (year applied).
Parameter
Solids, g kg1
Total N, g kg'1
N03-N,gkg''
NH4-N,gkg'
P.gkg'
K,gkg'
Cu, mg kg'1
Zn, mg kg'1
Ni, mg kg'1
Pb, mg kg"'
Cd, mg kg'1
Mo, mg kg'1
Location
where
biosolids
were applied
1982
35
128
3
50
28
9
1O4O
1980
70
27O
D30
59
A
1983
42
90
2
57
21
7
877
1300
94
161
15
2O
B
1984
528
29
DI
8
11
3
462
751
56
531
8
12
A
1985
680
22
1
Dl
27
3
1159
2538
91
322
11
38
B
1986
850
10
Dl
2
8
2
359
618
47
206
10
7
A
1987
850
13
2
3
13
3
422
681
50
204
9
9
B
1988
780
9
Dl
Dl
16
3
917
1054
66
228
12
20
A
1989
760
38
Dl
6
21
3
884
1255
78
134
9
36
B
720
30
Dl
6
34
2
865
1303
93
134
9
32
A
560
50
Dl
11
33
4
807
1317
91
129
7
45
B
760
46
Dl
12
37
4
863
1303
177
20
7
22
A
avg.±sd
597±294
42±37
Dl
14±20
23±10
4±2
787±259
1282±56
6
83±36
213*133
10±2
27±16
Grain yields were determined by harvesting a 15.2 by 1.2 m area. We measured grain elemental concentrations of Cd, Cu, Mo, Ni, P, Pb,
and Zn in concentrated HNO3 digests (Havlin and Soltanpour, 1980) by the inductively coupled plasma-atomic emission spectrophotometer
(ICP-AES). We calculated mean concentrations for each treatment and each location. This allowed us to compare results from all four
locations even though the A plots received six applications while the B plots received five applications of biosolids. We compared these
means statistically using oneway analyses of variance. We calculated mean separation values only for those cases where the probability
level for the oneway analyses of variance were less than 0.10 (F-LSD).
For estimated income calculations, we based grain prices (including protein premiums when given) for each year on the most current quotes
for that harvest year. Nitrogen fertilizer costs were based on anhydrous NH3, since it is the most commonly used material in eastern
Colorado for dryland wheat production. The Littleton/Englewood biosolids and its application are currently free to farmers within a 65-km
radius of the waste treatment facility.
Immediately following each harvest, soil samples from 0-20 and 20-60 cm were taken. Proceeding the 1992 harvests, soil samples
from 60-90, 90-120, and 120-180 cm also were obtained. After the 1993 harvest, soil samples from 60-100,100-150, and 150-200 cm
2-5
image:
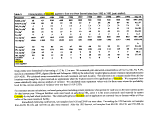 were acquired. We determined the NO3-N concentration in CuSO4/Ag2SO4 extracts using the
NAS-Szechrome colorimetric procedure (Szekely, 1968). We statistically analyzed the treatment
differences for the mean of each depth increment by oneway analyses of variance. We again
used mean separation tests (a = 0.05 probability level) for those concentrations that were
significantly different.
Results and Discussion
Grain Elemental Concentrations
Even after five or six applications of biosolids, we have not added large quantities of most of the
biosolids-borne trace elements (Table 4). These additions, however, have led to significant total
accumulations in soils (Ippolito et al., 1993, 1994). Despite this soil accumulation, grain
concentrations of these trace elements have not approached critical health levels (Logan and
Chancy, 1983; Sommers and Barbarick, 1986).
Table 4.
Cu
Zn
Ni
Pb
Cd
Mo
Total amounts
rates after five
Plot A, 6.7
Mg ha"1
30.2
47
3.41
9.31
0.41
1.02
of selected trace elements added with the
or six applications.
Plot B, 6.7
Mg ha'1
kg
121
188
13.6
37.2
1.63
4.07
Plot A, 26.8
Mg ha'1
ha'1
27.8
47.5
2.71
6.36
0.34
0.99
two biosolids
Plot B, 26.8
Mg ha'1
111
190
10.8
25.5
1.37
3.97
The N fertilizer or biosolids treatments did not significantly affect mean yields (Fig. 1).
Essentially, bioisolids treatments have performed equally, in terms of grain yield, with the
control (0 kg N ha'1) or the typical N fertilizer rate (56 or 67 kg N ha"1).
We found that both biosolids rates increased grain protein above the control (0 kg N ha'1) at all
locations except the East B site (Fig. 2). For the same three locations, the highest biosolids rate
produced higher grain protein than the N fertilizer treatment (56 or 67 kg N ha'1). We observed
no differences in grain protein between the two biosolids rates.
The range in income was from a low of $263 for the control at West Bennett B to a high of $491
for the 6.7 Mg ha'1 biosolids rate at East Bennett A (Fig. 3). The overall averages were $313,
333,384, and 355 ha'1 for the control, N fertilizer treatment, 6.7 Mg biosolids ha'1 rate, and 26.8
Mg biosolids ha'1 treatment, respectively. This income range draws wheat producers' attention.
2-6
image:
were acquired. We determined the NO3-N concentration in CuSO4/Ag2SO4 extracts using the
NAS-Szechrome colorimetric procedure (Szekely, 1968). We statistically analyzed the treatment
differences for the mean of each depth increment by oneway analyses of variance. We again
used mean separation tests (a = 0.05 probability level) for those concentrations that were
significantly different.
Results and Discussion
Grain Elemental Concentrations
Even after five or six applications of biosolids, we have not added large quantities of most of the
biosolids-borne trace elements (Table 4). These additions, however, have led to significant total
accumulations in soils (Ippolito et al., 1993, 1994). Despite this soil accumulation, grain
concentrations of these trace elements have not approached critical health levels (Logan and
Chancy, 1983; Sommers and Barbarick, 1986).
Table 4.
Cu
Zn
Ni
Pb
Cd
Mo
Total amounts
rates after five
Plot A, 6.7
Mg ha"1
30.2
47
3.41
9.31
0.41
1.02
of selected trace elements added with the
or six applications.
Plot B, 6.7
Mg ha'1
kg
121
188
13.6
37.2
1.63
4.07
Plot A, 26.8
Mg ha'1
ha'1
27.8
47.5
2.71
6.36
0.34
0.99
two biosolids
Plot B, 26.8
Mg ha'1
111
190
10.8
25.5
1.37
3.97
The N fertilizer or biosolids treatments did not significantly affect mean yields (Fig. 1).
Essentially, bioisolids treatments have performed equally, in terms of grain yield, with the
control (0 kg N ha'1) or the typical N fertilizer rate (56 or 67 kg N ha"1).
We found that both biosolids rates increased grain protein above the control (0 kg N ha'1) at all
locations except the East B site (Fig. 2). For the same three locations, the highest biosolids rate
produced higher grain protein than the N fertilizer treatment (56 or 67 kg N ha'1). We observed
no differences in grain protein between the two biosolids rates.
The range in income was from a low of $263 for the control at West Bennett B to a high of $491
for the 6.7 Mg ha'1 biosolids rate at East Bennett A (Fig. 3). The overall averages were $313,
333,384, and 355 ha'1 for the control, N fertilizer treatment, 6.7 Mg biosolids ha'1 rate, and 26.8
Mg biosolids ha'1 treatment, respectively. This income range draws wheat producers' attention.
2-6
image:
 As shown in Fig. 4, the higher biosolids treatment (26.8 Mg ha'1) produced higher grain P
concentrations than the typical N fertilizer rate at three locations. The lower biosolids treatment
(6.7 Mg ha"1) created higher P levels than the N fertilizer rate at East A and West A. Average
grain P concentrations ranged from 3.2 mg kg"1 for the N fertilizer at East A to 4.7 mg kg"1 for
the 26.8 Mg biosolids ha"1 at East B and West A. We did not anticipate large differences in grain
P, since the initial plant-available P levels in the surface soils ranged from moderate to high
(Table 2). Barbarick et al. (1995) also showed that grain P approached a maximum plateau
asymptotically (it leveled off) as biosolids-bourne P rates increased .
The higher biosolids rate produced higher grain Cu levels (Fig.5) than the control at East A and
West A. As with P, grain Cu has plateaued as amount of biosolids Cu applied has increased
(Barbarick et al., 1995).
Biosolids and N fertilizer application did not significantly affect grain Mo concentrations (Fig.
6). These data plus the information from Barbarick et al. (1995) indicate that the original
USEPA (1993) and Colorado Department of Health and Environment (1993) limit of 18 mg Mo
kg"1 for Grade I biosolids may be too restrictive for dryland winter wheat.
The 26.8 Mg biosolids ha'1 rate has produced higher grain Ni levels (Fig. 7) than the control and
the N fertilizer treatment at West A. Unlike the other nutrients studied, Ni has demonstrated a
linear increase in concentration as the amount of biosolids Ni applied has increased (Barbarick
etal., 1995).
Both biosolids rates produced significantly higher grain Zn concentrations than the control and
the N fertilizer treatments at all locations (Fig. 8). The higher biosolids rate also resulted in
significantly higher Zn levels than the lower biosolids treatment at West A. Our soils were
originally low in plant-available Zn (Table 2) so that the biosolids apparently supplied plant-
available Zn.
Soil NO3-N Concentrations
B Plots
Five applications of 26.8 Mg biosolids ha'1 resulted in significantly higher NO3-N concentrations
at 0 to 20 cm than any other treatment at East Bennett (Fig. 9). The high biosolids rate also
resulted in significant accumulations of NO3-N at 20 to 60 and 150 to 200 cm compared to the
control and the N fertilizer treatment. At the 60- to 100-cm depth, N03-N levels associated with
the high biosolids rate was significantly higher than the control. The 6.7 Mg biosolids ha"1
treatments contained significantly more N03-N than the control and 67 kg fertilizer N ha"1
treatment at the 0- to 20-cm depth; it was not significantly larger than the other two treatments
at deeper depths.
Biosolids applied five times at 26.8 Mg ha"1 produced significant N03-N accumulations
compared to all other treatments for the 0- to 100-cm depths at West Bennett (Fig. 10) and
compared to the control and N fertilizer at the 150- to 200-cm depth. Five applications of 6.7
biosolids Mg ha'1 did not increase soil NO3-N levels compared to the control and 67 kg N
fertilizer ha"1 at any depth.
2-7
image:
As shown in Fig. 4, the higher biosolids treatment (26.8 Mg ha'1) produced higher grain P
concentrations than the typical N fertilizer rate at three locations. The lower biosolids treatment
(6.7 Mg ha"1) created higher P levels than the N fertilizer rate at East A and West A. Average
grain P concentrations ranged from 3.2 mg kg"1 for the N fertilizer at East A to 4.7 mg kg"1 for
the 26.8 Mg biosolids ha"1 at East B and West A. We did not anticipate large differences in grain
P, since the initial plant-available P levels in the surface soils ranged from moderate to high
(Table 2). Barbarick et al. (1995) also showed that grain P approached a maximum plateau
asymptotically (it leveled off) as biosolids-bourne P rates increased .
The higher biosolids rate produced higher grain Cu levels (Fig.5) than the control at East A and
West A. As with P, grain Cu has plateaued as amount of biosolids Cu applied has increased
(Barbarick et al., 1995).
Biosolids and N fertilizer application did not significantly affect grain Mo concentrations (Fig.
6). These data plus the information from Barbarick et al. (1995) indicate that the original
USEPA (1993) and Colorado Department of Health and Environment (1993) limit of 18 mg Mo
kg"1 for Grade I biosolids may be too restrictive for dryland winter wheat.
The 26.8 Mg biosolids ha'1 rate has produced higher grain Ni levels (Fig. 7) than the control and
the N fertilizer treatment at West A. Unlike the other nutrients studied, Ni has demonstrated a
linear increase in concentration as the amount of biosolids Ni applied has increased (Barbarick
etal., 1995).
Both biosolids rates produced significantly higher grain Zn concentrations than the control and
the N fertilizer treatments at all locations (Fig. 8). The higher biosolids rate also resulted in
significantly higher Zn levels than the lower biosolids treatment at West A. Our soils were
originally low in plant-available Zn (Table 2) so that the biosolids apparently supplied plant-
available Zn.
Soil NO3-N Concentrations
B Plots
Five applications of 26.8 Mg biosolids ha'1 resulted in significantly higher NO3-N concentrations
at 0 to 20 cm than any other treatment at East Bennett (Fig. 9). The high biosolids rate also
resulted in significant accumulations of NO3-N at 20 to 60 and 150 to 200 cm compared to the
control and the N fertilizer treatment. At the 60- to 100-cm depth, N03-N levels associated with
the high biosolids rate was significantly higher than the control. The 6.7 Mg biosolids ha"1
treatments contained significantly more N03-N than the control and 67 kg fertilizer N ha"1
treatment at the 0- to 20-cm depth; it was not significantly larger than the other two treatments
at deeper depths.
Biosolids applied five times at 26.8 Mg ha"1 produced significant N03-N accumulations
compared to all other treatments for the 0- to 100-cm depths at West Bennett (Fig. 10) and
compared to the control and N fertilizer at the 150- to 200-cm depth. Five applications of 6.7
biosolids Mg ha'1 did not increase soil NO3-N levels compared to the control and 67 kg N
fertilizer ha"1 at any depth.
2-7
image:
 The residual NO3-N to 100 cm for the 6.7 Mg biosolids ha'1 treatment pose a potential for N03-N
leaching. The large amounts of N applied with the first application in 1983 produced most of
the NO3-N accumulation (Table 3)(Utschig et al., 1986). The four subsequent additions
consisted of dried biosolids (>50% solids; Table 3) which resulted in lower total applied N
levels. Without the first large N application, the residual carryover would more nearly match
that of the 67 kg N fertilizer ha'1 treatment.
The high biosolids rate supplies excessive N. Thus, the potential for N03-N leaching is high.
A Plots
Six applications of 26.8 Mg biosolids ha'1 resulted in significantly larger accumulations of soil
N03-N when compared to the other three treatments for all depths at East Bennett (Fig. 11) and
all but the 150- to 200-cm depths at West Bennett (Fig. 12). Residual N03-N was significantly
higher with the six additions of the low biosolids rate than with the control or with 56 kg N
fertilizer ha'1 at the 20- to 150-cm depths at East Bennett but was not significantly different than
the control or 56 kg N fertilizer ha'1 treatment at all soil depths at West Bennett. Again, we can
attribute most of the NO3-N carryover to the first large application in 1982 (Table 3; Utschig et
al., 1986), and we would have a closer match to the residual NO3-N found with 56 kg N fertilizer
ha"1 if we had not used more liquid biosolids for the first addition.
We do not recommend the 26.8 Mg biosolids ha'1 treatment, since it caused elevated NO3-N
concentrations at most soil depths. Knowledge of the quantities of different N forms in biosolids
and the form of the material (liquid, dewatered, dried) is required to determine optimum
application rates.
Conclusions
Five or six applications of 6.7 or 26.8 Mg biosolids ha'1 increased wheat grain protein, P, Cu, and
Zn concentrations compared to those from a control (0 kg N ha'1) or N fertilizer (56 or 67 kg N
ha'1) treatment. We found inconsistent trends in grain levels of Ni; and, no significant effects
on grain yields and gram Mo concentrations. Projected income ranged from an average of $313
ha'1 for the control to $384 ha'1 for the low biosolids rate.
The soil N03-N concentrations associated with the higher biosolids rate pose a potential for N03-
N leaching. Nitrate-N accumulated in the lower biosolids treatments to a depth of about 100 cm.
We attributed most of the higher levels of NO3-N in the upper depths to the high application of
N associated with the liquid materials that we initially applied to each set of plots (1982 and
1983). This biosolids management technique is no longer used by Littleton/Englewood so that
a large application of N would not normally occur.
Nitrogen management is the largest challenge in determining safe biosolids application rates.
Barbarick et al. (1995) have shown that grain trace-element concentrations tend to approach a
maximum (a plateau) as biosolids addition increase. Consequently, accurately determining the
agronomic rate to meet the N needs of the target crop should help prevent excessive trace
element uptake by plants and NO3-N leaching below the root zone.
2-8
image:
The residual NO3-N to 100 cm for the 6.7 Mg biosolids ha'1 treatment pose a potential for N03-N
leaching. The large amounts of N applied with the first application in 1983 produced most of
the NO3-N accumulation (Table 3)(Utschig et al., 1986). The four subsequent additions
consisted of dried biosolids (>50% solids; Table 3) which resulted in lower total applied N
levels. Without the first large N application, the residual carryover would more nearly match
that of the 67 kg N fertilizer ha'1 treatment.
The high biosolids rate supplies excessive N. Thus, the potential for N03-N leaching is high.
A Plots
Six applications of 26.8 Mg biosolids ha'1 resulted in significantly larger accumulations of soil
N03-N when compared to the other three treatments for all depths at East Bennett (Fig. 11) and
all but the 150- to 200-cm depths at West Bennett (Fig. 12). Residual N03-N was significantly
higher with the six additions of the low biosolids rate than with the control or with 56 kg N
fertilizer ha'1 at the 20- to 150-cm depths at East Bennett but was not significantly different than
the control or 56 kg N fertilizer ha'1 treatment at all soil depths at West Bennett. Again, we can
attribute most of the NO3-N carryover to the first large application in 1982 (Table 3; Utschig et
al., 1986), and we would have a closer match to the residual NO3-N found with 56 kg N fertilizer
ha"1 if we had not used more liquid biosolids for the first addition.
We do not recommend the 26.8 Mg biosolids ha'1 treatment, since it caused elevated NO3-N
concentrations at most soil depths. Knowledge of the quantities of different N forms in biosolids
and the form of the material (liquid, dewatered, dried) is required to determine optimum
application rates.
Conclusions
Five or six applications of 6.7 or 26.8 Mg biosolids ha'1 increased wheat grain protein, P, Cu, and
Zn concentrations compared to those from a control (0 kg N ha'1) or N fertilizer (56 or 67 kg N
ha'1) treatment. We found inconsistent trends in grain levels of Ni; and, no significant effects
on grain yields and gram Mo concentrations. Projected income ranged from an average of $313
ha'1 for the control to $384 ha'1 for the low biosolids rate.
The soil N03-N concentrations associated with the higher biosolids rate pose a potential for N03-
N leaching. Nitrate-N accumulated in the lower biosolids treatments to a depth of about 100 cm.
We attributed most of the higher levels of NO3-N in the upper depths to the high application of
N associated with the liquid materials that we initially applied to each set of plots (1982 and
1983). This biosolids management technique is no longer used by Littleton/Englewood so that
a large application of N would not normally occur.
Nitrogen management is the largest challenge in determining safe biosolids application rates.
Barbarick et al. (1995) have shown that grain trace-element concentrations tend to approach a
maximum (a plateau) as biosolids addition increase. Consequently, accurately determining the
agronomic rate to meet the N needs of the target crop should help prevent excessive trace
element uptake by plants and NO3-N leaching below the root zone.
2-8
image:
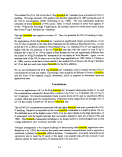 Figure 1. Grain yields averaged over location, 1982-93.
East A
EastB
0 kg N/ha
6.7 Mg biosolids/ha
West A
WestB
56 or 67 kg N/ha
26.8 Mg biosolids/ha
image:
Figure 1. Grain yields averaged over location, 1982-93.
East A
EastB
0 kg N/ha
6.7 Mg biosolids/ha
West A
WestB
56 or 67 kg N/ha
26.8 Mg biosolids/ha
image:
 Figure 2. Grain protein concentrations averaged over location, 1982-93,
LSD = 2.1%
East A
EastB
West A
WestB
0 kg N/ha
6.7 Mg biosolids/ha
56 or 67 kg N/ha
26.8 Mg biosolids/ha
image:
Figure 2. Grain protein concentrations averaged over location, 1982-93,
LSD = 2.1%
East A
EastB
West A
WestB
0 kg N/ha
6.7 Mg biosolids/ha
56 or 67 kg N/ha
26.8 Mg biosolids/ha
image:
 Figure 3. Projected income averaged over location, 1982-93,
500
:400
o>
o
o
300
200
East A
EastB
West A
WestB
0 kg N/ha
6.7 Mg biosolids/ha
56 or 67 kg N/ha
26.8 Mg biosolids/ha
image:
Figure 3. Projected income averaged over location, 1982-93,
500
:400
o>
o
o
300
200
East A
EastB
West A
WestB
0 kg N/ha
6.7 Mg biosolids/ha
56 or 67 kg N/ha
26.8 Mg biosolids/ha
image:
 Figure 4. Grain P concentrations averaged over location, 1982-93.
LSD = 0.7g/kg
East A
EastB
West A
WestB
0 kg N/ha
6.7 Mg biosolids/ha
56 or 67 kg N/ha
26.8 Mg biosolids/ha
image:
Figure 4. Grain P concentrations averaged over location, 1982-93.
LSD = 0.7g/kg
East A
EastB
West A
WestB
0 kg N/ha
6.7 Mg biosolids/ha
56 or 67 kg N/ha
26.8 Mg biosolids/ha
image:
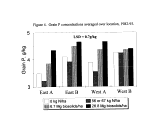 Figure 5. Grain Cu concentrations averaged over location, 1982-93,
O)
O
-— 5
°
East A
EastB
West A
WestB
0 kg N/ha
6.7 Mg biosolids/ha
56 or 67 kg N/ha
26.S Mg biosolids/ha
image:
Figure 5. Grain Cu concentrations averaged over location, 1982-93,
O)
O
-— 5
°
East A
EastB
West A
WestB
0 kg N/ha
6.7 Mg biosolids/ha
56 or 67 kg N/ha
26.S Mg biosolids/ha
image:
 Figure 6. Grain Mo concentrations averaged over location, 1982-93.
1.5
D)
E
o"
1
•|0.5
(D
0
East A
EastB
West A
WestB
0 kgs N/ha
6.7 Mg biosolids/ha
56 or 67 kg N/ha
26.8 Mg biosolids/ha
image:
Figure 6. Grain Mo concentrations averaged over location, 1982-93.
1.5
D)
E
o"
1
•|0.5
(D
0
East A
EastB
West A
WestB
0 kgs N/ha
6.7 Mg biosolids/ha
56 or 67 kg N/ha
26.8 Mg biosolids/ha
image:
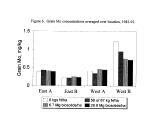 Figure 7. Grain Ni concentrations averaged over location, 1982-93.
O>
•== 1
CO I
O
0.5
LSD = 0.8 mg/kg
East A
EastB
West A
WestB
0 kg N/ha
6.7 Mg biosolids/ha
56 or 67 kg N/ha
26.8 Mg biosolids/ha
image:
Figure 7. Grain Ni concentrations averaged over location, 1982-93.
O>
•== 1
CO I
O
0.5
LSD = 0.8 mg/kg
East A
EastB
West A
WestB
0 kg N/ha
6.7 Mg biosolids/ha
56 or 67 kg N/ha
26.8 Mg biosolids/ha
image:
 Figure 8. Grain Zn concentrations averaged over location, 1982-93.
50
D)
40
N
O
30
20
10
LSD = 9 mg/kg
East A
EastB
West A
WestB
0 kg N/ha
6.7 Mg biosolids/ha
56 or 67 kg N/ha
26.S Mg biosolids/ha
image:
Figure 8. Grain Zn concentrations averaged over location, 1982-93.
50
D)
40
N
O
30
20
10
LSD = 9 mg/kg
East A
EastB
West A
WestB
0 kg N/ha
6.7 Mg biosolids/ha
56 or 67 kg N/ha
26.S Mg biosolids/ha
image:
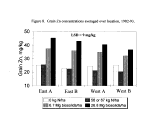 Figure 9. The effect of selected biosolids and N rates on
harvest soil nitrate-N, 1991-92, East Bennett
B plots.
Nitrate-N, ppm
10 20 30 40 50
LSD = 10*
LSD = 17**
LSD = 18*
NS
LSD = 4*
Control
67kg / ha
6.7 Mg biosolids / ha
26.8 Mg biosolids / ha
-B-
image:
Figure 9. The effect of selected biosolids and N rates on
harvest soil nitrate-N, 1991-92, East Bennett
B plots.
Nitrate-N, ppm
10 20 30 40 50
LSD = 10*
LSD = 17**
LSD = 18*
NS
LSD = 4*
Control
67kg / ha
6.7 Mg biosolids / ha
26.8 Mg biosolids / ha
-B-
image:
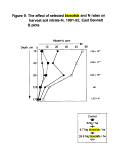 Figure 10. The effect of selected biosolids and N rates on
harvest soil nitrate-N, 1991-92, West Bennett
B plots.
Nitrate-N, ppm
10 20 30 40 50
LSD = 17*
LSD = 30*
LSD = 22*
NS
LSD = 2*
Control
67 kg N / ha
6.7 Mg biosolids / ha
26.8 Mg biosolids / ha
-B-
image:
Figure 10. The effect of selected biosolids and N rates on
harvest soil nitrate-N, 1991-92, West Bennett
B plots.
Nitrate-N, ppm
10 20 30 40 50
LSD = 17*
LSD = 30*
LSD = 22*
NS
LSD = 2*
Control
67 kg N / ha
6.7 Mg biosolids / ha
26.8 Mg biosolids / ha
-B-
image:
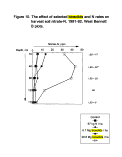 Figure 11. The effect of selected biosolids and N rates on
harvest soil nitrate-N, 1992-93, East Bennett
A plots.
Depth, cm -JO
17
Nitrate-N, ppm
LSD = 48
- >|Q**
LSD = 14
- 4/1**
LSD = 5
- c**
LSD = 3
_. o**
LSD = 6
— c**
Control
56 kg N / ha
6.7 Mg biosolids / ha
26.8 Mg biosolids / ha
-B-
image:
Figure 11. The effect of selected biosolids and N rates on
harvest soil nitrate-N, 1992-93, East Bennett
A plots.
Depth, cm -JO
17
Nitrate-N, ppm
LSD = 48
- >|Q**
LSD = 14
- 4/1**
LSD = 5
- c**
LSD = 3
_. o**
LSD = 6
— c**
Control
56 kg N / ha
6.7 Mg biosolids / ha
26.8 Mg biosolids / ha
-B-
image:
 Figure 12. The effect of selected biosolids and N rates on
harvest soil nitrate-N, 1992-93, West Bennett
A plots.
Nitrate-N, ppm
0 20 40 60 80 100
Depth, cm -j Q p
40
175-
LSD =
LSD = 14**
LSD = 19"
LSD = 7*
NS
Control
56 kg N / ha
6.7 Mg biosolids / ha
26.8 Mg biosolids / ha
image:
Figure 12. The effect of selected biosolids and N rates on
harvest soil nitrate-N, 1992-93, West Bennett
A plots.
Nitrate-N, ppm
0 20 40 60 80 100
Depth, cm -j Q p
40
175-
LSD =
LSD = 14**
LSD = 19"
LSD = 7*
NS
Control
56 kg N / ha
6.7 Mg biosolids / ha
26.8 Mg biosolids / ha
image:
 REFERENCES
Barbarick, K. A., and S. M. Workman. 1987. NH4HC03-DTPA and DTPA extractions of
sludge-amended soils. J. Environ. Qual. 16:125-130.
Barbarick, K.A., J.A. Ippolito, and D.G. Westfall. 1995. Biosolids effect on P, Cu, Zn, Ni, Mo
concentrations in dryland wheat. J. Environ. Qual. (In Press).
Barbarick, K.A., J. Ippolito, D.G. Westfall, R.H. Follett, and R. Jepson. 1992a. Fate of sewage
sludge nitrogen applied to soils. Colorado Agricultural Experiment Station Bulletin
TB92-3.
Barbarick, K. A., R. Lerch, J. M. Utschig, D. G. Westfall, R. H. Follett, T. M. McBride, and W.
F. Owen. 1987. Application of municipal sewage sludge to dryland winter wheat. Waste
Management Conference - Focus on the West Proceedings. Fort Collins, CO.
Barbarick, K. A., R. Lerch, D. G. Westfall, R. H. Follett, and T. M. McBride. 1987. Application
of anaerobically digested sewage sludge to dryland wheat. Technical Report 87-10.
Colorado Agricultural Experiment Station.
Barbarick, K. A., R. N. Lerch, D. G. Westfall, R. H. Follett, J. Ippolito, and R. Jepson. 1991.
Application of anaerobically digested sewage sludge to dryland winter wheat. Technical
Report TR91-5, Colorado Agricultural Experiment Station.
Barbarick, K.A., R.N. Lerch, J.M. Utschig, D.G. Westfall, R.H. Follett, J. Ippolito, R. Jepson,
and T. McBride. 1992b. Eight years of sewage sludge addition to dryland winter wheat.
Colo. Agric. Exp. Stn. Bulletin. TB92-1.
Barbarick, K. A., J. M. Utschig, D. G. Westfall, R. H. Follett, and T. McBride. 1984. Application
of the liquid/anaerobically digested sewage sludge from Littleton/Englewood to dryland
winter wheat in Bennett, Colorado, 1982-83. Progress Report No. 10, Colorado State
University Agricultural Experiment Station.
Barbarick, K. A., J. M. Utschig, D. G. Westfall, and R. H. Follett. 1986a. Liquid sludge
incorporation and nitrogen availability to dryland winter wheat. Technical Bulletin 86-2.
Colorado Agricultural Experiment Station.
Barbarick, K. A., D. G. Westfall, R. H. Follett, R. Lerch, and T. M. McBride. 1986b. Application
of anaerobically digested sewage sludge to dryland winter wheat. Technical Report 86-9.
Colorado Agricultural Experiment Station.
Colorado Department of Health. 1985. Domestic Sewage Sludge Regulations. Denver, CO.
Colorado Department of Health. 1993. Biosolids Regulation 4.9.0.
Havlin, J.L., and P.N. Soltanpour. 1980. A nitric acid plant tissue digest method for use with
inductively coupled plasma spectrometry. Comm. Soil Sci. and Plant Anal. 11:969-980.
Ippolito, J., K.A. Barbarick, D.G. Westfall, R.H. Follett, and R. Jepson. 1992. Application of
anaerobically digested sewage sludge to dryland winter wheat. Colorado Agricultural
Experiment Station Technical Report. TR92-5.
Ippolito, J., K.A. Barbarick, D.G. Westfall, R.H. Follett, and R. Jepson. 1993. Application of
anaerobically digested sewage sludge to dryland winter wheat. Colorado Agricultural
Experiment Station Technical Report. TR93-5.
Ippolito, J., K.A. Barbarick, D.G. Westfall, and R. Jepson. 1994. Application of anaerobically
digested biosolids to dryland winter wheat. Colorado Agricultural Experiment Station
Technical Report. TR94-6.
Lerch, R.N. 1987. Performance of sewage sludge versus nitrogen fertilizer applied to dryland
winter wheat. M.S. Thesis. Colorado State University. Fort Collins, CO.
2-9
image:
REFERENCES
Barbarick, K. A., and S. M. Workman. 1987. NH4HC03-DTPA and DTPA extractions of
sludge-amended soils. J. Environ. Qual. 16:125-130.
Barbarick, K.A., J.A. Ippolito, and D.G. Westfall. 1995. Biosolids effect on P, Cu, Zn, Ni, Mo
concentrations in dryland wheat. J. Environ. Qual. (In Press).
Barbarick, K.A., J. Ippolito, D.G. Westfall, R.H. Follett, and R. Jepson. 1992a. Fate of sewage
sludge nitrogen applied to soils. Colorado Agricultural Experiment Station Bulletin
TB92-3.
Barbarick, K. A., R. Lerch, J. M. Utschig, D. G. Westfall, R. H. Follett, T. M. McBride, and W.
F. Owen. 1987. Application of municipal sewage sludge to dryland winter wheat. Waste
Management Conference - Focus on the West Proceedings. Fort Collins, CO.
Barbarick, K. A., R. Lerch, D. G. Westfall, R. H. Follett, and T. M. McBride. 1987. Application
of anaerobically digested sewage sludge to dryland wheat. Technical Report 87-10.
Colorado Agricultural Experiment Station.
Barbarick, K. A., R. N. Lerch, D. G. Westfall, R. H. Follett, J. Ippolito, and R. Jepson. 1991.
Application of anaerobically digested sewage sludge to dryland winter wheat. Technical
Report TR91-5, Colorado Agricultural Experiment Station.
Barbarick, K.A., R.N. Lerch, J.M. Utschig, D.G. Westfall, R.H. Follett, J. Ippolito, R. Jepson,
and T. McBride. 1992b. Eight years of sewage sludge addition to dryland winter wheat.
Colo. Agric. Exp. Stn. Bulletin. TB92-1.
Barbarick, K. A., J. M. Utschig, D. G. Westfall, R. H. Follett, and T. McBride. 1984. Application
of the liquid/anaerobically digested sewage sludge from Littleton/Englewood to dryland
winter wheat in Bennett, Colorado, 1982-83. Progress Report No. 10, Colorado State
University Agricultural Experiment Station.
Barbarick, K. A., J. M. Utschig, D. G. Westfall, and R. H. Follett. 1986a. Liquid sludge
incorporation and nitrogen availability to dryland winter wheat. Technical Bulletin 86-2.
Colorado Agricultural Experiment Station.
Barbarick, K. A., D. G. Westfall, R. H. Follett, R. Lerch, and T. M. McBride. 1986b. Application
of anaerobically digested sewage sludge to dryland winter wheat. Technical Report 86-9.
Colorado Agricultural Experiment Station.
Colorado Department of Health. 1985. Domestic Sewage Sludge Regulations. Denver, CO.
Colorado Department of Health. 1993. Biosolids Regulation 4.9.0.
Havlin, J.L., and P.N. Soltanpour. 1980. A nitric acid plant tissue digest method for use with
inductively coupled plasma spectrometry. Comm. Soil Sci. and Plant Anal. 11:969-980.
Ippolito, J., K.A. Barbarick, D.G. Westfall, R.H. Follett, and R. Jepson. 1992. Application of
anaerobically digested sewage sludge to dryland winter wheat. Colorado Agricultural
Experiment Station Technical Report. TR92-5.
Ippolito, J., K.A. Barbarick, D.G. Westfall, R.H. Follett, and R. Jepson. 1993. Application of
anaerobically digested sewage sludge to dryland winter wheat. Colorado Agricultural
Experiment Station Technical Report. TR93-5.
Ippolito, J., K.A. Barbarick, D.G. Westfall, and R. Jepson. 1994. Application of anaerobically
digested biosolids to dryland winter wheat. Colorado Agricultural Experiment Station
Technical Report. TR94-6.
Lerch, R.N. 1987. Performance of sewage sludge versus nitrogen fertilizer applied to dryland
winter wheat. M.S. Thesis. Colorado State University. Fort Collins, CO.
2-9
image:
 Table 1. Biosolids sources, processing, and selected chemical analyses.
Biosolids
Source
A
B
C
Biosolids
Digestion
Process
anaerobic
anaerobic
anaerobic
Moisture
Reduction
Process
drying bed
belt filter press
belt filter press
Field
Locations
1 and 2
3, 4, and 5
6
Biosolids Analysis
P
mg/kg
22600
27000
26200
Cd
mg/kg
5.3
7.7
14.8
Cu
mg/kg
616
840
405
Zn
mg/kg
893
860
883
Table 2 . Biosolids nitrogen analyses and suggested application rates*.
Field
Location
1
2
3
4
5
6
Biosolids Analyses
Total Solids
g/kg
800
900
200
200
200
200
Total N
g/kg
40.4
45.0
51.7
43.0
43.0
40.3
Ammonium-N
g/kg
10.4
7.2
14.0
15.4
11.8
9.7
Fertilizer
Guide
Pert. N Rqmt.
kg/ha
73
28
67
52
63
0
Estimated
biosolids
plant-available N
g/kg
11.2
11.2
14.5
13.2
12.1
11.0
Suggested
biosolids
appl. rate
Mg/ha
6.5
2.5
4.6
3.9
5.2
o.o
See Table 3 for calculation of fertilizer N requirement for each location.
* Biosolids appl. rate calculations from WSU Cooperative Extension Bulletin EB 1432, "Sewage Sludge Guidelines for Washington, Part 3":
Estimated biosolids plant available N (g/kg dry biosolids) = 0.2 * biosolids organic N + 0.5 * biosolids ammonium-N
Suggested N application rate (Mg/ha dry biosolids) = Recommended fertilizer N rate (kg/ha)/biosolids plant-available N (g/kg)
image:
Table 1. Biosolids sources, processing, and selected chemical analyses.
Biosolids
Source
A
B
C
Biosolids
Digestion
Process
anaerobic
anaerobic
anaerobic
Moisture
Reduction
Process
drying bed
belt filter press
belt filter press
Field
Locations
1 and 2
3, 4, and 5
6
Biosolids Analysis
P
mg/kg
22600
27000
26200
Cd
mg/kg
5.3
7.7
14.8
Cu
mg/kg
616
840
405
Zn
mg/kg
893
860
883
Table 2 . Biosolids nitrogen analyses and suggested application rates*.
Field
Location
1
2
3
4
5
6
Biosolids Analyses
Total Solids
g/kg
800
900
200
200
200
200
Total N
g/kg
40.4
45.0
51.7
43.0
43.0
40.3
Ammonium-N
g/kg
10.4
7.2
14.0
15.4
11.8
9.7
Fertilizer
Guide
Pert. N Rqmt.
kg/ha
73
28
67
52
63
0
Estimated
biosolids
plant-available N
g/kg
11.2
11.2
14.5
13.2
12.1
11.0
Suggested
biosolids
appl. rate
Mg/ha
6.5
2.5
4.6
3.9
5.2
o.o
See Table 3 for calculation of fertilizer N requirement for each location.
* Biosolids appl. rate calculations from WSU Cooperative Extension Bulletin EB 1432, "Sewage Sludge Guidelines for Washington, Part 3":
Estimated biosolids plant available N (g/kg dry biosolids) = 0.2 * biosolids organic N + 0.5 * biosolids ammonium-N
Suggested N application rate (Mg/ha dry biosolids) = Recommended fertilizer N rate (kg/ha)/biosolids plant-available N (g/kg)
image:
 Table 3. Field location data and preapplication soil chemical properties
Field
Location
1
2
3
4
5
6
Months
from
application
to harvest
14
22
15
21
21
14
Winter
wheat
variety
Sprague
Eltan
Eltan
Eltan
Tres
Rely
Average
annual
precipitation
cm
25
25
27
27
29
36
Soil chemical analyses
Preapplication
Soil Nitrate-N
Avg.
kg/ha
46
76
49
52
37
227
Std.
Dev.
kg/ha
8
30
8
3
12
54
Fertilizer
Guide
FertN
Rqmt.
kg/ha
73
28
67
52
63
0
Organic
Matter
g/kg
22
12
13
13
28
PH
6.6
6.7
6.4
6.5
6.3
Olsen
P
mg/kg
19.7
11.3
12.0
18.0
12.1
Exch.
K
mg/kg
815
344
446
488
594
Soil sampling depth: NO3-N: 90 cm; organic matter, pH, P, and K: 30 cm
N fertilizer requirement (4.0 Mg grain/ha yield goal) calculated based on Washington State
Univ. Fertilizer Guide 34, "Dryland Wheat Nitrogen Needs" using the following factors:
N mineralized from soil organic matter per 12 months (kg/ha) = average annual precipitation (cm) *r0.88
Available soil NH4-N = 35 kg N/ha (average of 3 mg/kg in 90 cm profile)
Nitrogen requirement per unit yield = 0.045 kg N/kg grain
image:
Table 3. Field location data and preapplication soil chemical properties
Field
Location
1
2
3
4
5
6
Months
from
application
to harvest
14
22
15
21
21
14
Winter
wheat
variety
Sprague
Eltan
Eltan
Eltan
Tres
Rely
Average
annual
precipitation
cm
25
25
27
27
29
36
Soil chemical analyses
Preapplication
Soil Nitrate-N
Avg.
kg/ha
46
76
49
52
37
227
Std.
Dev.
kg/ha
8
30
8
3
12
54
Fertilizer
Guide
FertN
Rqmt.
kg/ha
73
28
67
52
63
0
Organic
Matter
g/kg
22
12
13
13
28
PH
6.6
6.7
6.4
6.5
6.3
Olsen
P
mg/kg
19.7
11.3
12.0
18.0
12.1
Exch.
K
mg/kg
815
344
446
488
594
Soil sampling depth: NO3-N: 90 cm; organic matter, pH, P, and K: 30 cm
N fertilizer requirement (4.0 Mg grain/ha yield goal) calculated based on Washington State
Univ. Fertilizer Guide 34, "Dryland Wheat Nitrogen Needs" using the following factors:
N mineralized from soil organic matter per 12 months (kg/ha) = average annual precipitation (cm) *r0.88
Available soil NH4-N = 35 kg N/ha (average of 3 mg/kg in 90 cm profile)
Nitrogen requirement per unit yield = 0.045 kg N/kg grain
image:
 Field Plot Techniques. Field plots were arranged in a randomized complete block design with
3 to 5 replications at all locations. Small plots (4 x 8 m) were used at locations 1 and 2. For
locations 1 and 2, biosolids were weighed and applied manually, and grain was harvested from
a 1.5 x 7 m swath in the center of each plot with a Hegi small plot combine. Field-scale plots
were used at locations 3,4, 5, and 6. Biosolids were applied with a John Deere 455 Hydropush
manure spreader to 2.5 ha plots. Grain was harvested from one or two combine header widths
in the center of each plot (about 1.2 ha).
Field Location Information (Table 3). Soils at all locations were developed under grasslands
(Haploxerolls great group), with a silt loam surface horizon susceptible to wind erosion. All
locations were managed using a wheat/fallow production system (one year of crop, one year of
fallow in a two year crop production cycle). Biosolids were applied in the fall after crop harvest
(Locations 2,4, and 5) or during the summer fallow (Locations 1, 3, and 6).
Tillage, wheat variety, herbicide and other cultural practices were those routinely used by the
cooperating grower. Wheat varieties at Locations 1,2, 3, and 4 were common soft white wheat
varieties, with moderate straw strength, selected primarily because of their resistance to snow
mold. Varieties at locations 5 and 6 were soft white club wheats with greater straw strength
(less susceptible to lodging). The field locations represent two counties in central Washington
(Locations 1-4) and two counties in eastern Washington (locations 5 and 6). Locations 1 and 2
were in the same field (about 75 m apart). Locations 3 and 4 were located in nearby fields (about
1 km apart). Location 1 was harvested in 1992, locations 3 and 6 in 1993, and locations 2,4, and
5 were harvested in 1994.
Grain testing. Grain yields are reported on an "as is" basis (about 10 % moisture content).
Subsamples of the grain harvested from each plot were collected in the field. Grain was cleaned
to remove chaff and grain test weight (bulk grain weight per unit volume) was determined with
a standard USDA grain grading apparatus. Grain nitrogen was determined via a LEGO
combustion analyzer. Grain N uptake was calculated by multiplying the grain N content by the
corresponding grain yield (minus 10 % moisture).
Soil sampling and analysis.
Preapplication soil samples (0-90 cm) were collected immediately prior to biosolids application.
Surface (0-30 cm) samples were analyzed for pH, Olsen (bicarbonate) P, and exchangeable K;
nitrate-N was determined for the 0-90 cm depth (Table 3).
Postharvest samples for determination of nitrate-N, ammonium-N and sulfate-S were collected
during the late summer or early fall following crop harvest, prior to significant precipitation.
Soil samples were collected in 30 cm depth increments to a depth of 90 cm (Locations 1,2, and
5) or 120 cm (Locations 3,4, and 6), using a hydraulic auger (Kauffman sampler; Albany, OR)
mounted on a small tractor. Approximately 10 to 15 cores (0-30 cm depth) and 3 to 6 cores (30-
60, 60-90, and 90-120 cm depths) were collected from each plot. For conversion of soil
concentrations to kg per hectare, we assumed a soil bulk density of 1.3 g/cm3 at all locations.
Soil nitrate was determined via a colorimetric method or a cadmium reduction method. Soil
reference samples run with each batch of unknown samples showed both nitrate analysis
2-4
image:
Field Plot Techniques. Field plots were arranged in a randomized complete block design with
3 to 5 replications at all locations. Small plots (4 x 8 m) were used at locations 1 and 2. For
locations 1 and 2, biosolids were weighed and applied manually, and grain was harvested from
a 1.5 x 7 m swath in the center of each plot with a Hegi small plot combine. Field-scale plots
were used at locations 3,4, 5, and 6. Biosolids were applied with a John Deere 455 Hydropush
manure spreader to 2.5 ha plots. Grain was harvested from one or two combine header widths
in the center of each plot (about 1.2 ha).
Field Location Information (Table 3). Soils at all locations were developed under grasslands
(Haploxerolls great group), with a silt loam surface horizon susceptible to wind erosion. All
locations were managed using a wheat/fallow production system (one year of crop, one year of
fallow in a two year crop production cycle). Biosolids were applied in the fall after crop harvest
(Locations 2,4, and 5) or during the summer fallow (Locations 1, 3, and 6).
Tillage, wheat variety, herbicide and other cultural practices were those routinely used by the
cooperating grower. Wheat varieties at Locations 1,2, 3, and 4 were common soft white wheat
varieties, with moderate straw strength, selected primarily because of their resistance to snow
mold. Varieties at locations 5 and 6 were soft white club wheats with greater straw strength
(less susceptible to lodging). The field locations represent two counties in central Washington
(Locations 1-4) and two counties in eastern Washington (locations 5 and 6). Locations 1 and 2
were in the same field (about 75 m apart). Locations 3 and 4 were located in nearby fields (about
1 km apart). Location 1 was harvested in 1992, locations 3 and 6 in 1993, and locations 2,4, and
5 were harvested in 1994.
Grain testing. Grain yields are reported on an "as is" basis (about 10 % moisture content).
Subsamples of the grain harvested from each plot were collected in the field. Grain was cleaned
to remove chaff and grain test weight (bulk grain weight per unit volume) was determined with
a standard USDA grain grading apparatus. Grain nitrogen was determined via a LEGO
combustion analyzer. Grain N uptake was calculated by multiplying the grain N content by the
corresponding grain yield (minus 10 % moisture).
Soil sampling and analysis.
Preapplication soil samples (0-90 cm) were collected immediately prior to biosolids application.
Surface (0-30 cm) samples were analyzed for pH, Olsen (bicarbonate) P, and exchangeable K;
nitrate-N was determined for the 0-90 cm depth (Table 3).
Postharvest samples for determination of nitrate-N, ammonium-N and sulfate-S were collected
during the late summer or early fall following crop harvest, prior to significant precipitation.
Soil samples were collected in 30 cm depth increments to a depth of 90 cm (Locations 1,2, and
5) or 120 cm (Locations 3,4, and 6), using a hydraulic auger (Kauffman sampler; Albany, OR)
mounted on a small tractor. Approximately 10 to 15 cores (0-30 cm depth) and 3 to 6 cores (30-
60, 60-90, and 90-120 cm depths) were collected from each plot. For conversion of soil
concentrations to kg per hectare, we assumed a soil bulk density of 1.3 g/cm3 at all locations.
Soil nitrate was determined via a colorimetric method or a cadmium reduction method. Soil
reference samples run with each batch of unknown samples showed both nitrate analysis
2-4
image:
 methods to be accurate and precise. Soil sulfate-S was determined via a turbidimetric method.
Surface (0-30 cm) samples were analyzed for ammonium-N via a colorimetric method.
Postharvest soil samples (0-10 cm) were analyzed for Olsen (bicarbonate) P and DTP A Zn.
Twenty to 30 cores were composited per plot.
Above-ground biomass and grain yield components were determined at locations 4 and 5 on
2 m of row per plot. At harvest, we counted the number of spikes per m of row and weighed
intact plants. Gram yield was determined by running the harvest bundles through a Hegi
combine.
Statistical analyses were performed using the SAS system (SAS Institute, Gary, N.C.). We did
not have the same number of biosolids treatments at each location, and biosolids analyses varied
between locations. To compare similar biosolids N rates across locations we grouped application
rates of 200 to 400 kg N/ha and called this treatment "300 kg N/ha" and grouped higher rates of
application 500 to 700 kg N/ha and called this treatment "600 kg N/ha". We used these
treatment groups, 300 and 600 kg N/ha as biosolids, for orthogonal contrasts across locations.
The combined data set (all locations) was analyzed as a split-plot design with locations as main
plots and fertilizer treatments as subplots. Statistical analyses within a location were performed
using analysis of variance procedures for a randomized complete block design.
Results and Discussion
Comparisons across locations (Table 4).
Statistical analysis using locations as main plots, and fertilizer treatments as subplots showed
highly significant (P < 0.01) effects of fertilizer application on grain yield, test weight, grain N,
grain N uptake and postharvest soil nitrate-N. The fertilizer treatment * location interaction was
also highly significant (P < 0.01) for all parameters (Table 4), indicating that the magnitude of
fertilizer treatment effects varied between locations.
The mean squares generated by the analysis of variance (Table 4) show the relative importance
of sources of variation. Location had a larger effect on yield and N uptake than did fertilizer
treatment, showing the unpredictable nature of yield where precipitation is the major limiting
factor. Fertilizer treatments had a stronger effect than location on grain N, postharvest soil
nitrate-N, and grain test weight. The consistency of these measurements across locations shows
that biosolids was a dependable nutrient source. The lower test weight across locations was due
to increased vegetative growth and increased plant water stress during the grain fill period.
Averaged over locations, biosolids at 300 kg N/ha and inorganic N fertilizer at 55 kg N/ha had
the same yield and postharvest nitrate-N. Biosolids at 300 kg N/ha significantly (P < 0.05)
reduced test weight and increased grain N compared to inorganic N fertilization. Increasing the
biosolids application rate from 300 to 600 kg N/ha significantly reduced grain yield, test weight,
and increased grain N and postharvest nitrate-N.
2-5
image:
methods to be accurate and precise. Soil sulfate-S was determined via a turbidimetric method.
Surface (0-30 cm) samples were analyzed for ammonium-N via a colorimetric method.
Postharvest soil samples (0-10 cm) were analyzed for Olsen (bicarbonate) P and DTP A Zn.
Twenty to 30 cores were composited per plot.
Above-ground biomass and grain yield components were determined at locations 4 and 5 on
2 m of row per plot. At harvest, we counted the number of spikes per m of row and weighed
intact plants. Gram yield was determined by running the harvest bundles through a Hegi
combine.
Statistical analyses were performed using the SAS system (SAS Institute, Gary, N.C.). We did
not have the same number of biosolids treatments at each location, and biosolids analyses varied
between locations. To compare similar biosolids N rates across locations we grouped application
rates of 200 to 400 kg N/ha and called this treatment "300 kg N/ha" and grouped higher rates of
application 500 to 700 kg N/ha and called this treatment "600 kg N/ha". We used these
treatment groups, 300 and 600 kg N/ha as biosolids, for orthogonal contrasts across locations.
The combined data set (all locations) was analyzed as a split-plot design with locations as main
plots and fertilizer treatments as subplots. Statistical analyses within a location were performed
using analysis of variance procedures for a randomized complete block design.
Results and Discussion
Comparisons across locations (Table 4).
Statistical analysis using locations as main plots, and fertilizer treatments as subplots showed
highly significant (P < 0.01) effects of fertilizer application on grain yield, test weight, grain N,
grain N uptake and postharvest soil nitrate-N. The fertilizer treatment * location interaction was
also highly significant (P < 0.01) for all parameters (Table 4), indicating that the magnitude of
fertilizer treatment effects varied between locations.
The mean squares generated by the analysis of variance (Table 4) show the relative importance
of sources of variation. Location had a larger effect on yield and N uptake than did fertilizer
treatment, showing the unpredictable nature of yield where precipitation is the major limiting
factor. Fertilizer treatments had a stronger effect than location on grain N, postharvest soil
nitrate-N, and grain test weight. The consistency of these measurements across locations shows
that biosolids was a dependable nutrient source. The lower test weight across locations was due
to increased vegetative growth and increased plant water stress during the grain fill period.
Averaged over locations, biosolids at 300 kg N/ha and inorganic N fertilizer at 55 kg N/ha had
the same yield and postharvest nitrate-N. Biosolids at 300 kg N/ha significantly (P < 0.05)
reduced test weight and increased grain N compared to inorganic N fertilization. Increasing the
biosolids application rate from 300 to 600 kg N/ha significantly reduced grain yield, test weight,
and increased grain N and postharvest nitrate-N.
2-5
image:
 Table 4. Biosolids effects on grain yield, grain quality, and postharvest soil nitrate-N.
Averages, significance, and analysis of variance across all locations
Fertilizer
Source
None
Anhydrous/aqua ammonia
Biosolids
Biosolids
Source of variation
Locations
Fertilizer Treatments
Fertilizer Tit * Location
Coefficient of variation (%)
LSD (5 %)
Source of Variation
Blocks
Locations
Main plot error
Fertilizer Treatments
Fertilizer Trt. * Location
Subplot Error
Total N applied
per hectare
kg/ha
0
55
300
600
df
4
3
12
df
4
4
3
3
12
47
Grain
Yield
Mg/ha
3.56
3.90
4.09
3.53
Grain
TestWt.
kg/m3
766
770
761
747
Grain
N
g/kg
15.8
17.9
20.5
22.9
Grain
N Uptake
kg/ha
52.5
' 64.2
77.6
72.0
Postharvest
Soil
Nitrate-N
kg/ha
38.5
51.6
64.9
143.1
P>F
**
**
**
10.78
0.25
**
**
**
1.4
6.70
**
**
**
8.96
1.08
**
**
**
14.08
5.85
**
**
**
40.88
19.63
Analysis of Variance
Mean Squares
0.5
14.9
0.4
1.4
0.8
0.2
222
1940
153
2006
881
114
4
59
6
198
16
3
98
8510
108
2387
545
88
1628
10510
1489
44485
2954
936
Note: Location 4 deleted from averages and ANOVA because it lacked a 300 kg N/ha biosolids treatment
** Significant at the 1 % probability level
image:
Table 4. Biosolids effects on grain yield, grain quality, and postharvest soil nitrate-N.
Averages, significance, and analysis of variance across all locations
Fertilizer
Source
None
Anhydrous/aqua ammonia
Biosolids
Biosolids
Source of variation
Locations
Fertilizer Treatments
Fertilizer Tit * Location
Coefficient of variation (%)
LSD (5 %)
Source of Variation
Blocks
Locations
Main plot error
Fertilizer Treatments
Fertilizer Trt. * Location
Subplot Error
Total N applied
per hectare
kg/ha
0
55
300
600
df
4
3
12
df
4
4
3
3
12
47
Grain
Yield
Mg/ha
3.56
3.90
4.09
3.53
Grain
TestWt.
kg/m3
766
770
761
747
Grain
N
g/kg
15.8
17.9
20.5
22.9
Grain
N Uptake
kg/ha
52.5
' 64.2
77.6
72.0
Postharvest
Soil
Nitrate-N
kg/ha
38.5
51.6
64.9
143.1
P>F
**
**
**
10.78
0.25
**
**
**
1.4
6.70
**
**
**
8.96
1.08
**
**
**
14.08
5.85
**
**
**
40.88
19.63
Analysis of Variance
Mean Squares
0.5
14.9
0.4
1.4
0.8
0.2
222
1940
153
2006
881
114
4
59
6
198
16
3
98
8510
108
2387
545
88
1628
10510
1489
44485
2954
936
Note: Location 4 deleted from averages and ANOVA because it lacked a 300 kg N/ha biosolids treatment
** Significant at the 1 % probability level
image:
 Table 5. Statistical significance of grain and soil N measurements.
Locations 1-6.
Contrast
Zero N vs. biosolids (300 kg N/ha)
Anhdrous/aqua ammonia vs. biosolids (300 kg N/ha)
Biosolids (300 kg N/ha) vs. biosolids (600 kg N/ha)
Coefficient of variation (%)
Standard error of the mean
Zero N vs. biosolids (300 kg N/ha)
Anhydrous/aqua ammonia vs. biosolids (300 kg N/ha
Biosolids (300 kg N/ha) vs. biosolids (600 kg N/ha)
Coefficient of variation (%)
Standard error of the mean
Zero N vs. biosolids (300 kg N/ha)
Anhydrous/aqua ammonia vs. biosolids (300 kg N/ha
Biosolids (300 kg N/ha) vs. biosolids (600 kg N/ha)
Coefficient of variation (%)
Standard error of the mean
Zero N vs. biosolids (300 kg N/ha)
Anhydrous/aqua ammonia vs. biosolids (300 kg N/ha
Biosolids (300 kg N/ha) vs. biosolids (600 kg N/ha)
Coefficient of variation {%)
Standard error of the mean
Zero N vs. biosolids (300 kg N/ha)
Anhydrous/aqua ammonia vs. biosolids (300 kg N/ha
Biosolids (300 kg N/ha) vs. biosolids (600 kg N/ha)
Coefficient of variation (%)
Standard error of the mean
Field Location
12345
Yield, Mg/ha
** NS + ** **
NS NS NS NS NS
NS ** ** M NS
8.6 8.2 14.5 9.3 7.2
0.23 0.37 0.73 0.30 0.25
Grain test weight, kg/m3
+ NS +
NS NS ** ** NS
NS M
1.4 1.4 2.3 1.2 0.4
10.9 10.5 17.3 9.3 2.9
Grain N, g/kg
** .j. ** ** **
** NS ** ** **
NS M
7.2 9.5 10.9 7.1 3.9
1.33 1.89 2.43 1.34 0.69
Grain N Uptake, kg/ha
** NS ** ** **
** NS ** * **
+ M NS
10.3 11.6 16.5 13.4 8.2
4.68 9.45 16.40 7.73 4.57
6
NS
NS
*
7.9
0.27
*
NS
NS
0.6
4.9
NS
NS
NS
10.2
1.82
NS
NS
+
13.0
7.23
Postharvest soil nitrate-N, kg/ha
NS NS NS * NS
NS NS NS ** * NS
** ** * M ** **
24.7 30.9 71.4 11.1 38.9 23.7
12.2 20.8 50.1 4.9 33.7 20.9
M = missing data makes this contrast impossible
Note: For Location 4 contrasts, zero N or aqua/anhydrous ammonia treatments compared with biosolids at
rate of 600 kg N/ha.
+,*,** Significant at the 10, 5, and 1 % probability levels, respectively
image:
Table 5. Statistical significance of grain and soil N measurements.
Locations 1-6.
Contrast
Zero N vs. biosolids (300 kg N/ha)
Anhdrous/aqua ammonia vs. biosolids (300 kg N/ha)
Biosolids (300 kg N/ha) vs. biosolids (600 kg N/ha)
Coefficient of variation (%)
Standard error of the mean
Zero N vs. biosolids (300 kg N/ha)
Anhydrous/aqua ammonia vs. biosolids (300 kg N/ha
Biosolids (300 kg N/ha) vs. biosolids (600 kg N/ha)
Coefficient of variation (%)
Standard error of the mean
Zero N vs. biosolids (300 kg N/ha)
Anhydrous/aqua ammonia vs. biosolids (300 kg N/ha
Biosolids (300 kg N/ha) vs. biosolids (600 kg N/ha)
Coefficient of variation (%)
Standard error of the mean
Zero N vs. biosolids (300 kg N/ha)
Anhydrous/aqua ammonia vs. biosolids (300 kg N/ha
Biosolids (300 kg N/ha) vs. biosolids (600 kg N/ha)
Coefficient of variation {%)
Standard error of the mean
Zero N vs. biosolids (300 kg N/ha)
Anhydrous/aqua ammonia vs. biosolids (300 kg N/ha
Biosolids (300 kg N/ha) vs. biosolids (600 kg N/ha)
Coefficient of variation (%)
Standard error of the mean
Field Location
12345
Yield, Mg/ha
** NS + ** **
NS NS NS NS NS
NS ** ** M NS
8.6 8.2 14.5 9.3 7.2
0.23 0.37 0.73 0.30 0.25
Grain test weight, kg/m3
+ NS +
NS NS ** ** NS
NS M
1.4 1.4 2.3 1.2 0.4
10.9 10.5 17.3 9.3 2.9
Grain N, g/kg
** .j. ** ** **
** NS ** ** **
NS M
7.2 9.5 10.9 7.1 3.9
1.33 1.89 2.43 1.34 0.69
Grain N Uptake, kg/ha
** NS ** ** **
** NS ** * **
+ M NS
10.3 11.6 16.5 13.4 8.2
4.68 9.45 16.40 7.73 4.57
6
NS
NS
*
7.9
0.27
*
NS
NS
0.6
4.9
NS
NS
NS
10.2
1.82
NS
NS
+
13.0
7.23
Postharvest soil nitrate-N, kg/ha
NS NS NS * NS
NS NS NS ** * NS
** ** * M ** **
24.7 30.9 71.4 11.1 38.9 23.7
12.2 20.8 50.1 4.9 33.7 20.9
M = missing data makes this contrast impossible
Note: For Location 4 contrasts, zero N or aqua/anhydrous ammonia treatments compared with biosolids at
rate of 600 kg N/ha.
+,*,** Significant at the 10, 5, and 1 % probability levels, respectively
image:
 5
4
3
2
5
4
3
2
5
05 4
~0) 3
S 2
<D
'>,
C
2
CD
5
4
3
2
5
4
3
2
5
4
3
2
Location 1
llll
lH*
x
Location 2
Location 3
Location 4
Location 5
Location 6
ill
775
750
725
£ 775
1*750
£725
O)
lm
(D
•£ 750 -
'2 725
CD
775
750
725
775
750
725
r 1 i • i' i
0 200 400 600
Fertilizer source:
Location 1
<
/j*
/x
Location 2
Location 3
I
Location 4
I
Location 5
Location 6
25
20
15
25
20
15
25
D)
=* 20
O)
c 15
0
D)
g
•"I 25 -I
.£ 20
5
CD 15 -
25
20
15
25 -
20 -
15 -
Location 1
a
0 200 400 600
2 None IXyVI Inorganic N|
Location 2
Location 3
Location 4
Location 5
I
Location 6
ill
1 I I
0 200 400 600
Biosolids
Total nitrogen applied, kg/ha
Figure 1. Biosolids and inorganic N fertilizer effects on grain yield, grain test weight and
grain nitrogen. Horizontal dotted lines equal values for zero fertilizer treatment.
image:
5
4
3
2
5
4
3
2
5
05 4
~0) 3
S 2
<D
'>,
C
2
CD
5
4
3
2
5
4
3
2
5
4
3
2
Location 1
llll
lH*
x
Location 2
Location 3
Location 4
Location 5
Location 6
ill
775
750
725
£ 775
1*750
£725
O)
lm
(D
•£ 750 -
'2 725
CD
775
750
725
775
750
725
r 1 i • i' i
0 200 400 600
Fertilizer source:
Location 1
<
/j*
/x
Location 2
Location 3
I
Location 4
I
Location 5
Location 6
25
20
15
25
20
15
25
D)
=* 20
O)
c 15
0
D)
g
•"I 25 -I
.£ 20
5
CD 15 -
25
20
15
25 -
20 -
15 -
Location 1
a
0 200 400 600
2 None IXyVI Inorganic N|
Location 2
Location 3
Location 4
Location 5
I
Location 6
ill
1 I I
0 200 400 600
Biosolids
Total nitrogen applied, kg/ha
Figure 1. Biosolids and inorganic N fertilizer effects on grain yield, grain test weight and
grain nitrogen. Horizontal dotted lines equal values for zero fertilizer treatment.
image:
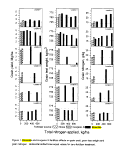 150
100
50
CO
.c
D) 150
z" 100
i 50
CO
-^
'c
CD
CO
o
Q.
Location 1
90 cm depth
ocation 2
iO cm depth
Location^}
120 cm depth
Location 4
120 cm depth
200 400 600
Fertilizer source:
None
0 200
Inorganic N •
400 600
Biosolids
Total nitrogen applied, kg/ha
Figure 2. Biosolids and inorganic N fertilizer effects on grain nitrogen uptake and post
harvest soil nitrate-N. Horizontal dotted lines equal values for zero fertilizer treatment.
image:
150
100
50
CO
.c
D) 150
z" 100
i 50
CO
-^
'c
CD
CO
o
Q.
Location 1
90 cm depth
ocation 2
iO cm depth
Location^}
120 cm depth
Location 4
120 cm depth
200 400 600
Fertilizer source:
None
0 200
Inorganic N •
400 600
Biosolids
Total nitrogen applied, kg/ha
Figure 2. Biosolids and inorganic N fertilizer effects on grain nitrogen uptake and post
harvest soil nitrate-N. Horizontal dotted lines equal values for zero fertilizer treatment.
image:
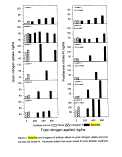 Comparisons by location (Fig 1 and 2; Table 5).
Grain yield. Preapplication nitrate-N analyses (90 cm depth) showed that all sites except
location 6 should respond to N fertilization (Table 3). Other nutrients tested were present at
adequate levels. Soil P (0 - 30 cm) was well above (locations 1 and 5) or slightly above
(locations 3,4, and 6) the recommended minimum soil P level for maximum yield of dryland
winter wheat (10 mg/kg Olsen P). Exchangeable K was well above recommended minimum
(100 mg/kg). Surface soil pH values ranged from 6.3 to 6.7 (near neutral).
Fertilization significantly increased grain yield at 4 of the 6 locations (Table 5; Fig. 1). Yield
responses were largely due to the N supplied by biosolids. The locations that did not respond
to fertilization had high preapplication soil nitrate-N analyses (Table 3). The WSU fertilizer
guide for dryland wheat correctly predicted non-responsive sites; it recommended application
of reduced N rates (location 2; 28 kg N/ha) or no N (location 6). Locations that did respond to
fertilization (locations 1,3,4, and 5) had estimated fertilizer N requirements of 52 to 73 kg N/ha
for a target yield of 4 Mg/ha (60 bushels per acre).
Using the current WSU guidelines for biosolids application, suggested biosolids application rates
for the responsive sites were 3.9 to 6.5 Mg/ha (Table 2). This is below the minimum application
rate for most manure spreaders currently used to apply biosolids, and below the biosolids
application rates used at our sites (except location 1 and 2). Actual yield responses (Fig. 1) show
that low (<300 kg N/ha) rates of biosolids were needed for maximum yield at all locations except
location 6. The cause of the significant yield increase at the highest rate of biosolids application
at location 6 is unknown. Preapplication and postharvest soil tests at location 6 showed high
nitrate levels, so the yield response was probably not due to nitrogen.
The yield data demonstrated that higher rates of N application were not needed in years with
above average yield potential. Locations 1 and 2 (same field, different harvest years) both
produced near-optimum yields with 300 kg N/ha biosolids applied, although maximum yields
were 3.0 Mg/ha for Location 1 and 5.0 Mg/ha for Location 2. Locations 3 and 4 (adjacent fields,
different harvest year) had similar increases in yield due to fertilization (approximately 1.2 Mg
yield increase over the zero N treatment), although maximum yields were 5.8 Mg/ha for
Location 3 and 3.8 Mg/ha for Location 4.
The largest yield reductions at high biosolids application rates occurred when wheat plants
lodged (fell over). We observed some lodging at the 300 kg N/ha rate and severe lodging at the
600 kg N/ha rate at locations 2 and 3. Some lodging was also observed at Location 4 with the
600 kg N/ha rate. Locations 2, 3, and 4 had the same wheat variety, Eltan, which has only
moderate straw strength. Locations 5 and 6 had the potential for lodging (high N supply and
above average precipitation), but had wheat varieties with greater straw strength. Location 1 had
a variety even more susceptible to lodging than Eltan, but low precipitation during the crop year
limited excessive growth.
2-10
image:
Comparisons by location (Fig 1 and 2; Table 5).
Grain yield. Preapplication nitrate-N analyses (90 cm depth) showed that all sites except
location 6 should respond to N fertilization (Table 3). Other nutrients tested were present at
adequate levels. Soil P (0 - 30 cm) was well above (locations 1 and 5) or slightly above
(locations 3,4, and 6) the recommended minimum soil P level for maximum yield of dryland
winter wheat (10 mg/kg Olsen P). Exchangeable K was well above recommended minimum
(100 mg/kg). Surface soil pH values ranged from 6.3 to 6.7 (near neutral).
Fertilization significantly increased grain yield at 4 of the 6 locations (Table 5; Fig. 1). Yield
responses were largely due to the N supplied by biosolids. The locations that did not respond
to fertilization had high preapplication soil nitrate-N analyses (Table 3). The WSU fertilizer
guide for dryland wheat correctly predicted non-responsive sites; it recommended application
of reduced N rates (location 2; 28 kg N/ha) or no N (location 6). Locations that did respond to
fertilization (locations 1,3,4, and 5) had estimated fertilizer N requirements of 52 to 73 kg N/ha
for a target yield of 4 Mg/ha (60 bushels per acre).
Using the current WSU guidelines for biosolids application, suggested biosolids application rates
for the responsive sites were 3.9 to 6.5 Mg/ha (Table 2). This is below the minimum application
rate for most manure spreaders currently used to apply biosolids, and below the biosolids
application rates used at our sites (except location 1 and 2). Actual yield responses (Fig. 1) show
that low (<300 kg N/ha) rates of biosolids were needed for maximum yield at all locations except
location 6. The cause of the significant yield increase at the highest rate of biosolids application
at location 6 is unknown. Preapplication and postharvest soil tests at location 6 showed high
nitrate levels, so the yield response was probably not due to nitrogen.
The yield data demonstrated that higher rates of N application were not needed in years with
above average yield potential. Locations 1 and 2 (same field, different harvest years) both
produced near-optimum yields with 300 kg N/ha biosolids applied, although maximum yields
were 3.0 Mg/ha for Location 1 and 5.0 Mg/ha for Location 2. Locations 3 and 4 (adjacent fields,
different harvest year) had similar increases in yield due to fertilization (approximately 1.2 Mg
yield increase over the zero N treatment), although maximum yields were 5.8 Mg/ha for
Location 3 and 3.8 Mg/ha for Location 4.
The largest yield reductions at high biosolids application rates occurred when wheat plants
lodged (fell over). We observed some lodging at the 300 kg N/ha rate and severe lodging at the
600 kg N/ha rate at locations 2 and 3. Some lodging was also observed at Location 4 with the
600 kg N/ha rate. Locations 2, 3, and 4 had the same wheat variety, Eltan, which has only
moderate straw strength. Locations 5 and 6 had the potential for lodging (high N supply and
above average precipitation), but had wheat varieties with greater straw strength. Location 1 had
a variety even more susceptible to lodging than Eltan, but low precipitation during the crop year
limited excessive growth.
2-10
image:
 Test weight (Fig.l; Table 5). Test weight is a measure of grain plumpness. Decreases in test
weight are usually associated with plant water stress during the grain fill period. Lodging and
excessive vegetative growth increase plant water stress. Large reductions in grain test weight
were associated with lodging at high biosolids application rates (Locations 2, 3, and 4). Where
lodging did not occur (Locations 1, 5 and 6), even high rates of biosolids produced grain with
acceptable test weight. Low rates of biosolids increased test weight at locations 1 and 5,
probably because of improved root development and extraction of soil water.
Grain N (Fig. 1; Table 5). High grain N is undesirable hi soft white winter wheat. High protein
grain is less suitable for production of cakes, crackers, cookies and other confectionery items.
Some export markets specify soft white wheat less with less than 18 g/kg N. Currently, there
are no premiums paid to growers for low protein wheat, so high protein does not negatively
affect the grower. Grain N increased with biosolids application rate at all locations except
location 6. Excluding location 6, low N grain (<18 g N/kg) was produced only at biosolids
application rates of less than 200 kg N/ha (Locations 1 and 2). Grain N levels continued to
increase at locations 1,2, and 5 at biosolids rates above that needed for maximum yield.
Grain N uptake (Fig. 2; Table 5). This measurement shows how much N is removed from the
field at grain harvest. Because of lodging, grain N uptake was actually reduced at locations 2
and 3 as the biosolids rate increased from 300 to 600 kg N/ha. Grain N uptake with biosolids
at 300 kg N/ha was higher than with inorganic N fertilization at locations 1, 3, and 5
demonstrating that biosolids supplied a greater quantity of N than the inorganic N fertilizer.
Postharvest nitrate-N (Fig. 2; Table 5) was similar for biosolids at 300 kg N/ha and inorganic
N fertilizer at all locations except location 5. Postharvest nitrate-N increased significantly when
the biosolids rate was increased from 300 to 600 kg N/ha at all locations. This was expected,
since yield was maximized at biosolids application rates of 300 kg N/ha.
Biomass and Yield Components (Tables 6 and 7). Locations 4 and 5 showed changes in
biomass production and yield components due to biosolids fertilization. The yield response to
biosolids at Location 4 was largely due to increased tillering (more spikes per unit area). At
Location 5, the biggest factor in the yield response was a greater number of kernels per spike.
At both locations, yield increases from more spikes and/or larger spikes were offset by a lower
grain kernel weight. Some of the light kernels produced with biosolids may have been blown
out the back of the combine when the large plots were harvested. We got this idea by comparing
the hand harvest yields with the combine yields. For the biosolids treatments, the grain yield
determined by hand harvesting (Tables 5 and 6) was about 1 Mg/ha higher than for combine
harvest (Fig. 1). For the zero N treatment, hand harvest and combine harvest gave similar yield
estimates.
The differences in yield response pattern between Location 4 and 5 were probably strongly
influenced by wheat variety. The Eltan variety used at Location 4 responded to increased
biosolids application rates by producing large quantities of tillers and straw. In contrast, the Tres
variety at location 5 did not increase tiller production above that produced with inorganic N
fertilization, even with 900 kg N/ha applied as biosolids. Increased straw production is desirable
2-11
image:
Test weight (Fig.l; Table 5). Test weight is a measure of grain plumpness. Decreases in test
weight are usually associated with plant water stress during the grain fill period. Lodging and
excessive vegetative growth increase plant water stress. Large reductions in grain test weight
were associated with lodging at high biosolids application rates (Locations 2, 3, and 4). Where
lodging did not occur (Locations 1, 5 and 6), even high rates of biosolids produced grain with
acceptable test weight. Low rates of biosolids increased test weight at locations 1 and 5,
probably because of improved root development and extraction of soil water.
Grain N (Fig. 1; Table 5). High grain N is undesirable hi soft white winter wheat. High protein
grain is less suitable for production of cakes, crackers, cookies and other confectionery items.
Some export markets specify soft white wheat less with less than 18 g/kg N. Currently, there
are no premiums paid to growers for low protein wheat, so high protein does not negatively
affect the grower. Grain N increased with biosolids application rate at all locations except
location 6. Excluding location 6, low N grain (<18 g N/kg) was produced only at biosolids
application rates of less than 200 kg N/ha (Locations 1 and 2). Grain N levels continued to
increase at locations 1,2, and 5 at biosolids rates above that needed for maximum yield.
Grain N uptake (Fig. 2; Table 5). This measurement shows how much N is removed from the
field at grain harvest. Because of lodging, grain N uptake was actually reduced at locations 2
and 3 as the biosolids rate increased from 300 to 600 kg N/ha. Grain N uptake with biosolids
at 300 kg N/ha was higher than with inorganic N fertilization at locations 1, 3, and 5
demonstrating that biosolids supplied a greater quantity of N than the inorganic N fertilizer.
Postharvest nitrate-N (Fig. 2; Table 5) was similar for biosolids at 300 kg N/ha and inorganic
N fertilizer at all locations except location 5. Postharvest nitrate-N increased significantly when
the biosolids rate was increased from 300 to 600 kg N/ha at all locations. This was expected,
since yield was maximized at biosolids application rates of 300 kg N/ha.
Biomass and Yield Components (Tables 6 and 7). Locations 4 and 5 showed changes in
biomass production and yield components due to biosolids fertilization. The yield response to
biosolids at Location 4 was largely due to increased tillering (more spikes per unit area). At
Location 5, the biggest factor in the yield response was a greater number of kernels per spike.
At both locations, yield increases from more spikes and/or larger spikes were offset by a lower
grain kernel weight. Some of the light kernels produced with biosolids may have been blown
out the back of the combine when the large plots were harvested. We got this idea by comparing
the hand harvest yields with the combine yields. For the biosolids treatments, the grain yield
determined by hand harvesting (Tables 5 and 6) was about 1 Mg/ha higher than for combine
harvest (Fig. 1). For the zero N treatment, hand harvest and combine harvest gave similar yield
estimates.
The differences in yield response pattern between Location 4 and 5 were probably strongly
influenced by wheat variety. The Eltan variety used at Location 4 responded to increased
biosolids application rates by producing large quantities of tillers and straw. In contrast, the Tres
variety at location 5 did not increase tiller production above that produced with inorganic N
fertilization, even with 900 kg N/ha applied as biosolids. Increased straw production is desirable
2-11
image:
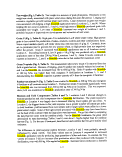 Table 6. Biosolids effects on biomass yields and grain yield components (Location 4).
Fertilizer
Source
None
Anhydrous/aqua ammonia
Biosolids
Biosolids
Total N
Applied
kg/ha
0
56
486
971
Dry Matter Yield
Total
Mg/ha
6.9
11.4
16.3
12.9
Grain
Mg/ha
2.4
3.9
5.3
3.9
Straw
Mg/ha
4.5
7.5
11.0
9.0
Yield Components
Kernels
per spike
25.0
29.0
30.5
34.0
Spikes
perm2
288
394
565
423
Thousand
Kernel
Weight
g
33.3
34.7
30.1
27.0
Contrasts:
Zero N vs. anhydrous/aqua ammonia
Zero N vs. biosolids
Anhydrous/aqua ammonia vs. biosolids
Coefficient of variation (%)
Standard error of the mean
NS
*
NS
28.9
1.12
NS
22.3
2.65
22.0
1.76
NS
8.5
2.52
NS
**
NS
18.1
75.65
+,*,** Significant at the 10, 5, and 1 % probability levels, respectively
Table 7. Biosolids effects on biomass yields and grain yield components (Location 5).
NS
9.8
3.07
Fertilizer
Source
None
Anhydrous/aqua ammonia
Biosolids
Biosolids
Biosolids
Total N
Applied
kg/ha
0
56
289
578
867
Dry Matter Yield
Total
Mg/ha
7.3
9.1
10.2
10.0
10.6
Grain
Mg/ha
3.2
3.9
4.3
4.4
4.5
Straw
Mg/ha
4.2
5.2
6.0
5.6
6.1
Yield Components
Kernels
per spike
41.8
43.6
53.3
57.1
54.7
Spikes
perm2
218
258
268
257
288
Thousand
Kernel
Weight
g
35.0
34.7
30.2
30.1
28.8
Zero N vs. anhydrous/aqua ammonia
Zero N vs. biosolids
Anhydrous/aqua ammonia vs. biosolids
Coefficient of variation (%)
Standard error of the mean
+,*,** Significant at the 10, 5, and 1 % probability levels, respectively
Contrasts:
NS
**
NS
13.6
0.55
NS
**
NS
14.8
1.40
NS
**
NS
16.0
0.87
NS
**
**
7.4
3.72
+
**
NS
10.4
26.80
NS
**
4.2
1.33
image:
Table 6. Biosolids effects on biomass yields and grain yield components (Location 4).
Fertilizer
Source
None
Anhydrous/aqua ammonia
Biosolids
Biosolids
Total N
Applied
kg/ha
0
56
486
971
Dry Matter Yield
Total
Mg/ha
6.9
11.4
16.3
12.9
Grain
Mg/ha
2.4
3.9
5.3
3.9
Straw
Mg/ha
4.5
7.5
11.0
9.0
Yield Components
Kernels
per spike
25.0
29.0
30.5
34.0
Spikes
perm2
288
394
565
423
Thousand
Kernel
Weight
g
33.3
34.7
30.1
27.0
Contrasts:
Zero N vs. anhydrous/aqua ammonia
Zero N vs. biosolids
Anhydrous/aqua ammonia vs. biosolids
Coefficient of variation (%)
Standard error of the mean
NS
*
NS
28.9
1.12
NS
22.3
2.65
22.0
1.76
NS
8.5
2.52
NS
**
NS
18.1
75.65
+,*,** Significant at the 10, 5, and 1 % probability levels, respectively
Table 7. Biosolids effects on biomass yields and grain yield components (Location 5).
NS
9.8
3.07
Fertilizer
Source
None
Anhydrous/aqua ammonia
Biosolids
Biosolids
Biosolids
Total N
Applied
kg/ha
0
56
289
578
867
Dry Matter Yield
Total
Mg/ha
7.3
9.1
10.2
10.0
10.6
Grain
Mg/ha
3.2
3.9
4.3
4.4
4.5
Straw
Mg/ha
4.2
5.2
6.0
5.6
6.1
Yield Components
Kernels
per spike
41.8
43.6
53.3
57.1
54.7
Spikes
perm2
218
258
268
257
288
Thousand
Kernel
Weight
g
35.0
34.7
30.2
30.1
28.8
Zero N vs. anhydrous/aqua ammonia
Zero N vs. biosolids
Anhydrous/aqua ammonia vs. biosolids
Coefficient of variation (%)
Standard error of the mean
+,*,** Significant at the 10, 5, and 1 % probability levels, respectively
Contrasts:
NS
**
NS
13.6
0.55
NS
**
NS
14.8
1.40
NS
**
NS
16.0
0.87
NS
**
**
7.4
3.72
+
**
NS
10.4
26.80
NS
**
4.2
1.33
image:
 in terms of soil conservation and the opportunity for a straw harvest. It is a negative when it
reduces grain yield by increasing plant water stress. Choosing the right variety is an important
component of a program to beneficially use biosolids in dryland cropping systems.
Extractable soil nutrients (S, Zn, and P; Fig. 3 and Table 8).
Sulfate-S was significantly increased (P < 0.10) by biosolids fertilization at all locations. The
increase in extractable sulfate-S with biosolids was equal to 3.1,4.9, and 3.8 g S/kg biosolids at
locations 3,4, and 5, respectively. Based on this estimate of sulfate-S per unit of biosolids, the
increase in soil sulfate-S after application of biosolids. at 300 kg-N/ha should be about 27 kg
S/ha. Sulfur uptake by wheat grain is usually less than 10 % of the N uptake. Since grain N
uptake at a high yielding dryland site is about 100 kg N/ha (Fig. 2), we would expect S removal
to be less than 10 kg/ha. Therefore, the sulfate-S generated by application of biosolids at a rate
of 300 kg N/ha should be enough to satisfy crop requirements for 2 or 3 cropping cycles,
provided leaching losses are not significant.
Olsen (bicarbonate) P was significantly increased (P < 0.01) by biosolids fertilization at all
locations. The depth sampled (10 cm) probably does not fully represent the depth of biosolids
incorporation; additional P from biosolids application is probably present below 10 cm. Across
locations, application of biosolids at a rate of 300 kg N/ha (175 kg P/ha) increased bicarbonate
P from 20 mg/kg to 33 mg/kg. The additional P removed with biosolids fertilization at 300 kg
N/ha was about 2 kg P/ha at locations 4 and 5 (data not shown). The P supplied by biosolids
should be enough to satisfy crop requirements for many (10 + ?) crops.
Zinc (DTPA extraction) was significantly increased (P < 0.01) by biosolids fertilization at all
locations. Even at high biosolids rates, extractable Zn levels in our study are far below levels
toxic to plants. The increase in plant-available Zn probably does not represent a major soil
fertility benefit. Wheat is very tolerant of low soil Zn availability, and yield response to applied
Zn on wheat has not been demonstrated in our area. Application of high rates of P fertilizer
sometimes result in a crop Zn deficiency. Phosphorus induced Zn deficiency appears highly
unlikely with biosolids application, since both nutrients are applied simultaneously
Summary and Conclusions
Anaerobically-digested, dewatered biosolids are a dependable nutrient source for dryland
cropping systems. Adequate N for maximum yield was present at all locations with a biosolids
application rate of 300 kg total N/ha. A single application of biosolids supplied enough P, S, Zn
for two or more crops. In addition to the benefits reported here, growers also observe significant
benefits in reducing wind erosion from biosolids application. Long-term research (6 to 10 years
after a single application) is needed to measure the residual effects of biosolids on site
productivity.
2-13
image:
in terms of soil conservation and the opportunity for a straw harvest. It is a negative when it
reduces grain yield by increasing plant water stress. Choosing the right variety is an important
component of a program to beneficially use biosolids in dryland cropping systems.
Extractable soil nutrients (S, Zn, and P; Fig. 3 and Table 8).
Sulfate-S was significantly increased (P < 0.10) by biosolids fertilization at all locations. The
increase in extractable sulfate-S with biosolids was equal to 3.1,4.9, and 3.8 g S/kg biosolids at
locations 3,4, and 5, respectively. Based on this estimate of sulfate-S per unit of biosolids, the
increase in soil sulfate-S after application of biosolids. at 300 kg-N/ha should be about 27 kg
S/ha. Sulfur uptake by wheat grain is usually less than 10 % of the N uptake. Since grain N
uptake at a high yielding dryland site is about 100 kg N/ha (Fig. 2), we would expect S removal
to be less than 10 kg/ha. Therefore, the sulfate-S generated by application of biosolids at a rate
of 300 kg N/ha should be enough to satisfy crop requirements for 2 or 3 cropping cycles,
provided leaching losses are not significant.
Olsen (bicarbonate) P was significantly increased (P < 0.01) by biosolids fertilization at all
locations. The depth sampled (10 cm) probably does not fully represent the depth of biosolids
incorporation; additional P from biosolids application is probably present below 10 cm. Across
locations, application of biosolids at a rate of 300 kg N/ha (175 kg P/ha) increased bicarbonate
P from 20 mg/kg to 33 mg/kg. The additional P removed with biosolids fertilization at 300 kg
N/ha was about 2 kg P/ha at locations 4 and 5 (data not shown). The P supplied by biosolids
should be enough to satisfy crop requirements for many (10 + ?) crops.
Zinc (DTPA extraction) was significantly increased (P < 0.01) by biosolids fertilization at all
locations. Even at high biosolids rates, extractable Zn levels in our study are far below levels
toxic to plants. The increase in plant-available Zn probably does not represent a major soil
fertility benefit. Wheat is very tolerant of low soil Zn availability, and yield response to applied
Zn on wheat has not been demonstrated in our area. Application of high rates of P fertilizer
sometimes result in a crop Zn deficiency. Phosphorus induced Zn deficiency appears highly
unlikely with biosolids application, since both nutrients are applied simultaneously
Summary and Conclusions
Anaerobically-digested, dewatered biosolids are a dependable nutrient source for dryland
cropping systems. Adequate N for maximum yield was present at all locations with a biosolids
application rate of 300 kg total N/ha. A single application of biosolids supplied enough P, S, Zn
for two or more crops. In addition to the benefits reported here, growers also observe significant
benefits in reducing wind erosion from biosolids application. Long-term research (6 to 10 years
after a single application) is needed to measure the residual effects of biosolids on site
productivity.
2-13
image:
 _
200 -
160 -
-
120 -
80 -
200 -
CO
=§,160 -
^
co 120-
i 80:
CO
•+- •
£200-
^
co 160 -
->-•
§ 120 -
Q.
80 -
Location 3
120 cm depth
/
'
J
7
><
><
>
>
Location 4
120 cm depth
pq
X
^
/
\
Location 5
90 cm depth
0
1 \ '
0 200 400
7.5 -
5.0 -
2.5 -
-
0)7.5 -
"D)
E 5.0 -
c"
N2.5-
Q.
H-
Q
-4— '
W v c
CD 7 .5 -
j?5.0-
-co
O
Q. 2.5 -
1
600
7.5 -
5.0 -
2.5 -
Location 3
10 cm depth
\
r/in •
Location 4
1 0 cm depth
Location 5
10 cm depth
„ \
Rn 1
Location 6
10 cm depth
75 -
50 -
25 -
D)
H75-
£ -
Of 50 -
0)
g 25 -
0
!_
CO
o
f 76-
CO
0)
^ 50 -
CO
r~
"CO oc
0 ^ ~
O.
-
75 -
50 -
25 -
Location 3
1 0 cm depth
Location 4
1 0 cm depth
Location 5
10 cm depth
Location 6
10 cm depth
I ' I ' I ' T
0 200 400 600
Fertilizer source: V/A None
Inorganic
\ • F ' \ ' r
0 200 400 600
Biosolids
Total nitrogen applied, kg/ha
Figure 3. Biosolids and inorganic N fertilizer effects on postharvest soil sulfate-S, DTPAZn
and bicarbonate P. Horizontal dotted lines equal values for zero fertilizer treatment.
image:
_
200 -
160 -
-
120 -
80 -
200 -
CO
=§,160 -
^
co 120-
i 80:
CO
•+- •
£200-
^
co 160 -
->-•
§ 120 -
Q.
80 -
Location 3
120 cm depth
/
'
J
7
><
><
>
>
Location 4
120 cm depth
pq
X
^
/
\
Location 5
90 cm depth
0
1 \ '
0 200 400
7.5 -
5.0 -
2.5 -
-
0)7.5 -
"D)
E 5.0 -
c"
N2.5-
Q.
H-
Q
-4— '
W v c
CD 7 .5 -
j?5.0-
-co
O
Q. 2.5 -
1
600
7.5 -
5.0 -
2.5 -
Location 3
10 cm depth
\
r/in •
Location 4
1 0 cm depth
Location 5
10 cm depth
„ \
Rn 1
Location 6
10 cm depth
75 -
50 -
25 -
D)
H75-
£ -
Of 50 -
0)
g 25 -
0
!_
CO
o
f 76-
CO
0)
^ 50 -
CO
r~
"CO oc
0 ^ ~
O.
-
75 -
50 -
25 -
Location 3
1 0 cm depth
Location 4
1 0 cm depth
Location 5
10 cm depth
Location 6
10 cm depth
I ' I ' I ' T
0 200 400 600
Fertilizer source: V/A None
Inorganic
\ • F ' \ ' r
0 200 400 600
Biosolids
Total nitrogen applied, kg/ha
Figure 3. Biosolids and inorganic N fertilizer effects on postharvest soil sulfate-S, DTPAZn
and bicarbonate P. Horizontal dotted lines equal values for zero fertilizer treatment.
image:
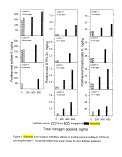 Table 8. Statistical significance of extractable soil nutrient measurements.
Locations 1-6.
Contrast
Field Location
6
No biosolids vs. biosolids
Biosolids (300 kg N/ha) vs. biosolids (600 kg N/ha)
Coefficient of variation (%)
Standard error of the mean
Sulfate-S, kg/ha
+ +- M
NS M M M
20.4 13.7 14.5 M
37.3 20.5 15.8 M
No biosolids vs. biosolids
Biosolids (300 kg N/ha) vs. biosolids (600 kg N/ha)
Coefficient of variation (%)
Standard error of the mean
Bicarbonate P, mg/kg
** ** ** **
+ M
27.2 35.0 12.3 19.6
7.9 10.1 5.3 4.9
No biosolids vs. biosolids
Biosolids (300 kg N/ha) vs. biosolids (600 kg N/ha)
Coefficient of variation (%)
Standard error of the mean
DTPA Zn, mg/kg
** ** ** **
MS M
54.3 45.4 22.6 18.8
1.1 0.8 0.7 0.5
M = missing data makes this contrast impossible
+,*,** Significant at the 10, 5, and 1 % probability levels, respectively
image:
Table 8. Statistical significance of extractable soil nutrient measurements.
Locations 1-6.
Contrast
Field Location
6
No biosolids vs. biosolids
Biosolids (300 kg N/ha) vs. biosolids (600 kg N/ha)
Coefficient of variation (%)
Standard error of the mean
Sulfate-S, kg/ha
+ +- M
NS M M M
20.4 13.7 14.5 M
37.3 20.5 15.8 M
No biosolids vs. biosolids
Biosolids (300 kg N/ha) vs. biosolids (600 kg N/ha)
Coefficient of variation (%)
Standard error of the mean
Bicarbonate P, mg/kg
** ** ** **
+ M
27.2 35.0 12.3 19.6
7.9 10.1 5.3 4.9
No biosolids vs. biosolids
Biosolids (300 kg N/ha) vs. biosolids (600 kg N/ha)
Coefficient of variation (%)
Standard error of the mean
DTPA Zn, mg/kg
** ** ** **
MS M
54.3 45.4 22.6 18.8
1.1 0.8 0.7 0.5
M = missing data makes this contrast impossible
+,*,** Significant at the 10, 5, and 1 % probability levels, respectively
image:
 A true "agronomic rate" (exactly matching N supplied with crop N needs) is probably about 5
Mg/ha biosolids (2 dry tons/acre) for our 25 to 35 cm precipitation zone. This would supply
about 200 kg total N/ha. This application rate is below the spreading capability of most manure
spreaders. A reasonable solution to this problem is to apply a spreadable biosolids rate and
eliminate, or reduce N fertilization for succeeding crops, based on soil nitrate tests. After the
first crop, we recovered most of the postharvest nitrate-N from the 0-60 cm depth (data not
shown). Under our low precipitation conditions, this residual nitrate-N will be available for
uptake by the second crop after biosolids application. An application rate of 7 to 10 Mg/ha (3
to 4 dry tons/acre) may provide enough N for 2 or 3 crops.
Grower confidence in biosolids fertilization is essential to continued biosolids utilization in
dryland cropping systems. Varieties that do not lodge with high fertility are needed to ensure
consistent yield performance with biosolids. In our study, we observed large reductions in grain
yield and grain test weight associated with lodging. The high grain N produced by biosolids
fertilization is a potential problem for soft white wheat production, but could be an asset for
production of hard red winter or hard red spring wheat.
The greatest benefit to the grower from biosolids application comes from the first biosolids
application at a site. Biosolids recycling programs designed to maximize beneficial use should
concentrate on one-time applications over large acreages, rather than repeated applications on
small acreages. Local biosolids permitting agencies can promote beneficial use by streamlining
the permit process for dryland sites which have a very low risk of off-site pollution.
Acknowledgments
We wish to express our appreciation to the Northwest Biosolids Management Association for
financial support. We thank cooperating wheat growers for their assistance with the field test
plots. We thank Bob Stevens and Virginia Prest for their assistance during plot harvest. We
thank Steve Fransen for assistance with statistical analysis.
Dan M. Sullivan is currently water quality/waste management specialist, Dept. Crop and Soil
Science, Oregon State University, Corvallis, OR 97331-7306. Andy I. Bary is soil scientist,
Washington State University, Puyallup, WA. Jim A. Kropf is WSU Cooperative Extension
Agent for Douglas/Chelan counties, Waterville, WA. David M. Granatstein is WSU sustainable
agriculture coordinator, Wenatchee, WA.
2-16
image:
A true "agronomic rate" (exactly matching N supplied with crop N needs) is probably about 5
Mg/ha biosolids (2 dry tons/acre) for our 25 to 35 cm precipitation zone. This would supply
about 200 kg total N/ha. This application rate is below the spreading capability of most manure
spreaders. A reasonable solution to this problem is to apply a spreadable biosolids rate and
eliminate, or reduce N fertilization for succeeding crops, based on soil nitrate tests. After the
first crop, we recovered most of the postharvest nitrate-N from the 0-60 cm depth (data not
shown). Under our low precipitation conditions, this residual nitrate-N will be available for
uptake by the second crop after biosolids application. An application rate of 7 to 10 Mg/ha (3
to 4 dry tons/acre) may provide enough N for 2 or 3 crops.
Grower confidence in biosolids fertilization is essential to continued biosolids utilization in
dryland cropping systems. Varieties that do not lodge with high fertility are needed to ensure
consistent yield performance with biosolids. In our study, we observed large reductions in grain
yield and grain test weight associated with lodging. The high grain N produced by biosolids
fertilization is a potential problem for soft white wheat production, but could be an asset for
production of hard red winter or hard red spring wheat.
The greatest benefit to the grower from biosolids application comes from the first biosolids
application at a site. Biosolids recycling programs designed to maximize beneficial use should
concentrate on one-time applications over large acreages, rather than repeated applications on
small acreages. Local biosolids permitting agencies can promote beneficial use by streamlining
the permit process for dryland sites which have a very low risk of off-site pollution.
Acknowledgments
We wish to express our appreciation to the Northwest Biosolids Management Association for
financial support. We thank cooperating wheat growers for their assistance with the field test
plots. We thank Bob Stevens and Virginia Prest for their assistance during plot harvest. We
thank Steve Fransen for assistance with statistical analysis.
Dan M. Sullivan is currently water quality/waste management specialist, Dept. Crop and Soil
Science, Oregon State University, Corvallis, OR 97331-7306. Andy I. Bary is soil scientist,
Washington State University, Puyallup, WA. Jim A. Kropf is WSU Cooperative Extension
Agent for Douglas/Chelan counties, Waterville, WA. David M. Granatstein is WSU sustainable
agriculture coordinator, Wenatchee, WA.
2-16
image:
 Biosolids
From An
Agricultural
Perspective
Gary Wegner
Wegner Ranch
Rt. 1 Box 8
Reardan.WA 99029
phone 1(509) 796-4825
image:
Biosolids
From An
Agricultural
Perspective
Gary Wegner
Wegner Ranch
Rt. 1 Box 8
Reardan.WA 99029
phone 1(509) 796-4825
image:
 Gary Wegner an Agricultural Perspective
Biosoliils
Pagel
As an American Farmer, my main concern is producing crops that grow fast
and healthy, creating healthy food that tastes good and is good for you. To
accomplish this, I need a healthy soil. A soil that is not deficient in
nutrients. A soil that contains as much organic matter as possible. As an
American Farmer, I can increase the organic matter content of my soil, by
returning lots of plant residue (stems, leaves and roots) to the soil. When
residue is mixed with the soil, it decays and becomes the part of the soil we
call organic matter.
What determines how much residue my crops produce? The type of crop,
the moisture available for the crop, and the availability of nutrients. A soil
that has a shortage of one, or more nutrients, will not produce up to it's
potential, even if all other factors are optimal. That is why the addition of
Biosolids to my soil at Wegner Ranch has had such a dramatic affect.
4 Organic matter is an important soil constituent that influences virtually
all chemical, biological and physical processes that occur in the soil.
* Organic matter is the "glue" that holds soil together, so that it can resist
wind and water erosion.
+ Organic matter contributes to the "cation
exchange capacity" of a soil, providing sites
for the retention of basic cations such as
potassium (K), calcium (Ca) and
magnesium (Mg).
4 Organic matter is an insoluble "store-house"
of nutrients (food for plants), bit by bit the
nutrients are taken from the store-house, and
converted to soluble nutrients which are
transported inside the plant to cells where
they become building material for the plant.
+ Mineralization, is the term used to describe
this process, which is the microbial
conversion of organic compounds to
inorganic molecules that are available for
plant uptake.
Organic
Matter
The glue
that holds
soil particles
together
image:
Gary Wegner an Agricultural Perspective
Biosoliils
Pagel
As an American Farmer, my main concern is producing crops that grow fast
and healthy, creating healthy food that tastes good and is good for you. To
accomplish this, I need a healthy soil. A soil that is not deficient in
nutrients. A soil that contains as much organic matter as possible. As an
American Farmer, I can increase the organic matter content of my soil, by
returning lots of plant residue (stems, leaves and roots) to the soil. When
residue is mixed with the soil, it decays and becomes the part of the soil we
call organic matter.
What determines how much residue my crops produce? The type of crop,
the moisture available for the crop, and the availability of nutrients. A soil
that has a shortage of one, or more nutrients, will not produce up to it's
potential, even if all other factors are optimal. That is why the addition of
Biosolids to my soil at Wegner Ranch has had such a dramatic affect.
4 Organic matter is an important soil constituent that influences virtually
all chemical, biological and physical processes that occur in the soil.
* Organic matter is the "glue" that holds soil together, so that it can resist
wind and water erosion.
+ Organic matter contributes to the "cation
exchange capacity" of a soil, providing sites
for the retention of basic cations such as
potassium (K), calcium (Ca) and
magnesium (Mg).
4 Organic matter is an insoluble "store-house"
of nutrients (food for plants), bit by bit the
nutrients are taken from the store-house, and
converted to soluble nutrients which are
transported inside the plant to cells where
they become building material for the plant.
+ Mineralization, is the term used to describe
this process, which is the microbial
conversion of organic compounds to
inorganic molecules that are available for
plant uptake.
Organic
Matter
The glue
that holds
soil particles
together
image:
 Biosolids
Gary Wegner, an Agricultural Perspective page 2
Recycling of Biosolids is the ultimate recycling program.
Here is how it works: Plants grow in soil, using energy from the
sun (photosynthesis) and nutrients from the soil. Plants are either
harvested for food, or eaten by animals. The animals that eat the
plants, are themselves harvested for food. We find these nutrients
(that were once in the soil) at the meat counter, in the cereal box
that we buy at the supermarket, or in the steak that we enjoy at a
fine restaurant. These nutrients we derive from the food we eat,
serve to nourish our bodies.
Our bodies utilize the nutrients, and
then shed what is normally called
waste. (Actually, "waste" is just excess
nutrients, like nitrogen, and all the other
nutrients that our cells cast off.
Cast off like spent fuel, just to be
replaced with more nutrients and new
sources of energy.) These biologically
processed nutrients (waste), move
through the pipes of the wastewater
system of a city, to a treatment facility. The facility could best be
described as a "bacteria farm", where bacteria are fed, much like
cattle in a feed lot. In the end, these beneficial bacteria make up
what we call Biosolids. The Biosolids are hauled back to farm
land, where they rejuvenate the soil, simply by returning vital
nutrients. The soil is renewed, ready to grow lush crops for
consumption by humans and animals, all over again!
Do you agree that Biosolids Recycling is, -without a doubt, the
ultimate recycling program?
image:
Biosolids
Gary Wegner, an Agricultural Perspective page 2
Recycling of Biosolids is the ultimate recycling program.
Here is how it works: Plants grow in soil, using energy from the
sun (photosynthesis) and nutrients from the soil. Plants are either
harvested for food, or eaten by animals. The animals that eat the
plants, are themselves harvested for food. We find these nutrients
(that were once in the soil) at the meat counter, in the cereal box
that we buy at the supermarket, or in the steak that we enjoy at a
fine restaurant. These nutrients we derive from the food we eat,
serve to nourish our bodies.
Our bodies utilize the nutrients, and
then shed what is normally called
waste. (Actually, "waste" is just excess
nutrients, like nitrogen, and all the other
nutrients that our cells cast off.
Cast off like spent fuel, just to be
replaced with more nutrients and new
sources of energy.) These biologically
processed nutrients (waste), move
through the pipes of the wastewater
system of a city, to a treatment facility. The facility could best be
described as a "bacteria farm", where bacteria are fed, much like
cattle in a feed lot. In the end, these beneficial bacteria make up
what we call Biosolids. The Biosolids are hauled back to farm
land, where they rejuvenate the soil, simply by returning vital
nutrients. The soil is renewed, ready to grow lush crops for
consumption by humans and animals, all over again!
Do you agree that Biosolids Recycling is, -without a doubt, the
ultimate recycling program?
image:
 Gary Wegner, an Agricultural Perspective
Biosolids
Pages
It is important know more about Essential Nutrients:
The "heavy metal group": Cr
Co
Cu
The "other" Essential Nutrients:
Chromium
Cobalt
Copper
Iron
Manganese
Molybdenum
Nickel
Vanadium
Zinc
Boron
Calcium
Carbon
Chlorine
Hydrogen
Potassium
Magnesium
Nitrogen
Sodium
Oxygen
Phosphorus
Selenium
Sulfur
image:
Gary Wegner, an Agricultural Perspective
Biosolids
Pages
It is important know more about Essential Nutrients:
The "heavy metal group": Cr
Co
Cu
The "other" Essential Nutrients:
Chromium
Cobalt
Copper
Iron
Manganese
Molybdenum
Nickel
Vanadium
Zinc
Boron
Calcium
Carbon
Chlorine
Hydrogen
Potassium
Magnesium
Nitrogen
Sodium
Oxygen
Phosphorus
Selenium
Sulfur
image:
 Biosolids
Gary Wegner, an Agricultural Perspective
The Nutrient Quiz
1. A deficiency of can affect as many as
60 enzymes and most major metabolic processes in the human body.
(Human Nutrition)
2. primary role is to carry oxygen and carbon dioxide within
the red blood cell from one body tissue to another. (Human Nutrition)
3. Photosynthesis can produce carbohydrates from CO2 and H2O, but the
process cannot go on to the production of proteins, nucleic acids, and so
on unless is available. (Soils & Soil Fertility)
4. There's mounting evidence that wheat growers are overlooking a simple,
inexpensive crop input that could return an investment two to three fold.
That input is , a crop nutrient that may be in short supply on
more than 70% of wheat fields in the High Plains. (Farm Journal 5/94)
5. In its biologically active form, __helps insulin
metabolize fat, turn protein into muscle and convert sugar into energy.
6. is a mineral that helps maintain the balance of fluid
within the cells of the body. It also aids in nerve conduction and helps
maintain normal blood pressure. (Encarta)
7. helps maintain the balance of fluid outside the cells of the
body. It also aids in nerve conduction and muscle contraction. (Encarta)
8. Sources of include milk products and dark-green
leafy vegetables (such as broccoli). (Encarta)
9. deficiency is extremely rare because most foods
contain the mineral. (Encarta)
10.About 90 percent of is stored in bone, where it can
be reabsorbed by blood and tissue. (Encarta)
11. is a macronutrient constituent of organic compounds
and, like nitrogen and phosphorus, is an integral part of their structures.
(Soils & Soil Fertility)
12. is involved in chlorophyll formation and is
important as a coenzyme that is needed to activate several plant
enzymes. (Soils & Soil Fertility)
image:
Biosolids
Gary Wegner, an Agricultural Perspective
The Nutrient Quiz
1. A deficiency of can affect as many as
60 enzymes and most major metabolic processes in the human body.
(Human Nutrition)
2. primary role is to carry oxygen and carbon dioxide within
the red blood cell from one body tissue to another. (Human Nutrition)
3. Photosynthesis can produce carbohydrates from CO2 and H2O, but the
process cannot go on to the production of proteins, nucleic acids, and so
on unless is available. (Soils & Soil Fertility)
4. There's mounting evidence that wheat growers are overlooking a simple,
inexpensive crop input that could return an investment two to three fold.
That input is , a crop nutrient that may be in short supply on
more than 70% of wheat fields in the High Plains. (Farm Journal 5/94)
5. In its biologically active form, __helps insulin
metabolize fat, turn protein into muscle and convert sugar into energy.
6. is a mineral that helps maintain the balance of fluid
within the cells of the body. It also aids in nerve conduction and helps
maintain normal blood pressure. (Encarta)
7. helps maintain the balance of fluid outside the cells of the
body. It also aids in nerve conduction and muscle contraction. (Encarta)
8. Sources of include milk products and dark-green
leafy vegetables (such as broccoli). (Encarta)
9. deficiency is extremely rare because most foods
contain the mineral. (Encarta)
10.About 90 percent of is stored in bone, where it can
be reabsorbed by blood and tissue. (Encarta)
11. is a macronutrient constituent of organic compounds
and, like nitrogen and phosphorus, is an integral part of their structures.
(Soils & Soil Fertility)
12. is involved in chlorophyll formation and is
important as a coenzyme that is needed to activate several plant
enzymes. (Soils & Soil Fertility)
image:
 Biosolitls
Gary Wegner, an Agricultural Perspective
Page 5
These steptoe barley
plants are shown at
50% of their actual
size.
They were 37 days
old. These samples
were taken 25 feet
from each other.
What was the
difference?
The plant on the
right received the
recommended
agronomic rate of
Biosolids.
The plant on the
left, received the
normal amount of
nitrogen fertilizer
used at Wegner
Ranch.
Plants respond to the full spectrum of essential nutrients found in
Biosolids.
Plant and animal growth is limited by the availability of water, sunlight and
nutrients. Any nutrient can be limiting. A deficiency of one nutrient, can
affect the utilization of another nutrient.
At Wegner Ranch we know that our soils were all deficient in Zinc.
Agronomists tell us that Zinc affects the utilization of Phosphorus. That is
just one of the reasons that we get a very significant response to Biosolids
applications.
image:
Biosolitls
Gary Wegner, an Agricultural Perspective
Page 5
These steptoe barley
plants are shown at
50% of their actual
size.
They were 37 days
old. These samples
were taken 25 feet
from each other.
What was the
difference?
The plant on the
right received the
recommended
agronomic rate of
Biosolids.
The plant on the
left, received the
normal amount of
nitrogen fertilizer
used at Wegner
Ranch.
Plants respond to the full spectrum of essential nutrients found in
Biosolids.
Plant and animal growth is limited by the availability of water, sunlight and
nutrients. Any nutrient can be limiting. A deficiency of one nutrient, can
affect the utilization of another nutrient.
At Wegner Ranch we know that our soils were all deficient in Zinc.
Agronomists tell us that Zinc affects the utilization of Phosphorus. That is
just one of the reasons that we get a very significant response to Biosolids
applications.
image:
 Biosolids
Gary Wegner, an Agricultural Perspective
It's only human nature to resist change. As a third generation, American
Farmer, I know my family has been faced with many changes. When my
Grandfather sold his last horse, he had made some serious decisions. He
had kept just a few of his best horses back, just in case those new tractors
didn't work out. Driving a tractor was a lot different than holding leather
reins for 14 hours a day. It is human nature to resist change. But good
choices can mean a better future, or what we call progress.
I began trying to get Biosolids in 1986. I met resistance from my father (my
partner), then my County Commissioners and some neighbors. With the
help of a farsighted County Commissioner, we formed the Lincoln County
Soil Safety Committee. Applications of Biosolids began in the Spring of
1988. My father saw the benefits and became supportive, as did many
others. My cousin, an Agronomy Professor at Iowa State University, visited
our farm and encouraged our use of Biosolids. We were cautious, and we
were careful, but it is has been the most beneficial decision we have ever
made.
We are concerned about the soil and we
are concerned about the crops that we
grow. That is why we use Biosolids.
We can see the soils and the crops
improve every year. Extra residue,
producing additional organic matter,
feeding better varieties of crops, to
produce better food for your table. That
is just good farm management. That is
the result of a good Biosolids Recycling
Program.
- Gary Wegner is a graduate of Washing-ton State University,
with a B.S. Degree in Animal Nutrition.
- Wegner Ranch, 25 miles West of Spokane, Washington, and includes
1,525 acres of tillable land, devoted to wheat, barley, canola and hull-less
barley production.
- Prior to returning to his family farm, Gary was a Farm Management
Instructor at Centralia College, a developer of training aids for the Farm
Credit Banks and a sales representative for the Ralston Purina Company.
image:
Biosolids
Gary Wegner, an Agricultural Perspective
It's only human nature to resist change. As a third generation, American
Farmer, I know my family has been faced with many changes. When my
Grandfather sold his last horse, he had made some serious decisions. He
had kept just a few of his best horses back, just in case those new tractors
didn't work out. Driving a tractor was a lot different than holding leather
reins for 14 hours a day. It is human nature to resist change. But good
choices can mean a better future, or what we call progress.
I began trying to get Biosolids in 1986. I met resistance from my father (my
partner), then my County Commissioners and some neighbors. With the
help of a farsighted County Commissioner, we formed the Lincoln County
Soil Safety Committee. Applications of Biosolids began in the Spring of
1988. My father saw the benefits and became supportive, as did many
others. My cousin, an Agronomy Professor at Iowa State University, visited
our farm and encouraged our use of Biosolids. We were cautious, and we
were careful, but it is has been the most beneficial decision we have ever
made.
We are concerned about the soil and we
are concerned about the crops that we
grow. That is why we use Biosolids.
We can see the soils and the crops
improve every year. Extra residue,
producing additional organic matter,
feeding better varieties of crops, to
produce better food for your table. That
is just good farm management. That is
the result of a good Biosolids Recycling
Program.
- Gary Wegner is a graduate of Washing-ton State University,
with a B.S. Degree in Animal Nutrition.
- Wegner Ranch, 25 miles West of Spokane, Washington, and includes
1,525 acres of tillable land, devoted to wheat, barley, canola and hull-less
barley production.
- Prior to returning to his family farm, Gary was a Farm Management
Instructor at Centralia College, a developer of training aids for the Farm
Credit Banks and a sales representative for the Ralston Purina Company.
image:
 Biosolitls
Gary Wegner, an Agricultural Perspective rage*
The Nutrient Quiz
1. A deficiency of Zinc can affect as many as 60 enzymes
and most major metabolic processes in the human body. (Human
Nutrition)
2. Irons primary role is to carry oxygen and carbon dioxide within the red
blood cell from one body tissue to another. (Human Nutrition)
3. Photosynthesis can produce carbohydrates from CO2 and H2O, but the
process cannot go on to the production of proteins, nucleic acids, and so
on unless Nitrogen is available. (Soils & Soil Fertility)
4. There's mounting evidence that wheat growers are overlooking a simple,
inexpensive crop input that could return an investment two to three fold.
That input is Chlorine, a crop nutrient that may be in short supply on
more than 70% of wheat fields in the High Plains. (Farm Journal 5/94)
5. In its biologically active form, Chromium helps insulin metabolize fat,
turn protein into muscle and convert sugar into energy.
6. Potassium is a mineral that helps maintain the balance of fluid within the
cells of the body. It also aids in nerve conduction and helps maintain
normal blood pressure. (Encarta)
7. Sodium helps maintain the balance of fluid outside the cells of the body.
It also aids in nerve conduction and muscle contraction. (Encarta)
8. Sources of Calcium include milk products and dark-green leafy
vegetables (such as broccoli). (Encarta)
9. Phosphorus deficiency is extremely rare because most foods contain the
mineral. (Encarta)
10. About 90 percent of Calcium is stored in bone, where it can be
reabsorbed by blood and tissue. (Encarta)
11. Sulfur is a macronutrient constituent of organic compounds and, like
nitrogen and phosphorus, is an integral part of their structures. (Soils &
Soil Fertility)
12. Copper is involved in chlorophyll formation and is important as a
coenzyme that is needed to activate several plant enzymes. (Soils & Soil
Fertility)
image:
Biosolitls
Gary Wegner, an Agricultural Perspective rage*
The Nutrient Quiz
1. A deficiency of Zinc can affect as many as 60 enzymes
and most major metabolic processes in the human body. (Human
Nutrition)
2. Irons primary role is to carry oxygen and carbon dioxide within the red
blood cell from one body tissue to another. (Human Nutrition)
3. Photosynthesis can produce carbohydrates from CO2 and H2O, but the
process cannot go on to the production of proteins, nucleic acids, and so
on unless Nitrogen is available. (Soils & Soil Fertility)
4. There's mounting evidence that wheat growers are overlooking a simple,
inexpensive crop input that could return an investment two to three fold.
That input is Chlorine, a crop nutrient that may be in short supply on
more than 70% of wheat fields in the High Plains. (Farm Journal 5/94)
5. In its biologically active form, Chromium helps insulin metabolize fat,
turn protein into muscle and convert sugar into energy.
6. Potassium is a mineral that helps maintain the balance of fluid within the
cells of the body. It also aids in nerve conduction and helps maintain
normal blood pressure. (Encarta)
7. Sodium helps maintain the balance of fluid outside the cells of the body.
It also aids in nerve conduction and muscle contraction. (Encarta)
8. Sources of Calcium include milk products and dark-green leafy
vegetables (such as broccoli). (Encarta)
9. Phosphorus deficiency is extremely rare because most foods contain the
mineral. (Encarta)
10. About 90 percent of Calcium is stored in bone, where it can be
reabsorbed by blood and tissue. (Encarta)
11. Sulfur is a macronutrient constituent of organic compounds and, like
nitrogen and phosphorus, is an integral part of their structures. (Soils &
Soil Fertility)
12. Copper is involved in chlorophyll formation and is important as a
coenzyme that is needed to activate several plant enzymes. (Soils & Soil
Fertility)
image:
 N-Viro Soil as a Gypsum Replacement in
Cotton Production on a Sodic Saline/Alkali Soil
B. McCullough-Sanden, H. McCutchin, R. Bailey, T. Logan, and B. Harrison
Introduction
N-Viro Soil (NVS) is produced by the N-Viro advanced alkaline stabilization process for
treatment of municipal sewage sludge. The material is a dry, granular, pasteurized product with
an alkaline pH (12), calcium carbonate equivalency of about 50 % (comprised mostly of CaC03
and a small amount of Ca(OH)2), andNPK content of about 1, 0.5 and 0.5-1 %, respectively. It
has been used as an agricultural limestone substitute, and as a soil substitute for reclamation,
horticulture and landfill cover. Because of its stable structure, high organic matter content and
relatively high content of soluble Ca, it appeared to be a possible substitute for gypsum in the
reclamation of sodic soils.
In the U.S. there are 16 western states with alkaline/sodic soils that could potentially use
significant quantities of N-Viro Soil (NVS) in agriculture. West of Nebraska, there is one N-
Viro facility, and it produces only landfill cover. Mike Scharp prepared a 1993 report on NVS
marketing for Kern County, California for N-Viro International Corporation. Scharp found that
the data required to market NVS needed development. ScharpOs conclusion was that NVS is not
going to fit into its regularly accepted markets that have been developed in the east and midwest;
for example, as a lime replacement.
California's San Joaquin Valley, a crop growing capital of the world, has saline/alkaline soil.
Gypsum is applied in order to farm these areas. Soluble calcium in the gypsum replaces sodium
on exchange sites in the soil and maintains water penetration. This addition of soluble calcium
improves the soil physical properties of water infiltration and aggregation. In 1992, in Kern
County, 144,796 tons of gypsum were purchased and used for this purpose. Within the state of
California, 846,905 tons of gypsum were purchased and applied. More than twice as much
gypsum was applied agriculturally in California as compared to lime. Based on this background
information it was decided to do a trial to test the usefulness of NVS as an alternative to gypsum.
This research forms a block in a solid foundation of knowledge of the performance of NVS on
sodic/alkaline soils that could open additional markets in the Western states and other areas like
Israel that have sodic/alkaline soils with water penetration problems.
Gypsum has been used for many years as a Ca2+ source to replace Na+ from the soil exchange
complex. This exchange generally increases infiltration rates and improves physical structure
of sodic soil. The reason that gypsum (CaSO4.2H2O) is applied in comparison to agricultural
limestone (CaCO3) is that it contains more soluble calcium. The concentration of soluble
calcium in NVS and gypsum was compared and found to be similar (around 2.4%, Table 1).
Since NVS is additionally a source of low level nutrients, organic matter and has moisture
holding properties, it is a product that shows promise of improved performance over that of the
several hundred thousand tons of gypsum now being sold.
2-1
image:
N-Viro Soil as a Gypsum Replacement in
Cotton Production on a Sodic Saline/Alkali Soil
B. McCullough-Sanden, H. McCutchin, R. Bailey, T. Logan, and B. Harrison
Introduction
N-Viro Soil (NVS) is produced by the N-Viro advanced alkaline stabilization process for
treatment of municipal sewage sludge. The material is a dry, granular, pasteurized product with
an alkaline pH (12), calcium carbonate equivalency of about 50 % (comprised mostly of CaC03
and a small amount of Ca(OH)2), andNPK content of about 1, 0.5 and 0.5-1 %, respectively. It
has been used as an agricultural limestone substitute, and as a soil substitute for reclamation,
horticulture and landfill cover. Because of its stable structure, high organic matter content and
relatively high content of soluble Ca, it appeared to be a possible substitute for gypsum in the
reclamation of sodic soils.
In the U.S. there are 16 western states with alkaline/sodic soils that could potentially use
significant quantities of N-Viro Soil (NVS) in agriculture. West of Nebraska, there is one N-
Viro facility, and it produces only landfill cover. Mike Scharp prepared a 1993 report on NVS
marketing for Kern County, California for N-Viro International Corporation. Scharp found that
the data required to market NVS needed development. ScharpOs conclusion was that NVS is not
going to fit into its regularly accepted markets that have been developed in the east and midwest;
for example, as a lime replacement.
California's San Joaquin Valley, a crop growing capital of the world, has saline/alkaline soil.
Gypsum is applied in order to farm these areas. Soluble calcium in the gypsum replaces sodium
on exchange sites in the soil and maintains water penetration. This addition of soluble calcium
improves the soil physical properties of water infiltration and aggregation. In 1992, in Kern
County, 144,796 tons of gypsum were purchased and used for this purpose. Within the state of
California, 846,905 tons of gypsum were purchased and applied. More than twice as much
gypsum was applied agriculturally in California as compared to lime. Based on this background
information it was decided to do a trial to test the usefulness of NVS as an alternative to gypsum.
This research forms a block in a solid foundation of knowledge of the performance of NVS on
sodic/alkaline soils that could open additional markets in the Western states and other areas like
Israel that have sodic/alkaline soils with water penetration problems.
Gypsum has been used for many years as a Ca2+ source to replace Na+ from the soil exchange
complex. This exchange generally increases infiltration rates and improves physical structure
of sodic soil. The reason that gypsum (CaSO4.2H2O) is applied in comparison to agricultural
limestone (CaCO3) is that it contains more soluble calcium. The concentration of soluble
calcium in NVS and gypsum was compared and found to be similar (around 2.4%, Table 1).
Since NVS is additionally a source of low level nutrients, organic matter and has moisture
holding properties, it is a product that shows promise of improved performance over that of the
several hundred thousand tons of gypsum now being sold.
2-1
image:
 The project involved the cooperation of Dr. Richard Bailey, Western Region, N-Viro
International Corp.; Hal McCutchan, Agricultural Project Engineer, Residuals Processing, Inc.;
Blake Sanden, Farm Advisor, University of California Cooperative Extension; Professor Terry
Logan, School of Natural Resources, Ohio State University; and others. Because soluble
calcium levels were found to be comparable in the gypsum and NVS samples it seemed feasible
to replace the function of gypsum with NVS. A field project was initiated and, with the
assistance of Blake Sanden, a cooperating farm that typically applied gysum to the soil to grow
cotton was located.
Study Objectives
1. To determine the value of NVS for reclamation/infiltration as a replacement for bulk
gypsum in a production field crop setting on a saline/sodic/alkali soil.
2. To determine if soil concentrations of heavy metals were measurably increased above
native levels.
3. To access crop benefits from the addition of nutrients and organic matter in NVS.
Study Description and Testing
Preparation and Testing of NVS
Bakersfield ash from Hondo Chemical Company was tested by The Medical College of Ohio
(MCO) and found to be an adequate admixture souce to insure adequate heat generation to
achieve PFRP. Admixture metal data was reviewed to be sure that the material met N-Viro/503
standards. MCO mixed the Hondo ash with biosolids from the Hyperion Treatment Plant in Los
Angeles to produce NVS. A trial NVS production was processed on 1/10/94 near the study site.
The prepared NVS was sampled over time at eight intervals (Day 1 after preparation through
Day 22). The samples were analyzed by the Environmental Science Lab at OSU for electrical
conductivity, solids, Ca(OH)2 (reported as a percentage of moist sample weight), and soluble Ca
content (reported on a dry weight basis) (Table 1). A gypsum sample from American Aggregates
was tested for soluble Ca and had a concentration of 2.4 %. Dry bulk density was 0.5 g/cm and
1.15 g/cm for the Day 22 NVS and for the Aggregates gypsum, respectively.
Southwestern Kern County is relatively close to the large urban areas of southern California. It
has an extensive year round agricultural land base . The site was located on the southern
boundary of the dry Buena Vista lakebed in southwestern Kern County. The soil type is
Westhaven silt loam that is considered a thermic Typic Torrifluvent, that is rated Class II with
irrigation and Class VII without irrigation.
Table 1. Soluble and total Ca, Mg, Na in
amendments.
Amendments
Gypsum
NVS
Ca
20635
28706
Soluble
Mg
(mg/kg)
135
32
Na
33
52
Ca
51470
110188
Total
Mg
(mg/kg)
6053
4497
Na
52
168
2-2
image:
The project involved the cooperation of Dr. Richard Bailey, Western Region, N-Viro
International Corp.; Hal McCutchan, Agricultural Project Engineer, Residuals Processing, Inc.;
Blake Sanden, Farm Advisor, University of California Cooperative Extension; Professor Terry
Logan, School of Natural Resources, Ohio State University; and others. Because soluble
calcium levels were found to be comparable in the gypsum and NVS samples it seemed feasible
to replace the function of gypsum with NVS. A field project was initiated and, with the
assistance of Blake Sanden, a cooperating farm that typically applied gysum to the soil to grow
cotton was located.
Study Objectives
1. To determine the value of NVS for reclamation/infiltration as a replacement for bulk
gypsum in a production field crop setting on a saline/sodic/alkali soil.
2. To determine if soil concentrations of heavy metals were measurably increased above
native levels.
3. To access crop benefits from the addition of nutrients and organic matter in NVS.
Study Description and Testing
Preparation and Testing of NVS
Bakersfield ash from Hondo Chemical Company was tested by The Medical College of Ohio
(MCO) and found to be an adequate admixture souce to insure adequate heat generation to
achieve PFRP. Admixture metal data was reviewed to be sure that the material met N-Viro/503
standards. MCO mixed the Hondo ash with biosolids from the Hyperion Treatment Plant in Los
Angeles to produce NVS. A trial NVS production was processed on 1/10/94 near the study site.
The prepared NVS was sampled over time at eight intervals (Day 1 after preparation through
Day 22). The samples were analyzed by the Environmental Science Lab at OSU for electrical
conductivity, solids, Ca(OH)2 (reported as a percentage of moist sample weight), and soluble Ca
content (reported on a dry weight basis) (Table 1). A gypsum sample from American Aggregates
was tested for soluble Ca and had a concentration of 2.4 %. Dry bulk density was 0.5 g/cm and
1.15 g/cm for the Day 22 NVS and for the Aggregates gypsum, respectively.
Southwestern Kern County is relatively close to the large urban areas of southern California. It
has an extensive year round agricultural land base . The site was located on the southern
boundary of the dry Buena Vista lakebed in southwestern Kern County. The soil type is
Westhaven silt loam that is considered a thermic Typic Torrifluvent, that is rated Class II with
irrigation and Class VII without irrigation.
Table 1. Soluble and total Ca, Mg, Na in
amendments.
Amendments
Gypsum
NVS
Ca
20635
28706
Soluble
Mg
(mg/kg)
135
32
Na
33
52
Ca
51470
110188
Total
Mg
(mg/kg)
6053
4497
Na
52
168
2-2
image:
 Study design
Treatments were randomized within a block and replicated four times. Pre-application soil
samples were taken to a depth of 1 foot on 2/294. All soil samples were taken with an open face
Lord-type probe. Eight to ten soil plugs were taken from each plot and composited before
analysis.
Three treatments were used, gypsum, at 3.5 ton/acre (representative of a standard amendment
practice), NVS, at 4.5 ton/acre, and a control (no amendment added). All rates are reported on
a fresh weight basis. The treatments were applied volumetrically based on bulk density values
and disced into the soil on 2/11/94.
The field was preinigated on 3/3/94 and planted on 4/4/94. From 4/22 to 5/20 the weather was
much cooler than normal and an unusally high amount of rainfall occurred (1.5 in) which
resulted in a poor stand (55 - 65% of desirable plant numbers). The combination of osmotic
stress due to high levels of soil salts and cool temperatures enabled soil borne fungal pathogens
(possibly thielaviopis, pythium, rhizoctonia) to cause the death of a large percentage of the
young cotton seedlings. The effect was random and not associated with any treatment. The
southwest corner of the farm (including more than half of the study) appeared to be more
affected than the rest of the field. Neighboring farms had similar problems. The first irrigation
occurred on 6/8/94 and pressure bomb determinations of leaf water potential were taken on 6/22
along with mid-season soil samples. Samples were composited among plots by treatment for
determination of saturation extract and total metal content (Tables 2 and 3). The samples were
tested for the metals listed in Title 40 CFR Part 503 (1993) and California Title 22. This
compositing by treatment did not allow statistical analysis on the soil metals data. Standard
salinity analyses for Western soils were completed in duplicate and analyzed statistically.
Three sets of plant mapping data were collected from all plots on 8/8/94, 8/22/94, and 9/9/94 as
a comparison of plant growth. Leaf petioles were collected at the same time and analyzed for
NO3-N, P04-P, K, Mg, Ca, Zn, and Cu.
During the growing season a total of seven irrigations were completed; all irrigations were made
by gated pipe with tailwater recycled to a following set or a lower field. The first three
irrigations were applied in alternate furrows with sets of 18 to 24 hours in duration. The last four
irrigations were applied to every furrow for a set time of 12 hours. On 8/13/94 the seventh and
final irrigation was applied. At that time, a modified two-point furrow evaluation was performed
on three of the four replicates for each treatment. This evaluation enabled the development of
advance curves, infiltration functions and mean infiltration. The worst OsealingO conditions for
sodic soils usually occur at the end of the season making this the optimal time to test for residual
treatment benefits.
2-3
image:
Study design
Treatments were randomized within a block and replicated four times. Pre-application soil
samples were taken to a depth of 1 foot on 2/294. All soil samples were taken with an open face
Lord-type probe. Eight to ten soil plugs were taken from each plot and composited before
analysis.
Three treatments were used, gypsum, at 3.5 ton/acre (representative of a standard amendment
practice), NVS, at 4.5 ton/acre, and a control (no amendment added). All rates are reported on
a fresh weight basis. The treatments were applied volumetrically based on bulk density values
and disced into the soil on 2/11/94.
The field was preinigated on 3/3/94 and planted on 4/4/94. From 4/22 to 5/20 the weather was
much cooler than normal and an unusally high amount of rainfall occurred (1.5 in) which
resulted in a poor stand (55 - 65% of desirable plant numbers). The combination of osmotic
stress due to high levels of soil salts and cool temperatures enabled soil borne fungal pathogens
(possibly thielaviopis, pythium, rhizoctonia) to cause the death of a large percentage of the
young cotton seedlings. The effect was random and not associated with any treatment. The
southwest corner of the farm (including more than half of the study) appeared to be more
affected than the rest of the field. Neighboring farms had similar problems. The first irrigation
occurred on 6/8/94 and pressure bomb determinations of leaf water potential were taken on 6/22
along with mid-season soil samples. Samples were composited among plots by treatment for
determination of saturation extract and total metal content (Tables 2 and 3). The samples were
tested for the metals listed in Title 40 CFR Part 503 (1993) and California Title 22. This
compositing by treatment did not allow statistical analysis on the soil metals data. Standard
salinity analyses for Western soils were completed in duplicate and analyzed statistically.
Three sets of plant mapping data were collected from all plots on 8/8/94, 8/22/94, and 9/9/94 as
a comparison of plant growth. Leaf petioles were collected at the same time and analyzed for
NO3-N, P04-P, K, Mg, Ca, Zn, and Cu.
During the growing season a total of seven irrigations were completed; all irrigations were made
by gated pipe with tailwater recycled to a following set or a lower field. The first three
irrigations were applied in alternate furrows with sets of 18 to 24 hours in duration. The last four
irrigations were applied to every furrow for a set time of 12 hours. On 8/13/94 the seventh and
final irrigation was applied. At that time, a modified two-point furrow evaluation was performed
on three of the four replicates for each treatment. This evaluation enabled the development of
advance curves, infiltration functions and mean infiltration. The worst OsealingO conditions for
sodic soils usually occur at the end of the season making this the optimal time to test for residual
treatment benefits.
2-3
image:
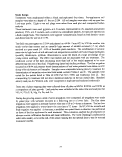 Table 2. Factors influencing reclamation/infiltration on a saline/sodic/alkali soil. Soil samples (0-12 in) taken on
2/2/94 and 6/22/94,
before and after amendment application. Mean and standard deviation of 4
replications.
Treatment
Control
Gypsum
N-Viro
Treatment
Control
Gypsum
N-Viro
2/2/94
7.8
7.8
7.7
2/2/94
14.7
14.9
12.9
PH
SD 6/22/94
0.1
0.1
0.1
ESP
8.0
8.0
8.0
SD
0.1
0.1
0.1
Elec,
2/2/94
6.5
6.7
6.2
, cond. (dS/m)
SD 6/22/94
1.8 6.8
1.5 7.8
1.8 7.3
SAR
SD
2.2
1.4
0.8
2/2/94
12.6
12.8
11.0
Boron (mg/kg)
SD 6/22/94
3.0
3.6
3.7
13.2
13.9
13.4
SD
4.6
2.1
2.3
2/2/94
5.1
4.3
3.2
SD 6/22/94
2.3 10.0
2.4 9.0
0.7 9.4
SD
5.3
3.8
4.7
2/2/94
569
678
368
SD 6/22/94
2.8
3.4
3.3
11.4
11.8
11.4
SD
4.6
1.9
2.0
Cl (ms/kR)
SO 6/22/94
389
360
193
438
831
473
SD
254
303
162
Table 3. Irrigation efficiencies for final irrigation on 8/13/94. All values are the mean of three replications of
each treatment.
Treatment
Control
Gypsum
NVS
Distribution
uniformity
0.93
0.99
0.99
Tailwater
* Runoff (%)
a 0.47
a 0.68
a 0.76
Irrigation
* Efficiency
a 0.24
a 0.32
a 0.53
Max. infiltration
12 hour set
* (inch)
a 0.55
a 0.78
a 1.41
*
a
a
b
Mean infiltration
over furrow
(inch)
0.55
0.78
1.34
*
a
a
b
Distribution uniformity = % low quarter average/field average infiltration
Tailwater runoff = % total applied water running off end
of field
Irrigation efficiency = % applied water beneficially used without tailwater
reuse
* = Duncan's New Multiple Range Test for statistical significance at the
.05 level
2-4
image:
Table 2. Factors influencing reclamation/infiltration on a saline/sodic/alkali soil. Soil samples (0-12 in) taken on
2/2/94 and 6/22/94,
before and after amendment application. Mean and standard deviation of 4
replications.
Treatment
Control
Gypsum
N-Viro
Treatment
Control
Gypsum
N-Viro
2/2/94
7.8
7.8
7.7
2/2/94
14.7
14.9
12.9
PH
SD 6/22/94
0.1
0.1
0.1
ESP
8.0
8.0
8.0
SD
0.1
0.1
0.1
Elec,
2/2/94
6.5
6.7
6.2
, cond. (dS/m)
SD 6/22/94
1.8 6.8
1.5 7.8
1.8 7.3
SAR
SD
2.2
1.4
0.8
2/2/94
12.6
12.8
11.0
Boron (mg/kg)
SD 6/22/94
3.0
3.6
3.7
13.2
13.9
13.4
SD
4.6
2.1
2.3
2/2/94
5.1
4.3
3.2
SD 6/22/94
2.3 10.0
2.4 9.0
0.7 9.4
SD
5.3
3.8
4.7
2/2/94
569
678
368
SD 6/22/94
2.8
3.4
3.3
11.4
11.8
11.4
SD
4.6
1.9
2.0
Cl (ms/kR)
SO 6/22/94
389
360
193
438
831
473
SD
254
303
162
Table 3. Irrigation efficiencies for final irrigation on 8/13/94. All values are the mean of three replications of
each treatment.
Treatment
Control
Gypsum
NVS
Distribution
uniformity
0.93
0.99
0.99
Tailwater
* Runoff (%)
a 0.47
a 0.68
a 0.76
Irrigation
* Efficiency
a 0.24
a 0.32
a 0.53
Max. infiltration
12 hour set
* (inch)
a 0.55
a 0.78
a 1.41
*
a
a
b
Mean infiltration
over furrow
(inch)
0.55
0.78
1.34
*
a
a
b
Distribution uniformity = % low quarter average/field average infiltration
Tailwater runoff = % total applied water running off end
of field
Irrigation efficiency = % applied water beneficially used without tailwater
reuse
* = Duncan's New Multiple Range Test for statistical significance at the
.05 level
2-4
image:
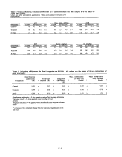 Timeline Recap of 1994 Season
Date Activity
2/2 Flag field plots and collect pre-treatment soil samples
2/11 Apply N-Viro Soil and gypsum to plots
2/14 Materials disced into soil
3/3 Preirrigate field
4/4 Plant field
4/22 Install neutron probe access tubes in every plot. Plants starting first true
leaf. Subsoil saturated at 4-6O depth - perched water
4/22-5/20 Weather much cooler than normal, 1.50 rain
5/23 Stand only 55-65% of normal
6/8 First irrigation
6/22 Second set of soil samples, install tensiometers, commence pressure
bomb readings
6/25 Second irrigation
7/7 First plant mapping
7/9 Third irrigation
7/20 Fourth irrigation
7/21 Apply Zephyr for spider mite control
7/28 Fifth irrigation
8/5 Sixth irrigation
8/8 Second plant mapping, pull petiole samples for tissue analysis
8/13 Seventh and final irrigation, conduct irrigation/infiltration evaluation
8/22 Pull second petiole samples
9/9 Pull third petiole samples
9/14 Apply sodium chlorate and Gramoxone for defoliation
9/16 Third and final plant mapping
9/30 Harvest of field
10/4 Harvest the four western most plots of trial. Grower failed to notify
before harvest of other plots.
Final yields were disappointing due to the poor stand in the study area. Since yield data could
be collected on only four plots out of the twelve, yield comparisons in relation to treatment
effects could not be made.
Results and Discussion
Salinity analyses
The salinity parameters did not seem to be affected by the treatments. Neither the gypsum nor
the NVS treatment caused an increase or decrease in soil chloride concentrations, electrical
conductivity, pH, ESP or SAR (Table 2). The salinity threshold for yield decline is commonly
cited as 7.7 dS/m, and the plot mean among treatments for the 6/22/94 sample analysis was 7.3
dS/m (Table 2). Some parameter values showed a marginal (not over 20%) increase during the
interval between soil sampling events due to capillary rise of salts and the lessening of water
infiltration. Boron was an exception in comparison to the other measurements and
2-5
image:
Timeline Recap of 1994 Season
Date Activity
2/2 Flag field plots and collect pre-treatment soil samples
2/11 Apply N-Viro Soil and gypsum to plots
2/14 Materials disced into soil
3/3 Preirrigate field
4/4 Plant field
4/22 Install neutron probe access tubes in every plot. Plants starting first true
leaf. Subsoil saturated at 4-6O depth - perched water
4/22-5/20 Weather much cooler than normal, 1.50 rain
5/23 Stand only 55-65% of normal
6/8 First irrigation
6/22 Second set of soil samples, install tensiometers, commence pressure
bomb readings
6/25 Second irrigation
7/7 First plant mapping
7/9 Third irrigation
7/20 Fourth irrigation
7/21 Apply Zephyr for spider mite control
7/28 Fifth irrigation
8/5 Sixth irrigation
8/8 Second plant mapping, pull petiole samples for tissue analysis
8/13 Seventh and final irrigation, conduct irrigation/infiltration evaluation
8/22 Pull second petiole samples
9/9 Pull third petiole samples
9/14 Apply sodium chlorate and Gramoxone for defoliation
9/16 Third and final plant mapping
9/30 Harvest of field
10/4 Harvest the four western most plots of trial. Grower failed to notify
before harvest of other plots.
Final yields were disappointing due to the poor stand in the study area. Since yield data could
be collected on only four plots out of the twelve, yield comparisons in relation to treatment
effects could not be made.
Results and Discussion
Salinity analyses
The salinity parameters did not seem to be affected by the treatments. Neither the gypsum nor
the NVS treatment caused an increase or decrease in soil chloride concentrations, electrical
conductivity, pH, ESP or SAR (Table 2). The salinity threshold for yield decline is commonly
cited as 7.7 dS/m, and the plot mean among treatments for the 6/22/94 sample analysis was 7.3
dS/m (Table 2). Some parameter values showed a marginal (not over 20%) increase during the
interval between soil sampling events due to capillary rise of salts and the lessening of water
infiltration. Boron was an exception in comparison to the other measurements and
2-5
image:
 concentrations nearly doubled on all plots during the time period between soil sampling dates.
The toxicity threshold for boron is considered to be between 6-15 mg/kg and the 6/22/94 sample
analysis had values of around 9 mg/kg (Table 2). The high soil boron and electrical conductivity
values might have caused some plant toxicity that helps to explain the cause of the poor plant
stands in the field study.
Irrigation evaluations
A significantly higher infiltration rate was found in the NVS treatment for the final irrigation on
8/13/94. A power advance function was determined by measuring in-field advance for three
points in three replications of each treatment. Advance in the control treatment was linear,
meaning that water only filled minor cracks and then ceased.to infiltrate. Furrow bottoms were
quite flat by this time in the season and an average depth and width were determined to estimate
water storage in the furrow. This storage volume within the furrow coupled with the power
advance was applied to a border-type volume balance model to generate the infiltration function.
Infiltration was computed along the furrow length according to the advance and the effective
6on timeO for that segment of the furrow, thus allowing for development of distribution
uniformity, tailwater runoff, and irrigation efficiencies. Mean infiltration over the entire furrow
length for the NVS treatment was more than 1 to 1.5 times that of gypsum and more than twice
that of the control at 1.34, 0.78, and 0.55 inches, respectively, for a 12 hour set (Table 3). No
significant differences between treatments were found for distribution uniformity, tailwater
runoff, and irrigation efficiencies (Table 3).
The infilration difference between treatments is highly significant and unexpected this
late in the season. That the infiltration in the gypsum plot declined to the level of the control is
reasonable as the dissolution of this material is fairly rapid early in the season and no longer
available to displace incoming sodium. Similarly, free calcium from the NVS material should
no longer be available. A plausible explanation for the increase in infiltration with the NVS
treatment is that organic compounds within the NVS (from the sludge component), and structural
stability of the NVS itself, are acting as long-term binders to maintain aggregate stability over
the season.
Trace element concentrations
Total trace element concentrations and concentrations in saturated extracts were determined on
the gypsum and NVS amendments and on the control and unamended soil (Table 4).
Concentrations of all elements were low in gypsum and NVS, with only Cu, Pb and Zn in NVS
at concentrations much above background soil. NVS concentrations were well within the 503
concentration limits for EQS sludge. Because of the low trace element concentrations in the
amendments, and the low application rates, there were no increases in total soil concentrations
above background. Only Cu and Zn concentrations in saturation extracts of NVS were elevated
compared to gypsum or control soil, but application of either amendment had no effect on
concentrations of trace elements in saturation extracts. Low trace element concentrations in NVS
and the low rate of NVS application for sodic soil reclamation suggest that trace element
accumulation above normal background levels is not anticipated.
Plant mapping and tissue analysis
The plant mapping data taken in July, August and September showed no significant differences
2-6
image:
concentrations nearly doubled on all plots during the time period between soil sampling dates.
The toxicity threshold for boron is considered to be between 6-15 mg/kg and the 6/22/94 sample
analysis had values of around 9 mg/kg (Table 2). The high soil boron and electrical conductivity
values might have caused some plant toxicity that helps to explain the cause of the poor plant
stands in the field study.
Irrigation evaluations
A significantly higher infiltration rate was found in the NVS treatment for the final irrigation on
8/13/94. A power advance function was determined by measuring in-field advance for three
points in three replications of each treatment. Advance in the control treatment was linear,
meaning that water only filled minor cracks and then ceased.to infiltrate. Furrow bottoms were
quite flat by this time in the season and an average depth and width were determined to estimate
water storage in the furrow. This storage volume within the furrow coupled with the power
advance was applied to a border-type volume balance model to generate the infiltration function.
Infiltration was computed along the furrow length according to the advance and the effective
6on timeO for that segment of the furrow, thus allowing for development of distribution
uniformity, tailwater runoff, and irrigation efficiencies. Mean infiltration over the entire furrow
length for the NVS treatment was more than 1 to 1.5 times that of gypsum and more than twice
that of the control at 1.34, 0.78, and 0.55 inches, respectively, for a 12 hour set (Table 3). No
significant differences between treatments were found for distribution uniformity, tailwater
runoff, and irrigation efficiencies (Table 3).
The infilration difference between treatments is highly significant and unexpected this
late in the season. That the infiltration in the gypsum plot declined to the level of the control is
reasonable as the dissolution of this material is fairly rapid early in the season and no longer
available to displace incoming sodium. Similarly, free calcium from the NVS material should
no longer be available. A plausible explanation for the increase in infiltration with the NVS
treatment is that organic compounds within the NVS (from the sludge component), and structural
stability of the NVS itself, are acting as long-term binders to maintain aggregate stability over
the season.
Trace element concentrations
Total trace element concentrations and concentrations in saturated extracts were determined on
the gypsum and NVS amendments and on the control and unamended soil (Table 4).
Concentrations of all elements were low in gypsum and NVS, with only Cu, Pb and Zn in NVS
at concentrations much above background soil. NVS concentrations were well within the 503
concentration limits for EQS sludge. Because of the low trace element concentrations in the
amendments, and the low application rates, there were no increases in total soil concentrations
above background. Only Cu and Zn concentrations in saturation extracts of NVS were elevated
compared to gypsum or control soil, but application of either amendment had no effect on
concentrations of trace elements in saturation extracts. Low trace element concentrations in NVS
and the low rate of NVS application for sodic soil reclamation suggest that trace element
accumulation above normal background levels is not anticipated.
Plant mapping and tissue analysis
The plant mapping data taken in July, August and September showed no significant differences
2-6
image:
 between treatments for plant height, vegetative and fruiting node, and plant height to node ratio
(Table 5). The final mapping on 9/16/94 showed a general decrease in plant height of 2.9 to 3.7
inches when compared to the 8/8/94 data. Desiccation due to salinity stress is the most likely
cause as the last irrigation was applied 8/13/94.
A series of petiole analyses taken 8/8, 8/22, and 9/9 (Table 6), corresponding to the period of
maximum fiber elongation, yielded no significant difference with respect to N03-N, P04-P, K,
Zn, and Cu. Tissue nitrate levels were barely in the sufficiency range for all sampling periods
(Basset and MacKenzie, 1978, de Tarr, 1994). Potassium was nearly double minimum levels
at 7-8 %. All others were easily within the sufficiency guidelines with the exception of Cu
which fell to the minimum in the 9/9/94 sampling.
Table 4. Total and saturated extract metals (mg/kg) for gypsum, N-Viro Soil, and composite soil samples
(0-12"). ;
Total
Pre-application soil
Metal
Antimony
Arsenic
Barium
Beryllium
Cadmium
Chromium
Cobalt
Lead
Mercury
Molybdenum
Nickel
Selenium
Silver
Thallium
Vanadium
Zinc
Antimony
Arsenic
Banum
Beryllium
Cadmium
Chromium
Cobalt
Copper
Lead
Mercury
Molybdenum
Nickel
Selenium
Silver
Thallium
Vanadium
Zinc
Gypsum
<3.6
4.7
47
<0.6
<0.6
7.8
3.6
6.9
<3.6
4i9
<0.4
<0.6
44.2
17.4
23.8
<0 5
<0.03
<2.0
<o!2
<0.2
<0.2
<2!o
<0.005
<0.2
<1 0
<0.03
<1 0
Oi2
0.2
NVS
<27.2
3.9
551
<4.5
<9
41.3
9.4
149.0
51.8
0.7
<9
40.9
<0.54
13
<45.4
49.3
334
<0.3
<0.03
<2
<o!2
0.4
<0.2
5.7
<2
<0.01
<0.2
<J
0.04
1.7
0.7
2.3
Control
<3.5
10.6
158
1.2
<0.6
47.3
15.1
22.8
28
. <0.1
34!e
<0.4
<0.6
<5.9
59.1
103
<0.5
0.16
<2.0
<0.1
<o!2
<0.2
0.2
0.2
<2.0
<0.005
0.2
<1 0
<0.03
<1 0
o!2
0.2
Gypsum
<3.5
11.8
149
1.1
0.8
43.2
14.2
22.5
23.4
<0.1
33
<0.4
<0.6
<5.9
54.2
97.7
Saturated
<0.5
0.14
<2.0
<0.1
<0.2
<0.2
0.2
0.2
<2.0
<0.005
0.2
<1.0
<0.03
<0.1
<1 0
0.2
1.2
2/2/94
NVS
<3.5
10.4
158
1.2
0.7
46.5
14.3
20.8
26.2
<0.1
32.8
<0.4
<0.6
<5.8
60.4
96.6
Extract
<0.5
0.14
<2.0
<0 1
<0.2
<0.2
0.2
0.2
<2.0
<0.005
0.2
<i,o
<0.03
<0.1
<1 0
0^2
0.7
Post-application soil 6/22/94
Control
0.5
8.7
137
1.2
0.3
4.7
13.4
26.3
11.4
0.1
31
1.4
0.2
0.6
47.2
93.9
<0.03
1.3
<2.0
0.01
0.01
0.1
0.2
0.17
1.1
<0.01
<0.2
<1.0
<0.03
<0.01
<0.04
0.2
0.8
Gypsum
0.6
9.2
140
1.1
0.3
4.2
14.1
23.9
11.4
<0.1
32! 1
1.3
0.2
<0.5
50.9
99.9
<0.03
1.1
<2.0
0.008
0.01
0.08
0.2
0.15
1
<0.01
<0.2
<1.0
<0.03
<0.01
<0.04
0.2
0.7
NVS
0.7
9.3
124
1.2
0.3
4.5
12.6
41.0
11.2
<0.1
29!8
1.4
0.2
0.5
43.2
88.3
<0.03
1.3
<2.0
0.009
0.01
0.08
0.2
0.15
1.1
<0.01
<0.2
<1.0
<0.03
<0.01
<0.04
0.2
0.9
2-7
image:
between treatments for plant height, vegetative and fruiting node, and plant height to node ratio
(Table 5). The final mapping on 9/16/94 showed a general decrease in plant height of 2.9 to 3.7
inches when compared to the 8/8/94 data. Desiccation due to salinity stress is the most likely
cause as the last irrigation was applied 8/13/94.
A series of petiole analyses taken 8/8, 8/22, and 9/9 (Table 6), corresponding to the period of
maximum fiber elongation, yielded no significant difference with respect to N03-N, P04-P, K,
Zn, and Cu. Tissue nitrate levels were barely in the sufficiency range for all sampling periods
(Basset and MacKenzie, 1978, de Tarr, 1994). Potassium was nearly double minimum levels
at 7-8 %. All others were easily within the sufficiency guidelines with the exception of Cu
which fell to the minimum in the 9/9/94 sampling.
Table 4. Total and saturated extract metals (mg/kg) for gypsum, N-Viro Soil, and composite soil samples
(0-12"). ;
Total
Pre-application soil
Metal
Antimony
Arsenic
Barium
Beryllium
Cadmium
Chromium
Cobalt
Lead
Mercury
Molybdenum
Nickel
Selenium
Silver
Thallium
Vanadium
Zinc
Antimony
Arsenic
Banum
Beryllium
Cadmium
Chromium
Cobalt
Copper
Lead
Mercury
Molybdenum
Nickel
Selenium
Silver
Thallium
Vanadium
Zinc
Gypsum
<3.6
4.7
47
<0.6
<0.6
7.8
3.6
6.9
<3.6
4i9
<0.4
<0.6
44.2
17.4
23.8
<0 5
<0.03
<2.0
<o!2
<0.2
<0.2
<2!o
<0.005
<0.2
<1 0
<0.03
<1 0
Oi2
0.2
NVS
<27.2
3.9
551
<4.5
<9
41.3
9.4
149.0
51.8
0.7
<9
40.9
<0.54
13
<45.4
49.3
334
<0.3
<0.03
<2
<o!2
0.4
<0.2
5.7
<2
<0.01
<0.2
<J
0.04
1.7
0.7
2.3
Control
<3.5
10.6
158
1.2
<0.6
47.3
15.1
22.8
28
. <0.1
34!e
<0.4
<0.6
<5.9
59.1
103
<0.5
0.16
<2.0
<0.1
<o!2
<0.2
0.2
0.2
<2.0
<0.005
0.2
<1 0
<0.03
<1 0
o!2
0.2
Gypsum
<3.5
11.8
149
1.1
0.8
43.2
14.2
22.5
23.4
<0.1
33
<0.4
<0.6
<5.9
54.2
97.7
Saturated
<0.5
0.14
<2.0
<0.1
<0.2
<0.2
0.2
0.2
<2.0
<0.005
0.2
<1.0
<0.03
<0.1
<1 0
0.2
1.2
2/2/94
NVS
<3.5
10.4
158
1.2
0.7
46.5
14.3
20.8
26.2
<0.1
32.8
<0.4
<0.6
<5.8
60.4
96.6
Extract
<0.5
0.14
<2.0
<0 1
<0.2
<0.2
0.2
0.2
<2.0
<0.005
0.2
<i,o
<0.03
<0.1
<1 0
0^2
0.7
Post-application soil 6/22/94
Control
0.5
8.7
137
1.2
0.3
4.7
13.4
26.3
11.4
0.1
31
1.4
0.2
0.6
47.2
93.9
<0.03
1.3
<2.0
0.01
0.01
0.1
0.2
0.17
1.1
<0.01
<0.2
<1.0
<0.03
<0.01
<0.04
0.2
0.8
Gypsum
0.6
9.2
140
1.1
0.3
4.2
14.1
23.9
11.4
<0.1
32! 1
1.3
0.2
<0.5
50.9
99.9
<0.03
1.1
<2.0
0.008
0.01
0.08
0.2
0.15
1
<0.01
<0.2
<1.0
<0.03
<0.01
<0.04
0.2
0.7
NVS
0.7
9.3
124
1.2
0.3
4.5
12.6
41.0
11.2
<0.1
29!8
1.4
0.2
0.5
43.2
88.3
<0.03
1.3
<2.0
0.009
0.01
0.08
0.2
0.15
1.1
<0.01
<0.2
<1.0
<0.03
<0.01
<0.04
0.2
0.9
2-7
image:
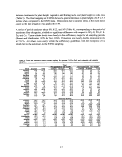 Table 5. Plant mapping data taken during 1994 growing season. Each
value is the
mean of four treatment replications
Measurement
Plant height (in)
No.
of veg. nodes
No. of fruiting
nodes
Total nodes
Height to node ratio
Date
7-Jul
8-Aug
16-Sep
7-Jul
8-Aug
16-Sep
7-Jul
8-Aug
16-Sep
7-Jul
8-Aug
16-Sep
7-Jul
8-Aug
16-Sep
Treatment
Control
20.9
27.2
25.3
7.4
8.0
12.9
7.2
10.9
7.8
14.6
18.9
20.6
1.4
1.4
1.2
*
a
a
a
a
a
a
a
a
a
a
a
a
b
a
a
NVS
21.0
27.8
23.5
10.1
7.2
12.6
5.7
12.1
7.8
15.9
19.2
20.4
1.3
1.4
1.2
*
a
a
a
b
a
a
a
a
a
b
a
a
a
a
a
Gypsum
22.0
28.2
25
10.1
8.0
12.8
5.2
11.2
8.0
15.2
19.2
20.8
1.4
1.5
1.2
*
a
a
a
b
a
a
a
a
a
ab
a
a
b
a
a
* = Duncan's New Multiple Range Test for statistical significance at
the .05 level
Table 6. Cotton petiole tissue analysis for samples taken during the 1994 growing
season.
Each value is the mean of four treatment replications.
Treatment
Measurement Date
NO3-N(mg/kg) 8-Aug
22-Aug
9-Sep
PO4-P(mg/kg) 8-Aug
22-Aug
9-Sep
K(mg/kg) 8-Aug
22-Aug
9-Sep
Zn(mg/kg) 8-Aug
22-Aug
9-Sep
Cu(mg/kg) 8-Aug
22-Aug
9-Sep
Control
2794
2124
868
1378
1436
1211
7
6
6
33
28
21
15
8
6
*
a
a
a
a
a
a
a
a
a
a
a
a
a
a
a
NVS
2312
2835
1575
1274
1526
1271
8
6
7
42
20
21
17
7
6
*
a
a
a
a
a
a
a
a
a
a
a
a
a
a
a
Gypsum
3520
2277
1500
1299
1419
1014
8
6
6
28
30
19
17
7
5
if
a
a
a
a
a
a
a
a
a
a
a
a
a
a
a
* = Duncan's New Multiple Range Test for statistical significance at
the .05 level
2-8
image:
Table 5. Plant mapping data taken during 1994 growing season. Each
value is the
mean of four treatment replications
Measurement
Plant height (in)
No.
of veg. nodes
No. of fruiting
nodes
Total nodes
Height to node ratio
Date
7-Jul
8-Aug
16-Sep
7-Jul
8-Aug
16-Sep
7-Jul
8-Aug
16-Sep
7-Jul
8-Aug
16-Sep
7-Jul
8-Aug
16-Sep
Treatment
Control
20.9
27.2
25.3
7.4
8.0
12.9
7.2
10.9
7.8
14.6
18.9
20.6
1.4
1.4
1.2
*
a
a
a
a
a
a
a
a
a
a
a
a
b
a
a
NVS
21.0
27.8
23.5
10.1
7.2
12.6
5.7
12.1
7.8
15.9
19.2
20.4
1.3
1.4
1.2
*
a
a
a
b
a
a
a
a
a
b
a
a
a
a
a
Gypsum
22.0
28.2
25
10.1
8.0
12.8
5.2
11.2
8.0
15.2
19.2
20.8
1.4
1.5
1.2
*
a
a
a
b
a
a
a
a
a
ab
a
a
b
a
a
* = Duncan's New Multiple Range Test for statistical significance at
the .05 level
Table 6. Cotton petiole tissue analysis for samples taken during the 1994 growing
season.
Each value is the mean of four treatment replications.
Treatment
Measurement Date
NO3-N(mg/kg) 8-Aug
22-Aug
9-Sep
PO4-P(mg/kg) 8-Aug
22-Aug
9-Sep
K(mg/kg) 8-Aug
22-Aug
9-Sep
Zn(mg/kg) 8-Aug
22-Aug
9-Sep
Cu(mg/kg) 8-Aug
22-Aug
9-Sep
Control
2794
2124
868
1378
1436
1211
7
6
6
33
28
21
15
8
6
*
a
a
a
a
a
a
a
a
a
a
a
a
a
a
a
NVS
2312
2835
1575
1274
1526
1271
8
6
7
42
20
21
17
7
6
*
a
a
a
a
a
a
a
a
a
a
a
a
a
a
a
Gypsum
3520
2277
1500
1299
1419
1014
8
6
6
28
30
19
17
7
5
if
a
a
a
a
a
a
a
a
a
a
a
a
a
a
a
* = Duncan's New Multiple Range Test for statistical significance at
the .05 level
2-8
image:
 Conclusions
The application of NVS at 4.5 fresh t/ac (2.47 t/ac dry weight) in comparison to the application
of a locally available mixed-grade mined gypsum applied at 3.5 t/ac (2.95 t/ac dry weight)
proved to be a superior amendment with respect to maintaining infiltration late in the season.
Even though the flyash used to produce NVS is a highly alkaline material, buffering by the
sludge component of NVS and the high background level of resident salts resulted in negligible
changes in alkalinity in this field for all treatments. No significant differences or even trends
were found with respect to changes in SAR, other salts, or heavy metals that were due to applied
treatments. Increasing salinity, boron and chlorides during the season due to capillary rise of
perched water was the dominant factor and appeared to mask any benefit that might have accrued
due to improved infiltration in the NVS or gypsum treatments. Thus, no significant differences
were found with respect to plant nutrition, stature, and possibly yield.
Long-term additions of NVS would build soil reservoirs of phosphorus, potassium and
some micro nutrients along with free Ca++ and may provide superior reclamation on sodic soils
not impacted by major drainage problems.
Acknowledgments
The N-Viro American Corporation provided funding and expertise to help make this project
possible. Wayne Hall Farming cooperated in providing field acreage and Junior Stokes
graciously donated time and equipment for field spreading of randomized plots.
References
Basset, D.M. and A.J. MacKenzie. 1978. Plant analysis as a guide to cotton fertilization. Soil
and Plant Tissue Testing in California. Univ. of CA, Bull 1879. pp.16-17.
de Tarr, W. 1994. Personal communication. USDA/Univ of CA Cotton Field Station, Shafter,
CA.
USEPA. 1993. Standards for the use and disposal of sewage sludge. Title 40 Code of Federal
Regulations Part 503. pp. 703-706.
2-9
image:
Conclusions
The application of NVS at 4.5 fresh t/ac (2.47 t/ac dry weight) in comparison to the application
of a locally available mixed-grade mined gypsum applied at 3.5 t/ac (2.95 t/ac dry weight)
proved to be a superior amendment with respect to maintaining infiltration late in the season.
Even though the flyash used to produce NVS is a highly alkaline material, buffering by the
sludge component of NVS and the high background level of resident salts resulted in negligible
changes in alkalinity in this field for all treatments. No significant differences or even trends
were found with respect to changes in SAR, other salts, or heavy metals that were due to applied
treatments. Increasing salinity, boron and chlorides during the season due to capillary rise of
perched water was the dominant factor and appeared to mask any benefit that might have accrued
due to improved infiltration in the NVS or gypsum treatments. Thus, no significant differences
were found with respect to plant nutrition, stature, and possibly yield.
Long-term additions of NVS would build soil reservoirs of phosphorus, potassium and
some micro nutrients along with free Ca++ and may provide superior reclamation on sodic soils
not impacted by major drainage problems.
Acknowledgments
The N-Viro American Corporation provided funding and expertise to help make this project
possible. Wayne Hall Farming cooperated in providing field acreage and Junior Stokes
graciously donated time and equipment for field spreading of randomized plots.
References
Basset, D.M. and A.J. MacKenzie. 1978. Plant analysis as a guide to cotton fertilization. Soil
and Plant Tissue Testing in California. Univ. of CA, Bull 1879. pp.16-17.
de Tarr, W. 1994. Personal communication. USDA/Univ of CA Cotton Field Station, Shafter,
CA.
USEPA. 1993. Standards for the use and disposal of sewage sludge. Title 40 Code of Federal
Regulations Part 503. pp. 703-706.
2-9
image:
 image:
 A Comparison of Production of Dryland Wheat
* Between Use of Anhydrous Ammonia and Biosolids
In Southeastern Colorado
R. B. Brobst, P. J. Hegeman, and B. Morales
Introduction
The USEPA (1989) reports that the application of biosolids to agricultural land is the most
common use/disposal method in current practice. Surveys of biosolids use/disposal practices
among wastewater treatment facilities in Colorado indicate a substantially higher rate of land
application than is practiced nationally. An estimated eighty-five percent of the state's biosolids
production is beneficially utilized as a soil conditioner/fertilizer. Agricultural land application
represents an attractive use option due to the proximity of agricultural land to front range
population centers. Additionally, the quality of biosolids generated in the state is typically high;
instances of biosolids containing substantial concentrations of contaminants are infrequent.
Agricultural use on land cultivated in dryland winter wheat is the predominant mode of
beneficial use in Colorado. In recent years the state has experienced an influx of biosolids from
out-of-state facilities for land application. Biosolids generated at several wastewater treatment
plants serving the New York City area were transported and applied to cropland in southeast
Colorado between April, 1992 and December, 1994. Within that period some 29,373 metric tons
(34,402 short tons) of biosolids were applied, primarily to land cultivated in dryland winter
wheat.
The potential movement of heavy metals present in land applied biosolids represents a minimal
risk to public health or to the environment, particularly if the biosolids are low in metal content
and the biosolids application rate is dictated by the nitrogen requirement of the crop (USEPA,
1983). Alkaline soil conditions further limit mobility of most potentially toxic trace metals
found in biosolids (Logan and Chaney, 1983). Evaluation of long term biosolids application to
cropland cultivated in dryland winter wheat (Lerch et al., 1990a, Barbarick et al., 1992) support
these earlier findings and have demonstrated the sustainability of biosolids application. The
eight year study conducted on experimental sites located near Bennett, Colorado has also
illustrated the economic viability of biosolids use as an alternative to commercial fertilizer
(Lerch et al., 1990b, Barbarick et al., 1992)). The importation and application of New York
biosolids in Colorado provided an opportunity to validate earlier findings under production
agriculture conditions.
The overall objective of the study was to compare the effect of New York biosolids and
commercial anhydrous ammonia on dryland winter wheat grain production. Data was also
generated to allow analysis of the uptake of trace metals present in the biosolids by the crop.
R.B. Brobst, B. Morales, USEPA, 999 18th St., Suite 500, Denver, Colorado 80202; P. J. Hegeman, Colorado Department
of Public Health and Environment, 4300 Cherry Creek Dr. South, Denver, Colorado 80222
2-1
image:
A Comparison of Production of Dryland Wheat
* Between Use of Anhydrous Ammonia and Biosolids
In Southeastern Colorado
R. B. Brobst, P. J. Hegeman, and B. Morales
Introduction
The USEPA (1989) reports that the application of biosolids to agricultural land is the most
common use/disposal method in current practice. Surveys of biosolids use/disposal practices
among wastewater treatment facilities in Colorado indicate a substantially higher rate of land
application than is practiced nationally. An estimated eighty-five percent of the state's biosolids
production is beneficially utilized as a soil conditioner/fertilizer. Agricultural land application
represents an attractive use option due to the proximity of agricultural land to front range
population centers. Additionally, the quality of biosolids generated in the state is typically high;
instances of biosolids containing substantial concentrations of contaminants are infrequent.
Agricultural use on land cultivated in dryland winter wheat is the predominant mode of
beneficial use in Colorado. In recent years the state has experienced an influx of biosolids from
out-of-state facilities for land application. Biosolids generated at several wastewater treatment
plants serving the New York City area were transported and applied to cropland in southeast
Colorado between April, 1992 and December, 1994. Within that period some 29,373 metric tons
(34,402 short tons) of biosolids were applied, primarily to land cultivated in dryland winter
wheat.
The potential movement of heavy metals present in land applied biosolids represents a minimal
risk to public health or to the environment, particularly if the biosolids are low in metal content
and the biosolids application rate is dictated by the nitrogen requirement of the crop (USEPA,
1983). Alkaline soil conditions further limit mobility of most potentially toxic trace metals
found in biosolids (Logan and Chaney, 1983). Evaluation of long term biosolids application to
cropland cultivated in dryland winter wheat (Lerch et al., 1990a, Barbarick et al., 1992) support
these earlier findings and have demonstrated the sustainability of biosolids application. The
eight year study conducted on experimental sites located near Bennett, Colorado has also
illustrated the economic viability of biosolids use as an alternative to commercial fertilizer
(Lerch et al., 1990b, Barbarick et al., 1992)). The importation and application of New York
biosolids in Colorado provided an opportunity to validate earlier findings under production
agriculture conditions.
The overall objective of the study was to compare the effect of New York biosolids and
commercial anhydrous ammonia on dryland winter wheat grain production. Data was also
generated to allow analysis of the uptake of trace metals present in the biosolids by the crop.
R.B. Brobst, B. Morales, USEPA, 999 18th St., Suite 500, Denver, Colorado 80202; P. J. Hegeman, Colorado Department
of Public Health and Environment, 4300 Cherry Creek Dr. South, Denver, Colorado 80222
2-1
image:
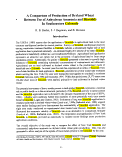 Materials and Methods
There are thirteen wastewater treatment facilities serving New York City. The Colorado
Department of Public Health and Environment, Water Quality Control Division, and the U. S.
Environmental Protection Agency, Region VIII, in early 1992, authorized the application of
biosolids from ten of those facilities to sites in Kiowa and Prowers Counties, Colorado.
Biosolids were surface applied to the study sites during the period between October, 1992 and
July, 1993 and were incorporated as the soil was worked prior to seeding. Biosolids samples
were collected at the time of application. Average biosolids composition is given in Table 1.
Table 1.
Parameter
N, total, %
NH4-N, %
NO3-N, %
P, %
K, %
Cd, mg/kg
Cr, mg/kg
Cu, mg/kg
Fe, %
Pb, mg/kg
Mo, mg/kg
Ni, mg/kg
Zn, mg/kg
1 Colorado
Characteristics of biosolids applied to dryland winter wheat fields.
Field 1
6.22
0.96
0.003
2.29
0.14
11.6
176.3
1653.3
2.1
262.5
6.5
28.4
2041.7
and federal regulatory
Field 2
2.35
1.13
0.002
0.84
0.09
7.9
180.0
1036.8
1.6
345.8
12.1
71.2
1197.5
maximum
Field 3
1.95
0.65
0.003
0.32
0.10
8.7
223.3
1146.7
1.7
375.0
17.8
93.8
1223.3
concentration for
Field 4
2.08
0.55
0.70
0.07
8.4
227.0
1150.0
304.0
11.0
74.0
1120.0
land application.
Limit1
85
3000
4300
840
75
420
7500
The biosolids applied comply with the maximum constituent limits contained in the Colorado
Biosolids Regulation (CDPHE, 1993) and in federal regulations at 40 CFR Part 503 (USEPA,
1992) for land application of biosolids. Both regulations establish a two tiered system of
concentration limits. Biosolids which comply with the more stringent set of limitations
(Colorado Grade I or federal Table 3 standards) have fewer restrictions placed upon their use.
2-2
image:
Materials and Methods
There are thirteen wastewater treatment facilities serving New York City. The Colorado
Department of Public Health and Environment, Water Quality Control Division, and the U. S.
Environmental Protection Agency, Region VIII, in early 1992, authorized the application of
biosolids from ten of those facilities to sites in Kiowa and Prowers Counties, Colorado.
Biosolids were surface applied to the study sites during the period between October, 1992 and
July, 1993 and were incorporated as the soil was worked prior to seeding. Biosolids samples
were collected at the time of application. Average biosolids composition is given in Table 1.
Table 1.
Parameter
N, total, %
NH4-N, %
NO3-N, %
P, %
K, %
Cd, mg/kg
Cr, mg/kg
Cu, mg/kg
Fe, %
Pb, mg/kg
Mo, mg/kg
Ni, mg/kg
Zn, mg/kg
1 Colorado
Characteristics of biosolids applied to dryland winter wheat fields.
Field 1
6.22
0.96
0.003
2.29
0.14
11.6
176.3
1653.3
2.1
262.5
6.5
28.4
2041.7
and federal regulatory
Field 2
2.35
1.13
0.002
0.84
0.09
7.9
180.0
1036.8
1.6
345.8
12.1
71.2
1197.5
maximum
Field 3
1.95
0.65
0.003
0.32
0.10
8.7
223.3
1146.7
1.7
375.0
17.8
93.8
1223.3
concentration for
Field 4
2.08
0.55
0.70
0.07
8.4
227.0
1150.0
304.0
11.0
74.0
1120.0
land application.
Limit1
85
3000
4300
840
75
420
7500
The biosolids applied comply with the maximum constituent limits contained in the Colorado
Biosolids Regulation (CDPHE, 1993) and in federal regulations at 40 CFR Part 503 (USEPA,
1992) for land application of biosolids. Both regulations establish a two tiered system of
concentration limits. Biosolids which comply with the more stringent set of limitations
(Colorado Grade I or federal Table 3 standards) have fewer restrictions placed upon their use.
2-2
image:
 The New York biosolids met the more stringent state and federal concentration limits with the
exception of lead which periodically exceeded the Grade I limit of 300 mg/kg. Nonetheless, all
lead analyses fell well within the regulatory maximum lead concentration for land application
of 840 mg/kg.
Four fields were identified which had received biosolids during that period and which were
seeded in winter wheat (Triticum aestivum sp.) during the fall of 1993. Winter wheat cultivation
in Colorado is practiced using a dryland summer fallow system. The crop is sown in the fall
months and harvested the following spring. The land then remains fallow for approximately
eighteen months, allowing precipitation to replenish the soil moisture. Biosolids application may
take place at any point within the fallow period.
Each field was paired with a field which had received applications of anhydrous ammonia prior
to seeding with whiter wheat. Soils at each site are predominantly Wiley silt loam. Each set of
paired fields was selected based upon the proximity of the paired fields, wheat cultivar, and
cultural practices (each set of paired plots was farmed by the same individual producer).
Biosolids application rates (Table 2) were determined for each field based upon background soil
nitrogen concentration and percent organic matter content (Follett, et al., 1991).
Yield data, soil, grain and straw samples were collected at harvest in June, 1994. Yield data was
determined by combine harvesting of 1.2 X 15.2 meter (4 X 50 foot) plots (Table 2). Soil, grain
and straw samples were collected from 7.9 X 30.5 meter (26 X 100 foot) plots located within
each set of paired fields. Three individual grain, straw and soil samples were collected from each
plot. All samples were analyzed by the Colorado Soil Testing Lab, Colorado State University.
Soil samples were collected from the uppermost 30.5 centimeters (12 inches). Soil sampling
results are reported in Table 3. Results of grain and straw analyses are given in Table 4.
Table 2. Effects of biosolids and anhydrous ammonia on yield and protein content
of wheat grain.
Biosolids applied Anhvdrous aoolied
application
Fields rate1
1
2
3
4
1 Metric tonnes/hectare
2 Bushels/acre
3%
5.0
2.2
3.1
2.4
yield2
34.3
27.0
42.3
47.3
protein
content3 yield2
18.9
14.4
15.0
15.6
protein
content3
33.6 18.1
31.7 15.0
41.8 14.8
43.5 15.3
2-3
image:
The New York biosolids met the more stringent state and federal concentration limits with the
exception of lead which periodically exceeded the Grade I limit of 300 mg/kg. Nonetheless, all
lead analyses fell well within the regulatory maximum lead concentration for land application
of 840 mg/kg.
Four fields were identified which had received biosolids during that period and which were
seeded in winter wheat (Triticum aestivum sp.) during the fall of 1993. Winter wheat cultivation
in Colorado is practiced using a dryland summer fallow system. The crop is sown in the fall
months and harvested the following spring. The land then remains fallow for approximately
eighteen months, allowing precipitation to replenish the soil moisture. Biosolids application may
take place at any point within the fallow period.
Each field was paired with a field which had received applications of anhydrous ammonia prior
to seeding with whiter wheat. Soils at each site are predominantly Wiley silt loam. Each set of
paired fields was selected based upon the proximity of the paired fields, wheat cultivar, and
cultural practices (each set of paired plots was farmed by the same individual producer).
Biosolids application rates (Table 2) were determined for each field based upon background soil
nitrogen concentration and percent organic matter content (Follett, et al., 1991).
Yield data, soil, grain and straw samples were collected at harvest in June, 1994. Yield data was
determined by combine harvesting of 1.2 X 15.2 meter (4 X 50 foot) plots (Table 2). Soil, grain
and straw samples were collected from 7.9 X 30.5 meter (26 X 100 foot) plots located within
each set of paired fields. Three individual grain, straw and soil samples were collected from each
plot. All samples were analyzed by the Colorado Soil Testing Lab, Colorado State University.
Soil samples were collected from the uppermost 30.5 centimeters (12 inches). Soil sampling
results are reported in Table 3. Results of grain and straw analyses are given in Table 4.
Table 2. Effects of biosolids and anhydrous ammonia on yield and protein content
of wheat grain.
Biosolids applied Anhvdrous aoolied
application
Fields rate1
1
2
3
4
1 Metric tonnes/hectare
2 Bushels/acre
3%
5.0
2.2
3.1
2.4
yield2
34.3
27.0
42.3
47.3
protein
content3 yield2
18.9
14.4
15.0
15.6
protein
content3
33.6 18.1
31.7 15.0
41.8 14.8
43.5 15.3
2-3
image:
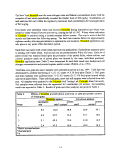 Table 3. Effects
of biosolids and anhydrous ammonia on elemental
composition of
soil at harvest.
Parameter1
K
P
Cd
Cu
Cr
Fe
Pb
Mo
Ni
Zn
Biosolids
total2
7616.9
663.9
1.2
19.3
11.7
22283.9
9.2
0.5
15.2
63.5
applied
available3
841.5
6.0
0.1
4.6
0.2
5.1
2.2
0.1
0.8
0.8
Anhvdrous
total2
6662.3
672.3
1.2
17.1
10.7
21242.3
8.8
0.5
14.3
56.9
applied
available3
788.1
4.1
0.1
3.5
0.2
3.9
1.7
0.1
0.7
0.4
1 mg/kg
2 HNO3-HCIO4
3 AB-DBTA extraction
Results and Discussion
Grain yields for the four paired fields are presented in Table 2. Although fields to which
biosolids had been applied exhibited higher yields in three of the four paired sets of fields, no
significant yield response was indicated. Lerch et al. (1990), and Barbarick et al. (1992) report
that dryland hard red winter wheat yield does not typically vary to a significant degree between
experimental plots fertilized with commercial nitrogen fertilizer and biosolids applied plots.
Both commercial nitrogen fertilizer and biosolids applied at agronomic rates (6.7 metric
tons/hectare or 3.0 tons/acre) will consistently result in higher yields when compared to non-
fertilized control plots (Barbarick et al., 1992).
Grain protein contents for the four paired fields are also presented in Table 2. Protein content
was greater in grain harvested from the biosolids treatment in three of the four paired sets of
fields. Grain protein was higher for the biosolids applied fields in the same three sets of paired
fields which experienced greater yields. As with the yield data, however, no significant
difference was found between the biosolids treatment and the anhydrous ammonia treatment.
Studies conducted at the Bennett, Colorado site (Lerch et al., 1990b, Barbarick et al., 1992)
indicate a linear relation between increased wheat grain protein content and increased biosolids
2-4
image:
Table 3. Effects
of biosolids and anhydrous ammonia on elemental
composition of
soil at harvest.
Parameter1
K
P
Cd
Cu
Cr
Fe
Pb
Mo
Ni
Zn
Biosolids
total2
7616.9
663.9
1.2
19.3
11.7
22283.9
9.2
0.5
15.2
63.5
applied
available3
841.5
6.0
0.1
4.6
0.2
5.1
2.2
0.1
0.8
0.8
Anhvdrous
total2
6662.3
672.3
1.2
17.1
10.7
21242.3
8.8
0.5
14.3
56.9
applied
available3
788.1
4.1
0.1
3.5
0.2
3.9
1.7
0.1
0.7
0.4
1 mg/kg
2 HNO3-HCIO4
3 AB-DBTA extraction
Results and Discussion
Grain yields for the four paired fields are presented in Table 2. Although fields to which
biosolids had been applied exhibited higher yields in three of the four paired sets of fields, no
significant yield response was indicated. Lerch et al. (1990), and Barbarick et al. (1992) report
that dryland hard red winter wheat yield does not typically vary to a significant degree between
experimental plots fertilized with commercial nitrogen fertilizer and biosolids applied plots.
Both commercial nitrogen fertilizer and biosolids applied at agronomic rates (6.7 metric
tons/hectare or 3.0 tons/acre) will consistently result in higher yields when compared to non-
fertilized control plots (Barbarick et al., 1992).
Grain protein contents for the four paired fields are also presented in Table 2. Protein content
was greater in grain harvested from the biosolids treatment in three of the four paired sets of
fields. Grain protein was higher for the biosolids applied fields in the same three sets of paired
fields which experienced greater yields. As with the yield data, however, no significant
difference was found between the biosolids treatment and the anhydrous ammonia treatment.
Studies conducted at the Bennett, Colorado site (Lerch et al., 1990b, Barbarick et al., 1992)
indicate a linear relation between increased wheat grain protein content and increased biosolids
2-4
image:
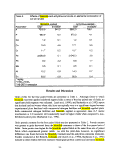 and commercial nitrogen application rates. Barbarick reports consistently higher protein content
in wheat cultivated on biosolids applied soils over crops fertilized with commercial nitrogen
fertilizers (Barbarick et al., 1992).
Review of the biosolids application data for the individual fields (Table 2) reveals that the three
fields which exhibited higher yields and protein contents than the corresponding, anhydrous
treated fields received higher whole biosolids applications than the paired field set where the
anhydrous application resulted in a higher yield and grain protein content. The biosolids
application rate was determined for each field based upon the plant available nitrogen content
of the biosolids at the time of biosolids application, and the residual nitrogen (as nitrate)
available in the soil and the soil organic matter content prior to biosolids application. Thus, the
biosolids application rates were adjusted so that the amount of plant available nitrogen was
similar for each field. Biosolids contain significant amounts of phosphorus and plant micro-
nutrients: copper, iron, and zinc (Table 1). The application of these constituents at the greater
biosolids application rates ranges from 109 to 227 percent of those added at the lowest biosolids
application rate.
The addition of macro- or micro-nuliients other than nitrogen, either individually or in
combination, may be responsible for the observed differences in yield and protein content. The
total (HN03-HC104 extractable) and plant available (AB-DPTA extractable) elements in the soil
at harvest indicates generally higher soil concentrations of both constituent forms in the biosolids
applied soils when compared to those fields receiving the anhydrous ammonia treatment (Table
3). Any differences, however, are not statistically significant. Long term biosolids application,
at application rates ranging from 6.7 to 40.4 metric tonnes per hectare (3.0 to 18.0 short
tons/acre) per cropping cycle has been shown to result in significantly increased soil
concentrations of both total and available forms of zinc and copper as well as other metals (Lerch
et al., 1990a, Barbarick et al., 1992). Continued biosolids application may show significant
increases in soil concentrations of micro-nutrients and other elements.
Analyses of grain (Table 4) indicated that the concentration of several micro-nutrients present
in greater concentration in the biosolids (iron and zinc) were higher in the crops raised on
biosolids amended soils. Several other elements were present in higher concentration in the
grain cultivated on anhydrous applied sites. No statistically significant difference between
elemental grain content for crops cultivated on the biosolids applied as opposed to those raised
on the anhydrous applied fields was observed. Elemental analyses of wheat straw also indicated
higher concentrations of iron and zinc for biosolids fertilized crops. Like the grain samples,
however, no statistically significant difference was observed for those elements or for any other
elements analyzed. Barbarick et al. (1993) reported significantly higher concentrations of copper
and zinc in grain cultivated on biosolids applied plots when compared to control plots,
particularly at higher (26.9 metric tonnes/hectare or 12 short tons/acre) biosolids application
rates. Significant differences were not consistently found at lower (6.7 metric tonnes/hectare or
3.0 short tons/acre) application rates. The concentrations of all of the elements analyzed, in both
grain and straw, were well below levels which could represent a potential hazard to livestock or
humans. This is consistent with results reported by Barbarick et al, (1993).
2-5
image:
and commercial nitrogen application rates. Barbarick reports consistently higher protein content
in wheat cultivated on biosolids applied soils over crops fertilized with commercial nitrogen
fertilizers (Barbarick et al., 1992).
Review of the biosolids application data for the individual fields (Table 2) reveals that the three
fields which exhibited higher yields and protein contents than the corresponding, anhydrous
treated fields received higher whole biosolids applications than the paired field set where the
anhydrous application resulted in a higher yield and grain protein content. The biosolids
application rate was determined for each field based upon the plant available nitrogen content
of the biosolids at the time of biosolids application, and the residual nitrogen (as nitrate)
available in the soil and the soil organic matter content prior to biosolids application. Thus, the
biosolids application rates were adjusted so that the amount of plant available nitrogen was
similar for each field. Biosolids contain significant amounts of phosphorus and plant micro-
nutrients: copper, iron, and zinc (Table 1). The application of these constituents at the greater
biosolids application rates ranges from 109 to 227 percent of those added at the lowest biosolids
application rate.
The addition of macro- or micro-nuliients other than nitrogen, either individually or in
combination, may be responsible for the observed differences in yield and protein content. The
total (HN03-HC104 extractable) and plant available (AB-DPTA extractable) elements in the soil
at harvest indicates generally higher soil concentrations of both constituent forms in the biosolids
applied soils when compared to those fields receiving the anhydrous ammonia treatment (Table
3). Any differences, however, are not statistically significant. Long term biosolids application,
at application rates ranging from 6.7 to 40.4 metric tonnes per hectare (3.0 to 18.0 short
tons/acre) per cropping cycle has been shown to result in significantly increased soil
concentrations of both total and available forms of zinc and copper as well as other metals (Lerch
et al., 1990a, Barbarick et al., 1992). Continued biosolids application may show significant
increases in soil concentrations of micro-nutrients and other elements.
Analyses of grain (Table 4) indicated that the concentration of several micro-nutrients present
in greater concentration in the biosolids (iron and zinc) were higher in the crops raised on
biosolids amended soils. Several other elements were present in higher concentration in the
grain cultivated on anhydrous applied sites. No statistically significant difference between
elemental grain content for crops cultivated on the biosolids applied as opposed to those raised
on the anhydrous applied fields was observed. Elemental analyses of wheat straw also indicated
higher concentrations of iron and zinc for biosolids fertilized crops. Like the grain samples,
however, no statistically significant difference was observed for those elements or for any other
elements analyzed. Barbarick et al. (1993) reported significantly higher concentrations of copper
and zinc in grain cultivated on biosolids applied plots when compared to control plots,
particularly at higher (26.9 metric tonnes/hectare or 12 short tons/acre) biosolids application
rates. Significant differences were not consistently found at lower (6.7 metric tonnes/hectare or
3.0 short tons/acre) application rates. The concentrations of all of the elements analyzed, in both
grain and straw, were well below levels which could represent a potential hazard to livestock or
humans. This is consistent with results reported by Barbarick et al, (1993).
2-5
image:
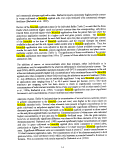 Table 4.
Effects
content
of biosolids and anhydrous
of wheat grain and straw.
Biosolids aDDlie&hhvdrous
Parameter1
N,%
P
Cd
Cr
Cu
Fe
Pb
Mo
Ni
Zn
wheat
2.9
2984.0
0.5
0.6
5.9
44.7
2.5
0.6
1.8
23.6
straw
0.3
230.4
1.8
0.5
2.3
76.7
2.5
0.5
0.6
3.8
applied
wheat
2.5
2815.0
0.5
0.7
6.1
40.6
2.7
1.1
1.5
22.4
ammonia on elemental
straw
0.3
244.2
0.6
0.5
2.1
73.4
2.5
1.1
1.0
3.7
1 ppm except as noted
Conclusions
Land application of biosolids to dryland winter wheat fields in southeastern Colorado may result
in increased grain yield and grain protein content when compared to commercially available
anhydrous ammonia. These increases are possibly due to elements present in the biosolids and
subsequently available hi the soil following biosolids application which are crop micro-nutrients.
The addition of heavy metals in the biosolids, at application rates limited by agronomic crop
requirements, did not result in significantly higher concentrations of those parameters in either
grain or straw.
2-6
image:
Table 4.
Effects
content
of biosolids and anhydrous
of wheat grain and straw.
Biosolids aDDlie&hhvdrous
Parameter1
N,%
P
Cd
Cr
Cu
Fe
Pb
Mo
Ni
Zn
wheat
2.9
2984.0
0.5
0.6
5.9
44.7
2.5
0.6
1.8
23.6
straw
0.3
230.4
1.8
0.5
2.3
76.7
2.5
0.5
0.6
3.8
applied
wheat
2.5
2815.0
0.5
0.7
6.1
40.6
2.7
1.1
1.5
22.4
ammonia on elemental
straw
0.3
244.2
0.6
0.5
2.1
73.4
2.5
1.1
1.0
3.7
1 ppm except as noted
Conclusions
Land application of biosolids to dryland winter wheat fields in southeastern Colorado may result
in increased grain yield and grain protein content when compared to commercially available
anhydrous ammonia. These increases are possibly due to elements present in the biosolids and
subsequently available hi the soil following biosolids application which are crop micro-nutrients.
The addition of heavy metals in the biosolids, at application rates limited by agronomic crop
requirements, did not result in significantly higher concentrations of those parameters in either
grain or straw.
2-6
image:
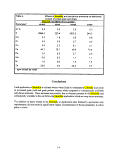 References
Barbarick, K. A., RN. Lerch, J. M. Utschig, D. G. Westfall, R. H. Follett, J. Ippolite, R. Jepson,
and T. M McBride. 1992. Eight years of application of sewage sludge to dryland winter wheat.
Technical Bulletin TB92-1, Colorado State University, Department of Agronomy, Cooperative
Extension Service. Fort Collins, CO.
Colorado Department of Public Health and Environment, Water Quality Control Division. 1993.
Biosolids Regulation. Denver, CO.
Follett, R. H., P. N. Soltanpour, D. G. Westfall, andJ. R. Self. 1991. Guide to fertilizer
recommendations in Colorado. XMC-37. Colorado State University, Department of Agronomy,
Cooperative Extension Service. Fort Collins, CO.
Lerch, R.N., K. A. Barbarick, D. G. Westfall, R. H. Follett, T. M McBride, and F. W. Owen.
1990a. Sustainable rates of sewage sludge for dryland winter wheat production: I. Soil nitrogen
and heavy metals. J. Prod. Agric. 3(l):60-65.
Lerch, R.N., K. A. Barbarick, D. G. Westfall, R. H. Follett, T. M McBride, and F. W. Owen.
1990b. Sustainable rates of sewage sludge for dryland winter wheat production: II. Production
and income. J. Prod. Agric. 3(1):66-71.
Logan T. J., R. L. Chancy, 1983. Utilization of municipal wastewater and sewage sludge on
land-metals, p. 235-323. In A. L. Page (ed.) Proc. 1983 Workshop on utilization of municipal
wastewater and sewage sludge on land, Denver, CO. January. University of California,
Riverside.
U. S. Environmental Protection Agency. 1983. Land application of municipal sludge. EPA
625/1-83-016. Office of Research and Development, Municipal Environ. Res. Lab. Cincinnati,
OH.
U. S. Environmental Protection Agency. 1989. Standards for the Disposal of Sewage Sludge;
Proposed Rule. Federal Register 54(23):5746-5902.
U. S. Environmental Protection Agency. 1992. Standards for the Disposal of Sewage Sludge;
Final Rules. Federal Register 58(32):9248-9415.
2-7
image:
References
Barbarick, K. A., RN. Lerch, J. M. Utschig, D. G. Westfall, R. H. Follett, J. Ippolite, R. Jepson,
and T. M McBride. 1992. Eight years of application of sewage sludge to dryland winter wheat.
Technical Bulletin TB92-1, Colorado State University, Department of Agronomy, Cooperative
Extension Service. Fort Collins, CO.
Colorado Department of Public Health and Environment, Water Quality Control Division. 1993.
Biosolids Regulation. Denver, CO.
Follett, R. H., P. N. Soltanpour, D. G. Westfall, andJ. R. Self. 1991. Guide to fertilizer
recommendations in Colorado. XMC-37. Colorado State University, Department of Agronomy,
Cooperative Extension Service. Fort Collins, CO.
Lerch, R.N., K. A. Barbarick, D. G. Westfall, R. H. Follett, T. M McBride, and F. W. Owen.
1990a. Sustainable rates of sewage sludge for dryland winter wheat production: I. Soil nitrogen
and heavy metals. J. Prod. Agric. 3(l):60-65.
Lerch, R.N., K. A. Barbarick, D. G. Westfall, R. H. Follett, T. M McBride, and F. W. Owen.
1990b. Sustainable rates of sewage sludge for dryland winter wheat production: II. Production
and income. J. Prod. Agric. 3(1):66-71.
Logan T. J., R. L. Chancy, 1983. Utilization of municipal wastewater and sewage sludge on
land-metals, p. 235-323. In A. L. Page (ed.) Proc. 1983 Workshop on utilization of municipal
wastewater and sewage sludge on land, Denver, CO. January. University of California,
Riverside.
U. S. Environmental Protection Agency. 1983. Land application of municipal sludge. EPA
625/1-83-016. Office of Research and Development, Municipal Environ. Res. Lab. Cincinnati,
OH.
U. S. Environmental Protection Agency. 1989. Standards for the Disposal of Sewage Sludge;
Proposed Rule. Federal Register 54(23):5746-5902.
U. S. Environmental Protection Agency. 1992. Standards for the Disposal of Sewage Sludge;
Final Rules. Federal Register 58(32):9248-9415.
2-7
image:
 image:
 o
'35
in
0)
en
image:
o
'35
in
0)
en
image:
 image:
 The Effect of Biosolids Application on
Native Shortgrass Prairie Vegetation and Soils
Edward F. Redente, Rebecca L. Harris-Pierce, and Kenneth A. Barbarick
Abstract
Three biosolids studies were initiated in 1991 in Larimer County,
applications of sewage sludge of 0,2.5, 5,10,21, and 30 Mg ha' (0,1,2, 5 10,15 tons acre ),
2) single applications of composted sewage sludge of 02 4,14 1and32Mg ha 0 1, 2 6
10 15 tons acre'1), and 3) co-application of three rates of alum (5,11, and 22 Mfe ha ) (2, 5,10
tons ac ™with 10.5 Mg ha" (5 tons acre") of sewage sludge. The goal of this sUidy was to
evaluate the effects of biosolids application on native rangeland soils and vegetation and to
determine if this is a viable recycling method.
The application of sewage sludge increased concentrations of NH4-N and N03-N in£oth^1992
and 1993 at soil depths up to 30 cm (12 in) Electrical conductivity also increased m both ym.
Levels of P Cu Zn, Pb, Cd, Mo, and organic matter increased in the top 8 cm (3 m) of soil in
1993; probably a result of the breakdown of the sewage sludge and incorporation into the soil
surface.
The application of biosolids produced a favorable response in total canopy covervvrtfi perennial
forbs and blue grama (Bouteloua gracilis) showing an increase in 1992. Total ^8™**
biom^ did not exhibit a significant response, but perennial forbs and grasses, especially warm
seal grasses responded with increases in 1992 and 1993. Shrub biomass increased m 1992,
almost entirely because of the favorable response of fringed sage (Artemisia frigidd).
All four dominant species (Bouteloua gracilis, Buchloe ^^^^^^
Artemisia frigida) exhibited increases in tissue concentrations of N, P, and K for both years witn
^^ fa WosolJds application rates. Plant tissue metal concentrations were variable and
remained below phytotoxic and maximum livestock intake levels.
Introduction
The United States produces approximately six million metric tons of municipal sewage sludge
amually (U.S. Environmental Protection Agency 1990). The sludge consists main y_ of
Tdegradeableorganicmatter along wi* significant -T^^TTST^W
sewage sludge contains all nutrient elements essential for plant growth (Melsted 1973 .
Sable qLtities of trace metals are also present, and are possible contaminant, of the sod-
Sma'human food chain. Recycling of sludge in an economically and-—en^y
acceptable manner that maximizes the beneficial aspects, and minimizes the adverse effects,
presents a challenge.
3-1
image:
The Effect of Biosolids Application on
Native Shortgrass Prairie Vegetation and Soils
Edward F. Redente, Rebecca L. Harris-Pierce, and Kenneth A. Barbarick
Abstract
Three biosolids studies were initiated in 1991 in Larimer County,
applications of sewage sludge of 0,2.5, 5,10,21, and 30 Mg ha' (0,1,2, 5 10,15 tons acre ),
2) single applications of composted sewage sludge of 02 4,14 1and32Mg ha 0 1, 2 6
10 15 tons acre'1), and 3) co-application of three rates of alum (5,11, and 22 Mfe ha ) (2, 5,10
tons ac ™with 10.5 Mg ha" (5 tons acre") of sewage sludge. The goal of this sUidy was to
evaluate the effects of biosolids application on native rangeland soils and vegetation and to
determine if this is a viable recycling method.
The application of sewage sludge increased concentrations of NH4-N and N03-N in£oth^1992
and 1993 at soil depths up to 30 cm (12 in) Electrical conductivity also increased m both ym.
Levels of P Cu Zn, Pb, Cd, Mo, and organic matter increased in the top 8 cm (3 m) of soil in
1993; probably a result of the breakdown of the sewage sludge and incorporation into the soil
surface.
The application of biosolids produced a favorable response in total canopy covervvrtfi perennial
forbs and blue grama (Bouteloua gracilis) showing an increase in 1992. Total ^8™**
biom^ did not exhibit a significant response, but perennial forbs and grasses, especially warm
seal grasses responded with increases in 1992 and 1993. Shrub biomass increased m 1992,
almost entirely because of the favorable response of fringed sage (Artemisia frigidd).
All four dominant species (Bouteloua gracilis, Buchloe ^^^^^^
Artemisia frigida) exhibited increases in tissue concentrations of N, P, and K for both years witn
^^ fa WosolJds application rates. Plant tissue metal concentrations were variable and
remained below phytotoxic and maximum livestock intake levels.
Introduction
The United States produces approximately six million metric tons of municipal sewage sludge
amually (U.S. Environmental Protection Agency 1990). The sludge consists main y_ of
Tdegradeableorganicmatter along wi* significant -T^^TTST^W
sewage sludge contains all nutrient elements essential for plant growth (Melsted 1973 .
Sable qLtities of trace metals are also present, and are possible contaminant, of the sod-
Sma'human food chain. Recycling of sludge in an economically and-—en^y
acceptable manner that maximizes the beneficial aspects, and minimizes the adverse effects,
presents a challenge.
3-1
image:
 Most municipal sludge is now disposed of by land application, incineration, landfilling, or
lagooning. Land application, which is the controlled spreading of sewage sludge into or onto
the soil surface, is becoming more popular as a sludge disposal option. Agriculture and mined-
land reclamation efforts have successfully used sludge as a fertilizer and mulch (Berglund, et al
1984; Catroux, et al. 1981; Sopper and Kerr 1979). A New Mexico study on a degraded
grassland showed sewage sludge acted as a fertilizer and organic matter amendment (Fresquez,
et al. 1990a). The study further showed that a one-time surface application of 22.5 to 45 Mg ha'1
(10 to 20 tons acre'1) of anaerobically digested sewage sludge did not lead to contamination of
soil and plant tissue (Fresquez, et al. 1990b, 1991).
In a rangeland study, Fresquez et al. (1990a,b) applied three rates (22.5,45, and 90 Mg ha'1) (10,
20, 40 tons acre"1) of municipal sewage sludge on a degraded, semiarid grassland in New
Mexico. Soil nutrients important to plant growth, including N, P, and K, increased linearly with
the application of sewage sludge. With the exception of organic matter and pH, all other soil
chemical properties, including electrical conductivity, were significantly higher in the 90 Mg ha'1
(40 tons acre'1) sludge treatment than in the unamended control. Organic matter levels did not
change with the application of sludge after one growing season. After two growing seasons
however, they reported higher organic matter levels in the low and intermediate sludge
treatments as compared with the control. Soil pH decreased linearly with the application of
sewage sludge. Total Cd and Pb levels in the soil did not change significantly, while several
micronutrients, such as Cu, Mn, and Zn, increased as a result of sewage sludge application. Low
and intermediate sludge application treatments resulted in higher plant yields than either the
unamended control or the highest sludge application rate. Blue grama, in particular, responded
significantly to the application of sewage sludge, with yields that nearly doubled.
Fresquez et al. (1990a,b) indicated that N, P, K, Cu, Mn, and Zn content of blue grama, galleta
(Hilariajamesii), and bottlebrush squirreltail (Sitanion hystrix) showed a linear increase with
increases in sludge application rate. However, Cd and Pb did not increase with application rate
because of low levels in the sludge itself. Other elements such as Al and especially Fe decreased
with the application of sewage sludge, possibly because of a dilution effect associated with
greater biomass production. Total plant foliar cover also increased linearly with the application
of sewage sludge. The dominant species prior to soil amendments were broom snakeweed
(Gutierrezia sarothrae), blue grama, and galleta. Blue grama density did not change with sludge
amendment. Fendler threeawn (Aristida longisetd), ring muhly (Muhlenbergia torreyf)
bottlebrush squirreltail, and especially broom snakeweed decreased in density with increasing
sludge application rates after the first growing season. These species are generally indicators of
a degraded rangeland and reduction in their densities can be considered an improvement of range
condition.
The goal of our study was to evaluate the effects of sludge application on native rangeland soils
and vegetation and to determine if this is a viable recycling method. Our specific objectives
were to determine the effects on: 1) soil chemical properties, 2) plant species composition and
production, and 3) plant tissue concentrations of nutrients and metals.
3-2
image:
Most municipal sludge is now disposed of by land application, incineration, landfilling, or
lagooning. Land application, which is the controlled spreading of sewage sludge into or onto
the soil surface, is becoming more popular as a sludge disposal option. Agriculture and mined-
land reclamation efforts have successfully used sludge as a fertilizer and mulch (Berglund, et al
1984; Catroux, et al. 1981; Sopper and Kerr 1979). A New Mexico study on a degraded
grassland showed sewage sludge acted as a fertilizer and organic matter amendment (Fresquez,
et al. 1990a). The study further showed that a one-time surface application of 22.5 to 45 Mg ha'1
(10 to 20 tons acre'1) of anaerobically digested sewage sludge did not lead to contamination of
soil and plant tissue (Fresquez, et al. 1990b, 1991).
In a rangeland study, Fresquez et al. (1990a,b) applied three rates (22.5,45, and 90 Mg ha'1) (10,
20, 40 tons acre"1) of municipal sewage sludge on a degraded, semiarid grassland in New
Mexico. Soil nutrients important to plant growth, including N, P, and K, increased linearly with
the application of sewage sludge. With the exception of organic matter and pH, all other soil
chemical properties, including electrical conductivity, were significantly higher in the 90 Mg ha'1
(40 tons acre'1) sludge treatment than in the unamended control. Organic matter levels did not
change with the application of sludge after one growing season. After two growing seasons
however, they reported higher organic matter levels in the low and intermediate sludge
treatments as compared with the control. Soil pH decreased linearly with the application of
sewage sludge. Total Cd and Pb levels in the soil did not change significantly, while several
micronutrients, such as Cu, Mn, and Zn, increased as a result of sewage sludge application. Low
and intermediate sludge application treatments resulted in higher plant yields than either the
unamended control or the highest sludge application rate. Blue grama, in particular, responded
significantly to the application of sewage sludge, with yields that nearly doubled.
Fresquez et al. (1990a,b) indicated that N, P, K, Cu, Mn, and Zn content of blue grama, galleta
(Hilariajamesii), and bottlebrush squirreltail (Sitanion hystrix) showed a linear increase with
increases in sludge application rate. However, Cd and Pb did not increase with application rate
because of low levels in the sludge itself. Other elements such as Al and especially Fe decreased
with the application of sewage sludge, possibly because of a dilution effect associated with
greater biomass production. Total plant foliar cover also increased linearly with the application
of sewage sludge. The dominant species prior to soil amendments were broom snakeweed
(Gutierrezia sarothrae), blue grama, and galleta. Blue grama density did not change with sludge
amendment. Fendler threeawn (Aristida longisetd), ring muhly (Muhlenbergia torreyf)
bottlebrush squirreltail, and especially broom snakeweed decreased in density with increasing
sludge application rates after the first growing season. These species are generally indicators of
a degraded rangeland and reduction in their densities can be considered an improvement of range
condition.
The goal of our study was to evaluate the effects of sludge application on native rangeland soils
and vegetation and to determine if this is a viable recycling method. Our specific objectives
were to determine the effects on: 1) soil chemical properties, 2) plant species composition and
production, and 3) plant tissue concentrations of nutrients and metals.
3-2
image:
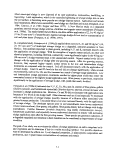 Methods
Experimental Design
The three studies we initiated in 1991 consisted of: 1) single applications of sewage sludge, 2)
single applications of composted sludge, and 3) co-application of alum and sewage sludge. Each
treatment plot measured 15m by 15m (50 ft by 50 ft) The single application of sewage sludge
consisted of 6 treatments including 0,2.5,5,10,21, and 30 Mg ha'1 (0,1,2, 5,10, 15 tons acre"
!). The composted sludge applications had 6 treatments including 0,2,4,14,21, and 32 Mg ha'1
(0,1,2,6,10,15 tons acre"1). The alum and sewage sludge experiment consisted of 10.5 Mg ha"1
(5 tons acre"1) of sewage sludge in combination with application rates of alum of 5,11, and 22
Mg ha"1 (2.5, 5,10 tons acre"1). All treatments for each experiment were replicated four times
in a randomized complete block design. "
Soils data
Baseline soils data were collected prior to the application of sludge. One composite soil sample
(taken from five corings) was obtained from each treatment to a depth of 30 cm (12 in) These
samples were separated into three depths: 0-8 cm (0-3 in), 8-15 cm (3-6 in), and 15-30 cm (6-12
in). Each sample was analyzed for pH, electrical conductivity (Workman et al. 1988), % organic
matter, particle-size distribution, NO3-N and NH4-N (Keeney and Nelson 1982), and total P, K,
Fe, Mn, Cu, Zn, Na, As, Cd, Cr, Pb, Hg, Mo, Ni, and Se. Sampling and analyses were repeated
(except for particle-size distribution) in 1992 and 1993. Nutrient and trace element
concentrations were determined by digesting in 4N HN03 (Bradford, et al. 1975) and using
Inductively Coupled Plasma Optical Emission Spectrometer (ICP).
Vegetation data
The vegetation was sampled in August 1991, July 1992 and July 1993. Each treatment plot was
sampled for cover and aboveground production by species, as well as plant-tissue nutrient and
metal concentrations of the four dominant plant species. Cover measurements by species were
made using the point method involving 50 individual points along a randomly placed transect
and included the amount of ground covered with litter and rock. Aboveground production was
measured by harvesting vegetation occurring within a rectangular 0.5 m2 quadrat placed in a
stratified-random manner.
Plant-tissue samples were taken of the four dominant plant species, blue grama, buffalograss
(Buchloe dactyloides), western wheatgrass, and fringed sage, from each treatment in the three
application studies. Aboveground plant samples were collected, washed hi deionized water,
oven-dried, ground, digested in concentrated nitric acid (Havlin and Soltanpour 1980), and
analyzed for total P, K, Fe, Mn, Cu, Zn, Na, As, Cd, Cr, Pb, Hg, Mo, Ni, and Se using the ICP.
The total N concentration was determined in H2SO4-H2O2 digests (Thomas et al. 1976), by a
Lachat Flow Injector.
Statistics
Vegetation and soil data from 1992 and 1993 for the sewage sludge, compost, and alum sludge
studies were analyzed using a standard randomized complete block analysis (Steel and Torrie
1980). Analysis of variance along with linear and quadratic regressions were performed using
SAS programming language. Parameters were considered significant at P <. 0.05 and r2 ;> 0.4.
3-3
image:
Methods
Experimental Design
The three studies we initiated in 1991 consisted of: 1) single applications of sewage sludge, 2)
single applications of composted sludge, and 3) co-application of alum and sewage sludge. Each
treatment plot measured 15m by 15m (50 ft by 50 ft) The single application of sewage sludge
consisted of 6 treatments including 0,2.5,5,10,21, and 30 Mg ha'1 (0,1,2, 5,10, 15 tons acre"
!). The composted sludge applications had 6 treatments including 0,2,4,14,21, and 32 Mg ha'1
(0,1,2,6,10,15 tons acre"1). The alum and sewage sludge experiment consisted of 10.5 Mg ha"1
(5 tons acre"1) of sewage sludge in combination with application rates of alum of 5,11, and 22
Mg ha"1 (2.5, 5,10 tons acre"1). All treatments for each experiment were replicated four times
in a randomized complete block design. "
Soils data
Baseline soils data were collected prior to the application of sludge. One composite soil sample
(taken from five corings) was obtained from each treatment to a depth of 30 cm (12 in) These
samples were separated into three depths: 0-8 cm (0-3 in), 8-15 cm (3-6 in), and 15-30 cm (6-12
in). Each sample was analyzed for pH, electrical conductivity (Workman et al. 1988), % organic
matter, particle-size distribution, NO3-N and NH4-N (Keeney and Nelson 1982), and total P, K,
Fe, Mn, Cu, Zn, Na, As, Cd, Cr, Pb, Hg, Mo, Ni, and Se. Sampling and analyses were repeated
(except for particle-size distribution) in 1992 and 1993. Nutrient and trace element
concentrations were determined by digesting in 4N HN03 (Bradford, et al. 1975) and using
Inductively Coupled Plasma Optical Emission Spectrometer (ICP).
Vegetation data
The vegetation was sampled in August 1991, July 1992 and July 1993. Each treatment plot was
sampled for cover and aboveground production by species, as well as plant-tissue nutrient and
metal concentrations of the four dominant plant species. Cover measurements by species were
made using the point method involving 50 individual points along a randomly placed transect
and included the amount of ground covered with litter and rock. Aboveground production was
measured by harvesting vegetation occurring within a rectangular 0.5 m2 quadrat placed in a
stratified-random manner.
Plant-tissue samples were taken of the four dominant plant species, blue grama, buffalograss
(Buchloe dactyloides), western wheatgrass, and fringed sage, from each treatment in the three
application studies. Aboveground plant samples were collected, washed hi deionized water,
oven-dried, ground, digested in concentrated nitric acid (Havlin and Soltanpour 1980), and
analyzed for total P, K, Fe, Mn, Cu, Zn, Na, As, Cd, Cr, Pb, Hg, Mo, Ni, and Se using the ICP.
The total N concentration was determined in H2SO4-H2O2 digests (Thomas et al. 1976), by a
Lachat Flow Injector.
Statistics
Vegetation and soil data from 1992 and 1993 for the sewage sludge, compost, and alum sludge
studies were analyzed using a standard randomized complete block analysis (Steel and Torrie
1980). Analysis of variance along with linear and quadratic regressions were performed using
SAS programming language. Parameters were considered significant at P <. 0.05 and r2 ;> 0.4.
3-3
image:
 Results
Soil concentrations of NH4-N and N03-N increased with biosolids (sewage and composted
sludge) application rates in both 1992 and 1993 at all three soil depths (Harris-Pierce 1994).
However, nitrogen concentrations were in general lower in 1993 than in 1992. Electrical
conductivity (EC) also increased at all depths in both years as the application rate increased.
Phosphorus, Cu, Zn, Pb, Cd, Mo, and organic matter all increased with application rate in the
top 8 cm (3 in) of soil in 1993.
Total canopy cover increased in 1992 and 1993 with the application of sewage and composted
sludge (Harris-Pierce 1994) (Figures 1 and 2). This increase was attributable to the addition of
nutrients, particularly N. Perennial forb cover increased with application rates in 1992.
Although forb cover also increased in 1993 the treatments were not significantly different from
the control. Blue grama cover increased in 1992; the reponse in 1993 was generally not as large
as in 1992 and was not significant.
Total biomass did not show a significant response to increases in biosolids application rates
(Figures 1 and 2). There were increases recorded for specific species and lifeforms but not for
overall biomass. As biosolids application rates increased there were corresponding increases in
blue grama (1992 and 1993), western wheatgrass (1993), fringed sagebrush (1992), perennial
forbs (1992 and 1993), and shrubs (1992).
Tissue concentrations of N, P, and K within the four dominant species (western wheatgrass,
fringed sage, blue grama, and buffalograss) increased in 1992 and 1993 as a result of biosolids
application (Harris-Pierce 1994). The plant uptake of other micronutrients and metals varied
among species. The response was not consistent but concentrations remained below phytotoxic
and maximum livestock intake levels.
The addition of alum with sewage sludge produced very little response in soils and vegetation
(Harris-Pierce 1994). Alum applied in this manner did not appear to have any effect, beneficial
or adverse.
Discussion
The application of sewage sludge provides all nutrients required for plant growth, especially N.
Application rates may be dictated by the ability of plants to utilize N and reduce the potential for
N leaching. In addition to the accumulation of N in soils and groundwater, another hazard in
applying sewage sludge to land is the buildup of trace metals in the soil. High concentrations
of trace metals can lead to reduced plant growth and to high metal concentrations in plant tissues
that then enter the food chain.
The organic components of sludge decompose to CO2, water, and residual soil organic matter.
The soluble inorganic constituents are leached away by drainage waters, while insoluble products
accumulate in the soil and become part of the soil matrix. Water percolating through the soil
carries soluble salts, mainly Na, K, Ca, Mg, and NO3. The major exchangeable cations in the
3-4
image:
Results
Soil concentrations of NH4-N and N03-N increased with biosolids (sewage and composted
sludge) application rates in both 1992 and 1993 at all three soil depths (Harris-Pierce 1994).
However, nitrogen concentrations were in general lower in 1993 than in 1992. Electrical
conductivity (EC) also increased at all depths in both years as the application rate increased.
Phosphorus, Cu, Zn, Pb, Cd, Mo, and organic matter all increased with application rate in the
top 8 cm (3 in) of soil in 1993.
Total canopy cover increased in 1992 and 1993 with the application of sewage and composted
sludge (Harris-Pierce 1994) (Figures 1 and 2). This increase was attributable to the addition of
nutrients, particularly N. Perennial forb cover increased with application rates in 1992.
Although forb cover also increased in 1993 the treatments were not significantly different from
the control. Blue grama cover increased in 1992; the reponse in 1993 was generally not as large
as in 1992 and was not significant.
Total biomass did not show a significant response to increases in biosolids application rates
(Figures 1 and 2). There were increases recorded for specific species and lifeforms but not for
overall biomass. As biosolids application rates increased there were corresponding increases in
blue grama (1992 and 1993), western wheatgrass (1993), fringed sagebrush (1992), perennial
forbs (1992 and 1993), and shrubs (1992).
Tissue concentrations of N, P, and K within the four dominant species (western wheatgrass,
fringed sage, blue grama, and buffalograss) increased in 1992 and 1993 as a result of biosolids
application (Harris-Pierce 1994). The plant uptake of other micronutrients and metals varied
among species. The response was not consistent but concentrations remained below phytotoxic
and maximum livestock intake levels.
The addition of alum with sewage sludge produced very little response in soils and vegetation
(Harris-Pierce 1994). Alum applied in this manner did not appear to have any effect, beneficial
or adverse.
Discussion
The application of sewage sludge provides all nutrients required for plant growth, especially N.
Application rates may be dictated by the ability of plants to utilize N and reduce the potential for
N leaching. In addition to the accumulation of N in soils and groundwater, another hazard in
applying sewage sludge to land is the buildup of trace metals in the soil. High concentrations
of trace metals can lead to reduced plant growth and to high metal concentrations in plant tissues
that then enter the food chain.
The organic components of sludge decompose to CO2, water, and residual soil organic matter.
The soluble inorganic constituents are leached away by drainage waters, while insoluble products
accumulate in the soil and become part of the soil matrix. Water percolating through the soil
carries soluble salts, mainly Na, K, Ca, Mg, and NO3. The major exchangeable cations in the
3-4
image:
 100
80
o
O
I
O
60
40
20
0
Total Canopy Cover
iiiii
A
A
1 2 5 10
Treatment (tons/acre)
15
350
300
250
§200
TO
m
150
100
50
0
Total Standing Biomass
AB
AB
A A
AB
01 2 5 10 15
Treatment (tons/acre)
Figure 1. Total canopy cover (%) and total aboveground biomass (g m"1) for sewage
sludge plots for 1992. Bars with different letters indicate significant differences
between treatments at P<0.05.
image:
100
80
o
O
I
O
60
40
20
0
Total Canopy Cover
iiiii
A
A
1 2 5 10
Treatment (tons/acre)
15
350
300
250
§200
TO
m
150
100
50
0
Total Standing Biomass
AB
AB
A A
AB
01 2 5 10 15
Treatment (tons/acre)
Figure 1. Total canopy cover (%) and total aboveground biomass (g m"1) for sewage
sludge plots for 1992. Bars with different letters indicate significant differences
between treatments at P<0.05.
image:
 100 -
80
£
g
o
&.
o
O
60
40
20
Total Canopy Cover
1 2 5 10
Treatment (tons/acre)
15
Total Standing Biomass
350
300
ocr\
2oU
N
§200
</)
(0
ro
|150
m*
100
50
n
-
-
-
-
-
•
BC
J_
C
iiii
lip
t&
Hi
ii:
i
!ii|
C
||
ii
;
|
ABC
rsr.f.
iiiiili
! •;;;•;
l||
iiiii
::!::
iiiiii
III
ii:::
'iiii
liii
A
:::::'
iiiiiii
111
: iiii
iiiii
iiiii
iiip
AB
t',i'.r.
iiiiii
•iiiii
iiiiii
iiiii
iiii i
iiii i
iiiii
iijii
0 12 5
Treatment (tons/acre)
Figure 2. Total canopy cover (%) and total aboveground biomass (g m'1) for sewage
sludge plots for 1993. Bars with different letters indicate significant differences
between treatments at P<0.05.
image:
100 -
80
£
g
o
&.
o
O
60
40
20
Total Canopy Cover
1 2 5 10
Treatment (tons/acre)
15
Total Standing Biomass
350
300
ocr\
2oU
N
§200
</)
(0
ro
|150
m*
100
50
n
-
-
-
-
-
•
BC
J_
C
iiii
lip
t&
Hi
ii:
i
!ii|
C
||
ii
;
|
ABC
rsr.f.
iiiiili
! •;;;•;
l||
iiiii
::!::
iiiiii
III
ii:::
'iiii
liii
A
:::::'
iiiiiii
111
: iiii
iiiii
iiiii
iiip
AB
t',i'.r.
iiiiii
•iiiii
iiiiii
iiiii
iiii i
iiii i
iiiii
iijii
0 12 5
Treatment (tons/acre)
Figure 2. Total canopy cover (%) and total aboveground biomass (g m'1) for sewage
sludge plots for 1993. Bars with different letters indicate significant differences
between treatments at P<0.05.
image:
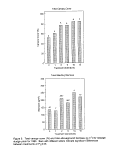 soil are Ca, Mg, Na, and K; their passage through the soil is slowed by the degree to which they
can be retained by exchange sites. Elements of lower solubility include Zn, Cd, Pb, Cu, Ni, Cr,
Hg, Mn, Co, P, As, Se, and Mo. These elements can remain sufficiently soluble under various
soil conditions (depending on pH) and can be available to plants and enter the food chain
(Lindsay 1973).
Increases in soil concentration of the nitrogen species are attributable to the levels added with
the biosolids. Lower levels of NH4-N in 1993 versus 1992 are a result of nitrification to NO3-N
and subsequent leaching through the soil, as evidenced by the higher levels of NO3-N at 15-30
cm (6-12 in) in 1993. Plant uptake and retention of N in living plants and litter in 1992 also
reduced the amount of N available in 1993.- . . _ •
Increases in electrical conductivity probably resulted from salts added with the biosolids. Salts
are added to flocculate and settle solids during wastewater treatment (Dowdy, et al. 1976).
Higher EC at the lower depths is indicative of salts leaching through the soil profile. However,
electrical conductivity remained at levels that were not of concern at all depths for all rates (<1
dS m'1).
Phosphorus and trace metal concentrations were generally higher in 1993 than 1992 because of
break down of the biosolids over time and incorporation into the soil surface. Increases in these
elements in the soil can be attributed to the amounts added with the sewage sludge.
Cover in all treatments, including the control, was lower in 1993 when compared with 1992.
The difference was likely due to climate; 1993 was a cooler, drier year than 1992. An increase
in forb cover was an expected result with additional N, it is not clear, however if this trend will
continue over time. Fresquez et al. (1990a,b) also noted an increase in foliar cover, particularly
for blue grama, with the addition of sewage sludge.
An increase in forb biomass was expected with the addition of N at levels not commonly found
on the shortgrass prairie. Lauenroth, et al. (1978) observed a similar increase in forbs with
addition of N on a semi-arid grassland in eastern Colorado.
Blue grama and fringed sage seemed to take advantage of the additional nitrogen, although the
fringed sage did not respond the second year following application, possibly a result of the
climatic difference between years. Fresquez et al. (1990b) reported that blue grama nearly
doubled in weight with the addition of sewage sludge. Western wheatgrass did not respond the
first year (1992), but showed a marked increase the second year (1993). This may have been
related to cooler temperatures and less competition from warm season species.
Increases in tissue concentrations of N, P, and K were directly attributable to the additional
nutrients provided by the application of sewage sludge. Fresquez, et al. (1991) reported a similar
increase in N, P, and K in blue grama tissue with increases in sewage sludge application rate.
Couillard and Grenier (1989) reported a positive correlation between growth on sludge-amended
soils and the N and P content of plant tissues.
3-7
image:
soil are Ca, Mg, Na, and K; their passage through the soil is slowed by the degree to which they
can be retained by exchange sites. Elements of lower solubility include Zn, Cd, Pb, Cu, Ni, Cr,
Hg, Mn, Co, P, As, Se, and Mo. These elements can remain sufficiently soluble under various
soil conditions (depending on pH) and can be available to plants and enter the food chain
(Lindsay 1973).
Increases in soil concentration of the nitrogen species are attributable to the levels added with
the biosolids. Lower levels of NH4-N in 1993 versus 1992 are a result of nitrification to NO3-N
and subsequent leaching through the soil, as evidenced by the higher levels of NO3-N at 15-30
cm (6-12 in) in 1993. Plant uptake and retention of N in living plants and litter in 1992 also
reduced the amount of N available in 1993.- . . _ •
Increases in electrical conductivity probably resulted from salts added with the biosolids. Salts
are added to flocculate and settle solids during wastewater treatment (Dowdy, et al. 1976).
Higher EC at the lower depths is indicative of salts leaching through the soil profile. However,
electrical conductivity remained at levels that were not of concern at all depths for all rates (<1
dS m'1).
Phosphorus and trace metal concentrations were generally higher in 1993 than 1992 because of
break down of the biosolids over time and incorporation into the soil surface. Increases in these
elements in the soil can be attributed to the amounts added with the sewage sludge.
Cover in all treatments, including the control, was lower in 1993 when compared with 1992.
The difference was likely due to climate; 1993 was a cooler, drier year than 1992. An increase
in forb cover was an expected result with additional N, it is not clear, however if this trend will
continue over time. Fresquez et al. (1990a,b) also noted an increase in foliar cover, particularly
for blue grama, with the addition of sewage sludge.
An increase in forb biomass was expected with the addition of N at levels not commonly found
on the shortgrass prairie. Lauenroth, et al. (1978) observed a similar increase in forbs with
addition of N on a semi-arid grassland in eastern Colorado.
Blue grama and fringed sage seemed to take advantage of the additional nitrogen, although the
fringed sage did not respond the second year following application, possibly a result of the
climatic difference between years. Fresquez et al. (1990b) reported that blue grama nearly
doubled in weight with the addition of sewage sludge. Western wheatgrass did not respond the
first year (1992), but showed a marked increase the second year (1993). This may have been
related to cooler temperatures and less competition from warm season species.
Increases in tissue concentrations of N, P, and K were directly attributable to the additional
nutrients provided by the application of sewage sludge. Fresquez, et al. (1991) reported a similar
increase in N, P, and K in blue grama tissue with increases in sewage sludge application rate.
Couillard and Grenier (1989) reported a positive correlation between growth on sludge-amended
soils and the N and P content of plant tissues.
3-7
image:
 Conclusions
It is apparent from our research and earlier research that the addition of sewage sludge can
produce a beneficial response in a semi-arid rangeland. The addition of nutrients, provided at
reasonable levels, can enhance production and improve range condition as measured by cover
and production of desirable species. Most of the native species, especially blue grama, respond
favorably to the nutrients found in the sewage sludge.
Sewage sludge also contains metals that can build up in the soil and be taken up by plants and
enter the food chain. Low rates of sludge application produced a vegetative response and
although metals showed some increase in soils and plant tissues, concentrations were well below
levels of concern. Previous research has shown that plant availability of sludge-borne metals is
highest during the first year sludge is applied, with declines thereafter. Declines in metal
concentrations are therefore expected in this study over time.
Acknowledgements
This study was funded by the City of Fort Collins and we want to thank especially Tom Gallier
for his support throughout the project. The authors also thank Jim Ippolito for his assistance in
the laboratory and the important contribution he made to the success of this research.
Authors are professor and graduate research assistant, Rangeland Ecosystem
Science Department and professor, Soil and Crop Sciences; Colorado State University, Fort
Collins, CO 80523.
3-8
image:
Conclusions
It is apparent from our research and earlier research that the addition of sewage sludge can
produce a beneficial response in a semi-arid rangeland. The addition of nutrients, provided at
reasonable levels, can enhance production and improve range condition as measured by cover
and production of desirable species. Most of the native species, especially blue grama, respond
favorably to the nutrients found in the sewage sludge.
Sewage sludge also contains metals that can build up in the soil and be taken up by plants and
enter the food chain. Low rates of sludge application produced a vegetative response and
although metals showed some increase in soils and plant tissues, concentrations were well below
levels of concern. Previous research has shown that plant availability of sludge-borne metals is
highest during the first year sludge is applied, with declines thereafter. Declines in metal
concentrations are therefore expected in this study over time.
Acknowledgements
This study was funded by the City of Fort Collins and we want to thank especially Tom Gallier
for his support throughout the project. The authors also thank Jim Ippolito for his assistance in
the laboratory and the important contribution he made to the success of this research.
Authors are professor and graduate research assistant, Rangeland Ecosystem
Science Department and professor, Soil and Crop Sciences; Colorado State University, Fort
Collins, CO 80523.
3-8
image:
 Literature Cited
Berglund, S., R.D. Davis, and P. L'Hermite (eds.). 1984. Utilization of Sewage Sludge on Land:
Rates of Application and Long-term Effects of Metals. D. Reidel Publishing Co.,
Dordrecht, Holland.
Bradford, G.R., A.L. Page, L.J. Lund, and W. Olmstead. 1975. Trace element concentrations
of sewage treatment plant effluents and sludges: Their interactions with soils and uptake
by plants. J. Environ. Qual. 4:123-127.
Catroux, G., P. L'Hermite, and E. Seuss' (eds.). 1981. The Influence of Sewage Sludge
Application on Physical and Biological Properties of Soils. D. Reidel Publishing Co.,
Dordrecht, Holland.
Couillard, D. and Y. Grenier. 1989. Effect of applications of sewage sludge on N, P, K, Ca, Mg,
and trace element contents of plant tissues. The Sci. of the Total Env. 80:113-125.
Dowdy, R.H., R.E. Larson, and E. Epstein. 1976. Sewage sludge and effluent use hi agriculture.
In Land Application of Waste Materials. Soil Conservation Society of America. Ankeny,
Iowa. pp. 13 8-153.
Fresquez, P.R., R.E. Francis, and G.L. Dennis. 1990a. Soil and vegetation responses to sewage
sludge on a degraded semiarid broom snakeweed/blue grama plant community. J. Range
Manage. 43:325-331.
Fresquez, P.R., R.E. Francis, and G.L. Dennis. 1990b. Effects of sewage sludge on soil and
plant quality in a degraded semiarid grassland. J. Environ. Qual. 19:324-329.
Fresquez, P.R., R. Aguilar, R.E. Francis, and E.F. Aldon. 1991. Heavy metal uptake by Blue
grama growing hi a degraded semiarid soil amended with sewage sludge. J. Water, Air,
& Soil Poll. 57-58:903-912.
Harris-Pierce, R.L. 1994. The Effect Of Sewage Sludge Application on Native Rangeland Soils
and Vegetation. Masters thesis Colorado State University, pp.
Havlin, J.L., and P.N. Soltanpour. 1980. A nitric acid plant digest method for use with
inductively coupled plasma spectrometry. Comm. Soil Sci. and Plant Anal. 11:969-980.
Keeney, D. R., and D. W. Nelson. 1982. Nitrogen-Inorganic forms, pp 648-649 In A. L .
Page (ed.) Methods of Soil Analysis, Part 2,2nd edition. Chemical and Microbiological
Properties. American Soc. Agon. Madison, WI.
Lauenroth, W.K., J.L. Dodd, and P.L. Sims. 1978. The effects of water- and nitrogen-induced
stresses on plant community structure in a semi-arid grassland. Oecologia 36:211-222.
3-9
image:
Literature Cited
Berglund, S., R.D. Davis, and P. L'Hermite (eds.). 1984. Utilization of Sewage Sludge on Land:
Rates of Application and Long-term Effects of Metals. D. Reidel Publishing Co.,
Dordrecht, Holland.
Bradford, G.R., A.L. Page, L.J. Lund, and W. Olmstead. 1975. Trace element concentrations
of sewage treatment plant effluents and sludges: Their interactions with soils and uptake
by plants. J. Environ. Qual. 4:123-127.
Catroux, G., P. L'Hermite, and E. Seuss' (eds.). 1981. The Influence of Sewage Sludge
Application on Physical and Biological Properties of Soils. D. Reidel Publishing Co.,
Dordrecht, Holland.
Couillard, D. and Y. Grenier. 1989. Effect of applications of sewage sludge on N, P, K, Ca, Mg,
and trace element contents of plant tissues. The Sci. of the Total Env. 80:113-125.
Dowdy, R.H., R.E. Larson, and E. Epstein. 1976. Sewage sludge and effluent use hi agriculture.
In Land Application of Waste Materials. Soil Conservation Society of America. Ankeny,
Iowa. pp. 13 8-153.
Fresquez, P.R., R.E. Francis, and G.L. Dennis. 1990a. Soil and vegetation responses to sewage
sludge on a degraded semiarid broom snakeweed/blue grama plant community. J. Range
Manage. 43:325-331.
Fresquez, P.R., R.E. Francis, and G.L. Dennis. 1990b. Effects of sewage sludge on soil and
plant quality in a degraded semiarid grassland. J. Environ. Qual. 19:324-329.
Fresquez, P.R., R. Aguilar, R.E. Francis, and E.F. Aldon. 1991. Heavy metal uptake by Blue
grama growing hi a degraded semiarid soil amended with sewage sludge. J. Water, Air,
& Soil Poll. 57-58:903-912.
Harris-Pierce, R.L. 1994. The Effect Of Sewage Sludge Application on Native Rangeland Soils
and Vegetation. Masters thesis Colorado State University, pp.
Havlin, J.L., and P.N. Soltanpour. 1980. A nitric acid plant digest method for use with
inductively coupled plasma spectrometry. Comm. Soil Sci. and Plant Anal. 11:969-980.
Keeney, D. R., and D. W. Nelson. 1982. Nitrogen-Inorganic forms, pp 648-649 In A. L .
Page (ed.) Methods of Soil Analysis, Part 2,2nd edition. Chemical and Microbiological
Properties. American Soc. Agon. Madison, WI.
Lauenroth, W.K., J.L. Dodd, and P.L. Sims. 1978. The effects of water- and nitrogen-induced
stresses on plant community structure in a semi-arid grassland. Oecologia 36:211-222.
3-9
image:
 Lindsay, W.L. 1973. Inorganic reactions of sewage wastes with soils. In Recycling Municipal
Sludges and Effluents on Land. National Association of State Universities and Land-
Grant Colleges. Washington, B.C. pp 91 -96.
Melsted, S.W. 1973. Soil-plant relationships (some practical considerations in waste
management). In Recycling Municipal Sludges and Effluents on Land. National
Association of State Universities and Land-Grant Colleges. Washington, D.C. pp 121-
128.
Sopper, W.E. and S.N. Kerr (eds.). 1979. Utilization of Municipal Sewage Effluent and Sludge
on Forest and Disturbed Land. The Pennsylvania.State University Press, University
Park, Pennsylvania.
Steel, R.G.D., and J.H. Torrie. 1980. Principles and Procedures of Statistics: A Biometrical
Approach. McGraw-Hill Publishing Co., New York.
Thomas, R.L., R.W. Sherd, and J.R. Mayer. 1976. Comparison of conventional and automated
procedures for nitrogen, phosphorus, and potassium analysis of plant materials using a
single digestion. Agron. J. 59:240-243.
United States Environmental Protection Agency. 1990. 40 CFR - Part 503, National sewage
sludge survey: Availability of information and data and anticipated impacts on proposed
regulations. Federal Register, Vol. 55, No. 218, pp. 47210- 47283.
Workman, S.M., P.N. Soltanpour, and R.H. Follett. 1988. Soil testing methods used at
Colorado State University for the evaluation of fertility, salinity, and trace element
toxicity. Agricultural Experiment Station Technical Bulletin LTB88-2. Colorado State
University, Fort Collins, Colorado.
3-10
image:
Lindsay, W.L. 1973. Inorganic reactions of sewage wastes with soils. In Recycling Municipal
Sludges and Effluents on Land. National Association of State Universities and Land-
Grant Colleges. Washington, B.C. pp 91 -96.
Melsted, S.W. 1973. Soil-plant relationships (some practical considerations in waste
management). In Recycling Municipal Sludges and Effluents on Land. National
Association of State Universities and Land-Grant Colleges. Washington, D.C. pp 121-
128.
Sopper, W.E. and S.N. Kerr (eds.). 1979. Utilization of Municipal Sewage Effluent and Sludge
on Forest and Disturbed Land. The Pennsylvania.State University Press, University
Park, Pennsylvania.
Steel, R.G.D., and J.H. Torrie. 1980. Principles and Procedures of Statistics: A Biometrical
Approach. McGraw-Hill Publishing Co., New York.
Thomas, R.L., R.W. Sherd, and J.R. Mayer. 1976. Comparison of conventional and automated
procedures for nitrogen, phosphorus, and potassium analysis of plant materials using a
single digestion. Agron. J. 59:240-243.
United States Environmental Protection Agency. 1990. 40 CFR - Part 503, National sewage
sludge survey: Availability of information and data and anticipated impacts on proposed
regulations. Federal Register, Vol. 55, No. 218, pp. 47210- 47283.
Workman, S.M., P.N. Soltanpour, and R.H. Follett. 1988. Soil testing methods used at
Colorado State University for the evaluation of fertility, salinity, and trace element
toxicity. Agricultural Experiment Station Technical Bulletin LTB88-2. Colorado State
University, Fort Collins, Colorado.
3-10
image:
 Biosolids Fertilization of a Colorado Shrubland
Bonnie L. Pierce, Edward F. Redente, and Kenneth A. Barbarick
Abstract
A study of the effects of municipal biosolids application on a semiarid sagebrush ecosystem was
initiated in July 1991 at Wolcott, Colorado to evaluate the interactions of elemental content of
the biosolids, the soil environment, and the plant community. Under proper management,
millions of hectares of rangeland in the U.S. may benefit from the nutrient and soil building
properties provided by biosolids. This investigation offered one of the first opportunities to
study ecosystem responses of a semiarid shrubland in the western U.S. to biosolids fertilization.
Semiarid shrubland attributes which may present unique challenges to land managers
considering biosolids fertilization include extensive areas of bare ground, naturally occurring
high concentrations of trace elements in soils and plants, steep slopes, immature soils, presence
of deep-rooted accumulator plant species, and spatial and temporal variability in precipitation.
The results of this study indicate that 2 years following a single surface treatment of biosolids,
N and P uptake was enhanced in 3 dominant perennial grasses. Molybdenum and Se
concentrations were significantly decreased with increasing biosolids application rates in 2
perennial grasses and 1 perennial forb, respectively. Additionally, soil pH, EC, N03-N, NH4-N,
and trace element concentrations were unaffected by treatment at rates below 20 Mg biosolids/ha
and no significant changes in plant production, cover, serai stage, or species composition were
identified at any treatment rate 2 years following land application of biosolids.
Keywords: biosolids, shrubland, sagebrush, semiarid, organic fertilizers, nitrate, trace metals
Introduction
The Wolcott, Colorado biosolids study was initiated in July 1991 in a cooperative research effort
between the U.S. Environmental Protection Agency (USEPA), the Colorado Department of
Public Health and Environment (CDPH&E), Colorado State University (CSU), the Bureau of
Land Management (BLM), and the Upper Eagle Valley Consolidated Sanitation District. The
study was conducted on BLM land, located in a cold desert sagebrush community at an elevation
of 2,225 meters. The results from this study were used to evaluate the interactions among the
nutrient content of the biosolids, the soil environment, and the plant community for the
development of appropriate management practices for the beneficial use of biosolids on semiarid
rangelands.
The primary objective of the study was to determine if the application of biosolids had
measurable effects of plant cover and production, plant uptake of metals and nutrients, and the
chemical properties of soils. Specific objectives were to:
3-1
image:
Biosolids Fertilization of a Colorado Shrubland
Bonnie L. Pierce, Edward F. Redente, and Kenneth A. Barbarick
Abstract
A study of the effects of municipal biosolids application on a semiarid sagebrush ecosystem was
initiated in July 1991 at Wolcott, Colorado to evaluate the interactions of elemental content of
the biosolids, the soil environment, and the plant community. Under proper management,
millions of hectares of rangeland in the U.S. may benefit from the nutrient and soil building
properties provided by biosolids. This investigation offered one of the first opportunities to
study ecosystem responses of a semiarid shrubland in the western U.S. to biosolids fertilization.
Semiarid shrubland attributes which may present unique challenges to land managers
considering biosolids fertilization include extensive areas of bare ground, naturally occurring
high concentrations of trace elements in soils and plants, steep slopes, immature soils, presence
of deep-rooted accumulator plant species, and spatial and temporal variability in precipitation.
The results of this study indicate that 2 years following a single surface treatment of biosolids,
N and P uptake was enhanced in 3 dominant perennial grasses. Molybdenum and Se
concentrations were significantly decreased with increasing biosolids application rates in 2
perennial grasses and 1 perennial forb, respectively. Additionally, soil pH, EC, N03-N, NH4-N,
and trace element concentrations were unaffected by treatment at rates below 20 Mg biosolids/ha
and no significant changes in plant production, cover, serai stage, or species composition were
identified at any treatment rate 2 years following land application of biosolids.
Keywords: biosolids, shrubland, sagebrush, semiarid, organic fertilizers, nitrate, trace metals
Introduction
The Wolcott, Colorado biosolids study was initiated in July 1991 in a cooperative research effort
between the U.S. Environmental Protection Agency (USEPA), the Colorado Department of
Public Health and Environment (CDPH&E), Colorado State University (CSU), the Bureau of
Land Management (BLM), and the Upper Eagle Valley Consolidated Sanitation District. The
study was conducted on BLM land, located in a cold desert sagebrush community at an elevation
of 2,225 meters. The results from this study were used to evaluate the interactions among the
nutrient content of the biosolids, the soil environment, and the plant community for the
development of appropriate management practices for the beneficial use of biosolids on semiarid
rangelands.
The primary objective of the study was to determine if the application of biosolids had
measurable effects of plant cover and production, plant uptake of metals and nutrients, and the
chemical properties of soils. Specific objectives were to:
3-1
image:
 1: Determine if plant species composition changed with increasing biosolids application
rates;
2: Ascertain whether total plant foliar cover and herbaceous production increased with
increasing biosolids applications rates;
3: Evaluate total plant tissue concentrations of nutrients and metals with increasing
biosolids application rates, and
4: Determine if soil chemical properties and total concentrations of nutrients and metals
changed with increasing biosolids application rates.
Shrubland Nutrient Requirements
Little information is known about rangeland nutrient requirements because of the wide variety
of rangelands and associated plant species, and because fertilization of rangelands is not a
common practice. Determining nutrient requirements for semiarid shrublands is further
complicated by the spatial variability of many soils and the variability in timing and microscale
distribution of precipitation at some sites (Rickard et. al., 1988). Most research accomplished
to date has focused on the nutrient requirements of specific crops or rangeland species.
Nitrogen is commonly recognized as the most important growth limiting nutrient in most
terrestrial ecosystems (Mengel and Kirkby, 1987). Numerous researchers have reported that
during short periods when soil moisture is adequate, nutrient supply can be limiting to arid and
semiarid ecosystems (James and Jurinak, 1978; Breman and deWit, 1983; and Sturges, 1986).
Burke (1989) in a field experiment on a high elevation sagebrush ecosystem in Wyoming, with
loamy sands and sandy soils, reported that soil N pools varied significantly across the landscape,
with larger N pools associated with higher vegetation cover and downslope and leeward
topographic positions.
The serai position of a plant species may also determine its nutrient requirements. Redente et.
al (1992), under controlled greenhouse conditions, investigated the nutrient response patterns of
5 semiarid plant species common to sagebrush ecosystems. The investigators reported that early
serai species produced more biomass but had lower tissue nutrient concentrations of N and P,
especially at high nutrient levels, while late serai species, in response to low availabilities of N
and P, sequestered nutrients within a smaller amount of biomass. At low nutrient availabilities,
the late serai species demonstrated a competitive advantage in obtaining N and P.
Mengel and Kirkby (1987) provide an example of the amounts of N and P a cool season,
perennial grass typically removes from the soil during one growing season. They reported, as
a general guideline, a nutrient uptake of 66 kg N/ha and 13 kg P/ha to produce a yield of 6,000
kg/ha of common Timothy grass (Phleum pratense) in one growing season (their calculations
are based on the data of Eakin, 1972). Stubbendieck et. al. (1992) list this species as a non-
drought tolerant grass which responds to N fertilization.
A number of factors control nutrient cycling in the soil-plant system. Nutrient input and output
processes have been characterized for many ecosystems, but specific nutrient requirements for
semiarid rangeland systems have not been defined. Nutrient loss by leaching is lower in
semiarid ecosystems due to lower annual precipitation, however, plants need adequate soil
3-2
image:
1: Determine if plant species composition changed with increasing biosolids application
rates;
2: Ascertain whether total plant foliar cover and herbaceous production increased with
increasing biosolids applications rates;
3: Evaluate total plant tissue concentrations of nutrients and metals with increasing
biosolids application rates, and
4: Determine if soil chemical properties and total concentrations of nutrients and metals
changed with increasing biosolids application rates.
Shrubland Nutrient Requirements
Little information is known about rangeland nutrient requirements because of the wide variety
of rangelands and associated plant species, and because fertilization of rangelands is not a
common practice. Determining nutrient requirements for semiarid shrublands is further
complicated by the spatial variability of many soils and the variability in timing and microscale
distribution of precipitation at some sites (Rickard et. al., 1988). Most research accomplished
to date has focused on the nutrient requirements of specific crops or rangeland species.
Nitrogen is commonly recognized as the most important growth limiting nutrient in most
terrestrial ecosystems (Mengel and Kirkby, 1987). Numerous researchers have reported that
during short periods when soil moisture is adequate, nutrient supply can be limiting to arid and
semiarid ecosystems (James and Jurinak, 1978; Breman and deWit, 1983; and Sturges, 1986).
Burke (1989) in a field experiment on a high elevation sagebrush ecosystem in Wyoming, with
loamy sands and sandy soils, reported that soil N pools varied significantly across the landscape,
with larger N pools associated with higher vegetation cover and downslope and leeward
topographic positions.
The serai position of a plant species may also determine its nutrient requirements. Redente et.
al (1992), under controlled greenhouse conditions, investigated the nutrient response patterns of
5 semiarid plant species common to sagebrush ecosystems. The investigators reported that early
serai species produced more biomass but had lower tissue nutrient concentrations of N and P,
especially at high nutrient levels, while late serai species, in response to low availabilities of N
and P, sequestered nutrients within a smaller amount of biomass. At low nutrient availabilities,
the late serai species demonstrated a competitive advantage in obtaining N and P.
Mengel and Kirkby (1987) provide an example of the amounts of N and P a cool season,
perennial grass typically removes from the soil during one growing season. They reported, as
a general guideline, a nutrient uptake of 66 kg N/ha and 13 kg P/ha to produce a yield of 6,000
kg/ha of common Timothy grass (Phleum pratense) in one growing season (their calculations
are based on the data of Eakin, 1972). Stubbendieck et. al. (1992) list this species as a non-
drought tolerant grass which responds to N fertilization.
A number of factors control nutrient cycling in the soil-plant system. Nutrient input and output
processes have been characterized for many ecosystems, but specific nutrient requirements for
semiarid rangeland systems have not been defined. Nutrient loss by leaching is lower in
semiarid ecosystems due to lower annual precipitation, however, plants need adequate soil
3-2
image:
 moisture to obtain the nutrients from the soil. The lack of continuous vegetation cover in
semiarid regions suggests a lower supply of soil moisture and nutrients. The addition of organic
fertilizers may increase the supply of nutrients to some rangeland species and may improve soil
structure to aid in water and nutrient retention, however, increased nutrient losses may also occur
from leaching, volatilization, and erosion. Because water may be the most limiting growth factor
in semiarid rangelands, simply increasing nutrient supply may be without effect for improving
conditions for plant growth. Alleviating this problem by increasing soil-water retention capacity
through improved soil structure may result in yield increases for forage grasses on semiarid
rangelands.
Biosolids as Fertilizers
The use of municipal biosolids as aN-source is widely recognized for its short-term fertilization
effects (Hall, 1984). With appropriate application rates, plants such as perennial grasses, may
benefit from the long-term slow release of organic-N from biosolids (Hall, 1984). Mengel and
Kirkby (1987) report that the main advantage of slow-release organic-N fertilizers is that a single
application can often be used to meet plant needs.
Most biosolids land application systems have been designed for use with croplands, forests,
drastically disturbed lands (Sopper et al, 1977), and most recently semiarid grasslands (Fresquez
etal, 1989,1990a, 1991, and Harris-Pierce, 1994).
Numerous differences exist between semiarid grasslands and shrublands which could affect
ecosystem responses to land application of biosolids. Besides obvious differences in plant
community composition, semiarid shrublands usually do not have continuous vegetation cover
and have considerable bare ground exposed (Blaisdell et. al., 1982). Sturges (1975) concluded
from his research at the Stratton Sagebrush Hydrology Study Area in Wyoming that increased
sediment movement across soil surfaces can be expected in semiarid shrublands in years with
high snowmelt rates or with intense summer storms that produce overland flow, no matter how
well the watershed is vegetated. This may have important implications for the potential
contamination of surface waters in regions of greater slope.
Current USEPA regulations for biosolids application for beneficial use (Numerical Criteria for
Part 503 Rule) lists pollutant loading limits for 11 trace elements which may be contained in
biosolids and maximum allowable cumulative loading rates. Although natural soil levels of
these metals were considered in establishment of the numerical criteria (USEPA, 1992), certain
land applications may require evaluation of abnormally high levels of these metals in rangeland
soils and the potential for some plant species to accumulate large quantities of metal (e.g., Se)
(Beath et. al., 1939a, 1939b, and 1940) from deeper soil horizons. Upon decomposition of plant
species which accumulate heavy metals, there is potential for increases in plant-available metals
in surface soils which could affect other plant species, e.g., forage plants.
3-3
image:
moisture to obtain the nutrients from the soil. The lack of continuous vegetation cover in
semiarid regions suggests a lower supply of soil moisture and nutrients. The addition of organic
fertilizers may increase the supply of nutrients to some rangeland species and may improve soil
structure to aid in water and nutrient retention, however, increased nutrient losses may also occur
from leaching, volatilization, and erosion. Because water may be the most limiting growth factor
in semiarid rangelands, simply increasing nutrient supply may be without effect for improving
conditions for plant growth. Alleviating this problem by increasing soil-water retention capacity
through improved soil structure may result in yield increases for forage grasses on semiarid
rangelands.
Biosolids as Fertilizers
The use of municipal biosolids as aN-source is widely recognized for its short-term fertilization
effects (Hall, 1984). With appropriate application rates, plants such as perennial grasses, may
benefit from the long-term slow release of organic-N from biosolids (Hall, 1984). Mengel and
Kirkby (1987) report that the main advantage of slow-release organic-N fertilizers is that a single
application can often be used to meet plant needs.
Most biosolids land application systems have been designed for use with croplands, forests,
drastically disturbed lands (Sopper et al, 1977), and most recently semiarid grasslands (Fresquez
etal, 1989,1990a, 1991, and Harris-Pierce, 1994).
Numerous differences exist between semiarid grasslands and shrublands which could affect
ecosystem responses to land application of biosolids. Besides obvious differences in plant
community composition, semiarid shrublands usually do not have continuous vegetation cover
and have considerable bare ground exposed (Blaisdell et. al., 1982). Sturges (1975) concluded
from his research at the Stratton Sagebrush Hydrology Study Area in Wyoming that increased
sediment movement across soil surfaces can be expected in semiarid shrublands in years with
high snowmelt rates or with intense summer storms that produce overland flow, no matter how
well the watershed is vegetated. This may have important implications for the potential
contamination of surface waters in regions of greater slope.
Current USEPA regulations for biosolids application for beneficial use (Numerical Criteria for
Part 503 Rule) lists pollutant loading limits for 11 trace elements which may be contained in
biosolids and maximum allowable cumulative loading rates. Although natural soil levels of
these metals were considered in establishment of the numerical criteria (USEPA, 1992), certain
land applications may require evaluation of abnormally high levels of these metals in rangeland
soils and the potential for some plant species to accumulate large quantities of metal (e.g., Se)
(Beath et. al., 1939a, 1939b, and 1940) from deeper soil horizons. Upon decomposition of plant
species which accumulate heavy metals, there is potential for increases in plant-available metals
in surface soils which could affect other plant species, e.g., forage plants.
3-3
image:
 Methods and Materials
Study Site Description
The study site is located 2 km north of the town of Wolcott, Colorado on BLM land. The
research site closely matches the surrounding land in terms of physical soil properties, slope,
elevation, climatic conditions, and plant communities. The Eagle river, a tributary of the
Colorado river, flows from east to west approximately 1.8 km south of the study site, and a
sanitary area landfill is located directly north of the study site. The average elevation for this
region is 2,225 meters.
Biosolids Characteristics
Biosolid samples from the Upper Eagle Valley wastewater facility were taken from July to
September 1991 prior to their surface application at Wolcott, CO. Analysis of its elemental
content and chemical properties are given in Table 1, and indicates that it meets current USEPA
regulations for application for beneficial use (Numerical Criteria for Part 503 Rule). The
biosolids qualify as "high-quality sludge" (meets the "Alternate Pollutant Limit") indicating that
as long as agronomic rates are applied, there is no time limitation for addition of these biosolids.
Soils and Climate
The soils are primarily of the Tanna-Pinelli complex, 12 to 25% slopes, consisting of fine,
montmorillonitic Aridic Argiborolls and fine, montmorillonitic Borollic Haplargids (SCS, 1992).
Soils of the southeastern portion of the study site include numerous small areas of the Moyerson-
Rock Outcrop complex, which are shallow Ustic Torriorthents (immature soils derived from
shale) (SCS, 1992).
The Wolcott study site soils are extremely heterogeneous. Effective rooting depths range from
25 cm (Moyerson Complex) to 152 cm or deeper (Pinneli soils) (SCS, 1992), and the available
water-holding capacity ranges from very low (Moyerson Complex) to high (Pinneli soils).
Permeability is slow on Tanna soils, and all
soils have a moderate to high hazard of water erosion with rapid runoff during summer
precipitation (SCS, 1992). Extensive areas of bare ground are found at the study site ranging
from 37% bare ground in 1991 to 26% in 1993 on control plots (Pierce, 1994).
The climate in this region is characterized by an average annual precipitation of 330 to 381 mm,
an average annual temperature of 4.4 to 6.7° C, and an average frost-free period of 80 to 90 days
(SCS, 1992). The average seasonal snowfall is 127 to 152 cm with areas of snowpack
accumulating during the winter, depending on topographic position (SCS, 1992).
The wettest year during the study was 1993, although drought conditions existed throughout the
investigation. Climatic data from the weather station at Eagle FAA airport near Wolcott, CO
shows an annual total precipitation of 256 mm in 1991,223 mm in 1992 and 295 mm in 1993.
Additionally, in 1993, the study site received 87 mm more total precipitation from January
through July, than the prior year.
3-4
image:
Methods and Materials
Study Site Description
The study site is located 2 km north of the town of Wolcott, Colorado on BLM land. The
research site closely matches the surrounding land in terms of physical soil properties, slope,
elevation, climatic conditions, and plant communities. The Eagle river, a tributary of the
Colorado river, flows from east to west approximately 1.8 km south of the study site, and a
sanitary area landfill is located directly north of the study site. The average elevation for this
region is 2,225 meters.
Biosolids Characteristics
Biosolid samples from the Upper Eagle Valley wastewater facility were taken from July to
September 1991 prior to their surface application at Wolcott, CO. Analysis of its elemental
content and chemical properties are given in Table 1, and indicates that it meets current USEPA
regulations for application for beneficial use (Numerical Criteria for Part 503 Rule). The
biosolids qualify as "high-quality sludge" (meets the "Alternate Pollutant Limit") indicating that
as long as agronomic rates are applied, there is no time limitation for addition of these biosolids.
Soils and Climate
The soils are primarily of the Tanna-Pinelli complex, 12 to 25% slopes, consisting of fine,
montmorillonitic Aridic Argiborolls and fine, montmorillonitic Borollic Haplargids (SCS, 1992).
Soils of the southeastern portion of the study site include numerous small areas of the Moyerson-
Rock Outcrop complex, which are shallow Ustic Torriorthents (immature soils derived from
shale) (SCS, 1992).
The Wolcott study site soils are extremely heterogeneous. Effective rooting depths range from
25 cm (Moyerson Complex) to 152 cm or deeper (Pinneli soils) (SCS, 1992), and the available
water-holding capacity ranges from very low (Moyerson Complex) to high (Pinneli soils).
Permeability is slow on Tanna soils, and all
soils have a moderate to high hazard of water erosion with rapid runoff during summer
precipitation (SCS, 1992). Extensive areas of bare ground are found at the study site ranging
from 37% bare ground in 1991 to 26% in 1993 on control plots (Pierce, 1994).
The climate in this region is characterized by an average annual precipitation of 330 to 381 mm,
an average annual temperature of 4.4 to 6.7° C, and an average frost-free period of 80 to 90 days
(SCS, 1992). The average seasonal snowfall is 127 to 152 cm with areas of snowpack
accumulating during the winter, depending on topographic position (SCS, 1992).
The wettest year during the study was 1993, although drought conditions existed throughout the
investigation. Climatic data from the weather station at Eagle FAA airport near Wolcott, CO
shows an annual total precipitation of 256 mm in 1991,223 mm in 1992 and 295 mm in 1993.
Additionally, in 1993, the study site received 87 mm more total precipitation from January
through July, than the prior year.
3-4
image:
 Table 1. Biosolid chemical
Valley Sanitation
Chemical Property
PH
EC
Total solids
Volatile solids
Nutrient
Total N
Organic N
NCyN
NH4-N
K
P
Zn
Fe
Cu
Ni
Mo
Al
Cd
Cr
Pb
As
Hg
Se
Ag
properties and nutrient concentrations from the Upper Eagle
District. Baseline data were collected July-September 1991 .
Units
none
ds/m
%
%
%
%
mg/kg
mg/kg
mg/kg
mg/kg
mg/kg
mg/kg
mg/kg
mg/kg
mg/kg
mg/kg
mg/kg
mg/kg
mg/kg
mg/kg
mg/kg
mg/kg
mg/kg
1991
7.7
13.0
28.0
71.8
1.70
1.24
0.159
168
0.44
1.98
1210
1.24
567
14.7
2.92
1.60
4.78
22.1
47.4
3.48
2.71
4.66
37.9
Chemical analyses of baseline soils shows low soil fertility with an estimated 7.6 kg available
N/ha and 5.5 kg available P/ha in the upper soil profile (0-60 cm) in 1991 (Pierce, 1994).
Available soil N includes NO3-N and NH4-N , and available soil P is PO43- measured in baseline
soils and using an assumed soil bulk density of 1.33 g/cm3. Table 2 indicates that 3 trace
elements are found at naturally high levels in baseline soils.
Plant Community
In 1991, perennial grasses, mid-serai shrubs, and big sagebrush (Artemisia tridentata) were the
dominant species at the study site. On a similar sagebrush ecosystem in Colorado, McLendon
and Redente (1990) characterized successional patterns over a 12- year period showing that this
3-5
image:
Table 1. Biosolid chemical
Valley Sanitation
Chemical Property
PH
EC
Total solids
Volatile solids
Nutrient
Total N
Organic N
NCyN
NH4-N
K
P
Zn
Fe
Cu
Ni
Mo
Al
Cd
Cr
Pb
As
Hg
Se
Ag
properties and nutrient concentrations from the Upper Eagle
District. Baseline data were collected July-September 1991 .
Units
none
ds/m
%
%
%
%
mg/kg
mg/kg
mg/kg
mg/kg
mg/kg
mg/kg
mg/kg
mg/kg
mg/kg
mg/kg
mg/kg
mg/kg
mg/kg
mg/kg
mg/kg
mg/kg
mg/kg
1991
7.7
13.0
28.0
71.8
1.70
1.24
0.159
168
0.44
1.98
1210
1.24
567
14.7
2.92
1.60
4.78
22.1
47.4
3.48
2.71
4.66
37.9
Chemical analyses of baseline soils shows low soil fertility with an estimated 7.6 kg available
N/ha and 5.5 kg available P/ha in the upper soil profile (0-60 cm) in 1991 (Pierce, 1994).
Available soil N includes NO3-N and NH4-N , and available soil P is PO43- measured in baseline
soils and using an assumed soil bulk density of 1.33 g/cm3. Table 2 indicates that 3 trace
elements are found at naturally high levels in baseline soils.
Plant Community
In 1991, perennial grasses, mid-serai shrubs, and big sagebrush (Artemisia tridentata) were the
dominant species at the study site. On a similar sagebrush ecosystem in Colorado, McLendon
and Redente (1990) characterized successional patterns over a 12- year period showing that this
3-5
image:
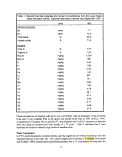 combination of plant species indicates an ecosystem at some point between a mid to late serai
stage. The six dominant species are western wheatgrass, bluebunch wheatgrass (Agropyron
spicatum), Indian ricegras.? (Oryzopsis hymenoides), pulse milkvetch (Astragalus tenellus), big
sagebrush (Artemisia tridentatd), and Douglas rabbitbr«s/z (Chrysothamnus viscidifloms).
Experimental Design
The experimental design for this study consisted of a randomized, complete block design with
nine treatments. Each treatment was a single surface application of biosolids from the Upper
Eagle Valley Consolidated Sanitation District at the following rates: 5,10,15,20,25, 30, 35,
and 40 Mg/ha. The dimensions of each treatment measured approximately 31 by 107 meters and
were replicated four times.
Sampling Procedures
We collected baseline soils data in July 1991, prior to biosolids application, to a depth of 180 cm
with a deep core-
Table 2. Comparison of soil nutrient and metal concentrations at different soil depths in
1991 (controls) to normal and critical soil levels (potential for phytotoxicity or
zootoxicity) (based on Mengel and Kirkby, 1987 and USEPA, 1992).
Elements
Normal Soil Levels
Critical Soil Levels
(potential for phyto-
toxicity or zoo- toxicity)
USEPA Background Soil
Levels
Study Site Soils
0-30 cm depth
30-60 cm depth
60-90 cm depth
90- 120 cm depth
120-1 80 cm depth
150-1 80 cm depth
Mo
mg/kg
0.6-3.5
100
2.00
10.9
11.7
12.5
10.7
11.1
7.95
Cd
mg/kg
unknown
3
0.20
*6.16
*8.37
*5.71
*5.31
*4.78
*3.34
Zn
mg/kg
50
300
54.0
126
128
115
101
95.8
61
* Exceeds critical soil level
3-6
image:
combination of plant species indicates an ecosystem at some point between a mid to late serai
stage. The six dominant species are western wheatgrass, bluebunch wheatgrass (Agropyron
spicatum), Indian ricegras.? (Oryzopsis hymenoides), pulse milkvetch (Astragalus tenellus), big
sagebrush (Artemisia tridentatd), and Douglas rabbitbr«s/z (Chrysothamnus viscidifloms).
Experimental Design
The experimental design for this study consisted of a randomized, complete block design with
nine treatments. Each treatment was a single surface application of biosolids from the Upper
Eagle Valley Consolidated Sanitation District at the following rates: 5,10,15,20,25, 30, 35,
and 40 Mg/ha. The dimensions of each treatment measured approximately 31 by 107 meters and
were replicated four times.
Sampling Procedures
We collected baseline soils data in July 1991, prior to biosolids application, to a depth of 180 cm
with a deep core-
Table 2. Comparison of soil nutrient and metal concentrations at different soil depths in
1991 (controls) to normal and critical soil levels (potential for phytotoxicity or
zootoxicity) (based on Mengel and Kirkby, 1987 and USEPA, 1992).
Elements
Normal Soil Levels
Critical Soil Levels
(potential for phyto-
toxicity or zoo- toxicity)
USEPA Background Soil
Levels
Study Site Soils
0-30 cm depth
30-60 cm depth
60-90 cm depth
90- 120 cm depth
120-1 80 cm depth
150-1 80 cm depth
Mo
mg/kg
0.6-3.5
100
2.00
10.9
11.7
12.5
10.7
11.1
7.95
Cd
mg/kg
unknown
3
0.20
*6.16
*8.37
*5.71
*5.31
*4.78
*3.34
Zn
mg/kg
50
300
54.0
126
128
115
101
95.8
61
* Exceeds critical soil level
3-6
image:
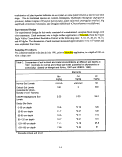 sampling instrument. Samples were taken at depths of 0-30 cm, 30-60 cm, 60-90 cm, 90-120
cm, 120-150 cm, and 150-180 cm. Soils were analyzed for pH, EC, N03-N, NH4-N levels, and
total P, K, Cu, Fe, Mn, Zn, Cd, Pb, Ni, Al, Ti, Mo, Cr, Sr, B, Ba, Ca, Na, and Mg (Pierce, 1994).
We completed follow-up monitoring, one and two years after treatment application, in July 1992
and August 1993. Analysis of the 1992 soils data included pH, EC, and N03-N and NH4-N
levels to a depth of 30 cm. The samples were divided into three depths: 0-10 cm, 10-20 cm, and
20-30 cm. Analysis of the second year (1993) soil samples were the same as the baseline
samples at
the following depths: 0-10 cm, 10-20 cm, 20-30 cm, 30-60 cm, and 60-90 cm.
Biosolid samples from the wastewater facility were taken prior to Jand application at Wolcott,
CO. We analyzed the samples for total P, K, Cu, Fe, Mn, Zn, Cd, Pb, Ni, Al, Ti, Mo, Cr, Sr, B,
Ba, Ca, Na, and Mg, as well as pH, EC, % total solids, % volatile solids, and N03-N and NH4-N
levels (Pierce, 1994). We collected surface biosolid samples in July 1992 from the 40 Mg/ha
treatments and analyzed for total % N, NH4-N, NO3-N, P, K, Cu, Fe, Mn, Zn, Cd, Pb, Ni, Al, Ti,
Mo, Cr, Sr, B, Ba, Ca, Na, and Mg. We again collected surface biosolids samples in August
1993 from the 40 Mg/ha treatments and analyzed for total P, K, Cu, Fe, Mn, Zn, Cd, Pb, Ni, Al,
Ti, Mo, Cr, Sr, B, Ba, Ca, Na, and Mg.
We collected baseline vegetation data on the test plots prior to treatment application. Each
treatment was sampled for canopy cover by species, and each control plot was sampled for
herbaceous production and plant tissue nutrient and metal concentrations.
We measured aboveground herbaceous production by harvesting vegetation by species in
rectangular 0.5 m2 quadrats placed in a stratified-random manner in each treatment. We clipped
all biomass either at ground level or at the point of entry into the quadrat volume. Baseline data
included harvesting 15 quadrats per control treatment across all four blocks. We sampled
aboveground production for all treatments in July 1992 and 1993. In all 3
years, shrub height and canopy width were measured for shrubs situated within the 0.5 m2
quadrats.
We completed baseline cover measurements using the individual point method along randomly
placed transects within each treatment. These measurements included the amount of ground
covered by rock, litter, and live vegetation. We took baseline measurements in all treatments and
included the placement of two 100 point transects per treatment. Measurements for July 1992
and 1993 were the same, except that we sampled four transects per treatment.
Plant tissue samples were taken from each control plot prior to biosolids application and from
all treatments in July 1992 and 1993 to determine nutrient and metal concentrations.
Aboveground plant samples from each of six dominant species were collected, washed in
distilled water, oven-dried at 60° C, ground, digested in concentrated nitric acid, and analyzed
using the ICP for total N, P, K, Ca, Mg, Na, Cu, Fe, Mn, Zn, Cd, Pb, Ni, Al, Ti, Cr, Sr, B, and
Ba.
3-7
image:
sampling instrument. Samples were taken at depths of 0-30 cm, 30-60 cm, 60-90 cm, 90-120
cm, 120-150 cm, and 150-180 cm. Soils were analyzed for pH, EC, N03-N, NH4-N levels, and
total P, K, Cu, Fe, Mn, Zn, Cd, Pb, Ni, Al, Ti, Mo, Cr, Sr, B, Ba, Ca, Na, and Mg (Pierce, 1994).
We completed follow-up monitoring, one and two years after treatment application, in July 1992
and August 1993. Analysis of the 1992 soils data included pH, EC, and N03-N and NH4-N
levels to a depth of 30 cm. The samples were divided into three depths: 0-10 cm, 10-20 cm, and
20-30 cm. Analysis of the second year (1993) soil samples were the same as the baseline
samples at
the following depths: 0-10 cm, 10-20 cm, 20-30 cm, 30-60 cm, and 60-90 cm.
Biosolid samples from the wastewater facility were taken prior to Jand application at Wolcott,
CO. We analyzed the samples for total P, K, Cu, Fe, Mn, Zn, Cd, Pb, Ni, Al, Ti, Mo, Cr, Sr, B,
Ba, Ca, Na, and Mg, as well as pH, EC, % total solids, % volatile solids, and N03-N and NH4-N
levels (Pierce, 1994). We collected surface biosolid samples in July 1992 from the 40 Mg/ha
treatments and analyzed for total % N, NH4-N, NO3-N, P, K, Cu, Fe, Mn, Zn, Cd, Pb, Ni, Al, Ti,
Mo, Cr, Sr, B, Ba, Ca, Na, and Mg. We again collected surface biosolids samples in August
1993 from the 40 Mg/ha treatments and analyzed for total P, K, Cu, Fe, Mn, Zn, Cd, Pb, Ni, Al,
Ti, Mo, Cr, Sr, B, Ba, Ca, Na, and Mg.
We collected baseline vegetation data on the test plots prior to treatment application. Each
treatment was sampled for canopy cover by species, and each control plot was sampled for
herbaceous production and plant tissue nutrient and metal concentrations.
We measured aboveground herbaceous production by harvesting vegetation by species in
rectangular 0.5 m2 quadrats placed in a stratified-random manner in each treatment. We clipped
all biomass either at ground level or at the point of entry into the quadrat volume. Baseline data
included harvesting 15 quadrats per control treatment across all four blocks. We sampled
aboveground production for all treatments in July 1992 and 1993. In all 3
years, shrub height and canopy width were measured for shrubs situated within the 0.5 m2
quadrats.
We completed baseline cover measurements using the individual point method along randomly
placed transects within each treatment. These measurements included the amount of ground
covered by rock, litter, and live vegetation. We took baseline measurements in all treatments and
included the placement of two 100 point transects per treatment. Measurements for July 1992
and 1993 were the same, except that we sampled four transects per treatment.
Plant tissue samples were taken from each control plot prior to biosolids application and from
all treatments in July 1992 and 1993 to determine nutrient and metal concentrations.
Aboveground plant samples from each of six dominant species were collected, washed in
distilled water, oven-dried at 60° C, ground, digested in concentrated nitric acid, and analyzed
using the ICP for total N, P, K, Ca, Mg, Na, Cu, Fe, Mn, Zn, Cd, Pb, Ni, Al, Ti, Cr, Sr, B, and
Ba.
3-7
image:
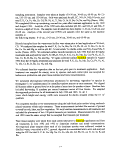 Statistical Analysis
Statistical testing of the data included linear and quadratic regression analyses and analyses of
variance. We used the F test to determine significance at the 0.05 and 0.01 level of probability.
We utilized linear and quadratic regression analyses and analyses of variance of 1992 through
1993 data to determine if any climatic or treatment effects existed for the 2 years following
treatment application. Significant results for regression analyses were based on a least squares
fit of all sample data to account for variation within and between replications. We considered
results as significant for regressions with R2 values :> 0.35 We used the LSD test to determine
means separation between treatments for 1992-1993 analyses of variance.
Results and Discussion
The application of municipal biosolids had measurable effects on the chemical properties of plant
tissues and soils at Wolcott, CO two years following land application, but showed no effect on
plant species composition, and total plant foliar cover and herbaceous production, (Pierce, 1994).
In addition, systematically varying treatment rates enabled us to determine inhibitory biosolids
rates (above 20 Mg/ha) and determine the rates at which plant nutrient needs may have been
exceeded (above 10 Mg/ha).
Nutrient Removal by Plants
The addition of low to moderate levels of N and P from a slow release organic fertilizer, such
as municipal biosolids, to a mid serai sagebrush ecosystem might be predicted to result in a
favorable environment for uptake of these nutrients by the mid serai species. Data indicates that
the 3 dominant perennial grass species, western wheatgrass, bluebunch wheatgrass, and Indian
ricegrass at Wolcott, CO did increase their plant tissue concentrations of N (Figure 1), and
western wheatgrass and Indian ricegrass increased their uptake of P (Figure 2), but did not
produce more biomass with treatment (Pierce, 1994). The nutrient response pattern of late serai
species, typical in sagebrush ecosystems, as reported by Redente et. al. (1992), indicates a
competitive advantage over early serai species in obtaining N and P at low nutrient availabilities.
Late serai species show higher concentrations of N and P in smaller amounts of biomass at lower
nutrient availabilities in contrast to the response of early serai species which produce more
biomass but have lower tissue nutrient concentrations.
The addition of 10 Mg/ha of Upper Eagle Valley municipal biosolids to native soils provides a
total of 66 kg N/ha for plant use (this value includes the available soil NO3-N and NH4-N). This
nutrient level appears to provide a favorable environment for uptake of N and P by the 3
dominant perennial grass species in the first two years following biosolids application. The
increasing quadratic response of N plant tissue levels to increasing biosolids rates for the 2
wheatgrasses (Figure 1) appears to indicate a diminished treatment response at levels above 10
Mg/ha.
3-8
image:
Statistical Analysis
Statistical testing of the data included linear and quadratic regression analyses and analyses of
variance. We used the F test to determine significance at the 0.05 and 0.01 level of probability.
We utilized linear and quadratic regression analyses and analyses of variance of 1992 through
1993 data to determine if any climatic or treatment effects existed for the 2 years following
treatment application. Significant results for regression analyses were based on a least squares
fit of all sample data to account for variation within and between replications. We considered
results as significant for regressions with R2 values :> 0.35 We used the LSD test to determine
means separation between treatments for 1992-1993 analyses of variance.
Results and Discussion
The application of municipal biosolids had measurable effects on the chemical properties of plant
tissues and soils at Wolcott, CO two years following land application, but showed no effect on
plant species composition, and total plant foliar cover and herbaceous production, (Pierce, 1994).
In addition, systematically varying treatment rates enabled us to determine inhibitory biosolids
rates (above 20 Mg/ha) and determine the rates at which plant nutrient needs may have been
exceeded (above 10 Mg/ha).
Nutrient Removal by Plants
The addition of low to moderate levels of N and P from a slow release organic fertilizer, such
as municipal biosolids, to a mid serai sagebrush ecosystem might be predicted to result in a
favorable environment for uptake of these nutrients by the mid serai species. Data indicates that
the 3 dominant perennial grass species, western wheatgrass, bluebunch wheatgrass, and Indian
ricegrass at Wolcott, CO did increase their plant tissue concentrations of N (Figure 1), and
western wheatgrass and Indian ricegrass increased their uptake of P (Figure 2), but did not
produce more biomass with treatment (Pierce, 1994). The nutrient response pattern of late serai
species, typical in sagebrush ecosystems, as reported by Redente et. al. (1992), indicates a
competitive advantage over early serai species in obtaining N and P at low nutrient availabilities.
Late serai species show higher concentrations of N and P in smaller amounts of biomass at lower
nutrient availabilities in contrast to the response of early serai species which produce more
biomass but have lower tissue nutrient concentrations.
The addition of 10 Mg/ha of Upper Eagle Valley municipal biosolids to native soils provides a
total of 66 kg N/ha for plant use (this value includes the available soil NO3-N and NH4-N). This
nutrient level appears to provide a favorable environment for uptake of N and P by the 3
dominant perennial grass species in the first two years following biosolids application. The
increasing quadratic response of N plant tissue levels to increasing biosolids rates for the 2
wheatgrasses (Figure 1) appears to indicate a diminished treatment response at levels above 10
Mg/ha.
3-8
image:
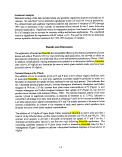 1992
Indian ricegrass
1992
Western wheatgrass
2.5
13
z 3
1.5
R2=0.36
y=1.65+0.44x
4
3.5
3
. *•*.
10 20 30 40
Application Rate (Mg/ha)
50
1993
Bluebunch wheatgrass
0.5'
2.6
£ 2.4
S c
p
o
S
I
2.2
1.8
°- 1.6
1.4
1.2
R2=0.36
y=1.72+0.05x-0.0009x
10 20 30 40 50
Application Rate (Mg/ha)
10 20 30 40 50
Application Rate (Mg/ha)
Figure 1. Plant tissue concentrations of N in 3 dominant, perennial
grasses, one and two years following treatment application.
Data were collected in July 1992 and 1993.
image:
1992
Indian ricegrass
1992
Western wheatgrass
2.5
13
z 3
1.5
R2=0.36
y=1.65+0.44x
4
3.5
3
. *•*.
10 20 30 40
Application Rate (Mg/ha)
50
1993
Bluebunch wheatgrass
0.5'
2.6
£ 2.4
S c
p
o
S
I
2.2
1.8
°- 1.6
1.4
1.2
R2=0.36
y=1.72+0.05x-0.0009x
10 20 30 40 50
Application Rate (Mg/ha)
10 20 30 40 50
Application Rate (Mg/ha)
Figure 1. Plant tissue concentrations of N in 3 dominant, perennial
grasses, one and two years following treatment application.
Data were collected in July 1992 and 1993.
image:
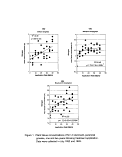 3.5
1992
Western wheatgrass
R =0.42
y=1.21+62.2x
10 20 30 40
Application Rate (Mg/ha)
1993
Western wheatgrass
10 20 30 40 50
Application Rate (Mg/ha)
Phosphorus
Plant Tissue Concentration (gfkg)
1.6
1.4
1.2
1
0.8
0.6
0.4
n o
1993
Indian ricegrass
•
'
••:.;/
• t/^ • •
sj*
' • f R2=0.39
y=0.654+0.03197x
•
I
0
Application Rate (Mg/ha)
Figure 2. Plant tissue concentrations of P in 2 dominant, perennial
grasses, one and two years following treatment application.
Data were collected in July 1992 and 1993.
image:
3.5
1992
Western wheatgrass
R =0.42
y=1.21+62.2x
10 20 30 40
Application Rate (Mg/ha)
1993
Western wheatgrass
10 20 30 40 50
Application Rate (Mg/ha)
Phosphorus
Plant Tissue Concentration (gfkg)
1.6
1.4
1.2
1
0.8
0.6
0.4
n o
1993
Indian ricegrass
•
'
••:.;/
• t/^ • •
sj*
' • f R2=0.39
y=0.654+0.03197x
•
I
0
Application Rate (Mg/ha)
Figure 2. Plant tissue concentrations of P in 2 dominant, perennial
grasses, one and two years following treatment application.
Data were collected in July 1992 and 1993.
image:
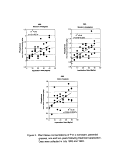 Fate of Elements with More Toxic Effects
Analyses of plant tissue taken from control plots from 1991 to 1993 indicates high levels of Mo
and Cd in 4 of the 6 dominant species at Wolcott, CO (Table 3). Three of the dominant species,
pulse milkvetch, big sagebrush, and Douglas rabbitbrush are unpalatable to most animals
(Stubbendieck, 1992), but may result in increased metal concentrations in upper soil horizons,
as the element is brought up from deeper soils and deposited on surface soils through the
processes of litter fall and decomposition. In this manner Mo may become more available to
other plants, e.g., forage plants.
Trace element concentrations in forage plants which can cause zootoxicity varies with plant
species, animal species, time and length of grazing, and .percent of-animal diet (Church, 1988).
The critical levels cited in Table 3 have been determined based on observations of adverse health
effects in cattle or sheep grazing areas with grasses exceeding these critical levels. Length of
grazing season and percent of diet were not specified in the data of Church (1988).
Table 3. Comparison of tissue nutrient and metal concentrations for four dominant species
from 1991-1993 (controls) to normal, phytotoxic, and zootoxic levels (based on
Logan and Chaney, 1983 and Mengel and Kirkby, 1987).
Element
Mo mg/kg
Normal levels 0.1-0.3
Phytotoxic levels 100
for agronomic crops
Critical levels (may cause zootoxicity if included in diet of 5
animals)
Study Site Plants
Pulse milkvetch -1991 *9.00
Pulse milkvetch-1992 *5.92
Pulse milkvetch-1993 *9.25
Indian ricegrass -1993 *7.26
Cd
mg/kg
Normal levels unknown
Phytotoxic levels 5-10
for agronomic crops
Critical levels (may cause zootoxicity if included in diet of 0.5-1
animals)
Study Site Plants
Big sagebrush-1992 *0.73
Big sagebrush-1993 t *0.61
Doualas rabbitbrush -1992 *0.52
* Exceeds critical levels
3-11
image:
Fate of Elements with More Toxic Effects
Analyses of plant tissue taken from control plots from 1991 to 1993 indicates high levels of Mo
and Cd in 4 of the 6 dominant species at Wolcott, CO (Table 3). Three of the dominant species,
pulse milkvetch, big sagebrush, and Douglas rabbitbrush are unpalatable to most animals
(Stubbendieck, 1992), but may result in increased metal concentrations in upper soil horizons,
as the element is brought up from deeper soils and deposited on surface soils through the
processes of litter fall and decomposition. In this manner Mo may become more available to
other plants, e.g., forage plants.
Trace element concentrations in forage plants which can cause zootoxicity varies with plant
species, animal species, time and length of grazing, and .percent of-animal diet (Church, 1988).
The critical levels cited in Table 3 have been determined based on observations of adverse health
effects in cattle or sheep grazing areas with grasses exceeding these critical levels. Length of
grazing season and percent of diet were not specified in the data of Church (1988).
Table 3. Comparison of tissue nutrient and metal concentrations for four dominant species
from 1991-1993 (controls) to normal, phytotoxic, and zootoxic levels (based on
Logan and Chaney, 1983 and Mengel and Kirkby, 1987).
Element
Mo mg/kg
Normal levels 0.1-0.3
Phytotoxic levels 100
for agronomic crops
Critical levels (may cause zootoxicity if included in diet of 5
animals)
Study Site Plants
Pulse milkvetch -1991 *9.00
Pulse milkvetch-1992 *5.92
Pulse milkvetch-1993 *9.25
Indian ricegrass -1993 *7.26
Cd
mg/kg
Normal levels unknown
Phytotoxic levels 5-10
for agronomic crops
Critical levels (may cause zootoxicity if included in diet of 0.5-1
animals)
Study Site Plants
Big sagebrush-1992 *0.73
Big sagebrush-1993 t *0.61
Doualas rabbitbrush -1992 *0.52
* Exceeds critical levels
3-11
image:
 image:
 E S
I i
S I
t 2
E 1
>-
£
1992
Western wheatgrass
R2=0.43
y=25-0123y
10 20 30 40
Application Rate (Mg/ha)
50
Molybdenum
Tissue Concentrati
1992
Bluebunch wheatgrass
R2=0.
43
y=2.49-0.
10 20 30 40
Application Rate (Mg/ha)
50
i I
•s. °
>, a
O »
1993
Bluebunch wheatgrass
10 20 30 40
Application Rate (Mg/ha)
50
Figure 3. Plant tissue concentrations of Mo in 2 dominant, perennial
grasses, one and two years following treatment application.
Data were collected in July 1992 and 1993.
image:
E S
I i
S I
t 2
E 1
>-
£
1992
Western wheatgrass
R2=0.43
y=25-0123y
10 20 30 40
Application Rate (Mg/ha)
50
Molybdenum
Tissue Concentrati
1992
Bluebunch wheatgrass
R2=0.
43
y=2.49-0.
10 20 30 40
Application Rate (Mg/ha)
50
i I
•s. °
>, a
O »
1993
Bluebunch wheatgrass
10 20 30 40
Application Rate (Mg/ha)
50
Figure 3. Plant tissue concentrations of Mo in 2 dominant, perennial
grasses, one and two years following treatment application.
Data were collected in July 1992 and 1993.
image:
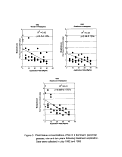 1993
Western wheatgrass
I
I.O
1.6
1.4
1.2
1
0.8
0.6
0.4
0.2
3
2.5
2
1.5
i
I R2=068
y=1.35-0.029x
\
\ .'
V
\
* \
. , *\«
I 10 20 30 40 50
Application Rate (Mg/ha)
1993
Pulse milkvetch
^ * 2
\ R =0.71
\ y=2.89-0.041x
\
x1
• \-
0 10 20 30 40 50
Application Rate (Mg/ha)
Figure 4. Plant tissue concentrations of Se in a dominant, perennial
grasses andperennial forb, one and two years following
treatment application. Data were collected in July 1992
and 1993.
image:
1993
Western wheatgrass
I
I.O
1.6
1.4
1.2
1
0.8
0.6
0.4
0.2
3
2.5
2
1.5
i
I R2=068
y=1.35-0.029x
\
\ .'
V
\
* \
. , *\«
I 10 20 30 40 50
Application Rate (Mg/ha)
1993
Pulse milkvetch
^ * 2
\ R =0.71
\ y=2.89-0.041x
\
x1
• \-
0 10 20 30 40 50
Application Rate (Mg/ha)
Figure 4. Plant tissue concentrations of Se in a dominant, perennial
grasses andperennial forb, one and two years following
treatment application. Data were collected in July 1992
and 1993.
image:
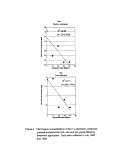 1992
1992
0 10 20 30 40 50
Application Rate (Mg/ha)
10 20 30 40
Application Rate (Mg/ha)
50
1993
1992
10 20 30 40
Application Rate (Mg/ha)
50
I
•o
=5
0
1
o
z
120
100
80
60
40
20
R2=0.42
y=0.95+2.8x
10 20 30 40
Application Rate (Mg/ha)
50
Figure 5. Soil NO^-N and NH^-N at various soil depths one and
two years following treatment application. Data were
collected in July 1992 and 1993.
image:
1992
1992
0 10 20 30 40 50
Application Rate (Mg/ha)
10 20 30 40
Application Rate (Mg/ha)
50
1993
1992
10 20 30 40
Application Rate (Mg/ha)
50
I
•o
=5
0
1
o
z
120
100
80
60
40
20
R2=0.42
y=0.95+2.8x
10 20 30 40
Application Rate (Mg/ha)
50
Figure 5. Soil NO^-N and NH^-N at various soil depths one and
two years following treatment application. Data were
collected in July 1992 and 1993.
image:
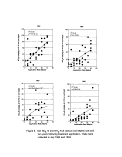 Kabata-Pendias et. al. (1984) report that the species of higher plants that show a tolerance to high
levels of trace elements belong most commonly to the plant families Cruciferae, Gramineae,
Luguminasae, and Chenopodiaceae. Seventeen species from these families are found at the
study site (Pierce, 1994).
The application of biosolids appears to reduce potentially toxic levels of Mo in western
wheatgrass and bluebunch wheatgrass to safer levels in these dominant perennial grasses
(Figure 3). Plant tissue concentrations of Se in western wheatgrass and pulse milkvetch indicates
decreases with an increase in treatment rate at the p <. 0.10 level of significance in 1993 (Figure
4).
The decrease in plant tissue concentrations of Mo in plant tissues of the dominant grasses at
Wolcott, CO with low biosolids application rates (e.g., 10 Mg/ha) is the most striking result of
this study. These perennial grasses provide valuable forage for domestic livestock and wildlife
(Stubbendieck, 1992), and the improvement in plant tissue quality is a favorable result.
Molybdenum is known to cause toxicity when consumed at high levels in the diet of ruminants
(Mengel and Kirkby, 1987), and naturally high levels of this element were measured at the study
site in the dominant grasses. Biosolids treatment may reduce Mo plant tissue concentrations in
dominant species at Wolcott,CO to safer levels for animal consumption.
Biosolids Effects on Soils
The effect of biosolids application on the study site soils are primarily on surface soils one year
following treatment. Application rates above 20 Mg/ha significantly increase soil NO3-N at the
0-10 cm soil depth in 1992 (Figure 5) to levels of potential concern for contamination of surface
waters if significant runoff occurs with intense summer storms or spring snow melt. Soil NH4-N
levels also increased significantly one year following treatment, with increasing application rates,
at the 0-10 cm soil depth (Figure 5).
Two years following treatment, soil NO3-N levels were significantly increased at the 60-90 cm
soil depth (Figure 5) and reached levels of potential concern for leaching into and contaminating
groundwaters only at the 20 Mg/ha treatment rate. The 1993 results, however, indicate very little
overall movement of NO3-N into soils to 90 cm at any other application rate (Pierce, 1994).
Analyses of soil pH and EC, and soil nutrient and metal concentrations indicates these properties
are not significantly affected by biosolids treatment.
Biosolids Application and the Environment
The naturally high levels of Zn found in the soils, and the level of Zn in the Upper Eagle Valley
biosolids, in combination, become the limiting factor for land application of biosolids at
Wolcott, CO. Applied at 10 Mg/ha, and accounting for natural soil Zn concentrations at the
study site, 193 surface applications can be added before USEPA cumulative loading limits are
reached (Pierce, 1994).
The two soil elements of potential concern at the study site are Mo and Cd, because they exist
at naturally high levels in the soil profile (Pierce, 1994). The USEPA Part 503 Rule does not
3-15
image:
Kabata-Pendias et. al. (1984) report that the species of higher plants that show a tolerance to high
levels of trace elements belong most commonly to the plant families Cruciferae, Gramineae,
Luguminasae, and Chenopodiaceae. Seventeen species from these families are found at the
study site (Pierce, 1994).
The application of biosolids appears to reduce potentially toxic levels of Mo in western
wheatgrass and bluebunch wheatgrass to safer levels in these dominant perennial grasses
(Figure 3). Plant tissue concentrations of Se in western wheatgrass and pulse milkvetch indicates
decreases with an increase in treatment rate at the p <. 0.10 level of significance in 1993 (Figure
4).
The decrease in plant tissue concentrations of Mo in plant tissues of the dominant grasses at
Wolcott, CO with low biosolids application rates (e.g., 10 Mg/ha) is the most striking result of
this study. These perennial grasses provide valuable forage for domestic livestock and wildlife
(Stubbendieck, 1992), and the improvement in plant tissue quality is a favorable result.
Molybdenum is known to cause toxicity when consumed at high levels in the diet of ruminants
(Mengel and Kirkby, 1987), and naturally high levels of this element were measured at the study
site in the dominant grasses. Biosolids treatment may reduce Mo plant tissue concentrations in
dominant species at Wolcott,CO to safer levels for animal consumption.
Biosolids Effects on Soils
The effect of biosolids application on the study site soils are primarily on surface soils one year
following treatment. Application rates above 20 Mg/ha significantly increase soil NO3-N at the
0-10 cm soil depth in 1992 (Figure 5) to levels of potential concern for contamination of surface
waters if significant runoff occurs with intense summer storms or spring snow melt. Soil NH4-N
levels also increased significantly one year following treatment, with increasing application rates,
at the 0-10 cm soil depth (Figure 5).
Two years following treatment, soil NO3-N levels were significantly increased at the 60-90 cm
soil depth (Figure 5) and reached levels of potential concern for leaching into and contaminating
groundwaters only at the 20 Mg/ha treatment rate. The 1993 results, however, indicate very little
overall movement of NO3-N into soils to 90 cm at any other application rate (Pierce, 1994).
Analyses of soil pH and EC, and soil nutrient and metal concentrations indicates these properties
are not significantly affected by biosolids treatment.
Biosolids Application and the Environment
The naturally high levels of Zn found in the soils, and the level of Zn in the Upper Eagle Valley
biosolids, in combination, become the limiting factor for land application of biosolids at
Wolcott, CO. Applied at 10 Mg/ha, and accounting for natural soil Zn concentrations at the
study site, 193 surface applications can be added before USEPA cumulative loading limits are
reached (Pierce, 1994).
The two soil elements of potential concern at the study site are Mo and Cd, because they exist
at naturally high levels in the soil profile (Pierce, 1994). The USEPA Part 503 Rule does not
3-15
image:
 restrict application of Upper Eagle Valley biosolids at Wolcott, CO (USEPA, 1992), but suggests
these soil levels be monitored to avoid exceeding maximum allowable pollutant concentrations.
The USEPA used the median background concentrations of metals in agricultural soils to
represent the background soil levels of inorganic biosolids pollutants in their exposure
assessment for determination of numerical criteria (Part 503 Rule) for land application of
biosolids (USEPA, 1992). The exposure assessment cautions that when background soil levels
are significant compared to maximum allowable pollutant concentrations, the allowable
pollutant-loading from biosolids should be reduced (USEPA, 1992). Comparison of soil
concentrations of Mo and Cd from baseline soils (1991) with USEPA pollutant ceilings indicates
that, although these levels are naturally high, they do not represent a significant problem for
biosolids application.
Cadmium can be transported readily from soils via plant roots to upper plant parts and recycled
in the upper soil mantle by plant decomposition. Cadmium is a cumulative metal that can be
stored in the kidneys, liver, and spleen of animals and humans (Mengel and Kirkby, 1987).
Molybedenum concentration above 5 mg/kg in dry matter of forage can be toxic to animals.
Ruminants, in particular, are susceptible to high Mo levels in plant tissue (Mengel and Kirkby,
1987). Excess Mo in the diet appears to interfere with normal Cu absorption and utilization
because Mo is transformed in the rumen to thiomolybdate which binds Cu and prevents Cu
absorption from the intestines, thereby causing the disease molybdenosis (Schrader and Thomas,
1981). Based on naturally high soil Cd and Mo levels at Wolcott, CO, these metals should be
monitored on a long-term basis (i.e., measured 10 years following treatment), if land application
of biosolids continues at this location, to ensure biosolids treatment do not significantly alter soil
Mo or Cd levels and pose a threat to animal or human health.
Conclusions
Application of municipal biosolids at Wolcott, CO after 2 growing seasons has provided an
enriched level of essential nutrients for plant use, and has lowered potentially toxic levels of Mo
plant tissue of 2 of the 6 dominant species at the study site at the 10 Mg/ha application rate. This
low treatment level does not contaminate soils from 0 to a 90 cm depth with excessive levels of
nutrients, metals, or soluble salts.
Little change was found in total or species-level plant cover and aboveground biomass in both
years following treatment with biosolids. No significant shift in serai stage of this semiarid
sagebrush ecosystem was detected with treatment.
We found significant increases in the essential nutrients N and P in 3 of the dominant forage
grasses at the study site in 1992 and 1993. We expectd this increase in plant tissue nutrient
concentration as a result of addition of nutrients from the biosolids.
Most soil chemical properties were not significantly altered at treatment rates below 20 Mg/ha,
at all soil depths to 90 cm, 2 years following biosolids application. Higher treatment rates pose
a potential hazard for contamination of surface waters by NO3-N in the first year following land
3-16
image:
restrict application of Upper Eagle Valley biosolids at Wolcott, CO (USEPA, 1992), but suggests
these soil levels be monitored to avoid exceeding maximum allowable pollutant concentrations.
The USEPA used the median background concentrations of metals in agricultural soils to
represent the background soil levels of inorganic biosolids pollutants in their exposure
assessment for determination of numerical criteria (Part 503 Rule) for land application of
biosolids (USEPA, 1992). The exposure assessment cautions that when background soil levels
are significant compared to maximum allowable pollutant concentrations, the allowable
pollutant-loading from biosolids should be reduced (USEPA, 1992). Comparison of soil
concentrations of Mo and Cd from baseline soils (1991) with USEPA pollutant ceilings indicates
that, although these levels are naturally high, they do not represent a significant problem for
biosolids application.
Cadmium can be transported readily from soils via plant roots to upper plant parts and recycled
in the upper soil mantle by plant decomposition. Cadmium is a cumulative metal that can be
stored in the kidneys, liver, and spleen of animals and humans (Mengel and Kirkby, 1987).
Molybedenum concentration above 5 mg/kg in dry matter of forage can be toxic to animals.
Ruminants, in particular, are susceptible to high Mo levels in plant tissue (Mengel and Kirkby,
1987). Excess Mo in the diet appears to interfere with normal Cu absorption and utilization
because Mo is transformed in the rumen to thiomolybdate which binds Cu and prevents Cu
absorption from the intestines, thereby causing the disease molybdenosis (Schrader and Thomas,
1981). Based on naturally high soil Cd and Mo levels at Wolcott, CO, these metals should be
monitored on a long-term basis (i.e., measured 10 years following treatment), if land application
of biosolids continues at this location, to ensure biosolids treatment do not significantly alter soil
Mo or Cd levels and pose a threat to animal or human health.
Conclusions
Application of municipal biosolids at Wolcott, CO after 2 growing seasons has provided an
enriched level of essential nutrients for plant use, and has lowered potentially toxic levels of Mo
plant tissue of 2 of the 6 dominant species at the study site at the 10 Mg/ha application rate. This
low treatment level does not contaminate soils from 0 to a 90 cm depth with excessive levels of
nutrients, metals, or soluble salts.
Little change was found in total or species-level plant cover and aboveground biomass in both
years following treatment with biosolids. No significant shift in serai stage of this semiarid
sagebrush ecosystem was detected with treatment.
We found significant increases in the essential nutrients N and P in 3 of the dominant forage
grasses at the study site in 1992 and 1993. We expectd this increase in plant tissue nutrient
concentration as a result of addition of nutrients from the biosolids.
Most soil chemical properties were not significantly altered at treatment rates below 20 Mg/ha,
at all soil depths to 90 cm, 2 years following biosolids application. Higher treatment rates pose
a potential hazard for contamination of surface waters by NO3-N in the first year following land
3-16
image:
 application in semiarid ecosystems subject to significant runoff with intense summer storms or
spring snowmelt. No sizeable movement of NO3-N, NH4-N, soluble salts, or metal pollutants
was detected to a 90-cm soil depth 2 years following treatment, and no change in soil pH was
identified.
The naturally high concentrations of Cd and Mo in plant tissue and soils at Wolcott, CO,
although not limiting to land application of biosolids, should be monitored on a long-term basis
to ensure biosolids treatment do not significantly alter these levels to pose a threat to animal or
human health.
Acknowledgments
The authors are: graduate research assistant, Bonnie Pierce, Soil and Crop Sciences Department,
Colorado State University; Professor, Rangeland Ecosystem Science Department, Colorado State
University, Edward Redente; and Professor, Soil and Crop Sciences Department, Colorado State
University, Kenneth Barbarick. The authors acknowledge the support of the U.S. Environmental
Protection Agency, the Colorado Department of Public Health and Environment, the Bureau of
Land Management, the Upper Eagle Valley Consolidated Sanitation District, and the Colorado
Agricultural Experiment Station (fund 15-2924). The contributions of Jim Ippilito, Troy Bauder,
and Ingrid Peterson in conduct of field work are appreciated.
References
Beath, O. A., C. S. Gilbert, and H. F. Eppson. 1939a. The use of indicator plants in locating
seleniferous areas in the western U.S. I. General. Amer. J. of Botany. 26:257-269.
Beath, O. A., C. S. Gilbert, and H. F. Eppson. 1939b. The use of indicator plants in locating
seleniferous areas in the western U.S. II. Correlation Studies by States. Amer. J. of
Botany. 26:296-315.
Beath, 0. A., C. S. Gilbert, and H. F. Eppson. 1940. The use of indicator plants in locating
seleniferous areas in the western U.S. III. Further Studies. Amer. J. of Botany. 27:564-
573.
Blaisdell, J. P., R. B. Murray, and E. McArthur. 1982. Managing intermountain rangelands-
sagebrush-grass ranges. Intermountain Forest and Range Experiment Station. General
Tech. Report INT-134.
Breman, H., and C. T. deWitt. 1983. Rangeland productivity and exploitation in the Sahel.
Science 221:1341-1347.
Burke, I.C. 1989. Control of nitrogen mineralization in a sagebrush steppe landscape.
Ecology 70(4):1115-1126.
3-17
image:
application in semiarid ecosystems subject to significant runoff with intense summer storms or
spring snowmelt. No sizeable movement of NO3-N, NH4-N, soluble salts, or metal pollutants
was detected to a 90-cm soil depth 2 years following treatment, and no change in soil pH was
identified.
The naturally high concentrations of Cd and Mo in plant tissue and soils at Wolcott, CO,
although not limiting to land application of biosolids, should be monitored on a long-term basis
to ensure biosolids treatment do not significantly alter these levels to pose a threat to animal or
human health.
Acknowledgments
The authors are: graduate research assistant, Bonnie Pierce, Soil and Crop Sciences Department,
Colorado State University; Professor, Rangeland Ecosystem Science Department, Colorado State
University, Edward Redente; and Professor, Soil and Crop Sciences Department, Colorado State
University, Kenneth Barbarick. The authors acknowledge the support of the U.S. Environmental
Protection Agency, the Colorado Department of Public Health and Environment, the Bureau of
Land Management, the Upper Eagle Valley Consolidated Sanitation District, and the Colorado
Agricultural Experiment Station (fund 15-2924). The contributions of Jim Ippilito, Troy Bauder,
and Ingrid Peterson in conduct of field work are appreciated.
References
Beath, O. A., C. S. Gilbert, and H. F. Eppson. 1939a. The use of indicator plants in locating
seleniferous areas in the western U.S. I. General. Amer. J. of Botany. 26:257-269.
Beath, O. A., C. S. Gilbert, and H. F. Eppson. 1939b. The use of indicator plants in locating
seleniferous areas in the western U.S. II. Correlation Studies by States. Amer. J. of
Botany. 26:296-315.
Beath, 0. A., C. S. Gilbert, and H. F. Eppson. 1940. The use of indicator plants in locating
seleniferous areas in the western U.S. III. Further Studies. Amer. J. of Botany. 27:564-
573.
Blaisdell, J. P., R. B. Murray, and E. McArthur. 1982. Managing intermountain rangelands-
sagebrush-grass ranges. Intermountain Forest and Range Experiment Station. General
Tech. Report INT-134.
Breman, H., and C. T. deWitt. 1983. Rangeland productivity and exploitation in the Sahel.
Science 221:1341-1347.
Burke, I.C. 1989. Control of nitrogen mineralization in a sagebrush steppe landscape.
Ecology 70(4):1115-1126.
3-17
image:
 Church, D. C. (ed.) 1988. The Ruminant Animal: Digestive Physiology and Nutrition.
Prentice Hall, Englewood Cliffs, N.J. p.355-395.
Eakin, J. H. 1972. Food and fertilizers, p. 1-21. Jn The Fertilizer Handbook, The Fertilizer
Inst, Washington.
Fresquez, P. R., and G. L. Dennis. 1989. Composition of fungal groups associated with
sewage sludge amended grassland soils. Arid Soil Research and Rehab. 4:19-32.
Fresquez, P. R., R. E. Francis, and G. L. Dennis. 1990a. Sewage sludge effects on soil and
plant quality in a degraded, semiarid grassland. J. Environ. Qua!.-19:324-329.
Fresquez, P. R., R. E. Francis, and G. L. Dennis. 1990b. Soil and vegetation responses to
sewage sludge on a degraded semiarid broom snakeweed/blue grama plant community. J.
Range Mgmt. 43(4):325-331.
Fresquez, P. R., R. Aguilar, R. E. Francis, and E. F. Aldon. 1991. Heavy metal uptake by
blue grama growing in a degraded semiarid soil amended with sewage sludge. Kluwer
Academic Publishers, Netherlands. 900-912.
Hall J. E. 1984. The cumulative and residual effects of sewage sludge nitrogen on crop
growth, p. 73-83. IaJ. H. Williams, et. al. (ed). Long-Term Effects of Sewage Sludge
and Farm Slurries Applications. 1984. Elsevier Applied Science Publishers. London
andN.Y..
Harris-Pierce, R. L. 1994. The effect of sewage sludge application on native rangeland soils
and vegetation. Masters Thesis. Colorado State Univ.
James, D. W., and J. J. Jurinak. 1978. Nitrogen fertilization of dominant plants in The
northeastern great basin deserts, p.219-231. In N. E. West et. al. (ed). Nitrogen in Desert
Ecosystems. U.S. Internal Program Series No. 9. Dowden, Hutchinson, and Ross,
Stroudsburg, Pennsylvania, USA.
Kabata-Pendias, A. and H. Pendias. 1984. Trace Elements in Soils and Plants. CRC Press,
Inc., Boca Raton, FL. p.109-116 and p. 199-206.
Logan, T. J., and R. L. Chaney. 1983. Utilization of municipal waste water and sludge on
land-metals, p. 235-326. In A. L. Page et. al. (ed). Utilization of Municipal Waste
Water and Sludge on Land. Univ. of California, Riverside.
McLendon T. and E. F. Redente. 1990. Succession patterns following soil disturbance in a
sagebrush steppe community. Oecologia. 85:293-300.
Mengel, K., and E. A. Kirkby. 1987. Principles of Plant Nutrition. 4th Ed. Internal. Potash
Institude, Switzerland.
3-18
image:
Church, D. C. (ed.) 1988. The Ruminant Animal: Digestive Physiology and Nutrition.
Prentice Hall, Englewood Cliffs, N.J. p.355-395.
Eakin, J. H. 1972. Food and fertilizers, p. 1-21. Jn The Fertilizer Handbook, The Fertilizer
Inst, Washington.
Fresquez, P. R., and G. L. Dennis. 1989. Composition of fungal groups associated with
sewage sludge amended grassland soils. Arid Soil Research and Rehab. 4:19-32.
Fresquez, P. R., R. E. Francis, and G. L. Dennis. 1990a. Sewage sludge effects on soil and
plant quality in a degraded, semiarid grassland. J. Environ. Qua!.-19:324-329.
Fresquez, P. R., R. E. Francis, and G. L. Dennis. 1990b. Soil and vegetation responses to
sewage sludge on a degraded semiarid broom snakeweed/blue grama plant community. J.
Range Mgmt. 43(4):325-331.
Fresquez, P. R., R. Aguilar, R. E. Francis, and E. F. Aldon. 1991. Heavy metal uptake by
blue grama growing in a degraded semiarid soil amended with sewage sludge. Kluwer
Academic Publishers, Netherlands. 900-912.
Hall J. E. 1984. The cumulative and residual effects of sewage sludge nitrogen on crop
growth, p. 73-83. IaJ. H. Williams, et. al. (ed). Long-Term Effects of Sewage Sludge
and Farm Slurries Applications. 1984. Elsevier Applied Science Publishers. London
andN.Y..
Harris-Pierce, R. L. 1994. The effect of sewage sludge application on native rangeland soils
and vegetation. Masters Thesis. Colorado State Univ.
James, D. W., and J. J. Jurinak. 1978. Nitrogen fertilization of dominant plants in The
northeastern great basin deserts, p.219-231. In N. E. West et. al. (ed). Nitrogen in Desert
Ecosystems. U.S. Internal Program Series No. 9. Dowden, Hutchinson, and Ross,
Stroudsburg, Pennsylvania, USA.
Kabata-Pendias, A. and H. Pendias. 1984. Trace Elements in Soils and Plants. CRC Press,
Inc., Boca Raton, FL. p.109-116 and p. 199-206.
Logan, T. J., and R. L. Chaney. 1983. Utilization of municipal waste water and sludge on
land-metals, p. 235-326. In A. L. Page et. al. (ed). Utilization of Municipal Waste
Water and Sludge on Land. Univ. of California, Riverside.
McLendon T. and E. F. Redente. 1990. Succession patterns following soil disturbance in a
sagebrush steppe community. Oecologia. 85:293-300.
Mengel, K., and E. A. Kirkby. 1987. Principles of Plant Nutrition. 4th Ed. Internal. Potash
Institude, Switzerland.
3-18
image:
 Pierce, B. L. 1994. The effect of biosolids application on a semiarid rangeland site in
Colorado. Masters Thesis. Colorado State Univ.
Rickard, W. H., L. E. Rogers, B. E. Vaughan, and S. F. Liebetrau 1988. Shrub-Steppe:
Balance and Change in a Semi-arid Terestrial Ecosystem. Battelle Memorial Institute,
Pacific Northwest Laboratories, Richland, WA.
Redente, E. F., J. E. Friedlander, and T. McLendon. 1992. Response of early and late
semiarid serai species to nitrogen and phosphorus gradients. Plant and Soil. 140:127-135.
Schrader, L. E., and R. J. Thomas. 1981. Nitrate uptake, reduction, and transport in the
whole plant, p. 49-93. In J. D. Bewley (ed.). Nitrogen and Carbon Metabolism. Vol 3.
Martinus Nijhoff and Dr. W. Junk Publishers. The Hague, Boston, London.
Soil Conservation Service, U. S. Department of Agric. 1992. Soil Survey of Aspen-Gypsum
Area, Colorado, Parts of Eagle, Garfield, and Pitkin Counties.
Sopper, W. E., and S. N. Kerr. 1977. Utilization of municipal sewage effluent and sludge on
forest and disturbed land. Proceedings of a symposium conducted by the School of
Forest Resources and the Institute for Research on Land and Water Resources.
Pennsylvania State Univer.
Stubbendieck, J., S. L. Hatch, and C. H. Butterfield. 1992. North American Range Plants,
4th Ed., Univer. of Nebraska Press. Lincoln and London.
Sturges, D. L. 1975. Hydrologic relations on undisturbed and converted big sagebrush
lands: The status of our knowledge. Rocky Mountain Forest and Range Exper. Station.
USD A Forest Service Research Paper RM-140.
Sturges, D. L. 1986. Responses of vegetation and ground cover to spraying a high elevation,
big sagebrush watershed with 2,4-D. J. of Range Mgmt. 39:141-146.
U. S. Environmental Protection Agency. 1992. Technical support document for land
application of sewage sludge. Vol. I and II. EPA 822/R-93-001a. Office of Water.
Eastern Research Group. Lexington, MA.
3-19
image:
Pierce, B. L. 1994. The effect of biosolids application on a semiarid rangeland site in
Colorado. Masters Thesis. Colorado State Univ.
Rickard, W. H., L. E. Rogers, B. E. Vaughan, and S. F. Liebetrau 1988. Shrub-Steppe:
Balance and Change in a Semi-arid Terestrial Ecosystem. Battelle Memorial Institute,
Pacific Northwest Laboratories, Richland, WA.
Redente, E. F., J. E. Friedlander, and T. McLendon. 1992. Response of early and late
semiarid serai species to nitrogen and phosphorus gradients. Plant and Soil. 140:127-135.
Schrader, L. E., and R. J. Thomas. 1981. Nitrate uptake, reduction, and transport in the
whole plant, p. 49-93. In J. D. Bewley (ed.). Nitrogen and Carbon Metabolism. Vol 3.
Martinus Nijhoff and Dr. W. Junk Publishers. The Hague, Boston, London.
Soil Conservation Service, U. S. Department of Agric. 1992. Soil Survey of Aspen-Gypsum
Area, Colorado, Parts of Eagle, Garfield, and Pitkin Counties.
Sopper, W. E., and S. N. Kerr. 1977. Utilization of municipal sewage effluent and sludge on
forest and disturbed land. Proceedings of a symposium conducted by the School of
Forest Resources and the Institute for Research on Land and Water Resources.
Pennsylvania State Univer.
Stubbendieck, J., S. L. Hatch, and C. H. Butterfield. 1992. North American Range Plants,
4th Ed., Univer. of Nebraska Press. Lincoln and London.
Sturges, D. L. 1975. Hydrologic relations on undisturbed and converted big sagebrush
lands: The status of our knowledge. Rocky Mountain Forest and Range Exper. Station.
USD A Forest Service Research Paper RM-140.
Sturges, D. L. 1986. Responses of vegetation and ground cover to spraying a high elevation,
big sagebrush watershed with 2,4-D. J. of Range Mgmt. 39:141-146.
U. S. Environmental Protection Agency. 1992. Technical support document for land
application of sewage sludge. Vol. I and II. EPA 822/R-93-001a. Office of Water.
Eastern Research Group. Lexington, MA.
3-19
image:
 Ammonia Volatilization from Biosolids
Applied to Semiarid Rangeland
R.E. Zartman*, R.D. Harmel, D.B. Wester, R.E. Sosebee, C. Mouron
Abstract
Proper quantities of applied biosolids are typically based upon nitrogen available to plants.
Ammonia volatilization from anaerobically-digested, dewatered biosolids was measured
following biosolid application at rates of O.O., 6.7, and 17.9 dry Mg ha'1. Volatilization studies
using two similar soils with different gravel contents were conducted under three temperature
regimes. Volatilization followed a diurnal fluctuating pattern and was significantly reduced by
day three for all trials. Cumulative volatilization losses, after 210 h, ranged from 11.5 kg ha"1
in the cool-season trial for the 6.7 dry Mg ha"1 application rate to 35.5 kg ha"1 in the hot-season
trial for the 17.9 dry Mg ha'1 rate. The influence of soil gravel was not significant (P > 0.01).
A prediction equation is being developed to model volatilization losses as a function of site-and
season-specific potential evapotranspiration, biosolid content application rate, and time after
application.
Keywords Biosolids, ammonia volatilization, semiarid, collector systems, potential
evapotranspiration.
Introduction
Methods to determine the maximum rate of biosolid application for beneficial use have changed
over the last decade in an effort to minimize negative environmental impacts associated with
land application of biosolids. Generally, current rate limits are based on the balance between
crop N needs and by the plant-available N (PAN) content of the applied biosolids. PAN, not
total N, is used as the limiting factor because much of the N in fertilizers, including biosolids,
is lost from the soil-plant system and is not available for plant uptake.
Many studies, including laboratory and field work with various organic fertilizers (urea,
biosolids, and slurry), have indicated that gaseous loss of ammonia is one of the major pathways
of N loss from fertilizer applications (Beauchamp et al., 1978; Adamsen and Sabey, 1987; Fine
et al., 1990). For example, Beauchamp et al. (1978) reported that 56-60% of the ammoniacal
N (21-22% of the total N applied) in anaerobically-digested liquid biosolids was volatilized
within 5-7 d after application. Other studies have attempted to quantify gaseous loss of ammonia
from organic fertilizer application, including biosolids (Beauchamp et al., 1982). Much of the
early work involved laboratory experiments and extrapolation to field conditions, but recent
ammonia volatilization work has focused on field quantification (Freney et al, 1983). Research
focused on initial volatilization, which occurs by NH3 diffusion from the biosolid-water solution
and along with the drying of the sludge, parameters that control diffusion and drying are of
interest. Many studies, including work by Beauchamp et al. (1980), and Beauchamp et al.
(1982) have attempted to determine relationships between diffusion/drying parameters (including
3-1
image:
Ammonia Volatilization from Biosolids
Applied to Semiarid Rangeland
R.E. Zartman*, R.D. Harmel, D.B. Wester, R.E. Sosebee, C. Mouron
Abstract
Proper quantities of applied biosolids are typically based upon nitrogen available to plants.
Ammonia volatilization from anaerobically-digested, dewatered biosolids was measured
following biosolid application at rates of O.O., 6.7, and 17.9 dry Mg ha'1. Volatilization studies
using two similar soils with different gravel contents were conducted under three temperature
regimes. Volatilization followed a diurnal fluctuating pattern and was significantly reduced by
day three for all trials. Cumulative volatilization losses, after 210 h, ranged from 11.5 kg ha"1
in the cool-season trial for the 6.7 dry Mg ha"1 application rate to 35.5 kg ha"1 in the hot-season
trial for the 17.9 dry Mg ha'1 rate. The influence of soil gravel was not significant (P > 0.01).
A prediction equation is being developed to model volatilization losses as a function of site-and
season-specific potential evapotranspiration, biosolid content application rate, and time after
application.
Keywords Biosolids, ammonia volatilization, semiarid, collector systems, potential
evapotranspiration.
Introduction
Methods to determine the maximum rate of biosolid application for beneficial use have changed
over the last decade in an effort to minimize negative environmental impacts associated with
land application of biosolids. Generally, current rate limits are based on the balance between
crop N needs and by the plant-available N (PAN) content of the applied biosolids. PAN, not
total N, is used as the limiting factor because much of the N in fertilizers, including biosolids,
is lost from the soil-plant system and is not available for plant uptake.
Many studies, including laboratory and field work with various organic fertilizers (urea,
biosolids, and slurry), have indicated that gaseous loss of ammonia is one of the major pathways
of N loss from fertilizer applications (Beauchamp et al., 1978; Adamsen and Sabey, 1987; Fine
et al., 1990). For example, Beauchamp et al. (1978) reported that 56-60% of the ammoniacal
N (21-22% of the total N applied) in anaerobically-digested liquid biosolids was volatilized
within 5-7 d after application. Other studies have attempted to quantify gaseous loss of ammonia
from organic fertilizer application, including biosolids (Beauchamp et al., 1982). Much of the
early work involved laboratory experiments and extrapolation to field conditions, but recent
ammonia volatilization work has focused on field quantification (Freney et al, 1983). Research
focused on initial volatilization, which occurs by NH3 diffusion from the biosolid-water solution
and along with the drying of the sludge, parameters that control diffusion and drying are of
interest. Many studies, including work by Beauchamp et al. (1980), and Beauchamp et al.
(1982) have attempted to determine relationships between diffusion/drying parameters (including
3-1
image:
 air temperature and ambient partial pressures) and volatilization. For instance, Beauchamp et
al. (1978) concluded that air temperature is especially important in the first two to three days
after biosolid application with other environmental and soil parameters later increasing in
importance. With diffusion/drying parameters in mind and from observations in this research,
drying potential played a major role in volatilization, especially during the first few days
following biosolid application. This study focused on field quantification of volatilization under
semiarid/arid rangeland conditions.
The objectives of this study were 1) to quantify volatilization of ammonia from anaerobically-
digested, dewatered biosolids; and 2) to predict volatilization losses from biosolids applied to
semiarid rangeland under various seasonal conditions.
Materials and Methods
Ammonia volatilization from applied biosolids was measured with semi-open, dynamic NH3
collectors (0.575 m x 0.405 m x 0.3 m). The collectors (Fig. 1 a,b) are "semi-open" because they
permit gaseous exchange with the atmosphere via diffusion and "dynamic" because they sweep
gases from the soil surface (Marshall and Debell, 1980). The collectors were placed in the field
to allow the diurnal cycle and its associated phenomena, including fluctuation of solar radiation,
air temperature, and relative humidity, to be maintained or at the least approximated.
Each collector was equipped with a small fan with a flow rate of approximately 340 L mhY1. The
fan provided an air exchange rate in the collector chamber of approximately six volumes min-1.
This air exchange rate was sufficient to keep chamber temperature near ambient levels. With
this air flow rate, possible reduction of the diffusion gradient caused by the build up of gaseous
ammonia in the collection was assumed to be minimal.
Each unit also was equipped with a bubbler collection system with 0.1 N H2SO4 absorbing
solution to trap NH3 and a small diaphragm pump with a 1.6 L mitf1 flow rate. Operation of
each ammonia collection system included 56 min h'1 with the fan on and the bubbler off (Fig.
1 a) and four min fr1 with the bubbler on and the fan off (Fig. 1 b). The concentration of ammonia
in the absorbing solution after each time period was determined as noted in Methods of Air
Sampling and Analysis (Lodge, 1989).
The efficiency of ammonia collection systems was evaluated with three 20 cm constant-rate NH3
emission tubes. By comparing the total NH3 emitted per time period with the total NH3 collected
per period during the four min fr1 collection periods, the efficiency of the collection systems was
calculated. A flow rate correction based on bubbler flow rates compared to the flow rate used
in the efficiency test was also utilized.
Properties of surface soil samples from two soil series, one gravelly and one nongravelly, were
evaluated (Table 1). Chilicotal very gravelly loam (loamy, skeletal, mixed thermic Ustollic
Calciorthid) and Berino loam taxajunct (fine loamy, mixed, thermic, Ustollic Haplargid) were
selected because of their similar chemistry; both soils have similar soil textures and parent
3-2
image:
air temperature and ambient partial pressures) and volatilization. For instance, Beauchamp et
al. (1978) concluded that air temperature is especially important in the first two to three days
after biosolid application with other environmental and soil parameters later increasing in
importance. With diffusion/drying parameters in mind and from observations in this research,
drying potential played a major role in volatilization, especially during the first few days
following biosolid application. This study focused on field quantification of volatilization under
semiarid/arid rangeland conditions.
The objectives of this study were 1) to quantify volatilization of ammonia from anaerobically-
digested, dewatered biosolids; and 2) to predict volatilization losses from biosolids applied to
semiarid rangeland under various seasonal conditions.
Materials and Methods
Ammonia volatilization from applied biosolids was measured with semi-open, dynamic NH3
collectors (0.575 m x 0.405 m x 0.3 m). The collectors (Fig. 1 a,b) are "semi-open" because they
permit gaseous exchange with the atmosphere via diffusion and "dynamic" because they sweep
gases from the soil surface (Marshall and Debell, 1980). The collectors were placed in the field
to allow the diurnal cycle and its associated phenomena, including fluctuation of solar radiation,
air temperature, and relative humidity, to be maintained or at the least approximated.
Each collector was equipped with a small fan with a flow rate of approximately 340 L mhY1. The
fan provided an air exchange rate in the collector chamber of approximately six volumes min-1.
This air exchange rate was sufficient to keep chamber temperature near ambient levels. With
this air flow rate, possible reduction of the diffusion gradient caused by the build up of gaseous
ammonia in the collection was assumed to be minimal.
Each unit also was equipped with a bubbler collection system with 0.1 N H2SO4 absorbing
solution to trap NH3 and a small diaphragm pump with a 1.6 L mitf1 flow rate. Operation of
each ammonia collection system included 56 min h'1 with the fan on and the bubbler off (Fig.
1 a) and four min fr1 with the bubbler on and the fan off (Fig. 1 b). The concentration of ammonia
in the absorbing solution after each time period was determined as noted in Methods of Air
Sampling and Analysis (Lodge, 1989).
The efficiency of ammonia collection systems was evaluated with three 20 cm constant-rate NH3
emission tubes. By comparing the total NH3 emitted per time period with the total NH3 collected
per period during the four min fr1 collection periods, the efficiency of the collection systems was
calculated. A flow rate correction based on bubbler flow rates compared to the flow rate used
in the efficiency test was also utilized.
Properties of surface soil samples from two soil series, one gravelly and one nongravelly, were
evaluated (Table 1). Chilicotal very gravelly loam (loamy, skeletal, mixed thermic Ustollic
Calciorthid) and Berino loam taxajunct (fine loamy, mixed, thermic, Ustollic Haplargid) were
selected because of their similar chemistry; both soils have similar soil textures and parent
3-2
image:
 Table 1. Initial (prestudy) average
Sludge Property
PH
NH3-N (g kg-')
TKN (g kg-1)
Water Content (%)
Soil Property
CEC (cmole kg-' soil)f
CaCOj Content ( g kg-')
Sand (g kg-')
Silt (g kg-')
Clay (g kg-')
pH
Organic C (mg kg-')
TKN (mg kg-')
Extractable NH4+ (mg kg-1)
NCv-N (mg kg-')
'These values seem unreasonably high in
sludge and selected soil surface properties
Mean Value
6.6
17.0
52.1
74.0
Chilicotal Soil
20.4
7.78
595
260
145
7.80
3500
625
1.91
19.1
relation to the low clay
Berino Soil
22.5
4.50
670
183
147
7.74
3600
496
1.73
20.3
content of these soils.
materials. Soils with similar chemistry were selected to minimize the differences of soil
chemistry influence on ammonia volatilization.
A 4.5 kg sample of Berino loam was placed in the base of nine ammonia collectors. A 4.0 kg
sample of Chilicotal very gravelly loam was placed in the base of the nine collectors with 0.50
kg of the natural surface gravel placed on the soil's surface. Large clumps of plant matter were
removed prior to sludge application. To reestablish a soil crust, each plot received 0.25 L of tap
water applied as simulated rainfall distributed evenly over the soil surface. The plots were left
overnight to dry.
Immediately prior to biosolid application, samples were collected for determination of selected
parameters. Biololids were applied midday at 0.0,6.7, and 17.9 dry Mg ha'1. These rates were
chosen to correspond to a control group (0.0 Mg ha'1), the current level of biosolid application
at a semiarid/arid range site near Sierra Blanca, Texas (6.7 Mg ha'1), and a possible future
increased rate (17.9 Mg Ha'1).
Immediately after biosolid application, an ammonia collector system was placed over each base.
The collectors were set to bubble for the first four-minute ammonia collection period after 55
min and again every hour for 210 h. The first time period was a 6 h period corresponding to the
afternoon hours. Starting with time period number two, the time periods were 12 h and
corresponded to daytime and nighttime periods. The purpose of time periods was to differentiate
daytime ammonia volatilization losses from nighttime losses.
A completely randomized design was used to assign treatments, each with three replicates, to
plots within the experimental area. A repeated measures technique was used to test the influence
3-3
image:
Table 1. Initial (prestudy) average
Sludge Property
PH
NH3-N (g kg-')
TKN (g kg-1)
Water Content (%)
Soil Property
CEC (cmole kg-' soil)f
CaCOj Content ( g kg-')
Sand (g kg-')
Silt (g kg-')
Clay (g kg-')
pH
Organic C (mg kg-')
TKN (mg kg-')
Extractable NH4+ (mg kg-1)
NCv-N (mg kg-')
'These values seem unreasonably high in
sludge and selected soil surface properties
Mean Value
6.6
17.0
52.1
74.0
Chilicotal Soil
20.4
7.78
595
260
145
7.80
3500
625
1.91
19.1
relation to the low clay
Berino Soil
22.5
4.50
670
183
147
7.74
3600
496
1.73
20.3
content of these soils.
materials. Soils with similar chemistry were selected to minimize the differences of soil
chemistry influence on ammonia volatilization.
A 4.5 kg sample of Berino loam was placed in the base of nine ammonia collectors. A 4.0 kg
sample of Chilicotal very gravelly loam was placed in the base of the nine collectors with 0.50
kg of the natural surface gravel placed on the soil's surface. Large clumps of plant matter were
removed prior to sludge application. To reestablish a soil crust, each plot received 0.25 L of tap
water applied as simulated rainfall distributed evenly over the soil surface. The plots were left
overnight to dry.
Immediately prior to biosolid application, samples were collected for determination of selected
parameters. Biololids were applied midday at 0.0,6.7, and 17.9 dry Mg ha'1. These rates were
chosen to correspond to a control group (0.0 Mg ha'1), the current level of biosolid application
at a semiarid/arid range site near Sierra Blanca, Texas (6.7 Mg ha'1), and a possible future
increased rate (17.9 Mg Ha'1).
Immediately after biosolid application, an ammonia collector system was placed over each base.
The collectors were set to bubble for the first four-minute ammonia collection period after 55
min and again every hour for 210 h. The first time period was a 6 h period corresponding to the
afternoon hours. Starting with time period number two, the time periods were 12 h and
corresponded to daytime and nighttime periods. The purpose of time periods was to differentiate
daytime ammonia volatilization losses from nighttime losses.
A completely randomized design was used to assign treatments, each with three replicates, to
plots within the experimental area. A repeated measures technique was used to test the influence
3-3
image:
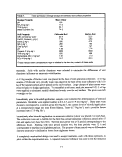 of time (corresponding to the time periods mentioned above) on ammonia volatilization.
Volatilization tests were performed under hot (20 to 36°C), cool (-4 to 14°C), and intermediate
(6 to 23 °C) temperature regimes during 1993 and 1994 to evaluate ammonia volatilization from
biosolids under various seasonal conditions.
Results and Discussion
Several relationships were apparent when the volatilization studies were compared. No
statistical comparison can be made between all three studies, as night volatilization losses were
not measured in January; therefore, these relationships are based on observation. Ammonia
volatilization from applied biosolids followed a diurnal fluctuating pattern for both the hot and
intermediate temperature regime trials (nighttime temperature extremes precluded measurements
in the cool-season trial) and was significantly reduced by day three for all of the trials (Fig. 2,
3,4). Hargrove (1988) cited many studies indicating diurnal fluctuation; therefore, this result
was anticipated. Cumulative volatilization data are presented in Fig. 5, 6, and 7. At the 6.7 dry
Mg ha'1 application rate, cumulative (210 h) ammonia volatilization losses ranged from 11.5 kg
ha'1 in the cool-season trial (Fig. 7) to 18.3 kg ha'1 in the hot-season trial (Fig. 5). These
represent a range of 9.5 to 16.6% of applied NH3-N. At the 17.9 dry Mg ha'1 application rate,
cumulative (210 h) volatilization losses ranged from 26.2 kg ha'1 in the cool-season trial to 35.5
kg ha'1 in the hot season trial. These represent a range of 8.3 to 12.1% of applied Ntb-N.
Statistical analysis of the data showed that the influence of biosolid application rate and time
after application were significant effects (P < 0.01) during the first 210 h after application, as
initial volatilization is controlled by environmental factors. Potential evapotranspiration (Table
2) seemed to play a large role in volatilization, especially over the first few days following
sludge application.
Table 2.
Hot
Day
8/7/93
8/8/93
8/9/93
8/10/93
8/11/93
8/12/93
8/13/93
8/14/93
8/15/93
Potential evapotranspiration (PET) in
(Lascano and Salisbury, 1993).
Season
PET
5.2
7.7
9.8
8.0
8.2
8.7
6.6
8.3
7.0
Cool Season
Day
1/7/94
1/8/94
1/9/94
1/10/94
1/11/94
1/12/94
1/13/94
1/14/94
1/15/94
mm d-1, calculated using
PET
2.6
4.3
5.0
4.1
3.0
3.3
3.8
3.9
1.9
MacPet®
Intermediate
Day
3/12/94
3/13/94
3/14/94
3/15/94
3/16/94
3/17/94
3/18/94
3/19/94
3/20/94
PET
2.0
4.5
7.5
6.9
7.7
14.2
9.8
10.7
13.3
This PET/volatilization relationship was clearly evident in the intermediate temperature trial
(Fig. 8). On day one, when the PET (Table 2) was extremely low (2.0 mm) because of relatively
low temperature and high humidity, little ammonia loss occurred when compared to day one of
3-4
image:
of time (corresponding to the time periods mentioned above) on ammonia volatilization.
Volatilization tests were performed under hot (20 to 36°C), cool (-4 to 14°C), and intermediate
(6 to 23 °C) temperature regimes during 1993 and 1994 to evaluate ammonia volatilization from
biosolids under various seasonal conditions.
Results and Discussion
Several relationships were apparent when the volatilization studies were compared. No
statistical comparison can be made between all three studies, as night volatilization losses were
not measured in January; therefore, these relationships are based on observation. Ammonia
volatilization from applied biosolids followed a diurnal fluctuating pattern for both the hot and
intermediate temperature regime trials (nighttime temperature extremes precluded measurements
in the cool-season trial) and was significantly reduced by day three for all of the trials (Fig. 2,
3,4). Hargrove (1988) cited many studies indicating diurnal fluctuation; therefore, this result
was anticipated. Cumulative volatilization data are presented in Fig. 5, 6, and 7. At the 6.7 dry
Mg ha'1 application rate, cumulative (210 h) ammonia volatilization losses ranged from 11.5 kg
ha'1 in the cool-season trial (Fig. 7) to 18.3 kg ha'1 in the hot-season trial (Fig. 5). These
represent a range of 9.5 to 16.6% of applied NH3-N. At the 17.9 dry Mg ha'1 application rate,
cumulative (210 h) volatilization losses ranged from 26.2 kg ha'1 in the cool-season trial to 35.5
kg ha'1 in the hot season trial. These represent a range of 8.3 to 12.1% of applied Ntb-N.
Statistical analysis of the data showed that the influence of biosolid application rate and time
after application were significant effects (P < 0.01) during the first 210 h after application, as
initial volatilization is controlled by environmental factors. Potential evapotranspiration (Table
2) seemed to play a large role in volatilization, especially over the first few days following
sludge application.
Table 2.
Hot
Day
8/7/93
8/8/93
8/9/93
8/10/93
8/11/93
8/12/93
8/13/93
8/14/93
8/15/93
Potential evapotranspiration (PET) in
(Lascano and Salisbury, 1993).
Season
PET
5.2
7.7
9.8
8.0
8.2
8.7
6.6
8.3
7.0
Cool Season
Day
1/7/94
1/8/94
1/9/94
1/10/94
1/11/94
1/12/94
1/13/94
1/14/94
1/15/94
mm d-1, calculated using
PET
2.6
4.3
5.0
4.1
3.0
3.3
3.8
3.9
1.9
MacPet®
Intermediate
Day
3/12/94
3/13/94
3/14/94
3/15/94
3/16/94
3/17/94
3/18/94
3/19/94
3/20/94
PET
2.0
4.5
7.5
6.9
7.7
14.2
9.8
10.7
13.3
This PET/volatilization relationship was clearly evident in the intermediate temperature trial
(Fig. 8). On day one, when the PET (Table 2) was extremely low (2.0 mm) because of relatively
low temperature and high humidity, little ammonia loss occurred when compared to day one of
3-4
image:
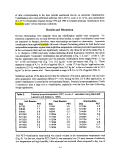 the other studies. Then, on day two as PET increased to 4.5 mm, a large increase in
volatilization occurred.
In the hot-season trial with relatively high PET values, the largest first day losses occurred, but
volatilization rates were extremely low by day three. In comparison, in the cool-season trial with
much lower PET values, the day one losses were much smaller, but substantial volatilization
occurred through day three. These observations indicate that slow drying allows significant
volatilization to occur for a longer period than does rapid drying.
Comparison of cumulative losses between the studies is difficult for several reasons. First,
nighttime losses were not measured in the January study, Also, the-relatively low PET value of
day one in the March study led to an unusual volatilization pattern compared to the other studies.
Generally, cumulative volatilization losses were highest for the August study and lowest for the
January study (even with estimated nighttime losses included in the January totals). The same
pattern exists for cumulative PET values over the first three days following application with the
highest totals for August and the lowest total for January. Only the first three days were
considered because 77%-94% of total volatilization losses occurred over the first three days in
each study.
The short time of soil/sludge contact might also explain why the influence of soil type (gravelly
versus nongravelly) was not significant. In the initial period following sludge application,
environmental parameters have an overriding influence on volatilization. In time, as the
soil/sludge interaction becomes more intimate, soil/sludge interaction, as well as environmental
conditions, would be expected to make a significant impact on volatilization. The magnitude
of soil/sludge interaction would be different for gravel-covered soils and gravel-free soil
surfaces, possibly resulting in significant volatilization differences.
Because of the importance of PET, a model of ammonia volatilization as a function of PET
would be useful. In this model, an estimate of the length of phase one and phase two drying
would be necessary. The length of phase one is especially important because of the large amount
of NH3 volatilized during that time. It was assumed that phase one drying lasted for 12 h;
however, for low (<2.3 mm d-1) PET on the day of application, a 36 h duration of phase one was
assumed to be more accurate.
Model Development
A model is being developed based on the assumption that volatilization occurs by NH3 diffusion
from the biosolid-water solution and along with evaporation of the biosolid water. Specifically,
volatilization is controlled by diffusion and drying parameters which are modeled using potential
evapotranspiration (PET). In order to use this model to predict cumulative volatilization losses
as a function of time after application, the following inputs are needed: biosolid NH3-N content,
biosolid water content, daily PET values, biosolid application rate, and maximum temperature
on day of biosolid application.
3-5
image:
the other studies. Then, on day two as PET increased to 4.5 mm, a large increase in
volatilization occurred.
In the hot-season trial with relatively high PET values, the largest first day losses occurred, but
volatilization rates were extremely low by day three. In comparison, in the cool-season trial with
much lower PET values, the day one losses were much smaller, but substantial volatilization
occurred through day three. These observations indicate that slow drying allows significant
volatilization to occur for a longer period than does rapid drying.
Comparison of cumulative losses between the studies is difficult for several reasons. First,
nighttime losses were not measured in the January study, Also, the-relatively low PET value of
day one in the March study led to an unusual volatilization pattern compared to the other studies.
Generally, cumulative volatilization losses were highest for the August study and lowest for the
January study (even with estimated nighttime losses included in the January totals). The same
pattern exists for cumulative PET values over the first three days following application with the
highest totals for August and the lowest total for January. Only the first three days were
considered because 77%-94% of total volatilization losses occurred over the first three days in
each study.
The short time of soil/sludge contact might also explain why the influence of soil type (gravelly
versus nongravelly) was not significant. In the initial period following sludge application,
environmental parameters have an overriding influence on volatilization. In time, as the
soil/sludge interaction becomes more intimate, soil/sludge interaction, as well as environmental
conditions, would be expected to make a significant impact on volatilization. The magnitude
of soil/sludge interaction would be different for gravel-covered soils and gravel-free soil
surfaces, possibly resulting in significant volatilization differences.
Because of the importance of PET, a model of ammonia volatilization as a function of PET
would be useful. In this model, an estimate of the length of phase one and phase two drying
would be necessary. The length of phase one is especially important because of the large amount
of NH3 volatilized during that time. It was assumed that phase one drying lasted for 12 h;
however, for low (<2.3 mm d-1) PET on the day of application, a 36 h duration of phase one was
assumed to be more accurate.
Model Development
A model is being developed based on the assumption that volatilization occurs by NH3 diffusion
from the biosolid-water solution and along with evaporation of the biosolid water. Specifically,
volatilization is controlled by diffusion and drying parameters which are modeled using potential
evapotranspiration (PET). In order to use this model to predict cumulative volatilization losses
as a function of time after application, the following inputs are needed: biosolid NH3-N content,
biosolid water content, daily PET values, biosolid application rate, and maximum temperature
on day of biosolid application.
3-5
image:
 The first step in model development involves deriving a drying potential approximation equation
given daily PET values. Drying of biosolids and volatilization occurs in two phases similar to
the drying phases of soil described in Ritchie (1972). Therefore, the influence of drying potential
on volatilization was separated into two phases. In phase one, cumulative drying potential from
application time to 12-36h. The evaporative surface area of biosolid also decreases during phase
one drying. For phase two drying, the cumulative drying potential varies as the square root of
time Ritchie (1972). The total amount of NH3-N volatilized at time since biosolids application
is determined by summing phase one and phase two drying.
In developing this predictive model, a proportionality coefficient for the cumulative loss will first
be determined by comparing measured and predicted values with theJeast-squares fit method
for individual data sets (treatment means averaged across soil type for each trial). The
proportionality constant will need to consider the maximum temperature on day of application
and rate of applied biosolids.
Summary
A predictive model being developed in this study allows users to input typical (site-and season-
specific) PET data, biosolid application rate, NH3-N content of sludge, H20 content of sludge,
and the maximum temperature on day of application (Tmax) and estimate loss of PAN due to
ammonia volatilization. This model should assist regulators and operators of semiarid/arid
rangeland application projects in achieving the proper balance between plant N needs and N
application rates of surface-applied biosolids. An environmentally sound management plan
would attempt to achieve this N balance, and, therefore, eliminate negative environmental
impacts of excess N loading.
Acknowledgements
Credits. This paper is a contribution of the College of Agricultural Sciences and Natural
Resources Publication No. T-4-XXXX.
Authors. Dr. R.E. Zartman and R.D. Harmel are Professor and former graduate student in
the Department of Plant and Soil Science; Drs. D.B. Wester and R.E. Sosebee are Associate
Professor and Professor in the Department of Range and Wildlife Management; and C. Mouron
is a former graduate student in the Mathmatics Department, Texas Tech University, Lubbock,
TX 79409. All correspondence should be addressed to Dr. R.E. Zartman, Department of Plant
and Soil Science, Texas Tech University, Lubbock, Texas 79409-2122.
3-6
image:
The first step in model development involves deriving a drying potential approximation equation
given daily PET values. Drying of biosolids and volatilization occurs in two phases similar to
the drying phases of soil described in Ritchie (1972). Therefore, the influence of drying potential
on volatilization was separated into two phases. In phase one, cumulative drying potential from
application time to 12-36h. The evaporative surface area of biosolid also decreases during phase
one drying. For phase two drying, the cumulative drying potential varies as the square root of
time Ritchie (1972). The total amount of NH3-N volatilized at time since biosolids application
is determined by summing phase one and phase two drying.
In developing this predictive model, a proportionality coefficient for the cumulative loss will first
be determined by comparing measured and predicted values with theJeast-squares fit method
for individual data sets (treatment means averaged across soil type for each trial). The
proportionality constant will need to consider the maximum temperature on day of application
and rate of applied biosolids.
Summary
A predictive model being developed in this study allows users to input typical (site-and season-
specific) PET data, biosolid application rate, NH3-N content of sludge, H20 content of sludge,
and the maximum temperature on day of application (Tmax) and estimate loss of PAN due to
ammonia volatilization. This model should assist regulators and operators of semiarid/arid
rangeland application projects in achieving the proper balance between plant N needs and N
application rates of surface-applied biosolids. An environmentally sound management plan
would attempt to achieve this N balance, and, therefore, eliminate negative environmental
impacts of excess N loading.
Acknowledgements
Credits. This paper is a contribution of the College of Agricultural Sciences and Natural
Resources Publication No. T-4-XXXX.
Authors. Dr. R.E. Zartman and R.D. Harmel are Professor and former graduate student in
the Department of Plant and Soil Science; Drs. D.B. Wester and R.E. Sosebee are Associate
Professor and Professor in the Department of Range and Wildlife Management; and C. Mouron
is a former graduate student in the Mathmatics Department, Texas Tech University, Lubbock,
TX 79409. All correspondence should be addressed to Dr. R.E. Zartman, Department of Plant
and Soil Science, Texas Tech University, Lubbock, Texas 79409-2122.
3-6
image:
 Q TIMER |—(p
120 v«n AC
FIG, 1A
SEMI-OPEN, DYNAMIC AMMONIA
COLLECTOR SYSTEM,
PUMP OFF AND FAN OH,
BUBBLER
FIG, IB
SEMI-OPEN, DYNAMIC AMMONIA
COLLECTOR SYSTEM,
PUMP ON AND FAN OFF,
BUBBLER
image:
Q TIMER |—(p
120 v«n AC
FIG, 1A
SEMI-OPEN, DYNAMIC AMMONIA
COLLECTOR SYSTEM,
PUMP OFF AND FAN OH,
BUBBLER
FIG, IB
SEMI-OPEN, DYNAMIC AMMONIA
COLLECTOR SYSTEM,
PUMP ON AND FAN OFF,
BUBBLER
image:
 Fig. 2. Daily ammonia loss
(August 1993).
NH3, kg/ha
0
•B Chi. 6.7Mg/ha
IB Ber. 6.7Mg/ha
Chi. is Chilicotal; Ber. is Berino
Chi. 17.9 Mg/ha
Ber. 17.9 Mg/ha
image:
Fig. 2. Daily ammonia loss
(August 1993).
NH3, kg/ha
0
•B Chi. 6.7Mg/ha
IB Ber. 6.7Mg/ha
Chi. is Chilicotal; Ber. is Berino
Chi. 17.9 Mg/ha
Ber. 17.9 Mg/ha
image:
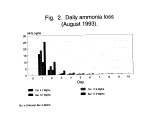 Fig. 3. Daily ammonia loss
(March 1994).
NH3, kg/ha
•I Chi.6.7Mg/ha
•B Ber.6.7Mg/ha
Chi. is Chilicotal; Ber. is Berino
Chi. 17.9 Mg/ha
Ber. 17.9 Mg/ha
image:
Fig. 3. Daily ammonia loss
(March 1994).
NH3, kg/ha
•I Chi.6.7Mg/ha
•B Ber.6.7Mg/ha
Chi. is Chilicotal; Ber. is Berino
Chi. 17.9 Mg/ha
Ber. 17.9 Mg/ha
image:
 Fig. 4. Daily ammonia loss
(January 1994).
NH3, kg/ha
0
BH Chi. 6.7Mg/ha
•I Ber.6.7Mg/ha
Chi. is Chilicotal; Ber. is Berino
Chi. 17.9 Mg/ha
Ber. 17.9 Mg/ha
image:
Fig. 4. Daily ammonia loss
(January 1994).
NH3, kg/ha
0
BH Chi. 6.7Mg/ha
•I Ber.6.7Mg/ha
Chi. is Chilicotal; Ber. is Berino
Chi. 17.9 Mg/ha
Ber. 17.9 Mg/ha
image:
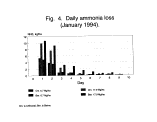 Fig. 5. Cumulative ammonia loss
(August 1993).
NH3, kg/ha
0
89 Chi.6.7Mg/ha
•i Ber. 6.7Mg/ha
Chi. is Chilicotal; Ber. is Berino
Chi. 17.9 Mg/ha
Ber. 17.9 Mg/ha
image:
Fig. 5. Cumulative ammonia loss
(August 1993).
NH3, kg/ha
0
89 Chi.6.7Mg/ha
•i Ber. 6.7Mg/ha
Chi. is Chilicotal; Ber. is Berino
Chi. 17.9 Mg/ha
Ber. 17.9 Mg/ha
image:
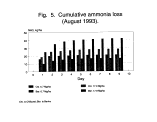 Fig. 6. Cumulative ammonia loss
(March 1994).
NH3, kg/ha
•I Chi. 6.7Mg/ha
•I Ber. 6.7Mg/ha
Chi. is Chilicotal; Ber. is Berino
Chi. 17.9 Mg/ha
Ber. 17.9 Mg/ha
image:
Fig. 6. Cumulative ammonia loss
(March 1994).
NH3, kg/ha
•I Chi. 6.7Mg/ha
•I Ber. 6.7Mg/ha
Chi. is Chilicotal; Ber. is Berino
Chi. 17.9 Mg/ha
Ber. 17.9 Mg/ha
image:
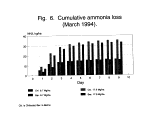 Fig. 7. Cumulative ammonia loss
(January 1994).
NH3, kg/ha
0
BB Chi. 6.7 Mg/ha
•I Ber. 6.7 Mg/ha
Chi. is Chilicotal; Ber. is Berino
Chi. 17.9 Mg/ha
Ber. 17.9 Mg/ha
image:
Fig. 7. Cumulative ammonia loss
(January 1994).
NH3, kg/ha
0
BB Chi. 6.7 Mg/ha
•I Ber. 6.7 Mg/ha
Chi. is Chilicotal; Ber. is Berino
Chi. 17.9 Mg/ha
Ber. 17.9 Mg/ha
image:
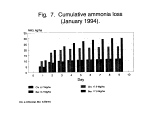 Fig. 8. Cumulative vs. PET
(March 1994).
NH3, kg/ha
0
PET, mm
Actual 6.7 Mg/ha
Actual 7.9 Mg/ha
* PET
Chi. is Chilicotal; Ber. is Berino
image:
Fig. 8. Cumulative vs. PET
(March 1994).
NH3, kg/ha
0
PET, mm
Actual 6.7 Mg/ha
Actual 7.9 Mg/ha
* PET
Chi. is Chilicotal; Ber. is Berino
image:
 References
Adamson, F.J., and B.R. Sabey. (1987) Ammonia volatilization from liquid digested sewage
sludge as affected by placement in soil. Soil Sci. Soc. Am. J. 51,1080-1082.
Beauchamp, E.G., et al. (1978) Ammonia volatilization from sewage sludge applied in the
field. J. Environ. Qual. 1,141-146.
Beauchamp, E.G., et al. (1982) Ammonia volatilization from liquid dairy cattle manure in the
field. Can. J. Soil Sci. 62,11-19.
English, C.J., Jr., et al. (1980) Volatile ammonia losses from surface-applied sludge. J. Water
Poll. Control Fed. 52,2340-2350.
Fine, P., et al. (1989) Incubation studies of the fate of organic nitrogen in soils amended with
activated sludge. Soil Sci. Soc. Am. J. 53,444-450.
Freney, J.R., et al. (1983) Volatilization of ammonia, p. 1-32. In Gaseous Loss of Nitrogen
from Plant-Soil Systems. J.R. Freney and J.R. Simpson, (Eds), Martinus Nijhoff/Dr. W. Junk
Pub., The Hague, Netherlands. 367 pp.
Frost, J.P., et al. (1990) Effect of separation and acidification of cattle slurry on ammonia
volatilization and on the efficiency of slurry nitrogen for herbage production. J. Agri. Sci.
115:49-56.
Hargrove, W.L. (1988) Evaluation of ammonia volatilization in the field. J. Prod. Agri. 1:104-
111.
Lascano, R., and D. Salisbury. (1993) MacPet(R). Tex. A&M Misc. Pub. 3181.
Lodge, J.P., (Ed). 1989. In Methods of Air Sampling and Analysis. 3rd Edition. Lewis Pub.,
Chelsea, MI. 763pp.
Marshall, U.G., and D.S. Debell. (1980) Comparison of four methods of measuring
volatilization losses of nitrogen following urea fertilization of forest soils. Can. J. Soil Sci.
60: 549-563.
Ritchie, J.T. (1972) Model for predicting evaporation from a row crop with incomplete cover.
Water Resou. Res. 8:1204-1213.
3-7
image:
References
Adamson, F.J., and B.R. Sabey. (1987) Ammonia volatilization from liquid digested sewage
sludge as affected by placement in soil. Soil Sci. Soc. Am. J. 51,1080-1082.
Beauchamp, E.G., et al. (1978) Ammonia volatilization from sewage sludge applied in the
field. J. Environ. Qual. 1,141-146.
Beauchamp, E.G., et al. (1982) Ammonia volatilization from liquid dairy cattle manure in the
field. Can. J. Soil Sci. 62,11-19.
English, C.J., Jr., et al. (1980) Volatile ammonia losses from surface-applied sludge. J. Water
Poll. Control Fed. 52,2340-2350.
Fine, P., et al. (1989) Incubation studies of the fate of organic nitrogen in soils amended with
activated sludge. Soil Sci. Soc. Am. J. 53,444-450.
Freney, J.R., et al. (1983) Volatilization of ammonia, p. 1-32. In Gaseous Loss of Nitrogen
from Plant-Soil Systems. J.R. Freney and J.R. Simpson, (Eds), Martinus Nijhoff/Dr. W. Junk
Pub., The Hague, Netherlands. 367 pp.
Frost, J.P., et al. (1990) Effect of separation and acidification of cattle slurry on ammonia
volatilization and on the efficiency of slurry nitrogen for herbage production. J. Agri. Sci.
115:49-56.
Hargrove, W.L. (1988) Evaluation of ammonia volatilization in the field. J. Prod. Agri. 1:104-
111.
Lascano, R., and D. Salisbury. (1993) MacPet(R). Tex. A&M Misc. Pub. 3181.
Lodge, J.P., (Ed). 1989. In Methods of Air Sampling and Analysis. 3rd Edition. Lewis Pub.,
Chelsea, MI. 763pp.
Marshall, U.G., and D.S. Debell. (1980) Comparison of four methods of measuring
volatilization losses of nitrogen following urea fertilization of forest soils. Can. J. Soil Sci.
60: 549-563.
Ritchie, J.T. (1972) Model for predicting evaporation from a row crop with incomplete cover.
Water Resou. Res. 8:1204-1213.
3-7
image:
 image:
 Environmental Effects on the Degradation of
Biosolids by Soil Microbes
Richard K. Strait*, Richard E. Zartman, Ronald E. Sosebee,
David B. Wester
Methodology Development and Initial Results
In the past, research on the microbial degradation of biosolids resulting from the land application
has been centered in humid regions such as the Eastern United States. Comparatively little is
known about the microbe/biosolid interactions which occur in arid areas, such as desert
grasslands, which are characterized by low rainfall and above freezing temperatures. Land
application on arid and semi-arid rangelands has many distinct advantages, including forage
improvement and decreased environmental risk (Sosebee 1994, Wester 1994, Aguilar and Loftin
1994). As application sites in the American Southwest increase in size and number, a knowledge
of the microbial degradation rates of biosolids in these environments is essential.
Prior studies of soil microbial populations have utilized methods, including light microscopy,
the "Most Probable Number" method, and enumeration of plated cultures to determine changes
in the soil microbial populations (Weaver, et al. 1994). These methods require the destruction
of the soil sample in order to determine population size. Multiple samples must be taken in order
to determine population changes over time and the inherent variation in populations from sample
to sample may lead to misleading results in these studies. This paper introduces a new method
which utilizes a single soil sample from which repeated measurements are obtained. Soil
microbial populations remain viable throughout the sampling period. In addition, this method
is integrated into environmental chambers, thus allowing for the regulation of physical
conditions. The goal in developing this technique was to provide an in-situ method to study the
long-term degradation of biosolids by microbes in an arid soil. However, the method may also
be applied to other soil microbial population studies.
The development of this "live" method arose from an interest in determining the rates of the
microbial degradation of biosolids at a land application site near Sierra Blanca, Texas. This site
is located in the Trans Pecos region of the Chihuahuan Desert. The site is classified as a desert
grassland with Hilaria mutica, Bouteloua gracilus and Sporobolus airoides as the dominant
grasses (Wester 1994). Biosolids are being commercially applied to improve the condition of
the rangeland for future grazing. Since little information on degradation rates in such an
environment is available, research in this area may provide guidelines for future application
practices. In addition, this research can provide insight into the ecology of microbial populations
in desert soils.
This study utilizes CO2 evolution to measure changes in microbial population size. Measuring
CO2 evolution and relating it to changes in population size has the advantage of quick analysis
of samples through infrared spectroscopy. In contract to other methods, the analysis of daily
samples can be completed in minutes instead of hours or days. In the past, microbial biomass
3-1
image:
Environmental Effects on the Degradation of
Biosolids by Soil Microbes
Richard K. Strait*, Richard E. Zartman, Ronald E. Sosebee,
David B. Wester
Methodology Development and Initial Results
In the past, research on the microbial degradation of biosolids resulting from the land application
has been centered in humid regions such as the Eastern United States. Comparatively little is
known about the microbe/biosolid interactions which occur in arid areas, such as desert
grasslands, which are characterized by low rainfall and above freezing temperatures. Land
application on arid and semi-arid rangelands has many distinct advantages, including forage
improvement and decreased environmental risk (Sosebee 1994, Wester 1994, Aguilar and Loftin
1994). As application sites in the American Southwest increase in size and number, a knowledge
of the microbial degradation rates of biosolids in these environments is essential.
Prior studies of soil microbial populations have utilized methods, including light microscopy,
the "Most Probable Number" method, and enumeration of plated cultures to determine changes
in the soil microbial populations (Weaver, et al. 1994). These methods require the destruction
of the soil sample in order to determine population size. Multiple samples must be taken in order
to determine population changes over time and the inherent variation in populations from sample
to sample may lead to misleading results in these studies. This paper introduces a new method
which utilizes a single soil sample from which repeated measurements are obtained. Soil
microbial populations remain viable throughout the sampling period. In addition, this method
is integrated into environmental chambers, thus allowing for the regulation of physical
conditions. The goal in developing this technique was to provide an in-situ method to study the
long-term degradation of biosolids by microbes in an arid soil. However, the method may also
be applied to other soil microbial population studies.
The development of this "live" method arose from an interest in determining the rates of the
microbial degradation of biosolids at a land application site near Sierra Blanca, Texas. This site
is located in the Trans Pecos region of the Chihuahuan Desert. The site is classified as a desert
grassland with Hilaria mutica, Bouteloua gracilus and Sporobolus airoides as the dominant
grasses (Wester 1994). Biosolids are being commercially applied to improve the condition of
the rangeland for future grazing. Since little information on degradation rates in such an
environment is available, research in this area may provide guidelines for future application
practices. In addition, this research can provide insight into the ecology of microbial populations
in desert soils.
This study utilizes CO2 evolution to measure changes in microbial population size. Measuring
CO2 evolution and relating it to changes in population size has the advantage of quick analysis
of samples through infrared spectroscopy. In contract to other methods, the analysis of daily
samples can be completed in minutes instead of hours or days. In the past, microbial biomass
3-1
image:
 has been measured by the "fumigation" method (Weaver et al. 1994). Since this method is time
consuming and destroys individual soil samples, a new method was needed. The interest of our
research centered around differences in microbial population size over time instead of total
biomass at a single point; thus, fumigation and sample destruction was unneccessary.
Given the environmental conditions in the Trans Pecos, the question of the effects of moisture
and temperature on microbial degradation of biosolids is of interest. The "live" method
discusses here integrates C02 measurement into environmental chambers. The chambers used
in the study were built and adapted specifically for this technique and are somewhat simplistic
when compared to those available on the market. However, they do provide a basis from which
the technique can be modified in the future.
Materials and Methods
This ongoing research currently includes three different methods: traditional microbial
population plating and enumeration, a benchtop CO2 evolution study, and the newly developed
"live" method for investigating the effects of temperature and moisture on microbial populations.
Microbial Population Enumeration
Initial testing of the soils at the Sierra Blanca site involved the standard method of microbial
enumeration from a soil sample (Weaver, Angle and Bottomley 1994). Stellar clay loam (Fine,
montmorillonitic, thermic Ustollic Haplargid) samples were collected in July of 1994 from
existing research plots maintained by Texas Tech University. The plots sampled represented five
different application rates and three times of application. Application rates sampled were 0,7,
18, 34, and 90 Mg/ha. Applications were made in July 1993, January 1994, and April 1994.
Soil samples were stored on ice and transported to the laboratory within 24 hours. In the
laboratory, soil samples were divided into five l.Og subsamples. Each subsample was stirred
into 99mL of FTA Hemagglutination Buffer and placed on a wrist action shaker for 20 minutes.
Serial dilutions of this solution were carried out until concentrations of Ig soil per 10,100, and
1000 liters were achieved. Each of these dilutions was then plated onto Triptic Soy Agar plates.
After 24 and 48 hours of incubation at 30 °C, plates were enumerated under lOx magnification.
Only those plates with numbers of colonies ranging from 30 to 300 were counted.
Benchtop CO2 Evolution Study
This study evaluated the feasibility of taking multiple CO2 samples from growth chambers and
to test the effect of autoclaving on soil and biosolid microbial populations and biosolid
degradation. Stellar clay loam was collected from the application site. In order to gain
homogeneity among the samples, soil was collected from locations that lacked vegetation and
other types of surface cover. The top 5cm of the soil were sampled. These samples were stored
on ice and returned to the laboratory, where they were homogenized by mixing and screening
through a 4.76mm sieve (ASTM #4). Half the soil was autoclaved at 121 °C and 19 psi for one
hour. Autoclaved and nonautoclaved soil was divided into lOOOg subsamples, each of which
was placed into 2.0 Liter Erlenmeyer flasks. Biosolids were sampled immediately after removal
from then- shipment containers at the site and transported to the lab on ice. Biosolids were then
3-2
image:
has been measured by the "fumigation" method (Weaver et al. 1994). Since this method is time
consuming and destroys individual soil samples, a new method was needed. The interest of our
research centered around differences in microbial population size over time instead of total
biomass at a single point; thus, fumigation and sample destruction was unneccessary.
Given the environmental conditions in the Trans Pecos, the question of the effects of moisture
and temperature on microbial degradation of biosolids is of interest. The "live" method
discusses here integrates C02 measurement into environmental chambers. The chambers used
in the study were built and adapted specifically for this technique and are somewhat simplistic
when compared to those available on the market. However, they do provide a basis from which
the technique can be modified in the future.
Materials and Methods
This ongoing research currently includes three different methods: traditional microbial
population plating and enumeration, a benchtop CO2 evolution study, and the newly developed
"live" method for investigating the effects of temperature and moisture on microbial populations.
Microbial Population Enumeration
Initial testing of the soils at the Sierra Blanca site involved the standard method of microbial
enumeration from a soil sample (Weaver, Angle and Bottomley 1994). Stellar clay loam (Fine,
montmorillonitic, thermic Ustollic Haplargid) samples were collected in July of 1994 from
existing research plots maintained by Texas Tech University. The plots sampled represented five
different application rates and three times of application. Application rates sampled were 0,7,
18, 34, and 90 Mg/ha. Applications were made in July 1993, January 1994, and April 1994.
Soil samples were stored on ice and transported to the laboratory within 24 hours. In the
laboratory, soil samples were divided into five l.Og subsamples. Each subsample was stirred
into 99mL of FTA Hemagglutination Buffer and placed on a wrist action shaker for 20 minutes.
Serial dilutions of this solution were carried out until concentrations of Ig soil per 10,100, and
1000 liters were achieved. Each of these dilutions was then plated onto Triptic Soy Agar plates.
After 24 and 48 hours of incubation at 30 °C, plates were enumerated under lOx magnification.
Only those plates with numbers of colonies ranging from 30 to 300 were counted.
Benchtop CO2 Evolution Study
This study evaluated the feasibility of taking multiple CO2 samples from growth chambers and
to test the effect of autoclaving on soil and biosolid microbial populations and biosolid
degradation. Stellar clay loam was collected from the application site. In order to gain
homogeneity among the samples, soil was collected from locations that lacked vegetation and
other types of surface cover. The top 5cm of the soil were sampled. These samples were stored
on ice and returned to the laboratory, where they were homogenized by mixing and screening
through a 4.76mm sieve (ASTM #4). Half the soil was autoclaved at 121 °C and 19 psi for one
hour. Autoclaved and nonautoclaved soil was divided into lOOOg subsamples, each of which
was placed into 2.0 Liter Erlenmeyer flasks. Biosolids were sampled immediately after removal
from then- shipment containers at the site and transported to the lab on ice. Biosolids were then
3-2
image:
 autoclaved in the same manner as the soil, with half being autoclaved and half remaining as
sampled. Biosolids were applied to the soil at rates of 0, 7, and 90 Mg/ha to achieve the
following combinations of soil and biosolids: Soil: Biosolids; Autoclaved Soil: Biosolids; Soil:
Autoclaved Biosolids; Autoclaved Soil: Autoclaved Biosolids.
Individual Erlenmeyers were fitted with two hole stoppers through which 3.2mm LD. tubing had
been threaded (Illustration 1). Tube #1 extended from 3cm beyond the top of each stopper
through the stopper to 2.5cm beneath the surface of the soil. Tube #2 extended from 3cm below
the bottom of each stopper through the stopper to an external length of 15cm. The external end
of Tubing #2 was connected to a bacterial filter. Thirty centimeters of 3.2mm tubing connected
the filters to diaphragm pumps (Penn-Plax Silencer #XP-SLUL). .Pumps were set to deliver a
flow rate of 0.5L/hr.
After setup, the experiment ran for 20 days. Air samples were taken periodically from the outlet
of Tube #1 of each flask with a lOmL syringe. These samples were immediately injected into
an infrared CO2 analyzer (Beckman Model 365 equipped with a Hewlett Packard 3390A
Integrator). The analyzer was calibrated with a 515ppm CO2 standard. Integrated sample values
were weighed against a calibration curve to obtain C02 concentrations for each sample. On day
fourteen of the experiment, 60mL distilled H20 was added to each Erlenmeyer as a simulation
of rainfall. The entire experiment was conducted at room temperature.
"Live" Method of CO2 Evolution Analysis
Two experiments have been conducted utilizing this technique. The live method measures CO2
from "growth chambers" set up similarly to the Erlenmeyer flasks in the benchtop study.
However, each growth chamber is constructed from round, clear polycarbonate containers 18 cm
in circumference and 19 cm in depth and fitted with airtight lids. Two glass tubes (3.2mm ID)
have been installed in the side of each chamber: Tube A is 2.54cm long and centered in the wall
of the chamber 3cm from the top while Tube B is 10cm in length and installed 2.5 cm from the
bottom of the chamber so that the interior end of the tube is centered in the chamber. This end
of Tube B is then covered with a nylon fabric sleeve (690 X 690 mesh/2.54cm), which prevents
soil from clogging the tube. The exterior ends of both Tube A and B were connected to 30cm
lengths of plastic tubing (3.2mm ID). Tube A serves as an air inlet to the growth chamber while
Tube B acts as an air outlet. Copper-constantan thermocouple wire was installed in each
chamber through a hold 5cm from the bottom of the container. The interior length of the wire
is 8.9 cm. The holes made in the sides of the chambers to house the tubing and the thermocouple
wire were sealed with silicone caulk on the exterior of the container (Illustration 2).
For each experiment, 24 growth chambers were constructed. Soil was sampled and homogenized
in the same manner as in the Benchtop Study. To each chamber, 1850g of soil was added. This
volume of soil brought the soil depth in each growth chamber to 5cm. At this point, the
thermocouple wire is centered on the soil surface. Twelve of these chambers were "rained" on
by adding 10% distilled water by volume (18mL) evenly across the soil surface. The surface was
then covered with nylon mesh fabric (690 X 690 mesh/2.54cm). This fabric allows water, air,
and microbes to pass through it while separating the soil from the biosolids. Thus, after the
completion of each experiment, soil and biosolids can be sampled separately without cross
3-3
image:
autoclaved in the same manner as the soil, with half being autoclaved and half remaining as
sampled. Biosolids were applied to the soil at rates of 0, 7, and 90 Mg/ha to achieve the
following combinations of soil and biosolids: Soil: Biosolids; Autoclaved Soil: Biosolids; Soil:
Autoclaved Biosolids; Autoclaved Soil: Autoclaved Biosolids.
Individual Erlenmeyers were fitted with two hole stoppers through which 3.2mm LD. tubing had
been threaded (Illustration 1). Tube #1 extended from 3cm beyond the top of each stopper
through the stopper to 2.5cm beneath the surface of the soil. Tube #2 extended from 3cm below
the bottom of each stopper through the stopper to an external length of 15cm. The external end
of Tubing #2 was connected to a bacterial filter. Thirty centimeters of 3.2mm tubing connected
the filters to diaphragm pumps (Penn-Plax Silencer #XP-SLUL). .Pumps were set to deliver a
flow rate of 0.5L/hr.
After setup, the experiment ran for 20 days. Air samples were taken periodically from the outlet
of Tube #1 of each flask with a lOmL syringe. These samples were immediately injected into
an infrared CO2 analyzer (Beckman Model 365 equipped with a Hewlett Packard 3390A
Integrator). The analyzer was calibrated with a 515ppm CO2 standard. Integrated sample values
were weighed against a calibration curve to obtain C02 concentrations for each sample. On day
fourteen of the experiment, 60mL distilled H20 was added to each Erlenmeyer as a simulation
of rainfall. The entire experiment was conducted at room temperature.
"Live" Method of CO2 Evolution Analysis
Two experiments have been conducted utilizing this technique. The live method measures CO2
from "growth chambers" set up similarly to the Erlenmeyer flasks in the benchtop study.
However, each growth chamber is constructed from round, clear polycarbonate containers 18 cm
in circumference and 19 cm in depth and fitted with airtight lids. Two glass tubes (3.2mm ID)
have been installed in the side of each chamber: Tube A is 2.54cm long and centered in the wall
of the chamber 3cm from the top while Tube B is 10cm in length and installed 2.5 cm from the
bottom of the chamber so that the interior end of the tube is centered in the chamber. This end
of Tube B is then covered with a nylon fabric sleeve (690 X 690 mesh/2.54cm), which prevents
soil from clogging the tube. The exterior ends of both Tube A and B were connected to 30cm
lengths of plastic tubing (3.2mm ID). Tube A serves as an air inlet to the growth chamber while
Tube B acts as an air outlet. Copper-constantan thermocouple wire was installed in each
chamber through a hold 5cm from the bottom of the container. The interior length of the wire
is 8.9 cm. The holes made in the sides of the chambers to house the tubing and the thermocouple
wire were sealed with silicone caulk on the exterior of the container (Illustration 2).
For each experiment, 24 growth chambers were constructed. Soil was sampled and homogenized
in the same manner as in the Benchtop Study. To each chamber, 1850g of soil was added. This
volume of soil brought the soil depth in each growth chamber to 5cm. At this point, the
thermocouple wire is centered on the soil surface. Twelve of these chambers were "rained" on
by adding 10% distilled water by volume (18mL) evenly across the soil surface. The surface was
then covered with nylon mesh fabric (690 X 690 mesh/2.54cm). This fabric allows water, air,
and microbes to pass through it while separating the soil from the biosolids. Thus, after the
completion of each experiment, soil and biosolids can be sampled separately without cross
3-3
image:
 contamination. Biosolids were applied on the top of the nylon fabric at a rate of lOOg (dry mass)
per chamber. This quantity of biosolids is sufficient to cover the entire surface of the soil. After
application, lids were placed on the containers and secured with vinyl tape.
These growth chambers were housed in larger "environmental chambers" constructed from .3255
m3 dormitory refrigerators. Four growth chambers were placed in each refrigerator. Six
environmental chambers were adapted so that two operated at each of three temperatures- 5,22,
and 35°C. In the coldest treatment, temperature was regulated with the thermostat equipped on
each refrigerator. Since 22°C is equivalent to ambient laboratory temperatures, these
refrigerators were not connected to power for the course of the study. In the warmest treatment,
temperatures were regulated with household heating pads (Sunbeam King Size). Each heating
pad was wrapped hi 3 mil plastic and stapled to a wooden block which was then screwed to the
door of the refrigerator so that the pad hung lengthwise (Illustration 3). Heating pad electrical
cords exited the refrigerators via holes drilled in the doors. Temperatures were maintained with
the heating pad's thermostat. Shelves in the refrigerators were adjusted so that an equal amount
of air space surrounded each of the four growth chambers. Thermocouple wires from the growth
chambers were fed through holes in the side of each refrigerator and connected to a recorder.
On the "inlet" side of each refrigerator, two #10 two-hole stoppers were placed in 3cm diameter
holes. Glass tubing (3.2mm ID) was installed through each set of stoppers. The exterior end of
this glass tubing was attached with plastic tubing (3.2mm ID) to a diaphragm pump on top of the
refrigerator. Air filters (Gelman 4310) were installed in-line between the pumps and the
refrigerators. The interior end of the glass tubing was connected with plastic tubing to a Tee-
valve mounted on the wall of the refrigerator. Each Tee-valve splits off to two 45cm lengths of
plastic tubing. This tubing is connected to the "inlet" tubing of each of the four growth chambers
within the refrigerator. On the "sampling" side of each refrigerator, tubing from each container
is connected directly to glass tubing running through stoppers to the outside of the refrigerators.
Thus, individual samples can be taken from each growth chamber without opening the
refrigerator.
One issue which required addressing was that of daily fluctuations in atmospheric CO2 within
the laboratory itself. In order to remove this artifact, we set up a benchtop control with each
experiment. The basic construction of this control was the same as that of the growth chambers,
but, instead of soil and biosolids, the containers were filled with autoclaved sand. Thus, CO2,
as measured from this control, would reflect ambient CO2. Ambient CO2 levels were then used
as a baseline for growth chamber measurements.
During the course of each experiment, samples were taken on a daily basis. Samples were drawn
with a syringe directly from the sampling ports on each refrigerator and analyzed with infrared
spectroscopy. In Experiment One, 3mL samples were taken, while lOmL samples were taken
in Experiment Two. These sample sizes were based upon the expected CO2 evolution compared
with the standard calibration gas available at the tune each experiment began. Experiment One
was calibrated with a 515 ppm standard and Experiment Two was calibrated with a 1585 ppm
standard. Both experiments lasted for one month.
3-4
image:
contamination. Biosolids were applied on the top of the nylon fabric at a rate of lOOg (dry mass)
per chamber. This quantity of biosolids is sufficient to cover the entire surface of the soil. After
application, lids were placed on the containers and secured with vinyl tape.
These growth chambers were housed in larger "environmental chambers" constructed from .3255
m3 dormitory refrigerators. Four growth chambers were placed in each refrigerator. Six
environmental chambers were adapted so that two operated at each of three temperatures- 5,22,
and 35°C. In the coldest treatment, temperature was regulated with the thermostat equipped on
each refrigerator. Since 22°C is equivalent to ambient laboratory temperatures, these
refrigerators were not connected to power for the course of the study. In the warmest treatment,
temperatures were regulated with household heating pads (Sunbeam King Size). Each heating
pad was wrapped hi 3 mil plastic and stapled to a wooden block which was then screwed to the
door of the refrigerator so that the pad hung lengthwise (Illustration 3). Heating pad electrical
cords exited the refrigerators via holes drilled in the doors. Temperatures were maintained with
the heating pad's thermostat. Shelves in the refrigerators were adjusted so that an equal amount
of air space surrounded each of the four growth chambers. Thermocouple wires from the growth
chambers were fed through holes in the side of each refrigerator and connected to a recorder.
On the "inlet" side of each refrigerator, two #10 two-hole stoppers were placed in 3cm diameter
holes. Glass tubing (3.2mm ID) was installed through each set of stoppers. The exterior end of
this glass tubing was attached with plastic tubing (3.2mm ID) to a diaphragm pump on top of the
refrigerator. Air filters (Gelman 4310) were installed in-line between the pumps and the
refrigerators. The interior end of the glass tubing was connected with plastic tubing to a Tee-
valve mounted on the wall of the refrigerator. Each Tee-valve splits off to two 45cm lengths of
plastic tubing. This tubing is connected to the "inlet" tubing of each of the four growth chambers
within the refrigerator. On the "sampling" side of each refrigerator, tubing from each container
is connected directly to glass tubing running through stoppers to the outside of the refrigerators.
Thus, individual samples can be taken from each growth chamber without opening the
refrigerator.
One issue which required addressing was that of daily fluctuations in atmospheric CO2 within
the laboratory itself. In order to remove this artifact, we set up a benchtop control with each
experiment. The basic construction of this control was the same as that of the growth chambers,
but, instead of soil and biosolids, the containers were filled with autoclaved sand. Thus, CO2,
as measured from this control, would reflect ambient CO2. Ambient CO2 levels were then used
as a baseline for growth chamber measurements.
During the course of each experiment, samples were taken on a daily basis. Samples were drawn
with a syringe directly from the sampling ports on each refrigerator and analyzed with infrared
spectroscopy. In Experiment One, 3mL samples were taken, while lOmL samples were taken
in Experiment Two. These sample sizes were based upon the expected CO2 evolution compared
with the standard calibration gas available at the tune each experiment began. Experiment One
was calibrated with a 515 ppm standard and Experiment Two was calibrated with a 1585 ppm
standard. Both experiments lasted for one month.
3-4
image:
 ILLUSTRATION 1
2
Benchtop CO Evolution
Inleflube
Filter
Outlet Tube
image:
ILLUSTRATION 1
2
Benchtop CO Evolution
Inleflube
Filter
Outlet Tube
image:
 ILLUSTRATION 2
GROWTH CHAMBER
Nylon Mesh
Fabric
Air Inlet
From Pump
Theimocoupler
Wire
Air Outlet to
Analyzer
image:
ILLUSTRATION 2
GROWTH CHAMBER
Nylon Mesh
Fabric
Air Inlet
From Pump
Theimocoupler
Wire
Air Outlet to
Analyzer
image:
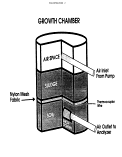 0.
D
HI
w
ti
0
I
0
image:
0.
D
HI
w
ti
0
I
0
image:
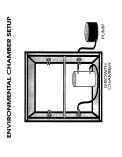 In Experiment One, soil moisture levels in the 5°C treatments increased. Most likely, this was
caused by the dewpoint temperature in the laboratory falling to below 5°C. Therefore, the
second experiment included measurements of relative humidity and temperature, from which the
daily dewpoint was calculated. During Experiment Two, the ambient dewpoint dropped below
5°C for only one day; thus, no significant wetting of samples occurred.
Results and Discussion
This is an ongoing study and all data have not been fully analyzed. Future results may shed light
on current findings. However, our data, as measured to date, does raise some interesting
questions. In the enumeration study, results indicate that microbial population size is a function
of application rate and time since application of biosolids (Chart 1). Population sizes generally
increased with increasing biosolid application rates while they decreased with time since
application. These results prompted investigation into the actual rate of microbial degradation
of biosolids. The methodology of addressing this problem is difficult. As previously mentioned,
traditional methods are both destructive of individual soil samples and time consuming.
Although variations between individual soil samples can be lessened with replication, the time
involved to undertake such a study may be prohibitive. Thus, our goals in this study became
two-fold: 1.) to determine the rate of microbial degradation of biosolids under different
environmental conditions and 2.) to develop a new methodology that was nondestructive and
less time consuming. Obviously, the second goal must be met before the first one can be sought
out. To date, we have been involved primarily in meeting that second goal.
The benchtop CO2 evolution study brought out several interesting factors. In the beginning, we
had hoped to include an experimental control of autoclaved soil and autoclaved biosolids. By
doing so, we hoped to block out CO2 evolution by chemical factors. However, autoclaved
samples evolved CO2 in manners similar to non-autoclaved samples. In some cases, autoclaved
biosolids appeared to be more readily degraded than untreated biosolids (Chart 2). In addition,
autoclaving appeared to alter the physical and chemical composition of the soil and the biosolids.
Thus, we determined that such a control would be useless in our study.
However, this study did show some promising results. As rate increased, C02 evolution also
increased (Chart 2). This result was supported by the findings of our enumeration study. In
addition, several of the replicates began to grow large fungal colonies on the sludge. This fungi
began to grow at the soil-biosolid interface and spread over the entire surface of the biosolid
layer. As the fungi spread, CO2 evolution increased. At a later stage, when the fungal colonies
appeared to die off, CO2 evolution decreased (Chart 3). Thus, our system for measuring C02
evolution from the same soil samples over time appears to work well.
Some general inferences can be drawn from the results of both "live" method experiments. First
of all, increasing CO2 sample size in Experiment Two reduced fluctuations within treatments
from those seen in Experiment One (Charts 4 and 5). In addition, the general trend of the
microbial decomposition of biosolids when plotted over time occurs on a decreasing log scale.
3-8
image:
In Experiment One, soil moisture levels in the 5°C treatments increased. Most likely, this was
caused by the dewpoint temperature in the laboratory falling to below 5°C. Therefore, the
second experiment included measurements of relative humidity and temperature, from which the
daily dewpoint was calculated. During Experiment Two, the ambient dewpoint dropped below
5°C for only one day; thus, no significant wetting of samples occurred.
Results and Discussion
This is an ongoing study and all data have not been fully analyzed. Future results may shed light
on current findings. However, our data, as measured to date, does raise some interesting
questions. In the enumeration study, results indicate that microbial population size is a function
of application rate and time since application of biosolids (Chart 1). Population sizes generally
increased with increasing biosolid application rates while they decreased with time since
application. These results prompted investigation into the actual rate of microbial degradation
of biosolids. The methodology of addressing this problem is difficult. As previously mentioned,
traditional methods are both destructive of individual soil samples and time consuming.
Although variations between individual soil samples can be lessened with replication, the time
involved to undertake such a study may be prohibitive. Thus, our goals in this study became
two-fold: 1.) to determine the rate of microbial degradation of biosolids under different
environmental conditions and 2.) to develop a new methodology that was nondestructive and
less time consuming. Obviously, the second goal must be met before the first one can be sought
out. To date, we have been involved primarily in meeting that second goal.
The benchtop CO2 evolution study brought out several interesting factors. In the beginning, we
had hoped to include an experimental control of autoclaved soil and autoclaved biosolids. By
doing so, we hoped to block out CO2 evolution by chemical factors. However, autoclaved
samples evolved CO2 in manners similar to non-autoclaved samples. In some cases, autoclaved
biosolids appeared to be more readily degraded than untreated biosolids (Chart 2). In addition,
autoclaving appeared to alter the physical and chemical composition of the soil and the biosolids.
Thus, we determined that such a control would be useless in our study.
However, this study did show some promising results. As rate increased, C02 evolution also
increased (Chart 2). This result was supported by the findings of our enumeration study. In
addition, several of the replicates began to grow large fungal colonies on the sludge. This fungi
began to grow at the soil-biosolid interface and spread over the entire surface of the biosolid
layer. As the fungi spread, CO2 evolution increased. At a later stage, when the fungal colonies
appeared to die off, CO2 evolution decreased (Chart 3). Thus, our system for measuring C02
evolution from the same soil samples over time appears to work well.
Some general inferences can be drawn from the results of both "live" method experiments. First
of all, increasing CO2 sample size in Experiment Two reduced fluctuations within treatments
from those seen in Experiment One (Charts 4 and 5). In addition, the general trend of the
microbial decomposition of biosolids when plotted over time occurs on a decreasing log scale.
3-8
image:
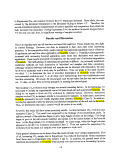 Also, cumulative C02 evolution results for the experiments differ. In Experiment One, CO2
evolution increased with increasing temperature and moisture (Chart 6). In Experiment Two,
this trend is not followed (Chart 7). The disagreement between the two data sets may be caused
by interference in Experiment One as a result of the smaller CO2 sample size, or by seasonal
effects on individual soil and biosolid samples. Experiment One samples were taken in
September 1994 and Experiment Two samples were taken hi January 1995. Future experiments
should clear up the CO2 sample size question. Currently, new studies are being planned to assess
seasonal effects on experimental results and the impact of fluctuating soil moisture levels. At
this stage, comments on actual degradation rates in arid environments are preliminary.
Currently, we are pleased with the initial performance of our "live" method.
3-9
image:
Also, cumulative C02 evolution results for the experiments differ. In Experiment One, CO2
evolution increased with increasing temperature and moisture (Chart 6). In Experiment Two,
this trend is not followed (Chart 7). The disagreement between the two data sets may be caused
by interference in Experiment One as a result of the smaller CO2 sample size, or by seasonal
effects on individual soil and biosolid samples. Experiment One samples were taken in
September 1994 and Experiment Two samples were taken hi January 1995. Future experiments
should clear up the CO2 sample size question. Currently, new studies are being planned to assess
seasonal effects on experimental results and the impact of fluctuating soil moisture levels. At
this stage, comments on actual degradation rates in arid environments are preliminary.
Currently, we are pleased with the initial performance of our "live" method.
3-9
image:
 Compared data Chart 1
Chart 1a: July 1993 Applicatic
30000000 T
25000000 --
8
20000000 --
oc
S 15000000
UJ
Q.
CO
UJ
o 10000000
oc
O
2
5000000 --
•Microbes/gram of soil
0
10
20
30
40 50
Mg/ha
60
70
80
90
image:
Compared data Chart 1
Chart 1a: July 1993 Applicatic
30000000 T
25000000 --
8
20000000 --
oc
S 15000000
UJ
Q.
CO
UJ
o 10000000
oc
O
2
5000000 --
•Microbes/gram of soil
0
10
20
30
40 50
Mg/ha
60
70
80
90
image:
 Compared data Chart 8
Chart 1b: January 1994 Applicatic
30000000
25000000 -
8
20000000 --
15000000
UJ
0.
w
lil
o 10000000
cc
o
5000000 --
0
Microbes/gram of soil
image:
Compared data Chart 8
Chart 1b: January 1994 Applicatic
30000000
25000000 -
8
20000000 --
15000000
UJ
0.
w
lil
o 10000000
cc
o
5000000 --
0
Microbes/gram of soil
image:
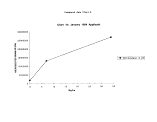 Compared data chart 3
Chart 1c, APRIL1994 APPLICATIOh
35000000 T
30000000 --
_j
O
g 25000000--
O
S
£ 20000000 --
O
DC
°- 15000000 --
CO
UJ
CO
o
g 10000000 --
•Microbes/gram of soil
0
image:
Compared data chart 3
Chart 1c, APRIL1994 APPLICATIOh
35000000 T
30000000 --
_j
O
g 25000000--
O
S
£ 20000000 --
O
DC
°- 15000000 --
CO
UJ
CO
o
g 10000000 --
•Microbes/gram of soil
0
image:
 ppm CO2
soil
A. soil
Soil and sludge
(7Mg/ha)
A. soil and A. sludge
(7Mg/ha)
A. soil and sludge
(7Mg/ha)
Soil and A. sludge
(7Mg/ha)
Soil and sludge
(90Mg/ha)
A. soil and A. sludge
(90Mg/ha)
A. soil and sludge
(90Mg/ha)
Soil and A. sludge
(90Mg/ha)
O
n_
0)
5"
(D
m
5 1
2 3
0)
to 3
n
rr
tn
image:
ppm CO2
soil
A. soil
Soil and sludge
(7Mg/ha)
A. soil and A. sludge
(7Mg/ha)
A. soil and sludge
(7Mg/ha)
Soil and A. sludge
(7Mg/ha)
Soil and sludge
(90Mg/ha)
A. soil and A. sludge
(90Mg/ha)
A. soil and sludge
(90Mg/ha)
Soil and A. sludge
(90Mg/ha)
O
n_
0)
5"
(D
m
5 1
2 3
0)
to 3
n
rr
tn
image:
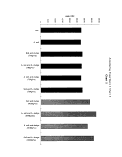 C-1
CHART 3
CO2 EVOLUTION IN RELATIONSHIP TO FUNGAL GROWTH
z
o
CM
O
O
FUNGAL GROWTH
OBSERVABLE
INCREASED FUNGAL
GROWTH OBSERVABLE
PARTIAL DEATH OF SOME
FUNGAL COLONIES
F
7/27/94
0:00
7/29/94
0:00
7/31/94
0:00
8/2/94 0:00 8/4/94 0:00 8/6/94 0:00 8/8/94 0:00
8/10/94
0:00
8/12/94
0:00
image:
C-1
CHART 3
CO2 EVOLUTION IN RELATIONSHIP TO FUNGAL GROWTH
z
o
CM
O
O
FUNGAL GROWTH
OBSERVABLE
INCREASED FUNGAL
GROWTH OBSERVABLE
PARTIAL DEATH OF SOME
FUNGAL COLONIES
F
7/27/94
0:00
7/29/94
0:00
7/31/94
0:00
8/2/94 0:00 8/4/94 0:00 8/6/94 0:00 8/8/94 0:00
8/10/94
0:00
8/12/94
0:00
image:
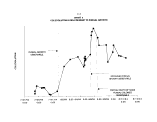 1000
800
600 --
400
CM
o
u
0.
O.
200-•
-200 - -
-400
10/23/94
Sheet 1 Chart 15
Chart 4: Experiment One
10/28/94
11/2/94
11/7/94
Date/Time
11/12/94
11/17/94
11/22/94
image:
1000
800
600 --
400
CM
o
u
0.
O.
200-•
-200 - -
-400
10/23/94
Sheet 1 Chart 15
Chart 4: Experiment One
10/28/94
11/2/94
11/7/94
Date/Time
11/12/94
11/17/94
11/22/94
image:
 1800 T
1600 -
1400-
1200 -
1000 -
s
a.
Q.
800
600
Sheet 1 Chart 17
Chart 5: Experiment Two
3/12/950:00
-200 •L
Date/Time
image:
1800 T
1600 -
1400-
1200 -
1000 -
s
a.
Q.
800
600
Sheet 1 Chart 17
Chart 5: Experiment Two
3/12/950:00
-200 •L
Date/Time
image:
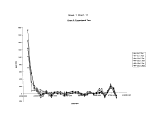 3500 T
Sheet 1 Chart 19
Charts
3000 - •
2500 - •
2000
1500
1000
500 -
SoCDry
5o C Wet
22oC Dry
22o C Wet
35o C Dry
35o C Wet
image:
3500 T
Sheet 1 Chart 19
Charts
3000 - •
2500 - •
2000
1500
1000
500 -
SoCDry
5o C Wet
22oC Dry
22o C Wet
35o C Dry
35o C Wet
image:
 2500 T
Sheet 1 Chart 18
Chart?
2000 - -
1500 - •
CM
o
u
I
1000 --
500 --
0-1-
-s'lfM.
«> *
SoCDry
5o C Wet
22oCDry
22o C Wet
35o C Dry
t •:•'
35o C Wet
image:
2500 T
Sheet 1 Chart 18
Chart?
2000 - -
1500 - •
CM
o
u
I
1000 --
500 --
0-1-
-s'lfM.
«> *
SoCDry
5o C Wet
22oCDry
22o C Wet
35o C Dry
t •:•'
35o C Wet
image:
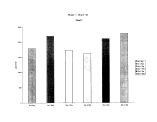 c
o
'w
</)
<D
image:
c
o
'w
</)
<D
image:
 image:
 Rangeland Restoration with Surface-applied Biosolids:
Effects on Soils, Vegetation, and Surface Hydrology at the
Sevilleta National Wildlife Refuge, Central New Mexico
Loftin, S.R. and R. Aguilar
Abstract
A biosolids research project was initiated by the Rocky Mountain Forest and Range Experiment
Station in December 1990 on the Sevilleta National Wildlife Refuge, central New Mexico.
Based on previous study results from the Rio Puerco Watershed, Albuquerque biosolids (17%
solids) were surface-applied at a rate of 45 Mg/ha. Vegetation was monitored for changes in
aboveground cover, and total nitrogen and heavy metal content (cadmium, copper, lead, and
zinc) of aboveground tissues. Soils were monitored for changes in nutrients (organic carbon,
nitrogen, and phosphorus) and heavy metals. Runoff plots were established to study the effects
of biosolids on surface runoff quantity. Biosolids increased aboveground plant cover (when
water was available), nitrogen and copper content of aboveground tissues, and soil nutrient and
heavy metal content. Surface-applied biosolids significantly reduced surface runoff from
simulated rainfall. The reduction in runoff from biosolids-treated plots was still significant three
years after biosolids application.
Keywords: rangeland restoration, biosolids, sewage sludge, vegetation, soil, runoff, hay
metals.
Introduction
Improper land use practices, including over-grazing, can lead to a severe reduction in plant cover
and soil productivity. This process, known as desertification, is especially common in arid and
semiarid regions with sparse vegetative cover. In the United States over 225 million acres have
experienced severe or very severe desertification and overgrazing is the single most important
causal factor (Sheridan 1981). Southwestern rangelands have experienced heavy livestock
grazing over the past century resulting in a substantial reduction in total plant cover and density
(Dortignac and Hickey 1963). A loss of vegetative cover can increase the erosion potential of
the soil and soil erosion can accelerate the process of desertification by removing the topsoil rich
in plant nutrients and organic matter. If the cycle of degradation is not disrupted, a grassland can
degrade to a desert-like system which might be virtually impossible to restore (Naveh 1988;
Klein 1989).
Soil organic matter plays a key role in inhibiting the process of desertification (El-Tayeb and
Skujins 1989; Parr et al. 1989). Organic matter improves infiltration of precipitation, soil water
holding capacity, and nutrient availability, all of which are important to plant recovery. Any
successful attempt at grassland restoration will need to increase retention of precipitation and
4-1
image:
Rangeland Restoration with Surface-applied Biosolids:
Effects on Soils, Vegetation, and Surface Hydrology at the
Sevilleta National Wildlife Refuge, Central New Mexico
Loftin, S.R. and R. Aguilar
Abstract
A biosolids research project was initiated by the Rocky Mountain Forest and Range Experiment
Station in December 1990 on the Sevilleta National Wildlife Refuge, central New Mexico.
Based on previous study results from the Rio Puerco Watershed, Albuquerque biosolids (17%
solids) were surface-applied at a rate of 45 Mg/ha. Vegetation was monitored for changes in
aboveground cover, and total nitrogen and heavy metal content (cadmium, copper, lead, and
zinc) of aboveground tissues. Soils were monitored for changes in nutrients (organic carbon,
nitrogen, and phosphorus) and heavy metals. Runoff plots were established to study the effects
of biosolids on surface runoff quantity. Biosolids increased aboveground plant cover (when
water was available), nitrogen and copper content of aboveground tissues, and soil nutrient and
heavy metal content. Surface-applied biosolids significantly reduced surface runoff from
simulated rainfall. The reduction in runoff from biosolids-treated plots was still significant three
years after biosolids application.
Keywords: rangeland restoration, biosolids, sewage sludge, vegetation, soil, runoff, hay
metals.
Introduction
Improper land use practices, including over-grazing, can lead to a severe reduction in plant cover
and soil productivity. This process, known as desertification, is especially common in arid and
semiarid regions with sparse vegetative cover. In the United States over 225 million acres have
experienced severe or very severe desertification and overgrazing is the single most important
causal factor (Sheridan 1981). Southwestern rangelands have experienced heavy livestock
grazing over the past century resulting in a substantial reduction in total plant cover and density
(Dortignac and Hickey 1963). A loss of vegetative cover can increase the erosion potential of
the soil and soil erosion can accelerate the process of desertification by removing the topsoil rich
in plant nutrients and organic matter. If the cycle of degradation is not disrupted, a grassland can
degrade to a desert-like system which might be virtually impossible to restore (Naveh 1988;
Klein 1989).
Soil organic matter plays a key role in inhibiting the process of desertification (El-Tayeb and
Skujins 1989; Parr et al. 1989). Organic matter improves infiltration of precipitation, soil water
holding capacity, and nutrient availability, all of which are important to plant recovery. Any
successful attempt at grassland restoration will need to increase retention of precipitation and
4-1
image:
 control runoff and erosion, increase plant growth, and re-establish a stable pool of soil organic
matter.
Biosolids are an excellent choice for a soil amendment, it is readily available, contains many
plant nutrients, and has excellent soil conditioning capabilities when it is incorporated into the
soil (Alloway and Jackson 1991; Glaub and Golueke 1989; Parr et al. 1989). A surface
application of biosolids to semiarid grasslands has been shown to increase above-ground plant
cover (assuming these systems are water and/or nutrient limited) (Fresquez et al. 1990) and a
subsequent decrease in surface runoff and soil erosion (Aguilar and Loftin 1992). Surface
applications of biosolids make no direct input to soil organic matter (carbon), however, increases
in soil organic matter could occur as an indirect result of increased plant nutrient availability and
subsequent belowground productivity. The specific objectives of this research were to: 1)
determine the effects of municipal biosolids application on soils and vegetation in a semiarid
grassland environment, 2) determine how biosolids application influences runoff and surface
water quality, and 3) assess the fate of potential biosolids-borne contaminants in the soils and
vegetation.
Methods
Study Site Description
The study was conducted within the Sevilleta National Wildlife Refuge (SNWR). The wildlife
refuge is administered by the United States Department of Interior, Fish and Wildlife Service and
has been designated as a Long Term Ecological Research Site (LTER) under the administration
of the Department of Biology, University of New Mexico. Climate at the SNWR is arid to
semiarid with mean annual precipitation ranging from 200 to 250 mm.
Although the SNWR has had a history of heavy livestock grazing, no grazing has occurred on
the refuge for approximately 20 years. A desert grassland community was selected for study on
moderately sloping and strongly sloping components of a stable alluvial fan. The typical
vegetation assemblage at the study site includes the grasses blue grama (Bouteloua gracilis),
hairy grama (Bouteloua hirsuta), black grama (Bouteloua eriopoda), ring muhly (Muhlenbergia
torrei), three awn (Aristida spp.), and the shrubs broom snakeweed (Gutierresia sarothrae),
yellow spiny aster (Haplopappus spinulosus), narrow-leaf yucca (Yucca glauca), winterfat
(Ceratoides lanata), four-wing saltbush (Atriplex canescens), and groundsel (Senecio douglasii
var. longilobus). Soils at the site are mapped as the Harvey-Dean Association (USDA Soil
Conservation Service 1988). The Harvey soil is classified as fine-loamy, mixed, mesic Ustollic
Calciorthid and the Dean soil is classified as fine-loamy, carbonatic, mesic Ustollic Calciorthid.
The soils are formed in alluvium derived dominantly from sandstone, limestone, and eolian
material and are deep and well drained. Permeability ranges from moderate for the Harvey soil
to moderately slow for the Dean soil. Runoff is medium and the hazard of water erosion is
moderate for both soils.
Experimental Design
Soil and vegetation were sampled within ten (10 X 10 m) plots (five control and five biosolids-
treated). A randomized block design was used to increase the interspersion of treatments
4-2
image:
control runoff and erosion, increase plant growth, and re-establish a stable pool of soil organic
matter.
Biosolids are an excellent choice for a soil amendment, it is readily available, contains many
plant nutrients, and has excellent soil conditioning capabilities when it is incorporated into the
soil (Alloway and Jackson 1991; Glaub and Golueke 1989; Parr et al. 1989). A surface
application of biosolids to semiarid grasslands has been shown to increase above-ground plant
cover (assuming these systems are water and/or nutrient limited) (Fresquez et al. 1990) and a
subsequent decrease in surface runoff and soil erosion (Aguilar and Loftin 1992). Surface
applications of biosolids make no direct input to soil organic matter (carbon), however, increases
in soil organic matter could occur as an indirect result of increased plant nutrient availability and
subsequent belowground productivity. The specific objectives of this research were to: 1)
determine the effects of municipal biosolids application on soils and vegetation in a semiarid
grassland environment, 2) determine how biosolids application influences runoff and surface
water quality, and 3) assess the fate of potential biosolids-borne contaminants in the soils and
vegetation.
Methods
Study Site Description
The study was conducted within the Sevilleta National Wildlife Refuge (SNWR). The wildlife
refuge is administered by the United States Department of Interior, Fish and Wildlife Service and
has been designated as a Long Term Ecological Research Site (LTER) under the administration
of the Department of Biology, University of New Mexico. Climate at the SNWR is arid to
semiarid with mean annual precipitation ranging from 200 to 250 mm.
Although the SNWR has had a history of heavy livestock grazing, no grazing has occurred on
the refuge for approximately 20 years. A desert grassland community was selected for study on
moderately sloping and strongly sloping components of a stable alluvial fan. The typical
vegetation assemblage at the study site includes the grasses blue grama (Bouteloua gracilis),
hairy grama (Bouteloua hirsuta), black grama (Bouteloua eriopoda), ring muhly (Muhlenbergia
torrei), three awn (Aristida spp.), and the shrubs broom snakeweed (Gutierresia sarothrae),
yellow spiny aster (Haplopappus spinulosus), narrow-leaf yucca (Yucca glauca), winterfat
(Ceratoides lanata), four-wing saltbush (Atriplex canescens), and groundsel (Senecio douglasii
var. longilobus). Soils at the site are mapped as the Harvey-Dean Association (USDA Soil
Conservation Service 1988). The Harvey soil is classified as fine-loamy, mixed, mesic Ustollic
Calciorthid and the Dean soil is classified as fine-loamy, carbonatic, mesic Ustollic Calciorthid.
The soils are formed in alluvium derived dominantly from sandstone, limestone, and eolian
material and are deep and well drained. Permeability ranges from moderate for the Harvey soil
to moderately slow for the Dean soil. Runoff is medium and the hazard of water erosion is
moderate for both soils.
Experimental Design
Soil and vegetation were sampled within ten (10 X 10 m) plots (five control and five biosolids-
treated). A randomized block design was used to increase the interspersion of treatments
4-2
image:
 throughout the study site (Hurlbert 1984). The 10 X 10 m plots were used for experiments and
field activities that required disturbance of the soil and ground cover and might otherwise
influence the surface hydrology of the runoff plots.
Three pairs of runoff plots (3 X 10 m), each consisting of a treated and a control plot, were
established within each of two slope gradient classes (6% and 10-11%). The runoff plots were
bordered by 15 cm (6-inch) aluminum flashing to exclude external runoff and contain surface
runoff generated from the plot during rainfall events. The water was collected in 1800-liter
galvanized steel livestock tanks buried at the base of the plots. Lids (framed fiberglass roofing
panels) were placed over the tanks to exclude direct rainfall inputs and to reduce evaporation
following rainfall events. - ,,.._-.
Biosolids Treatment
The biosolids treatment, applied in early April 1991, consisted of a one-time surface application
equivalent to 45 Mg/ha (20 tons/acre on an oven-dry weight basis) of municipal biosolids
provided by the City of Albuquerque. Levels of Cu, Pb, and Zn were below USEPA limits
(Table 1) and the projected metal-loading rate associated with the one-time application at 45
Mg/ha was well below current federal limitations for biosolids application to non-agricultural
lands (U.S. Environmental Protection Agency 1992). The biosolids were applied in the spring
to minimize losses that might otherwise occur during high intensity rainfall from summer and
fall convective thunderstorms, given that spring precipitation at the SNWR is either in the form
of low intensity rainfall or snow.
Albuquerque biosolids are anaerobically digested and mechanically de-watered to approximately
17% dry solids (82.5% water). The product is a gelatinous substance that is relatively easy to
transport and handle. Biosolids were applied to the treated plots with a front-end loader and then
spread with rakes and shovels to obtain a uniform application (the 45 Mg/ha surface application
resulted in a uniform "wet sludge" layer approximately 2.5 cm thick). Extra caution in
minimizing disturbance to the existing native vegetation was exercised while spreading the
biosolids on the plots.
Rainfall Simulation
A rainfall simulator was used in September 1991,1992, and 1993 to evaluate rangeland response
to high-intensity rainfall under controlled conditions. The rainfall simulator was designed to
deliver rainfall at approximately the same droplet size and velocity as would a natural storm
(Ward 1986). The simulated rainfall experiments insured estimates of runoff yield in the absence
of natural storms capable of producing runoff. Each event was approximately equivalent to a
high intensity summer thunderstorm common in the region (40-80 mrn/hr for 30 minutes).
The rainfall simulator (15 sprinklers mounted on 3-meter tall standpipes) distributed water
simultaneously to a runoff plot pair so that infiltration and runoff yield could be observed and
recorded while rainfall variability was minimized. At the conclusion of each simulation run the
total amount of runoff in the runoff collection tanks was measured and recorded.
4-3
image:
throughout the study site (Hurlbert 1984). The 10 X 10 m plots were used for experiments and
field activities that required disturbance of the soil and ground cover and might otherwise
influence the surface hydrology of the runoff plots.
Three pairs of runoff plots (3 X 10 m), each consisting of a treated and a control plot, were
established within each of two slope gradient classes (6% and 10-11%). The runoff plots were
bordered by 15 cm (6-inch) aluminum flashing to exclude external runoff and contain surface
runoff generated from the plot during rainfall events. The water was collected in 1800-liter
galvanized steel livestock tanks buried at the base of the plots. Lids (framed fiberglass roofing
panels) were placed over the tanks to exclude direct rainfall inputs and to reduce evaporation
following rainfall events. - ,,.._-.
Biosolids Treatment
The biosolids treatment, applied in early April 1991, consisted of a one-time surface application
equivalent to 45 Mg/ha (20 tons/acre on an oven-dry weight basis) of municipal biosolids
provided by the City of Albuquerque. Levels of Cu, Pb, and Zn were below USEPA limits
(Table 1) and the projected metal-loading rate associated with the one-time application at 45
Mg/ha was well below current federal limitations for biosolids application to non-agricultural
lands (U.S. Environmental Protection Agency 1992). The biosolids were applied in the spring
to minimize losses that might otherwise occur during high intensity rainfall from summer and
fall convective thunderstorms, given that spring precipitation at the SNWR is either in the form
of low intensity rainfall or snow.
Albuquerque biosolids are anaerobically digested and mechanically de-watered to approximately
17% dry solids (82.5% water). The product is a gelatinous substance that is relatively easy to
transport and handle. Biosolids were applied to the treated plots with a front-end loader and then
spread with rakes and shovels to obtain a uniform application (the 45 Mg/ha surface application
resulted in a uniform "wet sludge" layer approximately 2.5 cm thick). Extra caution in
minimizing disturbance to the existing native vegetation was exercised while spreading the
biosolids on the plots.
Rainfall Simulation
A rainfall simulator was used in September 1991,1992, and 1993 to evaluate rangeland response
to high-intensity rainfall under controlled conditions. The rainfall simulator was designed to
deliver rainfall at approximately the same droplet size and velocity as would a natural storm
(Ward 1986). The simulated rainfall experiments insured estimates of runoff yield in the absence
of natural storms capable of producing runoff. Each event was approximately equivalent to a
high intensity summer thunderstorm common in the region (40-80 mrn/hr for 30 minutes).
The rainfall simulator (15 sprinklers mounted on 3-meter tall standpipes) distributed water
simultaneously to a runoff plot pair so that infiltration and runoff yield could be observed and
recorded while rainfall variability was minimized. At the conclusion of each simulation run the
total amount of runoff in the runoff collection tanks was measured and recorded.
4-3
image:
 Table 1. Organic carbon, plant nutrient, and heavy metal analysis of Albuquerque
municipal biosolids, loading rates from the Sevilleta biosolids application project, and
U.S. Environmental Protection Agency (USEPA) loading limits.
Albuquerque Biosolids
OC TKN P Cu Pb Zn
(%) (mg/kg)
20.1 2.62 2.37 635 232 921
USEPA Limits (mg/kg)1 4,300 840 7,500
Sevilleta Biosolids Loading Rates
OC TKN P Cu Pb Zn
(kg/ha) (kg/ha)
9,045 1,175 1,066 28.57 10.44 41.44
USEPA Limits (kg/ha)2 1,500 300 2,800
1USEPA ceiling concentrations for municipal biosolids (USEPA, 1993).
2USEPA cumulative pollutant loading rates for land application of municipal biosolids
(USEPA, 1993)
Soil and Vegetation Analyses
Soil samples were collected once before the biosolids treatment (Fall/Winter 1990) and three
times following the treatment (Fall 1991, Spring 1992, Fall 1992) in all 10 X 10 m plots. The
fall sampling periods followed the late summer to early fall convective thunderstorm period and
the spring sampling period followed the winter/spring precipitation period.
Five composite soil samples were collected from each of the three sampling depths, (0-5, 5-10,
10-15 cm) within each 10 X 10 m plot during the scheduled sampling periods. Each composite
sample was composed of five randomly selected subsamples. Results from other studies (e.g.,
Davis et al., 1988) suggested that the depth resolution of this sampling procedure would allow
4-4
image:
Table 1. Organic carbon, plant nutrient, and heavy metal analysis of Albuquerque
municipal biosolids, loading rates from the Sevilleta biosolids application project, and
U.S. Environmental Protection Agency (USEPA) loading limits.
Albuquerque Biosolids
OC TKN P Cu Pb Zn
(%) (mg/kg)
20.1 2.62 2.37 635 232 921
USEPA Limits (mg/kg)1 4,300 840 7,500
Sevilleta Biosolids Loading Rates
OC TKN P Cu Pb Zn
(kg/ha) (kg/ha)
9,045 1,175 1,066 28.57 10.44 41.44
USEPA Limits (kg/ha)2 1,500 300 2,800
1USEPA ceiling concentrations for municipal biosolids (USEPA, 1993).
2USEPA cumulative pollutant loading rates for land application of municipal biosolids
(USEPA, 1993)
Soil and Vegetation Analyses
Soil samples were collected once before the biosolids treatment (Fall/Winter 1990) and three
times following the treatment (Fall 1991, Spring 1992, Fall 1992) in all 10 X 10 m plots. The
fall sampling periods followed the late summer to early fall convective thunderstorm period and
the spring sampling period followed the winter/spring precipitation period.
Five composite soil samples were collected from each of the three sampling depths, (0-5, 5-10,
10-15 cm) within each 10 X 10 m plot during the scheduled sampling periods. Each composite
sample was composed of five randomly selected subsamples. Results from other studies (e.g.,
Davis et al., 1988) suggested that the depth resolution of this sampling procedure would allow
4-4
image:
 an accurate trace of the vertical movement of specific nutrients and contaminants through the soil
profile.
Soil samples were analyzed for pH, electrical conductivity (EC), organic carbon (OC), total
nitrogen (TKN), KC1 extractable NH4-N and N03-N, NaHC03 extractable phosphorus, and
DTPA (Diethylenetriaminepentaacetic acid) extractable heavy metals (Cd, Cu, Pb, Zn).
Characterization of vegetation (aboveground foliar cover) followed the same general schedule
as soil characterization and sampling. Changes in aboveground plant cover were determined
using a line-intercept technique developed by SNWR-LTER researchers. Transect intercepts
were recorded for individual plant species and other ground cover categories including plant
litter, bare soil, gravel, and biosolids.
Blue grama grass (four composite samples per large plot, and two composite samples per runoff
plot) and yellow spiny-aster (one composite sample per large and runoff plot) aboveground tissue
samples were collected in Fall 1992 and analyzed for total nitrogen and total heavy metal
content.
A more detailed description of the methods and procedures is published in Aguilar et al. (1994).
Statistical Analysis
Data sets that included repeated measures (time or time and depth) were analyzed with SPSS
(Statistical Package for the Social Sciences) repeated measures multivariate analysis of variance
to test for significant interactions among main factors (treatment, time, and depth). Data sets that
included both time and depth as repeated measures were analyzed with consecutive repeated
measures MANOVA tests (depth then time) using adjusted alpha values (cc=0.025) to test for
significant interactions among main factors (treatment, time, and depth). Unless otherwise
noted, an a (type I error rate) of 0.05 was adopted for all of the statistical analyses.
Results and Discussion
Soil Response
An increase in plant-available nutrients is an important step towards increasing aboveground
plant cover and stabilizing soils. Biosolids are an excellent source of nitrogen and phosphorus
(Table 1), two plant nutrients that are often limiting in terrestrial ecosystems.
Mineral nitrogen increased significantly in biosolids-treated soils (Table 2). Most of the mineral
nitrogen present in anaerobically digested biosolids is in the form of ammonium (NH4).
Therefore, it is not surprising that the peak NH4-N response occurred in the first sampling period
following biosolids application (Fall 1991). Ammonium is relatively immobile in soils and,
consequently, the largest response was in the surface (0-5 cm) depth. In aerated soils NH4 is
rapidly converted to NO3 through the process of nitrification which explains why soil N03-N
levels peaked after soil NH4-N. Nitrate is mobile in soil and significant increases in NO3-N were
detected in the 5-10 and 10-15 cm depths. Sodium bicarbonate-extractable phosphorus, an index
of plant-available phosphorus, increased significantly following the biosolids application.
4-5
image:
an accurate trace of the vertical movement of specific nutrients and contaminants through the soil
profile.
Soil samples were analyzed for pH, electrical conductivity (EC), organic carbon (OC), total
nitrogen (TKN), KC1 extractable NH4-N and N03-N, NaHC03 extractable phosphorus, and
DTPA (Diethylenetriaminepentaacetic acid) extractable heavy metals (Cd, Cu, Pb, Zn).
Characterization of vegetation (aboveground foliar cover) followed the same general schedule
as soil characterization and sampling. Changes in aboveground plant cover were determined
using a line-intercept technique developed by SNWR-LTER researchers. Transect intercepts
were recorded for individual plant species and other ground cover categories including plant
litter, bare soil, gravel, and biosolids.
Blue grama grass (four composite samples per large plot, and two composite samples per runoff
plot) and yellow spiny-aster (one composite sample per large and runoff plot) aboveground tissue
samples were collected in Fall 1992 and analyzed for total nitrogen and total heavy metal
content.
A more detailed description of the methods and procedures is published in Aguilar et al. (1994).
Statistical Analysis
Data sets that included repeated measures (time or time and depth) were analyzed with SPSS
(Statistical Package for the Social Sciences) repeated measures multivariate analysis of variance
to test for significant interactions among main factors (treatment, time, and depth). Data sets that
included both time and depth as repeated measures were analyzed with consecutive repeated
measures MANOVA tests (depth then time) using adjusted alpha values (cc=0.025) to test for
significant interactions among main factors (treatment, time, and depth). Unless otherwise
noted, an a (type I error rate) of 0.05 was adopted for all of the statistical analyses.
Results and Discussion
Soil Response
An increase in plant-available nutrients is an important step towards increasing aboveground
plant cover and stabilizing soils. Biosolids are an excellent source of nitrogen and phosphorus
(Table 1), two plant nutrients that are often limiting in terrestrial ecosystems.
Mineral nitrogen increased significantly in biosolids-treated soils (Table 2). Most of the mineral
nitrogen present in anaerobically digested biosolids is in the form of ammonium (NH4).
Therefore, it is not surprising that the peak NH4-N response occurred in the first sampling period
following biosolids application (Fall 1991). Ammonium is relatively immobile in soils and,
consequently, the largest response was in the surface (0-5 cm) depth. In aerated soils NH4 is
rapidly converted to NO3 through the process of nitrification which explains why soil N03-N
levels peaked after soil NH4-N. Nitrate is mobile in soil and significant increases in NO3-N were
detected in the 5-10 and 10-15 cm depths. Sodium bicarbonate-extractable phosphorus, an index
of plant-available phosphorus, increased significantly following the biosolids application.
4-5
image:
 Table 2. Plant nutrient and organic carbon content of control and biosolids-treated soils. Means
within a depth with the same
Depth Treatment
Ammonium Nitrogen (mg/kg)
0-5 cm Control
Biosolids
5- 10 cm Control
Biosolids
10-15 cm Control
Biosolids
Nitate Nitrogen (mg/kg)
0-5 cm Control
Biosolids
5- 10 cm Control
Biosolids
10-15 cm Control
Biosolids
letter are not significantly
PT
3.90df
3.55ef
3.41d.
3.61d
4.04bc
3.64c
7.62c
7.52c
7.20c
7.22c
9.17c
9.28c
different (P>0.05).
Sampling
F91
3.98de
207a
4.30cd
26.1a
S.Olab
21.4ac
9.16cd
40.5b
6.68cde
39.6b
6.55cde
33.2b
Period
S92
5.07d
136b
5.50c
4L7a
S.Olab
41. Sac
3.16d
82.3a
1.53e
49.9b
1.70e
28.3b
F92
3.00f
44.9c
3.70d
8.56b
3.66c
6.22a
3.64d
39.1b
3.84d
83.6a
3.23d
91.5a
Extractable Phosphorus (mg/kg)
0-5 cm
5-10 cm
10-15 cm
Control
Biosolids
Control
Biosolids
Control
Biosolids
6.51c
6.41c
2.62c
3.13c
1.68cd
1.28d
6.54c
49.0b
2.93c
10.5b
2.27cd
5.39ab
6.35c
64.0a
2.81c
25.7a
2.40bc
10.4ab
Total Kjeldahl Nitrogen (%)
0-5 cm
5-10 cm
1 10-15 cm
Organic
0-5 cm
5-10 cm
Control
Biosolids
Control
Biosolids
Control
Biosolids
Carbon (%)
Control
Biosolids
Control
Biosolids
10-15 cm Control
Biosolids
709c
700c
950a
840a
988a
1075a
0.71a
0.87a
0.83a
1.03a
0.98a
1.19a
726c
1267a
852a
1057a
1035a
1165a
0.71a
O.SOa
O.Sla
0.85a
0.87a
0.89a
733c
1240a
899a
lllla
1053a
1207a
0.62a
0.70a
0.72a
0.74a
O.SOa
0.84a
5.55c
58.6ab
3.12c
18.6a
2.28c
5.53a
697c
1038b
883a
1105a
1017a
1225a
0.63a
0.73a
0.74a
O.Sla
O.Sla
0.86a
4-6
image:
Table 2. Plant nutrient and organic carbon content of control and biosolids-treated soils. Means
within a depth with the same
Depth Treatment
Ammonium Nitrogen (mg/kg)
0-5 cm Control
Biosolids
5- 10 cm Control
Biosolids
10-15 cm Control
Biosolids
Nitate Nitrogen (mg/kg)
0-5 cm Control
Biosolids
5- 10 cm Control
Biosolids
10-15 cm Control
Biosolids
letter are not significantly
PT
3.90df
3.55ef
3.41d.
3.61d
4.04bc
3.64c
7.62c
7.52c
7.20c
7.22c
9.17c
9.28c
different (P>0.05).
Sampling
F91
3.98de
207a
4.30cd
26.1a
S.Olab
21.4ac
9.16cd
40.5b
6.68cde
39.6b
6.55cde
33.2b
Period
S92
5.07d
136b
5.50c
4L7a
S.Olab
41. Sac
3.16d
82.3a
1.53e
49.9b
1.70e
28.3b
F92
3.00f
44.9c
3.70d
8.56b
3.66c
6.22a
3.64d
39.1b
3.84d
83.6a
3.23d
91.5a
Extractable Phosphorus (mg/kg)
0-5 cm
5-10 cm
10-15 cm
Control
Biosolids
Control
Biosolids
Control
Biosolids
6.51c
6.41c
2.62c
3.13c
1.68cd
1.28d
6.54c
49.0b
2.93c
10.5b
2.27cd
5.39ab
6.35c
64.0a
2.81c
25.7a
2.40bc
10.4ab
Total Kjeldahl Nitrogen (%)
0-5 cm
5-10 cm
1 10-15 cm
Organic
0-5 cm
5-10 cm
Control
Biosolids
Control
Biosolids
Control
Biosolids
Carbon (%)
Control
Biosolids
Control
Biosolids
10-15 cm Control
Biosolids
709c
700c
950a
840a
988a
1075a
0.71a
0.87a
0.83a
1.03a
0.98a
1.19a
726c
1267a
852a
1057a
1035a
1165a
0.71a
O.SOa
O.Sla
0.85a
0.87a
0.89a
733c
1240a
899a
lllla
1053a
1207a
0.62a
0.70a
0.72a
0.74a
O.SOa
0.84a
5.55c
58.6ab
3.12c
18.6a
2.28c
5.53a
697c
1038b
883a
1105a
1017a
1225a
0.63a
0.73a
0.74a
O.Sla
O.Sla
0.86a
4-6
image:
 Table 3. Heavy metal and pH analyses of control and biosolids-treated soils. Means within a depth
with the same letter are not significantly different (P>0.05).
Depth
Treatment
PT
Sampling
F91
Period
S92
F92
pH (-log[H+]) (averaged across depths)
0-1 5 cm
Control
Biosolids
7.58a
7.56a
7.66a
7.46ab
7.52a
7.22bc
7.46ab
7.14c
DTPA Extractable Cu (mg/kg)
0-5 cm
5-1 Ocm
10-1 5 cm
Control
Biosolids
Control
Biosolids
Control
Biosolids
1.18b
1.12b
1.72a
1.58a
2.56a
2.28b
0.61d
3.05a
0.56d
1.06b
0.59d
0.81d
0.73c
3.71a
0.65c
1.52a
0.66d
1.01c
0.90bc
3.79a
0.91b
1.64a
1.00c
1.52c
DTPA Extractable Pb (mg/kg)
0-5 cm
5-1 Ocm
10-1 5 cm
Control
Biosolids
Control
Biosolids
Control
Biosolids
1.11d
1.13d
0.72e
0.82de
0.60e
OJOde
1.75ab
1.98a
1.24a
1 .54ace
1.18a
1.01ab
1.45c
1.67b
1.02bc
1.11ab
0.91 be
0.95bc
1.23d
1.50c
0.91cd
0.97cd
0.84cd
0.86c
DTPA Extractable Zn (mg/kg)
0-5 cm
5-1 Ocm
10-1 5 cm
Control
Biosolids
Control
Biosolids
Control
Biosolids
0.65bd
0.65b
0.41 be
0.41 be
0.36a
0.35a
0.48c
2.02a
0.1 7e
0.36bcd
0.1 4d
0.23ad
0.63bd
1.98a
0.24d
0.56a
0.1 9bd
0.32ac
0.53cd
1.64a
O.SOcd
0.52ab
0.23bcd
0.35ab
4-7
image:
Table 3. Heavy metal and pH analyses of control and biosolids-treated soils. Means within a depth
with the same letter are not significantly different (P>0.05).
Depth
Treatment
PT
Sampling
F91
Period
S92
F92
pH (-log[H+]) (averaged across depths)
0-1 5 cm
Control
Biosolids
7.58a
7.56a
7.66a
7.46ab
7.52a
7.22bc
7.46ab
7.14c
DTPA Extractable Cu (mg/kg)
0-5 cm
5-1 Ocm
10-1 5 cm
Control
Biosolids
Control
Biosolids
Control
Biosolids
1.18b
1.12b
1.72a
1.58a
2.56a
2.28b
0.61d
3.05a
0.56d
1.06b
0.59d
0.81d
0.73c
3.71a
0.65c
1.52a
0.66d
1.01c
0.90bc
3.79a
0.91b
1.64a
1.00c
1.52c
DTPA Extractable Pb (mg/kg)
0-5 cm
5-1 Ocm
10-1 5 cm
Control
Biosolids
Control
Biosolids
Control
Biosolids
1.11d
1.13d
0.72e
0.82de
0.60e
OJOde
1.75ab
1.98a
1.24a
1 .54ace
1.18a
1.01ab
1.45c
1.67b
1.02bc
1.11ab
0.91 be
0.95bc
1.23d
1.50c
0.91cd
0.97cd
0.84cd
0.86c
DTPA Extractable Zn (mg/kg)
0-5 cm
5-1 Ocm
10-1 5 cm
Control
Biosolids
Control
Biosolids
Control
Biosolids
0.65bd
0.65b
0.41 be
0.41 be
0.36a
0.35a
0.48c
2.02a
0.1 7e
0.36bcd
0.1 4d
0.23ad
0.63bd
1.98a
0.24d
0.56a
0.1 9bd
0.32ac
0.53cd
1.64a
O.SOcd
0.52ab
0.23bcd
0.35ab
4-7
image:
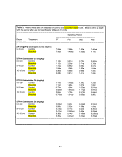 Phosphorus is also relatively immobile in soils and the greatest increases occurred in the 0-5 cm
depth.
The majority of soil TKN is organic nitrogen and an increase in organic nitrogen and/or organic
carbon represents an increase in the potential biological productivity. Organic nitrogen and
carbon can be used by soil microorganisms as a nutrient and energy source which, in turn,
increases soil fertility and plant and ecosystem productivity. Total soil nitrogen increased only
in the 0-5 cm depth and significant increases in soil OC were not observed at any depth (Table
2). Some of the TKN response in the surface was undoubtedly due to the increase in inorganic
nitrogen, however, soil microbial populations respond rapidly to increased nutrient availability
and immobilize inorganic nitrogen into organic forms. This microbiaL response should also
produce an increase in soil OC, however, the increase, if it occurred, may not have been
significant relative to the amount of residual OC present in the soil.
Soil pH is an important controlling factor for nutrient and heavy metal solubility and availability
to plants and microorganisms. Fortunately, most aridland soils are slightly to strongly alkaline,
conditions which decrease heavy metal solubility. In addition, Chang et al. (1992) report that
biosolids application to soils with a pH * 5.5 have not produced heavy metal (Cu, Zn, Ni, Cr)
toxicity problems. Consequently, the significant increases in soil acidity observed in the last two
sampling periods (Table 3) should not present a problem.
Soil Cd levels were consistently below detectable limits (0.02 mg/kg) for the duration of the
project (Table 3). Soil Pb increased significantly only in the 0-5 cm depth, while Cu and Zn both
increased significantly at all depths. Although significant increases were observed, levels of
DTPA extractable metals were very low (<4.0 mg/kg) and did not result in any observable
detrimental effects on vegetation.
Vegetation Response
Surface application of municipal biosolids increased aboveground plant cover but the response
was very dependent upon climatic conditions following application (Loftin and Aguilar 1994).
Precipitation in central New Mexico occurs primarily in the late summer/fall and winter/spring.
The 1991 summer/fall season produced over 180 mm rainfall while the winter/spring and 1992
summer/fall periods produced 200 and 90 mm, respectively. The lack of plant cover response
following the 1991 summer/fall period (Table 4) is partly due to the fact that the biosolids
application covered the plants and they had to grow out from under the biosolids in order to be
measured by the line-intercept method. A significant increase in plant cover on treated plots
occurred in Spring 1992 but only on the 3X10 m plots. The following summer/fall period was
relatively dry and no significant differences in plant cover were observed on either the 10 X 10
or3X 10m plots.
Without adequate water, no amount of fertilizer or mulch will produce a vegetation response.
Surface-applied biosolids might actually inhibit uptake of water under some circumstances.
Many aridland plants have surface roots which can uptake water after a very light rainfall.
Biosolids, or any other mulching material, would absorb the water from a light shower and the
4-8
image:
Phosphorus is also relatively immobile in soils and the greatest increases occurred in the 0-5 cm
depth.
The majority of soil TKN is organic nitrogen and an increase in organic nitrogen and/or organic
carbon represents an increase in the potential biological productivity. Organic nitrogen and
carbon can be used by soil microorganisms as a nutrient and energy source which, in turn,
increases soil fertility and plant and ecosystem productivity. Total soil nitrogen increased only
in the 0-5 cm depth and significant increases in soil OC were not observed at any depth (Table
2). Some of the TKN response in the surface was undoubtedly due to the increase in inorganic
nitrogen, however, soil microbial populations respond rapidly to increased nutrient availability
and immobilize inorganic nitrogen into organic forms. This microbiaL response should also
produce an increase in soil OC, however, the increase, if it occurred, may not have been
significant relative to the amount of residual OC present in the soil.
Soil pH is an important controlling factor for nutrient and heavy metal solubility and availability
to plants and microorganisms. Fortunately, most aridland soils are slightly to strongly alkaline,
conditions which decrease heavy metal solubility. In addition, Chang et al. (1992) report that
biosolids application to soils with a pH * 5.5 have not produced heavy metal (Cu, Zn, Ni, Cr)
toxicity problems. Consequently, the significant increases in soil acidity observed in the last two
sampling periods (Table 3) should not present a problem.
Soil Cd levels were consistently below detectable limits (0.02 mg/kg) for the duration of the
project (Table 3). Soil Pb increased significantly only in the 0-5 cm depth, while Cu and Zn both
increased significantly at all depths. Although significant increases were observed, levels of
DTPA extractable metals were very low (<4.0 mg/kg) and did not result in any observable
detrimental effects on vegetation.
Vegetation Response
Surface application of municipal biosolids increased aboveground plant cover but the response
was very dependent upon climatic conditions following application (Loftin and Aguilar 1994).
Precipitation in central New Mexico occurs primarily in the late summer/fall and winter/spring.
The 1991 summer/fall season produced over 180 mm rainfall while the winter/spring and 1992
summer/fall periods produced 200 and 90 mm, respectively. The lack of plant cover response
following the 1991 summer/fall period (Table 4) is partly due to the fact that the biosolids
application covered the plants and they had to grow out from under the biosolids in order to be
measured by the line-intercept method. A significant increase in plant cover on treated plots
occurred in Spring 1992 but only on the 3X10 m plots. The following summer/fall period was
relatively dry and no significant differences in plant cover were observed on either the 10 X 10
or3X 10m plots.
Without adequate water, no amount of fertilizer or mulch will produce a vegetation response.
Surface-applied biosolids might actually inhibit uptake of water under some circumstances.
Many aridland plants have surface roots which can uptake water after a very light rainfall.
Biosolids, or any other mulching material, would absorb the water from a light shower and the
4-8
image:
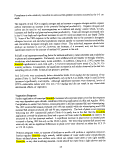 Table 4. Total aboveground plant cover (%) in 10X10 and 3X10 m plots. Means within a
plot size with the same letter are not significantly different (P>0.05).
Sampling Period
Plot Size Treatment PT F91 S92 F92
10 X 10m Control 38.2b 40.8ab 40.2ab 32.7bc
Treated 35.5bc 31.0bc 51.Oa 24.1c
3X10m Control 39.2b 46:9b ~"43.16 37.4b
Treated 39.6b 47.8b 60.1 a 40.4b
water would evaporate before reaching the soil. Of course when rainfall is sufficient to penetrate
the biosolids layer and wet the underlying soil, the biosolids act as a mulch which inhibits
evaporation and increases soil water availability. The magnitude, rate, and direction of
vegetation response to biosolids application is dependent upon the climatic conditions following
application. Thus it is difficult to predict the immediate response of vegetation to biosolids
application at any one site. However, visual observations of the experimental plots in subsequent
years indicate that aboveground cover has been increasing.
Changes in plant tissue nitrogen provide an index of the nitrogen captured by the system during
the relatively brief period of elevated nitrogen availability following the biosolids amendment.
Changes in heavy metal content of plant tissues provide an indication of heavy metal uptake and
potential transport to higher trophic levels. Blue grama grass and yellow spiny-aster were chosen
for tissue analysis because they are the most abundant grass and forb, respectively, on the site.
Both species showed significantly greater aboveground tissue TKN and Cu on treated plots,
while Zn levels were not significantly different (Table 5). Plant tissue Cd and Pb were below
detection limits (1.0 and 10.0 mg/kg, respectively) on both treated and control plots and are not
included in Table 5.
Hydrological Response
Results from 1993 rainfall simulations support previously published results from 1991 and 1992
(Aguilar and Loftin 1992; Aguilar et al. 1994). Surface runoff from biosolids-treated plots was
significantly less than runoff from controls for all simulation experiments (Table 6). Due to dry
soil conditions it was necessary to conduct "wet" and "very wet" simulations in 1992 and 1993
in order to generate runoff from either control or treated plots. Wet and very wet simulations
were conducted within 24 and 1 hr, respectively, of the initial simulation. Although not
statistically testable, the results from the wet and very wet runs indicate that surface-applied
biosolids reduced surface runoff even under conditions of high (near saturation) soil moisture
content. During simulations, water on the control plots quickly puddled (standing water) on
4-9
image:
Table 4. Total aboveground plant cover (%) in 10X10 and 3X10 m plots. Means within a
plot size with the same letter are not significantly different (P>0.05).
Sampling Period
Plot Size Treatment PT F91 S92 F92
10 X 10m Control 38.2b 40.8ab 40.2ab 32.7bc
Treated 35.5bc 31.0bc 51.Oa 24.1c
3X10m Control 39.2b 46:9b ~"43.16 37.4b
Treated 39.6b 47.8b 60.1 a 40.4b
water would evaporate before reaching the soil. Of course when rainfall is sufficient to penetrate
the biosolids layer and wet the underlying soil, the biosolids act as a mulch which inhibits
evaporation and increases soil water availability. The magnitude, rate, and direction of
vegetation response to biosolids application is dependent upon the climatic conditions following
application. Thus it is difficult to predict the immediate response of vegetation to biosolids
application at any one site. However, visual observations of the experimental plots in subsequent
years indicate that aboveground cover has been increasing.
Changes in plant tissue nitrogen provide an index of the nitrogen captured by the system during
the relatively brief period of elevated nitrogen availability following the biosolids amendment.
Changes in heavy metal content of plant tissues provide an indication of heavy metal uptake and
potential transport to higher trophic levels. Blue grama grass and yellow spiny-aster were chosen
for tissue analysis because they are the most abundant grass and forb, respectively, on the site.
Both species showed significantly greater aboveground tissue TKN and Cu on treated plots,
while Zn levels were not significantly different (Table 5). Plant tissue Cd and Pb were below
detection limits (1.0 and 10.0 mg/kg, respectively) on both treated and control plots and are not
included in Table 5.
Hydrological Response
Results from 1993 rainfall simulations support previously published results from 1991 and 1992
(Aguilar and Loftin 1992; Aguilar et al. 1994). Surface runoff from biosolids-treated plots was
significantly less than runoff from controls for all simulation experiments (Table 6). Due to dry
soil conditions it was necessary to conduct "wet" and "very wet" simulations in 1992 and 1993
in order to generate runoff from either control or treated plots. Wet and very wet simulations
were conducted within 24 and 1 hr, respectively, of the initial simulation. Although not
statistically testable, the results from the wet and very wet runs indicate that surface-applied
biosolids reduced surface runoff even under conditions of high (near saturation) soil moisture
content. During simulations, water on the control plots quickly puddled (standing water) on
4-9
image:
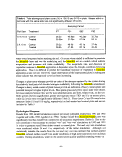 Table 5. TKN, Cu, and Zn concentrations in aboveground tissues from blue grama grass
and yellow spiny-aster. Means, within a species and analysis, followed by the same letter
are not significantly different (P>0.05).
Treatment TKN (%) Cu (mg/kg) Zn (mg/kg)
Blue Grama Grass
Control 1.18b 1.95b 12.40a
Treated 2.19a 3.75a 9.95a
Yellow Spiny-Aster
Control 1.75b 8.18b 30.91 a
Treated 2.49a 23.63a 41.54a
bare soil and then flowed downslope from one bare spot to the next. Surface-applied biosolids
filled bare spaces and initially absorbed precipitation until saturated. Even when treated areas
puddled after the biosolids became saturated, the water rarely flowed because of the increased
surface resistance. Water was held in place until it infiltrated the soil.
Conclusions
Surface application of biosolids to a degraded semiarid grassland increased plant-available
nitrogen (NH4-H and NO3-N) and phosphorus, and increased the total nitrogen content of
aboveground plant tissues. Soil and plant tissue heavy metal levels were also increased. Soil
heavy metal contents did not reach levels which are likely to be phytotoxic, and no phytotoxic
effects were observed. Unfortunately, information is currently not available to evaluate the
potential long-term effects of increased Cu contents in aboveground plant tissues.
Total soil nitrogen and total plant nitrogen increased significantly following biosolids
application. Increases in total soil and plant nitrogen represent positive responses by the
biological components of this semiarid grassland ecosystem. The period of increased
biologically-available mineral nitrogen following biosolids application is relatively brief.
Nitrogen assimilated into organic biomass by plants and soil microorganisms can be retained
within the system and used to support future productivity.
Soil organic carbon is an important factor in controlling nutrient and water retention and
availability. Furthermore, soil organic carbon improves soil physical structure and decreases soil
erosion potential. Unfortunately, no increase in soil organic carbon was detected after two
growing seasons. In an earlier Forest Service biosolids project, no significant differences in soil
organic matter were observed eight years after application (Loftin et al. 1995). Plant root
production is the major soil organic matter source and there is evidence to support the
assumption that plants will not allocate carbon to roots when nutrients are readily available
(Chapin et al. 1987; Loftin and Aguilar 1994). We hypothesize that any increase in soil organic
carbon, if it does occur, will be a long-term response that will occur only after plants are nutrient
4-10
image:
Table 5. TKN, Cu, and Zn concentrations in aboveground tissues from blue grama grass
and yellow spiny-aster. Means, within a species and analysis, followed by the same letter
are not significantly different (P>0.05).
Treatment TKN (%) Cu (mg/kg) Zn (mg/kg)
Blue Grama Grass
Control 1.18b 1.95b 12.40a
Treated 2.19a 3.75a 9.95a
Yellow Spiny-Aster
Control 1.75b 8.18b 30.91 a
Treated 2.49a 23.63a 41.54a
bare soil and then flowed downslope from one bare spot to the next. Surface-applied biosolids
filled bare spaces and initially absorbed precipitation until saturated. Even when treated areas
puddled after the biosolids became saturated, the water rarely flowed because of the increased
surface resistance. Water was held in place until it infiltrated the soil.
Conclusions
Surface application of biosolids to a degraded semiarid grassland increased plant-available
nitrogen (NH4-H and NO3-N) and phosphorus, and increased the total nitrogen content of
aboveground plant tissues. Soil and plant tissue heavy metal levels were also increased. Soil
heavy metal contents did not reach levels which are likely to be phytotoxic, and no phytotoxic
effects were observed. Unfortunately, information is currently not available to evaluate the
potential long-term effects of increased Cu contents in aboveground plant tissues.
Total soil nitrogen and total plant nitrogen increased significantly following biosolids
application. Increases in total soil and plant nitrogen represent positive responses by the
biological components of this semiarid grassland ecosystem. The period of increased
biologically-available mineral nitrogen following biosolids application is relatively brief.
Nitrogen assimilated into organic biomass by plants and soil microorganisms can be retained
within the system and used to support future productivity.
Soil organic carbon is an important factor in controlling nutrient and water retention and
availability. Furthermore, soil organic carbon improves soil physical structure and decreases soil
erosion potential. Unfortunately, no increase in soil organic carbon was detected after two
growing seasons. In an earlier Forest Service biosolids project, no significant differences in soil
organic matter were observed eight years after application (Loftin et al. 1995). Plant root
production is the major soil organic matter source and there is evidence to support the
assumption that plants will not allocate carbon to roots when nutrients are readily available
(Chapin et al. 1987; Loftin and Aguilar 1994). We hypothesize that any increase in soil organic
carbon, if it does occur, will be a long-term response that will occur only after plants are nutrient
4-10
image:
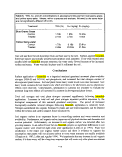 limited. It may take at least ten years for nutrient-limiting conditions to return following a
biosolids treatment of this type.
The increase in plant nutrient availability resulted in an increase in plant cover, but only when
water was available. This is an important point that needs to be stressed. Aridlands are, by
definition, water-limited and no restoration program will succeed without adequate water for
plant growth. It is generally accepted that a surface mulch of almost any organic material can
increase the time and amount of soil water retention and our runoff data showed that surface-
applied biosolids did increase the retention of precipitation following relatively heavy rainfall
(40-80 mm/hr for 30 minutes). However, a surface layer of biosolids (or any other organic
material) will intercept some precipitation -and release it to the atmosphere via precipitation
before it reaches the soil. This phenomenon could limit the effectiveness of light rainfall events.
Acknowledgements
The authors would like to thank the following agencies for their cooperation and support; the
New Mexico Water Resources Research Institute, the City of Albuquerque Wastewater Utility
Division, the USDI Bureau of Land Management, the USDI Fish and Wildlife Service, and the
University of New Mexico Sevilleta Long Term Ecological Research Program.
Authors are Ecologist, USDA Forest Service, Rocky Mountain Forest and Range Experiment
Station, Albuquerque, NM, and Soil Scientist, Sandia National Laboratory, Albuquerque, NM.
Requests for reprints should be directed to Samuel R. Loftin, Rocky Mountain Forest and Range
Experiment Station, 2205 Columbia SE, Albuquerque, NM 87106.
4-11
image:
limited. It may take at least ten years for nutrient-limiting conditions to return following a
biosolids treatment of this type.
The increase in plant nutrient availability resulted in an increase in plant cover, but only when
water was available. This is an important point that needs to be stressed. Aridlands are, by
definition, water-limited and no restoration program will succeed without adequate water for
plant growth. It is generally accepted that a surface mulch of almost any organic material can
increase the time and amount of soil water retention and our runoff data showed that surface-
applied biosolids did increase the retention of precipitation following relatively heavy rainfall
(40-80 mm/hr for 30 minutes). However, a surface layer of biosolids (or any other organic
material) will intercept some precipitation -and release it to the atmosphere via precipitation
before it reaches the soil. This phenomenon could limit the effectiveness of light rainfall events.
Acknowledgements
The authors would like to thank the following agencies for their cooperation and support; the
New Mexico Water Resources Research Institute, the City of Albuquerque Wastewater Utility
Division, the USDI Bureau of Land Management, the USDI Fish and Wildlife Service, and the
University of New Mexico Sevilleta Long Term Ecological Research Program.
Authors are Ecologist, USDA Forest Service, Rocky Mountain Forest and Range Experiment
Station, Albuquerque, NM, and Soil Scientist, Sandia National Laboratory, Albuquerque, NM.
Requests for reprints should be directed to Samuel R. Loftin, Rocky Mountain Forest and Range
Experiment Station, 2205 Columbia SE, Albuquerque, NM 87106.
4-11
image:
 Table 6. Rainfall and runoff relationships during rainfall simulation experiments at the Sevilleta
National Wildlife Refuge1. Values are means of three plots from the low (L) or high (H) slope class
unless otherwise noted as "wet" (W), or "very wet" (VW) which are values from individual rainfall
simulations. Runoff/rainfall means, within a date and slope class, followed by the same letter were
not significantly different (P>0.05).
Date
Plot
Slope (%) Rainfall (mm) Runoff (mm) Runoff/Rainfall
September 1991
Control (L) 6.1
Treated (L) 6.2
Control (H) 10.1
Treated (H) 10.3
September 1992
Control (L) 6.1
Treated (L) 6.2
Con (L) VW2 5.9
Trt (L) VW 6.0
Control (H) 10.1
Treated (H) 10.3
Con(H)VW 10.3
Trt(H)VW 10.1
September 1993
Control (L) 6.1
Treated (L) 6.2
Con (L) VW 5.9
Trt (L) VW 6.0
Control (H) 10.1
Treated (H) 10.3
Con (H) W3 9.9
Trt(H)W 10.8
Con(H)VW 10.3
Trt(H)VW 10.1
44.7
43.9
33.8
35.8
38.2
44.1
48.0
36.0
33.6
43.9
46.6
40.2
45.8
45.6
45.4
31.8
35.7
39.2
35.1
45.7
49.3
26.5
9.0
-0.1
6.9
0.2
0.4
0.0
11.6
0.0
0.1
0.0
3.7
0.0
7.9
0.0
17.7
0.0
6.0
0.1
9.3
2.4
19.1
0.0
0198a
O.OOSb
0.164a
0.0056b
0.0079a
O.OOOb
0.242
0.000
0.0029a
O.OOOb
0.079
0.000
0.174a
O.OOOb
0.390
0.000
0.154a
0.002b
0.265
0.053
0.0387
0.000
1 All plots were 30 m2 and rainfall simulation experiments lasted 30 minutes.
2 vw- "very wet" - second simulation conducted within 1 hr following initial simulation.
3 W- "wet" - second simulation conducted within 24 hr following initial simulation.
4-12
image:
Table 6. Rainfall and runoff relationships during rainfall simulation experiments at the Sevilleta
National Wildlife Refuge1. Values are means of three plots from the low (L) or high (H) slope class
unless otherwise noted as "wet" (W), or "very wet" (VW) which are values from individual rainfall
simulations. Runoff/rainfall means, within a date and slope class, followed by the same letter were
not significantly different (P>0.05).
Date
Plot
Slope (%) Rainfall (mm) Runoff (mm) Runoff/Rainfall
September 1991
Control (L) 6.1
Treated (L) 6.2
Control (H) 10.1
Treated (H) 10.3
September 1992
Control (L) 6.1
Treated (L) 6.2
Con (L) VW2 5.9
Trt (L) VW 6.0
Control (H) 10.1
Treated (H) 10.3
Con(H)VW 10.3
Trt(H)VW 10.1
September 1993
Control (L) 6.1
Treated (L) 6.2
Con (L) VW 5.9
Trt (L) VW 6.0
Control (H) 10.1
Treated (H) 10.3
Con (H) W3 9.9
Trt(H)W 10.8
Con(H)VW 10.3
Trt(H)VW 10.1
44.7
43.9
33.8
35.8
38.2
44.1
48.0
36.0
33.6
43.9
46.6
40.2
45.8
45.6
45.4
31.8
35.7
39.2
35.1
45.7
49.3
26.5
9.0
-0.1
6.9
0.2
0.4
0.0
11.6
0.0
0.1
0.0
3.7
0.0
7.9
0.0
17.7
0.0
6.0
0.1
9.3
2.4
19.1
0.0
0198a
O.OOSb
0.164a
0.0056b
0.0079a
O.OOOb
0.242
0.000
0.0029a
O.OOOb
0.079
0.000
0.174a
O.OOOb
0.390
0.000
0.154a
0.002b
0.265
0.053
0.0387
0.000
1 All plots were 30 m2 and rainfall simulation experiments lasted 30 minutes.
2 vw- "very wet" - second simulation conducted within 1 hr following initial simulation.
3 W- "wet" - second simulation conducted within 24 hr following initial simulation.
4-12
image:
 Literature Cited
Aguilar, R. and S.R. Loftin. 1992. Sewage sludge application in semiarid grasslands: effects
on runoff and surface water quality, pp 211-220. In: C.T. Ortega-Klett (ed.)
Proceedings of the 36th Annual New Mexico Water Conference. New Mexico
Water Res. Research Inst. Nov. 7-8, 1991, Las Cruces, NM.
Aguilar, R., S.R. Loftin, and P.R. Fresquez. 1994. Rangeland restoration with treated municipal
sewage sludge. In: Clapp, C.E., W.E. Larson, and R.H. Dowdy. Sewage Sludge:
Land Utilization and the Environment. ASA-CSSA-SSSA, Madison, WI.
Alloway, B.J. and A.P. Jackson. 1991. The behavior of heavy metals in sewage sludge-
amended soils. Science of the Total Environ. 100:151-176.
Chang, A.C., T.C. Granato, and A.L. Page. 1992. A methodology for establishing phytotoxicity
criteria for chromium, copper, nickel, and zinc in agricultural land application of
municipal sewage sludges. J. of Environ. Qual. 21(4):521-536.
Chapin, F.S.IIL, A.J. Bloom, C.B. Field, and R.H. Waring. 1987. Plant responses to multiple
environmental factors. Bioscience 37(l):49-57.
Davis, R.D., C.H. Carlton-Smith, J.H. Stark, and J.A. Campbell. 1988. Distribution of metals
in grassland soils following surface applications of sewage sludge. Environ. Poll.
49:99-115.
Dortignac, E.J., and W.C. Hickey, Jr. 1963. Surface runoff and erosion as affected by soil
ripping. Presented at the Second Federal Interagency Conference on
Sedimentation held at Jackson, MS on January 1963; U.S. Dept. of Agric., Forest
Service, Washington, DC 13 p.
El-Tayeb, O.M. and J. Skujins. 1989. Introduction: potential of biological processes in
desertification control. Arid Soil Res. and Rehab. 3:91-98.
Fresquez, P.R., R.E. Francis and G.L. Dennis. 1990. Soil and vegetation responses to sewage
sludge on a degraded semiarid broom snakeweed/blue grama plant community.
J. of Range Manage. 43:325-331.
Fresquez, P.R., R. Aguilar, R.E. Francis and E.F. Aldon. 1991. Heavy metal uptake by blue
grama growing in a degraded semiarid soil amended with sewage sludge. J. of
Water, Air and Soil Poll. 57-58:903-912.
Glaub, J.C. and C.G. Golueke. 1989. Municipal organic wastes and composts for arid areas.
Arid Soil Res. and Rehab. 3:171-184.
4-13
image:
Literature Cited
Aguilar, R. and S.R. Loftin. 1992. Sewage sludge application in semiarid grasslands: effects
on runoff and surface water quality, pp 211-220. In: C.T. Ortega-Klett (ed.)
Proceedings of the 36th Annual New Mexico Water Conference. New Mexico
Water Res. Research Inst. Nov. 7-8, 1991, Las Cruces, NM.
Aguilar, R., S.R. Loftin, and P.R. Fresquez. 1994. Rangeland restoration with treated municipal
sewage sludge. In: Clapp, C.E., W.E. Larson, and R.H. Dowdy. Sewage Sludge:
Land Utilization and the Environment. ASA-CSSA-SSSA, Madison, WI.
Alloway, B.J. and A.P. Jackson. 1991. The behavior of heavy metals in sewage sludge-
amended soils. Science of the Total Environ. 100:151-176.
Chang, A.C., T.C. Granato, and A.L. Page. 1992. A methodology for establishing phytotoxicity
criteria for chromium, copper, nickel, and zinc in agricultural land application of
municipal sewage sludges. J. of Environ. Qual. 21(4):521-536.
Chapin, F.S.IIL, A.J. Bloom, C.B. Field, and R.H. Waring. 1987. Plant responses to multiple
environmental factors. Bioscience 37(l):49-57.
Davis, R.D., C.H. Carlton-Smith, J.H. Stark, and J.A. Campbell. 1988. Distribution of metals
in grassland soils following surface applications of sewage sludge. Environ. Poll.
49:99-115.
Dortignac, E.J., and W.C. Hickey, Jr. 1963. Surface runoff and erosion as affected by soil
ripping. Presented at the Second Federal Interagency Conference on
Sedimentation held at Jackson, MS on January 1963; U.S. Dept. of Agric., Forest
Service, Washington, DC 13 p.
El-Tayeb, O.M. and J. Skujins. 1989. Introduction: potential of biological processes in
desertification control. Arid Soil Res. and Rehab. 3:91-98.
Fresquez, P.R., R.E. Francis and G.L. Dennis. 1990. Soil and vegetation responses to sewage
sludge on a degraded semiarid broom snakeweed/blue grama plant community.
J. of Range Manage. 43:325-331.
Fresquez, P.R., R. Aguilar, R.E. Francis and E.F. Aldon. 1991. Heavy metal uptake by blue
grama growing in a degraded semiarid soil amended with sewage sludge. J. of
Water, Air and Soil Poll. 57-58:903-912.
Glaub, J.C. and C.G. Golueke. 1989. Municipal organic wastes and composts for arid areas.
Arid Soil Res. and Rehab. 3:171-184.
4-13
image:
 Hurlbert, S.H. 1984. Pseudoreplication and the design of ecological field experiments. Ecol.
Mono. 54(2): 187-211.
Klein, D.A. 1989. Cellulose functions in arid soil development. Arid Soil Res. and Rehab.
3:185-198.
Loftin, S.R. and R. Aguilar. 1994. Semiarid rangeland response to municipal sewage sludge:
plant growth and litter decomposition, pp 221-229. In: Clapp, C.E., W.E. Larson,
and R.H. Dowdy (eds.). Sewage Sludge: Land Utilization and the Environment.
ASA-CSSA-SSSA, Madison, WI.
Loftin, S.R., R. Aguilar, and P.R. Fresquez. 1995. Rangeland restoration with surface-applied
biosolids: effects on soils and vegetation of the Rio Puerco Watershed,
Northcentral NM. (this issue).
Naveh, Z. 1988. Multifactorial reconstruction of semiarid Mediterranean landscapes for
multipurpose land uses. In: Allen, E.A. (ed.). The reconstruction of disturbed
arid lands: an ecological approach. AAAS Selected Symposium 109.
Parr, J.F., R.I. Papendick, S.B. Hornick, D. Colacicco. 1989. Use of organic amendments for
increasing the productivity of arid lands. Arid Soil Res. and Rehab. 3:149-170.
Sheridan, D. 1981. Desertification of the United States. Council on Environmental Quality.
U.S. Government Publishing Office. Washington D.C.
U.S. Department of Agriculture, Soil Conservation Service. 1988. Soil Survey ofSocorro
County Area, New Mexico. U.S. Government Printing Press, Washington D.C.
U.S. Environmental Protection Agency. 1993. 40 CFR - Parts 257 and 503, Standards for the
disposal of sewage sludge; final rule.
Ward, T.J. 1986. A study of runoff and erosion processes using large and small area rainfall
simulators. New Mexico Water Resources Research Institute (WRRI) Report No.
215. New Mexico State University, Las Cruces, New Mexico.
4-14
image:
Hurlbert, S.H. 1984. Pseudoreplication and the design of ecological field experiments. Ecol.
Mono. 54(2): 187-211.
Klein, D.A. 1989. Cellulose functions in arid soil development. Arid Soil Res. and Rehab.
3:185-198.
Loftin, S.R. and R. Aguilar. 1994. Semiarid rangeland response to municipal sewage sludge:
plant growth and litter decomposition, pp 221-229. In: Clapp, C.E., W.E. Larson,
and R.H. Dowdy (eds.). Sewage Sludge: Land Utilization and the Environment.
ASA-CSSA-SSSA, Madison, WI.
Loftin, S.R., R. Aguilar, and P.R. Fresquez. 1995. Rangeland restoration with surface-applied
biosolids: effects on soils and vegetation of the Rio Puerco Watershed,
Northcentral NM. (this issue).
Naveh, Z. 1988. Multifactorial reconstruction of semiarid Mediterranean landscapes for
multipurpose land uses. In: Allen, E.A. (ed.). The reconstruction of disturbed
arid lands: an ecological approach. AAAS Selected Symposium 109.
Parr, J.F., R.I. Papendick, S.B. Hornick, D. Colacicco. 1989. Use of organic amendments for
increasing the productivity of arid lands. Arid Soil Res. and Rehab. 3:149-170.
Sheridan, D. 1981. Desertification of the United States. Council on Environmental Quality.
U.S. Government Publishing Office. Washington D.C.
U.S. Department of Agriculture, Soil Conservation Service. 1988. Soil Survey ofSocorro
County Area, New Mexico. U.S. Government Printing Press, Washington D.C.
U.S. Environmental Protection Agency. 1993. 40 CFR - Parts 257 and 503, Standards for the
disposal of sewage sludge; final rule.
Ward, T.J. 1986. A study of runoff and erosion processes using large and small area rainfall
simulators. New Mexico Water Resources Research Institute (WRRI) Report No.
215. New Mexico State University, Las Cruces, New Mexico.
4-14
image:
 Utilization of Municipal, Industrial and Animal Wastes on Semiarid Rangelands
J.D. Reader, G.E. Schuman, G.F. Frasier and R.H. Hart1
In recent years, cities and industries have begun to consider rangelands as potential sites
for disposal of municipal, industrial and animal wastes. Numerous studies have demonstrated that
municipal sewage sludge and feedlot animal wastes can be successfully used as fertilizer and
mulch on croplands, but few studies have applied these wastes to rangelands. Therefore little
information is available concerning the effects of waste applications to rangelands where
incorporation of the waste material into the soil is not feasible, and where the vegetation is
comprised of perennial grasses rather than annual crops. We initiated a study in April, 1993, to
determine the effects of industrial, municipal and-animal waste applications on soil, plant and
water quality properties of semiarid rangelands. The study is being conducted at the Central
Plains Experimental Range (CPER) near Nunn, CO, on short grass range, and at the High Plains
Grasslands Research Station (HPGRS) near Cheyenne, WY, on mixed grass range. At both sites
a series of thirty 9-by-9-m plots for vegetation/soil evaluations and twenty 3-by-9-m plots for
hydrologic investigations were established. Treatments consisted of surface applications (23
Mg/ha) of (1) fresh feedlot cattle waste, (2) composted feedlot cattle waste, (3) phosphogypsum
(a by-product of the phosphorus fertilizer industry and 92% CaSO4) (4) composted sewage
sludge, and (5) control (no treatment). Soil samples were collected in 1993 prior to waste
application for evaluating baseline soil properties, and in 1994 to assess the effects of waste
application on soil properties. Vegetation samples for evaluating forage production/quality and
species composition were collected at peak production in 1993 and 1994. Runoff water quality
and quantity were evaluated with a rotating boom rainfall simulator in May and August, 1993.
The composted sewage sludge and composted manure contained high levels of N and P,
which resulted in increased aboveground plant production and increased concentrations of N and
P in plant tissue in the 1993 growing season. In the spring of 1994, elevated levels of NO3-N and
bicarbonate-extracted P were found in the soil profiles of these two waste treatments, but due to
severe drought throughout the 1994 growing season, total plant production did not respond to the
increased nutrient levels. During simulated rainfall events, elevated levels of N and P were found
in the runoff water from the composted manure and composted sewage sludge treatments. The
fresh manure and phosphogypsum amendments did not improve total plant production, although
plant N concentrations were increased in some plant species by the fresh manure amendment, and
both the fresh manure and phosphogypsum amendments increased the P concentration of warm
season grasses. Elevated levels of NO3-N and bicarbonate-extracted P were not found in the soil
profiles except at the soil surface. Runoff during simulated rainfall events on the fresh manure
and phosphogypsum amendments were not elevated in N, but were elevated in P.
'Soil Scientist, Soil Scientist, Hydraulic Engineer, and Rangeland Scientist. USDA-ARS. Crops
Research Laboratory, 1701 Centre Ave., Fort Collins CO 80526, and, High Plains Grasslands
Res. Stn., 8408 Hildreth Rd., Cheyenne, WY 82009.
image:
Utilization of Municipal, Industrial and Animal Wastes on Semiarid Rangelands
J.D. Reader, G.E. Schuman, G.F. Frasier and R.H. Hart1
In recent years, cities and industries have begun to consider rangelands as potential sites
for disposal of municipal, industrial and animal wastes. Numerous studies have demonstrated that
municipal sewage sludge and feedlot animal wastes can be successfully used as fertilizer and
mulch on croplands, but few studies have applied these wastes to rangelands. Therefore little
information is available concerning the effects of waste applications to rangelands where
incorporation of the waste material into the soil is not feasible, and where the vegetation is
comprised of perennial grasses rather than annual crops. We initiated a study in April, 1993, to
determine the effects of industrial, municipal and-animal waste applications on soil, plant and
water quality properties of semiarid rangelands. The study is being conducted at the Central
Plains Experimental Range (CPER) near Nunn, CO, on short grass range, and at the High Plains
Grasslands Research Station (HPGRS) near Cheyenne, WY, on mixed grass range. At both sites
a series of thirty 9-by-9-m plots for vegetation/soil evaluations and twenty 3-by-9-m plots for
hydrologic investigations were established. Treatments consisted of surface applications (23
Mg/ha) of (1) fresh feedlot cattle waste, (2) composted feedlot cattle waste, (3) phosphogypsum
(a by-product of the phosphorus fertilizer industry and 92% CaSO4) (4) composted sewage
sludge, and (5) control (no treatment). Soil samples were collected in 1993 prior to waste
application for evaluating baseline soil properties, and in 1994 to assess the effects of waste
application on soil properties. Vegetation samples for evaluating forage production/quality and
species composition were collected at peak production in 1993 and 1994. Runoff water quality
and quantity were evaluated with a rotating boom rainfall simulator in May and August, 1993.
The composted sewage sludge and composted manure contained high levels of N and P,
which resulted in increased aboveground plant production and increased concentrations of N and
P in plant tissue in the 1993 growing season. In the spring of 1994, elevated levels of NO3-N and
bicarbonate-extracted P were found in the soil profiles of these two waste treatments, but due to
severe drought throughout the 1994 growing season, total plant production did not respond to the
increased nutrient levels. During simulated rainfall events, elevated levels of N and P were found
in the runoff water from the composted manure and composted sewage sludge treatments. The
fresh manure and phosphogypsum amendments did not improve total plant production, although
plant N concentrations were increased in some plant species by the fresh manure amendment, and
both the fresh manure and phosphogypsum amendments increased the P concentration of warm
season grasses. Elevated levels of NO3-N and bicarbonate-extracted P were not found in the soil
profiles except at the soil surface. Runoff during simulated rainfall events on the fresh manure
and phosphogypsum amendments were not elevated in N, but were elevated in P.
'Soil Scientist, Soil Scientist, Hydraulic Engineer, and Rangeland Scientist. USDA-ARS. Crops
Research Laboratory, 1701 Centre Ave., Fort Collins CO 80526, and, High Plains Grasslands
Res. Stn., 8408 Hildreth Rd., Cheyenne, WY 82009.
image:
 image:
 Evaluating Infiltration-Related Water Quality Impacts
Associated with Land Application of Biosolids
in Arid and Semi-arid Settings
Gordon N. McCurry
Abstract
Land application of municipal wastewater biosolids has many benefits in arid and semi-arid
settings, including increases in plant productivity, decreases in sediment runoff and increases in
infiltration rates. Increased infiltration of biosolids-derived leachate could have adverse water
quality effects on the receiving waters. These may include ground water degradation due to deep
percolation of leachate and surface water contamination associated with return flows of the
leachate to wetlands, streams and lakes. The heavy reliance on water supplies hi arid and semi-
arid settings warrants an investigation of the quantity and quality of liquid infiltrating beneath
land application sites. Results from land application sites in Colorado and New Mexico where
infiltration monitoring has been conducted are presented. Monitoring methods used to evaluate
infiltration-related water quality impacts associated with land application of biosolids in semi-
arid settings are discussed. Infiltration studies from these and other sites in arid and semi-arid
environments indicate that infiltration from normal rainfall events is usually restricted to the
upper two meters, although extreme precipitation events can cause much deeper infiltration.
Introduction
Land application is a viable option for disposing of municipal wastewater biosolids. This
disposal method involves the surface spreading of anaerobically digested and partially dewatered
biosolids on designated lands. Land application has been used at many sites in the arid and semi-
arid setting in the western U.S., both as a soil amendment to increase plant productivity and to
decrease sediment yield in surface streams (Gallier et al, 1993; Aguilar and Loftin, 1992;
Mostaghimi et al, 1992; Aguilar and Aldon, 1991a; Lerch et al, 1990; Sabey et al, 1990; King
et al, 1988). Land application of biosolids is likely to increase in the future to take advantage
of these and other benefits.
Biosolids application is not without its risks to the surrounding environment, however. If
undertaken incorrectly, biosolids application can lead to the accumulation of heavy metals in soil
(Chang and Page, 1993; Liang and Corey, 1993; Fresquez et al, 1990; Welch and Lund, 1989;
Davis et al, 1988; Williams et al, 1987; Tackert et al, 1986; Sommers and Nelson, 1981) and to
degradation of surface water (Coupe and Macy, 1993) and ground water quality (Berg et al,
1987; Goda et al, 1986; O'Brien and Mitsch, 1980; Baxter et al, 1977; Trout et al, 1975). Water
is almost always in short supply in arid and semi-arid regions. Surface streams often are dry
except during the period of snowmelt runoff in the spring or during brief periods after summer
thunderstorms, so the often more reliable ground water supplies are an even more precious
4-1
image:
Evaluating Infiltration-Related Water Quality Impacts
Associated with Land Application of Biosolids
in Arid and Semi-arid Settings
Gordon N. McCurry
Abstract
Land application of municipal wastewater biosolids has many benefits in arid and semi-arid
settings, including increases in plant productivity, decreases in sediment runoff and increases in
infiltration rates. Increased infiltration of biosolids-derived leachate could have adverse water
quality effects on the receiving waters. These may include ground water degradation due to deep
percolation of leachate and surface water contamination associated with return flows of the
leachate to wetlands, streams and lakes. The heavy reliance on water supplies hi arid and semi-
arid settings warrants an investigation of the quantity and quality of liquid infiltrating beneath
land application sites. Results from land application sites in Colorado and New Mexico where
infiltration monitoring has been conducted are presented. Monitoring methods used to evaluate
infiltration-related water quality impacts associated with land application of biosolids in semi-
arid settings are discussed. Infiltration studies from these and other sites in arid and semi-arid
environments indicate that infiltration from normal rainfall events is usually restricted to the
upper two meters, although extreme precipitation events can cause much deeper infiltration.
Introduction
Land application is a viable option for disposing of municipal wastewater biosolids. This
disposal method involves the surface spreading of anaerobically digested and partially dewatered
biosolids on designated lands. Land application has been used at many sites in the arid and semi-
arid setting in the western U.S., both as a soil amendment to increase plant productivity and to
decrease sediment yield in surface streams (Gallier et al, 1993; Aguilar and Loftin, 1992;
Mostaghimi et al, 1992; Aguilar and Aldon, 1991a; Lerch et al, 1990; Sabey et al, 1990; King
et al, 1988). Land application of biosolids is likely to increase in the future to take advantage
of these and other benefits.
Biosolids application is not without its risks to the surrounding environment, however. If
undertaken incorrectly, biosolids application can lead to the accumulation of heavy metals in soil
(Chang and Page, 1993; Liang and Corey, 1993; Fresquez et al, 1990; Welch and Lund, 1989;
Davis et al, 1988; Williams et al, 1987; Tackert et al, 1986; Sommers and Nelson, 1981) and to
degradation of surface water (Coupe and Macy, 1993) and ground water quality (Berg et al,
1987; Goda et al, 1986; O'Brien and Mitsch, 1980; Baxter et al, 1977; Trout et al, 1975). Water
is almost always in short supply in arid and semi-arid regions. Surface streams often are dry
except during the period of snowmelt runoff in the spring or during brief periods after summer
thunderstorms, so the often more reliable ground water supplies are an even more precious
4-1
image:
 commodity in these regions. Due to the scarcity of water in arid and semi-arid settings it is
essential that land application be undertaken in a manner that minimizes adverse water quality
impacts.
A number of studies have shown that land application of biosolids decreases surface runoff. At
the Sevilleta National Wildlife Refuge (NWR) in central New Mexico, Aguilar et al (1994) and
Aguilar and Loftin (1992) recorded essentially no runoff leaving biosolids test plots in response
to natural and simulated rainfall events over a three year period; runoff from adjacent control
plots averaged about 20 percent of rainfall. At the Meadow Springs Ranch site in northern
Colorado, runoff from control plots was 3.4 to 37 times that of biosolids-treated plots (RED and
CDM, 1993). Kelling et al (1977) noted a reduction in sediment load andjunoff from biosolids-
applie'd test plots, which they attributed to increased infiltration. Even in more humid settings,
Mostaghimi et al (1992) found in their simulated rainfall experiments on test plots in Virginia
that infiltration from biosolids-applied plots was almost twice that of the control plots.
These studies indicate that surface runoff decreases and infiltration increases in areas where
biosolids have been applied. With increasing infiltration rates there is also a greater potential
for water quality to be adversely affected by leachate generated from the biosolids. An objective
of the current study therefore is to evaluate infiltration and infiltration-related water quality
impacts associated with biosolids application in arid and semi-arid environments. Because land
application sites in these environments are often in relatively remote locations where power
sources are unavailable and access is difficult, an additional objective of this study is to compare
the effectiveness of different water quality monitoring methods used in arid to semi-arid settings.
Processes Leading to Water Quality Degradation
In order for the threat of infiltration-related water quality impacts near land application sites to
be minimized there must be an understanding of the biosolids contaminant source, contaminant
migration pathways and contaminant transport processes from a hydrologic perspective.
Understanding these aspects with regard to the characteristics of a given field site can lead to
environmentally safer and more effective land application operations at that site.
Contaminant Sources
Contaminant sources associated with biosolids application can include infiltration of compounds
directly from the biosolids liquid fraction, infiltration of biosolids-derived leachate, and
mobilization of compounds in soil due to reduced soil pH. Direct application of liquid biosolids
will lead to infiltration of the soluble components, and may cause deep enough migration within
the soil profile to cause ground water contamination (Berg et al, 1987; Baxter et al, 1977; Trout
et al, 1975). Dewatering of biosolids to approximately 15-20 percent solids can virtually
eliminate this problem (Aguilar et al, 1994; RBD and CDM, 1993). Biosolids application has
been shown to decrease the pH of shallow soils (Fresquez et al, 1991; Fresquez et al, 1990;
Williams et al, 1987; Goda et al, 1986). Since heavy metals become more mobile at lower pH
conditions (Tackett et al, 1986), it is possible that metals either naturally present in soils, or
enriched from biosolids application (such as Cd, Cu, Fe, Pb, Ni and Zn) could become mobilized
and migrate into deeper portions of the soils profile (Sommers and Nelson, 1981). In many soils
4-2
image:
commodity in these regions. Due to the scarcity of water in arid and semi-arid settings it is
essential that land application be undertaken in a manner that minimizes adverse water quality
impacts.
A number of studies have shown that land application of biosolids decreases surface runoff. At
the Sevilleta National Wildlife Refuge (NWR) in central New Mexico, Aguilar et al (1994) and
Aguilar and Loftin (1992) recorded essentially no runoff leaving biosolids test plots in response
to natural and simulated rainfall events over a three year period; runoff from adjacent control
plots averaged about 20 percent of rainfall. At the Meadow Springs Ranch site in northern
Colorado, runoff from control plots was 3.4 to 37 times that of biosolids-treated plots (RED and
CDM, 1993). Kelling et al (1977) noted a reduction in sediment load andjunoff from biosolids-
applie'd test plots, which they attributed to increased infiltration. Even in more humid settings,
Mostaghimi et al (1992) found in their simulated rainfall experiments on test plots in Virginia
that infiltration from biosolids-applied plots was almost twice that of the control plots.
These studies indicate that surface runoff decreases and infiltration increases in areas where
biosolids have been applied. With increasing infiltration rates there is also a greater potential
for water quality to be adversely affected by leachate generated from the biosolids. An objective
of the current study therefore is to evaluate infiltration and infiltration-related water quality
impacts associated with biosolids application in arid and semi-arid environments. Because land
application sites in these environments are often in relatively remote locations where power
sources are unavailable and access is difficult, an additional objective of this study is to compare
the effectiveness of different water quality monitoring methods used in arid to semi-arid settings.
Processes Leading to Water Quality Degradation
In order for the threat of infiltration-related water quality impacts near land application sites to
be minimized there must be an understanding of the biosolids contaminant source, contaminant
migration pathways and contaminant transport processes from a hydrologic perspective.
Understanding these aspects with regard to the characteristics of a given field site can lead to
environmentally safer and more effective land application operations at that site.
Contaminant Sources
Contaminant sources associated with biosolids application can include infiltration of compounds
directly from the biosolids liquid fraction, infiltration of biosolids-derived leachate, and
mobilization of compounds in soil due to reduced soil pH. Direct application of liquid biosolids
will lead to infiltration of the soluble components, and may cause deep enough migration within
the soil profile to cause ground water contamination (Berg et al, 1987; Baxter et al, 1977; Trout
et al, 1975). Dewatering of biosolids to approximately 15-20 percent solids can virtually
eliminate this problem (Aguilar et al, 1994; RBD and CDM, 1993). Biosolids application has
been shown to decrease the pH of shallow soils (Fresquez et al, 1991; Fresquez et al, 1990;
Williams et al, 1987; Goda et al, 1986). Since heavy metals become more mobile at lower pH
conditions (Tackett et al, 1986), it is possible that metals either naturally present in soils, or
enriched from biosolids application (such as Cd, Cu, Fe, Pb, Ni and Zn) could become mobilized
and migrate into deeper portions of the soils profile (Sommers and Nelson, 1981). In many soils
4-2
image:
 in the western U.S., however, soils are generally alkaline so the ultimate depth of migration of
metals is likely to be limited to less than 10 cm (Welch and Lund, 1989; Davis et al, 1988;
Williams et al, 1987). For partially dewatered biosolids, infiltration of biosolids-derived leachate
is thus the most likely source of contaminants that can migrate to and potentially cause water
quality degradation. Leachate would form as precipitation interacts with the biosolids, forming
a solute which contains soluble compounds from the biosolids. Whether it is surface water or
ground water that is ultimately affected, and the extent of the impacts, depend in part on the
migration pathways and transport processes.
Migration Pathways
Contaminant migration pathways are the-routes that soluble compounds may take after
infiltrating below where biosolids have been applied. Leachate will tend to infiltrate vertically
downward below the surface under the force of gravity unless impeded by a low-permeability
barrier or until it reaches the water table. In the upper soil horizon, infiltration may be via
macropore flow or via flow through the porous soil medium. Macropore flow occurs when water
moves through distinct soil regions (macropores) much more rapidly than through the
surrounding soil matrix (Seyfried, 1991); this can include flow through shrinkage cracks in the
soil, along plant roots, insect burrow holes or the like. Macropore flow allows dissolved
compounds to migrate into the soil relatively unaffected by the attenuating processes that act to
decrease compound concentrations. Macropore flow was observed to become unimportant
below about 30 cm below land surface at a test site in southern Idaho (Seyfried, 1991). Flow
through the porous soil matrix will therefore be the dominant process in deeper soil zones even
where macropore flow exists.
One migration pathway is for leachate to infiltrate vertically downward until it encounters a
low-permeability barrier, such as a clay, within the unsaturated zone soil profile. The soil
moisture content will increase above this low permeability barrier as infiltration continues. If
sufficient liquid exists, the leachate will eventually migrate laterally and down-dip along the top
of the barrier. Depending on the local topography and location of the land application area, this
perched water could migrate to and discharge at the land surface as a seep or directly to a
wetland or surface water body, degrading surface water quality in these bodies. A second
migration pathway exists when low permeability soil layers are not present, or are not laterally
continuous. In these cases, and if sufficient leachate infiltrates, then a direct migration pathway
to ground water exists. Ground water quality will then be affected by the compounds present
in the infiltrating leachate. Local ground water-surface water flow dynamics may result in a
third migration pathway, this time to surface water. Ground water naturally flowing to and
discharging at nearby streams, lakes or wetlands as return flow could also adversely affect the
receiving surface water bodies if the return flow water has become contaminated by biosolids-
derived leachate. The depth to ground water, presence of low permeability perching layers with
the unsaturated zone and infiltration of sufficient volumes of leachate are factors that determine
which, if any, of these migration pathways will occur.
Transport Processes
Each of the migration pathways discussed above requires that infiltration be greater than the
transport processes that inhibit fluid migration and decrease leachate concentrations. In arid and
4-3
image:
in the western U.S., however, soils are generally alkaline so the ultimate depth of migration of
metals is likely to be limited to less than 10 cm (Welch and Lund, 1989; Davis et al, 1988;
Williams et al, 1987). For partially dewatered biosolids, infiltration of biosolids-derived leachate
is thus the most likely source of contaminants that can migrate to and potentially cause water
quality degradation. Leachate would form as precipitation interacts with the biosolids, forming
a solute which contains soluble compounds from the biosolids. Whether it is surface water or
ground water that is ultimately affected, and the extent of the impacts, depend in part on the
migration pathways and transport processes.
Migration Pathways
Contaminant migration pathways are the-routes that soluble compounds may take after
infiltrating below where biosolids have been applied. Leachate will tend to infiltrate vertically
downward below the surface under the force of gravity unless impeded by a low-permeability
barrier or until it reaches the water table. In the upper soil horizon, infiltration may be via
macropore flow or via flow through the porous soil medium. Macropore flow occurs when water
moves through distinct soil regions (macropores) much more rapidly than through the
surrounding soil matrix (Seyfried, 1991); this can include flow through shrinkage cracks in the
soil, along plant roots, insect burrow holes or the like. Macropore flow allows dissolved
compounds to migrate into the soil relatively unaffected by the attenuating processes that act to
decrease compound concentrations. Macropore flow was observed to become unimportant
below about 30 cm below land surface at a test site in southern Idaho (Seyfried, 1991). Flow
through the porous soil matrix will therefore be the dominant process in deeper soil zones even
where macropore flow exists.
One migration pathway is for leachate to infiltrate vertically downward until it encounters a
low-permeability barrier, such as a clay, within the unsaturated zone soil profile. The soil
moisture content will increase above this low permeability barrier as infiltration continues. If
sufficient liquid exists, the leachate will eventually migrate laterally and down-dip along the top
of the barrier. Depending on the local topography and location of the land application area, this
perched water could migrate to and discharge at the land surface as a seep or directly to a
wetland or surface water body, degrading surface water quality in these bodies. A second
migration pathway exists when low permeability soil layers are not present, or are not laterally
continuous. In these cases, and if sufficient leachate infiltrates, then a direct migration pathway
to ground water exists. Ground water quality will then be affected by the compounds present
in the infiltrating leachate. Local ground water-surface water flow dynamics may result in a
third migration pathway, this time to surface water. Ground water naturally flowing to and
discharging at nearby streams, lakes or wetlands as return flow could also adversely affect the
receiving surface water bodies if the return flow water has become contaminated by biosolids-
derived leachate. The depth to ground water, presence of low permeability perching layers with
the unsaturated zone and infiltration of sufficient volumes of leachate are factors that determine
which, if any, of these migration pathways will occur.
Transport Processes
Each of the migration pathways discussed above requires that infiltration be greater than the
transport processes that inhibit fluid migration and decrease leachate concentrations. In arid and
4-3
image:
 semi-arid environments the attenuating processes for both fluid and mass transport are
significant. Infiltration of fluid below the plant evaporative root zone depth will occur only
when the magnitude and duration of precipitation exceeds the effects of evapotranspiration,
runoff, soil moisture retention and moisture absorption by the applied biosolids. The effects of
these processes on decreasing infiltration in arid environments are discussed below.
Several investigators have quantified evapotranspiration rates in arid and semi-arid regions. A
characteristic of rangelands (which are predominant in arid and semi-arid zones) are the high
evapotranspiration and low water yields (Branson et al, 1972). In south Texas rangelands, Weltz
and Blackburn (1993) calculated evapotranspiration rates that ranged from 72 percent of
precipitation from bare sandy loam soil to 99.7 percent from grass and shrub locations. Carlson
et al (1990) found that evapotranspiration accounted for over 95 percent of the water balance in
grass and mesquite shrub sites in the rolling plains rangeland of Texas. Duell (1990) studied the
evapotranspiration requirements of a series of native grasses in the Owens Valley of southeast
California. He calculated evapotranspiration rates ranging from approximately 4 to 12 times the
annual precipitation for alkali and saltgrass/rush meadow sites. Parton et al (1981) and
Lauenroth and Sims (1976) found that the water demands by plants at a shortgrass prairie site
in northeast Colorado were sufficiently in excess of available water that evapotranspiration
consumed all precipitation during the growing season . Although it is often thought that
infiltration below the plant root zone can be considered negligible during the growing season
because of the high evapotranspiration rates for most arid grassland and rangeland environments
(McCully and Haas, 1970), Stephens et al (1986) found during a 19 month study that deep
percolation was roughly 20 percent of mean annual natural precipitation at one site near Socorro
in central New Mexico.
The potential for infiltration can be reduced further due to water absorption by the applied
biosolids and due to surface runoff of precipitation. Aguilar & Loftin (1992) determined that
partially dewatered biosolids (17 percent solids) absorbed an estimated 83-105 percent of the
precipitation that fell during a simulated rainfall experiment in central New Mexico. Epstein
(1975) found that biosolids retained approximately 10 times more water than the soil control in
one study. Runoff will decrease the amount of water that can potentially infiltrate. Several
studies have shown that biosolids application greatly decreases runoff (Aguilar et al, 1994; RBD
and CDM, 1993; Mostaghimi et al, 1992). Decreases in runoff due to land application is thought
to be enhanced by increases in surface roughness associated with the applied biosolids (Aguilar
et al, 1994). Surface slope can also directly affect runoff, although the amount of clay in the soil
may have an equally large effect on runoff (RBD and CDM, 1993).
Migration of biosolids-derived leachate below the evaporative root zone depth is strongly
influenced by the antecedent (existing) soil moisture content (AMC) and the soil moisture
retention capacity. Deeper migration occurs more readily when the soil is more moist because
of the associated increase in the unsaturated hydraulic conductivity at these conditions, which
allows for greater fluid migration. Nash et al (1991) found that wetting of dry arid rangeland soil
is a slow process and is largely a function of the soil AMC. Tromble et al (1974) found that
infiltration rates were higher in areas covered with litter than in other areas due to higher AMC
4-4
image:
semi-arid environments the attenuating processes for both fluid and mass transport are
significant. Infiltration of fluid below the plant evaporative root zone depth will occur only
when the magnitude and duration of precipitation exceeds the effects of evapotranspiration,
runoff, soil moisture retention and moisture absorption by the applied biosolids. The effects of
these processes on decreasing infiltration in arid environments are discussed below.
Several investigators have quantified evapotranspiration rates in arid and semi-arid regions. A
characteristic of rangelands (which are predominant in arid and semi-arid zones) are the high
evapotranspiration and low water yields (Branson et al, 1972). In south Texas rangelands, Weltz
and Blackburn (1993) calculated evapotranspiration rates that ranged from 72 percent of
precipitation from bare sandy loam soil to 99.7 percent from grass and shrub locations. Carlson
et al (1990) found that evapotranspiration accounted for over 95 percent of the water balance in
grass and mesquite shrub sites in the rolling plains rangeland of Texas. Duell (1990) studied the
evapotranspiration requirements of a series of native grasses in the Owens Valley of southeast
California. He calculated evapotranspiration rates ranging from approximately 4 to 12 times the
annual precipitation for alkali and saltgrass/rush meadow sites. Parton et al (1981) and
Lauenroth and Sims (1976) found that the water demands by plants at a shortgrass prairie site
in northeast Colorado were sufficiently in excess of available water that evapotranspiration
consumed all precipitation during the growing season . Although it is often thought that
infiltration below the plant root zone can be considered negligible during the growing season
because of the high evapotranspiration rates for most arid grassland and rangeland environments
(McCully and Haas, 1970), Stephens et al (1986) found during a 19 month study that deep
percolation was roughly 20 percent of mean annual natural precipitation at one site near Socorro
in central New Mexico.
The potential for infiltration can be reduced further due to water absorption by the applied
biosolids and due to surface runoff of precipitation. Aguilar & Loftin (1992) determined that
partially dewatered biosolids (17 percent solids) absorbed an estimated 83-105 percent of the
precipitation that fell during a simulated rainfall experiment in central New Mexico. Epstein
(1975) found that biosolids retained approximately 10 times more water than the soil control in
one study. Runoff will decrease the amount of water that can potentially infiltrate. Several
studies have shown that biosolids application greatly decreases runoff (Aguilar et al, 1994; RBD
and CDM, 1993; Mostaghimi et al, 1992). Decreases in runoff due to land application is thought
to be enhanced by increases in surface roughness associated with the applied biosolids (Aguilar
et al, 1994). Surface slope can also directly affect runoff, although the amount of clay in the soil
may have an equally large effect on runoff (RBD and CDM, 1993).
Migration of biosolids-derived leachate below the evaporative root zone depth is strongly
influenced by the antecedent (existing) soil moisture content (AMC) and the soil moisture
retention capacity. Deeper migration occurs more readily when the soil is more moist because
of the associated increase in the unsaturated hydraulic conductivity at these conditions, which
allows for greater fluid migration. Nash et al (1991) found that wetting of dry arid rangeland soil
is a slow process and is largely a function of the soil AMC. Tromble et al (1974) found that
infiltration rates were higher in areas covered with litter than in other areas due to higher AMC
4-4
image:
 values beneath litter. Loaque (1992) felt soil AMC was the most critical parameter in optimizing
a rainfall-runoff model of a rangeland catchment in Oklahoma. At biosolids land application
sites Aguilar et al (1994) and RED and CDM (1994) observed higher AMC values in soil
beneath treated plots compared to adjacent control plots. Bruggeman and Mostaghimi (1993)
found that peak loading of nutrient compounds appeared during a rainstorm, with wet initial soil
conditions. The moisture retention capacity of a soil indicates how much moisture it can hold
under negative pressure against the force of gravity. The field capacity of a soil generally
represents its maximum soil moisture retention capacity. In general, finer grained soils have
higher retention capacities. A larger moisture retention capacity means that a soil will contain
more moisture at a given soil suction, thus will have a higher hydraulic conductivity which
allows greater infiltration rates. Several investigators, as summarized in Khaleel et al (1981),
have reported increased moisture retention capacities, at both field capacity and wilting point
moisture contents, with increasing biosolids application rates. The increases were attributed to
increased soil organic carbon. Thus biosolids application has been shown to increase soil
antecedent moisture contents and moisture retention capacity, and thereby increase the potential
for infiltration of fluid beneath land application areas.
Several studies have been undertaken to evaluate the depth to which infiltration occurs in arid
and semi-arid environments. Aguilar and Aldon (1991b) set up test plots on native grassland
soils in the Rio Puerco Watershed Management area in northern New Mexico to measure natural
infiltration and runoff over a three year period. Using neutron probes, gravimetric analyses of
soil samples and onsite raingages, they found that soil moisture fluctuated greatly in the upper
30 cm in response to precipitation events. More gradual seasonal changes in soil moisture were
observed in the 50 to 100 cm depth, with increases occurring through snowmelt-based recharge
in the spring or correlated to successive thunderstorms in the summer. Little change in soil
moisture was observed below 100 cm depth and stayed near the estimated field capacity of the
soil (0.03 MPa; 1/3 bar). Analyses of soil chemistry showed accumulations of secondary
calcium carbonate at the 48-84 cm depth and gypsum deposits at the 160 to 170 cm depth. The
accumulation of these soluble compounds within the soil profile was attributed to the prevailing
depth of infiltration under normal precipitation events and to the maximum depth reached by
water following extreme storms, respectively (Aguilar and Aldon, 1991b). Aguilar et al (1994)
noted a caliche layer at a depth of 70 cm below the surface, which they felt represented the long-
term average depth of downward water movement in the soil. Otoma and Kuboi (1988)
simulated chloride movement beneath soil treated with biosolids and planted with ryegrass.
They found that chloride, also a soluble compound, would generally accumulate in the upper
meter of soil. Seyfried (1991) conducted simulated rainfall experiments on test plots of native
soils in southern Idaho. He found that moisture penetrated below 42 cm during an initial low
intensity' rainfall event (10.4 cm/hr) but that subsequent tests allowed a bromide tracer to migrate
to only about 21 cm. Seyfried concluded that montmorillonite clays that were present in the test
plots swelled during the initial test and inhibited moisture migration in subsequent tests.
Natural recharge was also studied at a native grass test site on the high plains near Golden,
Colorado. Kiusalaas and Poeter (1992) found that moisture profiles were static below 90 cm in
the late summer through winter, but that heavy precipitation in March 1992 allowed moisture
to migrate to slightly over 2m. A 10 year study conducted by Nixon et al (1972) in sandy soils
4-5
image:
values beneath litter. Loaque (1992) felt soil AMC was the most critical parameter in optimizing
a rainfall-runoff model of a rangeland catchment in Oklahoma. At biosolids land application
sites Aguilar et al (1994) and RED and CDM (1994) observed higher AMC values in soil
beneath treated plots compared to adjacent control plots. Bruggeman and Mostaghimi (1993)
found that peak loading of nutrient compounds appeared during a rainstorm, with wet initial soil
conditions. The moisture retention capacity of a soil indicates how much moisture it can hold
under negative pressure against the force of gravity. The field capacity of a soil generally
represents its maximum soil moisture retention capacity. In general, finer grained soils have
higher retention capacities. A larger moisture retention capacity means that a soil will contain
more moisture at a given soil suction, thus will have a higher hydraulic conductivity which
allows greater infiltration rates. Several investigators, as summarized in Khaleel et al (1981),
have reported increased moisture retention capacities, at both field capacity and wilting point
moisture contents, with increasing biosolids application rates. The increases were attributed to
increased soil organic carbon. Thus biosolids application has been shown to increase soil
antecedent moisture contents and moisture retention capacity, and thereby increase the potential
for infiltration of fluid beneath land application areas.
Several studies have been undertaken to evaluate the depth to which infiltration occurs in arid
and semi-arid environments. Aguilar and Aldon (1991b) set up test plots on native grassland
soils in the Rio Puerco Watershed Management area in northern New Mexico to measure natural
infiltration and runoff over a three year period. Using neutron probes, gravimetric analyses of
soil samples and onsite raingages, they found that soil moisture fluctuated greatly in the upper
30 cm in response to precipitation events. More gradual seasonal changes in soil moisture were
observed in the 50 to 100 cm depth, with increases occurring through snowmelt-based recharge
in the spring or correlated to successive thunderstorms in the summer. Little change in soil
moisture was observed below 100 cm depth and stayed near the estimated field capacity of the
soil (0.03 MPa; 1/3 bar). Analyses of soil chemistry showed accumulations of secondary
calcium carbonate at the 48-84 cm depth and gypsum deposits at the 160 to 170 cm depth. The
accumulation of these soluble compounds within the soil profile was attributed to the prevailing
depth of infiltration under normal precipitation events and to the maximum depth reached by
water following extreme storms, respectively (Aguilar and Aldon, 1991b). Aguilar et al (1994)
noted a caliche layer at a depth of 70 cm below the surface, which they felt represented the long-
term average depth of downward water movement in the soil. Otoma and Kuboi (1988)
simulated chloride movement beneath soil treated with biosolids and planted with ryegrass.
They found that chloride, also a soluble compound, would generally accumulate in the upper
meter of soil. Seyfried (1991) conducted simulated rainfall experiments on test plots of native
soils in southern Idaho. He found that moisture penetrated below 42 cm during an initial low
intensity' rainfall event (10.4 cm/hr) but that subsequent tests allowed a bromide tracer to migrate
to only about 21 cm. Seyfried concluded that montmorillonite clays that were present in the test
plots swelled during the initial test and inhibited moisture migration in subsequent tests.
Natural recharge was also studied at a native grass test site on the high plains near Golden,
Colorado. Kiusalaas and Poeter (1992) found that moisture profiles were static below 90 cm in
the late summer through winter, but that heavy precipitation in March 1992 allowed moisture
to migrate to slightly over 2m. A 10 year study conducted by Nixon et al (1972) in sandy soils
4-5
image:
 and native vegetation in coastal California showed that infiltrating recharge would penetrate
below the root zone and contribute to deeper recharge only once every seven years, on average,
although infiltration penetrated to more than 580 cm following heavy rainfall one year. Wengel
and Griffin (1979) found that leaching and accumulation of nitrate to depths of 244 cm occurred
at high biosolids application rates on agricultural land in the east coast. These studies show that
the transport processes discussed above limit fluid migration in arid and semi-arid environments
to the upper meter of soil under normal precipitation inputs but that deeper infiltration is possible
under extreme precipitation events.
A final factor affecting the potential for water quality degradation is the effectiveness of
reactions that degrade or attenuate the biosolids-related leachate constituents. These include
geochemical oxidation-reduction reactions, that will tend to cause metals compounds to
precipitate in the soil (Liang and Corey, 1993), and aerobic/anaerobic biodegradation reactions,
which will consume some of the nutrient compounds (O'Brien and Mitsch, 1980). Several
investigators have found that the depth of metals migration below land application sites in semi-
arid regions is limited due to these reactions (Aguilar et al 1994; RED and CDM, 1994; Welch
and Lund, 1989; Williams et al, 1987). Chang and Page (1990) found that the majority of
biosolids constituents were assimilated into soils through biogeochemical reactions. The amount
of compound attenuation that will occur will increase with a greater depth to water below land
surface and slower infiltration rate, since these will allow a greater time period for the
attenuating processes to operate.
Water Quality Monitoring in Arid Settings
The preceding discussion suggests that during extreme precipitation events or during the
dormant season for plants, both the unsaturated and saturated zones in arid and semi-arid
environments are potentially at risk from water quality degradation due to infiltration of
biosolids-derived leachate. Monitoring of both the unsaturated and saturated zones may be
appropriate based on the biosolids application rates, biosolids water content, natural
precipitation, permeability of site soils, and depth to water at a given land application site.
Monitoring would serve the purpose of an early warning of contamination, so that biosolids
application practices could be modified without posing further risk to the nearby water resources.
The following is a brief discussion of existing monitoring methods and devices for both zones.
Unsaturated Zone
Unsaturated zone monitoring devices exist for both water quantity and water quality. Commonly
used moisture monitoring devices include soil moisture blocks, tensiometers and neutron probes.
Moisture blocks consist of small diameter (5 cm) gypsum blocks with wire leads extending from
the blocks that are installed into previously drilled holes. The relative moisture content in soil
is indicated by increases in electrical conductance read on a meter. Moisture blocks can record
soil conditions drier than the wilting point, but must be calibrated to site soils based on moisture
characteristic curves developed from laboratory soils tests. Temperature probes co-located with
the moisture blocks can help calibrate the readings to actual water contents. Moisture blocks are
inexpensive but are less accurate than other devices and have a finite site life as the gypsum
block slowly decays.
4-6
image:
and native vegetation in coastal California showed that infiltrating recharge would penetrate
below the root zone and contribute to deeper recharge only once every seven years, on average,
although infiltration penetrated to more than 580 cm following heavy rainfall one year. Wengel
and Griffin (1979) found that leaching and accumulation of nitrate to depths of 244 cm occurred
at high biosolids application rates on agricultural land in the east coast. These studies show that
the transport processes discussed above limit fluid migration in arid and semi-arid environments
to the upper meter of soil under normal precipitation inputs but that deeper infiltration is possible
under extreme precipitation events.
A final factor affecting the potential for water quality degradation is the effectiveness of
reactions that degrade or attenuate the biosolids-related leachate constituents. These include
geochemical oxidation-reduction reactions, that will tend to cause metals compounds to
precipitate in the soil (Liang and Corey, 1993), and aerobic/anaerobic biodegradation reactions,
which will consume some of the nutrient compounds (O'Brien and Mitsch, 1980). Several
investigators have found that the depth of metals migration below land application sites in semi-
arid regions is limited due to these reactions (Aguilar et al 1994; RED and CDM, 1994; Welch
and Lund, 1989; Williams et al, 1987). Chang and Page (1990) found that the majority of
biosolids constituents were assimilated into soils through biogeochemical reactions. The amount
of compound attenuation that will occur will increase with a greater depth to water below land
surface and slower infiltration rate, since these will allow a greater time period for the
attenuating processes to operate.
Water Quality Monitoring in Arid Settings
The preceding discussion suggests that during extreme precipitation events or during the
dormant season for plants, both the unsaturated and saturated zones in arid and semi-arid
environments are potentially at risk from water quality degradation due to infiltration of
biosolids-derived leachate. Monitoring of both the unsaturated and saturated zones may be
appropriate based on the biosolids application rates, biosolids water content, natural
precipitation, permeability of site soils, and depth to water at a given land application site.
Monitoring would serve the purpose of an early warning of contamination, so that biosolids
application practices could be modified without posing further risk to the nearby water resources.
The following is a brief discussion of existing monitoring methods and devices for both zones.
Unsaturated Zone
Unsaturated zone monitoring devices exist for both water quantity and water quality. Commonly
used moisture monitoring devices include soil moisture blocks, tensiometers and neutron probes.
Moisture blocks consist of small diameter (5 cm) gypsum blocks with wire leads extending from
the blocks that are installed into previously drilled holes. The relative moisture content in soil
is indicated by increases in electrical conductance read on a meter. Moisture blocks can record
soil conditions drier than the wilting point, but must be calibrated to site soils based on moisture
characteristic curves developed from laboratory soils tests. Temperature probes co-located with
the moisture blocks can help calibrate the readings to actual water contents. Moisture blocks are
inexpensive but are less accurate than other devices and have a finite site life as the gypsum
block slowly decays.
4-6
image:
 Tensiometers consist of an airtight water-filled tube with a porous ceramic cup attached to the
bottom, and a type of vacuum gage. The soil monitoring depth corresponds to the installation
depth of the ceramic cups. Tensiometers indicate soil moisture content by directly reading soil
suction, which is the negative pressure exerted on residual moisture by soil capillary tension.
Tensiometers record soil tension in surrounding soils by losing water out of the ceramic cup until
an equilibrium vacuum pressure is reached inside and outside the tensiometer tube. Depending
on the depth of installation and type of tensiometer, soil suction readings only down to about -70
centibars can be attained. Soils must also be tested in the lab to determine the relationship
between soil suction and soil moisture content. Tensiometers are moderate in cost and provide
accurate readings of soil tension. If installed in very dry soils, they require frequent monitoring
and maintenance to stay operational. - .
Neutron probes record soil moisture by recording responses to radioactive source emitted from
the probe. Emitted neutrons are slowed (thermalized) through interactions with hydrogen atoms
in soil, so greater soil moisture content can be inversely correlated to neutron counts. The small
diameter (5-7 cm) neutron probes are lowered into access tubes previously installed into the soil
and measure soil moisture at any depths within the access tube. Like the other devices, the
relationship between soil moisture and neutron readings must be determined for each soil type
present at a site. Neutron probes are very accurate but are relatively costly. They offer an
advantage of being able to monitor soil moisture over the range of depths of the access tube,
allowing a more continuous soil moisture profile to be determined. Storage, use and handling
of the radioactive neutron emitter may pose unacceptable logistical difficulties.
Monitoring water quality in the unsaturated zone can be accomplished with lysimeters and by
direct soil sampling. Both methods are used to obtain samples, which are subsequently analyzed
for the compounds of interest. Lysimeters consist of hollow tubes with ceramic porous cups at
their base and are installed in predrilled holes. If sufficient soil moisture exists, water can be
induced through the ceramic cups and into the lysimeter tubes by creating a negative pressure
inside the tube with an external pump. Water contents must be near or above the field capacity
of the soil in order for soil samples to be obtained readily. Water collected in the lysimeter tubes
can then be withdrawn and submitted for laboratory analyses. Sampling soils directly can also
provide information on water quality in the unsaturated zone. To evaluate infiltration-related
impacts, soil samples must be collected and analyzed prior to land applying biosolids and then
a comparison is made with later soil samples. Natural variation in soil composition may render
the comparison of results inconclusive for metals and common ions, but should be effective for
evaluating the depth and magnitude of nitrogen compounds.
Saturated Zone
Monitoring the saturated zone for infiltration-related impacts involves the installation and
sampling of ground water monitoring wells. These can be small diameter (5 cm) wells
constructed with PVC casing and slotted screen. Drilling methods such as hollow stem augering
are preferred, since they do not introduce fluids into the borehole which could affect the
chemistry of the water samples which are collected later. Hollow stem auger drilling also allows
undisturbed soil samples to be collected, which is useful for characterizing soil chemistry is
deeper horizons. Recharge of infiltration from land application sites can be evaluated by
4-7
image:
Tensiometers consist of an airtight water-filled tube with a porous ceramic cup attached to the
bottom, and a type of vacuum gage. The soil monitoring depth corresponds to the installation
depth of the ceramic cups. Tensiometers indicate soil moisture content by directly reading soil
suction, which is the negative pressure exerted on residual moisture by soil capillary tension.
Tensiometers record soil tension in surrounding soils by losing water out of the ceramic cup until
an equilibrium vacuum pressure is reached inside and outside the tensiometer tube. Depending
on the depth of installation and type of tensiometer, soil suction readings only down to about -70
centibars can be attained. Soils must also be tested in the lab to determine the relationship
between soil suction and soil moisture content. Tensiometers are moderate in cost and provide
accurate readings of soil tension. If installed in very dry soils, they require frequent monitoring
and maintenance to stay operational. - .
Neutron probes record soil moisture by recording responses to radioactive source emitted from
the probe. Emitted neutrons are slowed (thermalized) through interactions with hydrogen atoms
in soil, so greater soil moisture content can be inversely correlated to neutron counts. The small
diameter (5-7 cm) neutron probes are lowered into access tubes previously installed into the soil
and measure soil moisture at any depths within the access tube. Like the other devices, the
relationship between soil moisture and neutron readings must be determined for each soil type
present at a site. Neutron probes are very accurate but are relatively costly. They offer an
advantage of being able to monitor soil moisture over the range of depths of the access tube,
allowing a more continuous soil moisture profile to be determined. Storage, use and handling
of the radioactive neutron emitter may pose unacceptable logistical difficulties.
Monitoring water quality in the unsaturated zone can be accomplished with lysimeters and by
direct soil sampling. Both methods are used to obtain samples, which are subsequently analyzed
for the compounds of interest. Lysimeters consist of hollow tubes with ceramic porous cups at
their base and are installed in predrilled holes. If sufficient soil moisture exists, water can be
induced through the ceramic cups and into the lysimeter tubes by creating a negative pressure
inside the tube with an external pump. Water contents must be near or above the field capacity
of the soil in order for soil samples to be obtained readily. Water collected in the lysimeter tubes
can then be withdrawn and submitted for laboratory analyses. Sampling soils directly can also
provide information on water quality in the unsaturated zone. To evaluate infiltration-related
impacts, soil samples must be collected and analyzed prior to land applying biosolids and then
a comparison is made with later soil samples. Natural variation in soil composition may render
the comparison of results inconclusive for metals and common ions, but should be effective for
evaluating the depth and magnitude of nitrogen compounds.
Saturated Zone
Monitoring the saturated zone for infiltration-related impacts involves the installation and
sampling of ground water monitoring wells. These can be small diameter (5 cm) wells
constructed with PVC casing and slotted screen. Drilling methods such as hollow stem augering
are preferred, since they do not introduce fluids into the borehole which could affect the
chemistry of the water samples which are collected later. Hollow stem auger drilling also allows
undisturbed soil samples to be collected, which is useful for characterizing soil chemistry is
deeper horizons. Recharge of infiltration from land application sites can be evaluated by
4-7
image:
 measuring water levels in monitoring wells. A history of previous water level measurements are
needed in order to identify and factor out daily and seasonal trends in water levels. Water quality
evaluations are undertaken by sampling the monitoring wells for the parameters of concern. At
a minimum, the more mobile constituents in biosolids such as nitrate and other nutrient
compounds should be tested for in the water samples (Berg et al, 1987; Sommers and Nelson,
1981). Several wells should be installed at the land application site to compare upgradient from
downgradient water quality. In addition, at least one set of ground water samples should be
collected prior to biosolids land application and analyzed to establish background conditions.
Quarterly to semi-annual sampling should be a sufficient sampling frequency after land
application has occurred. More frequent sampling may be warranted if the depth to water is
small (Liu, 1982) or if there are other activities nearby that may adversely affect ground water
quality and possibly implicate the land application activities.
Field Study Methodology
Two biosolids land application field studies located in arid to semi-arid rangeland settings have
been instrumented to evaluate infiltration-related water quality degradation. These studies are
part of ongoing research which has been published elsewhere (Aguilar et al, 1994; RED and
CDM, 1994) but salient aspects relating to the infiltration studies are summarized in the
following section.
Meadow Springs Ranch Infiltration Studies
The Meadow Springs Ranch (hereafter referred to as the 'MSR' site) field studies are based on
a series of bordered test plots located in the high plains grassland in northern Colorado. The
MSR test plots consist of 60 15x15 meter "vegetative response" test plots and 24 3x10 meter
"runoff response" test plots. Twenty-four of the vegetative response test plots were treated in
1991 with single applications of biosolids ranging from 0 to 34 Mg/ha; an equal number received
single applications of composted biosolids at the same rates, and the remaining plots received
biosolids and water treatment plant alum residuals in differing rates. The MSR runoff response
test plots were evenly divided between higher (14-16 percent) and lower (7-8 percent) slopes.
The runoff response plots consisted of four replications of single biosolids applications (in 1992)
of 0,17 or 34 Mg/ha at each slope type (RED and CDM, 1994). Soils beneath both test plot sites
consist of the Altvan Series of loamy soil.
Infiltration from natural precipitation events was evaluated at the vegetative response plots from
autumn 1991 through autumn 1993. Monitoring consisted of a set of soil moisture blocks,
tensiometers and lysimeter installed at four sites. Each set of devices was installed within the
highest application rate of the biosolids and compost test plots, at an alum/biosolids test plots
with an intermediate application rate, and at a nearby background site. Moisture blocks were
installed to depths of 15, 30 and 45 cm, with paired tensiometers at the 30 and 45 cm depths.
A suction lysimeter was also installed at each site at 45 cm. Precipitation events were recorded
by an onsite tipping bucket raingage and continuous strip chart recorder. Evaporation was
evaluated with an onsite Class A evaporation pan. Infiltration monitoring at the runoff response
test plots consisted of moisture blocks and tensiometers installed in one control plot and one
biosolids plot each at the lower and higher slopes. Moisture blocks were installed in two sets
4-8
image:
measuring water levels in monitoring wells. A history of previous water level measurements are
needed in order to identify and factor out daily and seasonal trends in water levels. Water quality
evaluations are undertaken by sampling the monitoring wells for the parameters of concern. At
a minimum, the more mobile constituents in biosolids such as nitrate and other nutrient
compounds should be tested for in the water samples (Berg et al, 1987; Sommers and Nelson,
1981). Several wells should be installed at the land application site to compare upgradient from
downgradient water quality. In addition, at least one set of ground water samples should be
collected prior to biosolids land application and analyzed to establish background conditions.
Quarterly to semi-annual sampling should be a sufficient sampling frequency after land
application has occurred. More frequent sampling may be warranted if the depth to water is
small (Liu, 1982) or if there are other activities nearby that may adversely affect ground water
quality and possibly implicate the land application activities.
Field Study Methodology
Two biosolids land application field studies located in arid to semi-arid rangeland settings have
been instrumented to evaluate infiltration-related water quality degradation. These studies are
part of ongoing research which has been published elsewhere (Aguilar et al, 1994; RED and
CDM, 1994) but salient aspects relating to the infiltration studies are summarized in the
following section.
Meadow Springs Ranch Infiltration Studies
The Meadow Springs Ranch (hereafter referred to as the 'MSR' site) field studies are based on
a series of bordered test plots located in the high plains grassland in northern Colorado. The
MSR test plots consist of 60 15x15 meter "vegetative response" test plots and 24 3x10 meter
"runoff response" test plots. Twenty-four of the vegetative response test plots were treated in
1991 with single applications of biosolids ranging from 0 to 34 Mg/ha; an equal number received
single applications of composted biosolids at the same rates, and the remaining plots received
biosolids and water treatment plant alum residuals in differing rates. The MSR runoff response
test plots were evenly divided between higher (14-16 percent) and lower (7-8 percent) slopes.
The runoff response plots consisted of four replications of single biosolids applications (in 1992)
of 0,17 or 34 Mg/ha at each slope type (RED and CDM, 1994). Soils beneath both test plot sites
consist of the Altvan Series of loamy soil.
Infiltration from natural precipitation events was evaluated at the vegetative response plots from
autumn 1991 through autumn 1993. Monitoring consisted of a set of soil moisture blocks,
tensiometers and lysimeter installed at four sites. Each set of devices was installed within the
highest application rate of the biosolids and compost test plots, at an alum/biosolids test plots
with an intermediate application rate, and at a nearby background site. Moisture blocks were
installed to depths of 15, 30 and 45 cm, with paired tensiometers at the 30 and 45 cm depths.
A suction lysimeter was also installed at each site at 45 cm. Precipitation events were recorded
by an onsite tipping bucket raingage and continuous strip chart recorder. Evaporation was
evaluated with an onsite Class A evaporation pan. Infiltration monitoring at the runoff response
test plots consisted of moisture blocks and tensiometers installed in one control plot and one
biosolids plot each at the lower and higher slopes. Moisture blocks were installed in two sets
4-8
image:
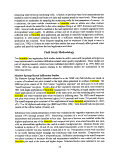 on a given plot, a depths of 15,30,45 and 60 cm. A single tensiometer was also installed at 30
cm at each plot. Measurements of soil moisture, precipitation and evaporation were made almost
daily throughout the growing seasons in 1992 and 1993 at both sites, and weekly or as site access
allowed during the winter months (RED and CDM, 1994). Soil samples were also collected at
0-7.5, 7.5-15 and 15-30 cm depth intervals in July 1992 and July 1993 for analyses of metals,
nitrate and other nutrient compounds.
In addition to monitoring natural precipitation at the MSR site, a simulated rainfall response test
was conducted. This occurred in August 1992 at the runoff response test plots. Simulated
rainfall was applied using a spray up - fall down system consisting of 200 cm tall sprinklers that
distributed precipitation evenly across each plot. Rainfall duration was for 30 minutes at each
plot, at an intensity ranging from 5.1 to 11.3 cm/hr. This is similar to the maximum intensity
30-minute storm events recorded in the region (RED and CDM, 1994). Rainfall was recorded
by a series of 12 rain gages in each plot. Runoff was determined from water levels in a
calibrated holding tank located at the bottom of each bordered test plot. Infiltration was
measured at hourly intervals during the day of the simulated rainfall event, and daily for several
months thereafter.
A final monitoring aspect at the MSR site consisted of ground water monitoring sampling. Ten
wells have been installed at the MSR site and are sampled quarterly for common ions and
nutrient parameters. Water levels are gaged routinely and maps of the water table surface have
been prepared to evaluate upgradient/downgradient flow directions and rates (RED and CDM,
1994).
Sevilleta National Wildlife Refuge
The Sevilleta National Wildlife Refuge site (hereafter referred to as the 'SNWR' site) is on
rangeland in central in New Mexico . The test plots at the SNWR site consist of three pairs of
3x10 m bordered plots on 6-7 percent slopes and 3 paired plots on 10-11 percent slopes. One
of each pair of plots received a one-time application of biosolids in 1991 at 45 Mg/ha (20 dry
tons/acre), with the other plot serving as a control (Aguilar et al, 1994). Soils beneath the site
are classified as the Harvey-Dean Association and consist of fine loamy soils. The emphasis in
this study was to evaluate vegetative response and runoff, so monitoring equipment used in the
infiltration evaluations consisted of a calibrated runoff tank at the base of each test plot and an
onsite self-activating recording rain gage. In addition, soil samples were collected in the upper
15 cm in 5 cm interval and analyzed for antecedent moisture content, nutrient compounds and
metals prior to conducting the simulated rainfall experiments each year. Samples were also
collected annually in 10 cm intervals down to 100 cm and analyzed for nitrate and TKN nitrogen
(Aguilar etal, 1994).
Natural and simulated rainfall events were monitored in 1991 -1993. Simulated rainfall events
were conducted in a manner as described above for the MSR simulated rainfall tests. Rainfall
rates ranged from 4.6 to 10.6 cm/hr for the 30 minute tests (Aguilar et al, 1994). Although
unsaturated zone monitoring was not undertaken directly, relationships of runoff to rainfall on
control and biosolids application test plots provide insight into the magnitude of infiltration that
is possible at this site.
4-9
image:
on a given plot, a depths of 15,30,45 and 60 cm. A single tensiometer was also installed at 30
cm at each plot. Measurements of soil moisture, precipitation and evaporation were made almost
daily throughout the growing seasons in 1992 and 1993 at both sites, and weekly or as site access
allowed during the winter months (RED and CDM, 1994). Soil samples were also collected at
0-7.5, 7.5-15 and 15-30 cm depth intervals in July 1992 and July 1993 for analyses of metals,
nitrate and other nutrient compounds.
In addition to monitoring natural precipitation at the MSR site, a simulated rainfall response test
was conducted. This occurred in August 1992 at the runoff response test plots. Simulated
rainfall was applied using a spray up - fall down system consisting of 200 cm tall sprinklers that
distributed precipitation evenly across each plot. Rainfall duration was for 30 minutes at each
plot, at an intensity ranging from 5.1 to 11.3 cm/hr. This is similar to the maximum intensity
30-minute storm events recorded in the region (RED and CDM, 1994). Rainfall was recorded
by a series of 12 rain gages in each plot. Runoff was determined from water levels in a
calibrated holding tank located at the bottom of each bordered test plot. Infiltration was
measured at hourly intervals during the day of the simulated rainfall event, and daily for several
months thereafter.
A final monitoring aspect at the MSR site consisted of ground water monitoring sampling. Ten
wells have been installed at the MSR site and are sampled quarterly for common ions and
nutrient parameters. Water levels are gaged routinely and maps of the water table surface have
been prepared to evaluate upgradient/downgradient flow directions and rates (RED and CDM,
1994).
Sevilleta National Wildlife Refuge
The Sevilleta National Wildlife Refuge site (hereafter referred to as the 'SNWR' site) is on
rangeland in central in New Mexico . The test plots at the SNWR site consist of three pairs of
3x10 m bordered plots on 6-7 percent slopes and 3 paired plots on 10-11 percent slopes. One
of each pair of plots received a one-time application of biosolids in 1991 at 45 Mg/ha (20 dry
tons/acre), with the other plot serving as a control (Aguilar et al, 1994). Soils beneath the site
are classified as the Harvey-Dean Association and consist of fine loamy soils. The emphasis in
this study was to evaluate vegetative response and runoff, so monitoring equipment used in the
infiltration evaluations consisted of a calibrated runoff tank at the base of each test plot and an
onsite self-activating recording rain gage. In addition, soil samples were collected in the upper
15 cm in 5 cm interval and analyzed for antecedent moisture content, nutrient compounds and
metals prior to conducting the simulated rainfall experiments each year. Samples were also
collected annually in 10 cm intervals down to 100 cm and analyzed for nitrate and TKN nitrogen
(Aguilar etal, 1994).
Natural and simulated rainfall events were monitored in 1991 -1993. Simulated rainfall events
were conducted in a manner as described above for the MSR simulated rainfall tests. Rainfall
rates ranged from 4.6 to 10.6 cm/hr for the 30 minute tests (Aguilar et al, 1994). Although
unsaturated zone monitoring was not undertaken directly, relationships of runoff to rainfall on
control and biosolids application test plots provide insight into the magnitude of infiltration that
is possible at this site.
4-9
image:
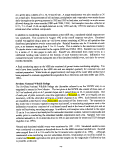 Results and Discussion
Results from monitoring infiltration associated with native precipitation at the land application
study sites were obtained largely from the soil moisture blocks and tensiometers installed at the
MSR site. The moisture block data showed responses from infiltration at all depths monitored.
The 15 cm monitoring depth showed large and rapid responses to rainfall events at all test plot
sites, and then equally rapid drying out of the soil. More seasonal patterns were observed at the
30 cm (12 inch) and 60 cm (24 inch) monitoring depths. Plots of soil moisture at these depths
for each biosolids application type at the MSR vegetative response test plots are shown in
Figures 1 and 2 for 1992 and 1993 data, respectively (RED and CDM, 1994). Also shown on
the plots are precipitation values recorded onsite: All soil moisture data shown on these figures
were smoothed using an eleven-point moving average. Soil moisture values in the range of 75
to 85 percent probably equate to field capacity conditions, meaning that downward fluid flow
occurs at those moisture contents.
Even with the large variation in soil moisture shown on figures 1 and 2, several trends are
evident. Soils beneath the biosolids plots generally showed the highest soil moisture contents
at both depths. Moisture contents were relatively high beneath the 60 cm depth through June of
each year. This is probably due to wet spring conditions and lack of evapotranspiration. From
July through November the soil becomes extremely dry at all depths except in response to large
storm events (figures la, 2a). Increases in soil moisture content at the 30 cm depth lags behind
precipitation events by approximately 3 to 7 days. This suggests moisture infiltration rates on
the order of 10'5 cm/sec for the MSR soils under partially saturated conditions.
The tensiometers showed the same general trends as the soil moisture blocks. The rapid soil
responses in the upper 15 cm due to precipitation and evapotranspiration effects were confirmed,
as were the generally higher moisture contents beneath the biosolids plots. Conditions were
generally dry enough at the MSR site during the monitoring period that on numerous occasions
all of the water was withdrawn from the tensiometers by the high soil suction. This required
repriming the tensiometers and loss of data until the tensiometers again came into equilibrium
with the surrounding soil. As implied by the 60 cm soil moisture block data (Figures Ib, 2b),
soil moisture was generally not high enough during the monitoring period to allow fluid samples
to be collected by the suction lysimeters.
The simulated rainfall events conducted during the third week of August 1992 at the MSR site
created distinct moisture infiltration fronts migrating into the soil columns. Plots of moisture
content from the soil moisture blocks at the 7-8 and 14-16 percent slopes are shown in figures
3 and 4, respectively (RED and CDM, 1994). The initially high moisture content readings
shown on all plots represents the effects of moisture block installation in early August. The 15
cm (6 inch) moisture blocks show immediate responses to the simulated rainfall event in all plot
types and slopes, followed by moisture contents approaching field capacity at the 30 cm depths.
Three of the test plots also showed soil moisture contents approximately equal to field capacity
at a depth of 45 cm (figures 3a, 3b and 4a), while none of the soils at the 60 cm depth reached
field capacity. This indicates that most of the infiltrating water was attenuated in the upper 45
cm through water storage.
4-10
image:
Results and Discussion
Results from monitoring infiltration associated with native precipitation at the land application
study sites were obtained largely from the soil moisture blocks and tensiometers installed at the
MSR site. The moisture block data showed responses from infiltration at all depths monitored.
The 15 cm monitoring depth showed large and rapid responses to rainfall events at all test plot
sites, and then equally rapid drying out of the soil. More seasonal patterns were observed at the
30 cm (12 inch) and 60 cm (24 inch) monitoring depths. Plots of soil moisture at these depths
for each biosolids application type at the MSR vegetative response test plots are shown in
Figures 1 and 2 for 1992 and 1993 data, respectively (RED and CDM, 1994). Also shown on
the plots are precipitation values recorded onsite: All soil moisture data shown on these figures
were smoothed using an eleven-point moving average. Soil moisture values in the range of 75
to 85 percent probably equate to field capacity conditions, meaning that downward fluid flow
occurs at those moisture contents.
Even with the large variation in soil moisture shown on figures 1 and 2, several trends are
evident. Soils beneath the biosolids plots generally showed the highest soil moisture contents
at both depths. Moisture contents were relatively high beneath the 60 cm depth through June of
each year. This is probably due to wet spring conditions and lack of evapotranspiration. From
July through November the soil becomes extremely dry at all depths except in response to large
storm events (figures la, 2a). Increases in soil moisture content at the 30 cm depth lags behind
precipitation events by approximately 3 to 7 days. This suggests moisture infiltration rates on
the order of 10'5 cm/sec for the MSR soils under partially saturated conditions.
The tensiometers showed the same general trends as the soil moisture blocks. The rapid soil
responses in the upper 15 cm due to precipitation and evapotranspiration effects were confirmed,
as were the generally higher moisture contents beneath the biosolids plots. Conditions were
generally dry enough at the MSR site during the monitoring period that on numerous occasions
all of the water was withdrawn from the tensiometers by the high soil suction. This required
repriming the tensiometers and loss of data until the tensiometers again came into equilibrium
with the surrounding soil. As implied by the 60 cm soil moisture block data (Figures Ib, 2b),
soil moisture was generally not high enough during the monitoring period to allow fluid samples
to be collected by the suction lysimeters.
The simulated rainfall events conducted during the third week of August 1992 at the MSR site
created distinct moisture infiltration fronts migrating into the soil columns. Plots of moisture
content from the soil moisture blocks at the 7-8 and 14-16 percent slopes are shown in figures
3 and 4, respectively (RED and CDM, 1994). The initially high moisture content readings
shown on all plots represents the effects of moisture block installation in early August. The 15
cm (6 inch) moisture blocks show immediate responses to the simulated rainfall event in all plot
types and slopes, followed by moisture contents approaching field capacity at the 30 cm depths.
Three of the test plots also showed soil moisture contents approximately equal to field capacity
at a depth of 45 cm (figures 3a, 3b and 4a), while none of the soils at the 60 cm depth reached
field capacity. This indicates that most of the infiltrating water was attenuated in the upper 45
cm through water storage.
4-10
image:
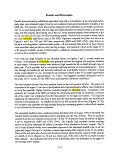 0 -W..
03-Jun
04-Jul
04-Aug 04-Sep
DATE (1992)
12" Moisture Block
05-Oct
OS-Nov
MOISTURE CONTENT (relative %)
M Jk O) CD C
00 0 0 0 0 C
V i i i i i
^^^^A^^^.
J
K
IMCUC
db)
A
HttH
Jun
|
H|
A
..1
.
^
\ 1
Mil
04-Jul
,£
"vl ILk«_, , i
04-Aug 64-Sep 05-Oct 05-Nov
DATE (1992)
-1.0
-0.9
-0.8 -^
(0
-0.7 jr
•0.6 —,
-0.5 .0
•0.3 'g
0.2 °-
-0.1
-0.0
24" Moisture Block
+ Control
A
Biosolids
X
Compost
o
Alum/Bio
1M3 Precip.
Figure 1. Meadow Springs Ranch averaged soil moisture block data for 1992. (A) 30 cm
monitoring depth; (B) 60 cm monitoring depth.
image:
0 -W..
03-Jun
04-Jul
04-Aug 04-Sep
DATE (1992)
12" Moisture Block
05-Oct
OS-Nov
MOISTURE CONTENT (relative %)
M Jk O) CD C
00 0 0 0 0 C
V i i i i i
^^^^A^^^.
J
K
IMCUC
db)
A
HttH
Jun
|
H|
A
..1
.
^
\ 1
Mil
04-Jul
,£
"vl ILk«_, , i
04-Aug 64-Sep 05-Oct 05-Nov
DATE (1992)
-1.0
-0.9
-0.8 -^
(0
-0.7 jr
•0.6 —,
-0.5 .0
•0.3 'g
0.2 °-
-0.1
-0.0
24" Moisture Block
+ Control
A
Biosolids
X
Compost
o
Alum/Bio
1M3 Precip.
Figure 1. Meadow Springs Ranch averaged soil moisture block data for 1992. (A) 30 cm
monitoring depth; (B) 60 cm monitoring depth.
image:
 1.0
16-May
16-Jun
17-Jul
DATE (1993)
12" Moisture Block
a-Aug
_ro
0)
O
O
UJ
DC
3
CO
80-
60-
40 -
20 -
0 -
16-f
X
...>v
TT
day
x
X
. . .X- - . •
X
JJ
. . . v A
(2b)
L..
X. X A
XX A
. .x _ . A
X
X
X
I;
-t^1"
fS&Hnsam,
A
X A
A
X
\ X
A
__Js.
16-Jun 17-Jul ""mTTTTW"v
1
18-Aug
Wfnui
rl.O
-0.9
-0.8
•0.7
-0.6
0.5
•0.4
0.3
•0.2
-0.1
-0.0
DATE (1993)
24" Moisture Block
en
o>
o
o
<u
•t-
Control
A
Biosolids
X
Compost
o
Alum/Bio |
H Precip.
Figure 2. Meadow Springs Ranch averaged soil moisture block data for 1993 (A) 30 cm
monitoring depth; (B) 60 cm monitoring depth.
image:
1.0
16-May
16-Jun
17-Jul
DATE (1993)
12" Moisture Block
a-Aug
_ro
0)
O
O
UJ
DC
3
CO
80-
60-
40 -
20 -
0 -
16-f
X
...>v
TT
day
x
X
. . .X- - . •
X
JJ
. . . v A
(2b)
L..
X. X A
XX A
. .x _ . A
X
X
X
I;
-t^1"
fS&Hnsam,
A
X A
A
X
\ X
A
__Js.
16-Jun 17-Jul ""mTTTTW"v
1
18-Aug
Wfnui
rl.O
-0.9
-0.8
•0.7
-0.6
0.5
•0.4
0.3
•0.2
-0.1
-0.0
DATE (1993)
24" Moisture Block
en
o>
o
o
<u
•t-
Control
A
Biosolids
X
Compost
o
Alum/Bio |
H Precip.
Figure 2. Meadow Springs Ranch averaged soil moisture block data for 1993 (A) 30 cm
monitoring depth; (B) 60 cm monitoring depth.
image:
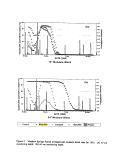 The moisture fronts show a lag time as moisture infiltrates downward to each deeper moisture
block. As shown on figures 3 and 4, the 30 cm moisture blocks at all four test plots showed lag
times of about 3-5 days before reaching maximum moisture content. The 45 cm (18 inch) blocks
show lags hi moisture increase of 5-10 days from the start of the rainfall events, with the larger
lag times at the biosolids-treated plots. The difference in moisture front migration rates between
the control and treated plots is greatest at the 60 cm depth. Approximately 10 days were required
after the simulated rainfall event for the moisture fronts to reach their maximum at the 60 cm
depth beneath both control plots, while approximately 20 days were required beneath the treated
plots. These travel times correspond to an-average infiltration rates of approximately 7 x 10'5
cm/sec at the control plots and 3.5 x 10'5 cm/sec at the biosolids treated plots. Variation in
moisture block responses at individual test plots of a given biosolids application rate is likely due
to different soil properties and instrument responses to soil moisture. Lag times between
precipitation events and soil moisture at depth were also observed by Nash et al (1991). The
slightly lower moisture contents seen in the moisture contents of the biosolids treated plots is
likely due to water being absorbed by the biosolids at the surface and less water being available
for infiltration.
Antecedent moisture content and runoff/rainfall data were computed for the simulated
experiments at both the MSR and the SNWR sites. Assuming evapotranspiration was minimal
over the 30-minute duration of the rainfall tests, average infiltration rates were calculated based
on the difference between precipitation and runoff volumes and rates. A summary of these data
are shown in Table 1. Soil moisture and infiltration rates are both much lower at the MSR site
than the SNWR site as shown in the table. Infiltration and runoff/rainfall rates are comparable
for a given slope type and biosolids application rate, suggesting that slope does not have a strong
influence on these parameters. The data in Table 1 also indicates that runoff rates are much
larger and infiltration rates are much smaller on control plots compared to biosolids plots.
Infiltration rates shown on Table 1 for the MSR site are approximately two orders of magnitude
larger than rates calculated based on the time required for the soil moisture fronts to reach a
depth of 60 cm. The higher infiltration rates shown on Table 1 are due to the higher moisture
content of the surface soils, which allowed more water to infiltrate into the upper soil zone.
Table 1 infiltration rates also account for other water losses, such as evapotranspiration and water
absorption by the biosolids, and so may be biased slightly high. Natural rainfall events that
produced runoff at the SNWR were recorded only in 1991 and 1993 (Aguilar et al, 1994).
Runoff and infiltration relations appear consistent with those of the simulated experiments,
although the magnitudes of the natural infiltration events were small enough that definitive
conclusions could not be made regarding infiltration.
Soil sample results collected from the MSR site showed increases in ammonia, nitrate, electrical
conductivity, P, Cu, An, Mo and Hg for all biosolids application rates in the 0-7.5 cm depth
interval compared to samples from control plots, while ammonia and nitrate concentrations also
increased in soil at the 7.5-15 and 15-30 cm depth intervals (RED and CDM, 1994). Soil sample
results from the SNWR site showed similar patterns, where Cu, Pb and Zn showed increases in
shallow soils down to about 10 cm compared to control plots. Nitrate, ammonia and P showed
4-13
image:
The moisture fronts show a lag time as moisture infiltrates downward to each deeper moisture
block. As shown on figures 3 and 4, the 30 cm moisture blocks at all four test plots showed lag
times of about 3-5 days before reaching maximum moisture content. The 45 cm (18 inch) blocks
show lags hi moisture increase of 5-10 days from the start of the rainfall events, with the larger
lag times at the biosolids-treated plots. The difference in moisture front migration rates between
the control and treated plots is greatest at the 60 cm depth. Approximately 10 days were required
after the simulated rainfall event for the moisture fronts to reach their maximum at the 60 cm
depth beneath both control plots, while approximately 20 days were required beneath the treated
plots. These travel times correspond to an-average infiltration rates of approximately 7 x 10'5
cm/sec at the control plots and 3.5 x 10'5 cm/sec at the biosolids treated plots. Variation in
moisture block responses at individual test plots of a given biosolids application rate is likely due
to different soil properties and instrument responses to soil moisture. Lag times between
precipitation events and soil moisture at depth were also observed by Nash et al (1991). The
slightly lower moisture contents seen in the moisture contents of the biosolids treated plots is
likely due to water being absorbed by the biosolids at the surface and less water being available
for infiltration.
Antecedent moisture content and runoff/rainfall data were computed for the simulated
experiments at both the MSR and the SNWR sites. Assuming evapotranspiration was minimal
over the 30-minute duration of the rainfall tests, average infiltration rates were calculated based
on the difference between precipitation and runoff volumes and rates. A summary of these data
are shown in Table 1. Soil moisture and infiltration rates are both much lower at the MSR site
than the SNWR site as shown in the table. Infiltration and runoff/rainfall rates are comparable
for a given slope type and biosolids application rate, suggesting that slope does not have a strong
influence on these parameters. The data in Table 1 also indicates that runoff rates are much
larger and infiltration rates are much smaller on control plots compared to biosolids plots.
Infiltration rates shown on Table 1 for the MSR site are approximately two orders of magnitude
larger than rates calculated based on the time required for the soil moisture fronts to reach a
depth of 60 cm. The higher infiltration rates shown on Table 1 are due to the higher moisture
content of the surface soils, which allowed more water to infiltrate into the upper soil zone.
Table 1 infiltration rates also account for other water losses, such as evapotranspiration and water
absorption by the biosolids, and so may be biased slightly high. Natural rainfall events that
produced runoff at the SNWR were recorded only in 1991 and 1993 (Aguilar et al, 1994).
Runoff and infiltration relations appear consistent with those of the simulated experiments,
although the magnitudes of the natural infiltration events were small enough that definitive
conclusions could not be made regarding infiltration.
Soil sample results collected from the MSR site showed increases in ammonia, nitrate, electrical
conductivity, P, Cu, An, Mo and Hg for all biosolids application rates in the 0-7.5 cm depth
interval compared to samples from control plots, while ammonia and nitrate concentrations also
increased in soil at the 7.5-15 and 15-30 cm depth intervals (RED and CDM, 1994). Soil sample
results from the SNWR site showed similar patterns, where Cu, Pb and Zn showed increases in
shallow soils down to about 10 cm compared to control plots. Nitrate, ammonia and P showed
4-13
image:
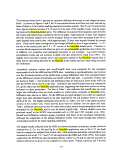 Runoff Site 22, 7%, 0 dry tons/ac
100
CD
I
<D
0)
"c
o
o
Q)
o
'o
07/30
"i 1 r
08/29
09/29
DATE (1992)
10/30
100
Runoff Site 16, 8%, 15.3 dry tons/ac
29-Aug
29-Sep
DATE (1992)
30-Oct
100
6" Moist. Block -*- 12" Moist. Block -B- 18" Moist. Block -•- 24" Moist. Block
Figure 3. Meadow Springs Ranch averaged soil moisture block data for 1992 simulated
rainfall experiment, on 7-8 percent slopes. (A) 0 Mg/ha biosolids; (B) 34 Mg/ha biosolids.
image:
Runoff Site 22, 7%, 0 dry tons/ac
100
CD
I
<D
0)
"c
o
o
Q)
o
'o
07/30
"i 1 r
08/29
09/29
DATE (1992)
10/30
100
Runoff Site 16, 8%, 15.3 dry tons/ac
29-Aug
29-Sep
DATE (1992)
30-Oct
100
6" Moist. Block -*- 12" Moist. Block -B- 18" Moist. Block -•- 24" Moist. Block
Figure 3. Meadow Springs Ranch averaged soil moisture block data for 1992 simulated
rainfall experiment, on 7-8 percent slopes. (A) 0 Mg/ha biosolids; (B) 34 Mg/ha biosolids.
image:
 100
0)
I
£.
I
o
O
CD
1
O
O-l r
30-Jul
Runoff Site 4,15%, 0 dry tons/ac
•Y" 1 r
29-Aug
29-Sep
DATE (1992)
30-Oct
100
100
*
CD
"5
O
O
30-Jul
Runoff Site 12,15%, 15.3 dry tons/ac
29-Aug
29-Sep
DATE (1992)
30--PPI
6" Moist. Block -*- 12" Moist. Block -B- 18" Moist. Block -*- 24" Moist. Block
Figure 4. Meadow Springs Ranch averaged soil moisture block data for 1992 simulated
rainfall experiment, on 14-16 percent slopes. (A) 0 Mg/ha biosolids; (B) 34 Mg/ha
biosolids.
image:
100
0)
I
£.
I
o
O
CD
1
O
O-l r
30-Jul
Runoff Site 4,15%, 0 dry tons/ac
•Y" 1 r
29-Aug
29-Sep
DATE (1992)
30-Oct
100
100
*
CD
"5
O
O
30-Jul
Runoff Site 12,15%, 15.3 dry tons/ac
29-Aug
29-Sep
DATE (1992)
30--PPI
6" Moist. Block -*- 12" Moist. Block -B- 18" Moist. Block -*- 24" Moist. Block
Figure 4. Meadow Springs Ranch averaged soil moisture block data for 1992 simulated
rainfall experiment, on 14-16 percent slopes. (A) 0 Mg/ha biosolids; (B) 34 Mg/ha
biosolids.
image:
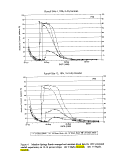 Table 1. Summary of Infiltration Results
Simulated Rainfall Experiments
on Biosolids-Ammended Test Plots
Site
MSR
SNWR
MSR
SNWR
MSR
SNWR
Application
Rate (Mg/h
0
17
34
0
45
0
17
34
0
45
0
17
34
0
45
Antecedent Moisture Content (%)
7 -8% slope 14 -16% slope
0.03 — 0.09 (0.03)
0.03 — 0.08 (0.04)
0.03 — 0.05 (0.02)
6-7% 10-11%
2.52 (0.78) 3.63 (2.43)
3.59 (1.73) 4.80 (1.84)
Infiltration Rate (cm/hr)
7 - 8% 14 - 16%
3.8 (0.9) 2.8 (1.0)
4.6 (0.9) 4.6 (0.9)
4.8 (0.7) 5.4 (0.4)
6-7% 10-11%
7.4 (1.2) 6.4 (1.3)
9.0 (1.2) 8.4 (1.5)
Runoff/Rainfall
7 - 8% 14 - 16%
0.451 (0.147) 0.492 (0.053)
0.302 (0.121) 0.316 (0.183)
0.245 (0.130) 0.357 (0.103)
6-7% 10-11%
0.127 (0.117) 0.107 (0.102)
0.001 (0.003) 0.002 (0.003)
MSR= Meadow Springs Ranch, CO; SNWR= Sevilleta Nat. Wildlife Refuge, NM.
First value is average for plots; number in () is standard deviation.
Sevilleta dataset has 6 plots/slope/application rate.
Each Sevilletta plot measured 3 times (9/91, 9/92,9/93).
Meadow Springs dataset has 4 plots/slope/application rate.
image:
Table 1. Summary of Infiltration Results
Simulated Rainfall Experiments
on Biosolids-Ammended Test Plots
Site
MSR
SNWR
MSR
SNWR
MSR
SNWR
Application
Rate (Mg/h
0
17
34
0
45
0
17
34
0
45
0
17
34
0
45
Antecedent Moisture Content (%)
7 -8% slope 14 -16% slope
0.03 — 0.09 (0.03)
0.03 — 0.08 (0.04)
0.03 — 0.05 (0.02)
6-7% 10-11%
2.52 (0.78) 3.63 (2.43)
3.59 (1.73) 4.80 (1.84)
Infiltration Rate (cm/hr)
7 - 8% 14 - 16%
3.8 (0.9) 2.8 (1.0)
4.6 (0.9) 4.6 (0.9)
4.8 (0.7) 5.4 (0.4)
6-7% 10-11%
7.4 (1.2) 6.4 (1.3)
9.0 (1.2) 8.4 (1.5)
Runoff/Rainfall
7 - 8% 14 - 16%
0.451 (0.147) 0.492 (0.053)
0.302 (0.121) 0.316 (0.183)
0.245 (0.130) 0.357 (0.103)
6-7% 10-11%
0.127 (0.117) 0.107 (0.102)
0.001 (0.003) 0.002 (0.003)
MSR= Meadow Springs Ranch, CO; SNWR= Sevilleta Nat. Wildlife Refuge, NM.
First value is average for plots; number in () is standard deviation.
Sevilleta dataset has 6 plots/slope/application rate.
Each Sevilletta plot measured 3 times (9/91, 9/92,9/93).
Meadow Springs dataset has 4 plots/slope/application rate.
image:
 increases at the SNWR biosolids application plots compared to the control plots, and elevated
nitrate concentrations were detected down to 80 cm (Aguilar et al, 1994).
Ground water monitoring performed at the MSR has shown that common ions, metals, nutrient
compounds and synthetic organic compounds are within natural background levels at all wells
or are below analytical detection limits. Ongoing quarterly monitoring at the MSR site will
continue as field studies proceed.
Conclusions
A series of studies have shown the potential for biosolids-related leachate to contaminate
underlying soils and ground water. Most infiltration-related studies conducted in arid and semi-
arid environments have shown that infiltration is limited to the upper meter or less under normal
precipitation conditions, but deeper infiltration is possible under extreme storm events. The data
collected from the MSR site where biosolids have been applied indicate that neither natural
precipitation nor leachate will infiltrate below about a meter in depth.
In a simulated rainfall experiment at the MSR site representing a large storm event, soils reached
field capacity down to 45 cm, but only moderate increases hi soil moisture were evidenced at 60
cm. Based on results obtained from natural precipitation events at the MSR site in 1992 and
1993, soil moisture infiltrates below biosolids land application areas to depths greater than 60
cm only in spring and early summer, or for brief periods following intense summer
thunderstorms. Spring and early summer appear to be the times when deep infiltration is most
likely because evapotranspiration effects are rninimal and soils frequently have a relatively high
moisture content due to snowmelt and spring rains. These finding are consistent with infiltration
studies conducted in arid and semi-arid regions on undisturbed control plots inNM, ID, CA, TX,
OK and UT.
Biosolids application was shown to cause increased soil moisture contents in all depths during
the monitoring periods at both the MSR and SNWR sites. Higher antecedent moisture contents
(AMCs) observed in site soils beneath biosolids test plots correlated closely with higher
infiltration rates in test plots at the SNWR site. This trend could not be corroborated at the MSR
site due to very low AMC values in soils there. The higher AMC contents beneath biosolids-
treated plots will increase the rate of infiltration and thus the potential for deeper migration of
infiltrating fluid. Land surface slope appears to make little difference in infiltration rate, whereas
biosolids application rate shows a strong direct correlation to infiltration rate and soil moisture
content.
Soil moisture blocks and neutron probes appear to be appropriate soil moisture monitoring
devices in remote arid and semi-arid environments. Laboratory testing is needed to correlate
readings from either device to actual soil moisture contents. Soil tensiometers required constant
maintenance and still became dewatered frequently, necessitating repriming and a new
equilibration period with surrounding soil moisture. For these reasons, use of tensiometers is
not recommended unless daily monitoring and maintenance can be undertaken throughout the
growing season. Due to the very dry soil conditions encountered, the suction lysimeters were
4-17
image:
increases at the SNWR biosolids application plots compared to the control plots, and elevated
nitrate concentrations were detected down to 80 cm (Aguilar et al, 1994).
Ground water monitoring performed at the MSR has shown that common ions, metals, nutrient
compounds and synthetic organic compounds are within natural background levels at all wells
or are below analytical detection limits. Ongoing quarterly monitoring at the MSR site will
continue as field studies proceed.
Conclusions
A series of studies have shown the potential for biosolids-related leachate to contaminate
underlying soils and ground water. Most infiltration-related studies conducted in arid and semi-
arid environments have shown that infiltration is limited to the upper meter or less under normal
precipitation conditions, but deeper infiltration is possible under extreme storm events. The data
collected from the MSR site where biosolids have been applied indicate that neither natural
precipitation nor leachate will infiltrate below about a meter in depth.
In a simulated rainfall experiment at the MSR site representing a large storm event, soils reached
field capacity down to 45 cm, but only moderate increases hi soil moisture were evidenced at 60
cm. Based on results obtained from natural precipitation events at the MSR site in 1992 and
1993, soil moisture infiltrates below biosolids land application areas to depths greater than 60
cm only in spring and early summer, or for brief periods following intense summer
thunderstorms. Spring and early summer appear to be the times when deep infiltration is most
likely because evapotranspiration effects are rninimal and soils frequently have a relatively high
moisture content due to snowmelt and spring rains. These finding are consistent with infiltration
studies conducted in arid and semi-arid regions on undisturbed control plots inNM, ID, CA, TX,
OK and UT.
Biosolids application was shown to cause increased soil moisture contents in all depths during
the monitoring periods at both the MSR and SNWR sites. Higher antecedent moisture contents
(AMCs) observed in site soils beneath biosolids test plots correlated closely with higher
infiltration rates in test plots at the SNWR site. This trend could not be corroborated at the MSR
site due to very low AMC values in soils there. The higher AMC contents beneath biosolids-
treated plots will increase the rate of infiltration and thus the potential for deeper migration of
infiltrating fluid. Land surface slope appears to make little difference in infiltration rate, whereas
biosolids application rate shows a strong direct correlation to infiltration rate and soil moisture
content.
Soil moisture blocks and neutron probes appear to be appropriate soil moisture monitoring
devices in remote arid and semi-arid environments. Laboratory testing is needed to correlate
readings from either device to actual soil moisture contents. Soil tensiometers required constant
maintenance and still became dewatered frequently, necessitating repriming and a new
equilibration period with surrounding soil moisture. For these reasons, use of tensiometers is
not recommended unless daily monitoring and maintenance can be undertaken throughout the
growing season. Due to the very dry soil conditions encountered, the suction lysimeters were
4-17
image:
 not effective in collecting samples of soil moisture from the unsaturated zone. These devices
may be useful in settings where relatively high moisture contents (those approaching field
capacity) for a given soil are anticipated. Ground water monitoring will provide the best
absolute means to evaluate changes in ground water quality associated with land application of
biosolids, but may be necessary only when the unsaturated zone monitoring indicates that deep
infiltration occurs at a site. Borehole drilling is recommended in order to determine the depth
to ground water and evaluate the presence of low-permeability layers within the unsaturated
zone.
The moisture contents observed at the MSR site indicate that the potential for lateral migration
leachate to nearby seeps and the vertical migration of leachate to the water table are both very
low. Ground water sampling results do not indicate impacts to the shallow aquifer system from
biosolids application. Therefore, the risk to water quality degradation associated with
infiltration of leachate beneath biosolids application areas at the MSR site appears minimal. The
larger AMC values and higher infiltration rates present at the SNWR test plots suggest a greater
potential for infiltration. The accumulation of calcium carbonate at 40-80 cm and gypsum at
160-170 cm, if indicative of the average and maximum depths of infiltration, supports the greater
depth of infiltration compared to the MSR site.
4-18
image:
not effective in collecting samples of soil moisture from the unsaturated zone. These devices
may be useful in settings where relatively high moisture contents (those approaching field
capacity) for a given soil are anticipated. Ground water monitoring will provide the best
absolute means to evaluate changes in ground water quality associated with land application of
biosolids, but may be necessary only when the unsaturated zone monitoring indicates that deep
infiltration occurs at a site. Borehole drilling is recommended in order to determine the depth
to ground water and evaluate the presence of low-permeability layers within the unsaturated
zone.
The moisture contents observed at the MSR site indicate that the potential for lateral migration
leachate to nearby seeps and the vertical migration of leachate to the water table are both very
low. Ground water sampling results do not indicate impacts to the shallow aquifer system from
biosolids application. Therefore, the risk to water quality degradation associated with
infiltration of leachate beneath biosolids application areas at the MSR site appears minimal. The
larger AMC values and higher infiltration rates present at the SNWR test plots suggest a greater
potential for infiltration. The accumulation of calcium carbonate at 40-80 cm and gypsum at
160-170 cm, if indicative of the average and maximum depths of infiltration, supports the greater
depth of infiltration compared to the MSR site.
4-18
image:
 Acknowledgements
The author appreciates the cooperation of Mr. Sam Loftin in sharing information on the Sevilleta
NWR study. Any errors or omissions regarding that site as presented in this paper are the
author's and not those of Mr. Loftin or his co-workers.
Hydrogeologist, Camp Dresser & McKee Inc, 1331 17th Street, Suite 1200, Denver, CO 80202.
References
Aguilar, R., and Aldon, E.F. (199la) Runoff and sediment rates on San Mateo and Querencia
soils, Rio Puerco Watershed Management Area, NM. USD A Forest Service Rocky
Mountain Forest Experiment Station Research Note RM-506. Albuquerque, NM.
Aguilar, R., and Aldon, E.F. (1991b) Seasonal water flux and potential for leaching in a semiarid
rangeland soil. In: Proceedings of the Fifth National Outdoor Action Conference on
Aquifer Restoration, Ground water Monitoring and Geophysical Methods. May 13-16,
1991, Las Vegas NV. National Water Well Assoc. pp 669-683.
Aguilar, R., and Loftin, S.R. (1992) Sewage sludge application in semiarid grasslands: effects
on runoff and surface water quality. In: Proceedings of the 36th Annual New Mexico
Water Conference. New Mexico Water Resources Research Institute, Technical Report
No 265, NM State Univ., Nov. 7-8,191, Las Cruces, NM.
Aguilar, R., Loftin, S.R., Ward, T.J., Stevens, K.A., and Gosz, J.R., (1994) Sewage sludge
application in semiarid grasslands: effects on vegetation and water quality. New Mexico
Water Resources Research Institute, Technical Report No 285, NM State Univ., Las
Cruces, NM.
Baxter, J.C., Martin, W.J., Sabey, B.R., Hart, W.E., and Cohen, D.B., (1977) Comprehensive
summary of sludge disposal recycling history. EPA Report EPA-600/2-77-054.
Berg, R.C., Morse, W.J., and Johnson, T.M., (1987) Hydrogeologic evaluation of the effects of
surface application of sewage sludge to agricultural land near Rockton, Illinois. Env.
Geol. Notes 119.
Branson, F.A., Gifford, G.F., and Owen, J.R., (1972) Rangeland Hydrology. Society for Range
Management, Denver Colorado. Range Science Series No. 1.
Bruggeman, A.C., and Mostaghimi, S. (1993) Sludge application effects on runoff, infiltration
and water quality. Water Res. Bull, 29:15-26.
Carlson, D.H., Thurow, T.L., Knight, R.W., and Heitschmidt, R.K., (1990) Effect of honey
mesquite on the water balance of Texas rolling plains rangeland. J. Rangeland Mgmnt.,
43:491-496.
4-19
image:
Acknowledgements
The author appreciates the cooperation of Mr. Sam Loftin in sharing information on the Sevilleta
NWR study. Any errors or omissions regarding that site as presented in this paper are the
author's and not those of Mr. Loftin or his co-workers.
Hydrogeologist, Camp Dresser & McKee Inc, 1331 17th Street, Suite 1200, Denver, CO 80202.
References
Aguilar, R., and Aldon, E.F. (199la) Runoff and sediment rates on San Mateo and Querencia
soils, Rio Puerco Watershed Management Area, NM. USD A Forest Service Rocky
Mountain Forest Experiment Station Research Note RM-506. Albuquerque, NM.
Aguilar, R., and Aldon, E.F. (1991b) Seasonal water flux and potential for leaching in a semiarid
rangeland soil. In: Proceedings of the Fifth National Outdoor Action Conference on
Aquifer Restoration, Ground water Monitoring and Geophysical Methods. May 13-16,
1991, Las Vegas NV. National Water Well Assoc. pp 669-683.
Aguilar, R., and Loftin, S.R. (1992) Sewage sludge application in semiarid grasslands: effects
on runoff and surface water quality. In: Proceedings of the 36th Annual New Mexico
Water Conference. New Mexico Water Resources Research Institute, Technical Report
No 265, NM State Univ., Nov. 7-8,191, Las Cruces, NM.
Aguilar, R., Loftin, S.R., Ward, T.J., Stevens, K.A., and Gosz, J.R., (1994) Sewage sludge
application in semiarid grasslands: effects on vegetation and water quality. New Mexico
Water Resources Research Institute, Technical Report No 285, NM State Univ., Las
Cruces, NM.
Baxter, J.C., Martin, W.J., Sabey, B.R., Hart, W.E., and Cohen, D.B., (1977) Comprehensive
summary of sludge disposal recycling history. EPA Report EPA-600/2-77-054.
Berg, R.C., Morse, W.J., and Johnson, T.M., (1987) Hydrogeologic evaluation of the effects of
surface application of sewage sludge to agricultural land near Rockton, Illinois. Env.
Geol. Notes 119.
Branson, F.A., Gifford, G.F., and Owen, J.R., (1972) Rangeland Hydrology. Society for Range
Management, Denver Colorado. Range Science Series No. 1.
Bruggeman, A.C., and Mostaghimi, S. (1993) Sludge application effects on runoff, infiltration
and water quality. Water Res. Bull, 29:15-26.
Carlson, D.H., Thurow, T.L., Knight, R.W., and Heitschmidt, R.K., (1990) Effect of honey
mesquite on the water balance of Texas rolling plains rangeland. J. Rangeland Mgmnt.,
43:491-496.
4-19
image:
 Chang, A.C., and Page, A.L., (1990) Long-term environmental effects associated with land
application of municipal sludges: a review. In: Solid/Liquid Separation: Waste
Management and Productivity Enhancement. Battelle Press, Columbus, OH, pp 439-454.
Coupe, R.H., and Macy, J.A., (1993) Surface water and streambed sediment quality of streams
draining surface mined land reclaimed with sewage sludge, Fulton County, Illinois. U.S.
Geol. Survey Water Resources Invest. Report 93-4056.
Davis, R.D., Carlton-Smith, C.H., Stark, J.H., and Campbell, J.A., (1988) Distribution of metals
in grassland soils following surface applications of sewage sludge. Environ. Poll, 49:99-
115. - . .._ •
Duell, L.F.W., (1990) Estimates of evapotranspiration in alkaline scrub and meadow
communities of Owens Valley, California, using the Bowen-ratio, Eddy-correlation, and
Penman-combination methods. U.S. Geol. Survey Water Supply Paper 2370-E.
Epstein, E., Effect of sewage sludge on some soil physical properties. J. Env. Qual, 4:139-142.
Fresquez, P.R., Aguilar, R., Francis, R.E., and Aldon, E.F., (1991) Heavy metal uptake by blue
grama growing in a degraded semiarid soil amended with sewage sludge. Water, Air and
Soil Poll, 57/58:903-912.
Fresquez, P.R., Francis, R.E., and Dennis, G.L., (1990) Sewage sludge effects on soil and plant
quality in a degraded, semiarid grassland. J. Env. Qual, 19:324-329.
Gallier, W.T., Brobst, R., Aguilar, R., Barbarick, K., and Hegeman, P. (1993) Rx for
Rangelands. Water Env. & Tech., 5:56-60.
Goda, T., Kuboi, T., and Fujii, K., (1986) Environmental impacts of sewage sludge applied to
cropland. Internal J. Env. Studies, 27:239-253.
Kelling, K.A., Peterson, A.E., and Walsh, L.M., (1977) Effect of wastewater sludge on soil
moisture relationships and surface. J. Wat. Poll Cont. Fed., 49:1698-1703.
Khaleel, R., Reddy, K.R., and Overcash, M.R. (1981) Changes in soil physical properties due
to organic waste applications: a review. J. Environ. Qual, 10:133-141.
King, C.H., Houck, C.P., and Deadmond, L.L., (1988) Land application of Kodak Colorado
Division wastewater treatment plant sludge. In: Analytical Techniques and Residuals
Management in Water Pollution Control Specialty Conference, April 19-20, 1988,
Alexandria, VA. Water Pollution Control Federation, pp 241-261.
Kiusalaas, N.J. and Poeter, E.P. (1992) Estimation of groundwater recharge using neutron probe
moisture readings near Golden, Colorado. Colorado Water Resources Research Institute,
Completion Report No. 165, Colo. State Univ., Fort Collins, CO.
4-20
image:
Chang, A.C., and Page, A.L., (1990) Long-term environmental effects associated with land
application of municipal sludges: a review. In: Solid/Liquid Separation: Waste
Management and Productivity Enhancement. Battelle Press, Columbus, OH, pp 439-454.
Coupe, R.H., and Macy, J.A., (1993) Surface water and streambed sediment quality of streams
draining surface mined land reclaimed with sewage sludge, Fulton County, Illinois. U.S.
Geol. Survey Water Resources Invest. Report 93-4056.
Davis, R.D., Carlton-Smith, C.H., Stark, J.H., and Campbell, J.A., (1988) Distribution of metals
in grassland soils following surface applications of sewage sludge. Environ. Poll, 49:99-
115. - . .._ •
Duell, L.F.W., (1990) Estimates of evapotranspiration in alkaline scrub and meadow
communities of Owens Valley, California, using the Bowen-ratio, Eddy-correlation, and
Penman-combination methods. U.S. Geol. Survey Water Supply Paper 2370-E.
Epstein, E., Effect of sewage sludge on some soil physical properties. J. Env. Qual, 4:139-142.
Fresquez, P.R., Aguilar, R., Francis, R.E., and Aldon, E.F., (1991) Heavy metal uptake by blue
grama growing in a degraded semiarid soil amended with sewage sludge. Water, Air and
Soil Poll, 57/58:903-912.
Fresquez, P.R., Francis, R.E., and Dennis, G.L., (1990) Sewage sludge effects on soil and plant
quality in a degraded, semiarid grassland. J. Env. Qual, 19:324-329.
Gallier, W.T., Brobst, R., Aguilar, R., Barbarick, K., and Hegeman, P. (1993) Rx for
Rangelands. Water Env. & Tech., 5:56-60.
Goda, T., Kuboi, T., and Fujii, K., (1986) Environmental impacts of sewage sludge applied to
cropland. Internal J. Env. Studies, 27:239-253.
Kelling, K.A., Peterson, A.E., and Walsh, L.M., (1977) Effect of wastewater sludge on soil
moisture relationships and surface. J. Wat. Poll Cont. Fed., 49:1698-1703.
Khaleel, R., Reddy, K.R., and Overcash, M.R. (1981) Changes in soil physical properties due
to organic waste applications: a review. J. Environ. Qual, 10:133-141.
King, C.H., Houck, C.P., and Deadmond, L.L., (1988) Land application of Kodak Colorado
Division wastewater treatment plant sludge. In: Analytical Techniques and Residuals
Management in Water Pollution Control Specialty Conference, April 19-20, 1988,
Alexandria, VA. Water Pollution Control Federation, pp 241-261.
Kiusalaas, N.J. and Poeter, E.P. (1992) Estimation of groundwater recharge using neutron probe
moisture readings near Golden, Colorado. Colorado Water Resources Research Institute,
Completion Report No. 165, Colo. State Univ., Fort Collins, CO.
4-20
image:
 Lauenroth, W.K., and Sims, P.L. (1976) Evapotranspiration from a shortgrass prairie subjected
to water and nitrogen treatments. Water Res. Res. 12:437-442.
Lerch, R.N., Barbarick, K.A., Westfall, D.G., Follett, R.H., and McBride, T.N., (1990)
Sustainable rates of sewage sludge for dryland winter wheat production: II. production
and income. J. Production Agric., 3:66-71.
Liang, Y., and Corey, R.B., (1993) Redistribution of sludge-borne cadmium, copper, and zinc
in a cultivated plot. J. Env. Qual, 22:1-8.
Liu, D., (1982) The effect of sewage sludge land disposal on the microbiological quality of
groundwater. Water Res., 16:957-961.
Loaque, K. (1992) Soil water content at R-5: Part 2, impact of antecedent conditions on rainfall-
runoff simulations. J. Hydrol, 139:253-261.
McCully, W.G., and Haas, R.H., (1970) An evapotranspiration model for great plains grasslands.
In: Evapotranspiration in the Great Plains. March 23-25,1970, Bushlands, Texas. Great
Plains Agricultural Council Research Committee Publication No. 50, pp 55-65.
Mostaghimi, S., Younos, T.M., and Tim, U.S. (1992) Effects of sludge and chemical fertilizer
application on runoff water quality. Water Res. Bull, 28:545-552.
Nash, M.S., Wierenga, P.J., and Gutjahr, A., (1991) Time series analysis of soil moisture and
rainfall along a line transect in arid rangeland. Soil Sci., 152:189-198.
Nixon, P.R., Lawless, G.P., and McCormick, R.L., (1972) Soil hydrology in a semiarid
watershed. Trans., Am. Soc. Agric. Eng., 15:985-991.
O'Brien, P., and Mitsch, W.J., (1980) Root zone nitrogen simulation model for land application
of sewage sludges. Ecolog. Modelling, 8:233-257.
Otoma, S., and Kuboi, T., (1988) Prediction of time variation in water and chloride profiles in
a soil subject to cropping and annual application of sewage sludge. J. Hydrol., 99:1-17.
Parton, W.J., Lauenroth, W.K., and Smith, P.M., (1981) Water loss from a shortgrass steppe.
Agric. Meteorol, 24:97-109. Elsevier Scientific Pub. Co., The Netherlands.
RBD Engineers Inc, and Camp Dresser & McKee Inc, (1994) Wastewater plan for biosolids and
water treatment plant residuals, City of Fort Collins, CO.
Sabey, B.R., Pendleton, R.L., and Webb, B.L., (1990) Effect of Municipal Sewage Sludge
application on growth of two reclamation shrub species in copper mine spoils. J. Env.
Qual, 19:580-586.
4-21
image:
Lauenroth, W.K., and Sims, P.L. (1976) Evapotranspiration from a shortgrass prairie subjected
to water and nitrogen treatments. Water Res. Res. 12:437-442.
Lerch, R.N., Barbarick, K.A., Westfall, D.G., Follett, R.H., and McBride, T.N., (1990)
Sustainable rates of sewage sludge for dryland winter wheat production: II. production
and income. J. Production Agric., 3:66-71.
Liang, Y., and Corey, R.B., (1993) Redistribution of sludge-borne cadmium, copper, and zinc
in a cultivated plot. J. Env. Qual, 22:1-8.
Liu, D., (1982) The effect of sewage sludge land disposal on the microbiological quality of
groundwater. Water Res., 16:957-961.
Loaque, K. (1992) Soil water content at R-5: Part 2, impact of antecedent conditions on rainfall-
runoff simulations. J. Hydrol, 139:253-261.
McCully, W.G., and Haas, R.H., (1970) An evapotranspiration model for great plains grasslands.
In: Evapotranspiration in the Great Plains. March 23-25,1970, Bushlands, Texas. Great
Plains Agricultural Council Research Committee Publication No. 50, pp 55-65.
Mostaghimi, S., Younos, T.M., and Tim, U.S. (1992) Effects of sludge and chemical fertilizer
application on runoff water quality. Water Res. Bull, 28:545-552.
Nash, M.S., Wierenga, P.J., and Gutjahr, A., (1991) Time series analysis of soil moisture and
rainfall along a line transect in arid rangeland. Soil Sci., 152:189-198.
Nixon, P.R., Lawless, G.P., and McCormick, R.L., (1972) Soil hydrology in a semiarid
watershed. Trans., Am. Soc. Agric. Eng., 15:985-991.
O'Brien, P., and Mitsch, W.J., (1980) Root zone nitrogen simulation model for land application
of sewage sludges. Ecolog. Modelling, 8:233-257.
Otoma, S., and Kuboi, T., (1988) Prediction of time variation in water and chloride profiles in
a soil subject to cropping and annual application of sewage sludge. J. Hydrol., 99:1-17.
Parton, W.J., Lauenroth, W.K., and Smith, P.M., (1981) Water loss from a shortgrass steppe.
Agric. Meteorol, 24:97-109. Elsevier Scientific Pub. Co., The Netherlands.
RBD Engineers Inc, and Camp Dresser & McKee Inc, (1994) Wastewater plan for biosolids and
water treatment plant residuals, City of Fort Collins, CO.
Sabey, B.R., Pendleton, R.L., and Webb, B.L., (1990) Effect of Municipal Sewage Sludge
application on growth of two reclamation shrub species in copper mine spoils. J. Env.
Qual, 19:580-586.
4-21
image:
 Seyfried, M.S. (1991) Infiltration patterns from simulated rainfall on a semiarid rangeland soil.
SoilSci. Soc. Am. J., 55:1726-1734.
Stephens, D.B., Knowlton, R.G., McCord, J., and Cox, W., (1986) Field study of natural ground
water recharge in a semi-arid lowland. New Mexico Water Resources Research Institute,
Technical Report No 177, NM State Univ., Las Cruces, NM.
Sommers, L.E., and Nelson, D.W., (1981) Monitoring the response of soils and crops to sludge
applications. In: Sludge and Its Ultimate Disposal Ann Arbor Science, Ann Arbor, MI,
pp 217-239.
Tackett, S.L., Winters, E.R., and Puz, M.J., (1986) Leaching of heavy metals from composted
sewage sludge as a function of pH. Canadian J. Soil Sci., 66:763-765.
Tromble, J.R., Renard, K.G. and Thatcher, A.P., (1974) Infiltration for three rangeland soil-
vegetation complexes. J. Range Mgmnt., 27:318-321.
Trout, J.T., Smith, J.L., McWhorter, D.B., (1975) Environmental effects of land application of
digested municipal sewage sludge. National Science Foundation, Washington, DC.
Applied Science and Research Applications.
Welch, J.E., and Lund, L.J., (1989) Zinc movement in sewage sludge treated soils as influenced
by soil properties, irrigation water quality and soil moisture level. Soil Sci., 147:208-
214.
Weltz, M.A., and Blackburn, W.H., (1993) Modeling water balance with the ERHYM model on
south Texas rangelands. Water Res. Bull, 29:461-474.
Wengel, R.W. and Griffin, G.F., (1979) Potential ground water pollution from sewage sludge
application on agricultural land. Connecticut Univ., Storrs Inst. of Water Resources
Research Project Technical Completion Report, OWRT A-074-Conn(l).
Williams, D.E., Vlamis, J., Pukite, A.M., and Corey, I.E., (1987) Metal movement in sludge-
amended soils: a nine year study. Soil Sci., 143:124-131.
4-22
image:
Seyfried, M.S. (1991) Infiltration patterns from simulated rainfall on a semiarid rangeland soil.
SoilSci. Soc. Am. J., 55:1726-1734.
Stephens, D.B., Knowlton, R.G., McCord, J., and Cox, W., (1986) Field study of natural ground
water recharge in a semi-arid lowland. New Mexico Water Resources Research Institute,
Technical Report No 177, NM State Univ., Las Cruces, NM.
Sommers, L.E., and Nelson, D.W., (1981) Monitoring the response of soils and crops to sludge
applications. In: Sludge and Its Ultimate Disposal Ann Arbor Science, Ann Arbor, MI,
pp 217-239.
Tackett, S.L., Winters, E.R., and Puz, M.J., (1986) Leaching of heavy metals from composted
sewage sludge as a function of pH. Canadian J. Soil Sci., 66:763-765.
Tromble, J.R., Renard, K.G. and Thatcher, A.P., (1974) Infiltration for three rangeland soil-
vegetation complexes. J. Range Mgmnt., 27:318-321.
Trout, J.T., Smith, J.L., McWhorter, D.B., (1975) Environmental effects of land application of
digested municipal sewage sludge. National Science Foundation, Washington, DC.
Applied Science and Research Applications.
Welch, J.E., and Lund, L.J., (1989) Zinc movement in sewage sludge treated soils as influenced
by soil properties, irrigation water quality and soil moisture level. Soil Sci., 147:208-
214.
Weltz, M.A., and Blackburn, W.H., (1993) Modeling water balance with the ERHYM model on
south Texas rangelands. Water Res. Bull, 29:461-474.
Wengel, R.W. and Griffin, G.F., (1979) Potential ground water pollution from sewage sludge
application on agricultural land. Connecticut Univ., Storrs Inst. of Water Resources
Research Project Technical Completion Report, OWRT A-074-Conn(l).
Williams, D.E., Vlamis, J., Pukite, A.M., and Corey, I.E., (1987) Metal movement in sludge-
amended soils: a nine year study. Soil Sci., 143:124-131.
4-22
image:
 Municipal Biosolids Application Effect on Infiltration
and Erosion on Desert Grasslands
Corey A. Moffet, Richard E Zartman, Cynthia M. Brenton,
Ernest B. Fish, David B. Wester, and Ronald E. Sosebee
Abstract
Land application of bio solids on arid and semi-arid rangeland has led to growing interest in
determining the hydrologic consequences of this practice. The objectives of this work are: 1)
to evaluate the effects of varied rates of biosolids on infiltration, erosion, and soil water quality;
and 2) to examine some of the mechanisms, whereby biosolids application affect infiltration.
A portable single-nozzle rainfall simulator was used to simulate rainfall on 0.5 m2 plots to
determine infiltration and erosion. In the infiltration and erosion experiment, effects of
vegetation cover (bare or vegetated), season of simulation (winter or summer), soil type
(Chilicotal or Stellar), and rate of biosolids applied (0, 7, 34, or 90 dry Mg ha'1) were studied.
Microlysimeters were used in the percolation and water quality study for two soils (Armesa and
Stellar) with similar rates of applied biosolids plus 18 dry Mg ha'1. The quantity of water to wet
the profile and the quality of the leachate were measured. Application of biosolids, especially
at the 34 and 90 Mg ha"1 rates, increased infiltration rate and cumulative infiltration while
decreasing erosion. The clay layer in the Stellar soil limited water percolation. Increases in
NCV'-N, S042', and PO43' were observed with an increase in biosolids application rate. Leachate
pH tended to decrease with increasing biosolids rate. Topical application of biosolids has
important hydrologic consequences in desert grasslands that depend upon kind of soil being
treated and the rate of biosolids applied. Risk of groundwater contamination from soil leachate
in the study area is minimal.
Keywords: biosolids, infiltration, erosion, ground water, hydrology
With the recent increase in land application of biosolids has come demand for a better
understanding of its ecological implications. The application of biosolids can supply large
quantities of nitrogen and phosphorus to the soil and agricultural crops (Soon et al. 1978). Use
as a fertilizer is not a new practice. People have used this resource and even its untreated
counterpart (raw sewage) for centuries as a soil amendment on cropland.
Fresquez et al. (1990) have demonstrated some of the benefits of biosolids application on
semi-arid grasslands in New Mexico. Hydrologic consequences of biosolids application in
semi-arid environments have also been examined (Aguilar and Loftin 1992, and Harris-Pierce
et al. 1995). These studies found a decrease in runoff and erosion with biosolids application
while maintaining surface water quality. The low precipitation in arid and semi-arid regions
would seem to be favorable for maintaining surface and ground water quality.
An understanding of the effects of biosolids application on hydrology is necessary in properly
managing the water resource and in explaining ecosystem responses to this treatment. The
4-1
image:
Municipal Biosolids Application Effect on Infiltration
and Erosion on Desert Grasslands
Corey A. Moffet, Richard E Zartman, Cynthia M. Brenton,
Ernest B. Fish, David B. Wester, and Ronald E. Sosebee
Abstract
Land application of bio solids on arid and semi-arid rangeland has led to growing interest in
determining the hydrologic consequences of this practice. The objectives of this work are: 1)
to evaluate the effects of varied rates of biosolids on infiltration, erosion, and soil water quality;
and 2) to examine some of the mechanisms, whereby biosolids application affect infiltration.
A portable single-nozzle rainfall simulator was used to simulate rainfall on 0.5 m2 plots to
determine infiltration and erosion. In the infiltration and erosion experiment, effects of
vegetation cover (bare or vegetated), season of simulation (winter or summer), soil type
(Chilicotal or Stellar), and rate of biosolids applied (0, 7, 34, or 90 dry Mg ha'1) were studied.
Microlysimeters were used in the percolation and water quality study for two soils (Armesa and
Stellar) with similar rates of applied biosolids plus 18 dry Mg ha'1. The quantity of water to wet
the profile and the quality of the leachate were measured. Application of biosolids, especially
at the 34 and 90 Mg ha"1 rates, increased infiltration rate and cumulative infiltration while
decreasing erosion. The clay layer in the Stellar soil limited water percolation. Increases in
NCV'-N, S042', and PO43' were observed with an increase in biosolids application rate. Leachate
pH tended to decrease with increasing biosolids rate. Topical application of biosolids has
important hydrologic consequences in desert grasslands that depend upon kind of soil being
treated and the rate of biosolids applied. Risk of groundwater contamination from soil leachate
in the study area is minimal.
Keywords: biosolids, infiltration, erosion, ground water, hydrology
With the recent increase in land application of biosolids has come demand for a better
understanding of its ecological implications. The application of biosolids can supply large
quantities of nitrogen and phosphorus to the soil and agricultural crops (Soon et al. 1978). Use
as a fertilizer is not a new practice. People have used this resource and even its untreated
counterpart (raw sewage) for centuries as a soil amendment on cropland.
Fresquez et al. (1990) have demonstrated some of the benefits of biosolids application on
semi-arid grasslands in New Mexico. Hydrologic consequences of biosolids application in
semi-arid environments have also been examined (Aguilar and Loftin 1992, and Harris-Pierce
et al. 1995). These studies found a decrease in runoff and erosion with biosolids application
while maintaining surface water quality. The low precipitation in arid and semi-arid regions
would seem to be favorable for maintaining surface and ground water quality.
An understanding of the effects of biosolids application on hydrology is necessary in properly
managing the water resource and in explaining ecosystem responses to this treatment. The
4-1
image:
 objectives of this work are: 1) to evaluate the effects of varied rates of biosolids on infiltration,
erosion, and soil water quality; and 2) to examine some of the mechanisms, whereby biosolids
application affect infiltration.
Materials and Methods
Study Site
This research is being conducted in far west Texas near the town of Sierra Blanca. This is a
northern Chihuahuan Desert grassland. The climate of the region is characterized by limited
precipitation and high afternoon air temperatures in the summer. The annual precipitation is
about 31 cm with about 65 % falling in the months of July, August,-and September. The
shallowest known ground water at the study site is greater than 150 meters deep and has not been
a source for domestic use.
The physiography of the study area is typical of the northern Chihuahuan desert. The study area
is located on a large gently sloping to nearly level bolson that is bounded by igneous mountains
on the west and limestone escarpments on the north and east.
The soils at the study area are diverse. Although all the soils being studied are classified as
aridisols; texture, structure, and expression of pedogenic features are widely varied. There is
not a Natural Resource Conservation Service (NRCS; previously the Soil Conservation Service)
soil survey available at this time for either Hudspeth or adjacent Culberson counties. The
published survey for adjacent El Paso county is in geology that is strongly influenced by the Rio
Grande river unlike the locally derived alluvium of the study area. Soil series have not been
established by the NRCS for the study area and thus the soil series names cited in this work are
tentative, providing only a field name. The three soils studied have been described and classified
as: Armesa fine sandy loam, 0 to 1 percent slope (Fine-loamy, carbonatic, thermic Ustic
Haplocalcids); Chilicotal gravelly sandy loam 1 to 3 percent slope (Loamy-skeletal, mixed,
thermic Ustic Haplocalcids); and Stellar taxajunct sandy clay loam, 1 to 3 percent slope (Fine,
mixed, thermic Ustertic Haplargids).
The Armesa soil has an 11 cm thick fine sandy loam surface horizon that overlies a 33 cm thick
sandy clay loam cambic horizon. The calcic horizon at 54 cm below the surface has about 40
% by volume calcium carbonate segregations. The similar Chilicotal soil has a 12 cm thick
gravelly sandy loam surface horizon that overlies a 30 to 50 cm thick gravelly sandy loam
cambic horizon. The calcic horizon is generally at a depth greater than 50 cm. The Chilicotal
soil has a significant cover of pebble sized rock fragments that armor the soil. The Stellar soil
has a 10 cm thick non-calcarious sandy clay loam surface horizon that overlies a clay argillic
horizon. The argillic horizon has well-developed prismatic structure that parts to subangular
blocks in the upper 20 cm but becomes extremely dense below a depth of 30 cm. A calcic
horizon is also present in the Stellar soil at depths between 50 and 100 cm.
Vegetation varies with soil and each soil studied constitutes a unique range site. A Loamy range
site variant is associated with the Stellar soil. The vegetation on the Loamy site is dominated
by tobosagrass (Maria muticd) with some mesquite (Prosopis glandulosa) and lotebush
(Ziziphus obtusifolid). A Gravelly range site is associated with the Chilicotal soil. The Gravelly
4-2
image:
objectives of this work are: 1) to evaluate the effects of varied rates of biosolids on infiltration,
erosion, and soil water quality; and 2) to examine some of the mechanisms, whereby biosolids
application affect infiltration.
Materials and Methods
Study Site
This research is being conducted in far west Texas near the town of Sierra Blanca. This is a
northern Chihuahuan Desert grassland. The climate of the region is characterized by limited
precipitation and high afternoon air temperatures in the summer. The annual precipitation is
about 31 cm with about 65 % falling in the months of July, August,-and September. The
shallowest known ground water at the study site is greater than 150 meters deep and has not been
a source for domestic use.
The physiography of the study area is typical of the northern Chihuahuan desert. The study area
is located on a large gently sloping to nearly level bolson that is bounded by igneous mountains
on the west and limestone escarpments on the north and east.
The soils at the study area are diverse. Although all the soils being studied are classified as
aridisols; texture, structure, and expression of pedogenic features are widely varied. There is
not a Natural Resource Conservation Service (NRCS; previously the Soil Conservation Service)
soil survey available at this time for either Hudspeth or adjacent Culberson counties. The
published survey for adjacent El Paso county is in geology that is strongly influenced by the Rio
Grande river unlike the locally derived alluvium of the study area. Soil series have not been
established by the NRCS for the study area and thus the soil series names cited in this work are
tentative, providing only a field name. The three soils studied have been described and classified
as: Armesa fine sandy loam, 0 to 1 percent slope (Fine-loamy, carbonatic, thermic Ustic
Haplocalcids); Chilicotal gravelly sandy loam 1 to 3 percent slope (Loamy-skeletal, mixed,
thermic Ustic Haplocalcids); and Stellar taxajunct sandy clay loam, 1 to 3 percent slope (Fine,
mixed, thermic Ustertic Haplargids).
The Armesa soil has an 11 cm thick fine sandy loam surface horizon that overlies a 33 cm thick
sandy clay loam cambic horizon. The calcic horizon at 54 cm below the surface has about 40
% by volume calcium carbonate segregations. The similar Chilicotal soil has a 12 cm thick
gravelly sandy loam surface horizon that overlies a 30 to 50 cm thick gravelly sandy loam
cambic horizon. The calcic horizon is generally at a depth greater than 50 cm. The Chilicotal
soil has a significant cover of pebble sized rock fragments that armor the soil. The Stellar soil
has a 10 cm thick non-calcarious sandy clay loam surface horizon that overlies a clay argillic
horizon. The argillic horizon has well-developed prismatic structure that parts to subangular
blocks in the upper 20 cm but becomes extremely dense below a depth of 30 cm. A calcic
horizon is also present in the Stellar soil at depths between 50 and 100 cm.
Vegetation varies with soil and each soil studied constitutes a unique range site. A Loamy range
site variant is associated with the Stellar soil. The vegetation on the Loamy site is dominated
by tobosagrass (Maria muticd) with some mesquite (Prosopis glandulosa) and lotebush
(Ziziphus obtusifolid). A Gravelly range site is associated with the Chilicotal soil. The Gravelly
4-2
image:
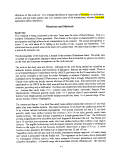 site has a sparse herbaceous cover of primarily fluffgrass (Dasyochloa pulchelld) and the
half-shrub broom snakeweed (Gutierrezia sarothrae). The dominant shrub is creosotebush
(Larrea tridentata). A Sandy Loam range site is associated with the Armesa soil. The Sandy
Loam range site has abundant herbaceous cover of black grama (Bouteloua eriopoda) and sand
dropseed (Sporobolus cryptandrus) with shrubs of longleaf mormon tea (Ephedra trifurcd) and
Yucca (Yucca data).
Rainfall Simulator
A portable single-nozzle rainfall simulator similar to the one used by N.Z. Elkins (1983), Wilcox
et al. (1986), and K.E. Spaeth (1990) was used to simulate the rainfall for the infiltration and
erosion experiment. The nozzle was placed 2 m above the surface of the plot. A nozzle pressure
of 20.7 kPa (3 psi) was maintained during simulation to produce a mean rainfall intensity on the
0.5m2 plots of 16 cm hr1 with a median drop size between 1.2 and 2 mm.
A drop with a diameter of 1.5 mm falling in still air from a height of 2 m has an impact velocity
of 4.50 m s'1 or 82 % of terminal velocity (G.D. Bubenzer, 1979). Since the water at the nozzle
orifice in this simulator is under pressure it is reasonable to assume that the impact velocity
would be greater than that reported for free falling drops.
Infiltration Measurement
Infiltration was measured on the Gravelly site during the summer of 1994. Rate of application
comprised treatments. The rates of biosolids tested were 0, 7, 34, and 90 dry Mg ha0. Each
treatment was replicated 5 times. On the Gravelly site all treatments were on bare ground
because of the paucity of vegetation.
Infiltration on the Loamy site was measured during both the winter and summer of 1994.
Treatments on the Loamy site consisted of: 1) bare and vegetated cover conditions; 2) the
biosolids rates of 0, 7, 34, and 90 dry Mg ha'1 topically-applied (Initial biosolids quality is
presented in table 1); and 3) winter and summer seasons of simulated rainfall. Each treatment
was replicated 5 times.
A square 0.5 m2 steel frame was positioned on each plot and driven into the ground, bounding
the plot edges on three sides. The fourth side of the frame, set on the lowest edge of the plot,
was flush with the soil surface and was fitted with a runoff collection pan. The runoff collection
pan was sheltered from the rain, but allowed runoff water to flow from the plot to a low corner
in the pan. The rainfall simulator was positioned on each plot and a thirty-minute rainfall was
simulated. The water used in the simulation was tap water that ultimately came from the town
of Van Horn, Texas. The runoff water that collected in the lower corner of the collection pan was
transferred through a nylon hose and suction pump to a graduated cylinder. The volume was
then recorded for each period. Runoff was recorded every 2.5 min for the first 10 min and every
5 min for the remaining 20 min. The difference in runoff and applied rainfall for each period is
the infiltration for that period.
4-3
image:
site has a sparse herbaceous cover of primarily fluffgrass (Dasyochloa pulchelld) and the
half-shrub broom snakeweed (Gutierrezia sarothrae). The dominant shrub is creosotebush
(Larrea tridentata). A Sandy Loam range site is associated with the Armesa soil. The Sandy
Loam range site has abundant herbaceous cover of black grama (Bouteloua eriopoda) and sand
dropseed (Sporobolus cryptandrus) with shrubs of longleaf mormon tea (Ephedra trifurcd) and
Yucca (Yucca data).
Rainfall Simulator
A portable single-nozzle rainfall simulator similar to the one used by N.Z. Elkins (1983), Wilcox
et al. (1986), and K.E. Spaeth (1990) was used to simulate the rainfall for the infiltration and
erosion experiment. The nozzle was placed 2 m above the surface of the plot. A nozzle pressure
of 20.7 kPa (3 psi) was maintained during simulation to produce a mean rainfall intensity on the
0.5m2 plots of 16 cm hr1 with a median drop size between 1.2 and 2 mm.
A drop with a diameter of 1.5 mm falling in still air from a height of 2 m has an impact velocity
of 4.50 m s'1 or 82 % of terminal velocity (G.D. Bubenzer, 1979). Since the water at the nozzle
orifice in this simulator is under pressure it is reasonable to assume that the impact velocity
would be greater than that reported for free falling drops.
Infiltration Measurement
Infiltration was measured on the Gravelly site during the summer of 1994. Rate of application
comprised treatments. The rates of biosolids tested were 0, 7, 34, and 90 dry Mg ha0. Each
treatment was replicated 5 times. On the Gravelly site all treatments were on bare ground
because of the paucity of vegetation.
Infiltration on the Loamy site was measured during both the winter and summer of 1994.
Treatments on the Loamy site consisted of: 1) bare and vegetated cover conditions; 2) the
biosolids rates of 0, 7, 34, and 90 dry Mg ha'1 topically-applied (Initial biosolids quality is
presented in table 1); and 3) winter and summer seasons of simulated rainfall. Each treatment
was replicated 5 times.
A square 0.5 m2 steel frame was positioned on each plot and driven into the ground, bounding
the plot edges on three sides. The fourth side of the frame, set on the lowest edge of the plot,
was flush with the soil surface and was fitted with a runoff collection pan. The runoff collection
pan was sheltered from the rain, but allowed runoff water to flow from the plot to a low corner
in the pan. The rainfall simulator was positioned on each plot and a thirty-minute rainfall was
simulated. The water used in the simulation was tap water that ultimately came from the town
of Van Horn, Texas. The runoff water that collected in the lower corner of the collection pan was
transferred through a nylon hose and suction pump to a graduated cylinder. The volume was
then recorded for each period. Runoff was recorded every 2.5 min for the first 10 min and every
5 min for the remaining 20 min. The difference in runoff and applied rainfall for each period is
the infiltration for that period.
4-3
image:
 Erosion Measurement
Erosion measurements were made on the same plots as the infiltration measurements while the
infiltration measurements were being made.
After the volume of runoff had been determined for a period the runoff water was poured into
a clean bucket. At the end of each of 3,10 min periods the runoff water that had been collected
during the period was thoroughly mixed and a 1 liter subsample was collected. The volume of
the subsample was measured and then the sample was filtered to remove the sediment. The
sediment was oven-dried at 105°F for 24 hr and weighed to determine the sediment concentration
for that period. The concentration multiplied by the volume of runoff yielded the quantity of
erosion.
Microlysimeters
Soil water quality data were collected from microlysimeters. Two contrasting soils were used
in this experiment, Armesa and Stellar. Soil water quality was measured on two occasions for
each soil. Each soil received treatments composed of five biosolids application rates. The five
biosolids application rates were 0,7,18, 34, and 90 dry Mg ha"1. This study was a completely
randomized design and each of the 5 rate treatments were replicated 5 times.
Lysimeters were constructed from polyvinyl chloride pipe (PVC) with an internal diameter of
25.4 cm. Each PVC pipe was cut into 90 cm sections, and one end was beveled or tapered so
that it could be more easily driven into the soil. Holes, were drilled on either side of the pipe
near the flat cut end so that U-hooks could be used to aid in moving the excavated lysimeter.
The lysimeters, once they had a core soil sample, weighed approximately 23 kg for the Stellar
soil and 68 kg for the Armesa soil.
The soils were prepared in the field by thoroughly wetting them to reduce resistance for inserting
the lysimeter into the soil. A backhoe was used to apply force to the lysimeters, fitted with a
plywood cover, which drove them into the ground. Lysimeters were inserted in plant
interspaces. In the Stellar soil, tubes would only penetrate approximately 30 cm, to the top of
a dense clay layer. Standing water, impounded in the lysimeter tube for approximately 2 weeks,
failed to penetrate this layer. In the Armesa soil we had no difficulty inserting the tubes a full
75 cm. The lysimeters were allowed to dry for a few days and then excavated and transported
to the laboratory where the leaching was to take place. Lysimeters were placed on plexiglass
squares, with 13, 0.64 cm perforations that were used to create a base plate for the lysimeter.
The lysimeter-plexiglass contact was caulked with silicon around the base to prevent drainage
water from escaping collection. The plexiglass fitted lysimeters sat on racks that allowed easy
access to the bottom of the lysimeter where a collection bucket was placed. Collection buckets
were constructed of plastic and would hold approximately 4000 ml of leachate. The lysimeters
were then prepared for the experiment by taping over the holes in the base plate and adding 1500
ml and 3500 ml of water to the Stellar and Armesa soils, respectively. The lysimeters were
allowed to stabilize for 24 hr before the tape was removed. This volume of water was added to
bring the soil to near field capacity.
4-4
image:
Erosion Measurement
Erosion measurements were made on the same plots as the infiltration measurements while the
infiltration measurements were being made.
After the volume of runoff had been determined for a period the runoff water was poured into
a clean bucket. At the end of each of 3,10 min periods the runoff water that had been collected
during the period was thoroughly mixed and a 1 liter subsample was collected. The volume of
the subsample was measured and then the sample was filtered to remove the sediment. The
sediment was oven-dried at 105°F for 24 hr and weighed to determine the sediment concentration
for that period. The concentration multiplied by the volume of runoff yielded the quantity of
erosion.
Microlysimeters
Soil water quality data were collected from microlysimeters. Two contrasting soils were used
in this experiment, Armesa and Stellar. Soil water quality was measured on two occasions for
each soil. Each soil received treatments composed of five biosolids application rates. The five
biosolids application rates were 0,7,18, 34, and 90 dry Mg ha"1. This study was a completely
randomized design and each of the 5 rate treatments were replicated 5 times.
Lysimeters were constructed from polyvinyl chloride pipe (PVC) with an internal diameter of
25.4 cm. Each PVC pipe was cut into 90 cm sections, and one end was beveled or tapered so
that it could be more easily driven into the soil. Holes, were drilled on either side of the pipe
near the flat cut end so that U-hooks could be used to aid in moving the excavated lysimeter.
The lysimeters, once they had a core soil sample, weighed approximately 23 kg for the Stellar
soil and 68 kg for the Armesa soil.
The soils were prepared in the field by thoroughly wetting them to reduce resistance for inserting
the lysimeter into the soil. A backhoe was used to apply force to the lysimeters, fitted with a
plywood cover, which drove them into the ground. Lysimeters were inserted in plant
interspaces. In the Stellar soil, tubes would only penetrate approximately 30 cm, to the top of
a dense clay layer. Standing water, impounded in the lysimeter tube for approximately 2 weeks,
failed to penetrate this layer. In the Armesa soil we had no difficulty inserting the tubes a full
75 cm. The lysimeters were allowed to dry for a few days and then excavated and transported
to the laboratory where the leaching was to take place. Lysimeters were placed on plexiglass
squares, with 13, 0.64 cm perforations that were used to create a base plate for the lysimeter.
The lysimeter-plexiglass contact was caulked with silicon around the base to prevent drainage
water from escaping collection. The plexiglass fitted lysimeters sat on racks that allowed easy
access to the bottom of the lysimeter where a collection bucket was placed. Collection buckets
were constructed of plastic and would hold approximately 4000 ml of leachate. The lysimeters
were then prepared for the experiment by taping over the holes in the base plate and adding 1500
ml and 3500 ml of water to the Stellar and Armesa soils, respectively. The lysimeters were
allowed to stabilize for 24 hr before the tape was removed. This volume of water was added to
bring the soil to near field capacity.
4-4
image:
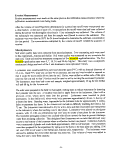 After the lysimeters had been prepared, the biosolids were weighed and placed on the soil surface
inside each lysimeter according to a randomization scheme. Quality for biosolids applied to each
soil type is given in table 2 and table 3 for both Armesa and Stellar soils, respectively.
Leaching Process and Chemical Analysis
Tap water, from the same source as used in the infiltration and erosion study, was used in all of
the wetting operations. Water was applied to the lysimeters with a sprinkler device. Using a
1000 ml plastic graduated cylinder, water was measured at 500 or 1000 ml increments and
emptied into the sprinkler. Water was then applied to the lysimeters at such a rate and at
intervals so water would not pond in the tube. Sufficient water was applied to exceed the field
capacity of the soil and to allow collection of 1.2 liters.of leachate for analysis.
From the leachate, a sample was poured into a 125 ml nalgen bottle and preserved with 6 drops
of concentrated nitric acid, while the remainder was poured into a 1 liter nalgen bottle. Both
bottles were then labeled to identify the sample. Five samples of tap water were also collected
to quantify initial water quality.
The 30 samples in the 1 liter nalgen bottles were analyzed on site with a Hach kit for
ortho-phosphates, nitrate-nitrogen, pH, sulfates, calcium hardness, total hardness, and chlorides.
Sample water tested with the Hach kit was kept relatively cool to preserve the sample and
analyzed within 24 hr. The 125 ml samples were sent to a commercial laboratory to be analyzed
for 24 elements including: silver, aluminum, arsenic, barium, beryllium, calcium, cadmium,
cobalt, copper, chromium, iron, potassium, magnesium, manganese, molybdenum, sodium,
nickel, phosphate, lead, antimony, strontium, titanium, vanadium, and zinc.
The procedures of lysimeter leaching, leachate collection, and chemical analysis were done
initially on freshly applied biosolids and once again 60 days later for the Armesa soil and 110
days later for the Stellar soil.
Results and Discussion
Infiltration and Erosion
Factors that were most important in affecting infiltration and erosion were soil type (site),
biosolids application rate, and vegetation cover condition (not necessarily in that order). The
season when rainfall was simulated was not an important factor. Due to differences in the factors
tested on each soil type, a subset of the data that provides balanced combinations of factors were
used to explore each effect.
A subset of these data that had balanced combinations of Stellar and Chilicotal soils was
selected. Only plots with a bare cover condition and that were measured in the summer of 1994
met the balanced criteria. From this data set soil-rate interactions may be explored.
Infiltration flux curves for both soil types without the addition of biosolids (Fig. 1) show very
similar curves. Infiltration flux falls sharply to a stage III infiltration of about 3.1 cm hr'1 and
1.9 cm hr'1 for Chilicotal and Stellar soils, respectively, within about 10 min from the start of
simulation. Addition of 7 Mg ha'1 of biosolids did not yield a stage III infiltration flux that was
4-5
image:
After the lysimeters had been prepared, the biosolids were weighed and placed on the soil surface
inside each lysimeter according to a randomization scheme. Quality for biosolids applied to each
soil type is given in table 2 and table 3 for both Armesa and Stellar soils, respectively.
Leaching Process and Chemical Analysis
Tap water, from the same source as used in the infiltration and erosion study, was used in all of
the wetting operations. Water was applied to the lysimeters with a sprinkler device. Using a
1000 ml plastic graduated cylinder, water was measured at 500 or 1000 ml increments and
emptied into the sprinkler. Water was then applied to the lysimeters at such a rate and at
intervals so water would not pond in the tube. Sufficient water was applied to exceed the field
capacity of the soil and to allow collection of 1.2 liters.of leachate for analysis.
From the leachate, a sample was poured into a 125 ml nalgen bottle and preserved with 6 drops
of concentrated nitric acid, while the remainder was poured into a 1 liter nalgen bottle. Both
bottles were then labeled to identify the sample. Five samples of tap water were also collected
to quantify initial water quality.
The 30 samples in the 1 liter nalgen bottles were analyzed on site with a Hach kit for
ortho-phosphates, nitrate-nitrogen, pH, sulfates, calcium hardness, total hardness, and chlorides.
Sample water tested with the Hach kit was kept relatively cool to preserve the sample and
analyzed within 24 hr. The 125 ml samples were sent to a commercial laboratory to be analyzed
for 24 elements including: silver, aluminum, arsenic, barium, beryllium, calcium, cadmium,
cobalt, copper, chromium, iron, potassium, magnesium, manganese, molybdenum, sodium,
nickel, phosphate, lead, antimony, strontium, titanium, vanadium, and zinc.
The procedures of lysimeter leaching, leachate collection, and chemical analysis were done
initially on freshly applied biosolids and once again 60 days later for the Armesa soil and 110
days later for the Stellar soil.
Results and Discussion
Infiltration and Erosion
Factors that were most important in affecting infiltration and erosion were soil type (site),
biosolids application rate, and vegetation cover condition (not necessarily in that order). The
season when rainfall was simulated was not an important factor. Due to differences in the factors
tested on each soil type, a subset of the data that provides balanced combinations of factors were
used to explore each effect.
A subset of these data that had balanced combinations of Stellar and Chilicotal soils was
selected. Only plots with a bare cover condition and that were measured in the summer of 1994
met the balanced criteria. From this data set soil-rate interactions may be explored.
Infiltration flux curves for both soil types without the addition of biosolids (Fig. 1) show very
similar curves. Infiltration flux falls sharply to a stage III infiltration of about 3.1 cm hr'1 and
1.9 cm hr'1 for Chilicotal and Stellar soils, respectively, within about 10 min from the start of
simulation. Addition of 7 Mg ha'1 of biosolids did not yield a stage III infiltration flux that was
4-5
image:
 significantly different (P > 0.05) from the unamended treatment for either soil (data not shown).
Stage III infiltration fluxes for the 7 Mg ha'1 rate were 3.6 cm hr1 and 2.5 cm hr1 for Chilicotal
and Stellar soils, respectively. Thirty-four Mg ha"1 of biosolids (Fig. 2) significantly elevated
the stage III infiltration flux above both control and 7 Mg ha'1 treatments. Stage III infiltration
flux for both soils increased by about 75 % above controls to 5.4 cm hr1 and 3.3 cm hr1 for
Chilicotal and Stellar, respectively. Stage I infiltration occurred for a short period and the period
of stage II infiltration was extended to about 15 min with 34 dry Mg ha"1 of biosolids. Stage III
infiltration flux was also significantly increased in both soils with 90 dry Mg ha'1 (Fig. 3). With
90 Mg ha'1 of biosolids stage I infiltration was almost 5 min and the stage II infiltration was over
15 min. Stellar soil yielded an increase in stage III infiltration flux over the control (1.9 cm hr1
to 5.3 cm hr1). Chilicotal soil had an even greater increase.over the control (3.1 cm hr1 to 9.2
cm hr"1).
Integrating infiltration flux curves over the 30-minute simulation period yielded terminal
cumulative infiltration (TCI). Figure 4 illustrates the effect of rate of biosolids on TCI for both
soils. The TCI for both soils was increased with application of biosolids. The 34 and 90 Mg ha'1
treatments had significantly greater TCI compared to the control and 7 Mg ha'! rates. The 90 Mg
ha'1 rate on the Chilicotal soil produced an increase of 3.4 cm over the control in the 30 min
simulated rainfall. Terminal cumulative infiltration for Chilicotal with 90 Mg ha'1 of biosolids
was two and a half times greater than the unamended Chilicotal. Recall, that with the 90 Mg ha'1
rate, stage I infiltration occurred. Therefore rainfall intensity limited infiltration flux for a period
of almost 5 min, and TCI may have been greater had the simulated rainfall been delivered at a
greater intensity.
The increase in infiltration flux achieved with the addition of biosolids and subsequent reduction
in runoff have acted in part to reduce erosion on experimental plots. The nearly level slope and
the armoring effect inherent with lag gravel on the surface reduce the potential for soil erosion
by water at this scale. In spite of low antecedent erodability on each soil, a reduction in erosion
has been observed where biosolids had been applied, more so on the Stellar soil than on the
Chilicotal (Fig. 5).
These data show how different soils responded to the application of varying rates of biosolids.
A significant question is, what mechanisms are involved in this response? Where have 3.4 cm
of water gone in the 90 dry Mg ha'1 biosolids amended Chilicotal treatment? At least some part
of this water must be absorbed in the biosolids, but measurements of absorbed water in the
biosolids following simulated rainfall is surpassingly low at just 0.4 cm. Once intermolecular
water has been removed from the biosolids it is rather difficult to rehydrate this compartment.
The absorbed water accounts for just over 10 % of the deficit. Other mechanisms are being
explored to explain the remainder; at this time, however, the response is not clearly understood.
It is widely accepted that infiltration is increased and erosion decreased by increasing grass
cover. A subset of data was used to explore the effect of vegetation cover and varied rates of
biosolids on infiltration and erosion. This subset has balanced combinations of vegetated and
bare cover treatments. Only the Stellar soil had both cover conditions.
4-6
image:
significantly different (P > 0.05) from the unamended treatment for either soil (data not shown).
Stage III infiltration fluxes for the 7 Mg ha'1 rate were 3.6 cm hr1 and 2.5 cm hr1 for Chilicotal
and Stellar soils, respectively. Thirty-four Mg ha"1 of biosolids (Fig. 2) significantly elevated
the stage III infiltration flux above both control and 7 Mg ha'1 treatments. Stage III infiltration
flux for both soils increased by about 75 % above controls to 5.4 cm hr1 and 3.3 cm hr1 for
Chilicotal and Stellar, respectively. Stage I infiltration occurred for a short period and the period
of stage II infiltration was extended to about 15 min with 34 dry Mg ha"1 of biosolids. Stage III
infiltration flux was also significantly increased in both soils with 90 dry Mg ha'1 (Fig. 3). With
90 Mg ha'1 of biosolids stage I infiltration was almost 5 min and the stage II infiltration was over
15 min. Stellar soil yielded an increase in stage III infiltration flux over the control (1.9 cm hr1
to 5.3 cm hr1). Chilicotal soil had an even greater increase.over the control (3.1 cm hr1 to 9.2
cm hr"1).
Integrating infiltration flux curves over the 30-minute simulation period yielded terminal
cumulative infiltration (TCI). Figure 4 illustrates the effect of rate of biosolids on TCI for both
soils. The TCI for both soils was increased with application of biosolids. The 34 and 90 Mg ha'1
treatments had significantly greater TCI compared to the control and 7 Mg ha'! rates. The 90 Mg
ha'1 rate on the Chilicotal soil produced an increase of 3.4 cm over the control in the 30 min
simulated rainfall. Terminal cumulative infiltration for Chilicotal with 90 Mg ha'1 of biosolids
was two and a half times greater than the unamended Chilicotal. Recall, that with the 90 Mg ha'1
rate, stage I infiltration occurred. Therefore rainfall intensity limited infiltration flux for a period
of almost 5 min, and TCI may have been greater had the simulated rainfall been delivered at a
greater intensity.
The increase in infiltration flux achieved with the addition of biosolids and subsequent reduction
in runoff have acted in part to reduce erosion on experimental plots. The nearly level slope and
the armoring effect inherent with lag gravel on the surface reduce the potential for soil erosion
by water at this scale. In spite of low antecedent erodability on each soil, a reduction in erosion
has been observed where biosolids had been applied, more so on the Stellar soil than on the
Chilicotal (Fig. 5).
These data show how different soils responded to the application of varying rates of biosolids.
A significant question is, what mechanisms are involved in this response? Where have 3.4 cm
of water gone in the 90 dry Mg ha'1 biosolids amended Chilicotal treatment? At least some part
of this water must be absorbed in the biosolids, but measurements of absorbed water in the
biosolids following simulated rainfall is surpassingly low at just 0.4 cm. Once intermolecular
water has been removed from the biosolids it is rather difficult to rehydrate this compartment.
The absorbed water accounts for just over 10 % of the deficit. Other mechanisms are being
explored to explain the remainder; at this time, however, the response is not clearly understood.
It is widely accepted that infiltration is increased and erosion decreased by increasing grass
cover. A subset of data was used to explore the effect of vegetation cover and varied rates of
biosolids on infiltration and erosion. This subset has balanced combinations of vegetated and
bare cover treatments. Only the Stellar soil had both cover conditions.
4-6
image:
 Comparing vegetation cover condition without the application of biosolids (Fig. 6), infiltration
flux responses were quite different. Vegetated treatments had a short period of stage I
infiltration. Stage II infiltration in the vegetated treatment was much longer, and terminated at
a higher infiltration flux than the bare treatment. The vegetated treatments without biosolids had
an infiltration flux curve similar to that found for bare plots amended with 90 Mg ha° of
biosolids. The similarities were limited to the general shape of the curves (i.e. period of each
infiltration stage). The infiltration flux for bare treatments with 90 Mg ha'1 terminated at 4.7 cm
hr1 which was 3.2 cm hr1 less than vegetated treatments without biosolids. In vegetated
treatments, the increase in terminal infiltration flux that resulted from the application of 90 dry
Mg ha'1 of biosolids was not as dramatic as was found in bare treatments (1.9 cm hr1 vs 3 2 cm
to"1)-
Adding 34 and 90 Mg ha'1 of biosolids to bare and vegetated treatments yielded significant
increases in TCI over the control and 7 Mg ha'1 rates (Fig. 7). In bare treatments, 90 Mg ha'1 of
biosolids yielded a significant increase in TCI over the 34 Mg ha'1 rate. The increase in TCI
gained over controls with the addition of 90 Mg ha-1 of biosolids was lower for vegetated
treatments than for bare treatments (1 cm vs. 2.3 cm).
Erosion on bare treatments was greater than vegetated treatments at all biosolids application rates
(Fig. 8). In both ground cover treatments, soil erosion decreased as biosolids rate increased. The
biosolids or vegetation cover intercept falling raindrops and absorb its energy so that detachment
of soil particles is reduced. Additionally, the reduction in runoff acts to reduce erosion.
Soil Water Quality
The day after the tubes were brought to near field capacity, biosolids were added and the Stellar
soil was leached for the first time. After applying an average of 2833 ml of water all but one
lysimeter had produced approximately 1200 ml of leachate. Water applied was equivalent to a
5.6 cm rainfall event with total infiltration. No relationship was found between column depth
and volume of water necessary to produce the leachate. However, with the fresh biosolids there
was a significant relationship (R2=0.3973; P=0.0010) between rate of applied biosolids and
volume of water needed to produce the leachate. When the biosolids were fresh they had the
ability to absorb a great deal of water. The 90 dry Mg ha'1 rate required about 1100 ml more
water to produce leachate than the control treatment.
Of all 31 constituents analyzed, 17 tests had significant differences among rates of biosolids
applied (Table 4). The 17 are Cl, total hardness, Ca hardness, Ca, Mg, Na, Sr, N03'--N, Ba, Mn,
K, Cu, Zn, SO42', pH, PO43% and Al. Many of these followed the same general trend where the
concentration of the constituent increased with increasing biosolids rate. The means for pH, Mn,
Cu, Zn, Al, PO43-, and NO3'vN did not express a consistent trend. The soil water pH ranged from
7.8 to 8.7 for all treatments, which is near the mean pH for the tap water of 8.1. Only Pb and As
exceeded EPA guidelines for drinking water at the 90 Mg ha'1 rate; and Pb was also slightly
above the criteria for the 34 Mg ha'1 rate. Tested anions were all within guidelines at all rates.
Approximately 110 days after the first leaching, the Stellar soil was again leached. The biosolids
had in the meantime dried considerably (much of the intermolecular water was removed).
4-7
image:
Comparing vegetation cover condition without the application of biosolids (Fig. 6), infiltration
flux responses were quite different. Vegetated treatments had a short period of stage I
infiltration. Stage II infiltration in the vegetated treatment was much longer, and terminated at
a higher infiltration flux than the bare treatment. The vegetated treatments without biosolids had
an infiltration flux curve similar to that found for bare plots amended with 90 Mg ha° of
biosolids. The similarities were limited to the general shape of the curves (i.e. period of each
infiltration stage). The infiltration flux for bare treatments with 90 Mg ha'1 terminated at 4.7 cm
hr1 which was 3.2 cm hr1 less than vegetated treatments without biosolids. In vegetated
treatments, the increase in terminal infiltration flux that resulted from the application of 90 dry
Mg ha'1 of biosolids was not as dramatic as was found in bare treatments (1.9 cm hr1 vs 3 2 cm
to"1)-
Adding 34 and 90 Mg ha'1 of biosolids to bare and vegetated treatments yielded significant
increases in TCI over the control and 7 Mg ha'1 rates (Fig. 7). In bare treatments, 90 Mg ha'1 of
biosolids yielded a significant increase in TCI over the 34 Mg ha'1 rate. The increase in TCI
gained over controls with the addition of 90 Mg ha-1 of biosolids was lower for vegetated
treatments than for bare treatments (1 cm vs. 2.3 cm).
Erosion on bare treatments was greater than vegetated treatments at all biosolids application rates
(Fig. 8). In both ground cover treatments, soil erosion decreased as biosolids rate increased. The
biosolids or vegetation cover intercept falling raindrops and absorb its energy so that detachment
of soil particles is reduced. Additionally, the reduction in runoff acts to reduce erosion.
Soil Water Quality
The day after the tubes were brought to near field capacity, biosolids were added and the Stellar
soil was leached for the first time. After applying an average of 2833 ml of water all but one
lysimeter had produced approximately 1200 ml of leachate. Water applied was equivalent to a
5.6 cm rainfall event with total infiltration. No relationship was found between column depth
and volume of water necessary to produce the leachate. However, with the fresh biosolids there
was a significant relationship (R2=0.3973; P=0.0010) between rate of applied biosolids and
volume of water needed to produce the leachate. When the biosolids were fresh they had the
ability to absorb a great deal of water. The 90 dry Mg ha'1 rate required about 1100 ml more
water to produce leachate than the control treatment.
Of all 31 constituents analyzed, 17 tests had significant differences among rates of biosolids
applied (Table 4). The 17 are Cl, total hardness, Ca hardness, Ca, Mg, Na, Sr, N03'--N, Ba, Mn,
K, Cu, Zn, SO42', pH, PO43% and Al. Many of these followed the same general trend where the
concentration of the constituent increased with increasing biosolids rate. The means for pH, Mn,
Cu, Zn, Al, PO43-, and NO3'vN did not express a consistent trend. The soil water pH ranged from
7.8 to 8.7 for all treatments, which is near the mean pH for the tap water of 8.1. Only Pb and As
exceeded EPA guidelines for drinking water at the 90 Mg ha'1 rate; and Pb was also slightly
above the criteria for the 34 Mg ha'1 rate. Tested anions were all within guidelines at all rates.
Approximately 110 days after the first leaching, the Stellar soil was again leached. The biosolids
had in the meantime dried considerably (much of the intermolecular water was removed).
4-7
image:
 Three-hundred ml of water was added between leaching dates to partially offset evaporation
losses.
After adding an average of 3360 ml (equivalent to total infiltration of 6.6 cm of rain) of water,
approximately 1200 ml of leachate was collected. There was no significant relationship between
either column depth or biosolids rate and volume of water necessary to produce leachate.
For this second leaching only 5 constituents had values that were significantly different among
rates (Table 5). Of these, 4 showed clear trends. Two of the anions, NO3'--N and SO42- generally
increased linearly with increased biosolids rate. Another anion, P043% as well as soil water pH
had quadratic components. The pH decreased sharply with the addition of small rates of
biosolids without much further reduction at the higher rates. The PO43- increased sharply with
small additions of biosolids without much further increase at the higher biosolids application
rates. The range for pH of the soil water in the second leaching was slightly lower than that of
the first leaching. Tested anions were all within drinking water guidelines. Lead was slightly
higher than drinking water guidelines for the 90 Mg ha'1 rate. Also, As was slightly above
guidelines for the 34 Mg ha'1 rate and Cr was slightly above at the 18 Mg ha'1 rate; interestingly,
both As and Cr were above guidelines on the control or 0 Mg ha'1 treatment as well.
There are a number of properties of the Stellar soil which help to explain these results. The
Stellar soil has strongly developed structural units which provide preferential flow paths creating
little interaction with soil colloids in ped interiors. Flow into the ped interior is rather slow in
comparison to that along ped faces. The column length of the Stellar soil was relatively short
which decreased the solutions residence time. The non-careous surface is less effective in
buffering the pH and binding metals. In the second leaching, the quality of the water may have
been better as a result of the biosolids having dried out. The water in biosolids may be
partitioned into three theoretical compartments; free water (largely removed in the dewatering
process), capillary water (held in tension by adhesive forces between water and biosolids
particles), and intermolecular water (held in the interior of biosolids organic particles). The
hysteretic intermolecular water once exhausted remained dry and water added in the leaching
process passed through the bulk fabric quite rapidly, resulting in poor biosolids to solution
exchange.
The first leaching of the Armesa soil was done after the lysimeters were prepared by bringing
them near field capacity and adding the biosolids. An average of 5720 ml of water (equivalent
to total infiltration of 11.2 cm of rainfall) was required to produce 1200 ml of leachate. There
was a significant relationship between column depth and volume of water used to produce
leachate. Rate of biosolids was not related to the volume of water need to produce leachate.
Of the 31 constituents tested only two elements Zn and Ba had significant differences among
rates of biosolids applied. Both elements generally increased with increased biosolids
application rate. The range in pH for soil water from this leaching was 8.1 to 8.8, slightly higher
than for the Stellar soil. All metal and anions were within drinking water standards.
4-8
image:
Three-hundred ml of water was added between leaching dates to partially offset evaporation
losses.
After adding an average of 3360 ml (equivalent to total infiltration of 6.6 cm of rain) of water,
approximately 1200 ml of leachate was collected. There was no significant relationship between
either column depth or biosolids rate and volume of water necessary to produce leachate.
For this second leaching only 5 constituents had values that were significantly different among
rates (Table 5). Of these, 4 showed clear trends. Two of the anions, NO3'--N and SO42- generally
increased linearly with increased biosolids rate. Another anion, P043% as well as soil water pH
had quadratic components. The pH decreased sharply with the addition of small rates of
biosolids without much further reduction at the higher rates. The PO43- increased sharply with
small additions of biosolids without much further increase at the higher biosolids application
rates. The range for pH of the soil water in the second leaching was slightly lower than that of
the first leaching. Tested anions were all within drinking water guidelines. Lead was slightly
higher than drinking water guidelines for the 90 Mg ha'1 rate. Also, As was slightly above
guidelines for the 34 Mg ha'1 rate and Cr was slightly above at the 18 Mg ha'1 rate; interestingly,
both As and Cr were above guidelines on the control or 0 Mg ha'1 treatment as well.
There are a number of properties of the Stellar soil which help to explain these results. The
Stellar soil has strongly developed structural units which provide preferential flow paths creating
little interaction with soil colloids in ped interiors. Flow into the ped interior is rather slow in
comparison to that along ped faces. The column length of the Stellar soil was relatively short
which decreased the solutions residence time. The non-careous surface is less effective in
buffering the pH and binding metals. In the second leaching, the quality of the water may have
been better as a result of the biosolids having dried out. The water in biosolids may be
partitioned into three theoretical compartments; free water (largely removed in the dewatering
process), capillary water (held in tension by adhesive forces between water and biosolids
particles), and intermolecular water (held in the interior of biosolids organic particles). The
hysteretic intermolecular water once exhausted remained dry and water added in the leaching
process passed through the bulk fabric quite rapidly, resulting in poor biosolids to solution
exchange.
The first leaching of the Armesa soil was done after the lysimeters were prepared by bringing
them near field capacity and adding the biosolids. An average of 5720 ml of water (equivalent
to total infiltration of 11.2 cm of rainfall) was required to produce 1200 ml of leachate. There
was a significant relationship between column depth and volume of water used to produce
leachate. Rate of biosolids was not related to the volume of water need to produce leachate.
Of the 31 constituents tested only two elements Zn and Ba had significant differences among
rates of biosolids applied. Both elements generally increased with increased biosolids
application rate. The range in pH for soil water from this leaching was 8.1 to 8.8, slightly higher
than for the Stellar soil. All metal and anions were within drinking water standards.
4-8
image:
 Approximately 60 days later, the Armesa soil was leached a second time. An average of 5340
ml of water was required to produce about 1200 ml of leachate. This amount of water is equal
to total infiltration of a 10.4 cm rain. Column depth was not related to the volume of water
needed to produce leachate. However, with this soil in the second leaching there was a
significant relationship (R^O.5416; P=0.0001) between rate of biosolids applied and volume of
water needed to produce leachate. The highest rate of biosolids required the least amount of
water to produce leachate. The relationship between biosolids rate and volume of water need
to produce leachate found here indicates that biosolids act as a mulch, reducing evaporation loss
from the lysimeters. This is opposite from the fresh biosolids on the Stellar soil where the high
biosolids rates actually absorbed more water. Of the 31 constituents tested, only one, Mg, had
significant differences among rates of application. The Mg concentration in the soil water
increased with increased biosolids rate. The level of Mg in soil water was 26 mg I'1 for the
control and 39.4 mg I'1 for the 90 Mg ha'1 rate. The pH values for the soil water ranged from 8.5
to 9.0. All metals tested, but one exception (18 Mg ha'1 rate for Pb) were well within drinking
water guidelines. All 4 rates of biosolids as well as the control had high nitrate concentrations.
Sulfate, although high in comparison with the other leachings was within drinking water
standards. Chloride concentrations were also within drinking water standards.
The Armesa soil had a much thicker column, and the soil structure was weaker than that of the
Stellar soil. Also, the Armesa soil was calcareous to the surface. These soil properties enhance
the Armesa soil's ability to remove dissolved constituents from the soil solution. The Armesa
soil exhibited less preferential flow, which allowed more intimate contact with soil colloids. The
Armesa soil water had a longer residence time in the soil.
Conclusion
The application of biosolids, especially at 34 and 90 dry Mg ha'1 rates, increased infiltration flux
and cumulative infiltration while decreasing erosion. The degree to which biosolids affect
infiltration and erosion depend on the site conditions (i.e. soil type and vegetation cover).
Infiltration increased more per Mg ha'1 of biosolids added on the Chilicotal soil than on the
Stellar soil, regardless of vegetation cover. In contrast, infiltration increased the least per Mg
ha'1 of biosolids added to the vegetated Stellar soil. Although the rate response attributed to
biosolids was less on the vegetated Stellar soil, both infiltration flux and cumulative infiltration
for the untreated vegetated Stellar soil were greater than treated bare treatment on either the
Stellar or Chilicotal soil, regardless of biosolids rate. Erosion was reduced more per Mg ha"1 of
biosolids added on the bare Stellar soil than on either the vegetated Stellar or bare Chilicotal soil.
Soil water quality for both Armesa and Stellar soils were within EPA drinking water standards
with 7 Mg ha'1 of biosolids. The Armesa soil had fewer constituents with significant differences
in leachate quality among the rates of applied biosolids. The Armesa soil, because it has a longer
flow path, less prominent structural units, and is calcareous to the surface, does a more thorough
job of removing dissolved constituents than the Stellar soil. Under normally expected
precipitation patterns, leachate would not be expected to reach the ground water table on the
study site, which is in excess of 150 meters. Total infiltration of 8.2 cm of precipitation over 24
4-9
image:
Approximately 60 days later, the Armesa soil was leached a second time. An average of 5340
ml of water was required to produce about 1200 ml of leachate. This amount of water is equal
to total infiltration of a 10.4 cm rain. Column depth was not related to the volume of water
needed to produce leachate. However, with this soil in the second leaching there was a
significant relationship (R^O.5416; P=0.0001) between rate of biosolids applied and volume of
water needed to produce leachate. The highest rate of biosolids required the least amount of
water to produce leachate. The relationship between biosolids rate and volume of water need
to produce leachate found here indicates that biosolids act as a mulch, reducing evaporation loss
from the lysimeters. This is opposite from the fresh biosolids on the Stellar soil where the high
biosolids rates actually absorbed more water. Of the 31 constituents tested, only one, Mg, had
significant differences among rates of application. The Mg concentration in the soil water
increased with increased biosolids rate. The level of Mg in soil water was 26 mg I'1 for the
control and 39.4 mg I'1 for the 90 Mg ha'1 rate. The pH values for the soil water ranged from 8.5
to 9.0. All metals tested, but one exception (18 Mg ha'1 rate for Pb) were well within drinking
water guidelines. All 4 rates of biosolids as well as the control had high nitrate concentrations.
Sulfate, although high in comparison with the other leachings was within drinking water
standards. Chloride concentrations were also within drinking water standards.
The Armesa soil had a much thicker column, and the soil structure was weaker than that of the
Stellar soil. Also, the Armesa soil was calcareous to the surface. These soil properties enhance
the Armesa soil's ability to remove dissolved constituents from the soil solution. The Armesa
soil exhibited less preferential flow, which allowed more intimate contact with soil colloids. The
Armesa soil water had a longer residence time in the soil.
Conclusion
The application of biosolids, especially at 34 and 90 dry Mg ha'1 rates, increased infiltration flux
and cumulative infiltration while decreasing erosion. The degree to which biosolids affect
infiltration and erosion depend on the site conditions (i.e. soil type and vegetation cover).
Infiltration increased more per Mg ha'1 of biosolids added on the Chilicotal soil than on the
Stellar soil, regardless of vegetation cover. In contrast, infiltration increased the least per Mg
ha'1 of biosolids added to the vegetated Stellar soil. Although the rate response attributed to
biosolids was less on the vegetated Stellar soil, both infiltration flux and cumulative infiltration
for the untreated vegetated Stellar soil were greater than treated bare treatment on either the
Stellar or Chilicotal soil, regardless of biosolids rate. Erosion was reduced more per Mg ha"1 of
biosolids added on the bare Stellar soil than on either the vegetated Stellar or bare Chilicotal soil.
Soil water quality for both Armesa and Stellar soils were within EPA drinking water standards
with 7 Mg ha'1 of biosolids. The Armesa soil had fewer constituents with significant differences
in leachate quality among the rates of applied biosolids. The Armesa soil, because it has a longer
flow path, less prominent structural units, and is calcareous to the surface, does a more thorough
job of removing dissolved constituents than the Stellar soil. Under normally expected
precipitation patterns, leachate would not be expected to reach the ground water table on the
study site, which is in excess of 150 meters. Total infiltration of 8.2 cm of precipitation over 24
4-9
image:
 hours (slightly more than the 10 yr return period, 24 hr storm) was required to move water
through just 75 cm of the coarser Armesa soil.
These results clearly show that topical application of biosolids has important hydrologic
consequences in desert grasslands that depend on kind of soil being treated and rate of biosolids
applied.
Acknowledgment
We would like to thank MERCO, A Joint Venture for allowing us to conduct this research on
their property and for providing much of the funding which supported this research effort.
Ronald E. Sosebee, Chairman and Professor, Dept. of Range and Wildlife Management, Texas
Tech Univ.; Ernest B. Fish, Professor, Dept. of Range and Wildlife Management, Texas Tech
Univ.; David B. Wester, Associate Professor, Dept. of Range and Wildlife Management, Texas
Tech Univ.; Richard E Zartman, Professor, Dept. of Plant and Soil Science, Texas Tech Univ.;
Cynthia M. Brenton, Graduate Research Assistant, Dept. of Range and Wildlife Management,
Texas Tech Univ.; Corey A. Moffet, Resident Soil Scientist, Dept. of Plant and Soil Science,
Texas Tech Univ. This is contribution number T-9-731, College of Agricultural Sciences and
Natural Resources, Texas Tech University. Address all correspondence to Dr. Ronald E.
Sosebee, Dept. of Range and Wildlife Management, Texas Tech Univ., Lubbock, TX 79409.
Literature cited
Aguilar, R., and S.R. Loftin. 1992. Sewage sludge application in semiarid grasslands:
Effects on runoff and surface water quality, p. 101-111. In Proc. of the 36th Annual New
Mexico Water Conf., Las Cruces, NM. 7-8 Nov. 1991. WRRI Rep. 265. New Mexico Water
Resource Res. Inst, Las Cruces.
Bubenzer, G.D. 1979. Inventory of rainfall simulators. Proc. Rainfall Simulator Workshop.
Tucson, Ariz. p. 120-130.
Elkins, N.Z. 1983. Potential mediation by desert subterranean termites in infiltration, runoff
and erosion soil loss on a desert watershed. Ph. D. diss. New Mexico State
Univ., Las Cruces.
Fresquez, P.R., R.E. Francis, and G. L. Dennis. 1990. Effects of sewage sludge on soil and
plant quality in a degraded semiarid broom snakeweed / blue grama plant
community. J. Environ. Qual. 19:324-329.
Harris-Pierce, R.L., E.F. Redente, and K.A. Barbarick. 1995. Sewage sludge application
effects on runoff water quality in a semiarid grassland. J. Environ. Qual.
24:112-115.
Soon, Y. K., T.E. Bates, and J. R. Moyer. 1980. Land application of chemically treated
sewage sludge: III. Effects on soil and plant heavy metal content. J. Environ.
Qual. 3:497-504.
4-10
image:
hours (slightly more than the 10 yr return period, 24 hr storm) was required to move water
through just 75 cm of the coarser Armesa soil.
These results clearly show that topical application of biosolids has important hydrologic
consequences in desert grasslands that depend on kind of soil being treated and rate of biosolids
applied.
Acknowledgment
We would like to thank MERCO, A Joint Venture for allowing us to conduct this research on
their property and for providing much of the funding which supported this research effort.
Ronald E. Sosebee, Chairman and Professor, Dept. of Range and Wildlife Management, Texas
Tech Univ.; Ernest B. Fish, Professor, Dept. of Range and Wildlife Management, Texas Tech
Univ.; David B. Wester, Associate Professor, Dept. of Range and Wildlife Management, Texas
Tech Univ.; Richard E Zartman, Professor, Dept. of Plant and Soil Science, Texas Tech Univ.;
Cynthia M. Brenton, Graduate Research Assistant, Dept. of Range and Wildlife Management,
Texas Tech Univ.; Corey A. Moffet, Resident Soil Scientist, Dept. of Plant and Soil Science,
Texas Tech Univ. This is contribution number T-9-731, College of Agricultural Sciences and
Natural Resources, Texas Tech University. Address all correspondence to Dr. Ronald E.
Sosebee, Dept. of Range and Wildlife Management, Texas Tech Univ., Lubbock, TX 79409.
Literature cited
Aguilar, R., and S.R. Loftin. 1992. Sewage sludge application in semiarid grasslands:
Effects on runoff and surface water quality, p. 101-111. In Proc. of the 36th Annual New
Mexico Water Conf., Las Cruces, NM. 7-8 Nov. 1991. WRRI Rep. 265. New Mexico Water
Resource Res. Inst, Las Cruces.
Bubenzer, G.D. 1979. Inventory of rainfall simulators. Proc. Rainfall Simulator Workshop.
Tucson, Ariz. p. 120-130.
Elkins, N.Z. 1983. Potential mediation by desert subterranean termites in infiltration, runoff
and erosion soil loss on a desert watershed. Ph. D. diss. New Mexico State
Univ., Las Cruces.
Fresquez, P.R., R.E. Francis, and G. L. Dennis. 1990. Effects of sewage sludge on soil and
plant quality in a degraded semiarid broom snakeweed / blue grama plant
community. J. Environ. Qual. 19:324-329.
Harris-Pierce, R.L., E.F. Redente, and K.A. Barbarick. 1995. Sewage sludge application
effects on runoff water quality in a semiarid grassland. J. Environ. Qual.
24:112-115.
Soon, Y. K., T.E. Bates, and J. R. Moyer. 1980. Land application of chemically treated
sewage sludge: III. Effects on soil and plant heavy metal content. J. Environ.
Qual. 3:497-504.
4-10
image:
 Spaeth, K.E. 1990. Hydrologic and ecological assessment of a discrete range site on the
southern High Plains. Ph. D. diss. Texas Tech Univ., Lubbock.
Wilcox, B.P., M.K. Wood, T.T. Tromble, and T.J. Ward. 1986. A hand-protable single
nozzle rainfall simulator designed for use on steep slopes. J. Range Manage.
39:375-377.
Tables and Figures
Table 1. Initial quality for biosolids applied to infiltration and erosion study.
Table 2. Initial quality for biosolids applied to Armesa soil in the. soil water quality study.
Table 3. Initial quality for biosolids applied to Stellar soil in the soil water quality study.
Table 4. Leachate constituent means among rates of topically-applied biosolids for the first
leaching of the Stellar soil. Within-constituent means followed by the same letter
are not significantly different (P > 0.05).
Table 5. Leachate constituent means among rates of topically-applied biosolids for the
second leaching of the Stellar soil. Within-constituent means followed by the
same letter are not significantly different (P > 0.05).
Fig. 1. Infiltration flux curves for two bare soils without biosolids application. Within-soil
means with same letter are not significantly different (P > 0.05).
Fig. 2. Infiltration flux curves for two bare soils with 34 dry Mg ha'1 of topically-applied
biosolids. Within-soil means with same letter are not significantly different (P >
0.05).
Fig. 3. Infiltration flux curves for two bare soils with 90 dry Mg ha'1 of topically-applied
biosolids. Within-soil means with same letter are not significantly different (P >
0.05).
Fig. 4. Cumulative infiltration for a thirty-minute simulated rainfall for two soil types with
four rates of topically-applied biosolids. Within-soil means with same letter are
not significantly different (P > 0.05).
Fig. 5. Cumulative erosion for a thirty-minute simulated rainfall for two soil types with 4
rates of topically-applied biosolids.
Fig. 6. Infiltration flux curves for two of vegetation cover conditions on a Stellar soil without
biosolids application. Within-cover condition means with same letter are not
significantly different (P > 0.05).
Fig. 7. Cumulative infiltration for a thirty-minute simulated rainfall for two vegetation cover
conditions with four rates of topically-applied biosolids. Within-cover condition
means with same letter are not significantly different (P > 0.05).
Fig. 8. Cumulative erosion for a thirty-minute simulated rainfall for two vegetation cover
conditions on a Stellar soil with four rates of topically-applied biosolids.
4-11
image:
Spaeth, K.E. 1990. Hydrologic and ecological assessment of a discrete range site on the
southern High Plains. Ph. D. diss. Texas Tech Univ., Lubbock.
Wilcox, B.P., M.K. Wood, T.T. Tromble, and T.J. Ward. 1986. A hand-protable single
nozzle rainfall simulator designed for use on steep slopes. J. Range Manage.
39:375-377.
Tables and Figures
Table 1. Initial quality for biosolids applied to infiltration and erosion study.
Table 2. Initial quality for biosolids applied to Armesa soil in the. soil water quality study.
Table 3. Initial quality for biosolids applied to Stellar soil in the soil water quality study.
Table 4. Leachate constituent means among rates of topically-applied biosolids for the first
leaching of the Stellar soil. Within-constituent means followed by the same letter
are not significantly different (P > 0.05).
Table 5. Leachate constituent means among rates of topically-applied biosolids for the
second leaching of the Stellar soil. Within-constituent means followed by the
same letter are not significantly different (P > 0.05).
Fig. 1. Infiltration flux curves for two bare soils without biosolids application. Within-soil
means with same letter are not significantly different (P > 0.05).
Fig. 2. Infiltration flux curves for two bare soils with 34 dry Mg ha'1 of topically-applied
biosolids. Within-soil means with same letter are not significantly different (P >
0.05).
Fig. 3. Infiltration flux curves for two bare soils with 90 dry Mg ha'1 of topically-applied
biosolids. Within-soil means with same letter are not significantly different (P >
0.05).
Fig. 4. Cumulative infiltration for a thirty-minute simulated rainfall for two soil types with
four rates of topically-applied biosolids. Within-soil means with same letter are
not significantly different (P > 0.05).
Fig. 5. Cumulative erosion for a thirty-minute simulated rainfall for two soil types with 4
rates of topically-applied biosolids.
Fig. 6. Infiltration flux curves for two of vegetation cover conditions on a Stellar soil without
biosolids application. Within-cover condition means with same letter are not
significantly different (P > 0.05).
Fig. 7. Cumulative infiltration for a thirty-minute simulated rainfall for two vegetation cover
conditions with four rates of topically-applied biosolids. Within-cover condition
means with same letter are not significantly different (P > 0.05).
Fig. 8. Cumulative erosion for a thirty-minute simulated rainfall for two vegetation cover
conditions on a Stellar soil with four rates of topically-applied biosolids.
4-11
image:
 Table 2.
Constituent
Total Kjeldahl Nitrogen
Iron
Calcium
Phosphorus
Aluminum
Magnesium
Manganese
Potassium
Zinc
Copper
Lead
Nickel
Boron
Cadmium
unit
gkg-1
gkg1
gkg-1
gkg-1
gkg-1
gkg-1
gkg-1
gkg'1
mg kg'1
trig kg'1
mg kg'1
mg kg'1
mg kg'1
mg kg'1
Mean
34.7
20.5
19.3
15.8
9.00
6.64
1.25
1.02
887
872
236
46.8
40.4
9.04
Table 1.
Constituent
Total Kjeldahl Nitrogen
Iron
Phosphorus
Calcium
Aluminum
Magnesium
Potassium
Zinc
Copper
Manganese
Lead
Boron
Nickel
Cadmium
unit
gkg-1
gkg-1
gkg-1
gkg-1
gkg-1
gkg-1
gkg-1
gkg-1
gkg-1
mg kg"1
mg kg-1
mg kg"1
mg kg'1
mg kg'1
Mean
40.4
25.8
21.0
20.6
9.76
6.57
3.08
1.11
1.01
605
249
43.0
36.0
23.8
image:
Table 2.
Constituent
Total Kjeldahl Nitrogen
Iron
Calcium
Phosphorus
Aluminum
Magnesium
Manganese
Potassium
Zinc
Copper
Lead
Nickel
Boron
Cadmium
unit
gkg-1
gkg1
gkg-1
gkg-1
gkg-1
gkg-1
gkg-1
gkg'1
mg kg'1
trig kg'1
mg kg'1
mg kg'1
mg kg'1
mg kg'1
Mean
34.7
20.5
19.3
15.8
9.00
6.64
1.25
1.02
887
872
236
46.8
40.4
9.04
Table 1.
Constituent
Total Kjeldahl Nitrogen
Iron
Phosphorus
Calcium
Aluminum
Magnesium
Potassium
Zinc
Copper
Manganese
Lead
Boron
Nickel
Cadmium
unit
gkg-1
gkg-1
gkg-1
gkg-1
gkg-1
gkg-1
gkg-1
gkg-1
gkg-1
mg kg"1
mg kg-1
mg kg"1
mg kg'1
mg kg'1
Mean
40.4
25.8
21.0
20.6
9.76
6.57
3.08
1.11
1.01
605
249
43.0
36.0
23.8
image:
 Table 3.
Constituent
Total Kjeldahl Nitrogen
Iron
Calcium
Phosphorus
Magnesium
Aluminum
Manganese
Zinc
Potassium
Copper
Boron
Nickel
Lead
Cadmium
unit
gkg-1
gkg'1
gkg'1
gkg-1
gkg-1
gkg1
gkg1
gkg-1
gkg-1
mg kg'1
mg kg-1
mg kg'1
mg kg'1
mg kg'1
Mean
37.4
28.54
23.2
20.1
9.02
7.84
1.25
1.19
1.02
430
37.2
12.1
3.86
3.39
image:
Table 3.
Constituent
Total Kjeldahl Nitrogen
Iron
Calcium
Phosphorus
Magnesium
Aluminum
Manganese
Zinc
Potassium
Copper
Boron
Nickel
Lead
Cadmium
unit
gkg-1
gkg'1
gkg'1
gkg-1
gkg-1
gkg1
gkg1
gkg-1
gkg-1
mg kg'1
mg kg-1
mg kg'1
mg kg'1
mg kg'1
Mean
37.4
28.54
23.2
20.1
9.02
7.84
1.25
1.19
1.02
430
37.2
12.1
3.86
3.39
image:
 Table 4.
Constituent
Cl
T-Hardness*
Ca-Hardness
NCV'-N
S042'
pH
P043'
Ca
Mg
Na
Sr
Ba
Mn
K
Cu
Zn
Al
unit
mgl'1
mgl-1
mgl-1
mgl-1
mgl-1
—
mgl-1
mgl-1
mgl-1
mgl-1
mgl-1
rngl'1
mgl-1
mgl'1
mgl-1
mgl-1
mgl-1
0 Mg ha'1
27.9
92.0
66.2
1.94
66.0
7.99
0.77
27.8
8.38
155
0.30
0.098
0.314
5
0.009
0.058
4.00
d
c
c
a
c
c
c
c
c
c
c
b
a
c
c
c
a
7Mg
34.6
95.5
55.5
1.00
73.8
8.29
1.30
26.5
8.40
175
0.31
0.095
0.172
5
0.022
0.143
2.25
ha"1
cd
c
c
b
b
ab
ab
c
c
b
c
b
a
c
ab
a
abc
ISMgha'1
40.3
93.9
64.4
0.52
76.0
8.47
1.35
27.2
9.22
200
0.32
0.094
0.200
7
0.032
0.118
3.40
be
c
c
be
b
a
a
c
c
b
c
b
a
be
ab
ab
ab
34 Mg ha'1
44.6
125.6
91.6
0.38
88.0
8.19
1.40
- 38.0
11.40
186
0.44
0.100
0.192
11
0.040
0.132
1.80
b
b
b
c
b
be
a
b
b
b
b
b
a
ab
a
ab
be
90Mgha'1
64.1
213.5
157.6
0.56
123.0
a
a
a
b
a
8. 20 be
0.84
59.4
19.70
272
0.78
0.200
0.050
15
0.018
0.078
0.92
be
a
a
a
a
a
b
a
be
be
c
* T-Hardness is Total-Hardness
TableS.
Constituent
S042-
NCV'-N
pH
P043-
V
unit
mgl-1
mgl-1
—
mgl-1
mgl-1
OMgha'1
95 .Od
1.42b
8.23 a
0.304 c
0.056 a
7 Mg ha1
120.4 c
4.39 b
8.04 b
0.880 b
0.042 b
ISMgha'1
125.4 be
3.96 b
7.97 b
1.074 b
0.052 ab
34 Mg ha '
137. 2 ab
3.63 b
7.95 b
1.284ab
0.040 b
90 Mg ha"1
148.6 a
19.17 a
7.97 b
1.580 a
0.040 b
image:
Table 4.
Constituent
Cl
T-Hardness*
Ca-Hardness
NCV'-N
S042'
pH
P043'
Ca
Mg
Na
Sr
Ba
Mn
K
Cu
Zn
Al
unit
mgl'1
mgl-1
mgl-1
mgl-1
mgl-1
—
mgl-1
mgl-1
mgl-1
mgl-1
mgl-1
rngl'1
mgl-1
mgl'1
mgl-1
mgl-1
mgl-1
0 Mg ha'1
27.9
92.0
66.2
1.94
66.0
7.99
0.77
27.8
8.38
155
0.30
0.098
0.314
5
0.009
0.058
4.00
d
c
c
a
c
c
c
c
c
c
c
b
a
c
c
c
a
7Mg
34.6
95.5
55.5
1.00
73.8
8.29
1.30
26.5
8.40
175
0.31
0.095
0.172
5
0.022
0.143
2.25
ha"1
cd
c
c
b
b
ab
ab
c
c
b
c
b
a
c
ab
a
abc
ISMgha'1
40.3
93.9
64.4
0.52
76.0
8.47
1.35
27.2
9.22
200
0.32
0.094
0.200
7
0.032
0.118
3.40
be
c
c
be
b
a
a
c
c
b
c
b
a
be
ab
ab
ab
34 Mg ha'1
44.6
125.6
91.6
0.38
88.0
8.19
1.40
- 38.0
11.40
186
0.44
0.100
0.192
11
0.040
0.132
1.80
b
b
b
c
b
be
a
b
b
b
b
b
a
ab
a
ab
be
90Mgha'1
64.1
213.5
157.6
0.56
123.0
a
a
a
b
a
8. 20 be
0.84
59.4
19.70
272
0.78
0.200
0.050
15
0.018
0.078
0.92
be
a
a
a
a
a
b
a
be
be
c
* T-Hardness is Total-Hardness
TableS.
Constituent
S042-
NCV'-N
pH
P043-
V
unit
mgl-1
mgl-1
—
mgl-1
mgl-1
OMgha'1
95 .Od
1.42b
8.23 a
0.304 c
0.056 a
7 Mg ha1
120.4 c
4.39 b
8.04 b
0.880 b
0.042 b
ISMgha'1
125.4 be
3.96 b
7.97 b
1.074 b
0.052 ab
34 Mg ha '
137. 2 ab
3.63 b
7.95 b
1.284ab
0.040 b
90 Mg ha"1
148.6 a
19.17 a
7.97 b
1.580 a
0.040 b
image:
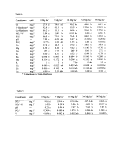 Infiltration Flux vs. Time
for two soils, without biosolids
Fig.1
15 -
x 10
uZ
g
1
i^
- 5
Chilicotal Stellar
0
15
Time (min.)
FIG, 1
image:
Infiltration Flux vs. Time
for two soils, without biosolids
Fig.1
15 -
x 10
uZ
g
1
i^
- 5
Chilicotal Stellar
0
15
Time (min.)
FIG, 1
image:
 Fig .2
Infiltration Flux vs. Time
for two soils, with 34 Mg/ha of biosolids
15
Chilicotal Stellar
o
x'lO
g
^ 5
0
0
10
15
Time (min.)
20
25
30
FIG, 2
image:
Fig .2
Infiltration Flux vs. Time
for two soils, with 34 Mg/ha of biosolids
15
Chilicotal Stellar
o
x'lO
g
^ 5
0
0
10
15
Time (min.)
20
25
30
FIG, 2
image:
 Fig.3
Infiltration Flux vs. Time
for two soils, with 90 Mg/ha of biosolids
15
o^
x'lO
c
g
'.«-'
2
•4-»
«=
^ 5
Chilicotal Stellar
0
10
15
Time (min.)
25
30
FIG, 3
image:
Fig.3
Infiltration Flux vs. Time
for two soils, with 90 Mg/ha of biosolids
15
o^
x'lO
c
g
'.«-'
2
•4-»
«=
^ 5
Chilicotal Stellar
0
10
15
Time (min.)
25
30
FIG, 3
image:
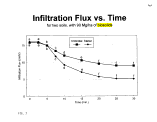 Fig.4
Terminal Cumulative Infiltration
vs. Rate
6
0
15
for two soils
Chilicotal Stellar
30
45
Rate (Mg/ha)
60
75
image:
Fig.4
Terminal Cumulative Infiltration
vs. Rate
6
0
15
for two soils
Chilicotal Stellar
30
45
Rate (Mg/ha)
60
75
image:
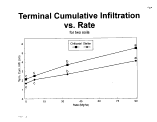 Fig.5
Terminal Cumulative Erosion vs
Rate
15
0
for two soils
Chilicotal Stellar
45
Rate (Mg/ha)
FIG, 5
image:
Fig.5
Terminal Cumulative Erosion vs
Rate
15
0
for two soils
Chilicotal Stellar
45
Rate (Mg/ha)
FIG, 5
image:
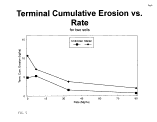 Infiltration Flux vs. Time
for two cover conditions, without biosolids
Fig.6
15
o
x'lO
LL
«=
^ 5
ab
Bare Vegetated
0
10
15
Time (min.)
20
25
30
FIG, 6
image:
Infiltration Flux vs. Time
for two cover conditions, without biosolids
Fig.6
15
o
x'lO
LL
«=
^ 5
ab
Bare Vegetated
0
10
15
Time (min.)
20
25
30
FIG, 6
image:
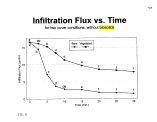 Fig.7
Terminal Cumulative Infiltration
vs. Rate
for two cover conditions
o
0
15
Bare Vegetated
1 '
30
45
Rate (Mg/ha)
60
75
90
FIG, 7
image:
Fig.7
Terminal Cumulative Infiltration
vs. Rate
for two cover conditions
o
0
15
Bare Vegetated
1 '
30
45
Rate (Mg/ha)
60
75
90
FIG, 7
image:
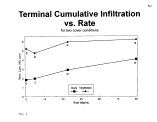 Fig.8
Terminal Cumulative Erosion vs.
Rate
15
OJ
(O
2
LU
E
is
O
E 5
0
FIG, 3
15
for two cover conditions
Bare Vegetated
30
45
Rate (Mg/ha)
60
75
90
image:
Fig.8
Terminal Cumulative Erosion vs.
Rate
15
OJ
(O
2
LU
E
is
O
E 5
0
FIG, 3
15
for two cover conditions
Bare Vegetated
30
45
Rate (Mg/ha)
60
75
90
image:
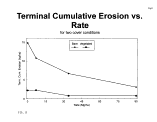 o
'55
w
<u
CO
image:
o
'55
w
<u
CO
image:
 image:
 MONITORING AIRBORNE MICROBIAL PATHOGENS AND INDICATORS
Suresh D. Pillai
Environmental Science Program, Texas A&M Univ. Research Center, El Paso,
Texas 79927. Tel (915) 859-9111.
ABSTRACT
Land disposal of sewage sludges is a common practice throughout the
United States and in several regions of the world. In areas where sludge
application is close to human habitation, there is potential for exposure to
airborne microbial pathogens. A four month study was conducted in Texas to
determine the impacts of the sludge application on the microbial air quality at
different locations around the application site. None of the sites showed the
presence of specific microbial pathogens though, indicator organisms such as
Clostridium spp., and hydrogen sulfide producing organisms were detected at
one location (hopper loading) where there was significant physical agitation of
the sludge material. Preliminary DNA fingerprinting analysis however, does not
indicate that the airborne clostridia originated from the sludge material. The
overall results indicate that the current rangeland sludge application program
does not adversely impact the microbial air quality at the rangeland-population
interface.
INTRODUCTION '
Municipal sewage sludges or, what are currently referred to as
"biosolids" are routinely utilized on agricultural lands in various parts of the
world. Presently, in the United States, as much as 33% of the domestic sewage
sludge production is reportedly being applied on agricultural lands. With the ban
on sludge dumping in the oceans and the increasing restrictions on land fills,
disposal onto land surfaces (for beneficial reuse) becomes almost the only
alternative, and is expected to increase in the coming years. As part of an
interim disposal practice, New York City currently transports dewatered
anaerobically digested municipal sewage sludge to a Far West Texas location
where it is mechanically applied as a semi solid "cake" form on arid rangelands
at an annual rate of 3 dry tons per acre.
One of the hazards associated with sewage sludges are pathogenic
microorganisms. Though there have been many studies on the survival of
pathogenic microbial populations in agricultural lands and aquatic systems
exposed to sewage sludges, there is little information on the possible airborne
transmission of microbial pathogens during land application of sludge material.
Most of the currently available airborne microbial data are based on aerosol
studies conducted near waste water treatment plants and at effluent spray
image:
MONITORING AIRBORNE MICROBIAL PATHOGENS AND INDICATORS
Suresh D. Pillai
Environmental Science Program, Texas A&M Univ. Research Center, El Paso,
Texas 79927. Tel (915) 859-9111.
ABSTRACT
Land disposal of sewage sludges is a common practice throughout the
United States and in several regions of the world. In areas where sludge
application is close to human habitation, there is potential for exposure to
airborne microbial pathogens. A four month study was conducted in Texas to
determine the impacts of the sludge application on the microbial air quality at
different locations around the application site. None of the sites showed the
presence of specific microbial pathogens though, indicator organisms such as
Clostridium spp., and hydrogen sulfide producing organisms were detected at
one location (hopper loading) where there was significant physical agitation of
the sludge material. Preliminary DNA fingerprinting analysis however, does not
indicate that the airborne clostridia originated from the sludge material. The
overall results indicate that the current rangeland sludge application program
does not adversely impact the microbial air quality at the rangeland-population
interface.
INTRODUCTION '
Municipal sewage sludges or, what are currently referred to as
"biosolids" are routinely utilized on agricultural lands in various parts of the
world. Presently, in the United States, as much as 33% of the domestic sewage
sludge production is reportedly being applied on agricultural lands. With the ban
on sludge dumping in the oceans and the increasing restrictions on land fills,
disposal onto land surfaces (for beneficial reuse) becomes almost the only
alternative, and is expected to increase in the coming years. As part of an
interim disposal practice, New York City currently transports dewatered
anaerobically digested municipal sewage sludge to a Far West Texas location
where it is mechanically applied as a semi solid "cake" form on arid rangelands
at an annual rate of 3 dry tons per acre.
One of the hazards associated with sewage sludges are pathogenic
microorganisms. Though there have been many studies on the survival of
pathogenic microbial populations in agricultural lands and aquatic systems
exposed to sewage sludges, there is little information on the possible airborne
transmission of microbial pathogens during land application of sludge material.
Most of the currently available airborne microbial data are based on aerosol
studies conducted near waste water treatment plants and at effluent spray
image:
 irrigation sites. To estimate the potential public health risks associated with land
application of sewage sludges, it is critical that information be available on the
extent of airborne microbial pathogens.The sludge application program in Far
West Texas is intended to restore depleted rangelands for cattle grazing while at
the same time, serving as a means of safe disposal. Since this rangeland is
located in an arid wind swept region, the potential for airborne microbial
pathogens during sludge application could be considered high. Primarily, there
are concerns of airborne transmission of microbial pathogens to the neighboring
town of Sierra Blanca (pop: 800) located 4 miles to the closest sludge
application site.
A four month study was conducted during. August-November, 1994 to
determine the levels of airborne microbial pathogens and indicator species
during sludge application. The primary objectives of the study were to
characterize the airborne microbial populations in the vicinity of sludge
application, and also determine if sludge derived microbial pathogens were
detectable at the rangeland-population interface.
MATERIALS AND METHODS
Site Description: The Sierra Blanca Ranch in Far West Texas is in the
Chihuahuan Desert and is characterized by limited precipitation, high intensity
thunderstorms, high evaporation rates, high summer air temperatures, high wind
velocities and low relative humidities. The ranch occupies approximately
180,000 acres of which only 18,000 acres is currently being used for sludge
application. The town of Sierra Bianca is 4 miles to the closest sludge
application site. Wind velocities on the ranch rarely exceed 20 mph (average
around 5 mph) though occasional gusts of upto 40 mph are reported during the
Spring season. The primary direction from which the wind blows is bimodal,
blowing from southerly and northwest directions. Sludge application takes place
primarily on gravelly and variant loamy sites which have tobosagrass, desert
holly and mesquite as some of the primary vegetation cover.
Sampling Locations: Five sampling locations were chosen viz., the
"Background" (representing sites upwind of the sludge application areas), the
"Interface" (representing the interface between the sludge application area and
the population center at Sierra Blanca), the "Old Application" locations
(representing areas where sludge had been applied 12 months previously), the
"Sludge Application" areas (representing locations directly within areas under
current sludge application) and the "Hopper Loading" sites where mechanized
sludge applicators (hoppers) are loaded with sludge using front end loaders. The
"Hopper Loading" sites served as a location where maximal physical disturbance
of sludge material and soil occurred and therefore had the maximum potential for
airborne microorganisms.
image:
irrigation sites. To estimate the potential public health risks associated with land
application of sewage sludges, it is critical that information be available on the
extent of airborne microbial pathogens.The sludge application program in Far
West Texas is intended to restore depleted rangelands for cattle grazing while at
the same time, serving as a means of safe disposal. Since this rangeland is
located in an arid wind swept region, the potential for airborne microbial
pathogens during sludge application could be considered high. Primarily, there
are concerns of airborne transmission of microbial pathogens to the neighboring
town of Sierra Blanca (pop: 800) located 4 miles to the closest sludge
application site.
A four month study was conducted during. August-November, 1994 to
determine the levels of airborne microbial pathogens and indicator species
during sludge application. The primary objectives of the study were to
characterize the airborne microbial populations in the vicinity of sludge
application, and also determine if sludge derived microbial pathogens were
detectable at the rangeland-population interface.
MATERIALS AND METHODS
Site Description: The Sierra Blanca Ranch in Far West Texas is in the
Chihuahuan Desert and is characterized by limited precipitation, high intensity
thunderstorms, high evaporation rates, high summer air temperatures, high wind
velocities and low relative humidities. The ranch occupies approximately
180,000 acres of which only 18,000 acres is currently being used for sludge
application. The town of Sierra Bianca is 4 miles to the closest sludge
application site. Wind velocities on the ranch rarely exceed 20 mph (average
around 5 mph) though occasional gusts of upto 40 mph are reported during the
Spring season. The primary direction from which the wind blows is bimodal,
blowing from southerly and northwest directions. Sludge application takes place
primarily on gravelly and variant loamy sites which have tobosagrass, desert
holly and mesquite as some of the primary vegetation cover.
Sampling Locations: Five sampling locations were chosen viz., the
"Background" (representing sites upwind of the sludge application areas), the
"Interface" (representing the interface between the sludge application area and
the population center at Sierra Blanca), the "Old Application" locations
(representing areas where sludge had been applied 12 months previously), the
"Sludge Application" areas (representing locations directly within areas under
current sludge application) and the "Hopper Loading" sites where mechanized
sludge applicators (hoppers) are loaded with sludge using front end loaders. The
"Hopper Loading" sites served as a location where maximal physical disturbance
of sludge material and soil occurred and therefore had the maximum potential for
airborne microorganisms.
image:
 Sampling :The AGI-30 all glass impinger (Ace Glass, Vine, N. J.) was utilized tor
the sampling and the air samples were concentrated in 20 ml of 0.1 % peptone.
Peptone was used to aid in resuscitating potentially injured organisms.
Impingement rather than impaction was employed for air sampling, because it
provided protection against microbial injury during sampling and subsequent
transportation to the laboratory. A total of 15 independent sampling trips were
made during the course of the study. A minimum of two independent samplings
were conducted at each location and five replicate air samples were collected (at
each sampling) using sterile impingers. Each impinger was operated for 20 mm
at a flow rate of 12L/min using at Dwyer VFB series (Dwyer Instruments, Ml) flow
meter The samplers were always positioned downwind, five feet above the
ground which correspond to the average breathing height of ah Individual.
Microbiological Analyses: The 20 ml samples were initially concentrated in the
laboratory to 5 ml using Centriprep-50 concentrators (Amicon, Beverly, MA) by a
two-step centrifugation procedure (1000 g for 5 min and 1000 g for 1 mm).
Aliquots of the concentrated sample were analyzed for the following specific
microbial pathogens and indicator populations:
• Aerobic heterotrophs
• Fecal conforms, Fecal streptococci and Salmonella spp.
• Hydrogen sulfide producers: [Hydrogen sulfide producing bacteria
(Salmonella, Citrobacter, Clostridium, Proteus, Edwardsiella and some
Klebsiella species) have been shown to be associated with the presence of
fecal material]
• Pathogenic Clostridium spp.: Since clostridial spores are present in sewage
sludges in numbers several orders of magnitude greater than those in soils,
and serve as a relatively better indicator for fecal contamination than
conforms, pathogenic Clostridium spp. were also enumerated.
• Coliphages: The soft agar overlay and the colorimetric methods were
employed to detect the presence of male specific (F+) phages and the
somatic phages.
Ribotyping of Clostridium isolates: To determine whether the clostridial
isolates (obtained from the air samples) were genetically related to those from
the sewage sludge material, selected clostridial isolates were nbotyped using
PCR primers specific to the 16S-23S interspacer region of eubacteria. For
ribotyping, the primer pair (TTGTACACACCGCCCGTC and
CCTTTCCCTCACGGTACTG) were employed in PCR amplifications using the
following reaction conditions: 95°C-1 min; 55°C-1min; 70°C-3 min. The reaction
products were separated on a 2% submarine NuSieve agarose gel.
RESULTS AND DISCUSSION
Aerobic heterotrophic populations: Airborne heterotrophic bacterial
populations ranging from a minimum of 64 CFU/m3 at the "Background location
image:
Sampling :The AGI-30 all glass impinger (Ace Glass, Vine, N. J.) was utilized tor
the sampling and the air samples were concentrated in 20 ml of 0.1 % peptone.
Peptone was used to aid in resuscitating potentially injured organisms.
Impingement rather than impaction was employed for air sampling, because it
provided protection against microbial injury during sampling and subsequent
transportation to the laboratory. A total of 15 independent sampling trips were
made during the course of the study. A minimum of two independent samplings
were conducted at each location and five replicate air samples were collected (at
each sampling) using sterile impingers. Each impinger was operated for 20 mm
at a flow rate of 12L/min using at Dwyer VFB series (Dwyer Instruments, Ml) flow
meter The samplers were always positioned downwind, five feet above the
ground which correspond to the average breathing height of ah Individual.
Microbiological Analyses: The 20 ml samples were initially concentrated in the
laboratory to 5 ml using Centriprep-50 concentrators (Amicon, Beverly, MA) by a
two-step centrifugation procedure (1000 g for 5 min and 1000 g for 1 mm).
Aliquots of the concentrated sample were analyzed for the following specific
microbial pathogens and indicator populations:
• Aerobic heterotrophs
• Fecal conforms, Fecal streptococci and Salmonella spp.
• Hydrogen sulfide producers: [Hydrogen sulfide producing bacteria
(Salmonella, Citrobacter, Clostridium, Proteus, Edwardsiella and some
Klebsiella species) have been shown to be associated with the presence of
fecal material]
• Pathogenic Clostridium spp.: Since clostridial spores are present in sewage
sludges in numbers several orders of magnitude greater than those in soils,
and serve as a relatively better indicator for fecal contamination than
conforms, pathogenic Clostridium spp. were also enumerated.
• Coliphages: The soft agar overlay and the colorimetric methods were
employed to detect the presence of male specific (F+) phages and the
somatic phages.
Ribotyping of Clostridium isolates: To determine whether the clostridial
isolates (obtained from the air samples) were genetically related to those from
the sewage sludge material, selected clostridial isolates were nbotyped using
PCR primers specific to the 16S-23S interspacer region of eubacteria. For
ribotyping, the primer pair (TTGTACACACCGCCCGTC and
CCTTTCCCTCACGGTACTG) were employed in PCR amplifications using the
following reaction conditions: 95°C-1 min; 55°C-1min; 70°C-3 min. The reaction
products were separated on a 2% submarine NuSieve agarose gel.
RESULTS AND DISCUSSION
Aerobic heterotrophic populations: Airborne heterotrophic bacterial
populations ranging from a minimum of 64 CFU/m3 at the "Background location
image:
 <o a maximum of 3 071 ,429 CFU/m3 (at the "Hopper Loading" site) of air were
recovered from the various locations (Table 1). There was however a s.gmficant
SIS/ in numbers of airborne bacteria! populations even at a single site on
dffferen dLvs The "Hopper Loading" site exhibited the highest number with
tons Lragtng around 300,000 CFU/m3 , while the -'Background" site had
3
, ,
i of 90,000 CFU/m3 (Fig 1,Fig.2 & Fig. 3). The increased
the "Hopper Loading" site could be attributed to the result of
Hopper Loading" site) was performed approximately 15 to 30 m
Ssssssssssssss^
materiaUunder similar weather conditions) during these operates.
dT^
during ttefour sampling dates at the 'Hopper Loading' ste were
occasions (Fig.4).
These airborne heterotrophic bacterial levels are significantly Skater than
L
image:
<o a maximum of 3 071 ,429 CFU/m3 (at the "Hopper Loading" site) of air were
recovered from the various locations (Table 1). There was however a s.gmficant
SIS/ in numbers of airborne bacteria! populations even at a single site on
dffferen dLvs The "Hopper Loading" site exhibited the highest number with
tons Lragtng around 300,000 CFU/m3 , while the -'Background" site had
3
, ,
i of 90,000 CFU/m3 (Fig 1,Fig.2 & Fig. 3). The increased
the "Hopper Loading" site could be attributed to the result of
Hopper Loading" site) was performed approximately 15 to 30 m
Ssssssssssssss^
materiaUunder similar weather conditions) during these operates.
dT^
during ttefour sampling dates at the 'Hopper Loading' ste were
occasions (Fig.4).
These airborne heterotrophic bacterial levels are significantly Skater than
L
image:
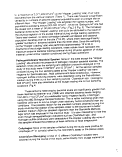 the Hopper Loading site) and four isolates from the air samples collected on
9/15/94 and 10/6/94. No attempt was made to biochemically characterize these
isolates Rather, they were ribotyped to determine whether they were genetically
related to those isolates obtained from the sludge samples. Fig.5 is the ribotype
pattern obtained of the clostridial isolates obtained on the various days. As can
be seen from the ribotype pattern, the isolates from the air samples (Lanes
G H IJ) show a different pattern from those from the sludge material (Lanes B,C,
D' E and F) indicating that they are genetically distinct, suggesting that they do
not have a common source or progenitor. It is however possible that we may
have missed genetic similarities between the sluge isolates and the air sample
isolates since a significantly large number of isolates were not isolated, and
consequently not screened.
The data indicates that the current rangeland application program does
not significantly influence the microbial air quality in terms of pathogenic or
indicator microbial species at the rangeland-population interface at Sierra
Blanca. Studies are currently in progress to determine the airborne microbial
populations under significantly stronger wind events.
image:
the Hopper Loading site) and four isolates from the air samples collected on
9/15/94 and 10/6/94. No attempt was made to biochemically characterize these
isolates Rather, they were ribotyped to determine whether they were genetically
related to those isolates obtained from the sludge samples. Fig.5 is the ribotype
pattern obtained of the clostridial isolates obtained on the various days. As can
be seen from the ribotype pattern, the isolates from the air samples (Lanes
G H IJ) show a different pattern from those from the sludge material (Lanes B,C,
D' E and F) indicating that they are genetically distinct, suggesting that they do
not have a common source or progenitor. It is however possible that we may
have missed genetic similarities between the sluge isolates and the air sample
isolates since a significantly large number of isolates were not isolated, and
consequently not screened.
The data indicates that the current rangeland application program does
not significantly influence the microbial air quality in terms of pathogenic or
indicator microbial species at the rangeland-population interface at Sierra
Blanca. Studies are currently in progress to determine the airborne microbial
populations under significantly stronger wind events.
image:
 Uamppng location * * ,.
^,1,—11 in— *•
Background
-— —'—
Sierra Blanca Interface
Sludge Application
Hopper Loading
Old Application Site
10/12/94
TO/19/94
8/12/94
8/30/94
10/27/94
8/23/94
9/12/94
10/4/94
11/7/94
9/6/94
9/15/94
10/6/94
11/9/94
9/8/94
9/30/94
64-17,143
107-500,000
386-1032
13714-528~571
148-23,928
~2354 - 91,429
6071-1,214,286
^JO.714- 78,571
17,500-30,714
4357-207,143
17,500-3,071,42
110,714-278,571
7143-196,428
750-196,429"
500 - 34,286
Table 1: Heterotrophic bacterial populations at various locations
image:
Uamppng location * * ,.
^,1,—11 in— *•
Background
-— —'—
Sierra Blanca Interface
Sludge Application
Hopper Loading
Old Application Site
10/12/94
TO/19/94
8/12/94
8/30/94
10/27/94
8/23/94
9/12/94
10/4/94
11/7/94
9/6/94
9/15/94
10/6/94
11/9/94
9/8/94
9/30/94
64-17,143
107-500,000
386-1032
13714-528~571
148-23,928
~2354 - 91,429
6071-1,214,286
^JO.714- 78,571
17,500-30,714
4357-207,143
17,500-3,071,42
110,714-278,571
7143-196,428
750-196,429"
500 - 34,286
Table 1: Heterotrophic bacterial populations at various locations
image:
 • Log CFU/m3
ED Windspeed(mph)
9/6/94 9/15/94 10/6/94 11/9/94
1. Heterotrophic bacterial populations•at"Hopper Loading"
image:
• Log CFU/m3
ED Windspeed(mph)
9/6/94 9/15/94 10/6/94 11/9/94
1. Heterotrophic bacterial populations•at"Hopper Loading"
image:
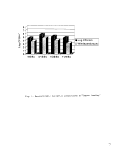 • log CFU/m3
DWindspeed(mph)
8/12/94
8/30/94
10/27/94
Fig. 2. Heterotrophic bacterialpopulations at rangeland-population
interface.
image:
• log CFU/m3
DWindspeed(mph)
8/12/94
8/30/94
10/27/94
Fig. 2. Heterotrophic bacterialpopulations at rangeland-population
interface.
image:
 B Log CFU/m3
B Windspeed(mph)
8/23/94 9/12/94 10/4/94 11/7/94
Fig. 3. Heterotrophic bacterial populations during
sludge application.
°l
image:
B Log CFU/m3
B Windspeed(mph)
8/23/94 9/12/94 10/4/94 11/7/94
Fig. 3. Heterotrophic bacterial populations during
sludge application.
°l
image:
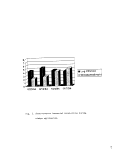 9/6/94 9/15/94 10/6/94 11/9/94
Sampling Dates
• Log CFU/m3
m Windspeed(mph)
Fig. 4. Airborne Clostridium sp. at "Hopper Loading"
image:
9/6/94 9/15/94 10/6/94 11/9/94
Sampling Dates
• Log CFU/m3
m Windspeed(mph)
Fig. 4. Airborne Clostridium sp. at "Hopper Loading"
image:
 Ribotyping of clostridial isolates using PCR
A: : 100 bp ladder
B : SLUDGE (9/15/94)
C -.SLUDGE (9/15/94)
D -.SLUDGE (9/15/94)
E -.SLUDGE (9/15/94)
F -.SLUDGE (9/15/94)
G : AIR (9/15/94)
H: AIR (9/15/940
I : AIR (10/6/94)
J: AIR (10/6/94)
image:
Ribotyping of clostridial isolates using PCR
A: : 100 bp ladder
B : SLUDGE (9/15/94)
C -.SLUDGE (9/15/94)
D -.SLUDGE (9/15/94)
E -.SLUDGE (9/15/94)
F -.SLUDGE (9/15/94)
G : AIR (9/15/94)
H: AIR (9/15/940
I : AIR (10/6/94)
J: AIR (10/6/94)
image:
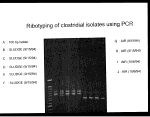 References
1 American Public Health Association. 1992. Standard methods for the
examination of water and waste water. 18th Ed.
2 ASTM standards on materials and environmental microbiology. 2nd. Ed.
American Society for Testing and Materials. Philadelphia, PA.
3 Brenner, K.P., P. Scarpino, and C. S. Clark. 1988. Animal viruses coinages
and bacteria in aerosols and wastewater at a spray irrigation site. Appl.
Environ. Microbiol. 54: 409-415.
4 Hill RT I.T. Knight, M.S. Anikis, and R.R. Colwell. 1993. Benthic
distribution of sewage sludge indicated by Clostridium perfringens at a deep-
ocean dump site. Appl. Environ. Microbiol. 59: 47-51.
5 Scanlan J W P.J. Psaris, R.D. Kuchewither, M. Nelson, M. Metcalf R.S.
ReSo' T G Akero B.P. Flynn, P.L. Schafer,and J.M. Kelly. 1989 Review
S sewage Idge technical regulations. J. Water Poll. Cent. Fed. 61:
1206-1213.
6 Sosebee R E 1994. General climate and weather patterns of the
Ch^uahuan Desert. Annual Report on the basic and applied research on the
beneficial reuse of biosolids on the Sierra Blanca Ranch.
image:
References
1 American Public Health Association. 1992. Standard methods for the
examination of water and waste water. 18th Ed.
2 ASTM standards on materials and environmental microbiology. 2nd. Ed.
American Society for Testing and Materials. Philadelphia, PA.
3 Brenner, K.P., P. Scarpino, and C. S. Clark. 1988. Animal viruses coinages
and bacteria in aerosols and wastewater at a spray irrigation site. Appl.
Environ. Microbiol. 54: 409-415.
4 Hill RT I.T. Knight, M.S. Anikis, and R.R. Colwell. 1993. Benthic
distribution of sewage sludge indicated by Clostridium perfringens at a deep-
ocean dump site. Appl. Environ. Microbiol. 59: 47-51.
5 Scanlan J W P.J. Psaris, R.D. Kuchewither, M. Nelson, M. Metcalf R.S.
ReSo' T G Akero B.P. Flynn, P.L. Schafer,and J.M. Kelly. 1989 Review
S sewage Idge technical regulations. J. Water Poll. Cent. Fed. 61:
1206-1213.
6 Sosebee R E 1994. General climate and weather patterns of the
Ch^uahuan Desert. Annual Report on the basic and applied research on the
beneficial reuse of biosolids on the Sierra Blanca Ranch.
image:
 Acknowledgements
The technical assistance of Kenneth Widmer, Jacob Pena and Scot Dowd are
gratefully acknowledged. I thank Dr. Bob Carlile for his helpru d.scuss.ons^Th.s
work was supported by a research grant from Merco Joint Verrture and funds
from the Texas Agricultural Experiment Station of the Texas A&M Un.vers.ty
System.
image:
Acknowledgements
The technical assistance of Kenneth Widmer, Jacob Pena and Scot Dowd are
gratefully acknowledged. I thank Dr. Bob Carlile for his helpru d.scuss.ons^Th.s
work was supported by a research grant from Merco Joint Verrture and funds
from the Texas Agricultural Experiment Station of the Texas A&M Un.vers.ty
System.
image:
 image:
 Air Quality /Wind Erosion Dynamics
of the Sierra Blanca Biosolid Application Area.
B.L. Harris
Abstract
The purpose of this study primarily was to determine the extent to which applied biosolids are
moved offsite by wind erosion processes. Secondarily, the study was directed to evaluate the
dynamics of wind-moved biosolids at selected sites within the application area. We anticipate
this study to continue at least on more year. Triplicate samplers were set at a 1 meter height at
15 locations to collect particulate mater from the air. All samples were processed at the Frank
Hernandez Environmental Laboratory at the Texas A&M University Agricultural Research and
Extension Center at El Paso, Texas. Very little movement of biosolids was observed. Particulate
matter collection was greater near marshalling areas, but little of this material moved offsite.
Sites downwind from the biosolids application site had significantly less airborne particulates
than upwind sites.
Introduction
Application of biosolids is conducted in the Southwestern U.S., in part, because of climatic and
environmental factors that lessen the potential of movement of the material from the application
areas, especially by water. However, wind movement has not been previously evaluated.
Monitoring wind movement of applied biosolids on the Sierra Blanca ranch can increase the
understanding of the industry, regulatory agencies, and the general public about potentials for
wind erosion of the biosolid materials.
Methodology
Ten sites were chosen and three replicates of wind erosion samplers (Fryrear, 1986)were placed
at 1-m height above the ground surface at each of those sites. Additionally, five sites, each with
two replicates, were chosen to place other samplers, each having samplers at 25-, 50-, and 100-
cm (1 -m) heights; however, this progress report only includes data from the 1 -m height samplers.
Descriptions of the sites can be found in Table 6. Wind direction was primarily west-southwest;
therefore, samplers TAM-2, -3, and -4 were considered upwind collectors of dust generated in
the natural environment. TAM-1 was near the town of Sierra Blanca. All other samplers were
strategically placed in and around application and marshaling areas, (see map at the end of this
report for sampler locations). Particulate samples were collected on 4/6/94, 5/13/94, 8/1/94,
9/6/94, and 10/1/94, based on data compiled regarding windspeed during the collection periods.
Those samples were shipped to the Frank Hernandez Environmental Laboratory at the Texas
A&M University Agricultural Research and Extension Center at El Paso, Texas for analyses.
5-1
image:
Air Quality /Wind Erosion Dynamics
of the Sierra Blanca Biosolid Application Area.
B.L. Harris
Abstract
The purpose of this study primarily was to determine the extent to which applied biosolids are
moved offsite by wind erosion processes. Secondarily, the study was directed to evaluate the
dynamics of wind-moved biosolids at selected sites within the application area. We anticipate
this study to continue at least on more year. Triplicate samplers were set at a 1 meter height at
15 locations to collect particulate mater from the air. All samples were processed at the Frank
Hernandez Environmental Laboratory at the Texas A&M University Agricultural Research and
Extension Center at El Paso, Texas. Very little movement of biosolids was observed. Particulate
matter collection was greater near marshalling areas, but little of this material moved offsite.
Sites downwind from the biosolids application site had significantly less airborne particulates
than upwind sites.
Introduction
Application of biosolids is conducted in the Southwestern U.S., in part, because of climatic and
environmental factors that lessen the potential of movement of the material from the application
areas, especially by water. However, wind movement has not been previously evaluated.
Monitoring wind movement of applied biosolids on the Sierra Blanca ranch can increase the
understanding of the industry, regulatory agencies, and the general public about potentials for
wind erosion of the biosolid materials.
Methodology
Ten sites were chosen and three replicates of wind erosion samplers (Fryrear, 1986)were placed
at 1-m height above the ground surface at each of those sites. Additionally, five sites, each with
two replicates, were chosen to place other samplers, each having samplers at 25-, 50-, and 100-
cm (1 -m) heights; however, this progress report only includes data from the 1 -m height samplers.
Descriptions of the sites can be found in Table 6. Wind direction was primarily west-southwest;
therefore, samplers TAM-2, -3, and -4 were considered upwind collectors of dust generated in
the natural environment. TAM-1 was near the town of Sierra Blanca. All other samplers were
strategically placed in and around application and marshaling areas, (see map at the end of this
report for sampler locations). Particulate samples were collected on 4/6/94, 5/13/94, 8/1/94,
9/6/94, and 10/1/94, based on data compiled regarding windspeed during the collection periods.
Those samples were shipped to the Frank Hernandez Environmental Laboratory at the Texas
A&M University Agricultural Research and Extension Center at El Paso, Texas for analyses.
5-1
image:
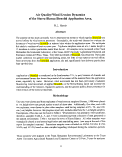 Heavy metal (Ni, V, Cd, Mn, Cr, Cu, and Co) content was determined using acid digestion
(HN03/HC104) techniques and IPC determinations. Zn and Pb were not determined because of
potential contamination from the galvanized sampler construction materials. There is potential
for other metals levels to be affected as well. Additionally, total sample weight, organic matter
and total organic carbon were determined (organic matter content was determined visually on
samples collected on 4/6/94; organic matter for other samples were analytically determined).
Data were analyzed statistically to determine if any significant movement of biosolid materials
occurred during the sampling periods. O.M. and T.O.C. samples were pulverized and
determined by NCHS-0 analyzer.
Results and Discussion
Significantly more particulate matter was collected from the marshaling area from 3/1/94 to
4/6/94, compared to other collection sites (Table 1). This marshaling area was in use during the
collection period. Considerable vehicular traffic occurred during this use period and generated
local dust. Sample weights of the other collection sites were very minute, ranging from 22 to
62 mg (Table 1). Samples collected from the marshaling area were also significantly higher in
V and Mn, compared to collection sites downwind from the application areas (TAM sites 8 and
10; Table 1).
The same trend was evident with regard to sample weight when samples were collected from
4/6/94 to 5/13/94, with the marshaling area having significantly more particulate matter (Table
2). Organic matter, Cd, Mn, Cr, and Co contents did not differ with respect to collection sites
during this period. An upwind site revealed a higher V content (TAM site 2), while a higher Ni
content was evident in a downwind site (TAM site 10) (Table 2).
Marshaling areas continued to show more particulate matter movement compared to all other
sites during the collection period of 7/4/94 to 8/1/94 (Table 3). Significantly more Ni was
detected in TTU-1 through TTU-5 samplers during this period; however, significantly lower
levels of Ni were detected in TAM-9 and TAM-10 samplers located very near the TTU-1
through TTU-5 samplers, indicating the high Ni content might be associated with component
materials of those particular samplers. Mn, Cr, and Co contents did not differ significantly with
regard to collection sites during this period (Table 3).
Similar trends with regard to marshaling areas and total sample weight were revealed during the
collection period of 8/1/94 to 9/6/94; however, this sampling also revealed that more particulate
matter is detected while the marshaling areas are in use, compared to when those areas are not
in use (TAM sites 70 and 71; Table 4). Higher amounts of organic matter were found in the
marshaling area samples, also.
Samples collected from 9/6/94 to 10/1/94 revealed similar results regarding total sample weights,
organic matter content, and Ni content (Table 5).
Overall, particulate matter movement in marshaling areas was 86.2% greater than upwind sites,
and 88.7% higher than downwind sites, suggesting that most movement occurs near marshaling
5-2
image:
Heavy metal (Ni, V, Cd, Mn, Cr, Cu, and Co) content was determined using acid digestion
(HN03/HC104) techniques and IPC determinations. Zn and Pb were not determined because of
potential contamination from the galvanized sampler construction materials. There is potential
for other metals levels to be affected as well. Additionally, total sample weight, organic matter
and total organic carbon were determined (organic matter content was determined visually on
samples collected on 4/6/94; organic matter for other samples were analytically determined).
Data were analyzed statistically to determine if any significant movement of biosolid materials
occurred during the sampling periods. O.M. and T.O.C. samples were pulverized and
determined by NCHS-0 analyzer.
Results and Discussion
Significantly more particulate matter was collected from the marshaling area from 3/1/94 to
4/6/94, compared to other collection sites (Table 1). This marshaling area was in use during the
collection period. Considerable vehicular traffic occurred during this use period and generated
local dust. Sample weights of the other collection sites were very minute, ranging from 22 to
62 mg (Table 1). Samples collected from the marshaling area were also significantly higher in
V and Mn, compared to collection sites downwind from the application areas (TAM sites 8 and
10; Table 1).
The same trend was evident with regard to sample weight when samples were collected from
4/6/94 to 5/13/94, with the marshaling area having significantly more particulate matter (Table
2). Organic matter, Cd, Mn, Cr, and Co contents did not differ with respect to collection sites
during this period. An upwind site revealed a higher V content (TAM site 2), while a higher Ni
content was evident in a downwind site (TAM site 10) (Table 2).
Marshaling areas continued to show more particulate matter movement compared to all other
sites during the collection period of 7/4/94 to 8/1/94 (Table 3). Significantly more Ni was
detected in TTU-1 through TTU-5 samplers during this period; however, significantly lower
levels of Ni were detected in TAM-9 and TAM-10 samplers located very near the TTU-1
through TTU-5 samplers, indicating the high Ni content might be associated with component
materials of those particular samplers. Mn, Cr, and Co contents did not differ significantly with
regard to collection sites during this period (Table 3).
Similar trends with regard to marshaling areas and total sample weight were revealed during the
collection period of 8/1/94 to 9/6/94; however, this sampling also revealed that more particulate
matter is detected while the marshaling areas are in use, compared to when those areas are not
in use (TAM sites 70 and 71; Table 4). Higher amounts of organic matter were found in the
marshaling area samples, also.
Samples collected from 9/6/94 to 10/1/94 revealed similar results regarding total sample weights,
organic matter content, and Ni content (Table 5).
Overall, particulate matter movement in marshaling areas was 86.2% greater than upwind sites,
and 88.7% higher than downwind sites, suggesting that most movement occurs near marshaling
5-2
image:
 areas, as expected. Little, if any, of this material is moving offsite of the area. Additionally, 17.6
% less participate matter moves in downwind sites than in upwind sites, indicating that wind
erosion, and thus biosolid offsite movement, is reduced as the wind moves across the area of
biosolid material application. Organic matter (associated with biosolid materials and/or plant
materials) in particulate matter was 21.6 % reduced in marshaling areas, compared to upwind
sites. Similarly, downwind sites had 54.6 % less organic matter in particulate matter, compared
to upwind locations.
Conclusions
1) The overall amounts of both mineral and organic materials being moved onto and off the
application areas is almost too small to measure; special micro-sample techniques were
required for analyses.
2) Applying biosolids reduces wind erosion by roughening the surface, thereby increasing
the boundary layer of air just above the ground surface.
3) Applying biosolids reduces wind erosion by supplying nutrients that promote growth of
plant species, which serve as windbreaks. Increasing plant growth in the application
areas helps filter particulate matter out of the air as it traverses the site.
4) While intense vehicular traffic in and around marshaling areas does increase dust in their
vicinity, those activities do not increase dust movement off the application site.
5) Based on these studies to date, there should be little concern about potentials for the
applied biosolids to be moved offsite by wind.
Acknowledgments
Special thanks and acknowledgment is made to MERCO Inc. for financial support and to B.L.
Carlile and Tom Gillane for their assistance in facilitating these studies. Also, special thanks are
extended for the assistance provided by Ken E. Lege', Frank Mazac, J.W. Neuhaus, Corey
Moffet, J.D. Bilbro, and D.W. Fryrear. Several individuals with Texas Tech University, notably
Ron Sosebee, receive thanks for their support in coordinating these studies with their other
ongoing efforts at the site.
Author: B.L. Harris, Soils Specialist, Texas Agricultural Extension Service, The Texas A&M
University System, College Station, Texas. Mailing Address: 348 Soil & Crop Sciences,
College Station, TX 77843-2474.
References
D.W. Fryrear (1986) A Field Dust Sampler. Journal of Soil and Water Conservation, 41,117.
5-3
image:
areas, as expected. Little, if any, of this material is moving offsite of the area. Additionally, 17.6
% less participate matter moves in downwind sites than in upwind sites, indicating that wind
erosion, and thus biosolid offsite movement, is reduced as the wind moves across the area of
biosolid material application. Organic matter (associated with biosolid materials and/or plant
materials) in particulate matter was 21.6 % reduced in marshaling areas, compared to upwind
sites. Similarly, downwind sites had 54.6 % less organic matter in particulate matter, compared
to upwind locations.
Conclusions
1) The overall amounts of both mineral and organic materials being moved onto and off the
application areas is almost too small to measure; special micro-sample techniques were
required for analyses.
2) Applying biosolids reduces wind erosion by roughening the surface, thereby increasing
the boundary layer of air just above the ground surface.
3) Applying biosolids reduces wind erosion by supplying nutrients that promote growth of
plant species, which serve as windbreaks. Increasing plant growth in the application
areas helps filter particulate matter out of the air as it traverses the site.
4) While intense vehicular traffic in and around marshaling areas does increase dust in their
vicinity, those activities do not increase dust movement off the application site.
5) Based on these studies to date, there should be little concern about potentials for the
applied biosolids to be moved offsite by wind.
Acknowledgments
Special thanks and acknowledgment is made to MERCO Inc. for financial support and to B.L.
Carlile and Tom Gillane for their assistance in facilitating these studies. Also, special thanks are
extended for the assistance provided by Ken E. Lege', Frank Mazac, J.W. Neuhaus, Corey
Moffet, J.D. Bilbro, and D.W. Fryrear. Several individuals with Texas Tech University, notably
Ron Sosebee, receive thanks for their support in coordinating these studies with their other
ongoing efforts at the site.
Author: B.L. Harris, Soils Specialist, Texas Agricultural Extension Service, The Texas A&M
University System, College Station, Texas. Mailing Address: 348 Soil & Crop Sciences,
College Station, TX 77843-2474.
References
D.W. Fryrear (1986) A Field Dust Sampler. Journal of Soil and Water Conservation, 41,117.
5-3
image:
 Table 1. Total weights, organic matter, and metal contents of articulate samples collected from 3/1/94 to 4/6/94.
Site
TAM-1
TAM-2
TAM-3
TAM-4
TAM-5
TAM-6
TAM-70*
TAM-8
TAM-9
TAM-10
Total
Weight
(g)
0.040 b
0.022 b
0.062 b
0.038 b
0.025 b
0.070 b
2.840 a
0.035 b
0.049 b
0.049 b
Organic
Matter
(%)
7.5
2.5
10.0
2.5
2.5
0.0
0.5
0.5
12.5
0.0
Ni
(mg/kg)
8.19 c
10.83 a-c
9.85 be
10.11 be
18.75 a
14.95 a-c
17.60 ab
9.32 be
12.30 a-c
13. 16 a-c
V
(mg/kg)
16.45 b
31.80b
24.15b
23.10b
26.75 b
21.75 b
54.80 a
22.30 b
23.80 b
24.05 b
Cd
(mg/kg)
0.00
0.00
0.68
2.31
2.79
4.32
2.27
2.59
1.73
2.83
Mn
(mg/kg)
215.0 be
208.0 be
218.5 be
209.5 be
299.0 b
241.0 be
405.5 a
183.0 c
193. Oc
209.5 be
Cr
(mg/kg)
17.75 b
38.15ab
27.95 ab
43.30 ab
5 1.00 a
24.05 b
36.0Q ab
28.10ab
23.20 b
42.l5abi
Cu
(mg/kg)
83.75 ab
66.15 ab
41.05b
121.50 ab
219.50 a
145.50 ab
92.50 ab
31.40b
36.50 b
112.85 ab
Co
(mg/kg)
4.84 ab
0.00 b
1.87ab
1.88ab
0.00 b
4.83 ab
6.90 a
2.59 ab
4.18ab
2.40 ab
This site was marshaling area sampled during use.
5-4
image:
Table 1. Total weights, organic matter, and metal contents of articulate samples collected from 3/1/94 to 4/6/94.
Site
TAM-1
TAM-2
TAM-3
TAM-4
TAM-5
TAM-6
TAM-70*
TAM-8
TAM-9
TAM-10
Total
Weight
(g)
0.040 b
0.022 b
0.062 b
0.038 b
0.025 b
0.070 b
2.840 a
0.035 b
0.049 b
0.049 b
Organic
Matter
(%)
7.5
2.5
10.0
2.5
2.5
0.0
0.5
0.5
12.5
0.0
Ni
(mg/kg)
8.19 c
10.83 a-c
9.85 be
10.11 be
18.75 a
14.95 a-c
17.60 ab
9.32 be
12.30 a-c
13. 16 a-c
V
(mg/kg)
16.45 b
31.80b
24.15b
23.10b
26.75 b
21.75 b
54.80 a
22.30 b
23.80 b
24.05 b
Cd
(mg/kg)
0.00
0.00
0.68
2.31
2.79
4.32
2.27
2.59
1.73
2.83
Mn
(mg/kg)
215.0 be
208.0 be
218.5 be
209.5 be
299.0 b
241.0 be
405.5 a
183.0 c
193. Oc
209.5 be
Cr
(mg/kg)
17.75 b
38.15ab
27.95 ab
43.30 ab
5 1.00 a
24.05 b
36.0Q ab
28.10ab
23.20 b
42.l5abi
Cu
(mg/kg)
83.75 ab
66.15 ab
41.05b
121.50 ab
219.50 a
145.50 ab
92.50 ab
31.40b
36.50 b
112.85 ab
Co
(mg/kg)
4.84 ab
0.00 b
1.87ab
1.88ab
0.00 b
4.83 ab
6.90 a
2.59 ab
4.18ab
2.40 ab
This site was marshaling area sampled during use.
5-4
image:
 Table 2. Total weights, organic matter, and metal contents of articulate samples collected from 4/6/94 to 5/13/94.
Site
TAM-1
TAM-2
TAM-3
TAM-4
TAM-5
TAM-6
TAM-71*
TAM-8
TAM-9
TAM-10
Total
Weight
(g)
0.038 be
0.020 cd
0.043 b
0.017 cd
0.017 cd
0.027 b-d
0.190 a
0.028 b-d
0.019 cd
0.013 d
Organic
Matter
(%)
3.33
0.00
2.00
12.50
5.00
10.33
0.50
0.00
3.33
3.33
Ni
(mg/kg)
12.73 b
14.95 b
11.79 b
10.80 b
8.89 b
6.87 b
10.10 b
6.92 b
19.36 b
45.53 a
V
(mg/kg)
19.07 be
39. 10 a
23.40 b
12.35 be
16.55 be
14.29 be
25.70 ab
19.43 be
21.53 b
4.23 c
Cd
(mg/kg)
2.51
1.19
2.43
2.37
4.24
0.95
1.35
1.16
1.90
2.84
Mn
(mg/kg)
193.00
249.00
238.00
245.00
264.00
224.67
214.00
212.00
230.00
247.00
Cr
(mg/kg)
17.93
23.15
19.93
36.25,
27.60
24.13
17.47
24.63
27.47
39.67
Cu
(mg/kg)
36.50 b
124.50 ab
47.70 ab
156.75 a
69.15ab
61.40ab
70.35 ab
28.87 b
51.13ab
74.60 ab
Co
(mg/kg)
4.60
3.78
1.67
4.32
0.00
4.92
3.26
2.63
1.77
0.00
This site was a marshaling area sampled during a post-use period.
5-5
image:
Table 2. Total weights, organic matter, and metal contents of articulate samples collected from 4/6/94 to 5/13/94.
Site
TAM-1
TAM-2
TAM-3
TAM-4
TAM-5
TAM-6
TAM-71*
TAM-8
TAM-9
TAM-10
Total
Weight
(g)
0.038 be
0.020 cd
0.043 b
0.017 cd
0.017 cd
0.027 b-d
0.190 a
0.028 b-d
0.019 cd
0.013 d
Organic
Matter
(%)
3.33
0.00
2.00
12.50
5.00
10.33
0.50
0.00
3.33
3.33
Ni
(mg/kg)
12.73 b
14.95 b
11.79 b
10.80 b
8.89 b
6.87 b
10.10 b
6.92 b
19.36 b
45.53 a
V
(mg/kg)
19.07 be
39. 10 a
23.40 b
12.35 be
16.55 be
14.29 be
25.70 ab
19.43 be
21.53 b
4.23 c
Cd
(mg/kg)
2.51
1.19
2.43
2.37
4.24
0.95
1.35
1.16
1.90
2.84
Mn
(mg/kg)
193.00
249.00
238.00
245.00
264.00
224.67
214.00
212.00
230.00
247.00
Cr
(mg/kg)
17.93
23.15
19.93
36.25,
27.60
24.13
17.47
24.63
27.47
39.67
Cu
(mg/kg)
36.50 b
124.50 ab
47.70 ab
156.75 a
69.15ab
61.40ab
70.35 ab
28.87 b
51.13ab
74.60 ab
Co
(mg/kg)
4.60
3.78
1.67
4.32
0.00
4.92
3.26
2.63
1.77
0.00
This site was a marshaling area sampled during a post-use period.
5-5
image:
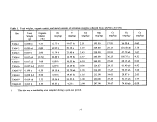 Table 3. Total weights, organic matter, and metal contents of articulate samples collected from 7/4/94 to 8/1/94.
Site
TAM-1
TAM-2
TAM-3
TAM-4
TAM-5
TAM-6
TAM-8
TAM-9
TAM-10
TTU-1
TTU-2
TTU-3
TTU-4
TTU-5
Total
Weight
(g)
0.040 cd
0.122b-d
0.162b
0.049 cd
0.062 cd
0.063 cd
0.105b-d
0.107b-d
0.032 d
0.137 be
0.111 b-d
0.048 cd
0.339 a
0.167b
Organic
Matter
(%)
3.06 a-c
2.68 a-d
2.20 b-e
2.81 a-d
3.39 a
3.32 ab
1.92c-e
2.93 a-d
3.43 a
1.83 de
1.84de
2.99 a-d
2.86 a-d
1.12e
Ni
(mg/kg)
24.10c
16.37 c
15.43 c
17.93 c
15.10c
22.07 c
13.13 c
17.33 c
22.33 c
260.00 b
271.00b
617.00 a
219.50 b
183.50 be
V
(mg/kg)
29.33 a
17.93 b-d
17.63 b-e
21. 57 be
18.50 b-d
22.20 b
12.80 de
18.40 b-d
18.87 b-d
18.95 b-d
15.10c-e
10.98 e
12.95 de
15.55 b-e
Cd
(mg/kg)
0.86 a-c
1.12ab
0.63 be
0.12 c
0.63 be
1.29ab
0.75 be
0.58 be
0.60 be
1.23ab
1.52 a
0.14 c
1.22ab
1.19ab
Mn
(mg/kg)
202.67
258.00
255.67
170.67
196.30
187.67
218.33
234.00
211.33
252.00
233.00
250.50
195.50
244.00
Cr
(mg/kg)
16.60
19.20
14.07
14.47
11.06
26.57
13.45
17.50
22.53
11.95
14.50
14.95
13.60
10.50
Cu
(mg/kg)
40.73 c
37.17c
41.23 c
50.03 c
30.10c
91. 20 be
47.30 c
45.57 c
38.67 c
161.50 b
253,;00 a
275.50 a
129.50 b
105.85 be
Co
(mg/kg)
5.26
5.66
5.22
2.26
4.82
5.68
4.86
5.89
10.14
6.04
5.66
6.44
4.58
4.88
OC
(%)
1.77 a-c
1.56 a-d
1.28 b-e
1.63 a-d
1.97 a
1.92ab
1.11 c-e
1.70 a-d
1.99 a
1.06de
1.07de
1.73 a-d
1.66 a-d
0.65 e
5-6
image:
Table 3. Total weights, organic matter, and metal contents of articulate samples collected from 7/4/94 to 8/1/94.
Site
TAM-1
TAM-2
TAM-3
TAM-4
TAM-5
TAM-6
TAM-8
TAM-9
TAM-10
TTU-1
TTU-2
TTU-3
TTU-4
TTU-5
Total
Weight
(g)
0.040 cd
0.122b-d
0.162b
0.049 cd
0.062 cd
0.063 cd
0.105b-d
0.107b-d
0.032 d
0.137 be
0.111 b-d
0.048 cd
0.339 a
0.167b
Organic
Matter
(%)
3.06 a-c
2.68 a-d
2.20 b-e
2.81 a-d
3.39 a
3.32 ab
1.92c-e
2.93 a-d
3.43 a
1.83 de
1.84de
2.99 a-d
2.86 a-d
1.12e
Ni
(mg/kg)
24.10c
16.37 c
15.43 c
17.93 c
15.10c
22.07 c
13.13 c
17.33 c
22.33 c
260.00 b
271.00b
617.00 a
219.50 b
183.50 be
V
(mg/kg)
29.33 a
17.93 b-d
17.63 b-e
21. 57 be
18.50 b-d
22.20 b
12.80 de
18.40 b-d
18.87 b-d
18.95 b-d
15.10c-e
10.98 e
12.95 de
15.55 b-e
Cd
(mg/kg)
0.86 a-c
1.12ab
0.63 be
0.12 c
0.63 be
1.29ab
0.75 be
0.58 be
0.60 be
1.23ab
1.52 a
0.14 c
1.22ab
1.19ab
Mn
(mg/kg)
202.67
258.00
255.67
170.67
196.30
187.67
218.33
234.00
211.33
252.00
233.00
250.50
195.50
244.00
Cr
(mg/kg)
16.60
19.20
14.07
14.47
11.06
26.57
13.45
17.50
22.53
11.95
14.50
14.95
13.60
10.50
Cu
(mg/kg)
40.73 c
37.17c
41.23 c
50.03 c
30.10c
91. 20 be
47.30 c
45.57 c
38.67 c
161.50 b
253,;00 a
275.50 a
129.50 b
105.85 be
Co
(mg/kg)
5.26
5.66
5.22
2.26
4.82
5.68
4.86
5.89
10.14
6.04
5.66
6.44
4.58
4.88
OC
(%)
1.77 a-c
1.56 a-d
1.28 b-e
1.63 a-d
1.97 a
1.92ab
1.11 c-e
1.70 a-d
1.99 a
1.06de
1.07de
1.73 a-d
1.66 a-d
0.65 e
5-6
image:
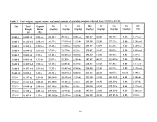 Table 4. Total weights, organic matter, and metal contents of articulate samples collected from 8/1/94 to 9/6/94.
Site
TAM-1
TAM-2
TAM-3
TAM-4
TAM-5
TAM-6
TAM-70t
TAM-71*
TAM-8
TAM-9
TAM-10
TTU-1
TTU-2
TTU-3
TTU-4
TTU-5
Total
Weight
(g)
0.026 ef
0.083 b-e
0.067 c-f
0.027 d-f
0.017 f
0.043 c-f
0.347 a
0.137 b
0.033 d-f
0.037 c-f
0.024 ef
0.033 d-f
0.044 c-f
0.017 f
0.086 b-d
0.095 be
Organic
Matter
O.OOd
1.39 be
2.35 a
O.OOd
O.OOd
0.69 cd
2.09 ab
2.23 ab
O.OOd
0.46 cd
O.OOd
O.OOd
0.70 cd
O.OOd
O.OOd
0.80 cd
Ni
(mg/kg)
25.13cd
12.83 cd
13.13 cd
13.23 cd
16.97 cd
13.50 cd
10.90 d
13.16cd
12.77 cd
14.51 cd
14.23 cd
15 1.00 b-d
193. 50 be
566.50 a
312.50 b
229.50 b
V
(mg/kg)
13.60b
12.37 b
11.87 b
10.31 b
2.35 b
4.88 b
11.40 b
ll.lOb
14.67 b
10.04 b
15.63 b
13.05 b
8.66 b
41. 30 a
14.45 b
12.20 b
Cd
(mg/kg)
4.82
0.51
3.13
1.66
1.02
0.48
1.05
1.50
1.29
0.00
0.00
1.08
2.92
0.00
0.56
0.83
Mn
(mg/kg)
240.67 a
199.67 b-e
228.00 a-e
148.33 f-h
154.67 f-h
139.33 gh
234.33 ab
187.00 d-f
193.33 b-e
152.33 f-h
177.67 d-g
185.50 d-f
125. 50 h
215.50 a-d
168.50 e-g
212.50 a-d
Cr
(mg/kg)
20. 10 a
18.10a-c
15. 17 a-e
11.80c-e
13.43 a-e
19.60 ab
12.83 b-e
15.70 a-e
14.83 a-e
14. 17 a-e
16.27 a-d
9.86 de
9.41 de
15.40 a-e
12.75 b-e
9.21 e
Cu
(mg/kg)
51.70 e
31.47 e
38.83 e
36.47 e
29.70 e
54.37 e
36.77 e
44.40 e
48.33 e
32.37 e
29.27 e
' 85.80 de
ISl.OOb
241. 50 a
158.50 be
lll.SOcd
Co
(mg/kg)
5.88 a
5.53 a
3.09 ab
0.00 b
0.00 b
2.54 ab
4.25 ab
4.40 ab
5.53 a
4.24 ab
5.77 a
1.89ab
0.00 b
0.00 b
4.64 a
4.27 ab
OC
O.OOd
0.81 be
1.36 a
O.OOd
O.OOd
0.40 cd
1.21'ab
1.29'ab
O.OOd
0.27 cd
O.OOd
O.OOd
0.41 cd
O.OOd
O.OOd
0.47 cd
t This site was a marshaling area in use from 9/6/94 to 9/13/94.
± This site was a marshaling area; sample collected pre-use from 8/1/94 to 9/6/94.
5-7
image:
Table 4. Total weights, organic matter, and metal contents of articulate samples collected from 8/1/94 to 9/6/94.
Site
TAM-1
TAM-2
TAM-3
TAM-4
TAM-5
TAM-6
TAM-70t
TAM-71*
TAM-8
TAM-9
TAM-10
TTU-1
TTU-2
TTU-3
TTU-4
TTU-5
Total
Weight
(g)
0.026 ef
0.083 b-e
0.067 c-f
0.027 d-f
0.017 f
0.043 c-f
0.347 a
0.137 b
0.033 d-f
0.037 c-f
0.024 ef
0.033 d-f
0.044 c-f
0.017 f
0.086 b-d
0.095 be
Organic
Matter
O.OOd
1.39 be
2.35 a
O.OOd
O.OOd
0.69 cd
2.09 ab
2.23 ab
O.OOd
0.46 cd
O.OOd
O.OOd
0.70 cd
O.OOd
O.OOd
0.80 cd
Ni
(mg/kg)
25.13cd
12.83 cd
13.13 cd
13.23 cd
16.97 cd
13.50 cd
10.90 d
13.16cd
12.77 cd
14.51 cd
14.23 cd
15 1.00 b-d
193. 50 be
566.50 a
312.50 b
229.50 b
V
(mg/kg)
13.60b
12.37 b
11.87 b
10.31 b
2.35 b
4.88 b
11.40 b
ll.lOb
14.67 b
10.04 b
15.63 b
13.05 b
8.66 b
41. 30 a
14.45 b
12.20 b
Cd
(mg/kg)
4.82
0.51
3.13
1.66
1.02
0.48
1.05
1.50
1.29
0.00
0.00
1.08
2.92
0.00
0.56
0.83
Mn
(mg/kg)
240.67 a
199.67 b-e
228.00 a-e
148.33 f-h
154.67 f-h
139.33 gh
234.33 ab
187.00 d-f
193.33 b-e
152.33 f-h
177.67 d-g
185.50 d-f
125. 50 h
215.50 a-d
168.50 e-g
212.50 a-d
Cr
(mg/kg)
20. 10 a
18.10a-c
15. 17 a-e
11.80c-e
13.43 a-e
19.60 ab
12.83 b-e
15.70 a-e
14.83 a-e
14. 17 a-e
16.27 a-d
9.86 de
9.41 de
15.40 a-e
12.75 b-e
9.21 e
Cu
(mg/kg)
51.70 e
31.47 e
38.83 e
36.47 e
29.70 e
54.37 e
36.77 e
44.40 e
48.33 e
32.37 e
29.27 e
' 85.80 de
ISl.OOb
241. 50 a
158.50 be
lll.SOcd
Co
(mg/kg)
5.88 a
5.53 a
3.09 ab
0.00 b
0.00 b
2.54 ab
4.25 ab
4.40 ab
5.53 a
4.24 ab
5.77 a
1.89ab
0.00 b
0.00 b
4.64 a
4.27 ab
OC
O.OOd
0.81 be
1.36 a
O.OOd
O.OOd
0.40 cd
1.21'ab
1.29'ab
O.OOd
0.27 cd
O.OOd
O.OOd
0.41 cd
O.OOd
O.OOd
0.47 cd
t This site was a marshaling area in use from 9/6/94 to 9/13/94.
± This site was a marshaling area; sample collected pre-use from 8/1/94 to 9/6/94.
5-7
image:
 Table 5. Total weights, organic matter, and metal contents of articulate samples collected from 9/6/94 to 10/1/94.
Site
TAM-1
TAM-2
TAM-3
TAM-4
TAM-5
TAM-6
TAM-70t
TAM-8
TAM-9
TAM-10
TTU-1
TTU-2
TTU-3
TTU-4
TTU-5
Total
Weight
(g)
0.022 d-f
0.031 c-f
0.067 b
0.020 d-f
0.013 f
0.021 d-f
0.119 a
0.041 cd
0.028 c-f
0.018 ef
0.039 c-e
0.034 c-f
0.016 f
0.044 c
0.114 a
Organic
Matter
(%)
0.00 c
0.00 c
3.35 a
0.00 c
0.00 c
0.00 c
3.04 a
1.28 be
0.00 c
0.00 c
1.19 be
0.00 c
0.00 c
2.30 ab
0.82 be
Ni
(mg/kg)
26.27 d
20.63 d
11.00 d
18.87 d
23.57d
14.80 d
15.80 d
16.50 d
13.70d
18.50 d
156.50 b-d
212.00 b
442.50 a
203. 00 be
75.70cd
V
(mg/kg)
22. 13 a
18.63 ab
15.13a-c
16.73 a-c
18.43 ab
17.33 ab
18.20 ab
13. 83 be
9.91 cd
11. 66 b-d
16.80 a-c
12.40 b-d
6.95 d
18.65 ab
17.60 ab
Cd
(mg/kg)
0.98
0.00
0.00
0.94
0.00
0.00
1.03
1.46
0.00
1.80
1.66
0.77
0.00
0.00
0.48
Mn
(mg/kg)
246.33 a-c
186.00 b-e
211.33b-e
168.67 de
182.00 c-e
151.67e
280.33 a
164.33 de
146.00 e
21 1.67 b-e
251.00ab
170.50 de
186.00 b-e
157.00 e
228.50 a-d
Cr
(mg/kg)
25.30 a
15.37 b-e
10.34 de
16.67 b-d
17.00 b-d
14.97 b-e
18.87 b
13.30 b-e
12.40 b-e
17.90 be
12.75 b-e
11.05 c-e
15.65 b-e
12.95 b-e
9.12e
Cu
(mg/kg)
57.17c
34.47 c
23.30c
57.63 c
38.57 c
52.27 c
61.23 c
42.47 c
29.50 c
41.13c
121. 00 b
151.00 b
228.50 a
123. 00 b
59.45 c
Co
(mg/kg)
9.92 a
5.00 ab
3.86 be
2.42 be
0.00 c
2.30 be
5.50 ab
5.21 ab
5.59 ab
4.98 ab
5.13 ab
5.32 ab
3.23 be
6.06 ab
5.15ab
OC
(%)
0.00 c
0.00 c
1.94 a
0.00 c
0.00 c
0.00 c
1.76 a
0.74 be
0.00 c
0.00 c
0.69 be
0.00 c
0.00 c
1.33 ab
0.48 be
f This site was a marshaling area; sample collected post-use from 9/13/94 to 10/1/94.
5-8
image:
Table 5. Total weights, organic matter, and metal contents of articulate samples collected from 9/6/94 to 10/1/94.
Site
TAM-1
TAM-2
TAM-3
TAM-4
TAM-5
TAM-6
TAM-70t
TAM-8
TAM-9
TAM-10
TTU-1
TTU-2
TTU-3
TTU-4
TTU-5
Total
Weight
(g)
0.022 d-f
0.031 c-f
0.067 b
0.020 d-f
0.013 f
0.021 d-f
0.119 a
0.041 cd
0.028 c-f
0.018 ef
0.039 c-e
0.034 c-f
0.016 f
0.044 c
0.114 a
Organic
Matter
(%)
0.00 c
0.00 c
3.35 a
0.00 c
0.00 c
0.00 c
3.04 a
1.28 be
0.00 c
0.00 c
1.19 be
0.00 c
0.00 c
2.30 ab
0.82 be
Ni
(mg/kg)
26.27 d
20.63 d
11.00 d
18.87 d
23.57d
14.80 d
15.80 d
16.50 d
13.70d
18.50 d
156.50 b-d
212.00 b
442.50 a
203. 00 be
75.70cd
V
(mg/kg)
22. 13 a
18.63 ab
15.13a-c
16.73 a-c
18.43 ab
17.33 ab
18.20 ab
13. 83 be
9.91 cd
11. 66 b-d
16.80 a-c
12.40 b-d
6.95 d
18.65 ab
17.60 ab
Cd
(mg/kg)
0.98
0.00
0.00
0.94
0.00
0.00
1.03
1.46
0.00
1.80
1.66
0.77
0.00
0.00
0.48
Mn
(mg/kg)
246.33 a-c
186.00 b-e
211.33b-e
168.67 de
182.00 c-e
151.67e
280.33 a
164.33 de
146.00 e
21 1.67 b-e
251.00ab
170.50 de
186.00 b-e
157.00 e
228.50 a-d
Cr
(mg/kg)
25.30 a
15.37 b-e
10.34 de
16.67 b-d
17.00 b-d
14.97 b-e
18.87 b
13.30 b-e
12.40 b-e
17.90 be
12.75 b-e
11.05 c-e
15.65 b-e
12.95 b-e
9.12e
Cu
(mg/kg)
57.17c
34.47 c
23.30c
57.63 c
38.57 c
52.27 c
61.23 c
42.47 c
29.50 c
41.13c
121. 00 b
151.00 b
228.50 a
123. 00 b
59.45 c
Co
(mg/kg)
9.92 a
5.00 ab
3.86 be
2.42 be
0.00 c
2.30 be
5.50 ab
5.21 ab
5.59 ab
4.98 ab
5.13 ab
5.32 ab
3.23 be
6.06 ab
5.15ab
OC
(%)
0.00 c
0.00 c
1.94 a
0.00 c
0.00 c
0.00 c
1.76 a
0.74 be
0.00 c
0.00 c
0.69 be
0.00 c
0.00 c
1.33 ab
0.48 be
f This site was a marshaling area; sample collected post-use from 9/13/94 to 10/1/94.
5-8
image:
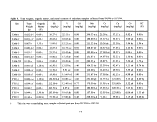 Table 6. Site descriptions.
Agency
TAM1"
TAM
TAM
TAM
TAM
TAM
TAM
TAM
TAM
TAM
TAM
TTU
TTU
TTU
TTU
TTU
TTU
TTU
TTU
TTU
TTU
Sampler #
1
2
3
4
5
6
7
7
8
9
10
1
2
3
4
5
6
7
8
9
10
Site
1
2
3
4
5
6
70
71
8
9
10
1
1
2
2
3
3
4
4
5
5
Description
Off application area; upwind; near
town.
Off application area; upwind.
Off application area; upwind.
Off application area; upwind.
On application area.
On application area.
Marshaling area; mobil; in use or post-
use.
Marshaling area; mobil; pre-use.
Off application area; downwind.
On application area.
Off application area; downwind;
surrounded by application areas on N,
W, and E sides.
Off application area; upwind.
On application area.
Off application area; downwind.
Marshaling area; stationary.
On application area; near major road.
Off application area; downwind; near
major road.
t TAM samplers were replicated three times on 10 sites; TTU samplers were replicated twice on five
sites.
5-9
image:
Table 6. Site descriptions.
Agency
TAM1"
TAM
TAM
TAM
TAM
TAM
TAM
TAM
TAM
TAM
TAM
TTU
TTU
TTU
TTU
TTU
TTU
TTU
TTU
TTU
TTU
Sampler #
1
2
3
4
5
6
7
7
8
9
10
1
2
3
4
5
6
7
8
9
10
Site
1
2
3
4
5
6
70
71
8
9
10
1
1
2
2
3
3
4
4
5
5
Description
Off application area; upwind; near
town.
Off application area; upwind.
Off application area; upwind.
Off application area; upwind.
On application area.
On application area.
Marshaling area; mobil; in use or post-
use.
Marshaling area; mobil; pre-use.
Off application area; downwind.
On application area.
Off application area; downwind;
surrounded by application areas on N,
W, and E sides.
Off application area; upwind.
On application area.
Off application area; downwind.
Marshaling area; stationary.
On application area; near major road.
Off application area; downwind; near
major road.
t TAM samplers were replicated three times on 10 sites; TTU samplers were replicated twice on five
sites.
5-9
image:
 TAEX Samplers #
TTU Samplers +
v " "\ —
image:
TAEX Samplers #
TTU Samplers +
v " "\ —
image:
 Biosolids: Beneficial Uses For
Semi-Arid Rangeland Restoration
S. Straka
This paper presents an overview of studies related to the beneficial use of biosolids on
semi-arid rangelands. This review starts with a definition of biosolids, then discusses
semi-arid rangeland deterioration. The beneficial effects of biosolids applied to such
rangelands are then discussed along with potential uses for biosolids as a land management
tool.
What Are Biosolids?
Biosolids are defined by the Colorado Department of Public Health and Environment as: The
accumulated residual product resulting from domestic wastewater treatment works. Biosolids
does not include grit or screening from a wastewater treatment works, grease, commercial or
industrial sludges, or domestic and industrial septage. Biosolids do not include animal
manures, untreated septage, municipal solid wastes, hazardous wastes, industrial sludges such
as those generated from oil and gas refineries. The intent of this definition is to differentiate
between untreated sludge that is randomly disposed, and biosolids which are a highly treated
organic amendment with land application procedures regulated by federal state and local
guidelines to promote beneficial uses. This differentiation is not completely recognized, and
public perception of biosolids is often of "sludge" that cities are trying to "dump" in rural
areas. However, this "dumping", or land application of biosolids, can be a very effective
method to restore rangeland quality in semi-arid areas by increasing soil nutrients, organic
matter, electroconductivity (EC) and moisture. The restored rangelands retain more moisture,
lose less soil to erosion, and yield better quality and quantity.
Biosolids are not untreated raw sewage materials; they are the treated residuals from domestic
wastewater treatment processes. Biosolids have undergone screening (to remove large
inorganic materials) and grit removal (to removal small inorganic material). The remaining
highly organic material is then be processed in a manner certified by the U.S. Environmental
Protection Agency (EPA) to destroy pathogens. Pathogen destruction may involve anaerobic
digestion, aerobic digestion, heating, drying, or pH adjustment.
Biosolids that have not undergone
pathogen destruction cannot be land applied
The specific biochemical properties of biosolids depend on the type of waste stream they are
derived from, and the type of treatment they are produced from. Generally, biosolids are high
in organic matter and nutrients, with some trace concentrations of metals and plant
micronutrients. The chemical properties of biosolids from three different domestic
wastewater treatment systems in Colorado are shown hi Table 1. Biosolids contain a form of
nitrogen that is more readily available to rangeland plants than nitrogen from commercial
fertilizers (Barbarick and Westfall, 1994).
5-1
image:
Biosolids: Beneficial Uses For
Semi-Arid Rangeland Restoration
S. Straka
This paper presents an overview of studies related to the beneficial use of biosolids on
semi-arid rangelands. This review starts with a definition of biosolids, then discusses
semi-arid rangeland deterioration. The beneficial effects of biosolids applied to such
rangelands are then discussed along with potential uses for biosolids as a land management
tool.
What Are Biosolids?
Biosolids are defined by the Colorado Department of Public Health and Environment as: The
accumulated residual product resulting from domestic wastewater treatment works. Biosolids
does not include grit or screening from a wastewater treatment works, grease, commercial or
industrial sludges, or domestic and industrial septage. Biosolids do not include animal
manures, untreated septage, municipal solid wastes, hazardous wastes, industrial sludges such
as those generated from oil and gas refineries. The intent of this definition is to differentiate
between untreated sludge that is randomly disposed, and biosolids which are a highly treated
organic amendment with land application procedures regulated by federal state and local
guidelines to promote beneficial uses. This differentiation is not completely recognized, and
public perception of biosolids is often of "sludge" that cities are trying to "dump" in rural
areas. However, this "dumping", or land application of biosolids, can be a very effective
method to restore rangeland quality in semi-arid areas by increasing soil nutrients, organic
matter, electroconductivity (EC) and moisture. The restored rangelands retain more moisture,
lose less soil to erosion, and yield better quality and quantity.
Biosolids are not untreated raw sewage materials; they are the treated residuals from domestic
wastewater treatment processes. Biosolids have undergone screening (to remove large
inorganic materials) and grit removal (to removal small inorganic material). The remaining
highly organic material is then be processed in a manner certified by the U.S. Environmental
Protection Agency (EPA) to destroy pathogens. Pathogen destruction may involve anaerobic
digestion, aerobic digestion, heating, drying, or pH adjustment.
Biosolids that have not undergone
pathogen destruction cannot be land applied
The specific biochemical properties of biosolids depend on the type of waste stream they are
derived from, and the type of treatment they are produced from. Generally, biosolids are high
in organic matter and nutrients, with some trace concentrations of metals and plant
micronutrients. The chemical properties of biosolids from three different domestic
wastewater treatment systems in Colorado are shown hi Table 1. Biosolids contain a form of
nitrogen that is more readily available to rangeland plants than nitrogen from commercial
fertilizers (Barbarick and Westfall, 1994).
5-1
image:
 Table 1: Chemical Properties (dry weight basis) of
three biosolids from Colorado.1
Parameter, units
Littleton/
Englewood2
Fort Collins3
EC5, ds/m
Organic N, %
NH4-N, %
N03-N, %
Phosphorus (P), %
Potassium (K), %
Arsenic (As), %
Cadmium (Cd), mg/kg
Chromium (Cr), mg/kg
Copper (Cu), mg/kg
Mercury (Hg), mg/kg
Lead (Pb), mg/kg
Molybdenum (Mo),
Nickel (Ni), mg/kg
Selenium (Se), mg/kg
Zinc (Zn), mg/kg
11.6
2.88
0.47
0.01
2.52
07283
- ,_ 4 -
6
98
558
0.8
45
26
85
13
942
5
4.22
0.40
0.01
1.6
0.194
3
5
40
553
6.2
117
16
19
14
776
12.7
6.31
1.35
0.01
2.32
0.200
3
10
80
500
3.0
138
31
41
4
915
Deterioration of Semi-Arid
Rangelands
Rangelands are defined as "uncultivated land
capable of providing habitat for domestic and
wild animals" (Holecheck et. al., 1989).
Rangelands are not capable of providing a
resource for cultivation due to limiting soil
and moisture conditions. Extensive areas of
semi-arid rangeland in the Western United
States are characterized by deteriorated
vegetation and soil conditions. This
deteriorated state results from historical
misuse and is continued by a vicious cycle of
water losses. Unregulated grazing in the late
nineteenth and early twentieth centuries
caused severe and long-lasting damage to
rangeland watersheds throughout the West
(Chaney et. al., 1993). This overgrazing
reduced the rangeland vegetative cover. As
a result, runoff volumes increased and soil
quality deteriorated, leading to further
vegetative losses.
Soil water availability and fertility in semi-
arid rangelands directly affects forage
production. Deficiencies in soil water reduce plant vigor, and result in plant mortality and
changes in rangeland species composition. Leaf conductance and transpiration studies in
north-western Colorado showed that moisture rapidly decreases through the growing season
or with rangeland disturbances, while plant photosynthetic rates decreased proportionally to
losses in soil moisture (Bohnam et. al., 1990). Studies conducted to determine crop
coefficients for rangelands showed that under rangeland conditions, water is often limiting
and soil water evaporation cannot be ignored (Wight and Hanson, 1990). Next to soil water,
soil fertility is the most limiting factor to forage production in rangelands with less than 500
mm annual precipitation (Holecheck et. al., 1989).
In an effort to halt semi-arid rangeland degradation, research has been conducted for the past
40 years to find effective land amendments to restore rangeland productivity. Studies in
Northeastern Colorado in the early 1950's compared the effectiveness of manure to
commercial fertilizer for rangeland rehabilitation. The manure was found to be the most
effective treatment, increasing herbage yields from 15 to 50 percent. Yields from plots treated
with commercial fertilizers seldom exceeded those from the untreated native range (Klipple
and Retzer, 1959). Another study conducted in 1951 in Saskatchewan concluded that the
benefit of heavy applications of manure are both immediate and lasting, while the effect of
Metro
Denver4
From: Barbarick, K., and Westfall, D., 1994 "Service In Action".
Colorado State University Cooperative Extension bulletin No. 0.547.
Applied to experimental plots near Bennett, CO in August, 1993.
Applied to experimental plots on the Meadow Springs Ranch near
Fort Collins, CO in August 1991.
Metrogro™ cake chemical analysis, 1993.
EC is a measure of the soluble salt concentration.
5-2
image:
Table 1: Chemical Properties (dry weight basis) of
three biosolids from Colorado.1
Parameter, units
Littleton/
Englewood2
Fort Collins3
EC5, ds/m
Organic N, %
NH4-N, %
N03-N, %
Phosphorus (P), %
Potassium (K), %
Arsenic (As), %
Cadmium (Cd), mg/kg
Chromium (Cr), mg/kg
Copper (Cu), mg/kg
Mercury (Hg), mg/kg
Lead (Pb), mg/kg
Molybdenum (Mo),
Nickel (Ni), mg/kg
Selenium (Se), mg/kg
Zinc (Zn), mg/kg
11.6
2.88
0.47
0.01
2.52
07283
- ,_ 4 -
6
98
558
0.8
45
26
85
13
942
5
4.22
0.40
0.01
1.6
0.194
3
5
40
553
6.2
117
16
19
14
776
12.7
6.31
1.35
0.01
2.32
0.200
3
10
80
500
3.0
138
31
41
4
915
Deterioration of Semi-Arid
Rangelands
Rangelands are defined as "uncultivated land
capable of providing habitat for domestic and
wild animals" (Holecheck et. al., 1989).
Rangelands are not capable of providing a
resource for cultivation due to limiting soil
and moisture conditions. Extensive areas of
semi-arid rangeland in the Western United
States are characterized by deteriorated
vegetation and soil conditions. This
deteriorated state results from historical
misuse and is continued by a vicious cycle of
water losses. Unregulated grazing in the late
nineteenth and early twentieth centuries
caused severe and long-lasting damage to
rangeland watersheds throughout the West
(Chaney et. al., 1993). This overgrazing
reduced the rangeland vegetative cover. As
a result, runoff volumes increased and soil
quality deteriorated, leading to further
vegetative losses.
Soil water availability and fertility in semi-
arid rangelands directly affects forage
production. Deficiencies in soil water reduce plant vigor, and result in plant mortality and
changes in rangeland species composition. Leaf conductance and transpiration studies in
north-western Colorado showed that moisture rapidly decreases through the growing season
or with rangeland disturbances, while plant photosynthetic rates decreased proportionally to
losses in soil moisture (Bohnam et. al., 1990). Studies conducted to determine crop
coefficients for rangelands showed that under rangeland conditions, water is often limiting
and soil water evaporation cannot be ignored (Wight and Hanson, 1990). Next to soil water,
soil fertility is the most limiting factor to forage production in rangelands with less than 500
mm annual precipitation (Holecheck et. al., 1989).
In an effort to halt semi-arid rangeland degradation, research has been conducted for the past
40 years to find effective land amendments to restore rangeland productivity. Studies in
Northeastern Colorado in the early 1950's compared the effectiveness of manure to
commercial fertilizer for rangeland rehabilitation. The manure was found to be the most
effective treatment, increasing herbage yields from 15 to 50 percent. Yields from plots treated
with commercial fertilizers seldom exceeded those from the untreated native range (Klipple
and Retzer, 1959). Another study conducted in 1951 in Saskatchewan concluded that the
benefit of heavy applications of manure are both immediate and lasting, while the effect of
Metro
Denver4
From: Barbarick, K., and Westfall, D., 1994 "Service In Action".
Colorado State University Cooperative Extension bulletin No. 0.547.
Applied to experimental plots near Bennett, CO in August, 1993.
Applied to experimental plots on the Meadow Springs Ranch near
Fort Collins, CO in August 1991.
Metrogro™ cake chemical analysis, 1993.
EC is a measure of the soluble salt concentration.
5-2
image:
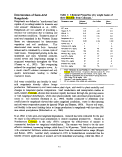 commercial fertilizers may not be worth the cost (Lodge, 1959). At a visit to this research
site twelve years after the manure application, the beneficial effects were still evident.
Even though the beneficial effects of manure application are recognized, most ranchers do
not have the mechanical resources for land application, or the money to afford the substantial
cost of widespread fertilizer application. However, biosolids now provide a low cost
alternative for rangeland rehabilitation. Biosolids are readily available, with many
communities looking for safe, economically feasible, beneficial use opportunities (Aguilar et.
al., 1992). Since the land application of biosolids is a benefit to the wastewater treatment
manager, -and the rancher, capitol costs for land application equipment may be shared or be
considered as part of the municipality's budget for wastewater treatment.
The Effect of Dry-Land Biosolids Application
Small scale field studies have been conducted at several semi-arid rangeland sites to assess the
benefits and environmental impacts of biosolids application. The environmental impacts were
monitored to combat the perceived threat of introducing contaminants into the environment;
the thought that currently limits public acceptance of biosolids. The results of some of these
studies are summarized below.
Increased Soil Fertility
Researchers from the Rocky Mountain Forest and Range Experiment Station conducted a
series of investigations at biosolids test plots in the Rio Puerco Watershed in northwest New
Mexico to determine the effect of biosolids on the rangeland quality. These studies focused
primarily on soil characteristics, microbial communities, and vegetation responses to the
biosolids application. The researchers applied anaerobically digested biosolids at rates of
0, 22.5, 45, and 90 MG/ha to four sets of test plots, for a total of 16 plots. Samples were
then taken from these prior to biosolids application, and annually (after the growing season)
for the next five years.
Results from the Rio Puerco studies showed that soil EC, nutrient, micronutrient, and metals
concentrations increased linearly with the biosolids application rates for the first two years
of application to all the test plots. However, after two years the EC levels in the heaviest
biosolids application decreased. The soil pH decreased through the sampling period, most
significantly in the 90 MG/ha test plot. This was attributed to the fact that the biosolids pH
was lower than that of the rangeland. Application of dried, anaerobically digested biosolids
at 90 Mg/ha resulted in an increase in concentrations of Copper, Manganese and Cadmium
to just above acceptable standards after four growing seasons, which the researchers attributed
partially to the pH reductions.
The researchers concluded that a single biosolids application has the potential to serve as a
low-grade, slow release fertilizer for this soil for several years (Dennis and Fresquez, 1989).
However, they recommended that the biosolids be applied at rates of 22-45 MG/ha to prevent
the potential for metals toxicity.
5-3
image:
commercial fertilizers may not be worth the cost (Lodge, 1959). At a visit to this research
site twelve years after the manure application, the beneficial effects were still evident.
Even though the beneficial effects of manure application are recognized, most ranchers do
not have the mechanical resources for land application, or the money to afford the substantial
cost of widespread fertilizer application. However, biosolids now provide a low cost
alternative for rangeland rehabilitation. Biosolids are readily available, with many
communities looking for safe, economically feasible, beneficial use opportunities (Aguilar et.
al., 1992). Since the land application of biosolids is a benefit to the wastewater treatment
manager, -and the rancher, capitol costs for land application equipment may be shared or be
considered as part of the municipality's budget for wastewater treatment.
The Effect of Dry-Land Biosolids Application
Small scale field studies have been conducted at several semi-arid rangeland sites to assess the
benefits and environmental impacts of biosolids application. The environmental impacts were
monitored to combat the perceived threat of introducing contaminants into the environment;
the thought that currently limits public acceptance of biosolids. The results of some of these
studies are summarized below.
Increased Soil Fertility
Researchers from the Rocky Mountain Forest and Range Experiment Station conducted a
series of investigations at biosolids test plots in the Rio Puerco Watershed in northwest New
Mexico to determine the effect of biosolids on the rangeland quality. These studies focused
primarily on soil characteristics, microbial communities, and vegetation responses to the
biosolids application. The researchers applied anaerobically digested biosolids at rates of
0, 22.5, 45, and 90 MG/ha to four sets of test plots, for a total of 16 plots. Samples were
then taken from these prior to biosolids application, and annually (after the growing season)
for the next five years.
Results from the Rio Puerco studies showed that soil EC, nutrient, micronutrient, and metals
concentrations increased linearly with the biosolids application rates for the first two years
of application to all the test plots. However, after two years the EC levels in the heaviest
biosolids application decreased. The soil pH decreased through the sampling period, most
significantly in the 90 MG/ha test plot. This was attributed to the fact that the biosolids pH
was lower than that of the rangeland. Application of dried, anaerobically digested biosolids
at 90 Mg/ha resulted in an increase in concentrations of Copper, Manganese and Cadmium
to just above acceptable standards after four growing seasons, which the researchers attributed
partially to the pH reductions.
The researchers concluded that a single biosolids application has the potential to serve as a
low-grade, slow release fertilizer for this soil for several years (Dennis and Fresquez, 1989).
However, they recommended that the biosolids be applied at rates of 22-45 MG/ha to prevent
the potential for metals toxicity.
5-3
image:
 Increased Soil Microbial Communities
Soil fertility is also related to soil biota. Microbes and fungi are the major agents in the
decomposition of organic matter and soil stabilization, and serve to increase the availability
of plant nutrients, and fix nitrogen from the atmosphere. In the Rio Puerco test plots, soil
bacterial, fungal, and ammonium oxidizer populations increased linearly with increasing
biosolids application rate (Dennis and Fresquez, 1989). Improvement in soil fertility and
organic matter as a result of biosolids application was also reflected in fungal, diversity, and
in the composition of the fungal community (Fresquez and Dennis, 1989). Fungal diversity
decreased but overall populations increased after biosolids application. This trend in fungal
population is due to increased nutrient availability.
A previous study conducted in north-central New Mexico, Whitford et. al., (1989) also
investigated the addition of organic materials on soil biota activity and the resulting effects on
soil organic matter and nutrients. The application of dried municipal biosolids showed no
significant effect on biomass and activity of soil im'croflora. However, the application of 1
MG/ha of dried municipal biosolids was lower than used in the previous studies. Also, the
second year after biosolids application was much drier than the first growing season, which
may have affected microbial population dynamics. The researchers also proposed that the lack
of variation of nematode populations after the first year may be due to increased populations
of nematode grazers.
Increased Quality and Quantity of Vegetation
The Rio Puerco biosolids application sites were also monitored by Fresquez et. al. (1990a,
1990b, 1991), to determine the effect of biosolids amendments on forage productivity, and
metal uptake by the primarily blue grama/broom snakeweed plant population. Plant tissue
analyses conducted one, two and five growing seasons after biosolids application showed that
plant biomass, crude protein, nitrogen, phosphorus and potassium concentrations increased
with biosolids applications for the first two growing seasons. However, after five growing
seasons, there was no significant difference in plant quality between the amended and
unamended sites. The plant tissue metals concentrations were not significantly different from
those in the unamended sites, proving that the decreased soil pH did not increase metals
content in plant tissue as a result of solubilization, even at the highest loading rate. Some
plant metals actually decreased in concentration with application of the biosolids. The
researchers proposed that this was due to the diluting effect of increased plant growth
(Fresquez et. al., 1990b)
Another biosolids application study was conducted at the Meadow Springs Ranch, owned by
the City of Fort Collins, in northcentral Colorado. Test plots on the Ranch were amended
with dewatered and composted biosolids, applied at rates of 0, 2.2, 4.5, 11.0, 22.0 and 34.0
MG/ha. Water treatment plant residuals were also applied at rates of 5.5, 11.0 and 22.0
MG/ha. Vegetation sampled from these plots showed increased nitrogen, potassium and
phosphorus concentrations in the plant tissues. Metals concentrations in plant tissues remained
within the normal ranges for plant tissue. The biomass and canopy cover of the two dominant
plant species, blue grama and fringed sage, showed increases in biomass as application rates
5-4
image:
Increased Soil Microbial Communities
Soil fertility is also related to soil biota. Microbes and fungi are the major agents in the
decomposition of organic matter and soil stabilization, and serve to increase the availability
of plant nutrients, and fix nitrogen from the atmosphere. In the Rio Puerco test plots, soil
bacterial, fungal, and ammonium oxidizer populations increased linearly with increasing
biosolids application rate (Dennis and Fresquez, 1989). Improvement in soil fertility and
organic matter as a result of biosolids application was also reflected in fungal, diversity, and
in the composition of the fungal community (Fresquez and Dennis, 1989). Fungal diversity
decreased but overall populations increased after biosolids application. This trend in fungal
population is due to increased nutrient availability.
A previous study conducted in north-central New Mexico, Whitford et. al., (1989) also
investigated the addition of organic materials on soil biota activity and the resulting effects on
soil organic matter and nutrients. The application of dried municipal biosolids showed no
significant effect on biomass and activity of soil im'croflora. However, the application of 1
MG/ha of dried municipal biosolids was lower than used in the previous studies. Also, the
second year after biosolids application was much drier than the first growing season, which
may have affected microbial population dynamics. The researchers also proposed that the lack
of variation of nematode populations after the first year may be due to increased populations
of nematode grazers.
Increased Quality and Quantity of Vegetation
The Rio Puerco biosolids application sites were also monitored by Fresquez et. al. (1990a,
1990b, 1991), to determine the effect of biosolids amendments on forage productivity, and
metal uptake by the primarily blue grama/broom snakeweed plant population. Plant tissue
analyses conducted one, two and five growing seasons after biosolids application showed that
plant biomass, crude protein, nitrogen, phosphorus and potassium concentrations increased
with biosolids applications for the first two growing seasons. However, after five growing
seasons, there was no significant difference in plant quality between the amended and
unamended sites. The plant tissue metals concentrations were not significantly different from
those in the unamended sites, proving that the decreased soil pH did not increase metals
content in plant tissue as a result of solubilization, even at the highest loading rate. Some
plant metals actually decreased in concentration with application of the biosolids. The
researchers proposed that this was due to the diluting effect of increased plant growth
(Fresquez et. al., 1990b)
Another biosolids application study was conducted at the Meadow Springs Ranch, owned by
the City of Fort Collins, in northcentral Colorado. Test plots on the Ranch were amended
with dewatered and composted biosolids, applied at rates of 0, 2.2, 4.5, 11.0, 22.0 and 34.0
MG/ha. Water treatment plant residuals were also applied at rates of 5.5, 11.0 and 22.0
MG/ha. Vegetation sampled from these plots showed increased nitrogen, potassium and
phosphorus concentrations in the plant tissues. Metals concentrations in plant tissues remained
within the normal ranges for plant tissue. The biomass and canopy cover of the two dominant
plant species, blue grama and fringed sage, showed increases in biomass as application rates
5-4
image:
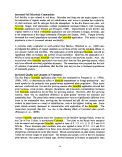 increased. The water treatment plant residuals, when mixed with wastewater biosolids, had
the same rangeland effect as the unblended wastewater biosolids (Gallier, et. al., 1993).
Reduced Runoff
Researchers at the Rocky Mountain Range and Forest Experiment Station conducted a further
series of runoff biosolids studies at the Sevilleta National Wildlife Refuge in New Mexico.
The study objectives were to determine the influencing factors for runoff from semi-arid
rangeland; and to investigate runoff characteristics from areas amended with biosolids.
Results from comparisons of runoff and erosion from two different soils at varying slopes
showed that slope and soil textural differences influence the rate of water infiltration and
resulting runoff and erosion in semi-arid rangeland (Aguilar and Aldon, 1991a). Runoff from
four high intensity summer storms, and from higher intensity simulated rainfalls, was
collected from plots applied with 45 MG/ha anaerobically digested biosolids. The runoff test
plots were located on level areas and also on steeper slopes. The runoff volumes and
constituents were compared with those from adjacent unamended plots. Comparison of the
volumes indicated that runoff from the biosolids sites was significantly reduced. This was
attributed to increased ground surface roughness and absorption of water by the biosolids
(Aguilar and Loftin, 1991).
Analysis of the runoff for potential contamination showed that runoff from test plots carried
metals in concentrations well within New Mexico groundwater and livestock water quality
standards. There was no significant difference between these concentrations and those from
the unamended plots. Additionally, there was no significant difference between nitrate
concentrations from the test plots and the control plots after both natural and simulated
rainfalls. The concentrations of nitrates hi the runoff from the test plots were well below the
acceptable New Mexico State standards of 10 mg/1 nitrate for groundwater or surface water
supplies.
The study concluded that contamination of surface water by constituents in biosolids do not
appear to be a limitation for biosolids application as a fertilizer and mulch amendment in a
semi-arid rangeland (Aguilar and Loftin, 1991).
Runoff response test plots were also established at the Fort Collins Meadow Springs Ranch.
Anaerobically digested wastewater treatment biosolids, water treatment residuals, and a blend
of the two solids were applied on short-grass prairies at rates of 0, 2.2, 4.5, 11.0, 22.0 and
34.0 dry MG/ha on land surface slopes ranging from 0 to 15 percent. (McCurry, Janonis and
Gallier, 1993). Runoff analysis from these plots showed increasing sediment, metals and
nutrients in the runoff from the test sites proportional to biosolids application rates. However,
runoff metals concentrations did not exceed the concentrations listed by the EPA for federal
drinking water standards. Aluminum and iron were the only exceptions to this trend;
concentrations of these metals decreased as application rates increased (Gallier et. al., 1993).
These results indicate that although runoff is decreased by biosolids application, the remaining
runoff contains more concentrated solids, nutrients and metals than unamended areas.
5-5
image:
increased. The water treatment plant residuals, when mixed with wastewater biosolids, had
the same rangeland effect as the unblended wastewater biosolids (Gallier, et. al., 1993).
Reduced Runoff
Researchers at the Rocky Mountain Range and Forest Experiment Station conducted a further
series of runoff biosolids studies at the Sevilleta National Wildlife Refuge in New Mexico.
The study objectives were to determine the influencing factors for runoff from semi-arid
rangeland; and to investigate runoff characteristics from areas amended with biosolids.
Results from comparisons of runoff and erosion from two different soils at varying slopes
showed that slope and soil textural differences influence the rate of water infiltration and
resulting runoff and erosion in semi-arid rangeland (Aguilar and Aldon, 1991a). Runoff from
four high intensity summer storms, and from higher intensity simulated rainfalls, was
collected from plots applied with 45 MG/ha anaerobically digested biosolids. The runoff test
plots were located on level areas and also on steeper slopes. The runoff volumes and
constituents were compared with those from adjacent unamended plots. Comparison of the
volumes indicated that runoff from the biosolids sites was significantly reduced. This was
attributed to increased ground surface roughness and absorption of water by the biosolids
(Aguilar and Loftin, 1991).
Analysis of the runoff for potential contamination showed that runoff from test plots carried
metals in concentrations well within New Mexico groundwater and livestock water quality
standards. There was no significant difference between these concentrations and those from
the unamended plots. Additionally, there was no significant difference between nitrate
concentrations from the test plots and the control plots after both natural and simulated
rainfalls. The concentrations of nitrates hi the runoff from the test plots were well below the
acceptable New Mexico State standards of 10 mg/1 nitrate for groundwater or surface water
supplies.
The study concluded that contamination of surface water by constituents in biosolids do not
appear to be a limitation for biosolids application as a fertilizer and mulch amendment in a
semi-arid rangeland (Aguilar and Loftin, 1991).
Runoff response test plots were also established at the Fort Collins Meadow Springs Ranch.
Anaerobically digested wastewater treatment biosolids, water treatment residuals, and a blend
of the two solids were applied on short-grass prairies at rates of 0, 2.2, 4.5, 11.0, 22.0 and
34.0 dry MG/ha on land surface slopes ranging from 0 to 15 percent. (McCurry, Janonis and
Gallier, 1993). Runoff analysis from these plots showed increasing sediment, metals and
nutrients in the runoff from the test sites proportional to biosolids application rates. However,
runoff metals concentrations did not exceed the concentrations listed by the EPA for federal
drinking water standards. Aluminum and iron were the only exceptions to this trend;
concentrations of these metals decreased as application rates increased (Gallier et. al., 1993).
These results indicate that although runoff is decreased by biosolids application, the remaining
runoff contains more concentrated solids, nutrients and metals than unamended areas.
5-5
image:
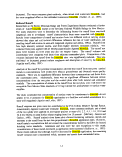 Increased Infiltration
Infiltration rates on semi-arid rangelands are influenced by soil compaction, antecedent soil
moisture, and vegetative cover. Researchers in Somalia investigating the effect of grazing
on infiltration rates did not find a correlation, but did see increased infiltration in areas with
higher cover and biomass accumulation (Takar, et. al, 1990). Studies on the effect of shrub
management on water yield from semi-arid rangeland showed that plant cover limited cracking
of the soil which reduced the depth from which evaporation occurs (Carlson et. al., 1990),
therefore conserving soil moisture.
In order to determine if the water retention provided by land applied biosolids increases
infiltration, monitoring of unsaturated zone leachate from biosolids_application sites was
conducted on the runoff test plots at the Fort Collins Meadow Springs Ranch. A set of
unsaturated zone monitoring devices were installed within the test plots receiving the highest
biosolids application rates and also in a control site. Results showed an increasing steady
state infiltration rate with increasing application rates. Nitrogen in the soil increased with
application rates, but this response was only apparent to a soil depth of 30.5 cm (Gallier et.
al., 1993).
The results showing limited nitrogen leaching corresponded to a study conducted by the
Rocky Mountain Range and Forest Experiment Station to determine the potential for
groundwater contamination in semi-arid rangeland. Subsurface infiltration dynamics were
investigated by Aguilar and Aldon (1991b) in the Rio Puerco watershed. Study results showed
that leaching in semiarid environments due to saturated flow will seldom occur below 1.5 m
in Querencia soils or similar soil types. The study also showed that precipitation and
evaporation dictated the water content in the upper 30 cm of soil.
Biosolids Management
Research results prove that land amendment of biosolids at light to moderate loadings (0-45
MG/ha) is beneficial to semi-arid rangelands, if properly managed. Biosolids application
reduces runoff, increases infiltration, and results in increase biomass growth and quality.
However, heavy loadings of biosolids may result in the accumulation of metals at unacceptable
concentrations, which may in turn lead to increased metal concentrations in vegetative tissues
and surface water. Heavy loadings of biosolids may also result in the contamination of
groundwater by nitrates if the application rate exceeds the nitrogen demand of the vegetation.
Also, since runoff from biosolids amended areas is more concentrated, biosolids should not
be applied in riparian zones.
The EPA issued the 40 CFR Part 503 Biosolids Rule in February 1993 to promote biosolids
reuse and to ensure proper management of biosolids loading rates and locations. All biosolids
land application programs must meet these regulations, in addition to any existing state and
local regulations. In order to protect the environment and public health, these regulations
require the application of biosolids at an agronomic rate determined by the nitrogen demand
of the cover crop or vegetation. The regulations determine the total amount of biosolids that
can be applied to a site (site life) based on the trace metals concentration. These loading
5-6
image:
Increased Infiltration
Infiltration rates on semi-arid rangelands are influenced by soil compaction, antecedent soil
moisture, and vegetative cover. Researchers in Somalia investigating the effect of grazing
on infiltration rates did not find a correlation, but did see increased infiltration in areas with
higher cover and biomass accumulation (Takar, et. al, 1990). Studies on the effect of shrub
management on water yield from semi-arid rangeland showed that plant cover limited cracking
of the soil which reduced the depth from which evaporation occurs (Carlson et. al., 1990),
therefore conserving soil moisture.
In order to determine if the water retention provided by land applied biosolids increases
infiltration, monitoring of unsaturated zone leachate from biosolids_application sites was
conducted on the runoff test plots at the Fort Collins Meadow Springs Ranch. A set of
unsaturated zone monitoring devices were installed within the test plots receiving the highest
biosolids application rates and also in a control site. Results showed an increasing steady
state infiltration rate with increasing application rates. Nitrogen in the soil increased with
application rates, but this response was only apparent to a soil depth of 30.5 cm (Gallier et.
al., 1993).
The results showing limited nitrogen leaching corresponded to a study conducted by the
Rocky Mountain Range and Forest Experiment Station to determine the potential for
groundwater contamination in semi-arid rangeland. Subsurface infiltration dynamics were
investigated by Aguilar and Aldon (1991b) in the Rio Puerco watershed. Study results showed
that leaching in semiarid environments due to saturated flow will seldom occur below 1.5 m
in Querencia soils or similar soil types. The study also showed that precipitation and
evaporation dictated the water content in the upper 30 cm of soil.
Biosolids Management
Research results prove that land amendment of biosolids at light to moderate loadings (0-45
MG/ha) is beneficial to semi-arid rangelands, if properly managed. Biosolids application
reduces runoff, increases infiltration, and results in increase biomass growth and quality.
However, heavy loadings of biosolids may result in the accumulation of metals at unacceptable
concentrations, which may in turn lead to increased metal concentrations in vegetative tissues
and surface water. Heavy loadings of biosolids may also result in the contamination of
groundwater by nitrates if the application rate exceeds the nitrogen demand of the vegetation.
Also, since runoff from biosolids amended areas is more concentrated, biosolids should not
be applied in riparian zones.
The EPA issued the 40 CFR Part 503 Biosolids Rule in February 1993 to promote biosolids
reuse and to ensure proper management of biosolids loading rates and locations. All biosolids
land application programs must meet these regulations, in addition to any existing state and
local regulations. In order to protect the environment and public health, these regulations
require the application of biosolids at an agronomic rate determined by the nitrogen demand
of the cover crop or vegetation. The regulations determine the total amount of biosolids that
can be applied to a site (site life) based on the trace metals concentration. These loading
5-6
image:
 restrictions prevent potential conditions for groundwater contamination or metals toxicity from
occurring at the application site. Additionally, the regulations prevent the land application
of biosolids on steep slopes, high infiltration areas, riparian zones, and other locations where
concentrated runoff could be a concern (EPA 1993).
Proper management of biosolids may include objectives to improve the quality of biosolids so
that they may be a safe resource at any loading rate. One author suggests the use of
recombinant DNA techniques to develop a more degradable biosolids to minimize disposal
problems; or to qualify municipal waste as a renewable resource and separating industrial
waste streams which contribute to metals concerns (Boyle, 1990). However these options may
not be socially, economically or politically feasible. .
Biosolids management may also include developing a model of watershed-scale effects of
biosolids application. Runoff models used to predict the effect of management practice on
reducing runoff from rangeland watersheds (Osborn and Simanton, 1990) could be
implemented to determine biosolids impacts on watershed hydrology.
Biosolids Use for Land Management Purposes
Properly applied biosolids are a renewable resource with many potential beneficial uses for
semi-arid rangelands, including improving soil quality (as mentioned previously), cultivating
or selecting for preferred plant species, manipulating animal grazing patterns, and increasing
stocking rates.
Plant Manipulation
Biosolids may be used to inhibit unwanted plant species. An interesting result of the biosolids
applications conducted in the Rio Puerco watershed was a dramatic decrease in the broom
snakeweed population. After 4 years, the broom snakeweed plants in all of the biosolids
application plots were dead while those in the unamended sites had regrowth. The researchers
proposed the predominance of blue grama may be due to increased nitrogen availability in the
root zone which can be utilized by the shallow rooted grasses. They concluded that the
decrease of broom snakeweed and increase of blue grama on biosolids amended sites shows
the potential for biosolids to be used as a slow release organic fertilizer for land management
purposes (Fresquez et. al., 1990a). The blue grama dominance may also be due to increased
soil moisture (Samuel and Hart, 1992) that results from biosolids dry-land application. The
vegetative response is correlated by plant species at a Bureau of Land Management (BLM)
site near Wolcott, Colorado, where land applied biosolids resulted in increases in three grass
species (western wheatgrass, alkali bluegrass, and big sagebrush) and decrease in one forb
species (nailwort). The vegetative responses were directly proportional to biosolids
application rates (Gallier et. al., 1993).
Reseeding
Biosolids may also be used to aid in reseeding disturbed areas with grasses that are otherwise
difficult to cultivate. When manure was applied at a rate of 12.8 KG/ha and seeded with
crested wheatgrass, both the crested wheatgrass and the native grass population (including
5-7
image:
restrictions prevent potential conditions for groundwater contamination or metals toxicity from
occurring at the application site. Additionally, the regulations prevent the land application
of biosolids on steep slopes, high infiltration areas, riparian zones, and other locations where
concentrated runoff could be a concern (EPA 1993).
Proper management of biosolids may include objectives to improve the quality of biosolids so
that they may be a safe resource at any loading rate. One author suggests the use of
recombinant DNA techniques to develop a more degradable biosolids to minimize disposal
problems; or to qualify municipal waste as a renewable resource and separating industrial
waste streams which contribute to metals concerns (Boyle, 1990). However these options may
not be socially, economically or politically feasible. .
Biosolids management may also include developing a model of watershed-scale effects of
biosolids application. Runoff models used to predict the effect of management practice on
reducing runoff from rangeland watersheds (Osborn and Simanton, 1990) could be
implemented to determine biosolids impacts on watershed hydrology.
Biosolids Use for Land Management Purposes
Properly applied biosolids are a renewable resource with many potential beneficial uses for
semi-arid rangelands, including improving soil quality (as mentioned previously), cultivating
or selecting for preferred plant species, manipulating animal grazing patterns, and increasing
stocking rates.
Plant Manipulation
Biosolids may be used to inhibit unwanted plant species. An interesting result of the biosolids
applications conducted in the Rio Puerco watershed was a dramatic decrease in the broom
snakeweed population. After 4 years, the broom snakeweed plants in all of the biosolids
application plots were dead while those in the unamended sites had regrowth. The researchers
proposed the predominance of blue grama may be due to increased nitrogen availability in the
root zone which can be utilized by the shallow rooted grasses. They concluded that the
decrease of broom snakeweed and increase of blue grama on biosolids amended sites shows
the potential for biosolids to be used as a slow release organic fertilizer for land management
purposes (Fresquez et. al., 1990a). The blue grama dominance may also be due to increased
soil moisture (Samuel and Hart, 1992) that results from biosolids dry-land application. The
vegetative response is correlated by plant species at a Bureau of Land Management (BLM)
site near Wolcott, Colorado, where land applied biosolids resulted in increases in three grass
species (western wheatgrass, alkali bluegrass, and big sagebrush) and decrease in one forb
species (nailwort). The vegetative responses were directly proportional to biosolids
application rates (Gallier et. al., 1993).
Reseeding
Biosolids may also be used to aid in reseeding disturbed areas with grasses that are otherwise
difficult to cultivate. When manure was applied at a rate of 12.8 KG/ha and seeded with
crested wheatgrass, both the crested wheatgrass and the native grass population (including
5-7
image:
 needle-and thread, blue grama and western wheatgrass) increased while the mossy
groundcover of selaginella decreased (Heady, 1952). Reexamination of the test plots 12 years
after manure application showed that taller plant growth was still evident in the manured areas.
Reduce Wind Erosion
Biosolids applied to eroded areas will reduce soil wind erosion. Dust is created by both wind
and soil conditions (Pennisi, 1992). Larger moist biosolids particles are less likely to be
suspended in the air than smaller eroded soil particles, and serve to "weigh down" the
underlying soil. The increased vegetative cover that results from the biosolids application will
further protect the soil from wind erosion. Biosolids application for the reduction of wind
erosion has proven successful on a private ranch in eastern Oregon <Gallier et. al., 1993).
Influence Grazing Patterns
In addition to providing a tool for land management, biosolids application could also provide
a means for animal management. In a study conducted in 1976 on big game rangeland in
Utah, elk showed a grazing preference for fertilized areas instead of native grassland
(Bayoumi and Smith, 1976). The U.S. Air Force Academy, near Colorado Springs,
Colorado, improved vegetative cover with the application of biosolids at rates less that 1
MG/ha, which resulted in improved wildlife habitat. (Gallier et. al., 1993)
Increase Stocking Rates
The rangeland improvements resulting from biosolids application is beneficial to animal
husbandry. Stocking rates at the private Oregon ranch where biosolids were applied to
reduce wind erosion increased from one cow per 6 ha to one cow per 2.1 ha. Biosolids
application to a ranch near Gunnison, Colorado has allowed grazing frequency to increase
from once to two times per year (Gallier et. al., 1993).
The value of dry land application of biosolids obviously extends beyond the municipalities
and engineers seeking a solution for residuals disposal. Rather than being simply a beneficial
disposal solution, biosolids application on semi-arid rangeland is a benefit which extends to
the rancher seeking to improve land value and animal production, to environmentalists
concerned with wildlife habit and rangeland ecosystem destruction, and essentially to all semi-
arid rangeland managers and users.
5-8
image:
needle-and thread, blue grama and western wheatgrass) increased while the mossy
groundcover of selaginella decreased (Heady, 1952). Reexamination of the test plots 12 years
after manure application showed that taller plant growth was still evident in the manured areas.
Reduce Wind Erosion
Biosolids applied to eroded areas will reduce soil wind erosion. Dust is created by both wind
and soil conditions (Pennisi, 1992). Larger moist biosolids particles are less likely to be
suspended in the air than smaller eroded soil particles, and serve to "weigh down" the
underlying soil. The increased vegetative cover that results from the biosolids application will
further protect the soil from wind erosion. Biosolids application for the reduction of wind
erosion has proven successful on a private ranch in eastern Oregon <Gallier et. al., 1993).
Influence Grazing Patterns
In addition to providing a tool for land management, biosolids application could also provide
a means for animal management. In a study conducted in 1976 on big game rangeland in
Utah, elk showed a grazing preference for fertilized areas instead of native grassland
(Bayoumi and Smith, 1976). The U.S. Air Force Academy, near Colorado Springs,
Colorado, improved vegetative cover with the application of biosolids at rates less that 1
MG/ha, which resulted in improved wildlife habitat. (Gallier et. al., 1993)
Increase Stocking Rates
The rangeland improvements resulting from biosolids application is beneficial to animal
husbandry. Stocking rates at the private Oregon ranch where biosolids were applied to
reduce wind erosion increased from one cow per 6 ha to one cow per 2.1 ha. Biosolids
application to a ranch near Gunnison, Colorado has allowed grazing frequency to increase
from once to two times per year (Gallier et. al., 1993).
The value of dry land application of biosolids obviously extends beyond the municipalities
and engineers seeking a solution for residuals disposal. Rather than being simply a beneficial
disposal solution, biosolids application on semi-arid rangeland is a benefit which extends to
the rancher seeking to improve land value and animal production, to environmentalists
concerned with wildlife habit and rangeland ecosystem destruction, and essentially to all semi-
arid rangeland managers and users.
5-8
image:
 References
Aguilar, R., and Aldon, E. 1991a. Runoff and Sediment Rates on San Mateo and Querencia
Soils, Rio Puerco Watershed Management Area, NM. USDA Forest Service Rocky Mountain
Forest and Range Experiment Station, Research Note RM-506.
Aguilar, R., and Aldon, E. 1991b. Seasonal Water Flux and Potential for Leaching in a
Semiarid Rangeland Soil. Proceedings if the Fifth National Outdoor Action Conference on
Aquifer Restoration, Ground Water Monitoring, and Geophysical Methods. May 13-16,
1991. Ground Water Management No. 5:669-683.
Aguilar, R., Gosz, J., and Ward, T. 1992. Sewage Sludge Application in Semiarid
Grasslands: Effects on Vegetation and Water Quality. New Mexico Water Resources
Research Institute Annual Report of Attainment, Project Number 1423645.
Aguilar, R., and Loftin, S. 1991. Sewage Sludge Application in Semiarid Grasslands:
Effects on Runoff and Surface Water Quality. New Mexico Water Resources Research
Institute Report. 265: 101-111.
Barbarick, K. and Westfall, D. 1994. "Service in Action". Colorado State University
Cooperative Extension, Bulletin No. 0.547.
Bayoumi, M., and Smith, D. 1976. Response of Big Game Winter Range Vegetation to
Fertilization. J. Range Manage. 29(l):44-47.
Bonham, C., Mack, S., and Trlica, M. 1990. Leaf Conductance and Transpiration of
Winterfat Associated with 2 Species of Wheatgrass on Disturbed Sites. J. Range Manage.
43(6):501-505.
Boyle, Michael. 1990. Biodegradation of Land Applied Sludge. J. Environ. Qual. 19:640-
644.
Carlson, D., Thurow, T., Knight, R., and Heitschmidt, R. 1990. Effect of Honey Mesquite
on the Water Balance of Texas Rolling Plains Rangeland. J. Range Manage. 43(6):491-496.
Chancy, E., Elmore, W., and Platts, W. 1993. Managing Change-Livestock Grazing on
Western Riparian Areas. USEPA-Northwest Information Center Inc., Eagle, Idaho.
Chancy, E., Elmore, W., and Platts, W. 1990. Livestock Grazing on Western Riparian
Areas. USEPA.
Colorado Department of Public Health and Environment. 1994. "Biosolids Regulations"
4.9.0 (5CCR 1002-19). Colorado Water Quality Control Comission. Denver, Colorado.
5-9
image:
References
Aguilar, R., and Aldon, E. 1991a. Runoff and Sediment Rates on San Mateo and Querencia
Soils, Rio Puerco Watershed Management Area, NM. USDA Forest Service Rocky Mountain
Forest and Range Experiment Station, Research Note RM-506.
Aguilar, R., and Aldon, E. 1991b. Seasonal Water Flux and Potential for Leaching in a
Semiarid Rangeland Soil. Proceedings if the Fifth National Outdoor Action Conference on
Aquifer Restoration, Ground Water Monitoring, and Geophysical Methods. May 13-16,
1991. Ground Water Management No. 5:669-683.
Aguilar, R., Gosz, J., and Ward, T. 1992. Sewage Sludge Application in Semiarid
Grasslands: Effects on Vegetation and Water Quality. New Mexico Water Resources
Research Institute Annual Report of Attainment, Project Number 1423645.
Aguilar, R., and Loftin, S. 1991. Sewage Sludge Application in Semiarid Grasslands:
Effects on Runoff and Surface Water Quality. New Mexico Water Resources Research
Institute Report. 265: 101-111.
Barbarick, K. and Westfall, D. 1994. "Service in Action". Colorado State University
Cooperative Extension, Bulletin No. 0.547.
Bayoumi, M., and Smith, D. 1976. Response of Big Game Winter Range Vegetation to
Fertilization. J. Range Manage. 29(l):44-47.
Bonham, C., Mack, S., and Trlica, M. 1990. Leaf Conductance and Transpiration of
Winterfat Associated with 2 Species of Wheatgrass on Disturbed Sites. J. Range Manage.
43(6):501-505.
Boyle, Michael. 1990. Biodegradation of Land Applied Sludge. J. Environ. Qual. 19:640-
644.
Carlson, D., Thurow, T., Knight, R., and Heitschmidt, R. 1990. Effect of Honey Mesquite
on the Water Balance of Texas Rolling Plains Rangeland. J. Range Manage. 43(6):491-496.
Chancy, E., Elmore, W., and Platts, W. 1993. Managing Change-Livestock Grazing on
Western Riparian Areas. USEPA-Northwest Information Center Inc., Eagle, Idaho.
Chancy, E., Elmore, W., and Platts, W. 1990. Livestock Grazing on Western Riparian
Areas. USEPA.
Colorado Department of Public Health and Environment. 1994. "Biosolids Regulations"
4.9.0 (5CCR 1002-19). Colorado Water Quality Control Comission. Denver, Colorado.
5-9
image:
 Dennis, G., and Fresquez, P. 1989. The Soil Microbial Community in a Sewage-Sludge-
Amended Semi-arid Grassland. Biol. Fertil. Soils. 7:310-317.
Environmental Protection Agency. 1993. "Standards for the Use or Disposal of Sewage
Sludge; Final Rule". 40 CFR Part 503. 58 Federal Register 9248.
Fresquez, P., and Dennis, G. 1989. Composition of Fungal Groups Associated with Sewage
Sludge Amended Grassland Soils. Arid Soil Research and Rehabilitation. 4:19-32.
Fresquez, P., Aguilar, R., Francis, R., and Aldon, E. 1991. Heavy Metal Uptake by Blue
Grama Growing in a Degraded Semiarid Soil Amended with SewageJSludge. Water, Air and
Soil Pollution. 57-58:903-912.
Fresquez, P., Francis, R., and Dennis, G. 1990a. Soil and Vegetation Responses to Sewage
Sludge on a Degraded Semiarid Broom Snakeweed/Blue Grama Plant Community. J. Range
Manage. 43(4):325-331.
Fresqeuz, P., Francis, R., and Dennis, G. 1990b. Sewage Sludge Effects on Soil and Plant
Quality in a Degraded, Semiarid Grassland. /. Environ. Qual. 19:324-329.
Gallier, T., Brobst, R., Aguilar, R., Barbarick, K., Hegeman, P., Janonis, B., Salahub, D.,
and Wilson, S. 1993. Water, Environment and Technology. 5(10): .
Heady, H. 1952. Reseeding, Fertilizing and Renovating in an Ungrazed Mixed Prairie. /.
Range. Manage. 5:144-149.
Holechek, J., Peiper, R., and Herbel, C. 1989. Range Management. Prentice-Hall. New
Jersey.
Klipple, G., and Retzer, J. 1959. Response of Native Vegetation on the Central Great Plains
to Applications of Corral Manure and Commercial Fertilizer. J. Range Manage. 12:239-243.
Lodge, R. 1959. Fertilization of Native Range in the Northern Great Plains. J. Range
Manage. 12:277-279.
McCurry, G. , Janonis, B., Gallier, T. 1993. Methods to Evaluate Impacts of Sludge
Application, in Proceedings from the 1993 Joint CSCE-ASCE National Conference on
Environmental Engineering. 1:413-420.
Mullahey, J., Waller, S., and Moser, L. 1990. Defoliation Effects on Production and
Morphological Development of Little Bluestem. /. Range Manage. 43(6):497-??.
Osborn, H. and Simanton, J. 1990. Hydrologic Modeling of a Treated Rangeland
Watershed. J. Range Manage. 43(6):474-481.
5-10
image:
Dennis, G., and Fresquez, P. 1989. The Soil Microbial Community in a Sewage-Sludge-
Amended Semi-arid Grassland. Biol. Fertil. Soils. 7:310-317.
Environmental Protection Agency. 1993. "Standards for the Use or Disposal of Sewage
Sludge; Final Rule". 40 CFR Part 503. 58 Federal Register 9248.
Fresquez, P., and Dennis, G. 1989. Composition of Fungal Groups Associated with Sewage
Sludge Amended Grassland Soils. Arid Soil Research and Rehabilitation. 4:19-32.
Fresquez, P., Aguilar, R., Francis, R., and Aldon, E. 1991. Heavy Metal Uptake by Blue
Grama Growing in a Degraded Semiarid Soil Amended with SewageJSludge. Water, Air and
Soil Pollution. 57-58:903-912.
Fresquez, P., Francis, R., and Dennis, G. 1990a. Soil and Vegetation Responses to Sewage
Sludge on a Degraded Semiarid Broom Snakeweed/Blue Grama Plant Community. J. Range
Manage. 43(4):325-331.
Fresqeuz, P., Francis, R., and Dennis, G. 1990b. Sewage Sludge Effects on Soil and Plant
Quality in a Degraded, Semiarid Grassland. /. Environ. Qual. 19:324-329.
Gallier, T., Brobst, R., Aguilar, R., Barbarick, K., Hegeman, P., Janonis, B., Salahub, D.,
and Wilson, S. 1993. Water, Environment and Technology. 5(10): .
Heady, H. 1952. Reseeding, Fertilizing and Renovating in an Ungrazed Mixed Prairie. /.
Range. Manage. 5:144-149.
Holechek, J., Peiper, R., and Herbel, C. 1989. Range Management. Prentice-Hall. New
Jersey.
Klipple, G., and Retzer, J. 1959. Response of Native Vegetation on the Central Great Plains
to Applications of Corral Manure and Commercial Fertilizer. J. Range Manage. 12:239-243.
Lodge, R. 1959. Fertilization of Native Range in the Northern Great Plains. J. Range
Manage. 12:277-279.
McCurry, G. , Janonis, B., Gallier, T. 1993. Methods to Evaluate Impacts of Sludge
Application, in Proceedings from the 1993 Joint CSCE-ASCE National Conference on
Environmental Engineering. 1:413-420.
Mullahey, J., Waller, S., and Moser, L. 1990. Defoliation Effects on Production and
Morphological Development of Little Bluestem. /. Range Manage. 43(6):497-??.
Osborn, H. and Simanton, J. 1990. Hydrologic Modeling of a Treated Rangeland
Watershed. J. Range Manage. 43(6):474-481.
5-10
image:
 Pennisi,E. 1992. Dancing Dust. Science News. 142:218-220.
Samuel, M. and Hart, R. 1992. Survival and Growth if Blue Grama Seedlings in Competition
with Western Wheatgrass. J. Range Manage. 45(5):444-448.
Takar, A., Dobrowolski, J., and Thurow, T. 1990. Influence of Grazing, Vegetation Life-Form,
and Soil Type on Infiltration Rates and Interill Erosion on a Somalian Rangeland. J. Range
Manage. 43(6):486-490.
Whitford, W., Aldon, E., Freckman, D., Steinberger, Y., and Parker, L. r989. Effect of Organic
Amendments on Soil Biota on a Degraded Rangeland. J. Range Manage. 42(1):56-60.
Wight, J. and Hanson, C. 1990. Crop Coefficients for Rangeland. J. Range Manage.
43(6):482-485
5-11
image:
Pennisi,E. 1992. Dancing Dust. Science News. 142:218-220.
Samuel, M. and Hart, R. 1992. Survival and Growth if Blue Grama Seedlings in Competition
with Western Wheatgrass. J. Range Manage. 45(5):444-448.
Takar, A., Dobrowolski, J., and Thurow, T. 1990. Influence of Grazing, Vegetation Life-Form,
and Soil Type on Infiltration Rates and Interill Erosion on a Somalian Rangeland. J. Range
Manage. 43(6):486-490.
Whitford, W., Aldon, E., Freckman, D., Steinberger, Y., and Parker, L. r989. Effect of Organic
Amendments on Soil Biota on a Degraded Rangeland. J. Range Manage. 42(1):56-60.
Wight, J. and Hanson, C. 1990. Crop Coefficients for Rangeland. J. Range Manage.
43(6):482-485
5-11
image:
 image:
 image:
 image: