<pubnumber> 600786019
 </pubnumber>
<title>Assessment of Solid Waste Characteristics and Control Technology for Oil Shale Retorting</title>
<pages>354</pages>
<pubyear>1986</pubyear>
<provider>NEPIS</provider>
<access>online</access>
<operator>dwu</operator>
<scandate>03/03/03</scandate>
<origin>hardcopy</origin>
<type>single page tiff</type>
<keyword>shale oil tosco retorted shales spent retorting retort water raw paraho gas material lurgi processed table coal process peak source</keyword>
600
ASSESSMENT OF SOLID WASTE CHARACTERISTICS AND
CONTROL TECHNOLOGY FOR OIL SHALE RETORTING ;
by
Ashok K. Agarwal
Monsanto Company
1515 Nicholas Road
Dayton, Ohio 45418
Contract No. EPA 68-01-6487
Project Officer
Edward R. Bates ]
Hazardous Waste Engineering Research Laboratory-
Cincinnati, Ohio 45268
March 1986
Air and Energy Engineering Research Laboratory
Office of Research and Development
U.S. Environmental Protection Agency
Research Triangle Park, North Carolina 27711
image:
</pubnumber>
<title>Assessment of Solid Waste Characteristics and Control Technology for Oil Shale Retorting</title>
<pages>354</pages>
<pubyear>1986</pubyear>
<provider>NEPIS</provider>
<access>online</access>
<operator>dwu</operator>
<scandate>03/03/03</scandate>
<origin>hardcopy</origin>
<type>single page tiff</type>
<keyword>shale oil tosco retorted shales spent retorting retort water raw paraho gas material lurgi processed table coal process peak source</keyword>
600
ASSESSMENT OF SOLID WASTE CHARACTERISTICS AND
CONTROL TECHNOLOGY FOR OIL SHALE RETORTING ;
by
Ashok K. Agarwal
Monsanto Company
1515 Nicholas Road
Dayton, Ohio 45418
Contract No. EPA 68-01-6487
Project Officer
Edward R. Bates ]
Hazardous Waste Engineering Research Laboratory-
Cincinnati, Ohio 45268
March 1986
Air and Energy Engineering Research Laboratory
Office of Research and Development
U.S. Environmental Protection Agency
Research Triangle Park, North Carolina 27711
image:
 NOTICE
The information in this document: has been funded wholly or in
part by the United States Environmental Protection Agency under
Contract 68-01-6487 to Monsanto Company. It has been subject
to the Agency's peer and administrative review, and it has been
approved for publication as an EPA>document.
I
1
I
1
11 ,
I
I
I
I
I
I
I
I
I
I
I
I
I
I
image:
NOTICE
The information in this document: has been funded wholly or in
part by the United States Environmental Protection Agency under
Contract 68-01-6487 to Monsanto Company. It has been subject
to the Agency's peer and administrative review, and it has been
approved for publication as an EPA>document.
I
1
I
1
11 ,
I
I
I
I
I
I
I
I
I
I
I
I
I
I
image:
 I
I
I
I
FOREWORD
I
When energy and material resources are extracted, processed,
converted, and used, the related pollutional impapts on our
environment and even on our health often require that new and
increasingly more efficient pollution control methods be used.
The Air and Energy Engineering Research Laboratory, Research
TriailOle PaT~l? . asc'l e1"C in HOTT-OT /-vr\-iT-i/-r =si->^ ^^w./->»-.r-i4--v--,-t-T -^-^ ~.-.,, __j
I me Air and Energy Engineering Research Laboratory, Research
Triangle Park, assists in developing and demonstrating new and
improved methodologies that will meet these needs i both effi-
ciently and economically. .
I
I
I
I
I
I
I
I
I
I
I
I
I
Frank Princiotta i
Director :
Air and Energy Engineering Research Laboratory
111
image:
I
I
I
I
FOREWORD
I
When energy and material resources are extracted, processed,
converted, and used, the related pollutional impapts on our
environment and even on our health often require that new and
increasingly more efficient pollution control methods be used.
The Air and Energy Engineering Research Laboratory, Research
TriailOle PaT~l? . asc'l e1"C in HOTT-OT /-vr\-iT-i/-r =si->^ ^^w./->»-.r-i4--v--,-t-T -^-^ ~.-.,, __j
I me Air and Energy Engineering Research Laboratory, Research
Triangle Park, assists in developing and demonstrating new and
improved methodologies that will meet these needs i both effi-
ciently and economically. .
I
I
I
I
I
I
I
I
I
I
I
I
I
Frank Princiotta i
Director :
Air and Energy Engineering Research Laboratory
111
image:
 ABSTRACT
I
I
I
I
i ( •_
This report is a comprehensive study of the characteristics of •
solid and liquid wastes produced from various oil shale process- H
ing technologies, and control methods for environmentally safe
disposal of solid wastes. It also includes the results from an m
experimental study to construct liners and covers for proper ||
disposal of spent shales. In addition the auto ignition potential
of raw and spent shales has been evaluated. «
Considerable effort is currently being directed to commercializa- •
tion of processes to produce liquid fuels from oil shale deposits
in the United States. When financing uncertainties are resolved, •
construction of large-scale plants could begin. The retorting of |
oil shale produces large quantities of solid wastes. These wastes
include raw mined oil shale (which does not contain enough kerogen «
for economical recovery), spent oil shale (mineral matter from |
which the kerogen has been thermally removed by retorting), over-
burden material (which must be removed before the shale can be
mined), shale fines from processing operations (e.g., dust •
collected in fabric filters) and process wastes (e.g., spent •
catalysts, wastewater treatment sludges).
Oil shale deposits in the eastern and western parts of the United f|
States, their geological subdivisions, their locations, tonnage,
and their physical and chemical characteristics have been _
described. The solid and liquid wastes generated from the various •
oil shale technologies have been compiled. Amounts of solid and
liquid wastes generated and their composition depend, among other
things, on the particular technology used and on the type of shale •
processed. Some of the wastes may also be site specific. Avail- •
able field and laboratory leachate data are also presented.
If only one-half of the planned production comes on line, it would |
eventually amount to approximately 600,000 barrels per day of
shale oil. This would lead to approximately 740,000 tons/day or _
270 million tons per year of retorted oil shale, along with lesser •
quantities of other solid wastes, which will require environmen- "
tally safe disposal. If not properly managed, these high volume
wastes are capable of producing leachates that could contaminate •
the water supply for millions of people. Surface disposal sites •
covering many square miles in area and hundreds of feet in depth
would do extensive property damage and threaten lives should •
they ever suffer sudden mass failure. An experimental program |
I
IV
I
image:
ABSTRACT
I
I
I
I
i ( •_
This report is a comprehensive study of the characteristics of •
solid and liquid wastes produced from various oil shale process- H
ing technologies, and control methods for environmentally safe
disposal of solid wastes. It also includes the results from an m
experimental study to construct liners and covers for proper ||
disposal of spent shales. In addition the auto ignition potential
of raw and spent shales has been evaluated. «
Considerable effort is currently being directed to commercializa- •
tion of processes to produce liquid fuels from oil shale deposits
in the United States. When financing uncertainties are resolved, •
construction of large-scale plants could begin. The retorting of |
oil shale produces large quantities of solid wastes. These wastes
include raw mined oil shale (which does not contain enough kerogen «
for economical recovery), spent oil shale (mineral matter from |
which the kerogen has been thermally removed by retorting), over-
burden material (which must be removed before the shale can be
mined), shale fines from processing operations (e.g., dust •
collected in fabric filters) and process wastes (e.g., spent •
catalysts, wastewater treatment sludges).
Oil shale deposits in the eastern and western parts of the United f|
States, their geological subdivisions, their locations, tonnage,
and their physical and chemical characteristics have been _
described. The solid and liquid wastes generated from the various •
oil shale technologies have been compiled. Amounts of solid and
liquid wastes generated and their composition depend, among other
things, on the particular technology used and on the type of shale •
processed. Some of the wastes may also be site specific. Avail- •
able field and laboratory leachate data are also presented.
If only one-half of the planned production comes on line, it would |
eventually amount to approximately 600,000 barrels per day of
shale oil. This would lead to approximately 740,000 tons/day or _
270 million tons per year of retorted oil shale, along with lesser •
quantities of other solid wastes, which will require environmen- "
tally safe disposal. If not properly managed, these high volume
wastes are capable of producing leachates that could contaminate •
the water supply for millions of people. Surface disposal sites •
covering many square miles in area and hundreds of feet in depth
would do extensive property damage and threaten lives should •
they ever suffer sudden mass failure. An experimental program |
I
IV
I
image:
 was undertaken to establish the best combination of spent shale
with materials readily available at the disposal site to construct
liners and covers for the spent shale disposal. i
Also in this report available information has been pompiled in
order to evaluate the auto ignition potential of raw and spent
shales from various oil shale processes. The results indicate
that raw shale fines have a potential for spontaneous ignition
similar to bituminous coals while such potential for retorted
shales appear to be less. Hence, there is a potential jthat if oil
shale disposal sites are not properly designed they i could auto
ignite. It appears probably that control technology employed by
the coal industry can be modified and applied toi oil shale
disposal sites to mitigate this hazard. j
Control technologies to prevent serious adverse impacts from dis-
posal of billions of tons of oil shale wastes have bejsn proposed
but their application to oil shale waste materials oh the scale
required for commercial plants has not been demonstrate^. Further-
more, to be effective, these control technologies must be applied
to highly technical and integrated disposal designs that are site
and process specific. There is no current experience an disposal
of wastes of similar composition or of volumes approaching that
which will result from the oil shale industry. i
image:
was undertaken to establish the best combination of spent shale
with materials readily available at the disposal site to construct
liners and covers for the spent shale disposal. i
Also in this report available information has been pompiled in
order to evaluate the auto ignition potential of raw and spent
shales from various oil shale processes. The results indicate
that raw shale fines have a potential for spontaneous ignition
similar to bituminous coals while such potential for retorted
shales appear to be less. Hence, there is a potential jthat if oil
shale disposal sites are not properly designed they i could auto
ignite. It appears probably that control technology employed by
the coal industry can be modified and applied toi oil shale
disposal sites to mitigate this hazard. j
Control technologies to prevent serious adverse impacts from dis-
posal of billions of tons of oil shale wastes have bejsn proposed
but their application to oil shale waste materials oh the scale
required for commercial plants has not been demonstrate^. Further-
more, to be effective, these control technologies must be applied
to highly technical and integrated disposal designs that are site
and process specific. There is no current experience an disposal
of wastes of similar composition or of volumes approaching that
which will result from the oil shale industry. i
image:
 I
I
I
I
I
I
I
I
I
I
I
I
I
I
I
I
I
I
I
image:
I
I
I
I
I
I
I
I
I
I
I
I
I
I
I
I
I
I
I
image:
 CONTENTS
Foreword
Abstract
Figures
Tables.
Acknowledgment xxii
1. Introduction ; .
1.1 Sources and volumes of solid waste, including
an overview of the oil shale industry . . .
1 i
1.2 Potential dangers to human health and the ',
environment from the disposal and reuse of
the wastes. 5
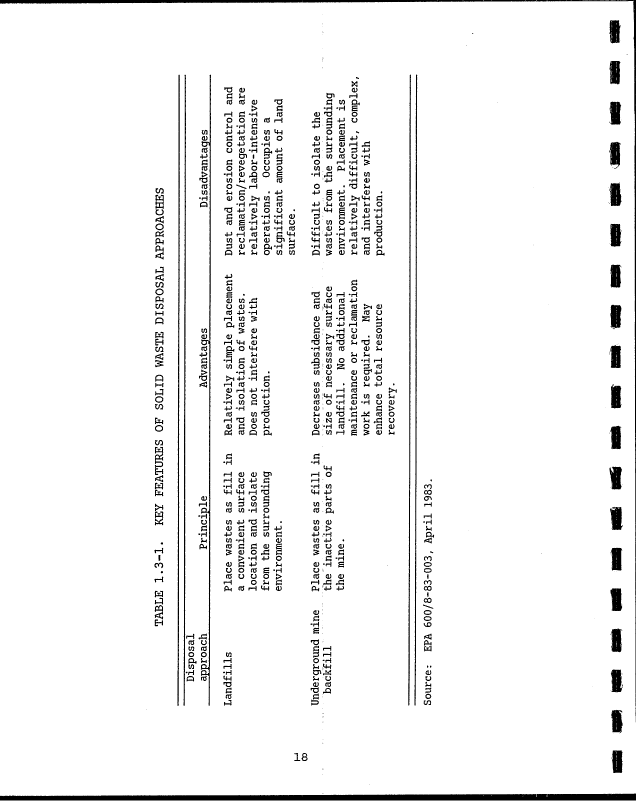
1.3 Present/proposed disposal approaches. . . i . 17
1.4 Conclusions and additional research needed i. . 21
i
2. Characteristics Of U.S. Oil Shale !. 23
2.1 Introduction ' . 23
2.2 Location j . 23
2.3 Geology . 1 . 28
2.4 Composition ; . 41
2.5 Physical properties . 52
3. Solid Wastes and Their Characteristics for •
Oil Shale Retorting Processes . 69
3.1 Lurgi-Ruhrgas oil shale retorting ....;. 69
3.2 TOSCO II oil shale retorting, j . 85
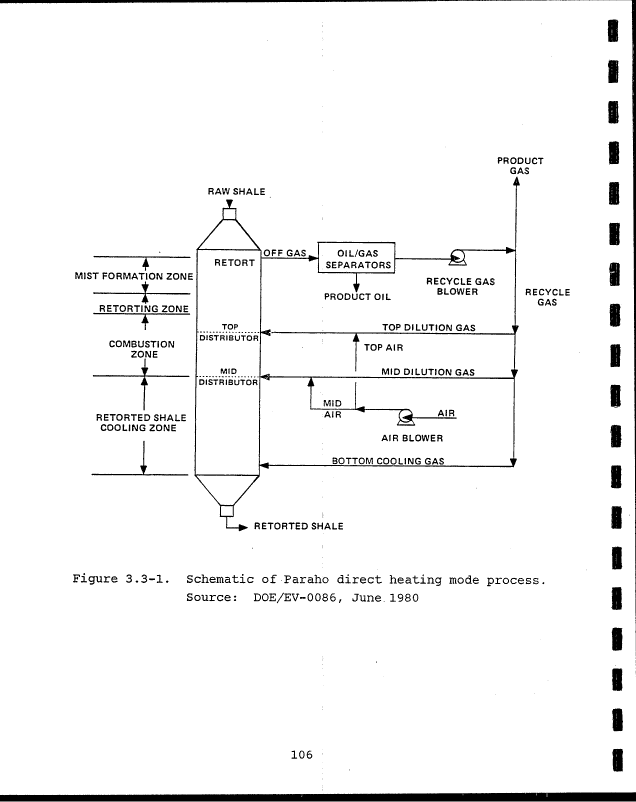
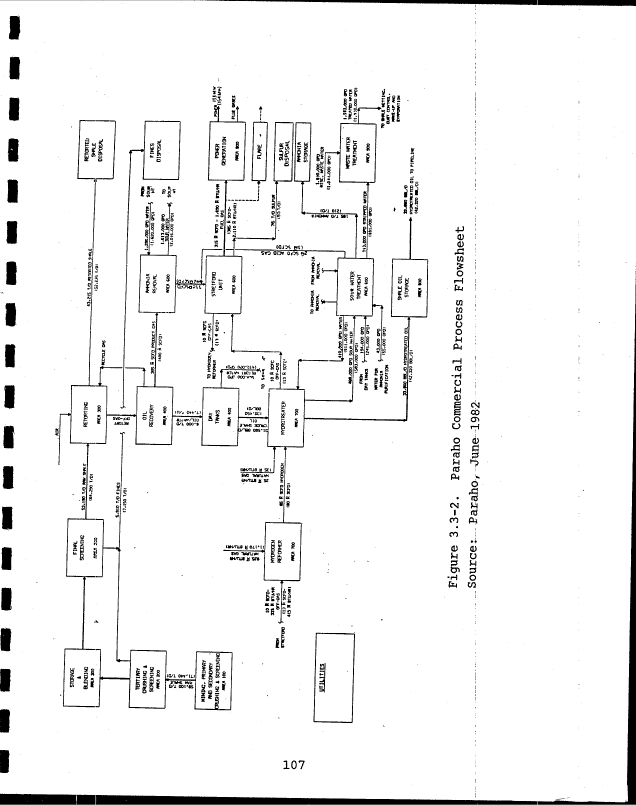
3.3 Paraho direct heating mode oil shale i
retorting J . . 105
3.4 Paraho indirect heating mode oil shale
retorting .: . 127
3.5 Occidental modified in situ oil shale j
retorting j . 135
3.6 T? oil shale retorting .; . 151
3.7 Hytort oil shale retorting. j . 155
3.8 Geokinetics horizontal in situ oil shale i
retorting : . 164
3.9 Superior circular grate oil shale retorting . 168
3.10 Union Oil A oil shale retorting 177
3.11 Union Oil B oil shale retorting i. 182
3.12 Union Oil SGR oil shale retorting ;. 191
3.13 Chevron STB oil shale retorting :. 202
3.14 Allis-Chalmers oil shale retorting . . . . ;. 210
3.15 Dravo oil shale retorting i. 216
vi i
image:
CONTENTS
Foreword
Abstract
Figures
Tables.
Acknowledgment xxii
1. Introduction ; .
1.1 Sources and volumes of solid waste, including
an overview of the oil shale industry . . .
1 i
1.2 Potential dangers to human health and the ',
environment from the disposal and reuse of
the wastes. 5
1.3 Present/proposed disposal approaches. . . i . 17
1.4 Conclusions and additional research needed i. . 21
i
2. Characteristics Of U.S. Oil Shale !. 23
2.1 Introduction ' . 23
2.2 Location j . 23
2.3 Geology . 1 . 28
2.4 Composition ; . 41
2.5 Physical properties . 52
3. Solid Wastes and Their Characteristics for •
Oil Shale Retorting Processes . 69
3.1 Lurgi-Ruhrgas oil shale retorting ....;. 69
3.2 TOSCO II oil shale retorting, j . 85
3.3 Paraho direct heating mode oil shale i
retorting J . . 105
3.4 Paraho indirect heating mode oil shale
retorting .: . 127
3.5 Occidental modified in situ oil shale j
retorting j . 135
3.6 T? oil shale retorting .; . 151
3.7 Hytort oil shale retorting. j . 155
3.8 Geokinetics horizontal in situ oil shale i
retorting : . 164
3.9 Superior circular grate oil shale retorting . 168
3.10 Union Oil A oil shale retorting 177
3.11 Union Oil B oil shale retorting i. 182
3.12 Union Oil SGR oil shale retorting ;. 191
3.13 Chevron STB oil shale retorting :. 202
3.14 Allis-Chalmers oil shale retorting . . . . ;. 210
3.15 Dravo oil shale retorting i. 216
vi i
image:
 CONTENTS (continued)
I
I
4. Environmental Control Technologies ....... . 219
4.1 Environmental impacts ........... . 219
4.2 Disposal alternatives ......... ... 222
4.3 Control technologies ............ 227
»
gj
References ............ ........... • 255
Appendix ............. ............ A~!
A. Auto-oxidation potential of raw and spent shale
and the suggested design of piles to avoid the •
auto-ignition of shales. . . .......... A-l gj
B. Use of spent oil shale as a liner material at
spent shale disposal sites ........... B-i _
I
I
I
I
I
I
I
I
I
I
I
image:
CONTENTS (continued)
I
I
4. Environmental Control Technologies ....... . 219
4.1 Environmental impacts ........... . 219
4.2 Disposal alternatives ......... ... 222
4.3 Control technologies ............ 227
»
gj
References ............ ........... • 255
Appendix ............. ............ A~!
A. Auto-oxidation potential of raw and spent shale
and the suggested design of piles to avoid the •
auto-ignition of shales. . . .......... A-l gj
B. Use of spent oil shale as a liner material at
spent shale disposal sites ........... B-i _
I
I
I
I
I
I
I
I
I
I
I
image:
 FIGURES
Number
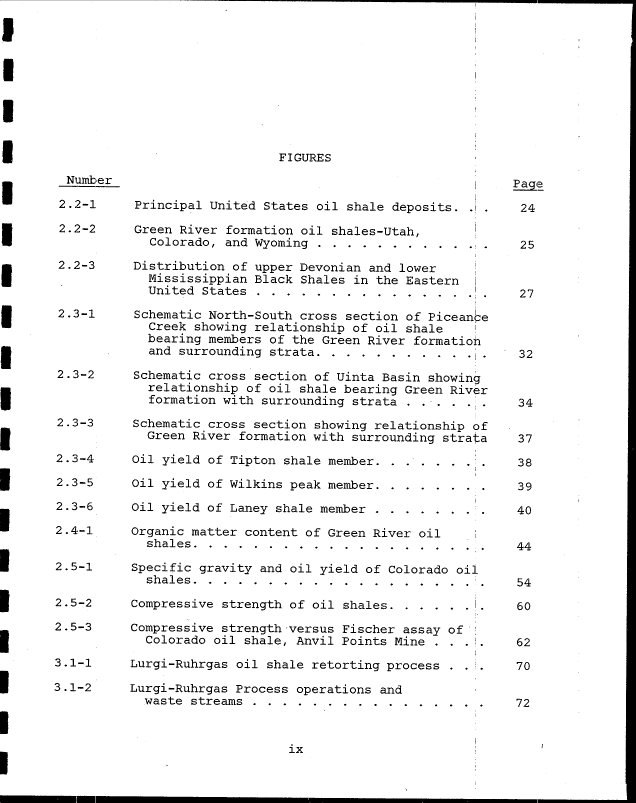
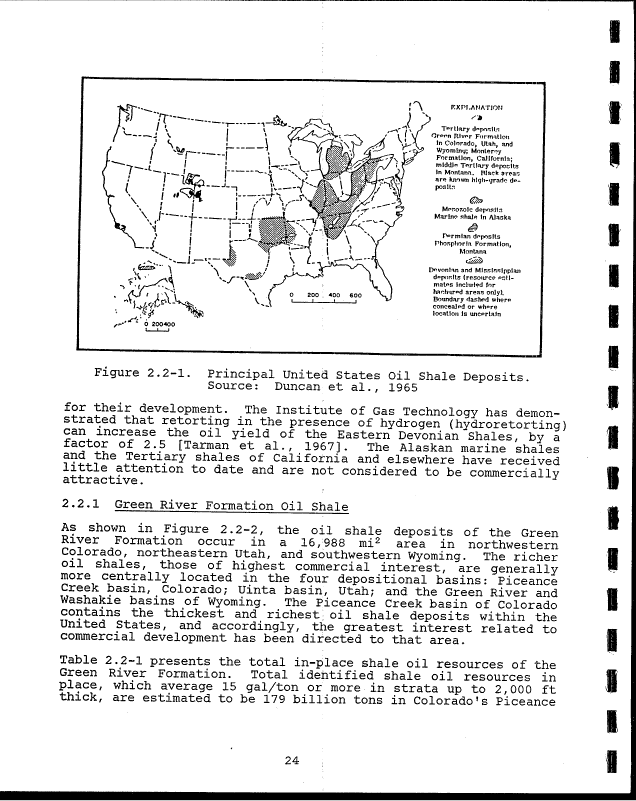
2.2-1 Principal United States oil shale deposits. .1 . 24
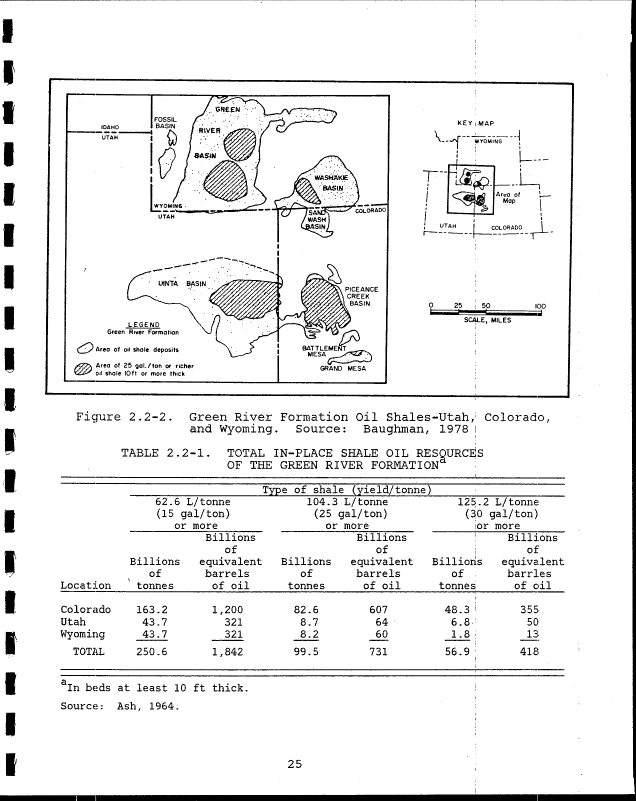
2.2-2 Green River formation oil shales-Utah, !
Colorado, and Wyoming ] . 25
2.2-3 Distribution of upper Devonian and lower |
Mississippian Black Shales in the Eastern
United States | 27
2.3-1 Schematic North-South cross section of Piceanjse
Creek showing relationship of oil shale >l
bearing members of the Green River formation
and surrounding strata j 32
2.3-2 Schematic cross section of Uinta Basin showing
relationship of oil shale bearing Green River
formation with surrounding strata .....;. 34
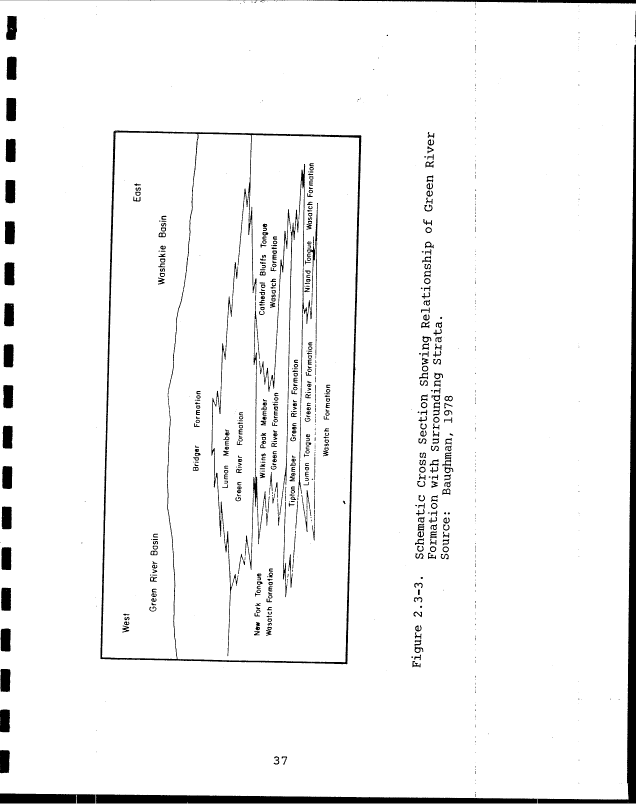
2.3-3 Schematic cross section showing relationship of
Green River formation with surrounding strata 37
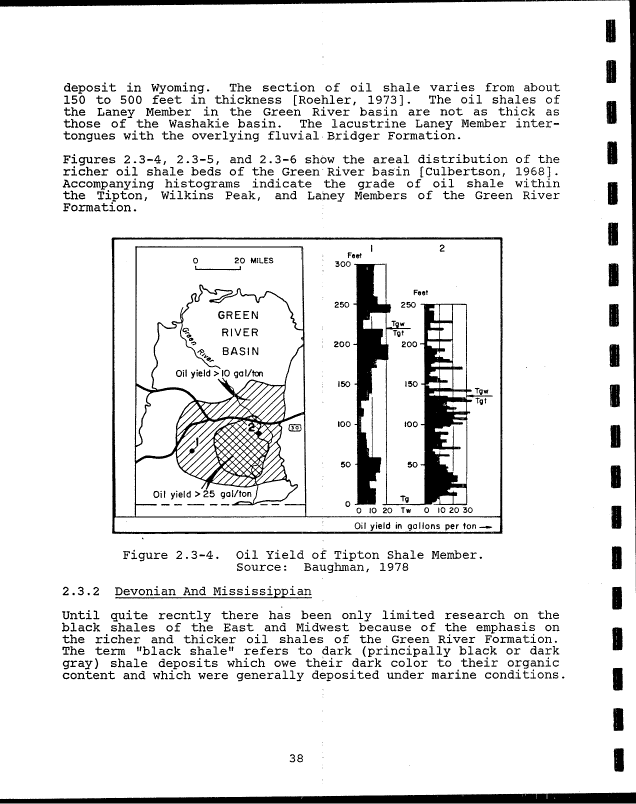
2.3-4 Oil yield of Tipton shale member. ..... .:. 38
i
i
2.3-5 Oil yield of Wilkins peak member 39
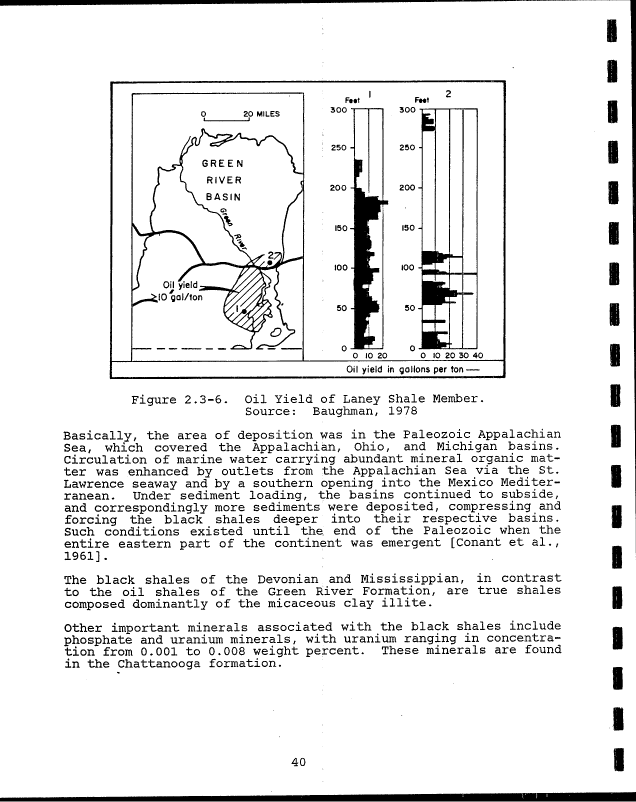
2.3-6 oil yield of Laney shale member ' . 40
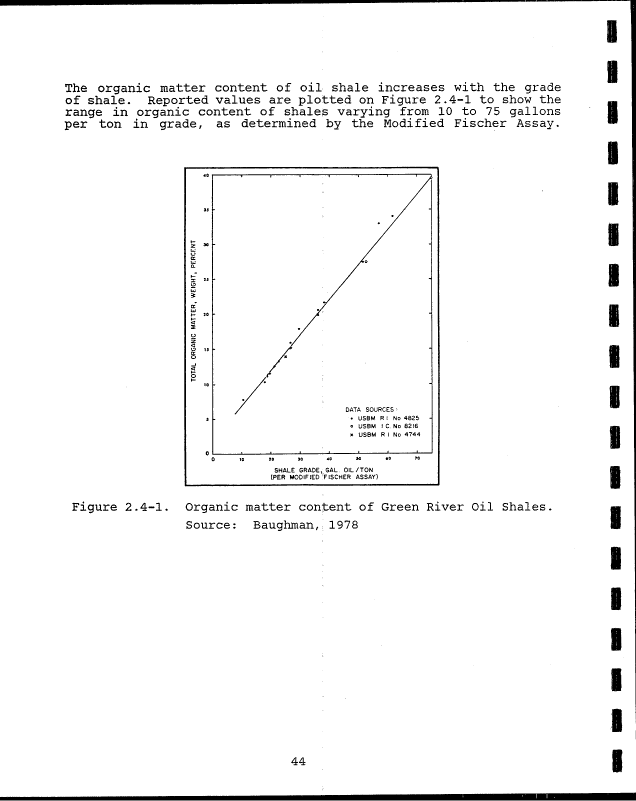
2.4-1 Organic matter content of Green River oil i
shales . 44
2.5-1 Specific gravity and oil yield of Colorado oil
shales 54
2.5-2 Compressive strength of oil shales 60
2.5-3 Compressive strength-versus Fischer assay of''
Colorado oil shale, Anvil Points Mine . . . i. 62
i
3.1-1 Lurgi-Ruhrgas oil shale retorting process . .I. 70
3.1-2 Lurgi-Ruhrgas Process operations and
waste streams 72
IX
image:
FIGURES
Number
2.2-1 Principal United States oil shale deposits. .1 . 24
2.2-2 Green River formation oil shales-Utah, !
Colorado, and Wyoming ] . 25
2.2-3 Distribution of upper Devonian and lower |
Mississippian Black Shales in the Eastern
United States | 27
2.3-1 Schematic North-South cross section of Piceanjse
Creek showing relationship of oil shale >l
bearing members of the Green River formation
and surrounding strata j 32
2.3-2 Schematic cross section of Uinta Basin showing
relationship of oil shale bearing Green River
formation with surrounding strata .....;. 34
2.3-3 Schematic cross section showing relationship of
Green River formation with surrounding strata 37
2.3-4 Oil yield of Tipton shale member. ..... .:. 38
i
i
2.3-5 Oil yield of Wilkins peak member 39
2.3-6 oil yield of Laney shale member ' . 40
2.4-1 Organic matter content of Green River oil i
shales . 44
2.5-1 Specific gravity and oil yield of Colorado oil
shales 54
2.5-2 Compressive strength of oil shales 60
2.5-3 Compressive strength-versus Fischer assay of''
Colorado oil shale, Anvil Points Mine . . . i. 62
i
3.1-1 Lurgi-Ruhrgas oil shale retorting process . .I. 70
3.1-2 Lurgi-Ruhrgas Process operations and
waste streams 72
IX
image:
 Number
39 — 1
. .& — X
3.2-2
3.3-1
30_0
. O £•
3.4-1
3.5-1
3.5-2
•3 fi-l
*J * U JL
3.7-1
3.7-2
O O *|
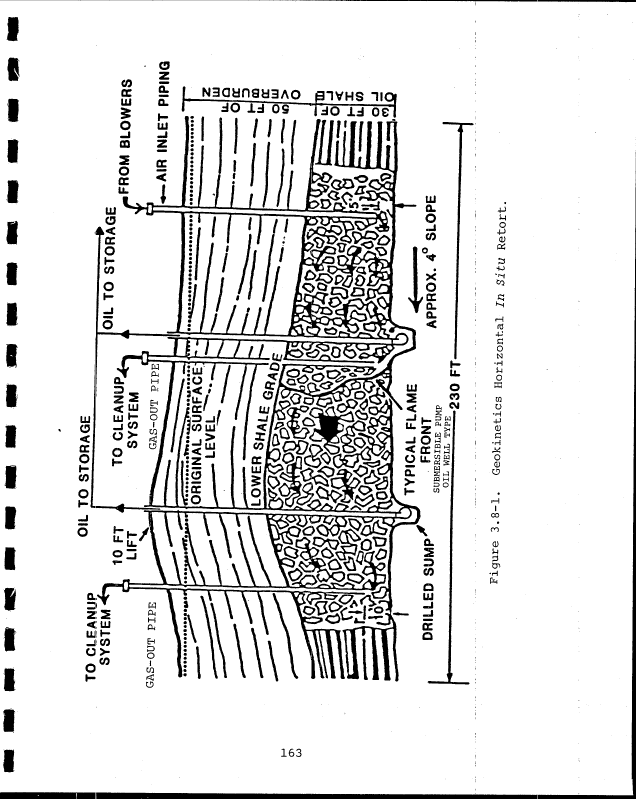
3.8-2
3.9-1
3Q — 9
. ;? <£
3.9-3
31 0—1
• X U X
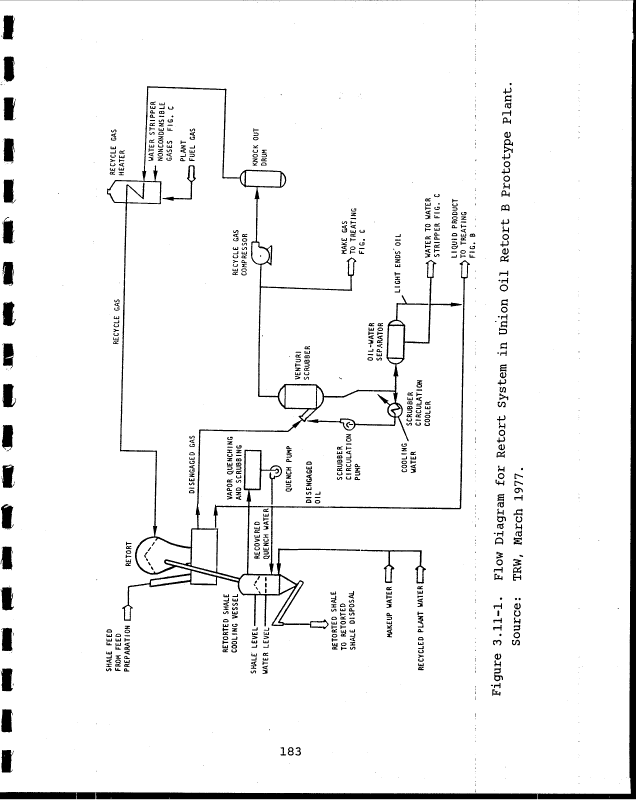
3.11-1
3.11-2
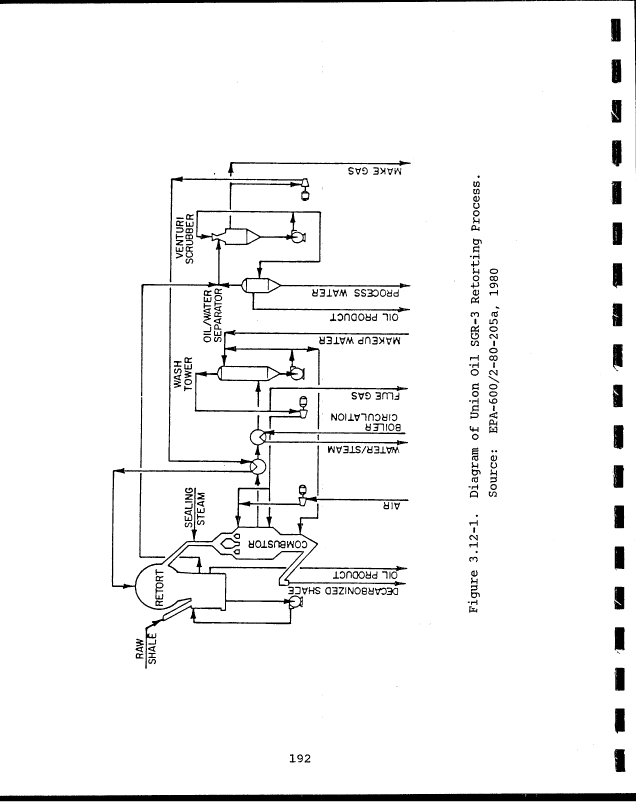
3.12-1
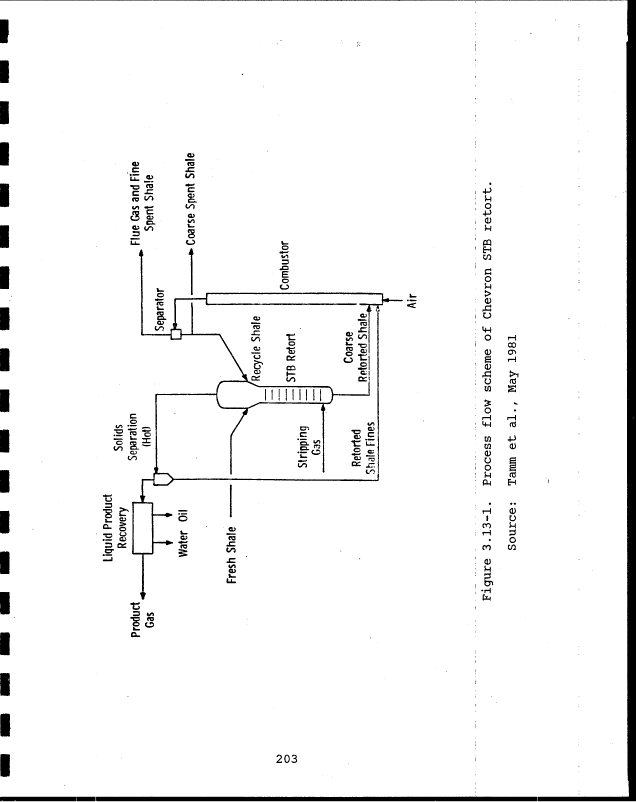
3.13-1
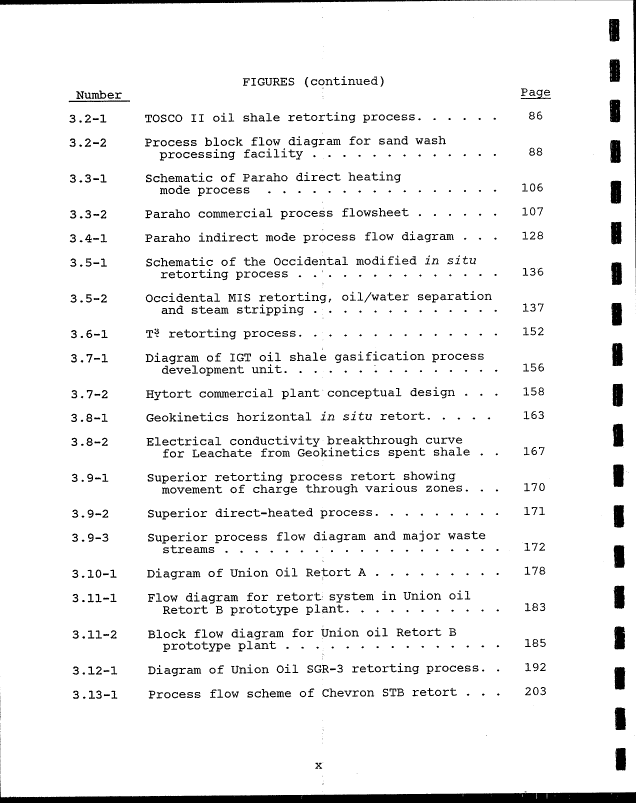
FIGURES (continued)
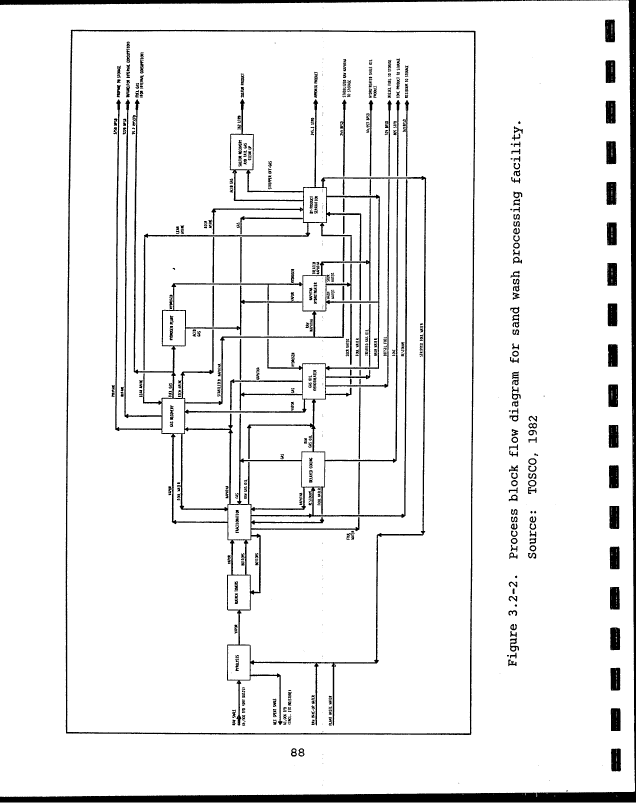
Process block flow diagram for sand wash
Schematic of Paraho direct heating
Paraho indirect mode process flow diagram . . .
Schematic of the Occidental modified in situ
Occidental MIS retorting, oil/water separation
Diagram of IGT oil shale gasification process
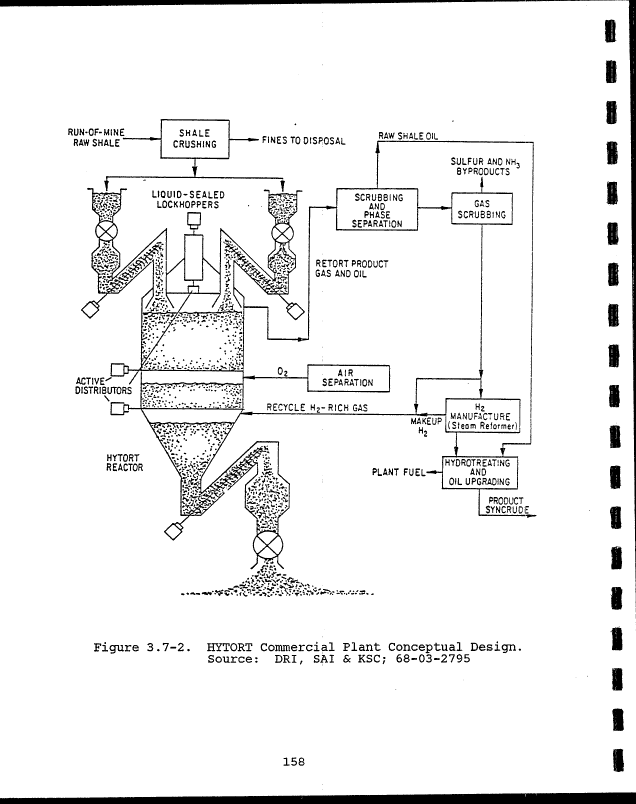
Hytort commercial plant conceptual design . . .
Electrical conductivity breakthrough curve
for Leachate from Geokinetics spent shale . .
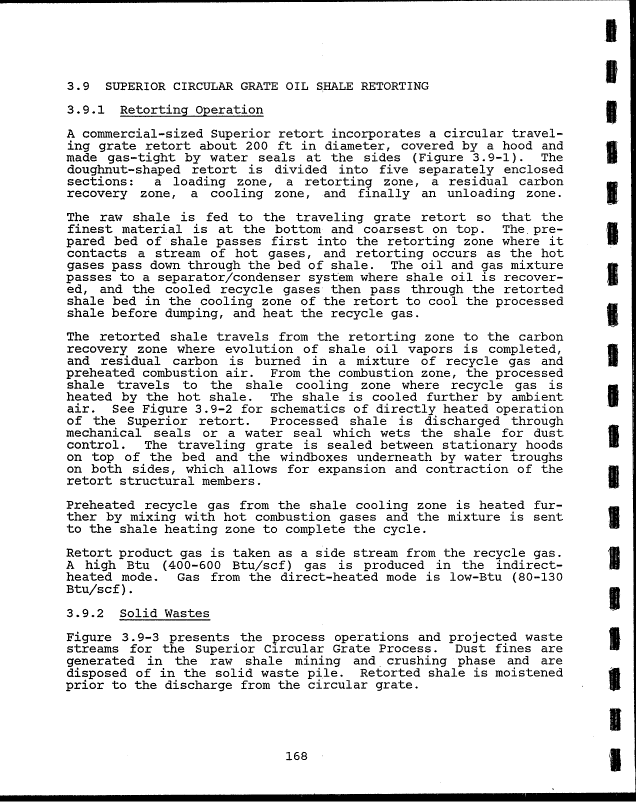
Superior retorting process retort showing
movement of charge through various zones. . .
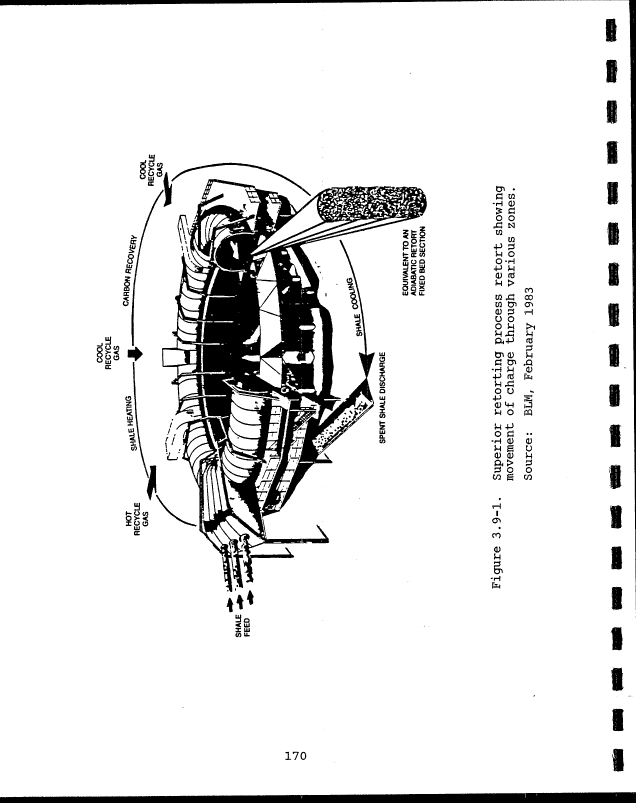
Superior process flow diagram and major waste
Flow diagram for retort! system in Union oil
Block flow diagram for Union oil Retort B
Diagram of Union Oil SGR-3 retorting process. .
Process flow scheme of Chevron STB retort . . .
X
Page
86
88
106
107
128
136
137
152
156
158
163
167
170
171
172
178
183
185
192
203
1
1
1
flB
1
1
1
1
•
I
^•v
1
*
1
1
image:
Number
39 — 1
. .& — X
3.2-2
3.3-1
30_0
. O £•
3.4-1
3.5-1
3.5-2
•3 fi-l
*J * U JL
3.7-1
3.7-2
O O *|
3.8-2
3.9-1
3Q — 9
. ;? <£
3.9-3
31 0—1
• X U X
3.11-1
3.11-2
3.12-1
3.13-1
FIGURES (continued)
Process block flow diagram for sand wash
Schematic of Paraho direct heating
Paraho indirect mode process flow diagram . . .
Schematic of the Occidental modified in situ
Occidental MIS retorting, oil/water separation
Diagram of IGT oil shale gasification process
Hytort commercial plant conceptual design . . .
Electrical conductivity breakthrough curve
for Leachate from Geokinetics spent shale . .
Superior retorting process retort showing
movement of charge through various zones. . .
Superior process flow diagram and major waste
Flow diagram for retort! system in Union oil
Block flow diagram for Union oil Retort B
Diagram of Union Oil SGR-3 retorting process. .
Process flow scheme of Chevron STB retort . . .
X
Page
86
88
106
107
128
136
137
152
156
158
163
167
170
171
172
178
183
185
192
203
1
1
1
flB
1
1
1
1
•
I
^•v
1
*
1
1
image:
 FIGURES (continued)
Number
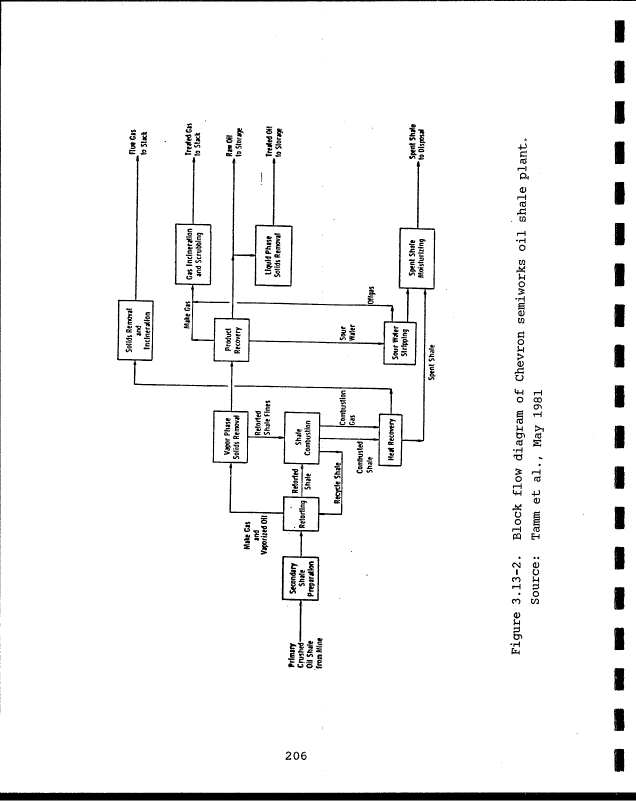
3.13-2 Block flow diagram of Chevron semiworks oil !
shale plant '. 206
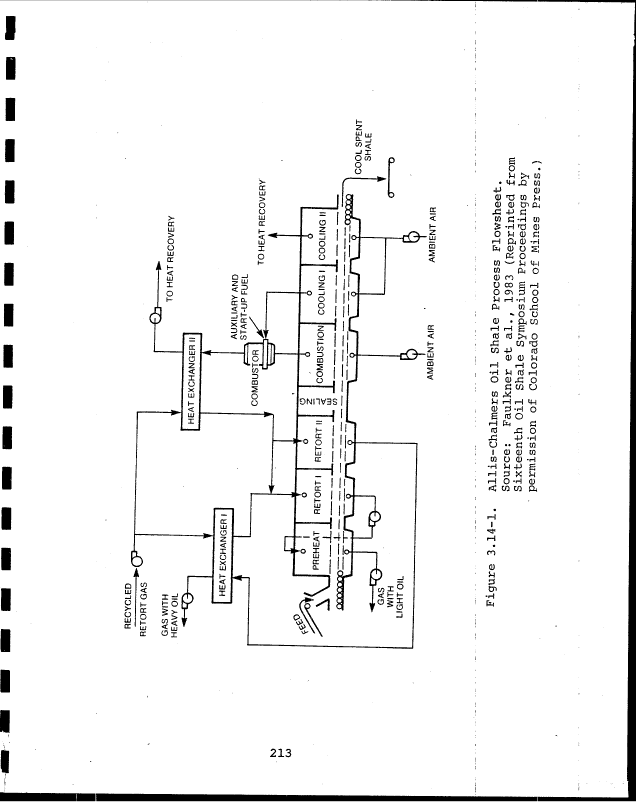
3.14-1 Allis-Chalmers oil shale process flowsheet. . . 213
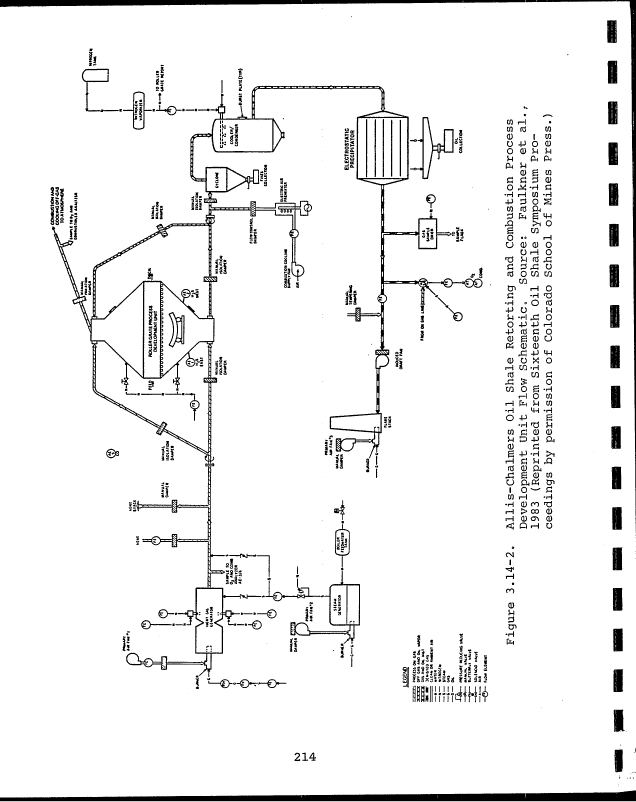
3.14-2 Allis-Chalmers oil shale retorting and combustion
process development unit flow schematic .... 214
i
3.15-1 Dravo retorting process . , . 216
3.15-2 Dravo pilot plant flowsheet schematic .-..].. 218
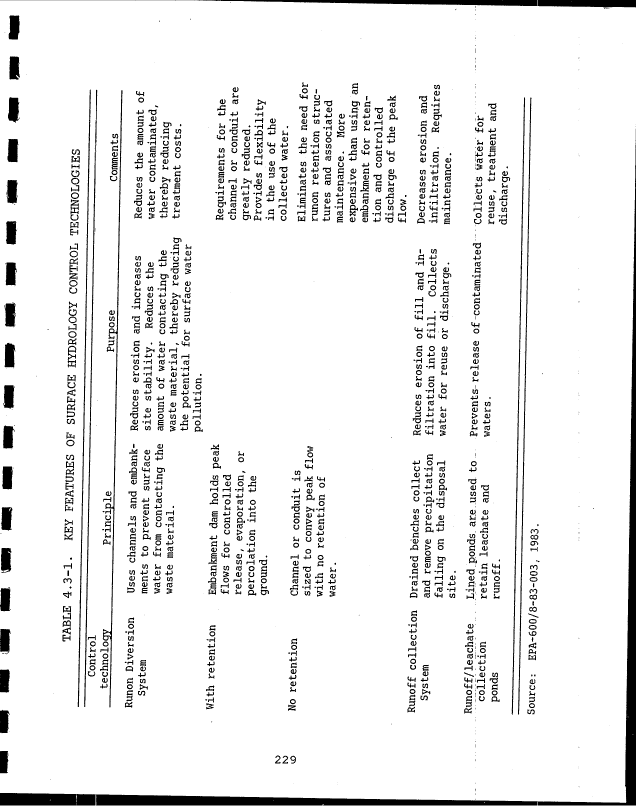
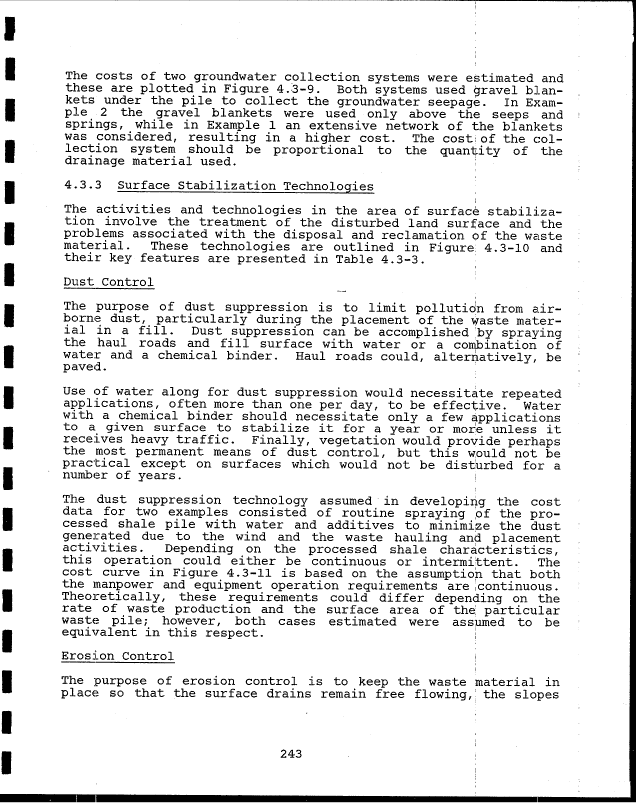
4.3-1 Surface hydrology control technologies. .. . 1 . 228
4.3-2 Runon diversion costs 1 231
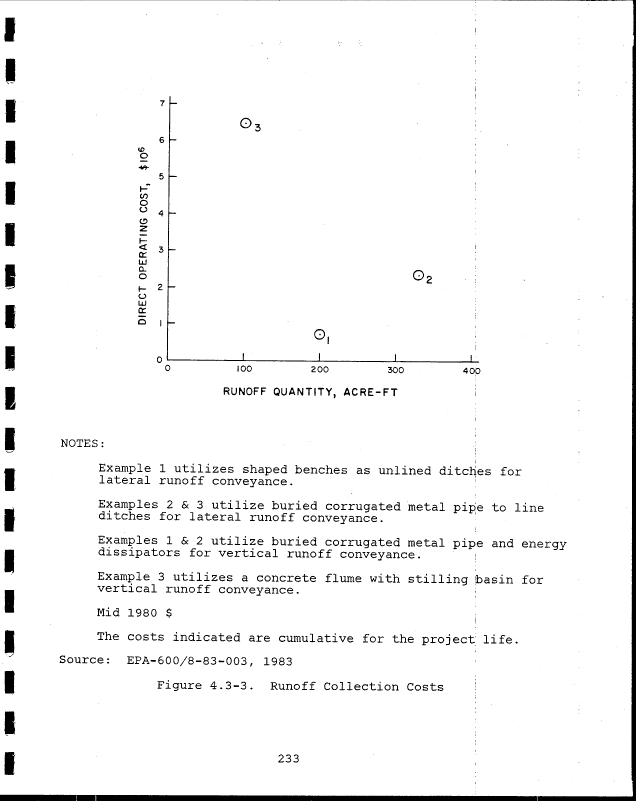
4.3-3 Runoff collection costs [ 233
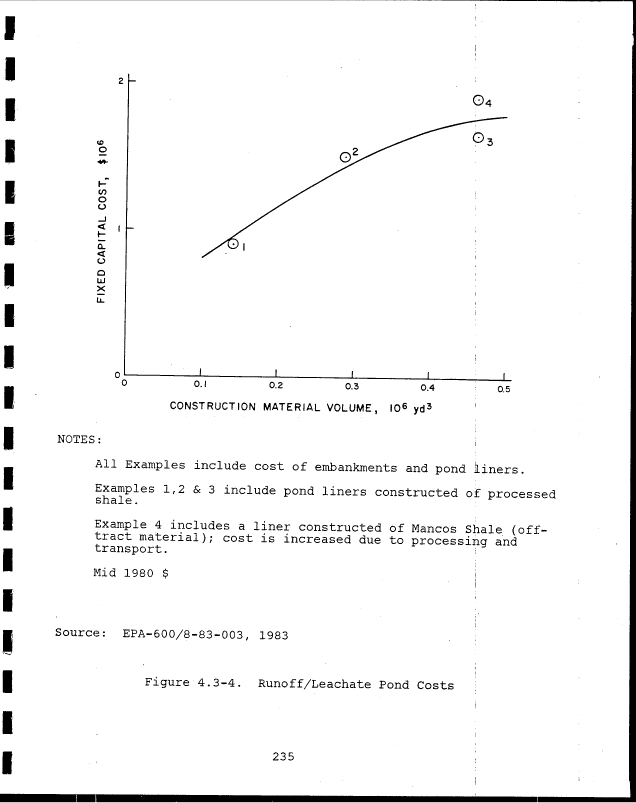
4.3-4 Runoff/leachate pond costs : 235
4.3-5 Runoff/leachate pond liner costs 236
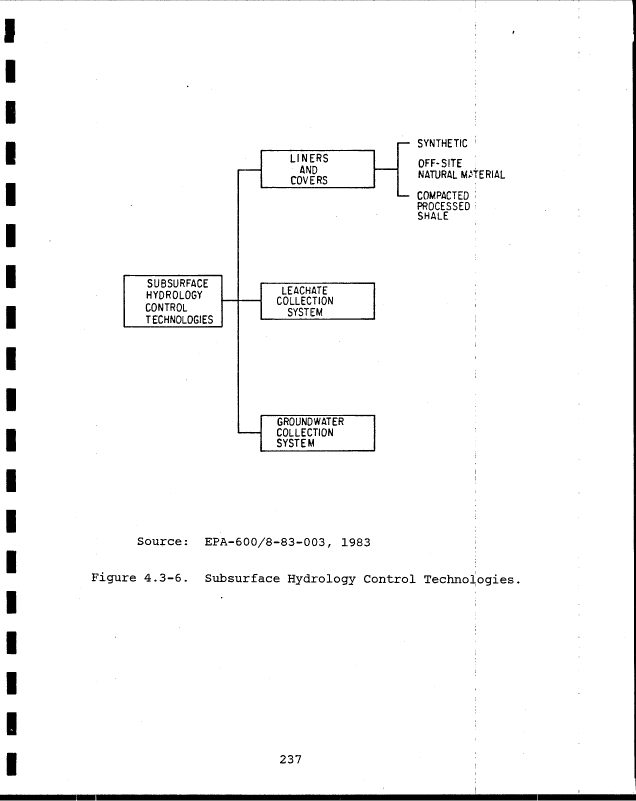
4.3-6 Subsurface hydrology control technologies . j . 237
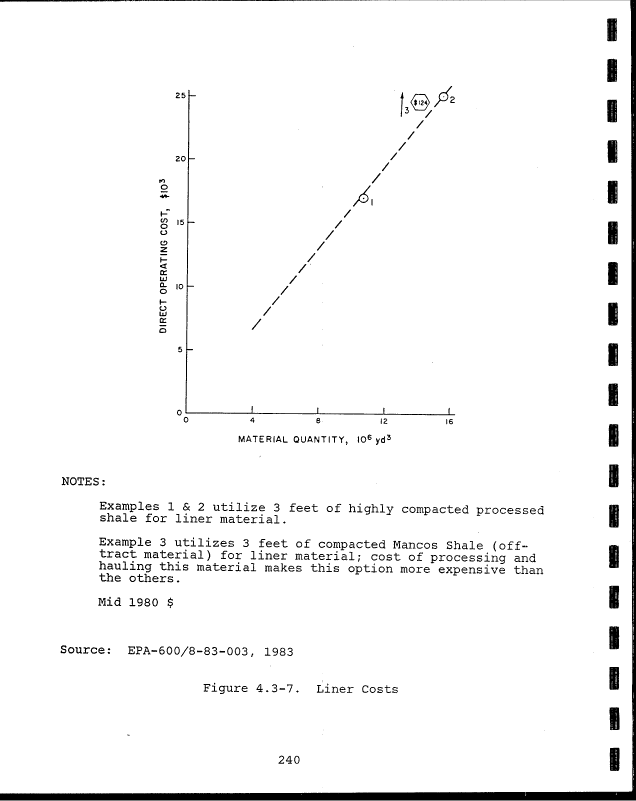
4.3-7 Liner costs j 240
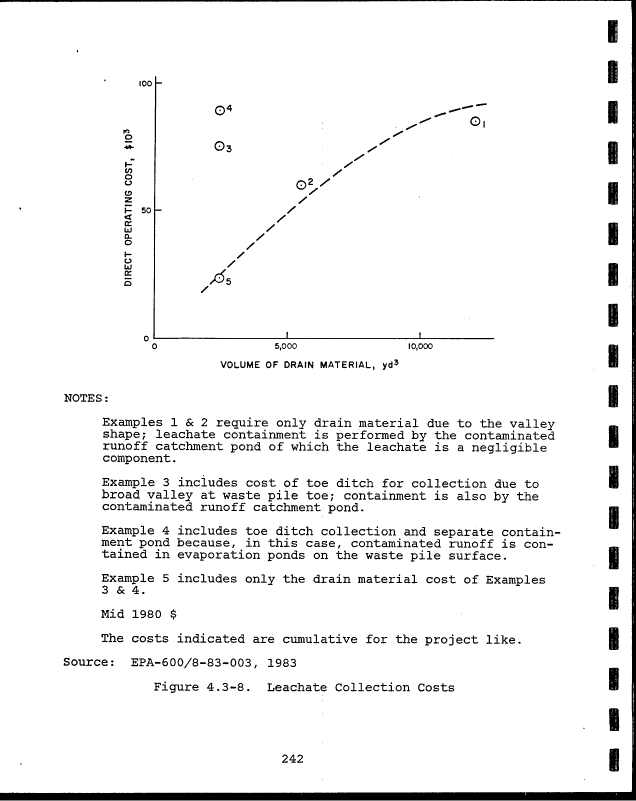
4.3-8 Leachate collection costs -. ! 242
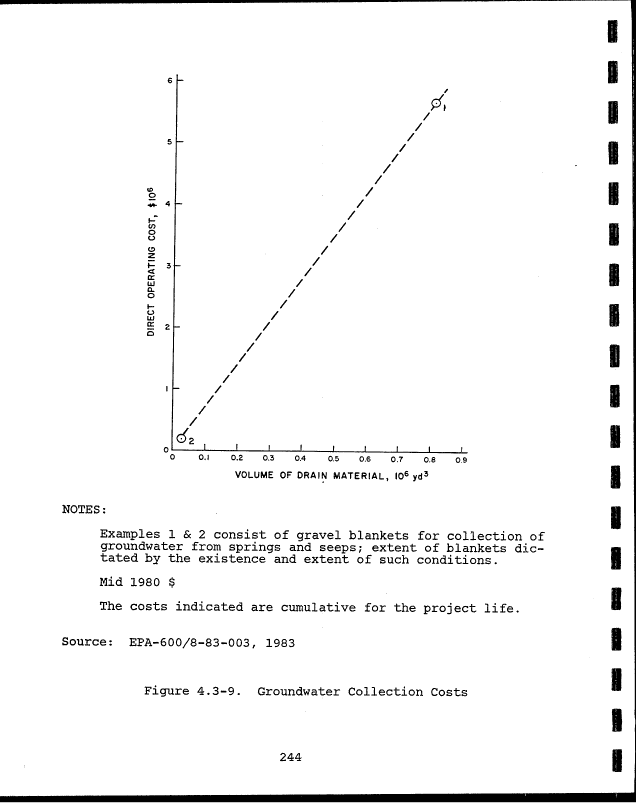
4.3-9 Groundwater collection costs ! . ' 244
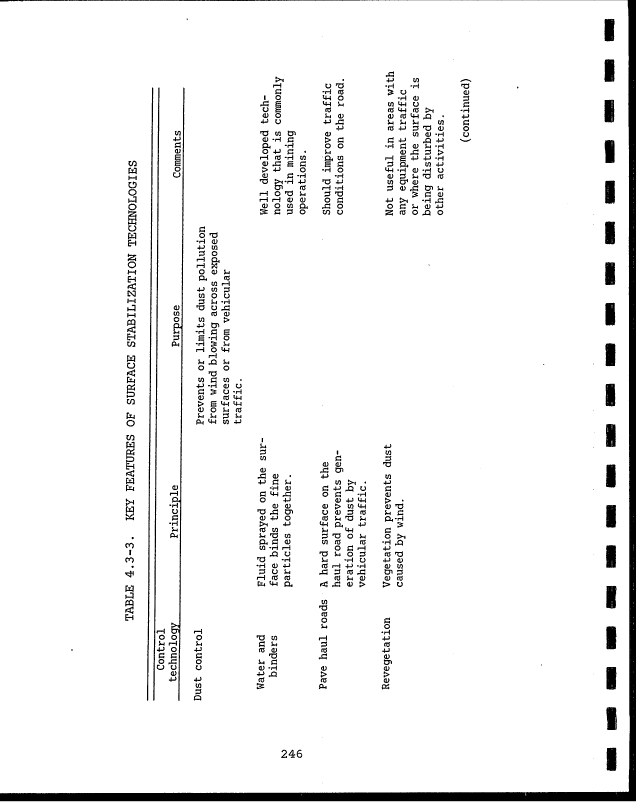
4.3-10 Surface stabilization technologies j 245
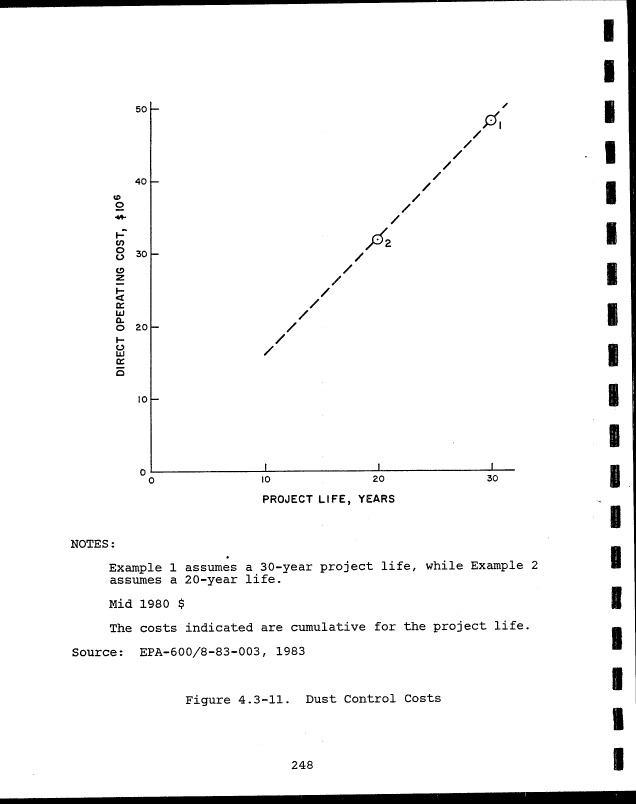
4.3-11 Dust control costs ; 248
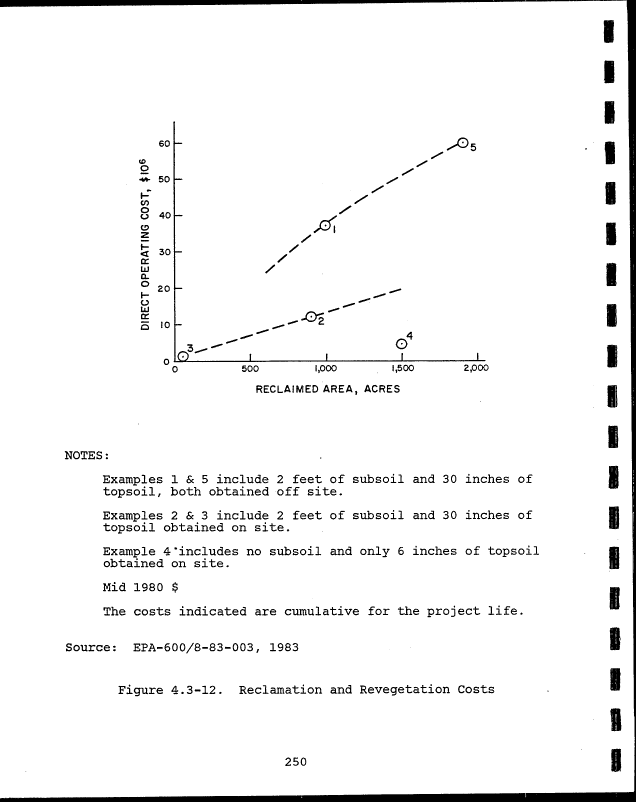
4.3-12 Reclamation and revegetation costs ! . 250
XI
image:
FIGURES (continued)
Number
3.13-2 Block flow diagram of Chevron semiworks oil !
shale plant '. 206
3.14-1 Allis-Chalmers oil shale process flowsheet. . . 213
3.14-2 Allis-Chalmers oil shale retorting and combustion
process development unit flow schematic .... 214
i
3.15-1 Dravo retorting process . , . 216
3.15-2 Dravo pilot plant flowsheet schematic .-..].. 218
4.3-1 Surface hydrology control technologies. .. . 1 . 228
4.3-2 Runon diversion costs 1 231
4.3-3 Runoff collection costs [ 233
4.3-4 Runoff/leachate pond costs : 235
4.3-5 Runoff/leachate pond liner costs 236
4.3-6 Subsurface hydrology control technologies . j . 237
4.3-7 Liner costs j 240
4.3-8 Leachate collection costs -. ! 242
4.3-9 Groundwater collection costs ! . ' 244
4.3-10 Surface stabilization technologies j 245
4.3-11 Dust control costs ; 248
4.3-12 Reclamation and revegetation costs ! . 250
XI
image:
 Number
1 1-1
JL. * J. JL
1 1 — 9
J. * J."*j£
1 1 — ^
J. * JL *>
1.1-4
1.2-1
1.2-2
1.2-3
1.2-4
1.2-5
1.2-6
1.2-7
1.2-8
1.3-1
2.2-1
TABLES
; Page
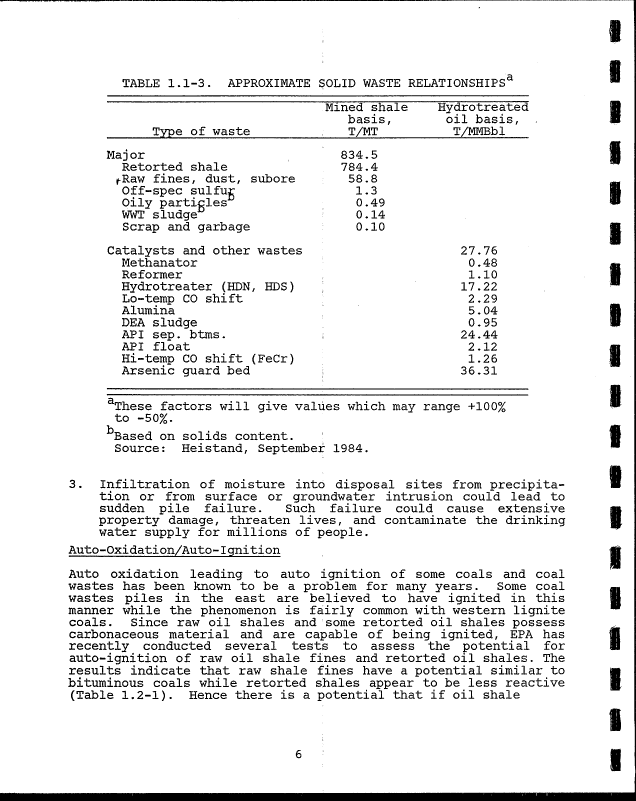
Antrrnx n matp Solid Waste Relationships 6
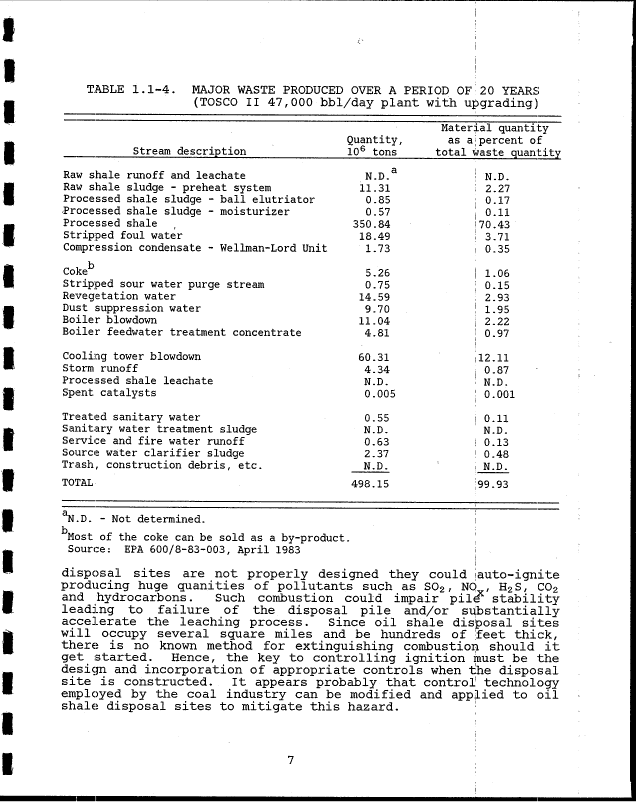
Major Waste Produced Over a Period of 20 Years
(TOSCO II 47,000 bbl/day plant with upgrading) 7
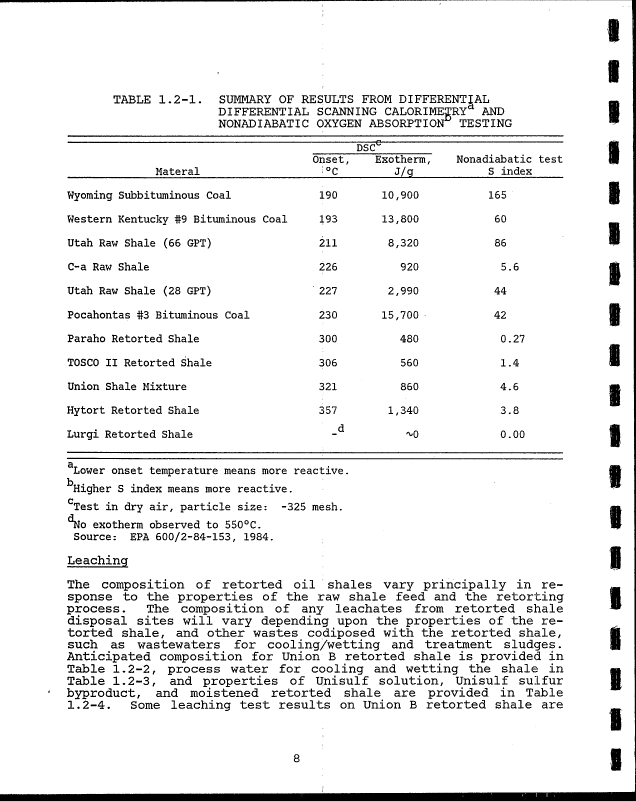
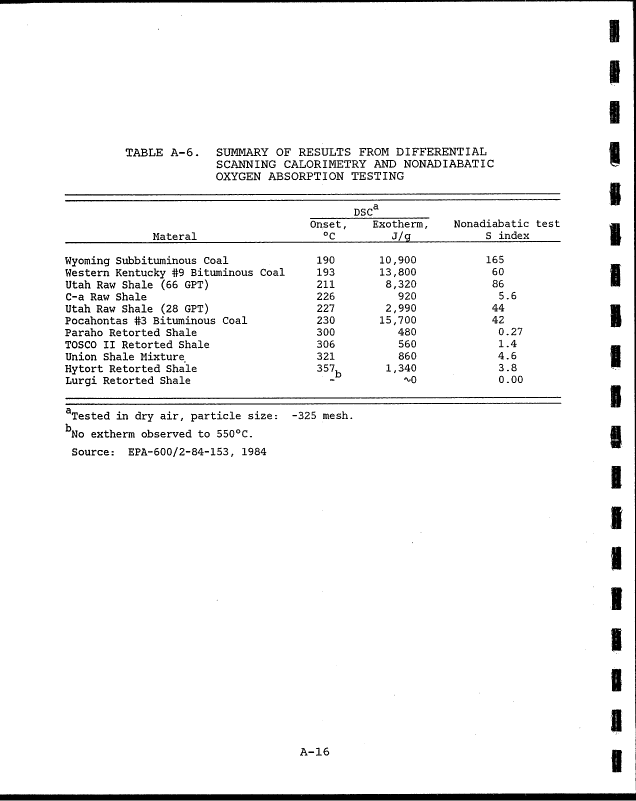
Summary of Results from Differential Scanning
Calorimetry and Nonadiabatic Oxygen
Chemical Properties of Union B Retorted Shale . 9
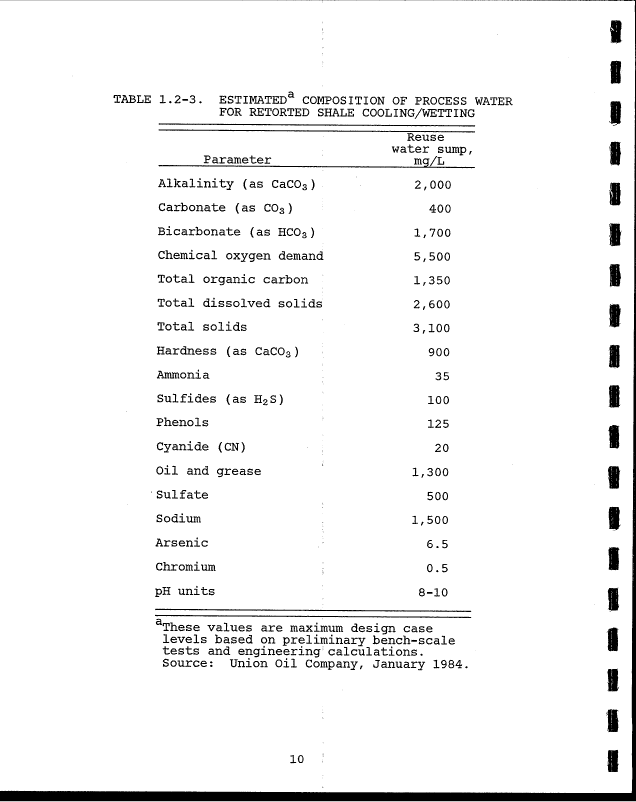
Estimated Composition of Process Water for
P(=t"OT~"t"(=f^ ^Vial*3 Pool "i ncr/Wp't'T'i ncr ...... 10
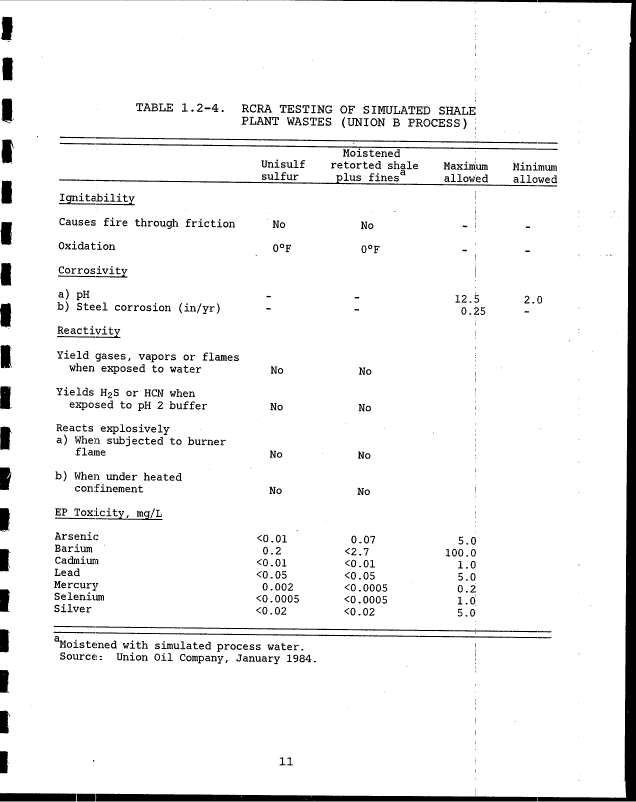
RCRA Testing of Simulated Shale Plant Wastes
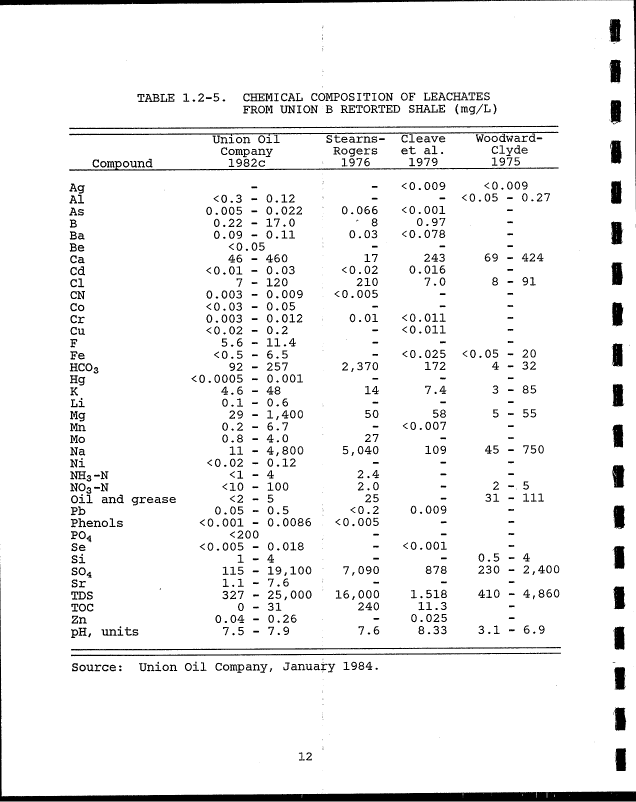
Chemical Composition of Leachates from Union B
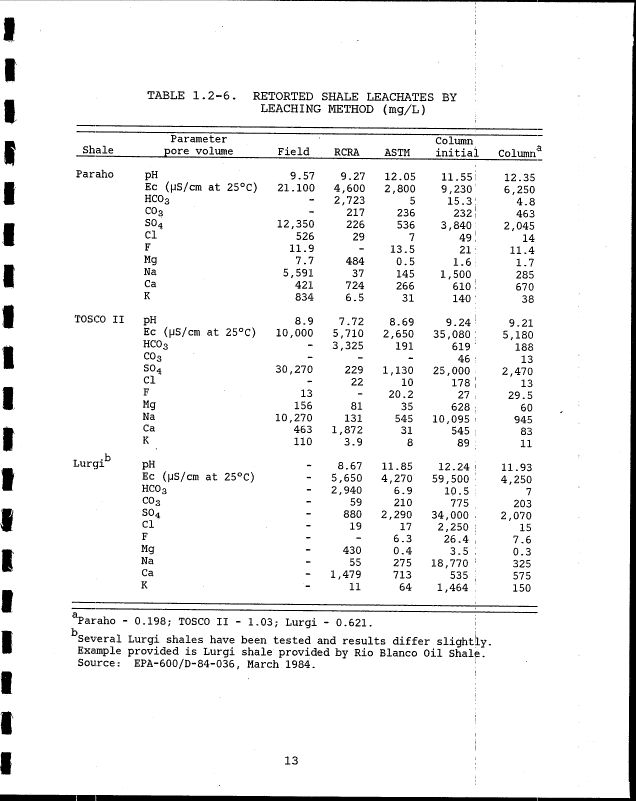
Retorted Shale Leachates by Leaching Method
(ma/L) 13
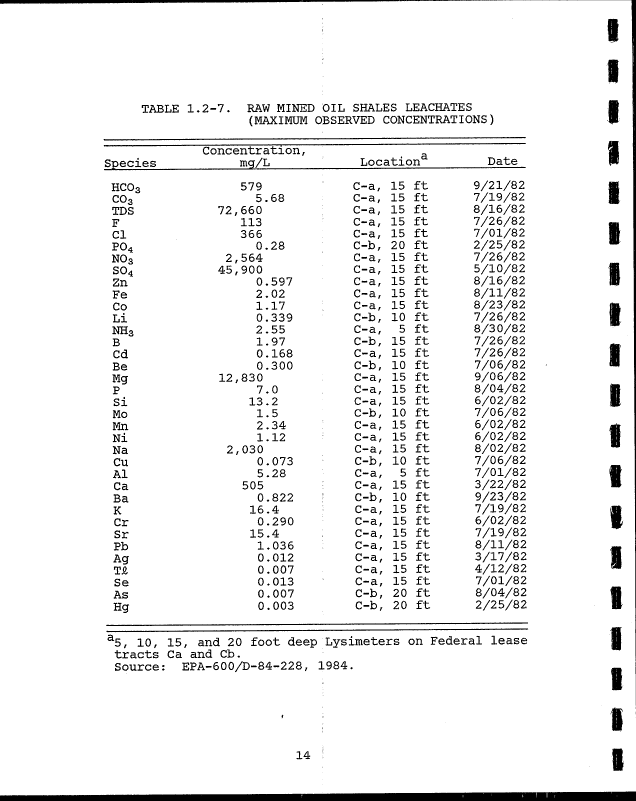
Raw Mined Oil Shales Leachates (Maximum
Estimated Quantities of Some Major Constituents
Leachable from Oil Shale (Assuming
Permeability and Water Availability are not
Key Features of Solid Waste Disposal Approaches 18
Total In-Place Shale Oil Resources of the
xii
1
1
1
1
I
w
1
W
I
1
1
1
image:
Number
1 1-1
JL. * J. JL
1 1 — 9
J. * J."*j£
1 1 — ^
J. * JL *>
1.1-4
1.2-1
1.2-2
1.2-3
1.2-4
1.2-5
1.2-6
1.2-7
1.2-8
1.3-1
2.2-1
TABLES
; Page
Antrrnx n matp Solid Waste Relationships 6
Major Waste Produced Over a Period of 20 Years
(TOSCO II 47,000 bbl/day plant with upgrading) 7
Summary of Results from Differential Scanning
Calorimetry and Nonadiabatic Oxygen
Chemical Properties of Union B Retorted Shale . 9
Estimated Composition of Process Water for
P(=t"OT~"t"(=f^ ^Vial*3 Pool "i ncr/Wp't'T'i ncr ...... 10
RCRA Testing of Simulated Shale Plant Wastes
Chemical Composition of Leachates from Union B
Retorted Shale Leachates by Leaching Method
(ma/L) 13
Raw Mined Oil Shales Leachates (Maximum
Estimated Quantities of Some Major Constituents
Leachable from Oil Shale (Assuming
Permeability and Water Availability are not
Key Features of Solid Waste Disposal Approaches 18
Total In-Place Shale Oil Resources of the
xii
1
1
1
1
I
w
1
W
I
1
1
1
image:
 TABLES (continued)
Number
! Page
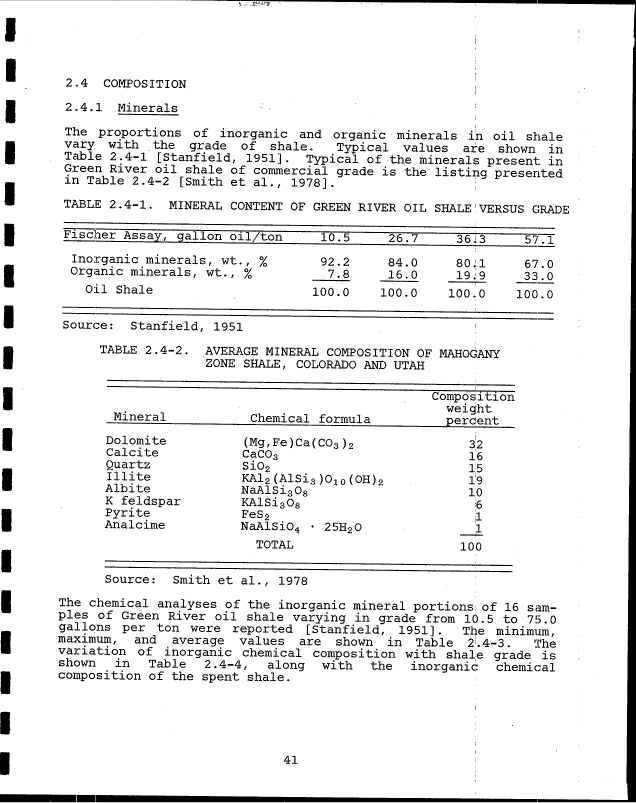
2.4-1 Mineral Content bf Green River Oil Shale !
Versus Grade. , 41
2.4-2 Average Mineral Composition of Mahogany Zone1
Shale, Colorado and Utah j 41
2.4-3 Fischer Assay Data of the Inorganic Mineral '
Portions of 16 Samples of Green River Oil
Shale Ranging From 10.5 To 75.0 gal/ton Oil
Shale ......... !
42
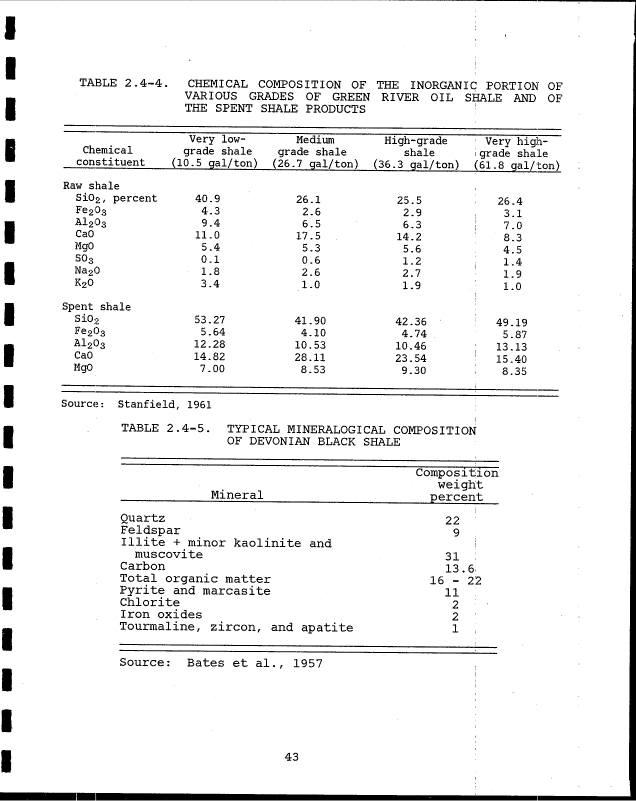
2.4-4 Chemical Composition of the Inorganic Portiori
of Various Grades of Green River Oil Shale '
and of The Spent Shale Products ; 43
2.4-5 Typical Mineralogical Composition of Devoniari
Black Shale ! 43
!
2.4-6 Probable Composition of Mahogany-Zone Organic
Matter . .' . 45
2.4-7 Elemental Composition of New Albany Shale ;
Organic Matter : 45
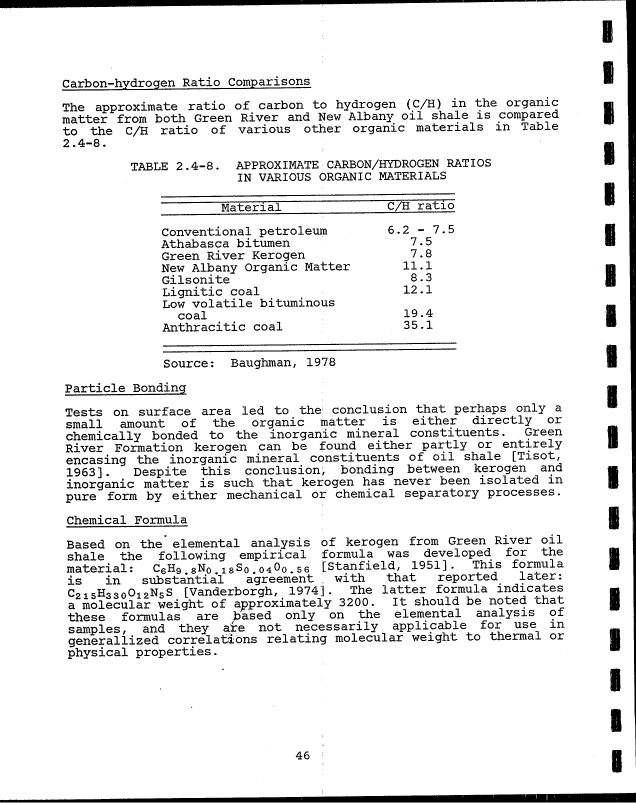
2.4-8 Approximate Carbon/Hydrogen Ratios in Various
Organic Materials 45
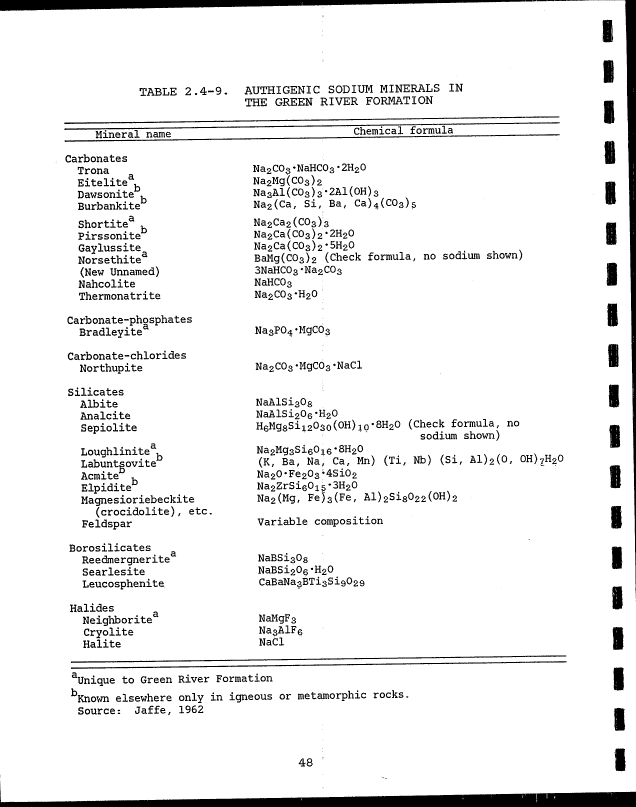
2.4-9 Authigenic Sodium Minerals In The Green River'
Formation j 48
!
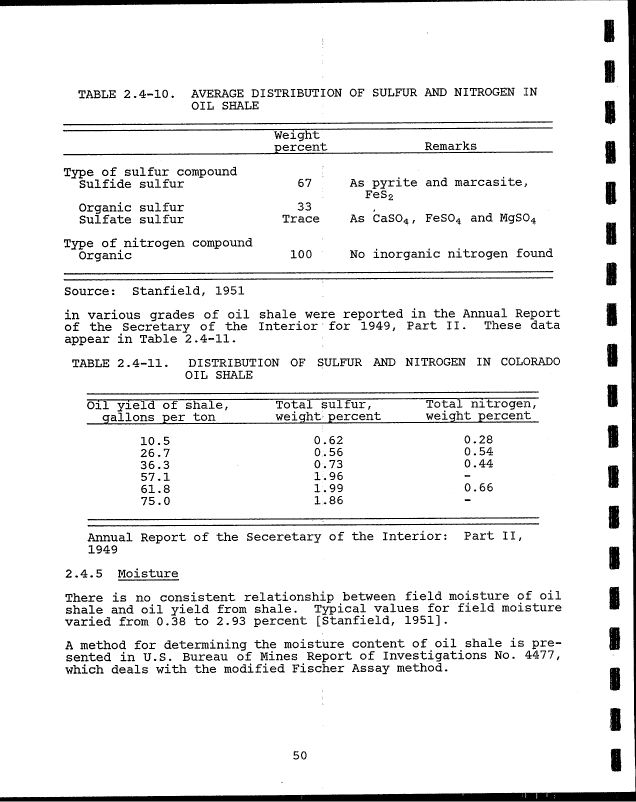
2.4-10 Average Distribution of Sulfur and Nitrogen In
Oil Shale ! . .: . 50
2.4-11 Distribution of Sulfur and Nitrogen in ;
Colorado Oil Shale 50
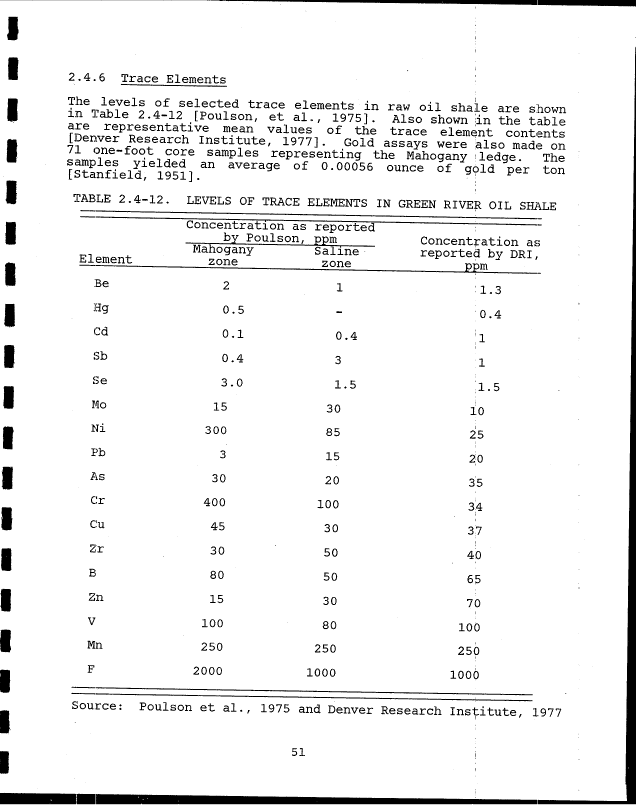
2.4-12 Levels of Trace Elements in Green River Oil I
Shale , ^ 51
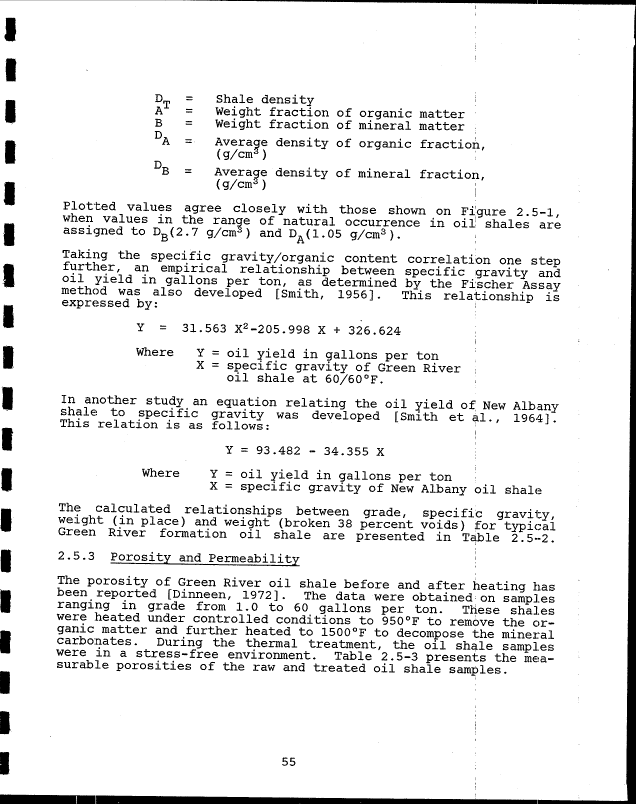
2.5-1 Visual Features of Green River Oil Shale. . .I. 53
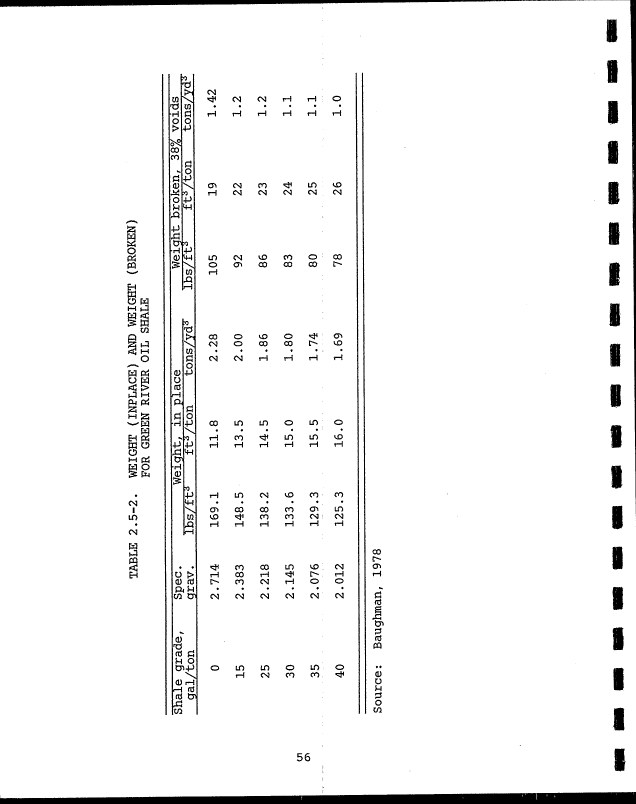
2.5-2 Weight (Inplace) and Weight (Broken) for Green
River Oil Shale' :. 55
2.5-3 Porosities of Raw and Thermally Treated Oil '
Shales (Percent of Bulk Volumes) ;. 57
Kill
image:
TABLES (continued)
Number
! Page
2.4-1 Mineral Content bf Green River Oil Shale !
Versus Grade. , 41
2.4-2 Average Mineral Composition of Mahogany Zone1
Shale, Colorado and Utah j 41
2.4-3 Fischer Assay Data of the Inorganic Mineral '
Portions of 16 Samples of Green River Oil
Shale Ranging From 10.5 To 75.0 gal/ton Oil
Shale ......... !
42
2.4-4 Chemical Composition of the Inorganic Portiori
of Various Grades of Green River Oil Shale '
and of The Spent Shale Products ; 43
2.4-5 Typical Mineralogical Composition of Devoniari
Black Shale ! 43
!
2.4-6 Probable Composition of Mahogany-Zone Organic
Matter . .' . 45
2.4-7 Elemental Composition of New Albany Shale ;
Organic Matter : 45
2.4-8 Approximate Carbon/Hydrogen Ratios in Various
Organic Materials 45
2.4-9 Authigenic Sodium Minerals In The Green River'
Formation j 48
!
2.4-10 Average Distribution of Sulfur and Nitrogen In
Oil Shale ! . .: . 50
2.4-11 Distribution of Sulfur and Nitrogen in ;
Colorado Oil Shale 50
2.4-12 Levels of Trace Elements in Green River Oil I
Shale , ^ 51
2.5-1 Visual Features of Green River Oil Shale. . .I. 53
2.5-2 Weight (Inplace) and Weight (Broken) for Green
River Oil Shale' :. 55
2.5-3 Porosities of Raw and Thermally Treated Oil '
Shales (Percent of Bulk Volumes) ;. 57
Kill
image:
 I
I
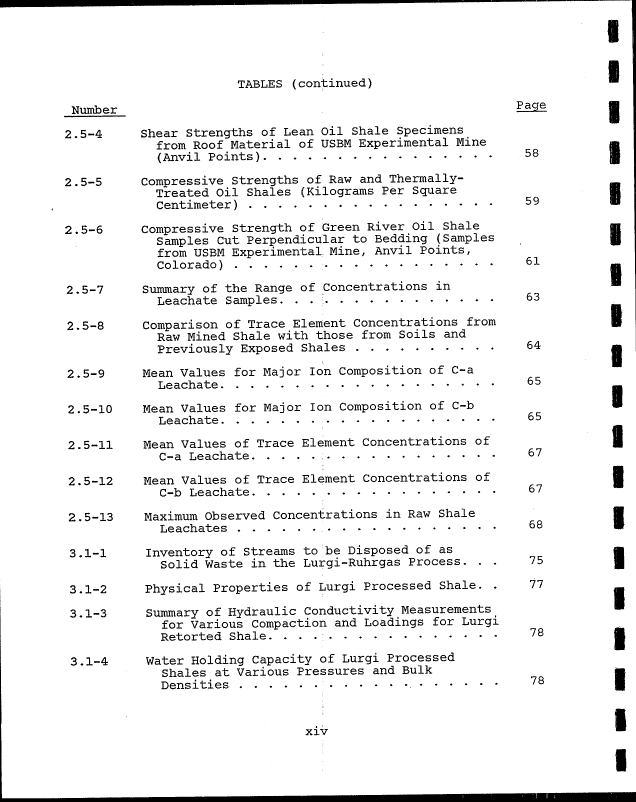
TABLES (continued) "
Number Z^ge ffi
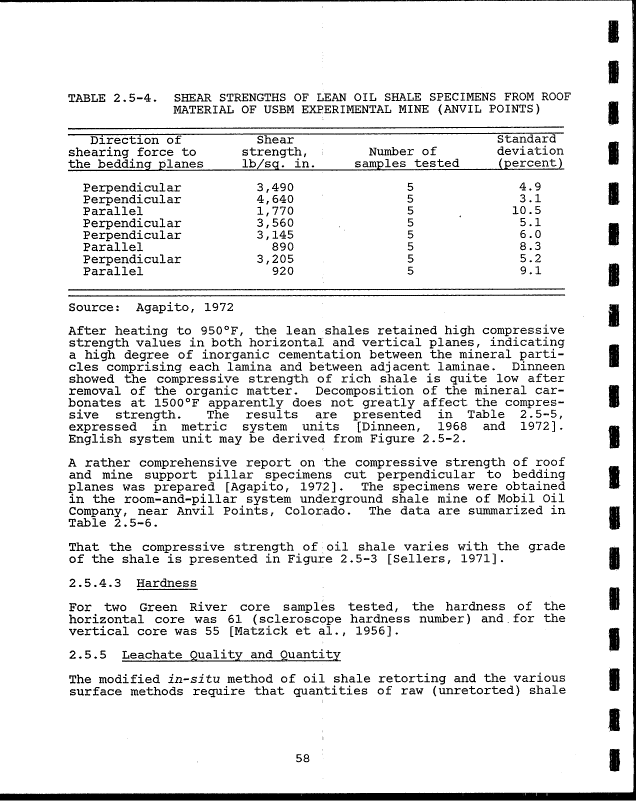
2.5-4 Shear Strengths of Lean Oil Shale Specimens
from Roof Material of USBM Experimental Mine n
(Anvil Points). 58 p
2.5-5 Compressive Strengths of Raw and Thermally-
Treated Oil Shales (Kilograms Per Square •
Centimeter) 59 ™
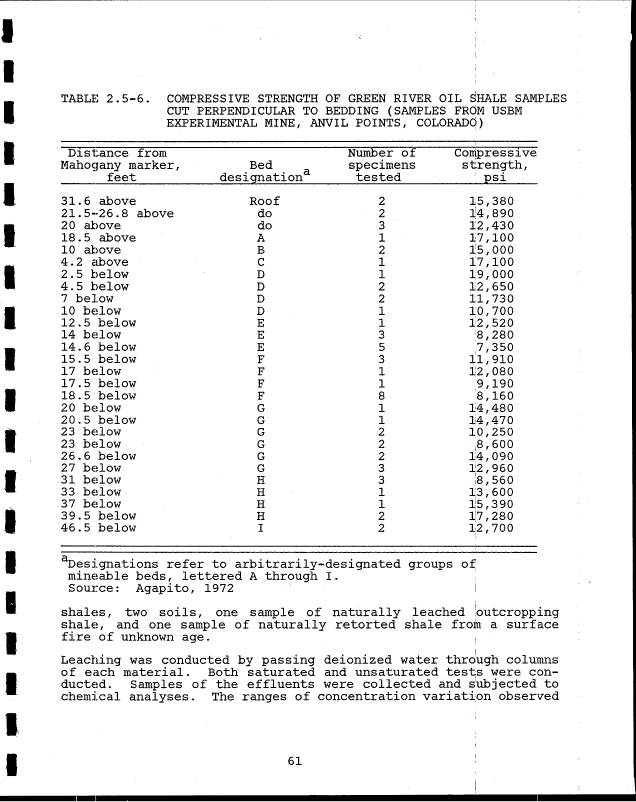
2.5-6 Compressive Strength of Green River Oil Shale en
Samples Cut Perpendicular to Bedding (Samples H
from USBM Experimental Mine, Anvil Points,
Colorado) 61 _
1
2.5-7 Summary of the Range of Concentrations in m
Leachate Samples. . . j 63
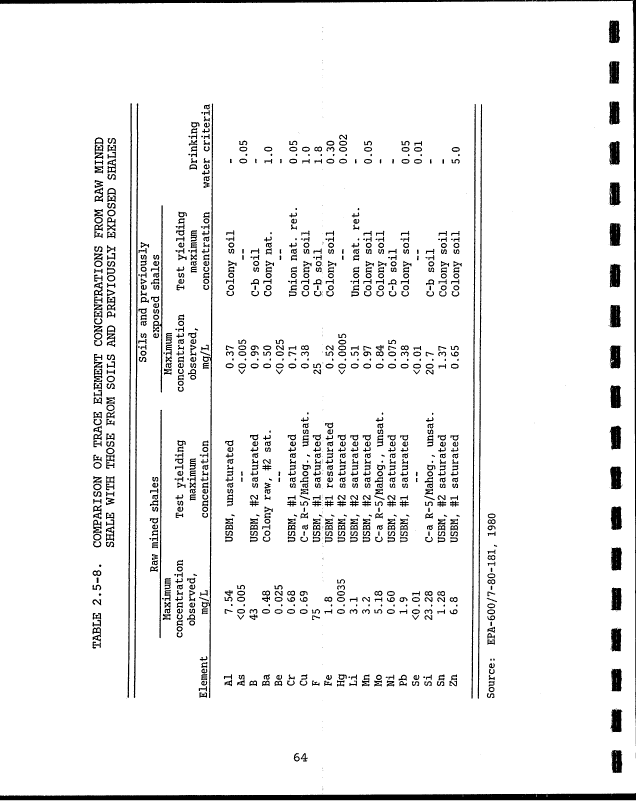
2.5-8 Comparison of Trace Element Concentrations from B
Raw Mined Shale with those from Soils and
Previously Exposed Shales 64 am
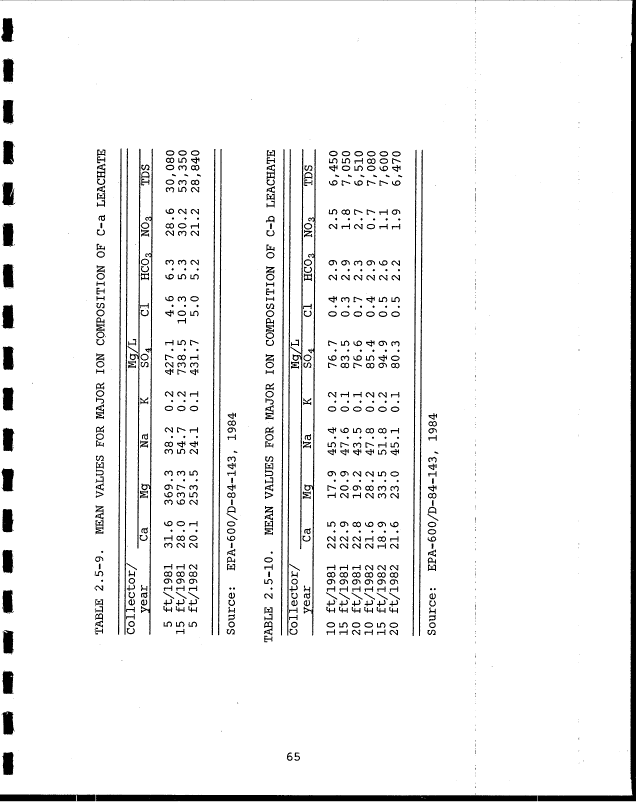
2.5-9 Mean Values for Major Ion Composition of C-a
Leachate 65
2.5-10 Mean Values for Major Ion Composition of C-b •
Leachate 65
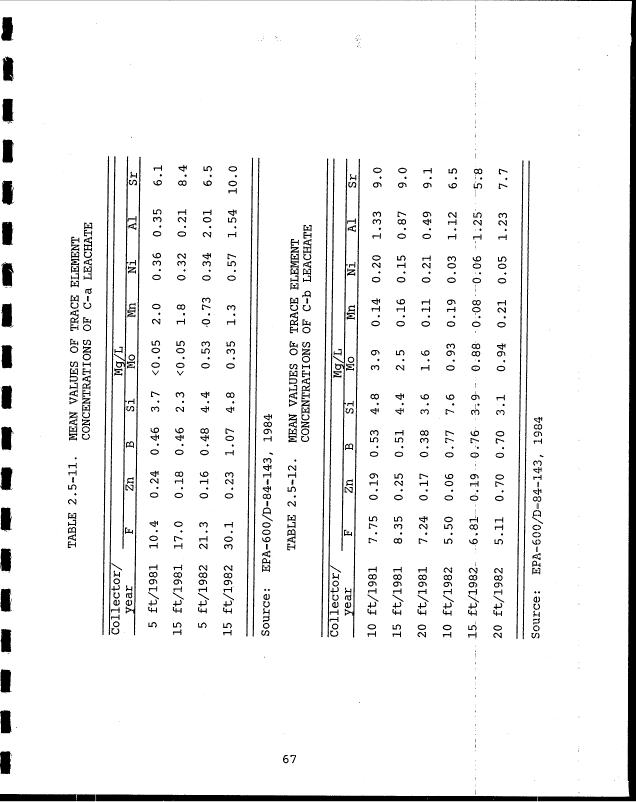
2.5-11 Mean Values of Trace Element Concentrations of |
C-a Leachate ; 67
2.5-12 Mean Values of Trace Element Concentrations of J|
C-b Leachate 67
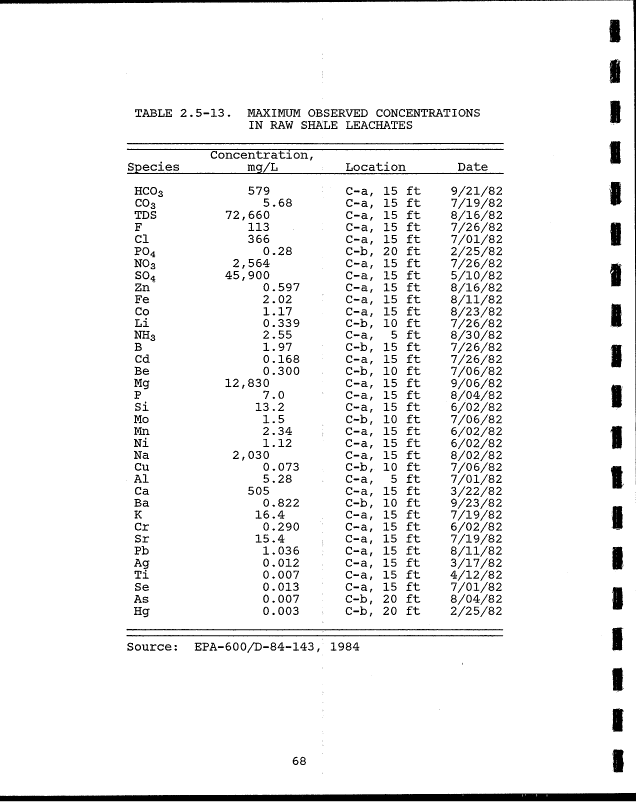
2.5-13 Maximum Observed Concentrations in Raw Shale •
Leachates 68 V
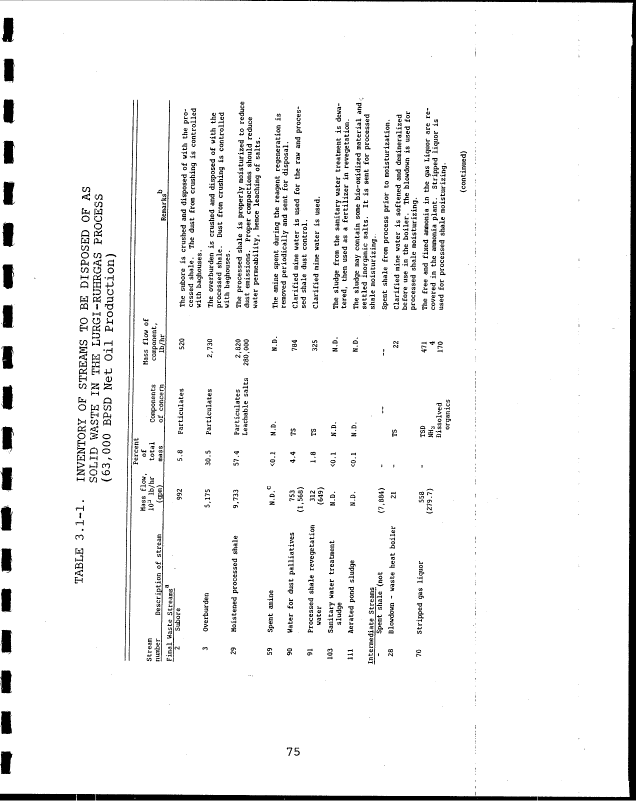
3.1-1 Inventory of Streams to be Disposed of as «
Solid Waste in the Lurgi-Ruhrgas Process. . . 75 g
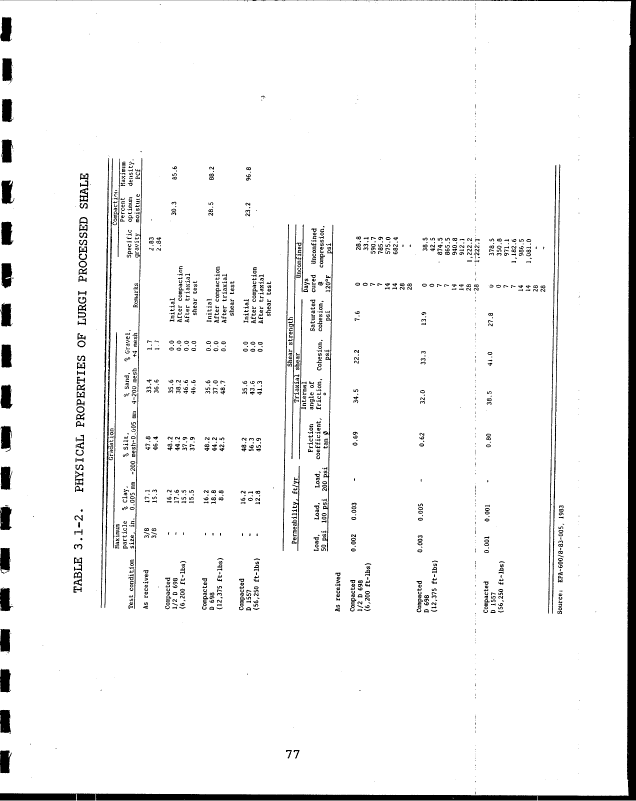
3.1-2 Physical Properties of Lurgi Processed Shale. . 77
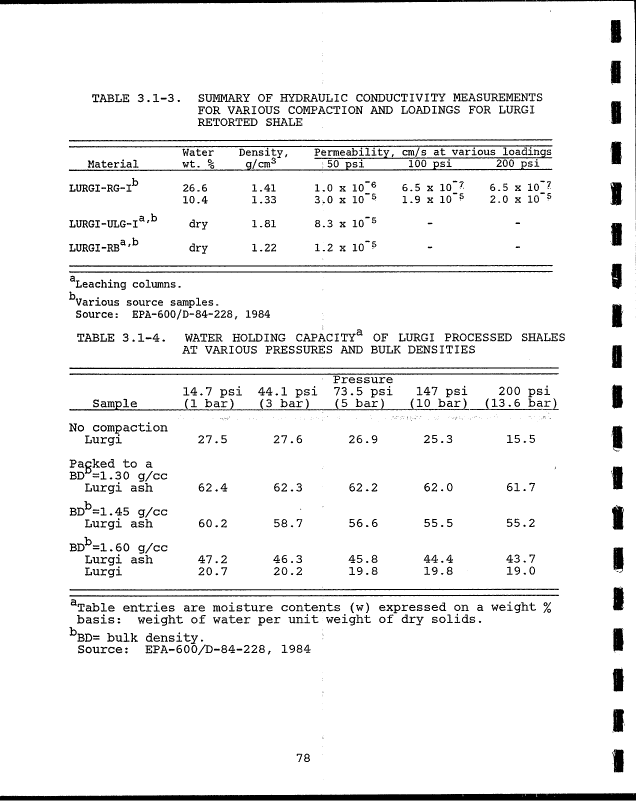
3.1-3 Summary of Hydraulic Conductivity Measurements •
for Various Compaction and Loadings for Lurgi
Retorted Shale. 78 •
3.1-4 Water Holding Capacity of Lurgi Processed
Shales at Various Pressures and Bulk m
Densities 78 I
xiv
I
I
image:
I
I
TABLES (continued) "
Number Z^ge ffi
2.5-4 Shear Strengths of Lean Oil Shale Specimens
from Roof Material of USBM Experimental Mine n
(Anvil Points). 58 p
2.5-5 Compressive Strengths of Raw and Thermally-
Treated Oil Shales (Kilograms Per Square •
Centimeter) 59 ™
2.5-6 Compressive Strength of Green River Oil Shale en
Samples Cut Perpendicular to Bedding (Samples H
from USBM Experimental Mine, Anvil Points,
Colorado) 61 _
1
2.5-7 Summary of the Range of Concentrations in m
Leachate Samples. . . j 63
2.5-8 Comparison of Trace Element Concentrations from B
Raw Mined Shale with those from Soils and
Previously Exposed Shales 64 am
2.5-9 Mean Values for Major Ion Composition of C-a
Leachate 65
2.5-10 Mean Values for Major Ion Composition of C-b •
Leachate 65
2.5-11 Mean Values of Trace Element Concentrations of |
C-a Leachate ; 67
2.5-12 Mean Values of Trace Element Concentrations of J|
C-b Leachate 67
2.5-13 Maximum Observed Concentrations in Raw Shale •
Leachates 68 V
3.1-1 Inventory of Streams to be Disposed of as «
Solid Waste in the Lurgi-Ruhrgas Process. . . 75 g
3.1-2 Physical Properties of Lurgi Processed Shale. . 77
3.1-3 Summary of Hydraulic Conductivity Measurements •
for Various Compaction and Loadings for Lurgi
Retorted Shale. 78 •
3.1-4 Water Holding Capacity of Lurgi Processed
Shales at Various Pressures and Bulk m
Densities 78 I
xiv
I
I
image:
 TABLES (continued) ;
Number | Paqe
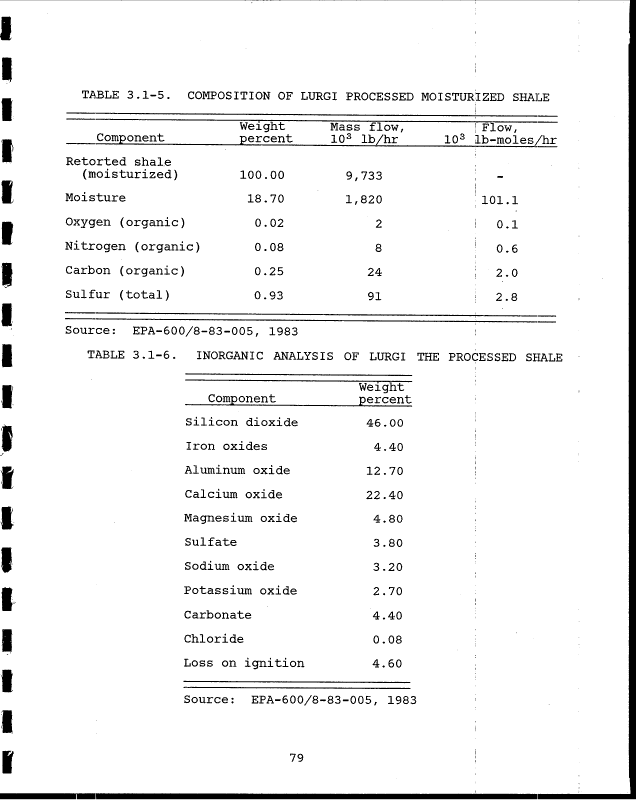
3.1-5 Composition of Lurgi Processed Moisturized i
Shale . ................. : 79
3.1-6 Inorganic Analysis of the Lurgi '< •
Processed Shale .......... ..... 79
i
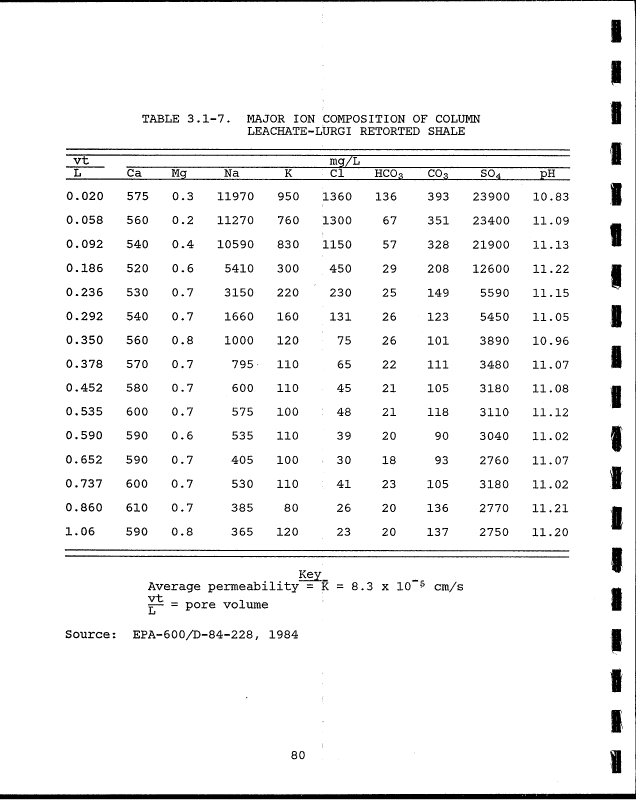
3.1-7 Major Ion Composition of Column Leachate-Lurgi
Retorted Shale .............. j go
3.1-8 Concentration of Selected Trace Elements in i
Column Leachate of Lurgi Retorted Shale . J . 81
3.1-9 Concentrations in ASTM Water Shake Test i
Extracts - Lurgi Spent Shales ......... 82
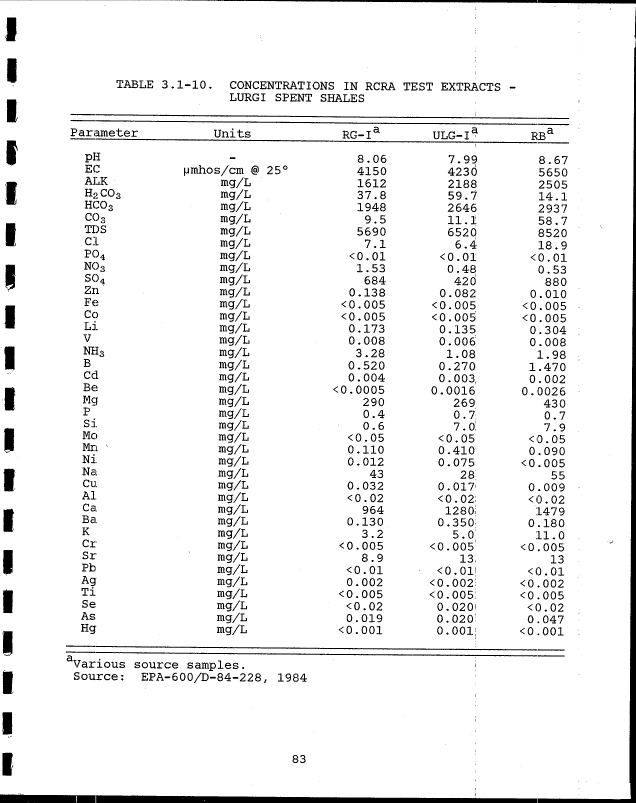
3.1-10 Concentrations in RCRA Test Extracts - Lurgi !
Spent Shales ................ j . 33
3.1-11 Leachable Mass as Indicated by the ASTM ;
Proposed Water Shake Test for Lurgi Spent i
Shales - mg/g . .............. j 34
3.1-1.2 Leachable Mass as Indicated by the RCRA I
Extraction Test for Lurgi Spent Shales - mg/g 84
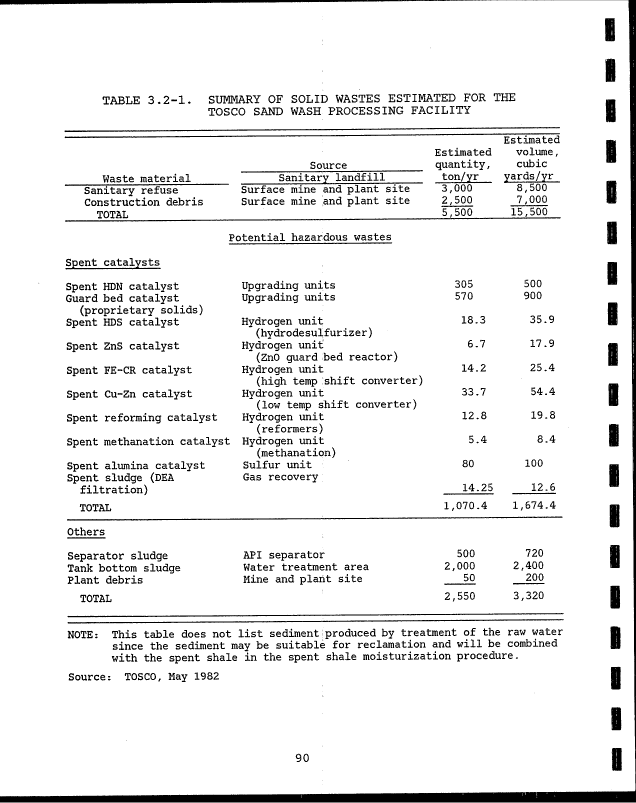
3.2-1 Summary of Solid Wastes Generated at Sand Wash
Processing Facility ............ j go
3.2-2 Major Waste Produced Over a Period of 20 Years
for TOSCO II 47,000 bbl/day Plant with
Upgrading
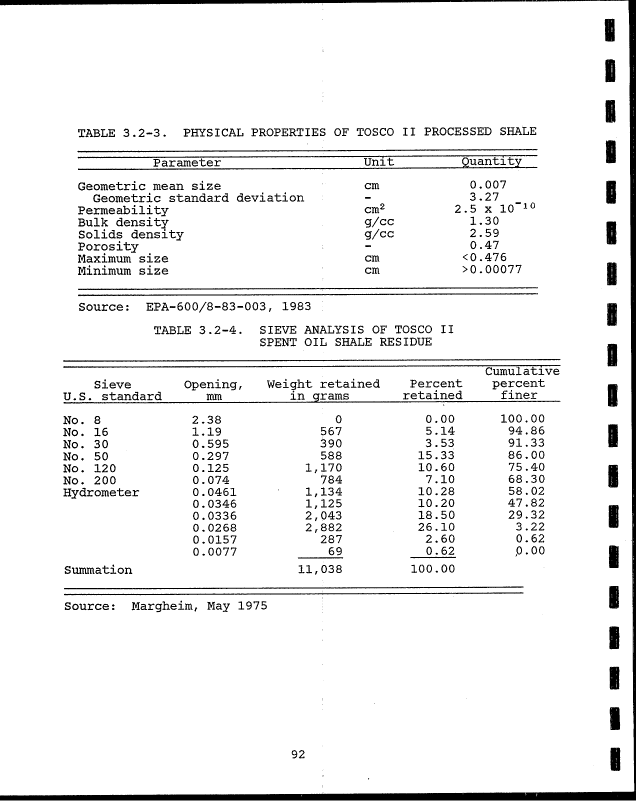
3.2-3 Physical Properties of TOSCO II Processed Shale 92
3.2-4 Sieve Analysis of TOSCO II Spent Oil Shale !
Residue .................. ! 92
3.2-5 Hydraulic Conductivity Measurements of TOSCO II
Retorted Shale ............... : 93
3.2-6 Water Holding Capacity of TOSCO II Processed !
Shales at Various Pressures and Bulk ',
Densities ................. i 93
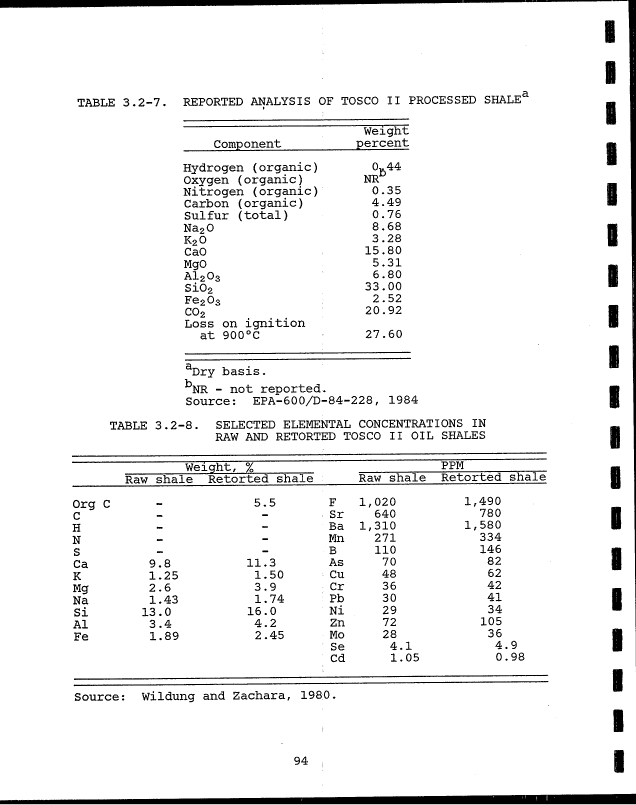
3.2-7 Reported Analysis of TOSCO II Processed Shale! - 94
3.2-8 Selected Elemental Concentrations in Raw and '
Retorted TOSCO II Oil Shales ........ i. 94
xv
image:
TABLES (continued) ;
Number | Paqe
3.1-5 Composition of Lurgi Processed Moisturized i
Shale . ................. : 79
3.1-6 Inorganic Analysis of the Lurgi '< •
Processed Shale .......... ..... 79
i
3.1-7 Major Ion Composition of Column Leachate-Lurgi
Retorted Shale .............. j go
3.1-8 Concentration of Selected Trace Elements in i
Column Leachate of Lurgi Retorted Shale . J . 81
3.1-9 Concentrations in ASTM Water Shake Test i
Extracts - Lurgi Spent Shales ......... 82
3.1-10 Concentrations in RCRA Test Extracts - Lurgi !
Spent Shales ................ j . 33
3.1-11 Leachable Mass as Indicated by the ASTM ;
Proposed Water Shake Test for Lurgi Spent i
Shales - mg/g . .............. j 34
3.1-1.2 Leachable Mass as Indicated by the RCRA I
Extraction Test for Lurgi Spent Shales - mg/g 84
3.2-1 Summary of Solid Wastes Generated at Sand Wash
Processing Facility ............ j go
3.2-2 Major Waste Produced Over a Period of 20 Years
for TOSCO II 47,000 bbl/day Plant with
Upgrading
3.2-3 Physical Properties of TOSCO II Processed Shale 92
3.2-4 Sieve Analysis of TOSCO II Spent Oil Shale !
Residue .................. ! 92
3.2-5 Hydraulic Conductivity Measurements of TOSCO II
Retorted Shale ............... : 93
3.2-6 Water Holding Capacity of TOSCO II Processed !
Shales at Various Pressures and Bulk ',
Densities ................. i 93
3.2-7 Reported Analysis of TOSCO II Processed Shale! - 94
3.2-8 Selected Elemental Concentrations in Raw and '
Retorted TOSCO II Oil Shales ........ i. 94
xv
image:
 Number
1
TABLES (continued) **
B
Page
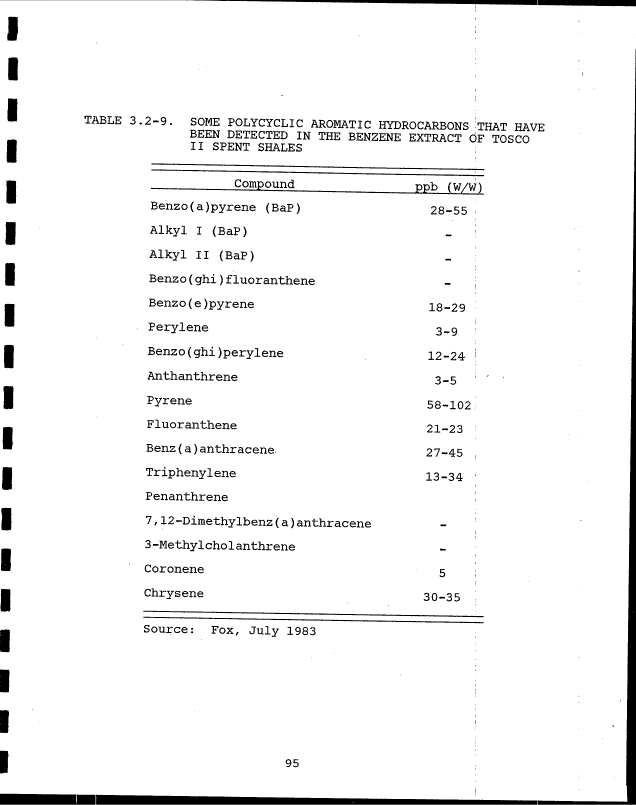
3.2-9 Some Polycyclic Aromatic:Hydrocarbons that have
been Detected in the Benzene Extract of TOSCO m
II Spent Shales • • 95 |j
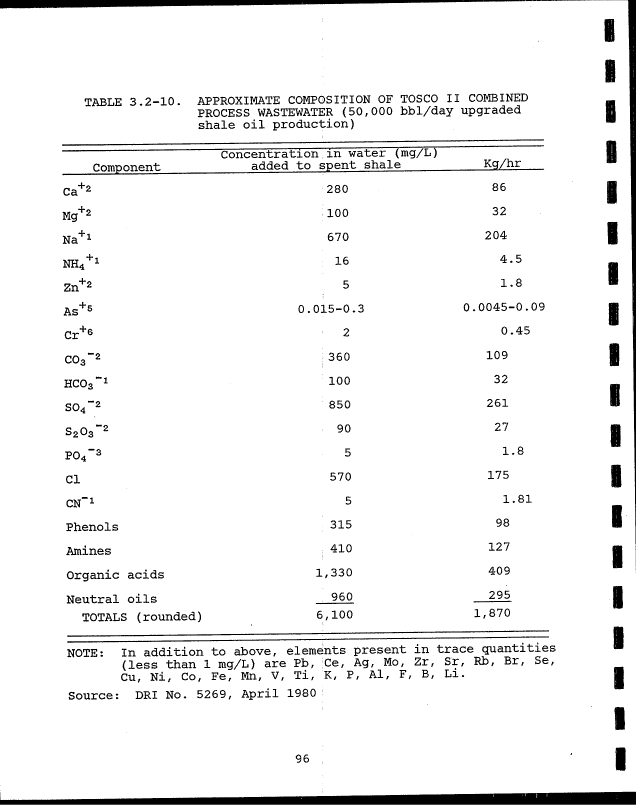
3.2-10 Approximate Composition of TOSCO II Combined
Process Wastewater (50,000 bbl/day upgraded •
shale oil production) 96 •
3.2-11 Organic Content of Gas Condensate (Foul Water) ffl
For TOSCO II 97 V
3.2-12 Composition of Foul Water for TOSCO II 97 _
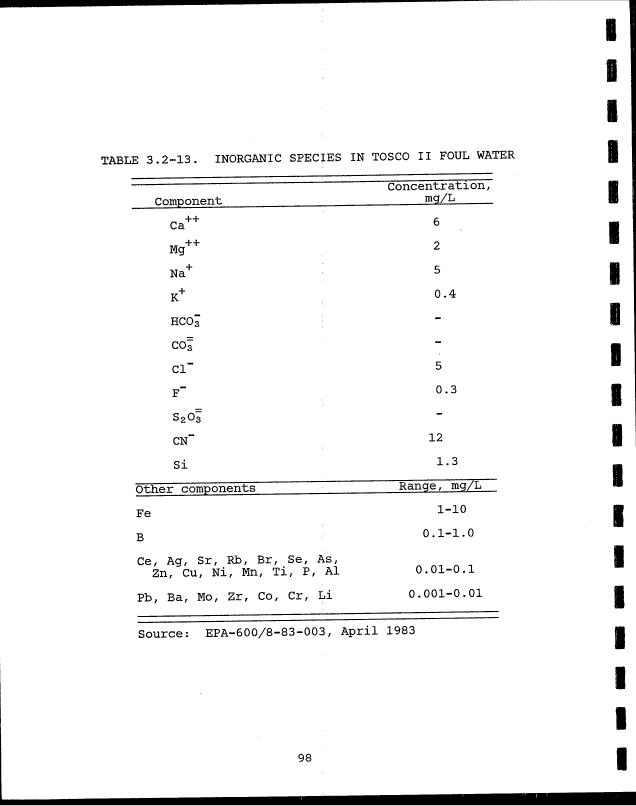
3.2-13 Inorganic Species in TOSCO II Foul Water. ... 98 •
3.2-14 Concentrations in ASTM Water Shake and RCRA •
Extracts - TOSCO II Spent Shales 99 m
3.2-15 Leachable Mass as Indicated by RCRA and ASTM m
Water Shake Extraction Test for TOSCO II (
Spent Shales 100
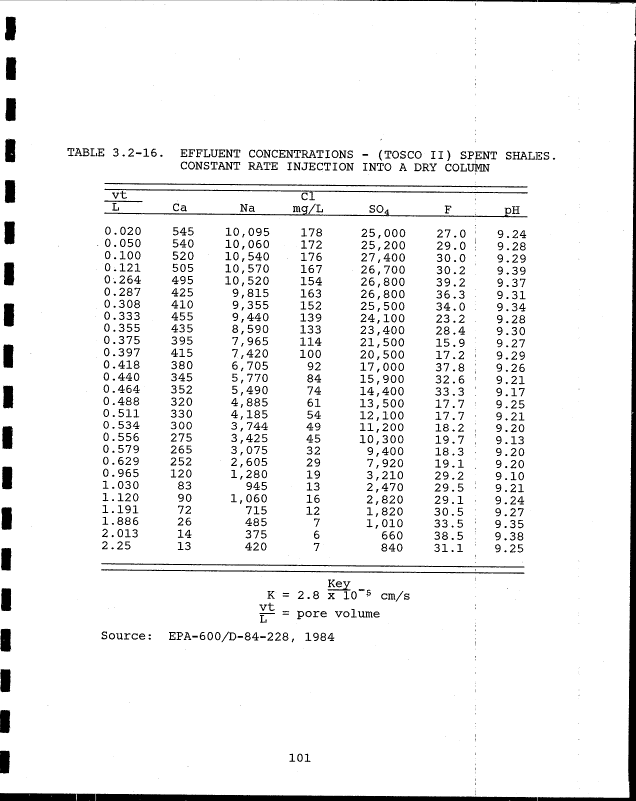
3.2-16 Effluent Concentrations - (TOSCO II) Spent I
Shales. Constant Rate Injection into a *
Dry Column 1°1
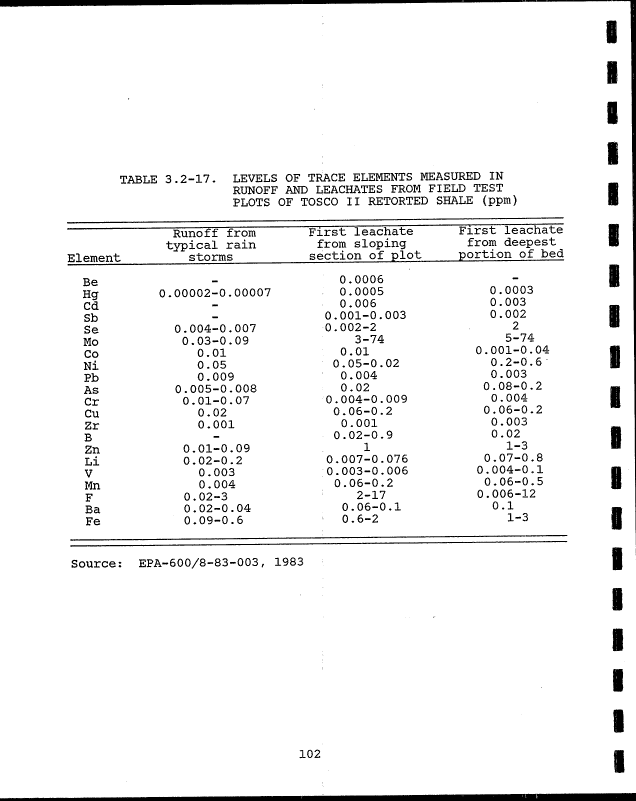
3.2-17 Levels of Trace Elements Measured in Runoff and 1
Leachates from Field Test Plots of TOSCO II
Retorted Shale (ppm). : 102 «
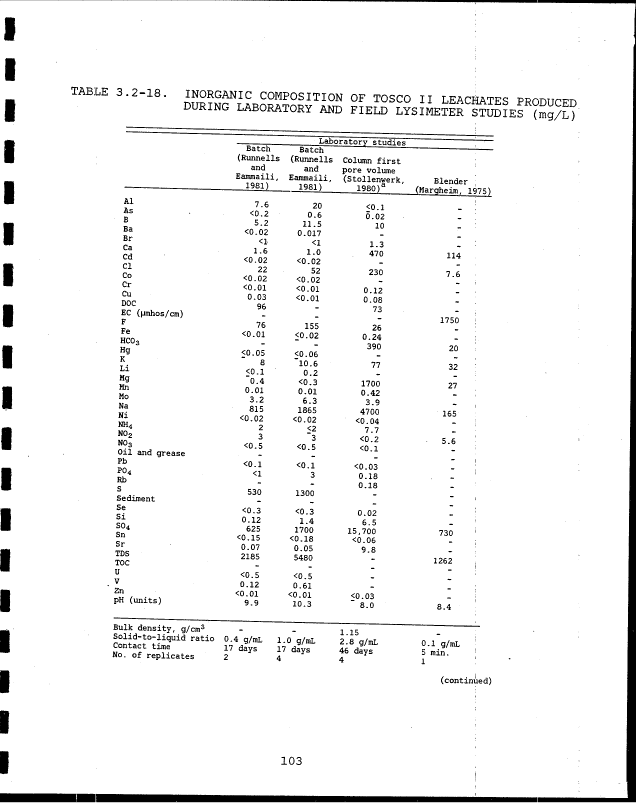
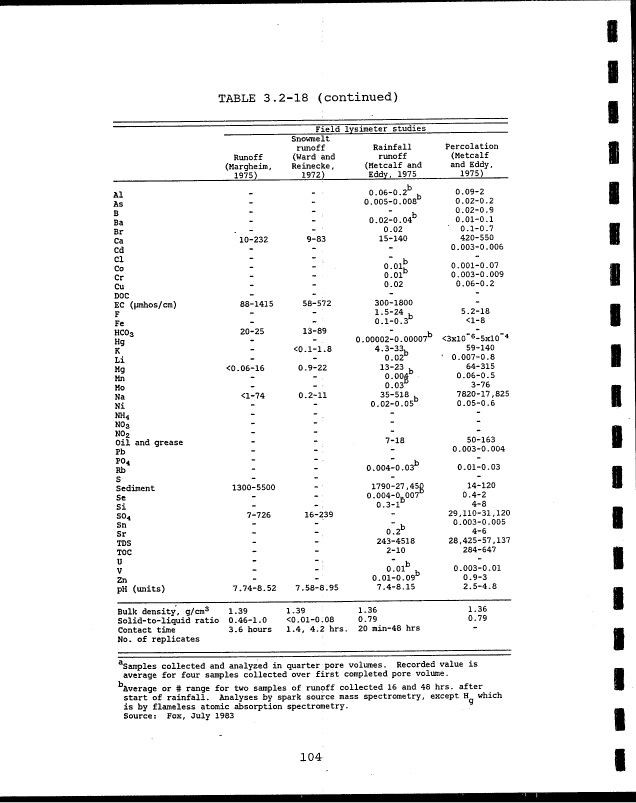
3.2-18 Inorganic Composition of TOSCO II Leachates
Produced During Laboratory and Field
Lysimeter Studies (mg/L) 103 •
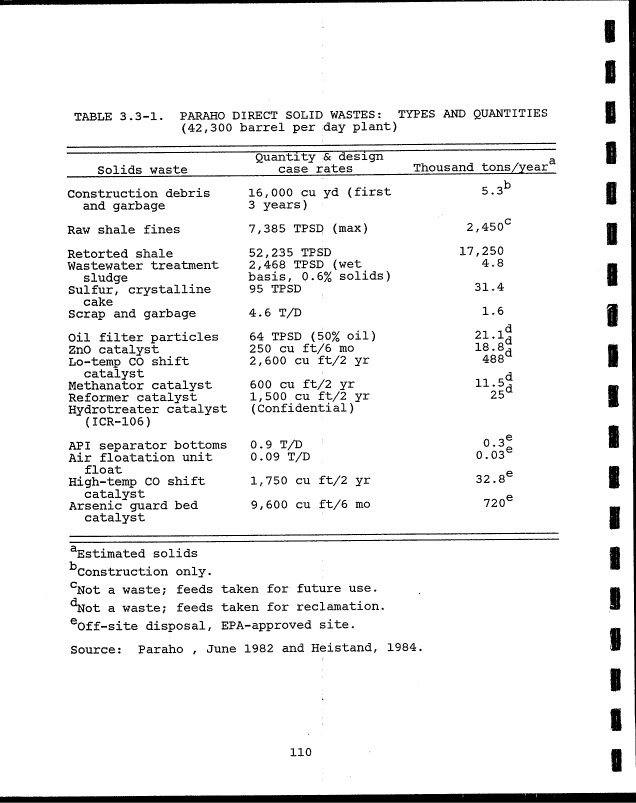
3.3-1 Paraho Direct Solid Wastes: Types and
Quantities • HO m
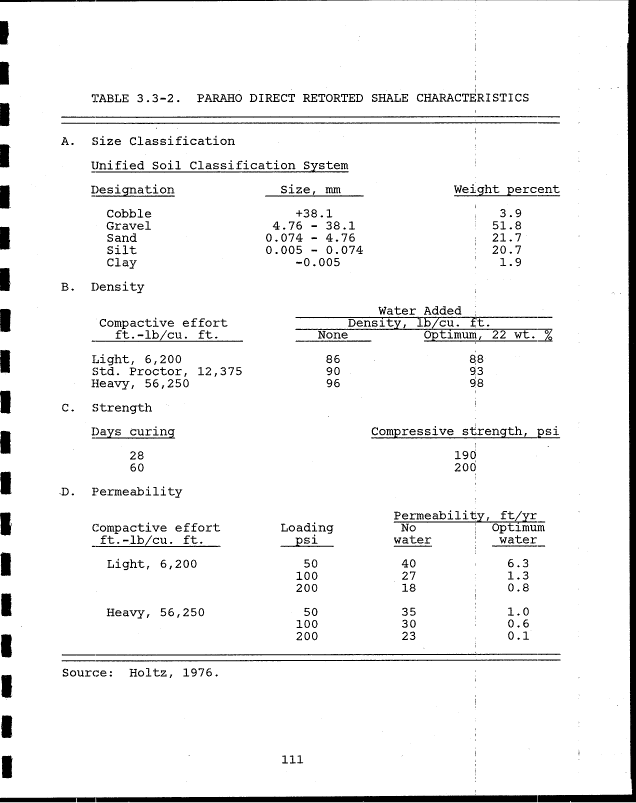
3.3-2 Paraho Direct Retorted Shale Characteristics. . Ill
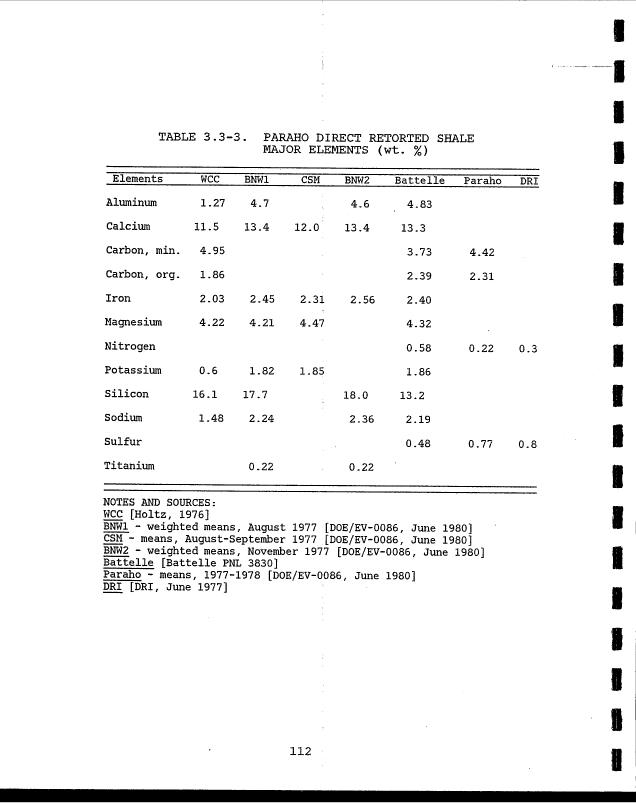
3.3-3 Paraho Direct Retorted Shale Major Elements •
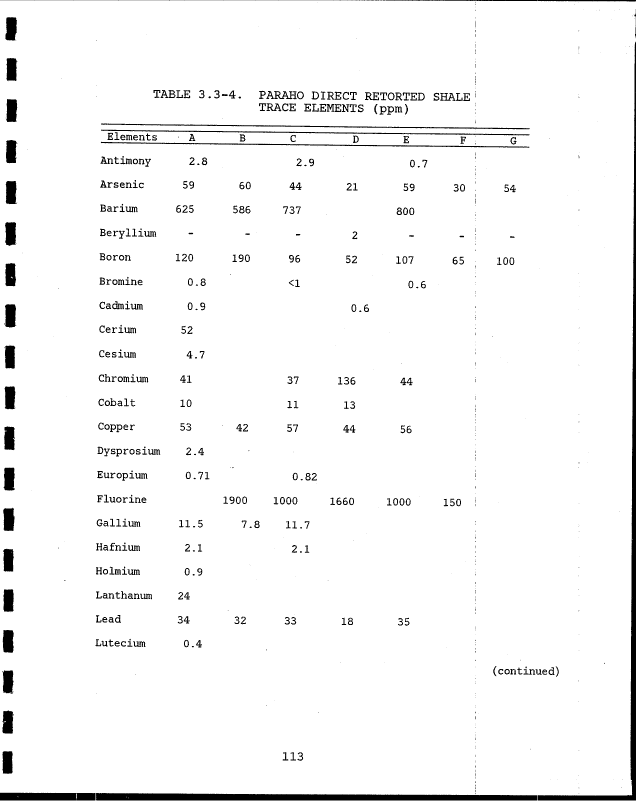
3.3-4 Paraho Direct Retorted Shale Trace Elements A
(ppm) 1]-3 •
3.3-5 Paraho Direct Product Water Bulk
Properties (wt. %). . ............ H5
xvi
I
I
image:
Number
1
TABLES (continued) **
B
Page
3.2-9 Some Polycyclic Aromatic:Hydrocarbons that have
been Detected in the Benzene Extract of TOSCO m
II Spent Shales • • 95 |j
3.2-10 Approximate Composition of TOSCO II Combined
Process Wastewater (50,000 bbl/day upgraded •
shale oil production) 96 •
3.2-11 Organic Content of Gas Condensate (Foul Water) ffl
For TOSCO II 97 V
3.2-12 Composition of Foul Water for TOSCO II 97 _
3.2-13 Inorganic Species in TOSCO II Foul Water. ... 98 •
3.2-14 Concentrations in ASTM Water Shake and RCRA •
Extracts - TOSCO II Spent Shales 99 m
3.2-15 Leachable Mass as Indicated by RCRA and ASTM m
Water Shake Extraction Test for TOSCO II (
Spent Shales 100
3.2-16 Effluent Concentrations - (TOSCO II) Spent I
Shales. Constant Rate Injection into a *
Dry Column 1°1
3.2-17 Levels of Trace Elements Measured in Runoff and 1
Leachates from Field Test Plots of TOSCO II
Retorted Shale (ppm). : 102 «
3.2-18 Inorganic Composition of TOSCO II Leachates
Produced During Laboratory and Field
Lysimeter Studies (mg/L) 103 •
3.3-1 Paraho Direct Solid Wastes: Types and
Quantities • HO m
3.3-2 Paraho Direct Retorted Shale Characteristics. . Ill
3.3-3 Paraho Direct Retorted Shale Major Elements •
3.3-4 Paraho Direct Retorted Shale Trace Elements A
(ppm) 1]-3 •
3.3-5 Paraho Direct Product Water Bulk
Properties (wt. %). . ............ H5
xvi
I
I
image:
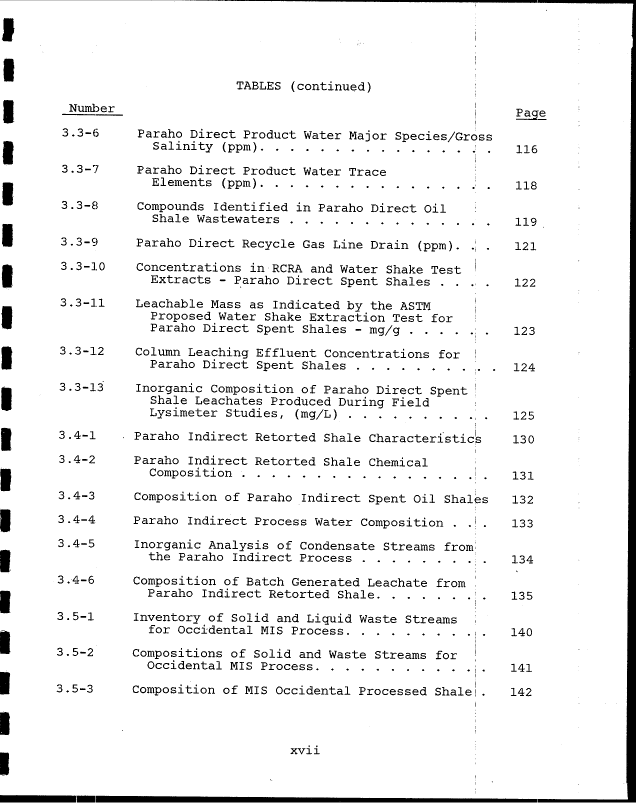
 TABLES (continued)
Number
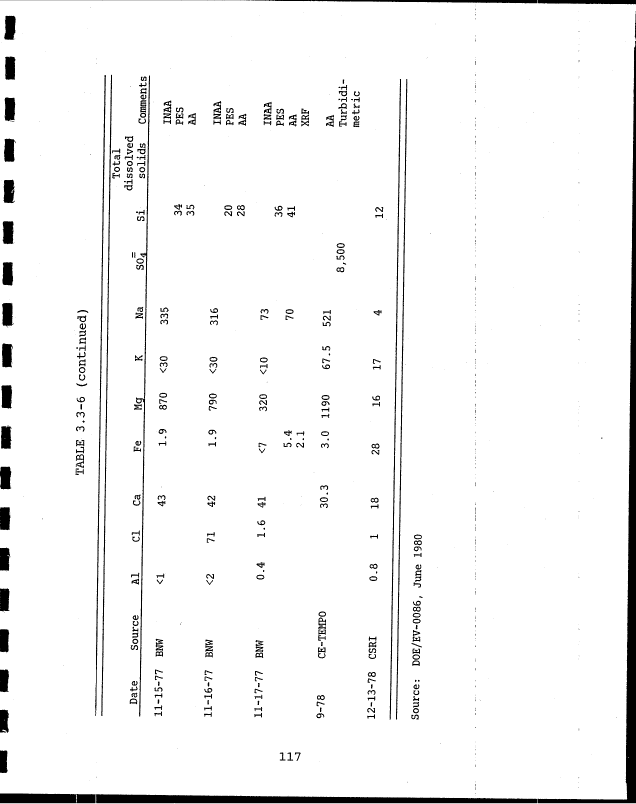
3.3-6 Paraho Direct Product Water Major Species/Gross
Salinity (ppm)
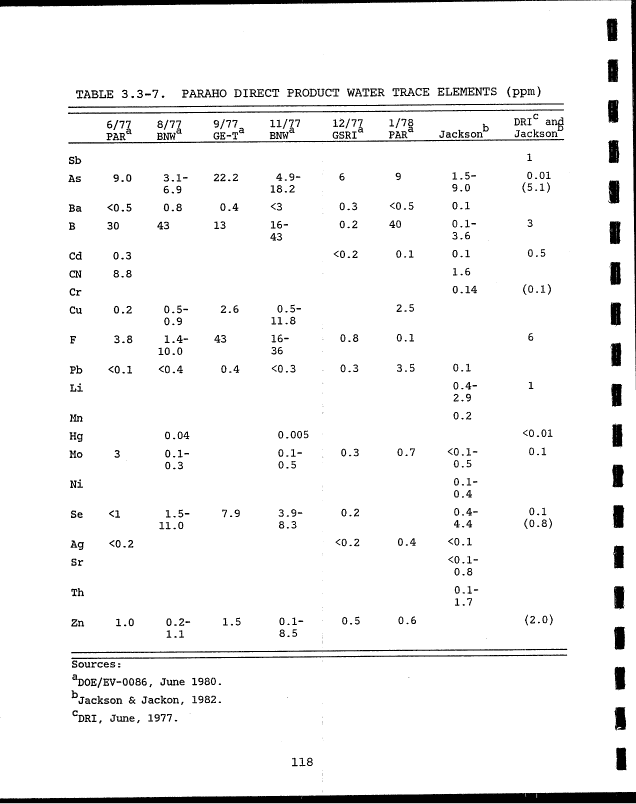
3.3-7 Paraho Direct Product Water Trace
Elements (ppm)
3.3-8 Compounds Identified in Paraho Direct Oil
Shale Wastewaters
116
118
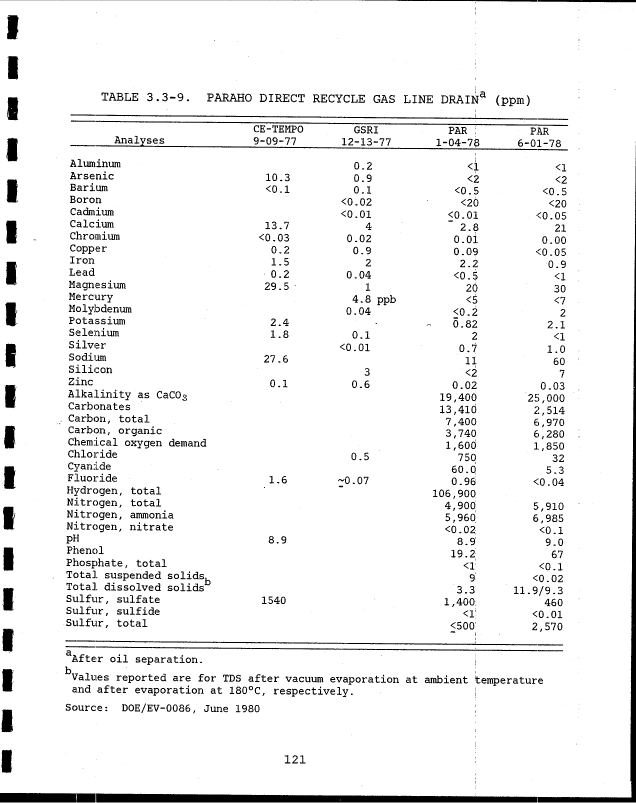
3.3-9 Paraho Direct Recycle Gas Line Drain (ppm). .! . 121
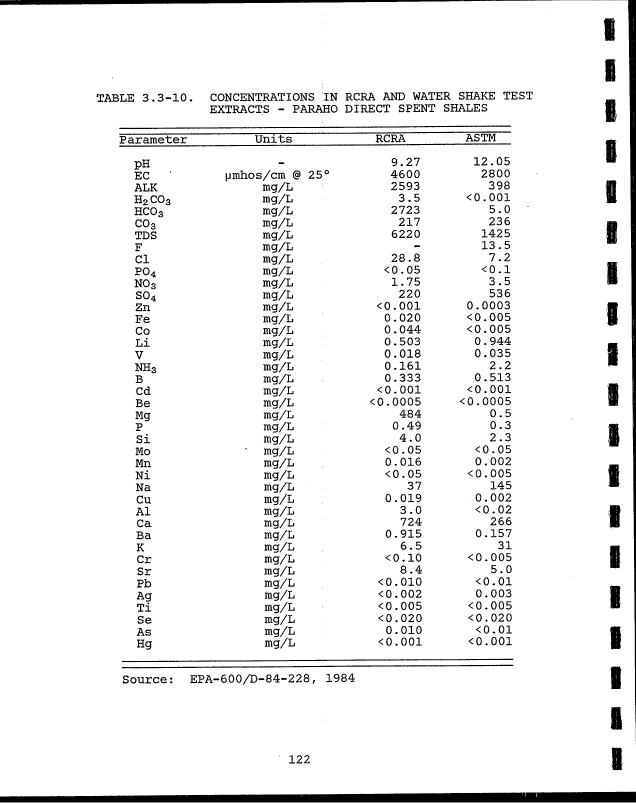
3.3-10 Concentrations in RCRA and Water Shake Test I
Extracts - Paraho Direct Spent Shales . . ., . 122
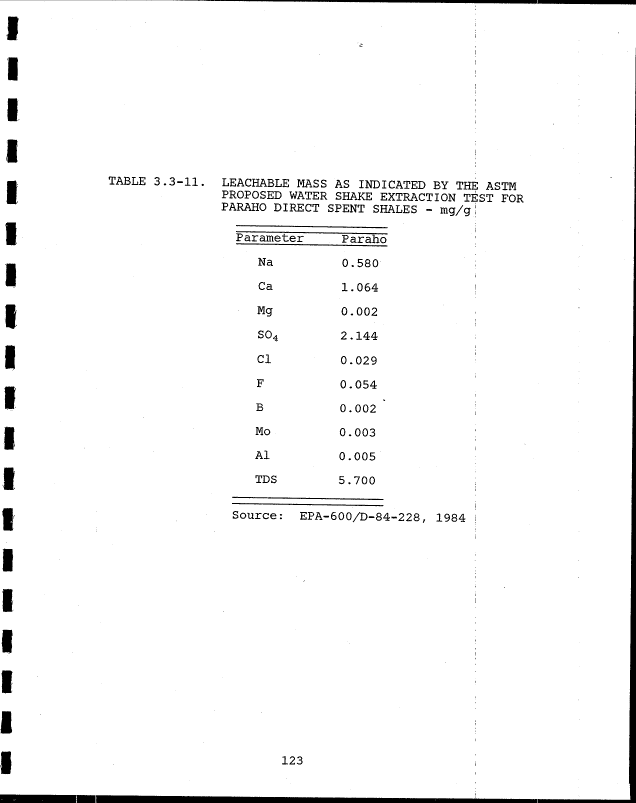
3.3-11 Leachable Mass as Indicated by the ASTM |
Proposed Water Shake Extraction Test for i
Paraho Direct Spent Shales - mg/g ..... ; . 123
3.3-12 Column Leaching Effluent Concentrations for i
Paraho Direct Spent Shales ........ ',. 124
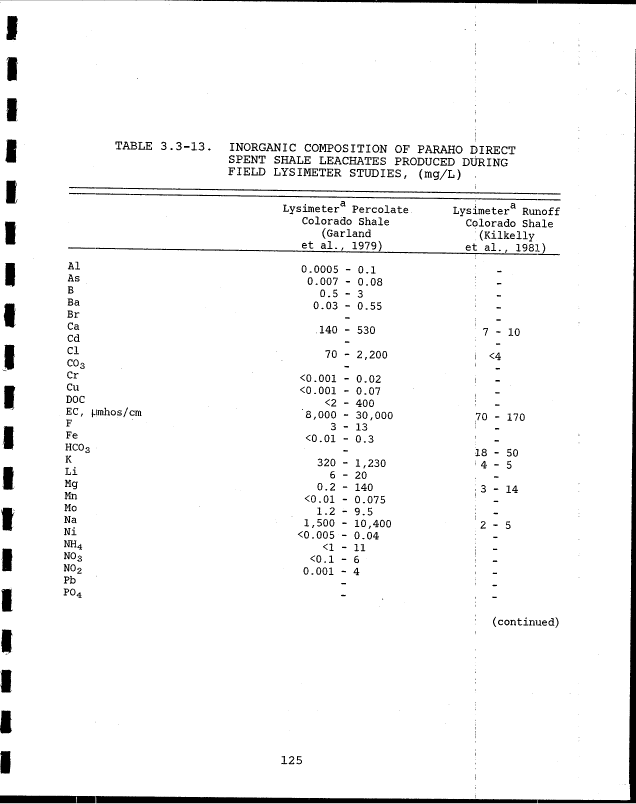
3.3-13 Inorganic Composition of Paraho Direct Spent ;
Shale Leachates Produced During Field •
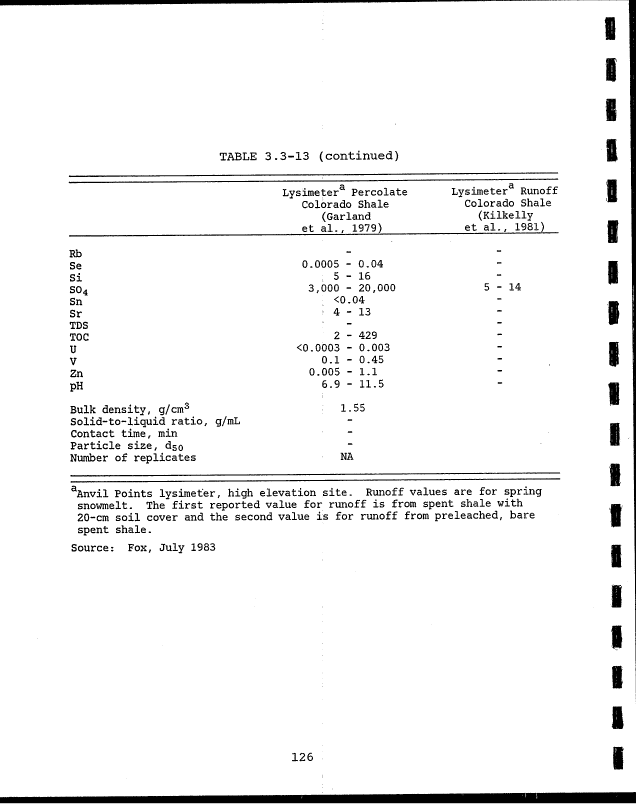
Lysimeter Studies, (mg/L) ......... ; . 125
!
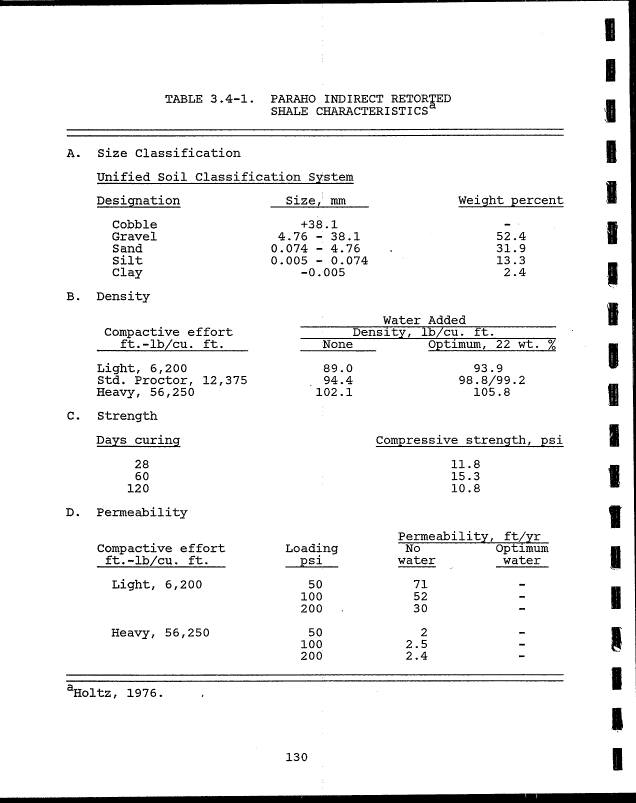
3.4-1 . Paraho Indirect Retorted Shale Characteristics 130
!
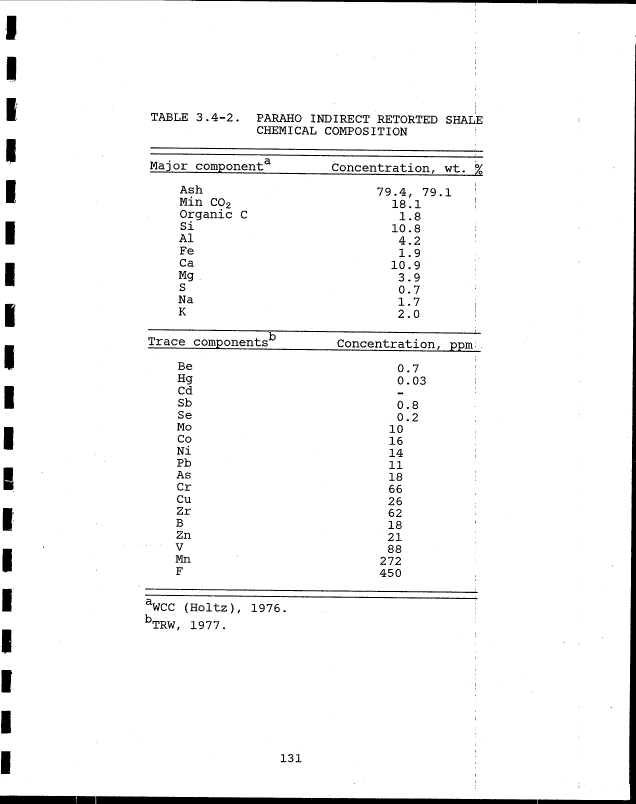
3.4-2 Paraho Indirect Retorted Shale Chemical ;
Composition ........... ..... | 131
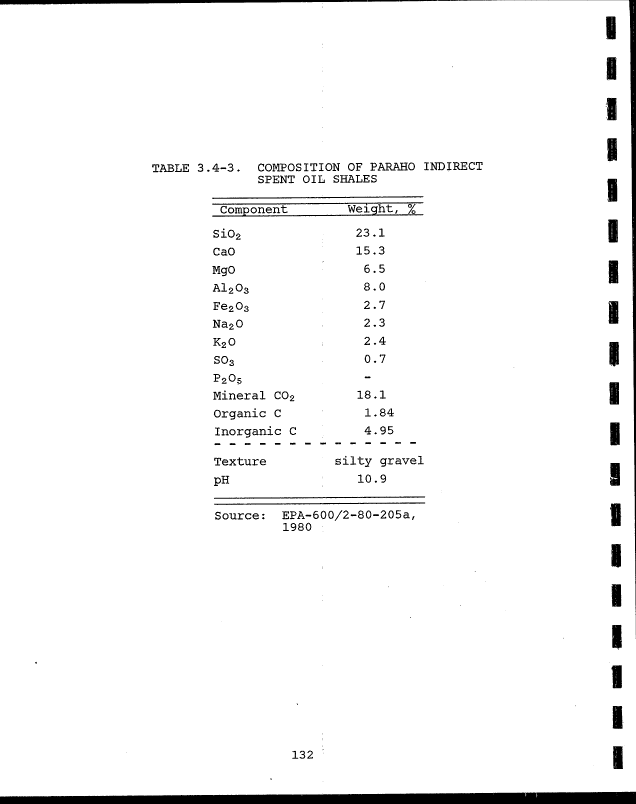
3.4-3 Composition of Paraho Indirect Spent Oil Shales 132
3.4-4 Paraho Indirect Process Water Composition . . j . 133
3.4-5 Inorganic Analysis of Condensate Streams from'
the Paraho Indirect Process ........ ; . 134
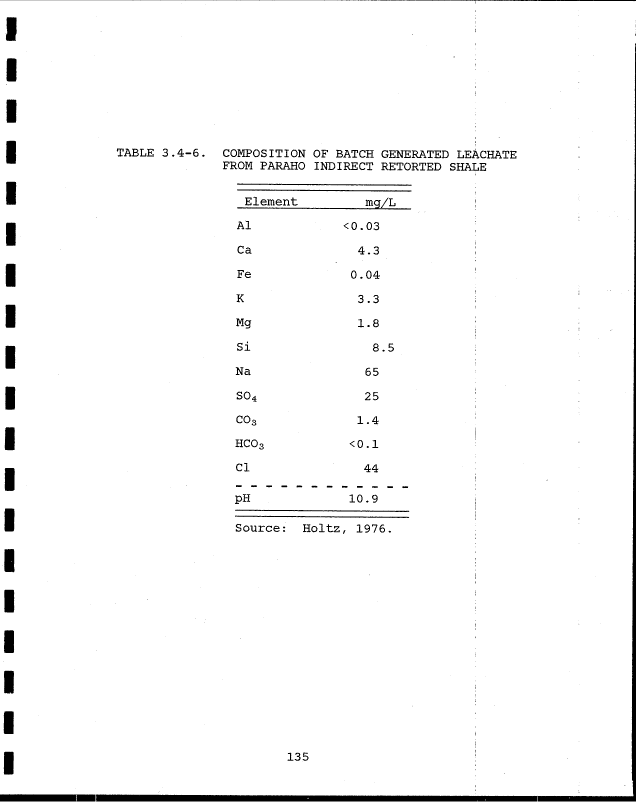
3.4-6 Composition of Batch Generated Leachate from !
Paraho Indirect Retorted Shale ....... j . 135
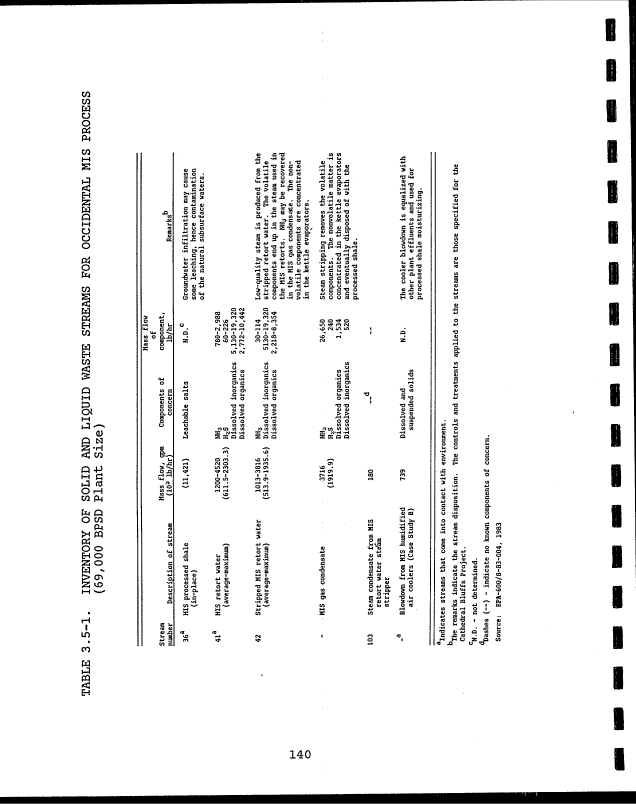
3.5-1 Inventory of Solid and Liquid Waste Streams ;
for Occidental MIS Process ......... \ . 140
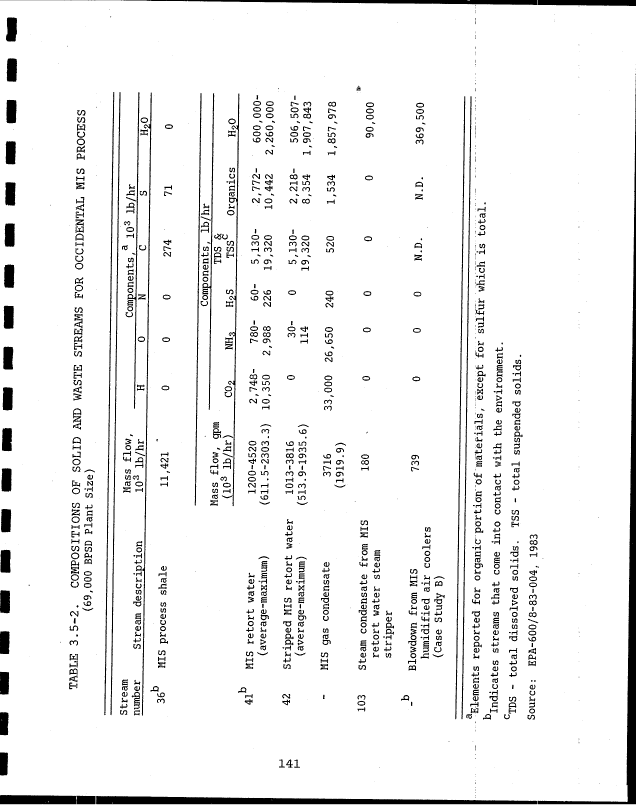
3.5-2 Compositions of Solid and Waste Streams for !
Occidental MIS Process ........... j . 141
i
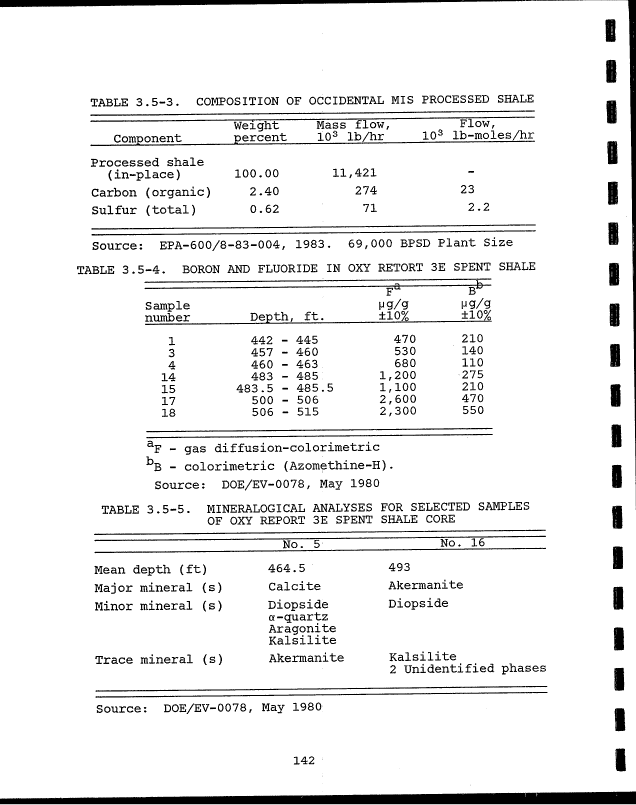
3.5-3 Composition of MIS Occidental Processed Shale! . 142
xvi i
image:
TABLES (continued)
Number
3.3-6 Paraho Direct Product Water Major Species/Gross
Salinity (ppm)
3.3-7 Paraho Direct Product Water Trace
Elements (ppm)
3.3-8 Compounds Identified in Paraho Direct Oil
Shale Wastewaters
116
118
3.3-9 Paraho Direct Recycle Gas Line Drain (ppm). .! . 121
3.3-10 Concentrations in RCRA and Water Shake Test I
Extracts - Paraho Direct Spent Shales . . ., . 122
3.3-11 Leachable Mass as Indicated by the ASTM |
Proposed Water Shake Extraction Test for i
Paraho Direct Spent Shales - mg/g ..... ; . 123
3.3-12 Column Leaching Effluent Concentrations for i
Paraho Direct Spent Shales ........ ',. 124
3.3-13 Inorganic Composition of Paraho Direct Spent ;
Shale Leachates Produced During Field •
Lysimeter Studies, (mg/L) ......... ; . 125
!
3.4-1 . Paraho Indirect Retorted Shale Characteristics 130
!
3.4-2 Paraho Indirect Retorted Shale Chemical ;
Composition ........... ..... | 131
3.4-3 Composition of Paraho Indirect Spent Oil Shales 132
3.4-4 Paraho Indirect Process Water Composition . . j . 133
3.4-5 Inorganic Analysis of Condensate Streams from'
the Paraho Indirect Process ........ ; . 134
3.4-6 Composition of Batch Generated Leachate from !
Paraho Indirect Retorted Shale ....... j . 135
3.5-1 Inventory of Solid and Liquid Waste Streams ;
for Occidental MIS Process ......... \ . 140
3.5-2 Compositions of Solid and Waste Streams for !
Occidental MIS Process ........... j . 141
i
3.5-3 Composition of MIS Occidental Processed Shale! . 142
xvi i
image:
 I
I
TABLES (continued) •"
Number
'' ..... " ' '
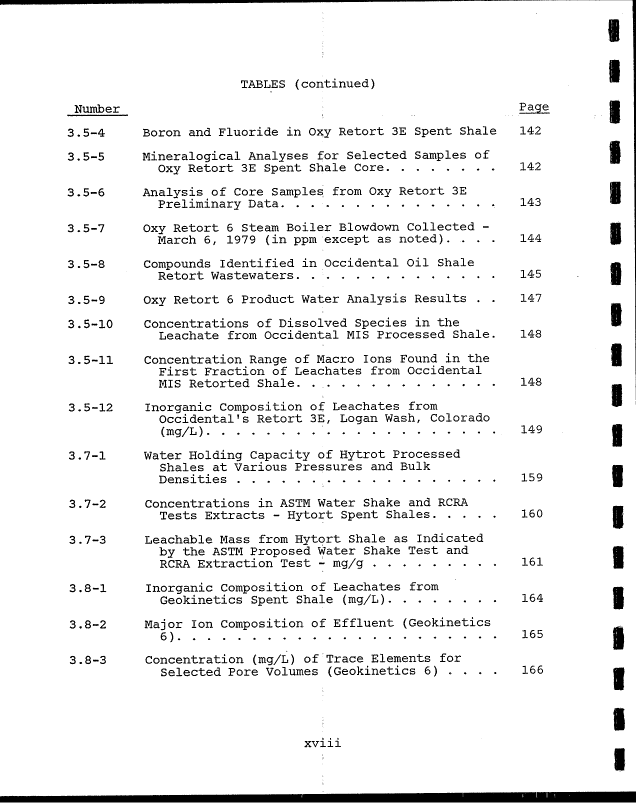
3.5-4 Boron and Fluoride in Oxy Retort 3E Spent Shale 142
3.5-5 Mineralogical Analyses for Selected Samples of ||
Oxy Retort 3E Spent Shale Core ........ 142
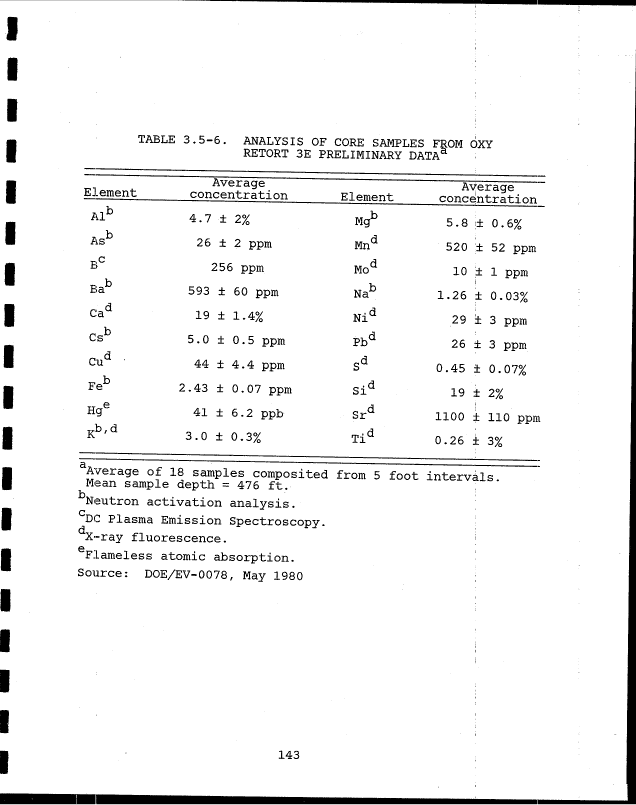
3.5-6 Analysis of Core Samples^ from Oxy Retort 3E I
Preliminary Data. . . ......... ... 143 *
3.5-7 Oxy Retort 6 Steam Boiler Blowdown Collected -
March 6, 1979 (in ppm except as noted). . . . 144
3.5-8 Compounds Identified in Occidental Oil Shale g
Retort Wastewaters. . ............ 145 B
3.5-9 Oxy Retort 6 Product Water Analysis Results . . 147
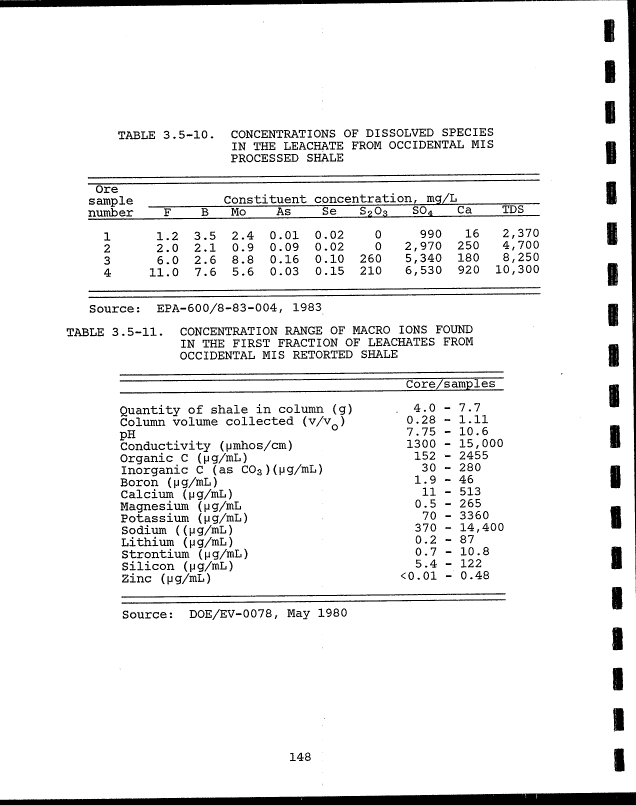
3.5-10 Concentrations of Dissolved Species in the v
Leachate from Occidental MIS Processed Shale. 148
3.5-11 Concentration Range of Macro Ions Found in the g
First Fraction of Leachates from Occidental
MIS Retorted Shale. . , ............ 148 —
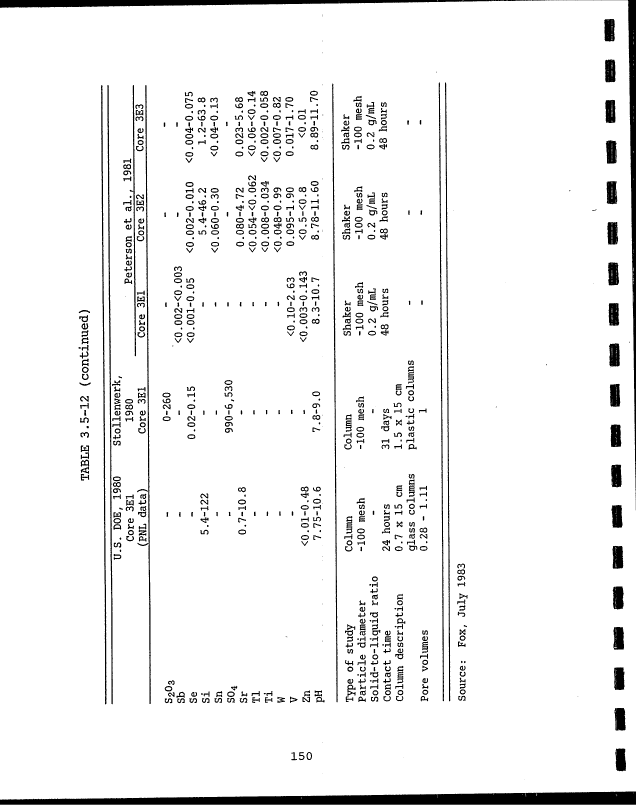
3.5-12 Inorganic Composition of Leachates from ™
Occidental's Retort 3E, Logan Wash, Colorado
(mg/L) ........ ............ 149 M
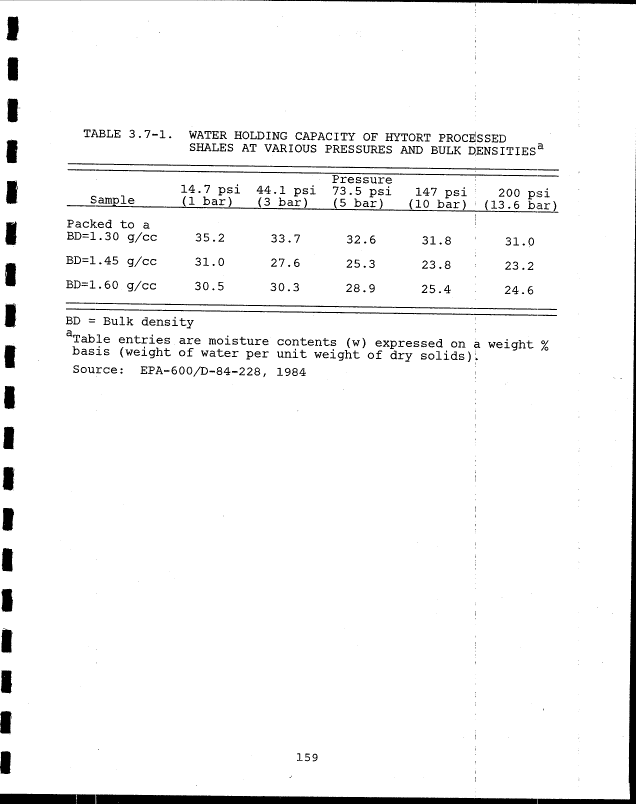
3.7-1 Water Holding Capacity of Hytrot Processed
Shales at Various Pressures and Bulk
Densities ...... ............ 159
3.7-2 Concentrations in ASTM Water Shake and RCRA
Tests Extracts - Hytort Spent Shales ..... 160 •
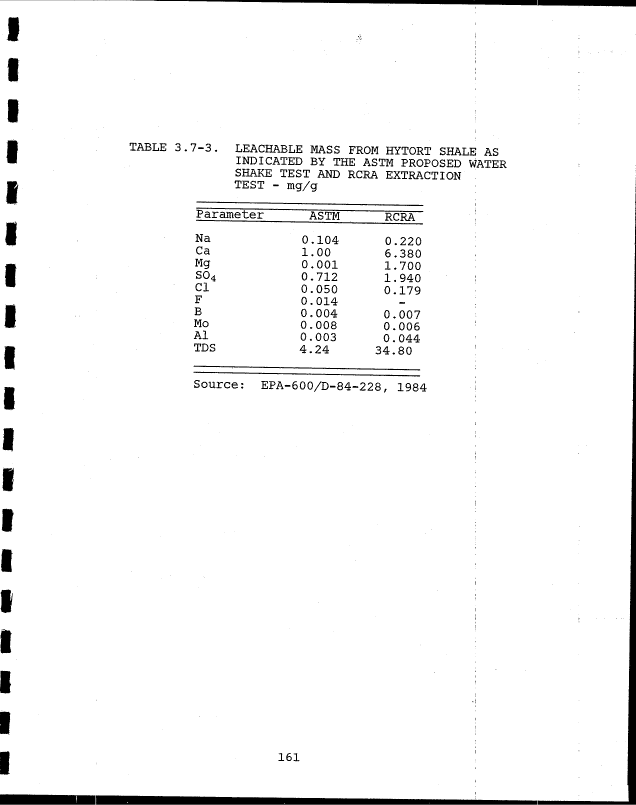
3.7-3 Leachable Mass from Hytort Shale as Indicated
by the ASTM Proposed Water Shake Test and
RCRA Extraction Test - mg/g ......... 161
3.8-1 Inorganic Composition of Leachates from
Geokinetics Spent Shale (mg/L) ........ 164
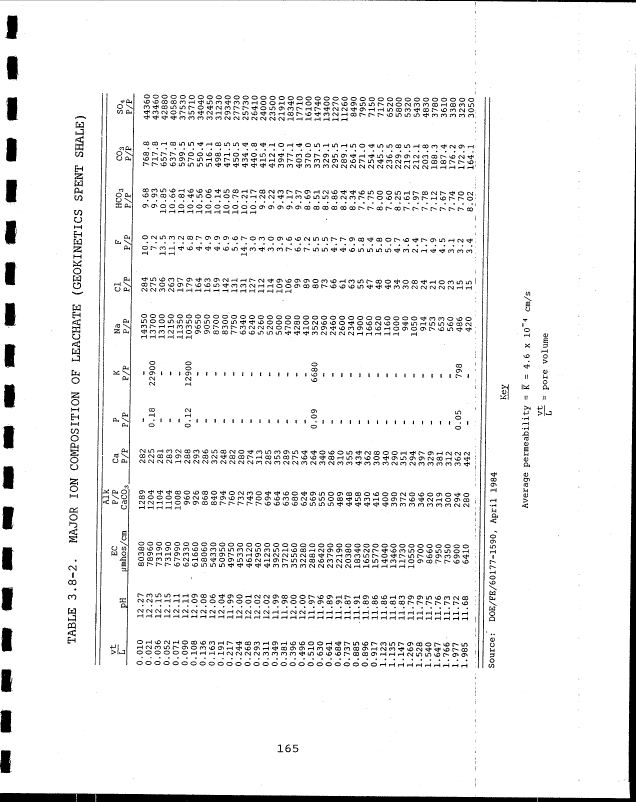
3,8-2 Major Ion Composition of Effluent (Geokinetics
6) ...................... 165
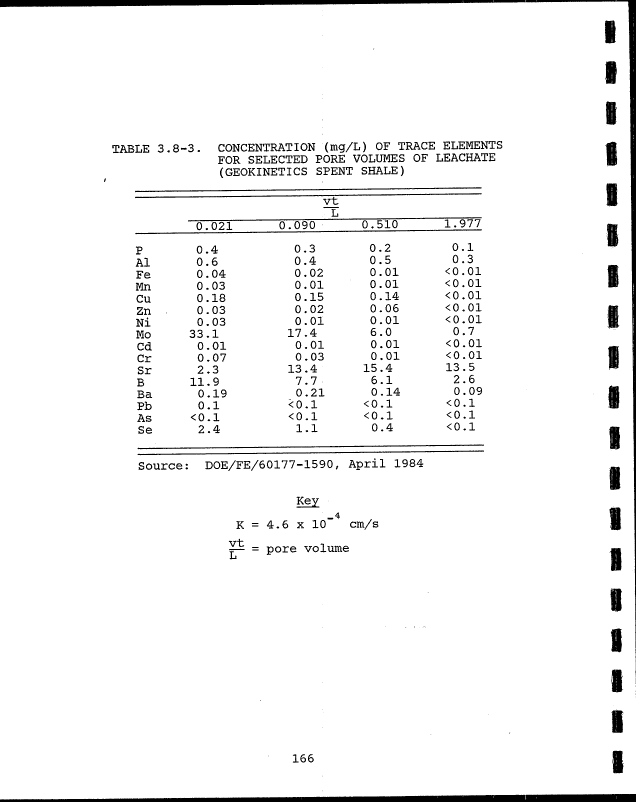
3.8-3 Concentration (mg/L) of Trace Elements for
Selected Pore Volumes (Geokinetics 6) .... 166 m
xvi 11
I
I
image:
I
I
TABLES (continued) •"
Number
'' ..... " ' '
3.5-4 Boron and Fluoride in Oxy Retort 3E Spent Shale 142
3.5-5 Mineralogical Analyses for Selected Samples of ||
Oxy Retort 3E Spent Shale Core ........ 142
3.5-6 Analysis of Core Samples^ from Oxy Retort 3E I
Preliminary Data. . . ......... ... 143 *
3.5-7 Oxy Retort 6 Steam Boiler Blowdown Collected -
March 6, 1979 (in ppm except as noted). . . . 144
3.5-8 Compounds Identified in Occidental Oil Shale g
Retort Wastewaters. . ............ 145 B
3.5-9 Oxy Retort 6 Product Water Analysis Results . . 147
3.5-10 Concentrations of Dissolved Species in the v
Leachate from Occidental MIS Processed Shale. 148
3.5-11 Concentration Range of Macro Ions Found in the g
First Fraction of Leachates from Occidental
MIS Retorted Shale. . , ............ 148 —
3.5-12 Inorganic Composition of Leachates from ™
Occidental's Retort 3E, Logan Wash, Colorado
(mg/L) ........ ............ 149 M
3.7-1 Water Holding Capacity of Hytrot Processed
Shales at Various Pressures and Bulk
Densities ...... ............ 159
3.7-2 Concentrations in ASTM Water Shake and RCRA
Tests Extracts - Hytort Spent Shales ..... 160 •
3.7-3 Leachable Mass from Hytort Shale as Indicated
by the ASTM Proposed Water Shake Test and
RCRA Extraction Test - mg/g ......... 161
3.8-1 Inorganic Composition of Leachates from
Geokinetics Spent Shale (mg/L) ........ 164
3,8-2 Major Ion Composition of Effluent (Geokinetics
6) ...................... 165
3.8-3 Concentration (mg/L) of Trace Elements for
Selected Pore Volumes (Geokinetics 6) .... 166 m
xvi 11
I
I
image:
 TABLES (continued) j
Number I Page
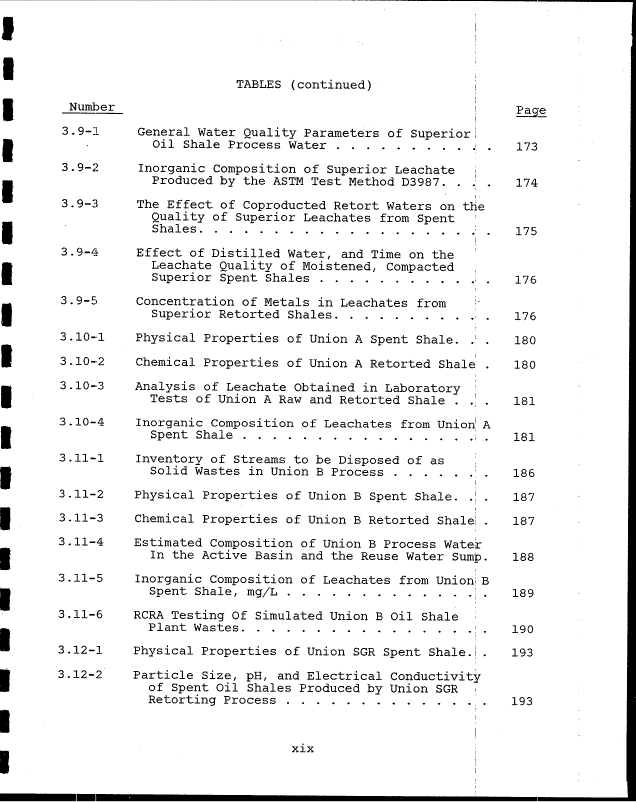
3.9-1 General Water Quality Parameters of Superior!
Oil Shale Process Water j . 173
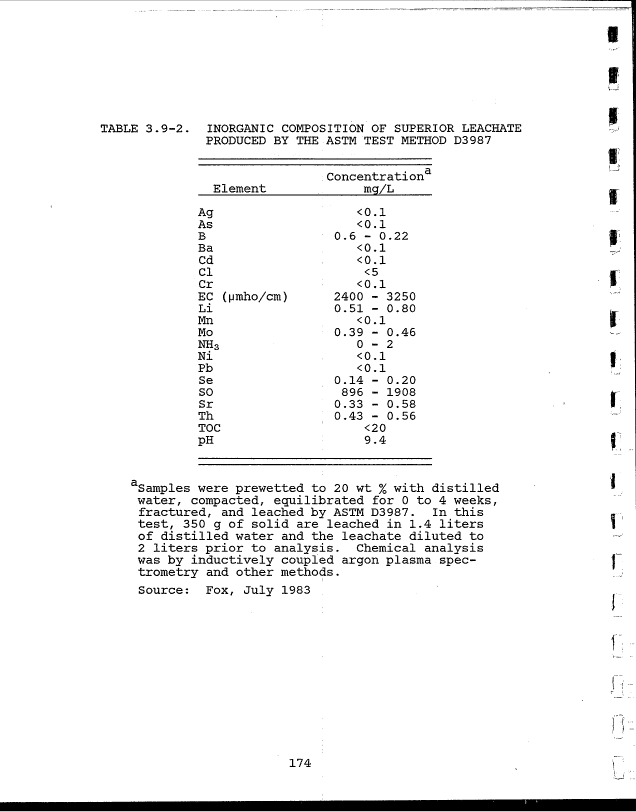
3.9-2 Inorganic Composition of Superior Leachate i
Produced by the ASTM Test Method D3987. . .' . 174
3.9-3 The Effect of Coproducted Retort Waters on tne
Quality of Superior Leachates from Spent
Shales j . 175
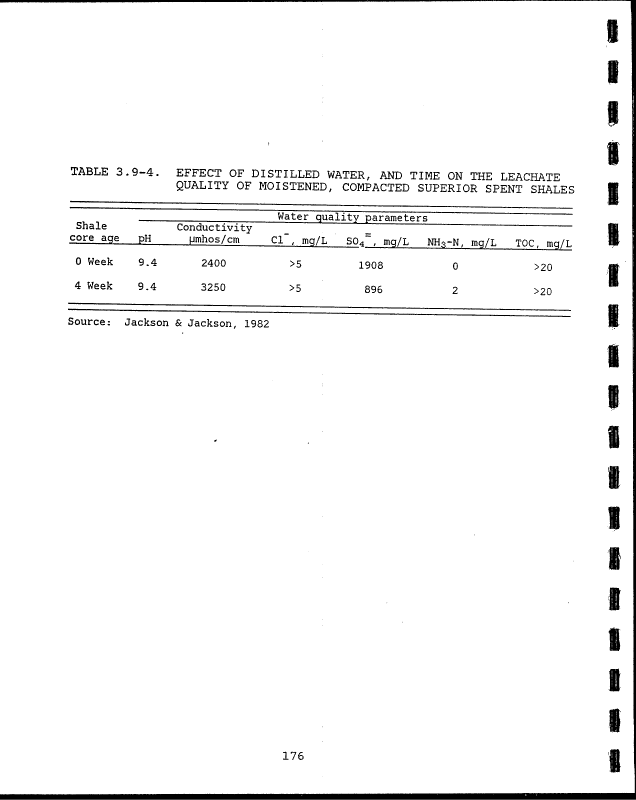
3.9-4 Effect of Distilled Water, and Time on the !
Leachate Quality of Moistened, Compacted
Superior Spent Shales ! . 175
3.9-5 Concentration of Metals in Leachates from '••
Superior Retorted Shales '', . 175
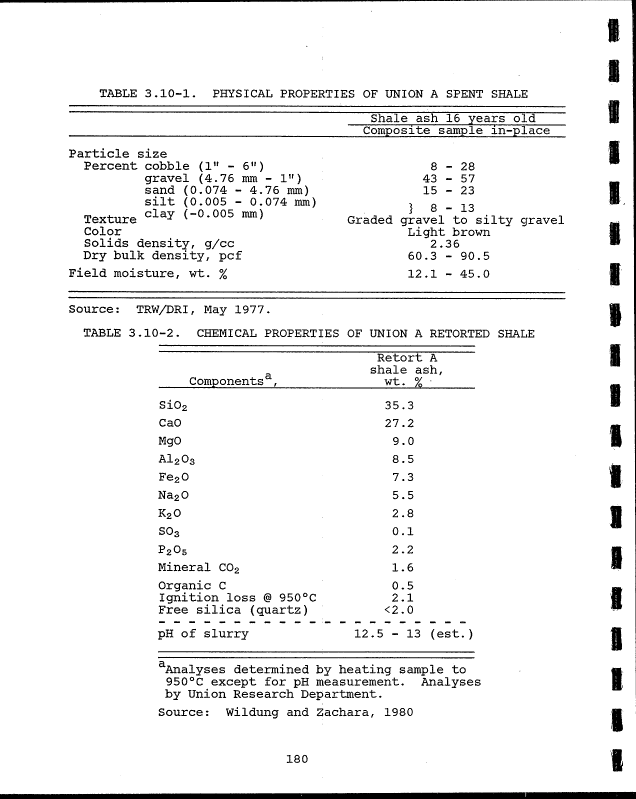
3.10-1 Physical Properties of Union A Spent Shale. .: . 180
3.10-2 Chemical Properties of Union A Retorted Shale . 180
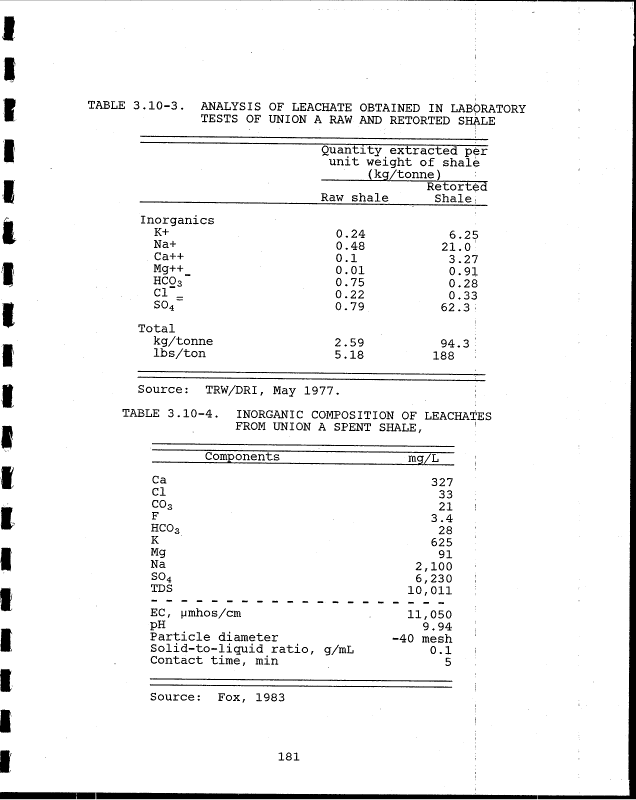
3.10-3 Analysis of Leachate Obtained in Laboratory '
Tests of Union A Raw and Retorted Shale . .! . 181
3.10-4 Inorganic Composition of Leachates from Union| A
Spent Shale • . isi
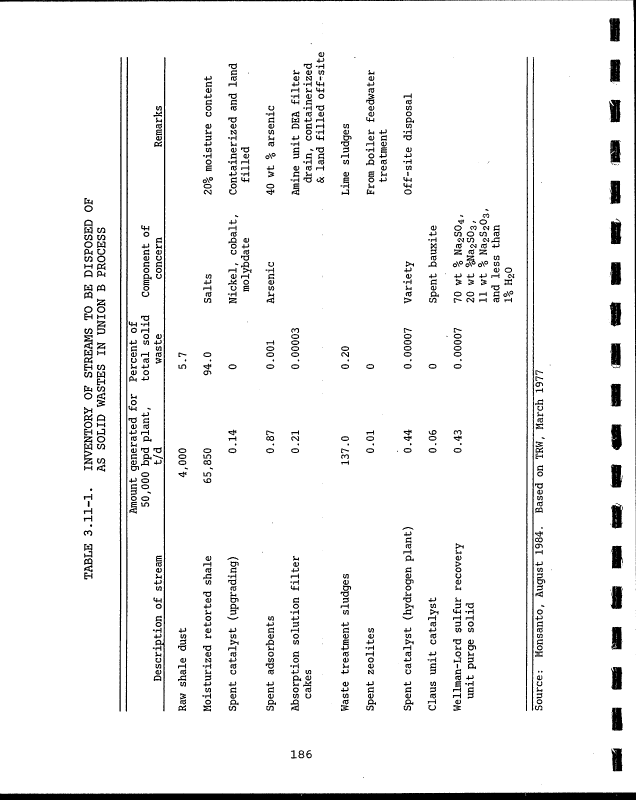
3.11-1 Inventory of Streams to be Disposed of as :
Solid Wastes in Union B Process [ . 186
i
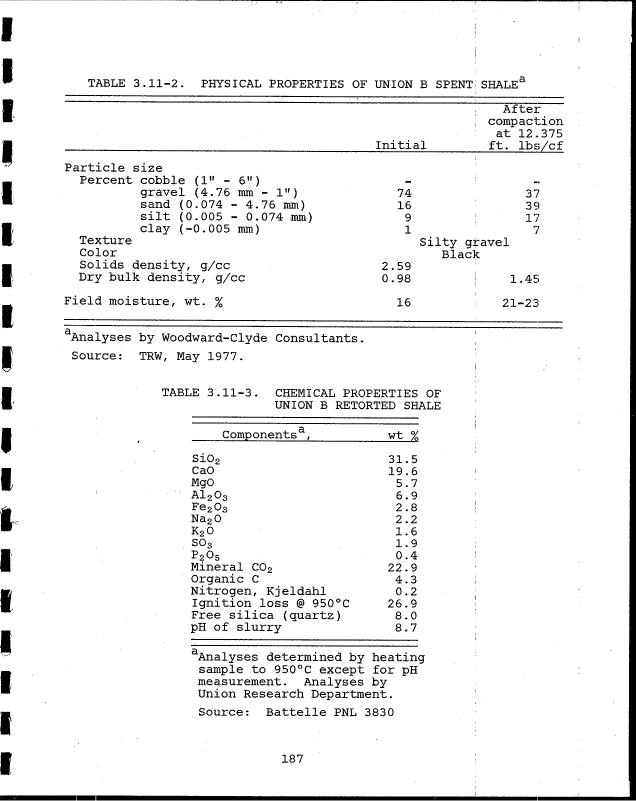
3.11-2 Physical Properties of Union B Spent Shale. .! . 187
]
3.11-3 Chemical Properties of Union B Retorted Shale! . 187
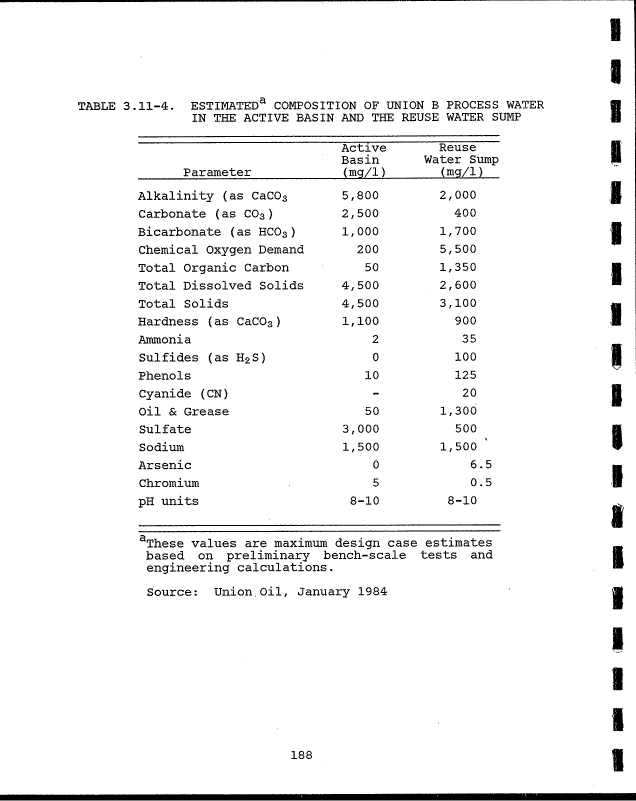
3.11-4 Estimated Composition of Union B Process Water
In the Active Basin and the Reuse Water Sump. 188
3.11-5 Inorganic Composition of Leachates from UnioniB
Spent Shale, mg/L j . 189
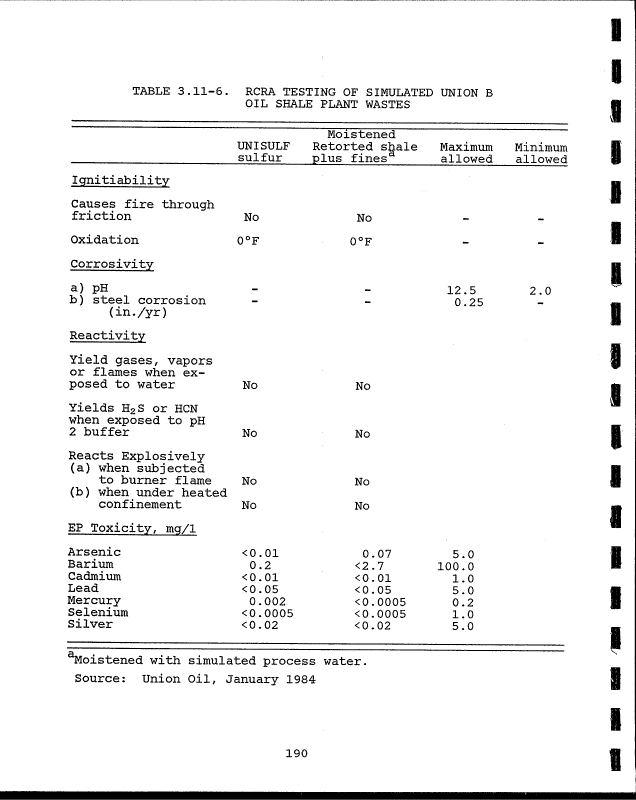
3.11-6 RCRA Testing Of Simulated Union B Oil Shale :
Plant Wastes ; . 190
i
3.12-1 Physical Properties of Union SGR Spent Shale.i . 193
3.12-2 Particle Size, pH, and Electrical Conductivity
of Spent Oil Shales Produced by Union SGR
Retorting Process . 193
xix
image:
TABLES (continued) j
Number I Page
3.9-1 General Water Quality Parameters of Superior!
Oil Shale Process Water j . 173
3.9-2 Inorganic Composition of Superior Leachate i
Produced by the ASTM Test Method D3987. . .' . 174
3.9-3 The Effect of Coproducted Retort Waters on tne
Quality of Superior Leachates from Spent
Shales j . 175
3.9-4 Effect of Distilled Water, and Time on the !
Leachate Quality of Moistened, Compacted
Superior Spent Shales ! . 175
3.9-5 Concentration of Metals in Leachates from '••
Superior Retorted Shales '', . 175
3.10-1 Physical Properties of Union A Spent Shale. .: . 180
3.10-2 Chemical Properties of Union A Retorted Shale . 180
3.10-3 Analysis of Leachate Obtained in Laboratory '
Tests of Union A Raw and Retorted Shale . .! . 181
3.10-4 Inorganic Composition of Leachates from Union| A
Spent Shale • . isi
3.11-1 Inventory of Streams to be Disposed of as :
Solid Wastes in Union B Process [ . 186
i
3.11-2 Physical Properties of Union B Spent Shale. .! . 187
]
3.11-3 Chemical Properties of Union B Retorted Shale! . 187
3.11-4 Estimated Composition of Union B Process Water
In the Active Basin and the Reuse Water Sump. 188
3.11-5 Inorganic Composition of Leachates from UnioniB
Spent Shale, mg/L j . 189
3.11-6 RCRA Testing Of Simulated Union B Oil Shale :
Plant Wastes ; . 190
i
3.12-1 Physical Properties of Union SGR Spent Shale.i . 193
3.12-2 Particle Size, pH, and Electrical Conductivity
of Spent Oil Shales Produced by Union SGR
Retorting Process . 193
xix
image:
 1
TABLES (continued)
Number Page •
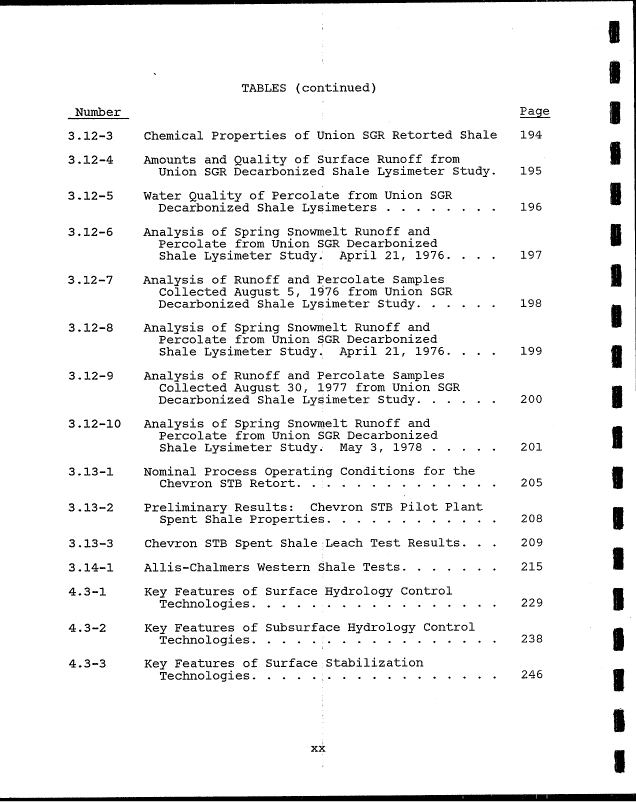
3.12-3 Chemical Properties of Union SGR Retorted Shale 194
3.12-4 Amounts and Quality of Surface Runoff from ff
Union SGR Decarbonized Shale Lysimeter Study. 195
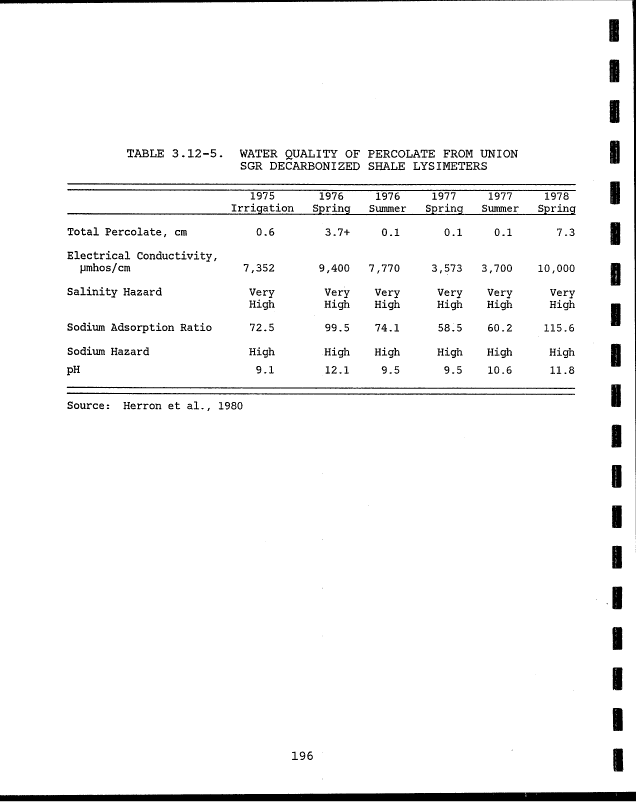
3.12-5 Water Quality of Percolate from Union SGR •
Decarbonized Shale Lysimeters 196
3.12-6 Analysis of Spring Snowmelt Runoff and •
Percolate from Union SGR Decarbonized •
Shale Lysimeter Study. April 21, 1976. . . . 197
xx
I
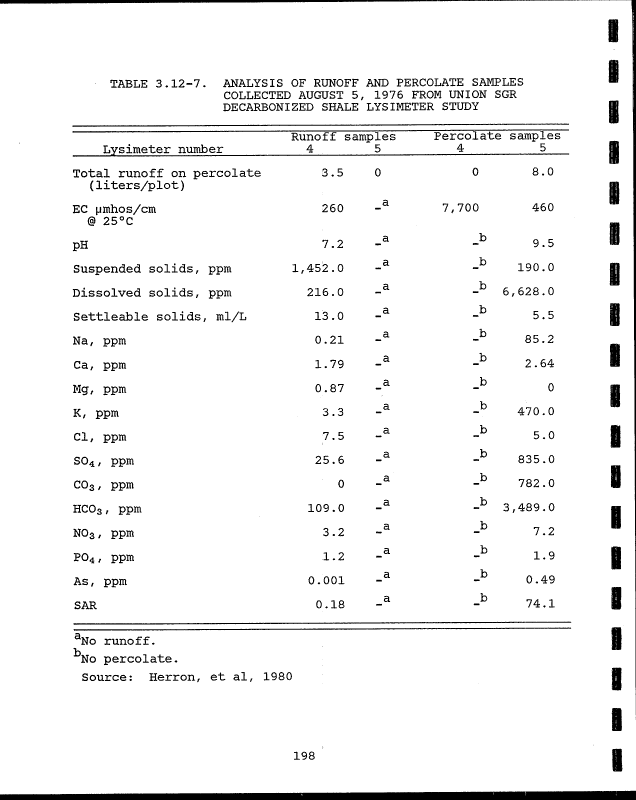
3.12-7 Analysis of Runoff and Percolate Samples
Collected August 5, 1976 from Union SGR
Decarbonized Shale Lysimeter Study 198
3.12-8 Analysis of Spring Snowmelt Runoff and
Percolate from Union SGR Decarbonized
Shale Lysimeter Study.' April 21, 1976. . . . 199 jfl
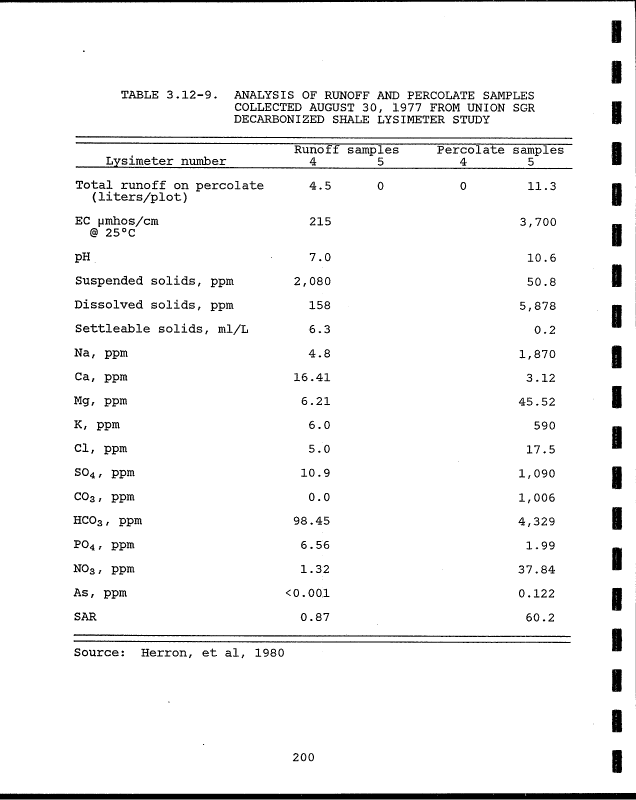
3.12-9 Analysis of Runoff and Percolate Samples
Collected August 30, 1977 from Union SGR
Decarbonized Shale Lysimeter Study 200
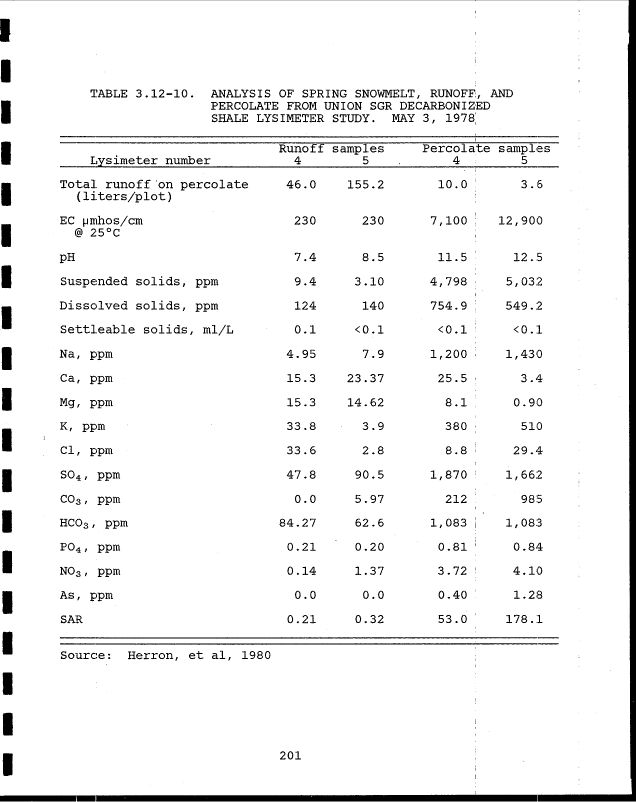
3.12-10 Analysis of Spring Snowmelt Runoff and
Percolate from Union SGR Decarbonize
Shale Lysimeter Study. May 3, 1978 201
Percolate from Union SGR Decarbonized •
•
Chevron STB Retort. ... .......... 205 J§
3.13-1 Nominal Process Operating Conditions for the
Chevron STB Retort. ...
3.13-2 Preliminary Results: Chevron STB Pilot Plant «
Spent Shale Properties ............ 208 9
3.13-3 Chevron STB Spent Shale : Leach Test Results. . . 209
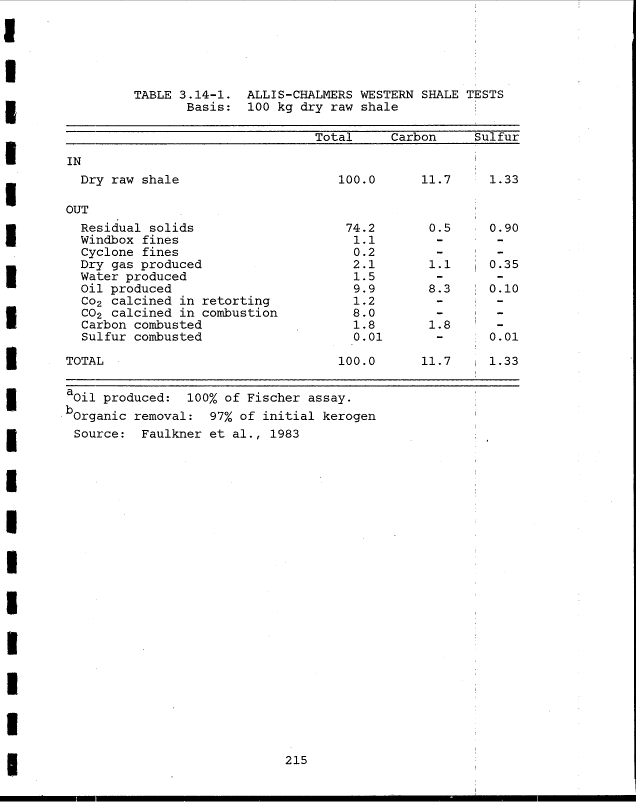
3.14-1 Allis-Chalmers Western Shale Tests ..... . . 215 •
Technologies 229 ||
4.3-1 Key Features of Surface Hydrology Control
Technologies ..... .........
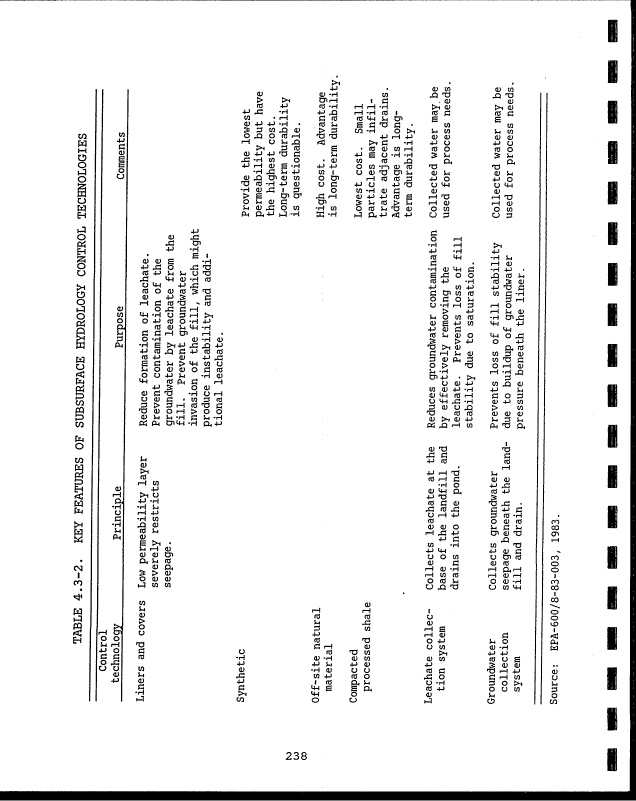
4.3-2 Key Features of Subsurface Hydrology Control —
Technologies ..... ............ 238 •
4.3-3 Key Features of Surface Stabilization
Technologies ..... ; ............ 246 0
I
I
image:
1
TABLES (continued)
Number Page •
3.12-3 Chemical Properties of Union SGR Retorted Shale 194
3.12-4 Amounts and Quality of Surface Runoff from ff
Union SGR Decarbonized Shale Lysimeter Study. 195
3.12-5 Water Quality of Percolate from Union SGR •
Decarbonized Shale Lysimeters 196
3.12-6 Analysis of Spring Snowmelt Runoff and •
Percolate from Union SGR Decarbonized •
Shale Lysimeter Study. April 21, 1976. . . . 197
xx
I
3.12-7 Analysis of Runoff and Percolate Samples
Collected August 5, 1976 from Union SGR
Decarbonized Shale Lysimeter Study 198
3.12-8 Analysis of Spring Snowmelt Runoff and
Percolate from Union SGR Decarbonized
Shale Lysimeter Study.' April 21, 1976. . . . 199 jfl
3.12-9 Analysis of Runoff and Percolate Samples
Collected August 30, 1977 from Union SGR
Decarbonized Shale Lysimeter Study 200
3.12-10 Analysis of Spring Snowmelt Runoff and
Percolate from Union SGR Decarbonize
Shale Lysimeter Study. May 3, 1978 201
Percolate from Union SGR Decarbonized •
•
Chevron STB Retort. ... .......... 205 J§
3.13-1 Nominal Process Operating Conditions for the
Chevron STB Retort. ...
3.13-2 Preliminary Results: Chevron STB Pilot Plant «
Spent Shale Properties ............ 208 9
3.13-3 Chevron STB Spent Shale : Leach Test Results. . . 209
3.14-1 Allis-Chalmers Western Shale Tests ..... . . 215 •
Technologies 229 ||
4.3-1 Key Features of Surface Hydrology Control
Technologies ..... .........
4.3-2 Key Features of Subsurface Hydrology Control —
Technologies ..... ............ 238 •
4.3-3 Key Features of Surface Stabilization
Technologies ..... ; ............ 246 0
I
I
image:
 TABLES (continued)
Number
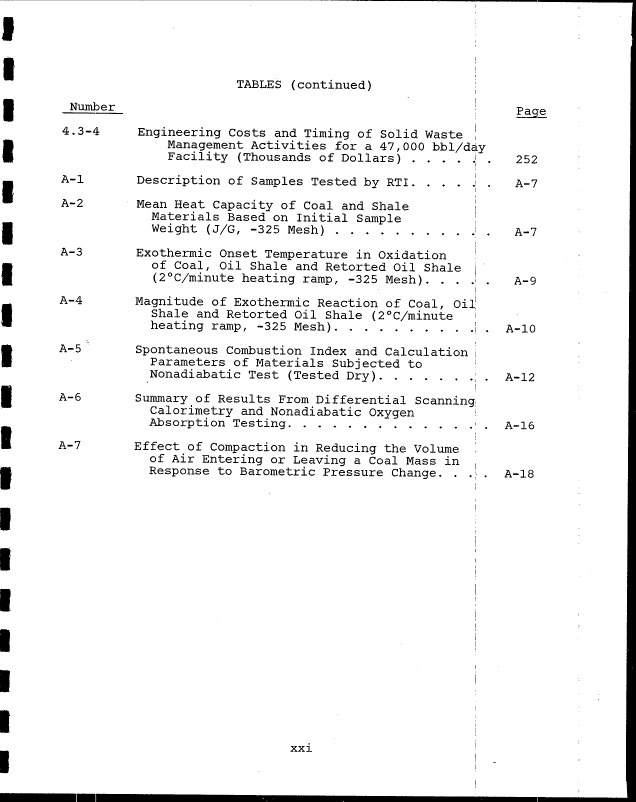
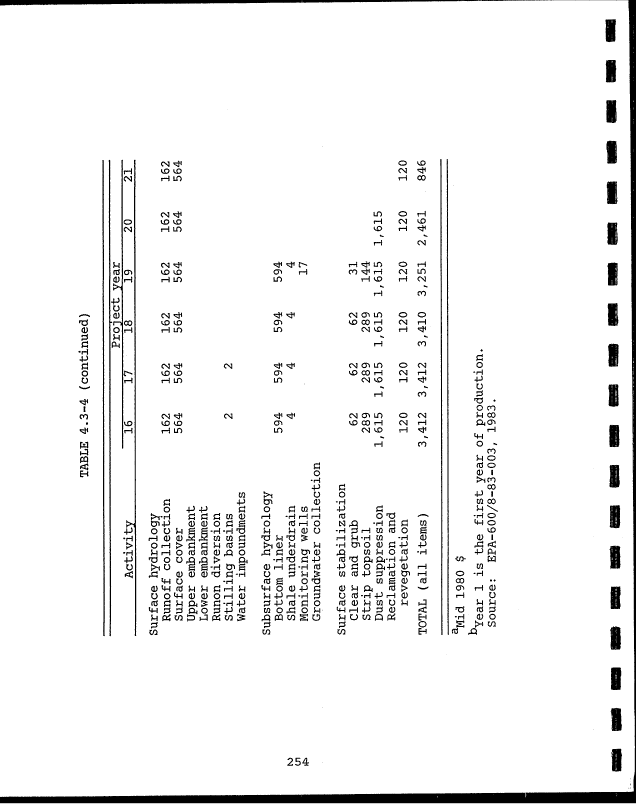
4.3-4 Engineering Costs and Timing of Solid Waste
Management Activities for a 47,000 bbl/day
Facility (Thousands of Dollars) . . . . j . 252
A-! Description of Samples Tested by RTI. . . . J . A-7
A-2 Mean Heat Capacity of Coal and Shale
Materials Based on Initial Sample
Weight (J/G, -325 Mesh) i . A-7
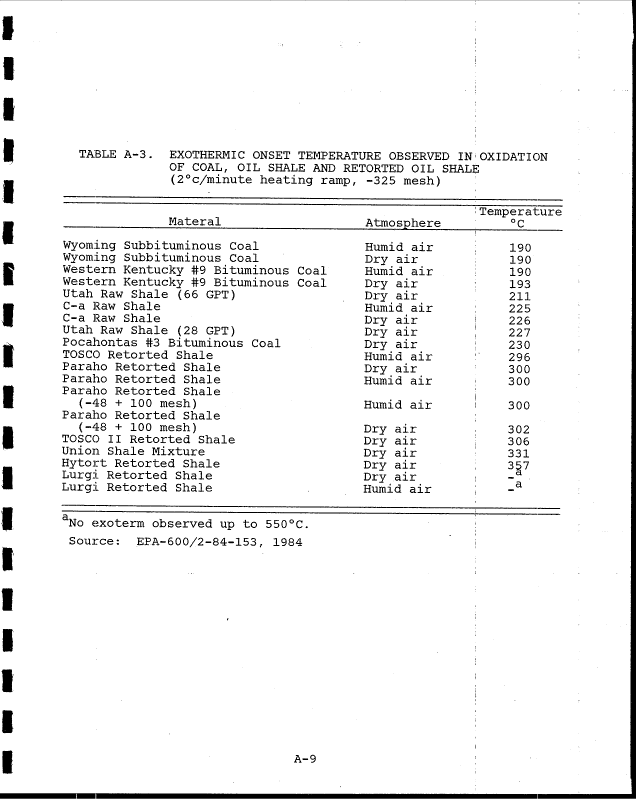
A~3 Exothermic Onset Temperature in Oxidation •
of Coal, Oil Shale and Retorted Oil Shale
(2°C/minute heating ramp, -325 Mesh) A-9
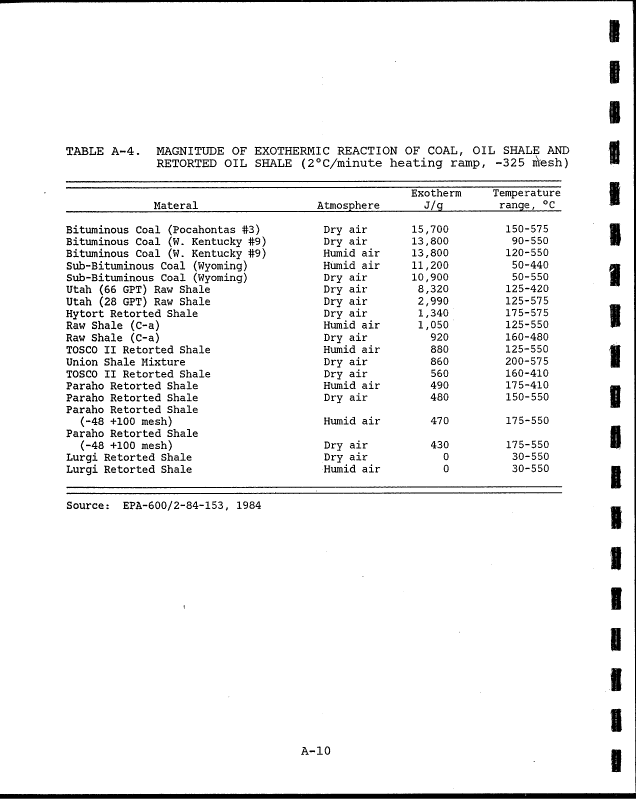
A-4 Magnitude of Exothermic Reaction of Coal, oil|
Shale and Retorted Oil Shale (2°C/minute i
heating ramp, -325 Mesh) \ . A-10
A-5 Spontaneous Combustion Index and Calculation i
Parameters of Materials Subjected to l
Nonadiabatic Test (Tested Dry) ; . A-12
!
A-6 Summary of Results From Differential Scanning
Calorimetry and Nonadiabatic Oxygen i
Absorption Testing ! A-16
A-7 Effect of Compaction in Reducing the Volume !
of Air Entering or Leaving a Coal Mass in
Response to Barometric Pressure Change. . .•- . A-18
xxx
image:
TABLES (continued)
Number
4.3-4 Engineering Costs and Timing of Solid Waste
Management Activities for a 47,000 bbl/day
Facility (Thousands of Dollars) . . . . j . 252
A-! Description of Samples Tested by RTI. . . . J . A-7
A-2 Mean Heat Capacity of Coal and Shale
Materials Based on Initial Sample
Weight (J/G, -325 Mesh) i . A-7
A~3 Exothermic Onset Temperature in Oxidation •
of Coal, Oil Shale and Retorted Oil Shale
(2°C/minute heating ramp, -325 Mesh) A-9
A-4 Magnitude of Exothermic Reaction of Coal, oil|
Shale and Retorted Oil Shale (2°C/minute i
heating ramp, -325 Mesh) \ . A-10
A-5 Spontaneous Combustion Index and Calculation i
Parameters of Materials Subjected to l
Nonadiabatic Test (Tested Dry) ; . A-12
!
A-6 Summary of Results From Differential Scanning
Calorimetry and Nonadiabatic Oxygen i
Absorption Testing ! A-16
A-7 Effect of Compaction in Reducing the Volume !
of Air Entering or Leaving a Coal Mass in
Response to Barometric Pressure Change. . .•- . A-18
xxx
image:
 ACKNOWLEDGMENT
1
I
I
I
This study and the preparation of this report has involved «
participation of professionals from Monsanto and independent •
consultants. Dr. Shib C. Chattoraj's work in developing this m
report is very much appreciated. The contributions of Dr. Arthur
D. Snyder and Mr. Duane R. Day are acknowledged. Also Mr. Robert H
N. Heistand provided valuable review comments. The liner study m
was performed by Denver Research Institute.
The project is deeply indebted to the EPA Project Officer,
Mr. Edward R. Bates for his continuing advice and guidance
during the course of this effort. ;
XXI1
1
1
I
I
I
I
I
I
I
I
I
image:
ACKNOWLEDGMENT
1
I
I
I
This study and the preparation of this report has involved «
participation of professionals from Monsanto and independent •
consultants. Dr. Shib C. Chattoraj's work in developing this m
report is very much appreciated. The contributions of Dr. Arthur
D. Snyder and Mr. Duane R. Day are acknowledged. Also Mr. Robert H
N. Heistand provided valuable review comments. The liner study m
was performed by Denver Research Institute.
The project is deeply indebted to the EPA Project Officer,
Mr. Edward R. Bates for his continuing advice and guidance
during the course of this effort. ;
XXI1
1
1
I
I
I
I
I
I
I
I
I
image:
 SECTION 1
INTRODUCTION
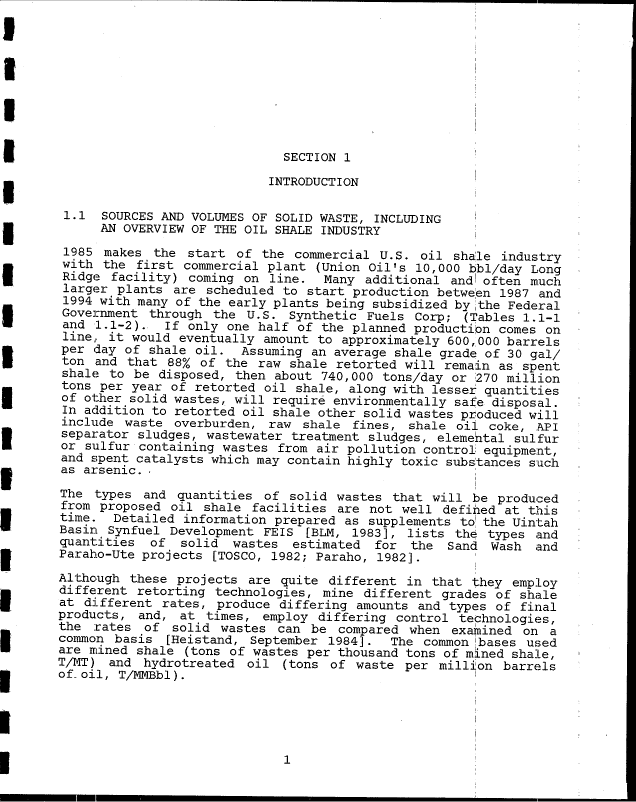
1.1 SOURCES AND VOLUMES OF SOLID WASTE, INCLUDING !
AN OVERVIEW OF THE OIL SHALE INDUSTRY j
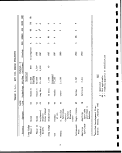
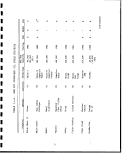
1985 makes the start of the commercial U.S. oil shale industry
with the first commercial plant (Union Oil's 10,000 bbl/day Long
Ridge facility) coming on line. Many additional and often much
larger plants are scheduled to start production between 1987 and
1994 with many of the early plants being subsidized by jthe Federal
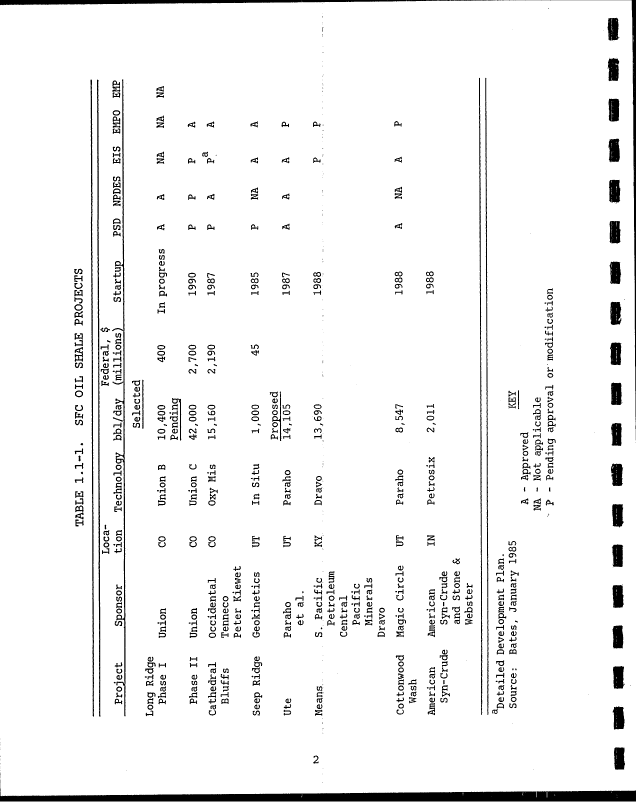
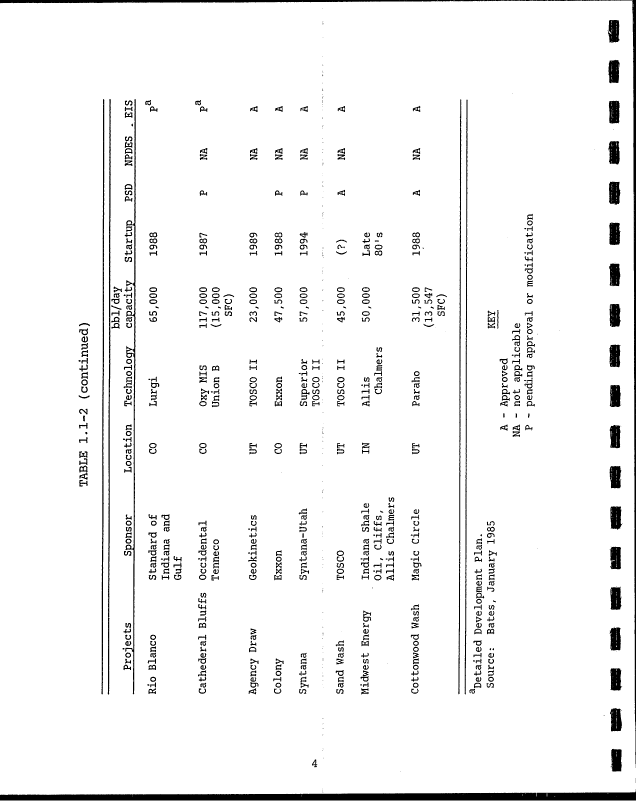
Government through the U.S. Synthetic Fuels Corp; (Tables 1.1-1
and 1.1-2). If only one half of the planned production comes on
line, it would eventually amount to approximately 600,000 barrels
per day of shale oil. Assuming an average shale grade of 30 gal/
ton and that 88% of the raw shale retorted will remain as spent
shale to be disposed, then about 740,000 tons/day or i270 million
tons per year of retorted oil shale, along with lesser quantities
of other solid wastes, will require environmentally safe disposal.
In addition to retorted oil shale other solid wastes produced will
include waste overburden, raw shale fines, shale oil coke, API
separator sludges, wastewater treatment sludges, elemental sulfur
or sulfur containing wastes from air pollution control equipment,
and spent catalysts which may contain highly toxic substances such
as arsenic. . ;
!
I
The types and quantities of solid wastes that will be produced
from proposed oil shale facilities are not well defiited at this
time. Detailed information prepared as supplements to' the Uintah
Basin Synfuel Development FEIS [BLM, 1983], lists the types and
quantities of solid wastes estimated for the Sand Wash and
Paraho-Ute projects [TOSCO, 1982; Paraho, 1982].
Although these projects are quite different in that they employ
different retorting technologies, mine different grades of shale
at different rates, produce differing amounts and types of final
products, and, at times, employ differing control technologies,
the rates of solid wastes can be compared when examined on a
common basis [Heistand, September 1984]. The common !bases used
are mined shale (tons of wastes per thousand tons of mined shale,
T/MT) and hydrotreated oil (tons of waste per million barrels
of., oil, T/MMBbl). i
image:
SECTION 1
INTRODUCTION
1.1 SOURCES AND VOLUMES OF SOLID WASTE, INCLUDING !
AN OVERVIEW OF THE OIL SHALE INDUSTRY j
1985 makes the start of the commercial U.S. oil shale industry
with the first commercial plant (Union Oil's 10,000 bbl/day Long
Ridge facility) coming on line. Many additional and often much
larger plants are scheduled to start production between 1987 and
1994 with many of the early plants being subsidized by jthe Federal
Government through the U.S. Synthetic Fuels Corp; (Tables 1.1-1
and 1.1-2). If only one half of the planned production comes on
line, it would eventually amount to approximately 600,000 barrels
per day of shale oil. Assuming an average shale grade of 30 gal/
ton and that 88% of the raw shale retorted will remain as spent
shale to be disposed, then about 740,000 tons/day or i270 million
tons per year of retorted oil shale, along with lesser quantities
of other solid wastes, will require environmentally safe disposal.
In addition to retorted oil shale other solid wastes produced will
include waste overburden, raw shale fines, shale oil coke, API
separator sludges, wastewater treatment sludges, elemental sulfur
or sulfur containing wastes from air pollution control equipment,
and spent catalysts which may contain highly toxic substances such
as arsenic. . ;
!
I
The types and quantities of solid wastes that will be produced
from proposed oil shale facilities are not well defiited at this
time. Detailed information prepared as supplements to' the Uintah
Basin Synfuel Development FEIS [BLM, 1983], lists the types and
quantities of solid wastes estimated for the Sand Wash and
Paraho-Ute projects [TOSCO, 1982; Paraho, 1982].
Although these projects are quite different in that they employ
different retorting technologies, mine different grades of shale
at different rates, produce differing amounts and types of final
products, and, at times, employ differing control technologies,
the rates of solid wastes can be compared when examined on a
common basis [Heistand, September 1984]. The common !bases used
are mined shale (tons of wastes per thousand tons of mined shale,
T/MT) and hydrotreated oil (tons of waste per million barrels
of., oil, T/MMBbl). i
image:
 CO
EH
o
W
1-3
Q
P^
FM
£3
>5
PH
w
t ^
M
O
a
*
H
1
H
*
TTT
ff\
EH
1
o
s
M
M
W
cn
Q
Q
in
PH
a
5
^
re
cn
W
«5 -rH
ti rH
0) rH
rO *fH
cu E
—
rH
42
a
o
1
CJ
cu
H
1
re c
u o
0 -H
t-3 4J
tj
o
10
§
a
cn
4J
CJ
cu
•r-t
O
PM
i! '
£5 aS as aS PH PH< PH
as re , •
3 PH PH <! <; PH <;
|«3 i rt
rf PH as & as &
•
aS PH PH PH OS aS
W '•
in
cu
0i o c** m c*— CO1 co oo
o cr> co ooooco coco
fc-i CFi CJ"* CT* CT* CT* CT» O"*
ft rH rH rH rH rH rH rH
C
f
o o o m
f*i f^ cy^ *cj*
^J* r— rH ,
^ •. '
CM CM ;
•a
cu
4-J T3
CJ 01 CU
cuocoo owmo r-rH
rHO-HOlD OOO O> 'i' rH
CD <4('OOtH O&rH \D m O
cn - c - o - -
OCUCMin rHS-i^CO COCM
iH pH ^* rH P-t rH rH
'• «
CQ CJ w 3 ! -H
-H 4-> O O W
CSS -H x: a ,c p
o o cn re P" re 5-1
•H -H >i ^ re i-< 4-J
GGrl Grexi recu
&C3O MPUQ PnpH
OOO H EH tx H S
CJCJCJ C3t3b>H OtH
Cc>
4-> CU
CU W H ' — 1 CU CU
1-130 u,3 wu tse
reai-H -iHCUCJrH Vj 3Ow
4-)-rH4J •WHrH-Hre -H CS-«4->CU
G O $4 V I— l-HOrH"4Hi-i CJ »BCJCn4->
cucj c orecji^re-Hcu 01 w
C CT3CUS-1-H X! «4->ljCJfiOCJ •iHCS'Oja
o o "H G cu rW re 4-* PH cu 4-> re ~H K* *ri i-i t^ c cu
•H -iHCJC4->o Sicu pHCPnSre0> cucnres
G cucucucu re -cu s^re s
D &OHPHCS PH cnCJ OS i^
cu
CU M tt) T3 'O
CT> M M rH tjl OS
•o re w 'O o c >-i
•HO) CUS*<4H-rH SreCJ
oiw w'O'wcs! ; CXSCJi
rerecus w OW-HC
0>X!43J3rH p, C' 4J a} ^i >i
pjpH PM 4-J pa cu cu re 4->|scucn
o re cu 4-> cu OS
^i CJ cn & S cj r^
C
o
.p
re
CJ
•H
iw
-H
O
S
&-!
O
rH
>H re
!sj rH O
X) S-
re &
u a.
•H re
a) 'o, tn
> & C
o re -H
G, o cu
as & PH
1 t 1
rc^ f^ 1^1
S ,
in
co
• CTi
C rH
re
rH ^*J
PH ^-4
re
4-J 3
a G
cu re
E r}
0* -
rH W
cu cu
> -P
<u re
O CQ
cu ••
rH CU
•H CJ
re i-i
4-» 3
cu o
o cn
re
1
f
I
1
1
I
1
I
I
I
I
I
I
1
I
I
I
I
I
image:
CO
EH
o
W
1-3
Q
P^
FM
£3
>5
PH
w
t ^
M
O
a
*
H
1
H
*
TTT
ff\
EH
1
o
s
M
M
W
cn
Q
Q
in
PH
a
5
^
re
cn
W
«5 -rH
ti rH
0) rH
rO *fH
cu E
—
rH
42
a
o
1
CJ
cu
H
1
re c
u o
0 -H
t-3 4J
tj
o
10
§
a
cn
4J
CJ
cu
•r-t
O
PM
i! '
£5 aS as aS PH PH< PH
as re , •
3 PH PH <! <; PH <;
|«3 i rt
rf PH as & as &
•
aS PH PH PH OS aS
W '•
in
cu
0i o c** m c*— CO1 co oo
o cr> co ooooco coco
fc-i CFi CJ"* CT* CT* CT* CT» O"*
ft rH rH rH rH rH rH rH
C
f
o o o m
f*i f^ cy^ *cj*
^J* r— rH ,
^ •. '
CM CM ;
•a
cu
4-J T3
CJ 01 CU
cuocoo owmo r-rH
rHO-HOlD OOO O> 'i' rH
CD <4('OOtH O&rH \D m O
cn - c - o - -
OCUCMin rHS-i^CO COCM
iH pH ^* rH P-t rH rH
'• «
CQ CJ w 3 ! -H
-H 4-> O O W
CSS -H x: a ,c p
o o cn re P" re 5-1
•H -H >i ^ re i-< 4-J
GGrl Grexi recu
&C3O MPUQ PnpH
OOO H EH tx H S
CJCJCJ C3t3b>H OtH
Cc>
4-> CU
CU W H ' — 1 CU CU
1-130 u,3 wu tse
reai-H -iHCUCJrH Vj 3Ow
4-)-rH4J •WHrH-Hre -H CS-«4->CU
G O $4 V I— l-HOrH"4Hi-i CJ »BCJCn4->
cucj c orecji^re-Hcu 01 w
C CT3CUS-1-H X! «4->ljCJfiOCJ •iHCS'Oja
o o "H G cu rW re 4-* PH cu 4-> re ~H K* *ri i-i t^ c cu
•H -iHCJC4->o Sicu pHCPnSre0> cucnres
G cucucucu re -cu s^re s
D &OHPHCS PH cnCJ OS i^
cu
CU M tt) T3 'O
CT> M M rH tjl OS
•o re w 'O o c >-i
•HO) CUS*<4H-rH SreCJ
oiw w'O'wcs! ; CXSCJi
rerecus w OW-HC
0>X!43J3rH p, C' 4J a} ^i >i
pjpH PM 4-J pa cu cu re 4->|scucn
o re cu 4-> cu OS
^i CJ cn & S cj r^
C
o
.p
re
CJ
•H
iw
-H
O
S
&-!
O
rH
>H re
!sj rH O
X) S-
re &
u a.
•H re
a) 'o, tn
> & C
o re -H
G, o cu
as & PH
1 t 1
rc^ f^ 1^1
S ,
in
co
• CTi
C rH
re
rH ^*J
PH ^-4
re
4-J 3
a G
cu re
E r}
0* -
rH W
cu cu
> -P
<u re
O CQ
cu ••
rH CU
•H CJ
re i-i
4-» 3
cu o
o cn
re
1
f
I
1
1
I
1
I
I
I
I
I
I
1
I
I
I
I
I
image:
 CO
CJ
i--j
O
05
W
CO
n
0
iNSORED
o
CM
CO
o
fa
CO
125
O
a
CM
I
r-l
*
iH
Ixl
i-3
1
^
l-
£t
to
W
c
Q
CO
AH
a
f»
4J
Si
n
4.,
to
tO "^
T3 CJ
•H C
*^_
&
O
Technol
^
0
•H
4J
nj
O
O
t-3
Si
o
U
C
o
£
M
U
(U
•n
O
Si
AH
AH
AH
AH
^*
r~)
0 0
o o - — .
O O CJ
" " fcl
O CM CO
CJ
C
o
-H
O
O
§
•H
a
M
*~*
0)
CO
f!
AH
£j
O
"jc
»
to
AH
AH
*
0^
00
_J
0
o
o
o
o
rH
t
m o
C "si 0
O <U CJ
& to H
6
o
•H
X! 10
0 G,
CO -H
rH
§3
CO AH
(U
>
•H
OS
<U
4-J
•H
3s
l4j
'
CM
CT>
^H
o
0
0
o
o
rH
•
(O O
•H O
f* t-i _<-;
O <U (0
!3 CO AH
8
en
Si
0)
C
rH Si
"iH fO
_O O-
"S "
rH
"H
•8
a
rt!
1
0
£
rH
O
O
O
0
0
J_l
o
-H
Si 0
a) a
§-8
CO H
8
w
MH
U-4
-H
Si rH
O CJ
•H
Si • O
<U > -H
CO CJ CO
U
-H
iw
•H
U
(C
AH
r43 (^
1 1
O rH
cn en
cri cr>
rH rH
O 0
0 0
o o
0 0
0 0
iH rH
C -H C -H
O o^ O o*
•H S^i -H CO JM
8 8
-H
0)
to
U
>) 0)
4-> -H
<U -H
O CJ
<U
U
•H
Si
<l)
to
w
>-< 0)
4-J -H
4-) 4->
<U -H
O CJ
Aj i^
i <!
AH r4
o co
CTi CO
Ol 0>
iH rH
O O O
O O O . — .
O O O CJ
O CM •* CO
O ^ rH
C
o o
Si CQ JS
> EH R5
0) CO Si
CJ AH
O H
0 O
!
t-«
O O 0 •
*1 U .£3 rH
K* O fO <0
(U C Si
J3 O JO -P
CJ cj p., a;
O <D
Si H^
r\
Q
Si (i
(0 (0
0) Si
rH tO
CJ A,
TJ
<U
3
•H
4-J
§
u
image:
CO
CJ
i--j
O
05
W
CO
n
0
iNSORED
o
CM
CO
o
fa
CO
125
O
a
CM
I
r-l
*
iH
Ixl
i-3
1
^
l-
£t
to
W
c
Q
CO
AH
a
f»
4J
Si
n
4.,
to
tO "^
T3 CJ
•H C
*^_
&
O
Technol
^
0
•H
4J
nj
O
O
t-3
Si
o
U
C
o
£
M
U
(U
•n
O
Si
AH
AH
AH
AH
^*
r~)
0 0
o o - — .
O O CJ
" " fcl
O CM CO
CJ
C
o
-H
O
O
§
•H
a
M
*~*
0)
CO
f!
AH
£j
O
"jc
»
to
AH
AH
*
0^
00
_J
0
o
o
o
o
rH
t
m o
C "si 0
O <U CJ
& to H
6
o
•H
X! 10
0 G,
CO -H
rH
§3
CO AH
(U
>
•H
OS
<U
4-J
•H
3s
l4j
'
CM
CT>
^H
o
0
0
o
o
rH
•
(O O
•H O
f* t-i _<-;
O <U (0
!3 CO AH
8
en
Si
0)
C
rH Si
"iH fO
_O O-
"S "
rH
"H
•8
a
rt!
1
0
£
rH
O
O
O
0
0
J_l
o
-H
Si 0
a) a
§-8
CO H
8
w
MH
U-4
-H
Si rH
O CJ
•H
Si • O
<U > -H
CO CJ CO
U
-H
iw
•H
U
(C
AH
r43 (^
1 1
O rH
cn en
cri cr>
rH rH
O 0
0 0
o o
0 0
0 0
iH rH
C -H C -H
O o^ O o*
•H S^i -H CO JM
8 8
-H
0)
to
U
>) 0)
4-> -H
<U -H
O CJ
<U
U
•H
Si
<l)
to
w
>-< 0)
4-J -H
4-) 4->
<U -H
O CJ
Aj i^
i <!
AH r4
o co
CTi CO
Ol 0>
iH rH
O O O
O O O . — .
O O O CJ
O CM •* CO
O ^ rH
C
o o
Si CQ JS
> EH R5
0) CO Si
CJ AH
O H
0 O
!
t-«
O O 0 •
*1 U .£3 rH
K* O fO <0
(U C Si
J3 O JO -P
CJ cj p., a;
O <D
Si H^
r\
Q
Si (i
(0 (0
0) Si
rH tO
CJ A,
TJ
<U
3
•H
4-J
§
u
image:
 *••%
T3
1
K
•H
•M
H
O
U
CN
I
H
*
"
W
I—I
§
EH
cn
t-H
cn
fa
a
cn
PM
g
4->
M
CO
4J
cn
&"t 4«)
CO -H
T3 U
^ CO
rH d
XJ CO
rQ U
fc
&
O
rH
O
CJ
O>
EH
G
O
B_J
•n
CO
o
fj
J*-l
o
w
G
g
cn
W
4J
U
0)
•n
O
S-i
PM
CO
CO
CO
cn
rH
O
O
O
*.
in
vO
-rH
t_3
O
U
<4H TJ
0 C
CO
S-j CO
CO G
T3 OJ
G -H MH
CO T3 rH
4-> C 3
cn M o
O
U
G
CO
CQ
O
-rH
K
CO
*3
PM
p-
CO
cn
rH
o o
00-—
o o u
- - to
r- m cn
rH rH
cn CQ
M
0 £3
o
u
r-H
(0
G 0
4> U
rO 4)
-H C
U G
U 4)
0 E-t
W
MH
t(_l
•-J
rH
OQ
rH
to
4>
(U
to
CJ
«l
rtj
S
cn
co
rH
0
o
o
CO
OJ
M
M
O
U
cn
o
H
£_,
S3
W
CJ
-H
4_)
(U
•H
AS
0
O)
O
£f
to
S-.
Q
1^1
O
0)
cn
rtj
««
rt!
S
PM
CO
CO
rH
0
O
in
^
r-
^4
G
1
W
o
CJ
G
0
^
W
^1
G
0
rH
0
O
r
rf!
f3j ':
ss ,
a,
i
*&
cn
cn
rH !
I
O
O
o
•.
f-
m
s-i M ;
O M
•H
>-i O ;
(U CJ
i-8.
CO EH
i
&j
b ;
!
PJM '
to
JJ
S3 '
1
W
4-)
G :
tn
•
t
as
G ''
co
•»J
i^t
cn
«G
f^l
S
st!
x^^s
f\,«
•^^/
o
o
o
«.
in
^J1
M
M
O
CJ
tn
o
£_,
^
O
CJ
cn
o
JS
Ul
CO
T3
G
(0
cn
0) CQ
to o
h4 CO
o
o
o
*.
o
in
to
0)
rH
W fO
•H CJ
r-H
r3n
>2
M
U)
0) S-<
rH ^4)
to w g
^G <4H r-H
OT 14H fO
tO rH CJ
G a
to m
•H --H
T3 rH r-l
G -H rH
M O rfj
^|
o>
{,_!
OJ
d
H
4-*
W
d)
•1
-H
s
rf!
^J
*
CO
co
cn.
rH
o r-
CD *^ ^^**
in m cj
» - fci
I-H ro cn
n I-H
O
to
to
PM
^
&
(U
rH
CJ
S-i
-H
CJ
CJ
•r)
C7^
to
g
Jf{
W
CO
1^
O
o
C5
0
4->
4-1
0
CJ
K""*
w
»^4
m
co
• cn
G T-H
to
PM ^
ft)
G §
4) fO
g >-3
ex
0 -
rH W
4) 4)
> -P
4) (0
f^ pf*|
T3
4) ..
rH 4)
•H CJ
4-> 3
0 0
o tn
to
G
o
-H
4_)
fO
CJ
-H
"4-1
TJ
0
g
JbJ
O
rH
CO
4) >
rH O
to a,
CJ P!
"rH <0
"0 rH
<U (H, 151
2 ^1
&.4J G
^>t o (U
<c c a,
i i i
<; <l PM
'Z
1
I
1
I
I
I
I
I
I
1
1
I
I
I
1
I
I
1
I
image:
*••%
T3
1
K
•H
•M
H
O
U
CN
I
H
*
"
W
I—I
§
EH
cn
t-H
cn
fa
a
cn
PM
g
4->
M
CO
4J
cn
&"t 4«)
CO -H
T3 U
^ CO
rH d
XJ CO
rQ U
fc
&
O
rH
O
CJ
O>
EH
G
O
B_J
•n
CO
o
fj
J*-l
o
w
G
g
cn
W
4J
U
0)
•n
O
S-i
PM
CO
CO
CO
cn
rH
O
O
O
*.
in
vO
-rH
t_3
O
U
<4H TJ
0 C
CO
S-j CO
CO G
T3 OJ
G -H MH
CO T3 rH
4-> C 3
cn M o
O
U
G
CO
CQ
O
-rH
K
CO
*3
PM
p-
CO
cn
rH
o o
00-—
o o u
- - to
r- m cn
rH rH
cn CQ
M
0 £3
o
u
r-H
(0
G 0
4> U
rO 4)
-H C
U G
U 4)
0 E-t
W
MH
t(_l
•-J
rH
OQ
rH
to
4>
(U
to
CJ
«l
rtj
S
cn
co
rH
0
o
o
CO
OJ
M
M
O
U
cn
o
H
£_,
S3
W
CJ
-H
4_)
(U
•H
AS
0
O)
O
£f
to
S-.
Q
1^1
O
0)
cn
rtj
««
rt!
S
PM
CO
CO
rH
0
O
in
^
r-
^4
G
1
W
o
CJ
G
0
^
W
^1
G
0
rH
0
O
r
rf!
f3j ':
ss ,
a,
i
*&
cn
cn
rH !
I
O
O
o
•.
f-
m
s-i M ;
O M
•H
>-i O ;
(U CJ
i-8.
CO EH
i
&j
b ;
!
PJM '
to
JJ
S3 '
1
W
4-)
G :
tn
•
t
as
G ''
co
•»J
i^t
cn
«G
f^l
S
st!
x^^s
f\,«
•^^/
o
o
o
«.
in
^J1
M
M
O
CJ
tn
o
£_,
^
O
CJ
cn
o
JS
Ul
CO
T3
G
(0
cn
0) CQ
to o
h4 CO
o
o
o
*.
o
in
to
0)
rH
W fO
•H CJ
r-H
r3n
>2
M
U)
0) S-<
rH ^4)
to w g
^G <4H r-H
OT 14H fO
tO rH CJ
G a
to m
•H --H
T3 rH r-l
G -H rH
M O rfj
^|
o>
{,_!
OJ
d
H
4-*
W
d)
•1
-H
s
rf!
^J
*
CO
co
cn.
rH
o r-
CD *^ ^^**
in m cj
» - fci
I-H ro cn
n I-H
O
to
to
PM
^
&
(U
rH
CJ
S-i
-H
CJ
CJ
•r)
C7^
to
g
Jf{
W
CO
1^
O
o
C5
0
4->
4-1
0
CJ
K""*
w
»^4
m
co
• cn
G T-H
to
PM ^
ft)
G §
4) fO
g >-3
ex
0 -
rH W
4) 4)
> -P
4) (0
f^ pf*|
T3
4) ..
rH 4)
•H CJ
4-> 3
0 0
o tn
to
G
o
-H
4_)
fO
CJ
-H
"4-1
TJ
0
g
JbJ
O
rH
CO
4) >
rH O
to a,
CJ P!
"rH <0
"0 rH
<U (H, 151
2 ^1
&.4J G
^>t o (U
<c c a,
i i i
<; <l PM
'Z
1
I
1
I
I
I
I
I
I
1
1
I
I
I
1
I
I
1
I
image:
 Factors were determined on the basis of shale minied and oil
produced for sixteen solid wastes, grouped into two Categories,
as shown in Table 1.1-3 [Heistand, September 1984]. '
Using the factors presented in Table 1.1-3, it is possible to
calculate probable rates of various solid wastes produced based
upon projected mining rates and product oil production for the
above-ground oil shale retorting facilities. :
A surface retorting plant, such as a TOSCO II processing facility,
will be a source of large quanitities of plant wastes' which will
require disposal. Table 1.1-4 indicates the makeup of the waste
material that will be discarded .from a small TOSCO II plant over a
period of 20 years. !
1.2 POTENTIAL DANGERS TO HUMAN HEALTH AND THE ENVIRONMENT
FROM THE DISPOSAL AND REUSE OF THE WASTES i
Although oil shale facilities will produce huge volumes of solid
wastes, the potential for reuse of the wastes is small. Some
wastes such as spent catalysts could potentially be reclaimed and
recycled back into the process. Elemental sulfur, remojved by some
air pollution control technologies, has a limited market poten-
tial; however it remains to be demonstrated on a commercial scale
that there are no trace impurities that would constrain its use.
It is expected that hazardous wastes such as spent catalysts and
some sludges will be disposed in licensed hazardous wa|ste facili-
ties. However, one catalyst unique to shale oil upgrading is of
particular concern. The arsenic guard bed catalyst will contain
20% or more arsenic. No facilities exist to reprocess, this spent
catalyst and environmentally safe disposal may be difficult to
achieve. Other than the arsenic guard bed catalyst,: the major
unique dangers to health or the environment posed by oil shale
facilities may be from the long term effects of on site disposal
of millions of tons of retorted oil shale, raw oil shale waste,
and other process wastes. Principal concerns in thisiregard may
be summarized as follows: ;
1. A.uto oxidation/auto ignition may be a serious ;problem if
disposal of raw shale fines and/or carbonaceous spent shales
are not done in a manner to minimize this risk. !
i
2. High inorganic salt loading and possibly organics in leach-
ates from raw shale fines or spent shale could potentially
have significant impacts on groundwater supplies in the area
and on surface waters that supply millions of people (Color-
ado River). A related issue is to what extent should process
wastewaters be treated prior to codisposal with the retorted
shale. Codisposal of spent catalysts and treatment sludges
may also significantly impact the nature of leachates from
disposal sites. ]
image:
Factors were determined on the basis of shale minied and oil
produced for sixteen solid wastes, grouped into two Categories,
as shown in Table 1.1-3 [Heistand, September 1984]. '
Using the factors presented in Table 1.1-3, it is possible to
calculate probable rates of various solid wastes produced based
upon projected mining rates and product oil production for the
above-ground oil shale retorting facilities. :
A surface retorting plant, such as a TOSCO II processing facility,
will be a source of large quanitities of plant wastes' which will
require disposal. Table 1.1-4 indicates the makeup of the waste
material that will be discarded .from a small TOSCO II plant over a
period of 20 years. !
1.2 POTENTIAL DANGERS TO HUMAN HEALTH AND THE ENVIRONMENT
FROM THE DISPOSAL AND REUSE OF THE WASTES i
Although oil shale facilities will produce huge volumes of solid
wastes, the potential for reuse of the wastes is small. Some
wastes such as spent catalysts could potentially be reclaimed and
recycled back into the process. Elemental sulfur, remojved by some
air pollution control technologies, has a limited market poten-
tial; however it remains to be demonstrated on a commercial scale
that there are no trace impurities that would constrain its use.
It is expected that hazardous wastes such as spent catalysts and
some sludges will be disposed in licensed hazardous wa|ste facili-
ties. However, one catalyst unique to shale oil upgrading is of
particular concern. The arsenic guard bed catalyst will contain
20% or more arsenic. No facilities exist to reprocess, this spent
catalyst and environmentally safe disposal may be difficult to
achieve. Other than the arsenic guard bed catalyst,: the major
unique dangers to health or the environment posed by oil shale
facilities may be from the long term effects of on site disposal
of millions of tons of retorted oil shale, raw oil shale waste,
and other process wastes. Principal concerns in thisiregard may
be summarized as follows: ;
1. A.uto oxidation/auto ignition may be a serious ;problem if
disposal of raw shale fines and/or carbonaceous spent shales
are not done in a manner to minimize this risk. !
i
2. High inorganic salt loading and possibly organics in leach-
ates from raw shale fines or spent shale could potentially
have significant impacts on groundwater supplies in the area
and on surface waters that supply millions of people (Color-
ado River). A related issue is to what extent should process
wastewaters be treated prior to codisposal with the retorted
shale. Codisposal of spent catalysts and treatment sludges
may also significantly impact the nature of leachates from
disposal sites. ]
image:
 TABLE 1.1-3. APPROXIMATE SOLID WASTE RELATIONSHIPS
Type of waste
Mined shale
basis,
T/MT
Hydrotreated
oil basis,
T/MMBbl
Ma j or
Retorted shale
fRaw fines, dust, subore
Off-spec sulfur
Oily particles
WWT sludge
Scrap and garbage
834.5
784.4
58.8
1.3
0.49
0.14
0.10
Catalysts and other wastes
Methanator
Reformer
Hydro treater (HDN, HDS) •
Lo-temp CO shift
Alumina
DEA sludge '
API sep. btms. i
API float
Hi-temp CO shift (FeCr)
Arsenic guard bed 1
27.76
0.48
1.10
17.22
2.29
5.04
0.95
24.44
2.12
1.26
36.31
I
I
I
1
1
1
I
aThese factors will give values which may range +100%
to -£
Based on solids content.
Source: Heistand, September 1984.
3. Infiltration of moisture into disposal sites from precipita-
tion or from surface or groundwater intrusion could lead to
sudden pile failure. Such failure could cause extensive
property damage, threaten lives, and contaminate the drinking
water supply for millions of people.
Auto-Oxidation/Auto-Ignition
Auto oxidation leading to auto ignition of some coals and coal
wastes has been known to be a problem for many years. Some coal
wastes piles in the east are believed to haye ignited in this
manner while the phenomenon is fairly common with western lignite
coals. Since raw oil shales and some retorted oil shales possess
carbonaceous material and are capable of being ignited, EPA has
recently conducted several tests to assess the potential for
auto-ignition of raw oil shale fines and retorted oil shales. The
results indicate that raw shale fines have a potential similar to
bituminous coals while retorted shales appear to be less reactive
(Table 1.2-1). Hence there is a potential that if oil shale
1
1
f
I
I
I
I
1
1
1
image:
TABLE 1.1-3. APPROXIMATE SOLID WASTE RELATIONSHIPS
Type of waste
Mined shale
basis,
T/MT
Hydrotreated
oil basis,
T/MMBbl
Ma j or
Retorted shale
fRaw fines, dust, subore
Off-spec sulfur
Oily particles
WWT sludge
Scrap and garbage
834.5
784.4
58.8
1.3
0.49
0.14
0.10
Catalysts and other wastes
Methanator
Reformer
Hydro treater (HDN, HDS) •
Lo-temp CO shift
Alumina
DEA sludge '
API sep. btms. i
API float
Hi-temp CO shift (FeCr)
Arsenic guard bed 1
27.76
0.48
1.10
17.22
2.29
5.04
0.95
24.44
2.12
1.26
36.31
I
I
I
1
1
1
I
aThese factors will give values which may range +100%
to -£
Based on solids content.
Source: Heistand, September 1984.
3. Infiltration of moisture into disposal sites from precipita-
tion or from surface or groundwater intrusion could lead to
sudden pile failure. Such failure could cause extensive
property damage, threaten lives, and contaminate the drinking
water supply for millions of people.
Auto-Oxidation/Auto-Ignition
Auto oxidation leading to auto ignition of some coals and coal
wastes has been known to be a problem for many years. Some coal
wastes piles in the east are believed to haye ignited in this
manner while the phenomenon is fairly common with western lignite
coals. Since raw oil shales and some retorted oil shales possess
carbonaceous material and are capable of being ignited, EPA has
recently conducted several tests to assess the potential for
auto-ignition of raw oil shale fines and retorted oil shales. The
results indicate that raw shale fines have a potential similar to
bituminous coals while retorted shales appear to be less reactive
(Table 1.2-1). Hence there is a potential that if oil shale
1
1
f
I
I
I
I
1
1
1
image:
 TABLE 1.1-4.
MAJOR WASTE PRODUCED OVER A PERIOD OF
(TOSCO II 47,000 bbl/day plant with
20 YEARS
upgrading)
Stream description
Raw shale runoff and leachate
Raw shale sludge - preheat system
Processed shale sludge - ball elutriator
.Processed shale sludge - moisturizer
Processed shale
Stripped foul water
Compression condensate - Wellman-Lord Unit
Cokeb
Stripped sour water purge stream
Revegetation water
Dust suppression water
Boiler blowdown
Boiler feedwater treatment concentrate
Cooling tower blowdown
Storm runoff
Processed shale leachate
Spent catalysts
Treated sanitary water
Sanitary water treatment sludge
Service and fire water runoff
Source water clarifier sludge
Trash, construction debris, etc.
TOTAL
Mater
Quantity, as a
106 tons total ^
N.D.a
11.31
0.85
0.57
350.84
18.49
ial quantity
percent of
tfaste quantity
N.D.
2.27
0.17
0.11
70.43
3.71
1.73 0.35
5.26
1.06
0.75 0.15
14.59 2.93
9.70 1.95
11-04 2.22
4.81 0.97
60.31 12.11
4.34 0.87
N.D. N.D.
0.005 0.001
0.55 0.11
N.D. ' N.D.
0.63 0.13
2.37 0.48
N.D. ' N.D.
498.15 99.93
N.D. - Not determined. i
Most of the coke can be sold as a by-product. [
Source: EPA 600/8-83-003, April 1983 i
i
disposal sites are not properly designed they could iauto-ignite
producing huge quanities of pollutants such as S02, NQ , H2S, C02
and hydrocarbons. Such combustion could impair pile^ stability
leading to failure of the disposal pile and/or substantially
accelerate the leaching process. Since oil shale disposal sites
will occupy several square miles and be hundreds of feet thick,
there is no known method for extinguishing combustion should it
get started. Hence, the key to controlling ignition must be the
design and incorporation of appropriate controls when tlhe disposal
site is constructed. It appears probably that control1 technology
employed by the coal industry can be modified and applied to oil
shale disposal sites to mitigate this hazard. :
image:
TABLE 1.1-4.
MAJOR WASTE PRODUCED OVER A PERIOD OF
(TOSCO II 47,000 bbl/day plant with
20 YEARS
upgrading)
Stream description
Raw shale runoff and leachate
Raw shale sludge - preheat system
Processed shale sludge - ball elutriator
.Processed shale sludge - moisturizer
Processed shale
Stripped foul water
Compression condensate - Wellman-Lord Unit
Cokeb
Stripped sour water purge stream
Revegetation water
Dust suppression water
Boiler blowdown
Boiler feedwater treatment concentrate
Cooling tower blowdown
Storm runoff
Processed shale leachate
Spent catalysts
Treated sanitary water
Sanitary water treatment sludge
Service and fire water runoff
Source water clarifier sludge
Trash, construction debris, etc.
TOTAL
Mater
Quantity, as a
106 tons total ^
N.D.a
11.31
0.85
0.57
350.84
18.49
ial quantity
percent of
tfaste quantity
N.D.
2.27
0.17
0.11
70.43
3.71
1.73 0.35
5.26
1.06
0.75 0.15
14.59 2.93
9.70 1.95
11-04 2.22
4.81 0.97
60.31 12.11
4.34 0.87
N.D. N.D.
0.005 0.001
0.55 0.11
N.D. ' N.D.
0.63 0.13
2.37 0.48
N.D. ' N.D.
498.15 99.93
N.D. - Not determined. i
Most of the coke can be sold as a by-product. [
Source: EPA 600/8-83-003, April 1983 i
i
disposal sites are not properly designed they could iauto-ignite
producing huge quanities of pollutants such as S02, NQ , H2S, C02
and hydrocarbons. Such combustion could impair pile^ stability
leading to failure of the disposal pile and/or substantially
accelerate the leaching process. Since oil shale disposal sites
will occupy several square miles and be hundreds of feet thick,
there is no known method for extinguishing combustion should it
get started. Hence, the key to controlling ignition must be the
design and incorporation of appropriate controls when tlhe disposal
site is constructed. It appears probably that control1 technology
employed by the coal industry can be modified and applied to oil
shale disposal sites to mitigate this hazard. :
image:
 TABLE 1.2-1. SUMMARY OF RESULTS FROM DIFFERENTIAL
DIFFERENTIAL SCANNING CALORIMETRY AND
NONADIABATIC OXYGEN ABSORPTION TESTING
-—e
Paraho Retorted Shale 300 480 0.27
TOSCO II Retorted Shale 306 560 1.4
Union Shale Mixture 321 860 4.6
Hytort Retorted Shale 357 1,340 3.8
I
I
I
I
Onset, Exotherm, Nonadiabatic test
Materal °C J/g S index
Wyoming Subbituminous Coal 190 10,900 165 I
Western Kentucky #9 Bituminous Coal 193 13,800 60
Utah Raw Shale (66 GPT) 211 8,320 86 ™
C-a Raw Shale 226 920 5.6 A
Utah Raw Shale (28 GPT) 227 2,990 44
Pocahontas #3 Bituminous Coal 230 15,700 42 B
1
I
Lurgi Retorted Shale - M3 0.00 11
Lower onset temperature means more reactive. A
Higher S index means more reactive. ™
Test in dry air, particle size: -325 mesh. m
wo exotherm observed to 550°C. H
Source: EPA 600/2-84-153, 1984.
Leaching ||
The composition of retorted oil shales vary principally in re- —
sponse to the properties of the raw shale feed and the retorting B
process. The composition of any leachates from retorted shale *»
disposal sites will vary depending upon the properties of the re-
torted shale, and other wastes codiposed with the retorted shale, ||
such as wastewaters for cooling/wetting and treatment sludges. fl
Anticipated composition for Union B retorted shale is provided in
Table 1.2-2, process water for cooling and wetting the shale in an
Table 1.2-3, and properties of Unisulf solution, Unisulf sulfur •
byproduct, and moistened retorted shale are provided in Table
1.2-4. Some leaching test results on Union B retorted shale are
I
8
I
image:
TABLE 1.2-1. SUMMARY OF RESULTS FROM DIFFERENTIAL
DIFFERENTIAL SCANNING CALORIMETRY AND
NONADIABATIC OXYGEN ABSORPTION TESTING
-—e
Paraho Retorted Shale 300 480 0.27
TOSCO II Retorted Shale 306 560 1.4
Union Shale Mixture 321 860 4.6
Hytort Retorted Shale 357 1,340 3.8
I
I
I
I
Onset, Exotherm, Nonadiabatic test
Materal °C J/g S index
Wyoming Subbituminous Coal 190 10,900 165 I
Western Kentucky #9 Bituminous Coal 193 13,800 60
Utah Raw Shale (66 GPT) 211 8,320 86 ™
C-a Raw Shale 226 920 5.6 A
Utah Raw Shale (28 GPT) 227 2,990 44
Pocahontas #3 Bituminous Coal 230 15,700 42 B
1
I
Lurgi Retorted Shale - M3 0.00 11
Lower onset temperature means more reactive. A
Higher S index means more reactive. ™
Test in dry air, particle size: -325 mesh. m
wo exotherm observed to 550°C. H
Source: EPA 600/2-84-153, 1984.
Leaching ||
The composition of retorted oil shales vary principally in re- —
sponse to the properties of the raw shale feed and the retorting B
process. The composition of any leachates from retorted shale *»
disposal sites will vary depending upon the properties of the re-
torted shale, and other wastes codiposed with the retorted shale, ||
such as wastewaters for cooling/wetting and treatment sludges. fl
Anticipated composition for Union B retorted shale is provided in
Table 1.2-2, process water for cooling and wetting the shale in an
Table 1.2-3, and properties of Unisulf solution, Unisulf sulfur •
byproduct, and moistened retorted shale are provided in Table
1.2-4. Some leaching test results on Union B retorted shale are
I
8
I
image:
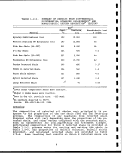 TABLE 1.2-2. CHEMICAL PROPERTIES OF UNION B RETORTED SHALE
Components5 Weight, %
I
Major elements as oxides ;
SiO2 31.5 ;
CaO 19.6 :
MgO 5.7 |
A1203 6.9
i
Fe20 2.8 ;
Na20 2.2 !
K20 1.6 !
S03 1.9 |
i
P20§ • 0.4 |
Other properties '
Mineral CO2 22.9 |
i
Organic C 4.3 ;
Nitrogen, Kjeldahl 0.2 i
Free silica (quartz) 8.0 i
pH of slurry 8.7 '•
aAnalyses determined by heating sample to ;
950°C for pH measurement. Analyses by
Union Research Department. |
Source: Battelle PNL 3830, 1981 !
image:
TABLE 1.2-2. CHEMICAL PROPERTIES OF UNION B RETORTED SHALE
Components5 Weight, %
I
Major elements as oxides ;
SiO2 31.5 ;
CaO 19.6 :
MgO 5.7 |
A1203 6.9
i
Fe20 2.8 ;
Na20 2.2 !
K20 1.6 !
S03 1.9 |
i
P20§ • 0.4 |
Other properties '
Mineral CO2 22.9 |
i
Organic C 4.3 ;
Nitrogen, Kjeldahl 0.2 i
Free silica (quartz) 8.0 i
pH of slurry 8.7 '•
aAnalyses determined by heating sample to ;
950°C for pH measurement. Analyses by
Union Research Department. |
Source: Battelle PNL 3830, 1981 !
image:
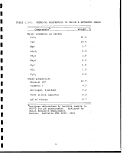 TABLE 1.2-3. ESTIMATED3 COMPOSITION OF PROCESS WATER
FOR RETORTED SHALE COOLING/WETTING
Parameter
Alkalinity (as CaC03 )
Carbonate ( as CO3 )
Bicarbonate ( as HC03 )
Chemical oxygen demand
Total organic carbon
Total dissolved solids
Total solids
Hardness (as CaCO3 )
Ammonia
Sulfides (as H2S)
Phenols
Cyanide (CN) - [
Oil and grease
Sulfate
Sodium
Arsenic :
Chromium '•
pH units '
Reuse
water sump,
mg/L
2,000
400
1,700
5,500
1,350
2,600
3,100
900
35
100
125
20
1,300
500
1,500
6.5
0.5
8-10
aThese values are maximum design case
levels based on preliminary bench-scale
tests and engineering1 calculations.
Source: Union Oil Company,
10 ;
January 1984.
1
1
1
1
1
§'
1
1
1
1
I
I
1
1
1
1
image:
TABLE 1.2-3. ESTIMATED3 COMPOSITION OF PROCESS WATER
FOR RETORTED SHALE COOLING/WETTING
Parameter
Alkalinity (as CaC03 )
Carbonate ( as CO3 )
Bicarbonate ( as HC03 )
Chemical oxygen demand
Total organic carbon
Total dissolved solids
Total solids
Hardness (as CaCO3 )
Ammonia
Sulfides (as H2S)
Phenols
Cyanide (CN) - [
Oil and grease
Sulfate
Sodium
Arsenic :
Chromium '•
pH units '
Reuse
water sump,
mg/L
2,000
400
1,700
5,500
1,350
2,600
3,100
900
35
100
125
20
1,300
500
1,500
6.5
0.5
8-10
aThese values are maximum design case
levels based on preliminary bench-scale
tests and engineering1 calculations.
Source: Union Oil Company,
10 ;
January 1984.
1
1
1
1
1
§'
1
1
1
1
I
I
1
1
1
1
image:
 TABLE 1.2-4.
RCRA TESTING OF SIMULATED SHALE
PLANT WASTES (UNION B PROCESS)
Unisulf
sulfur
Moistened
retorted shale
plus fines5
Ignitability
Causes fire through friction No
Oxidation 0°F
Corrosivity
a) pH
b) Steel corrosion (in/yr)
Reactivity
Yield gases, vapors or flames
when exposed to water No
Yields H2S or HCN when
exposed to pH 2 buffer No
Reacts explosively
a) When subjected to burner
flame No
b) When under heated
confinement No
HP Toxicity, mq/L
No
0°F
No
No
No
No
noistened with simulated process water.
Source: Union Oil Company, January 1984.
Maximum
allowed
12.5
0.25
Minimum
allowed
2.0
Arsenic
Barium
Cadmium
Lead
Mercury
Selenium
Silver
<0.01
0.2
<0.01
<0.05
0.002
<0.0005
<0.02
0.07
<2.7
<0.01
<0.05
<0.0005
<0.0005
<0.02
5.0
100.0
1.0
5.0
0.2
1.0
5.0
11
image:
TABLE 1.2-4.
RCRA TESTING OF SIMULATED SHALE
PLANT WASTES (UNION B PROCESS)
Unisulf
sulfur
Moistened
retorted shale
plus fines5
Ignitability
Causes fire through friction No
Oxidation 0°F
Corrosivity
a) pH
b) Steel corrosion (in/yr)
Reactivity
Yield gases, vapors or flames
when exposed to water No
Yields H2S or HCN when
exposed to pH 2 buffer No
Reacts explosively
a) When subjected to burner
flame No
b) When under heated
confinement No
HP Toxicity, mq/L
No
0°F
No
No
No
No
noistened with simulated process water.
Source: Union Oil Company, January 1984.
Maximum
allowed
12.5
0.25
Minimum
allowed
2.0
Arsenic
Barium
Cadmium
Lead
Mercury
Selenium
Silver
<0.01
0.2
<0.01
<0.05
0.002
<0.0005
<0.02
0.07
<2.7
<0.01
<0.05
<0.0005
<0.0005
<0.02
5.0
100.0
1.0
5.0
0.2
1.0
5.0
11
image:
 TABLE
Compound
Ag
Al
As
B
Ba
Be
Ca
Cd
Cl
CN
Co
Cr
Cu
F
Fe
HC03
Hg
K
Li
Mg
Mn
Mo
Na
Ni
NH3-N
N03-N
Oil and grease
Pb
Phenols
PO4
Se
Si
SO4
Sr
IDS
TOG
Zn
pH, units
Source : Union
'
1.2-5. CHEMICAL COMPOSITION
FROM UNION
Union Oil
Company
1982c
<0.3 - 0.12
0.005 - 0.022
0.22 - 17.0
0.09 - 0.11
<0.05
46 - 460
<0.01 - 0.03
7 - 120
0.003 - 0.009
<0.03 - 0.05
0.003 - 0.012
<0.02 - 0.2
5.6 - 11.4
<0.5 - 6.5
92 - 257
<0.0005 - 0.001
4.6 - 48
0.1 - 0.6
29 - 1,400
0.2 - 6.7
0.8 - 4.0
11 - 4,800
<0.02 - 0.12
<1 - 4
<10 - 100
<2 - 5
0.05 - 0.5
<0.001 - 0.0086
<200
<0.005 - 0.018
1-4
115 - 19,100
1.1 - 7.6
327 - 25,000
0-31
0.04 - 0.26
7.5 - 7.9
B RETORTED
S teams -
Rogers
• 1976
'
! 0.066
' 8
0.03
• -
17
<0.02
210
<0.005
0.01
-
_
-
2,370
-
14
50
27
5,040
—
2.4
2.0
25
! <0.2
<0.005
—
—
-
7,090
—
16,000
240
-
7.6
OF LE ACHATES
SHALE
Cleave
et al.
1979
<0.009
<0.001
0.97
<0.078
-
243
0.016
7.0
-
<0.011
<0 . Oil
—
<0.025
172
-
7.4
58
<0.007
109
—
—
—
0.009
—
<0.001
-
878
—
1.518
11.3
0.025
8.33
(mg/L)
Woodward-
Clyde
1975
<0.009
<0.05 - 0.27
—
—
-
-
69 - 424
8-91
-
_
-
-
<0.05 - 20
4-32
-
3-85
5-55
mm
45 - 750
—
2-5
31 - 111
—
—
-
0.5 - 4
230 - 2,400
—
410 - 4,860
-
3.1 - 6.9
Oil Company, Januairy 1984.
12
!
1
I
1
I
1
1
1
1.
1
1
PPI
1
1
1
I"
f
1
image:
TABLE
Compound
Ag
Al
As
B
Ba
Be
Ca
Cd
Cl
CN
Co
Cr
Cu
F
Fe
HC03
Hg
K
Li
Mg
Mn
Mo
Na
Ni
NH3-N
N03-N
Oil and grease
Pb
Phenols
PO4
Se
Si
SO4
Sr
IDS
TOG
Zn
pH, units
Source : Union
'
1.2-5. CHEMICAL COMPOSITION
FROM UNION
Union Oil
Company
1982c
<0.3 - 0.12
0.005 - 0.022
0.22 - 17.0
0.09 - 0.11
<0.05
46 - 460
<0.01 - 0.03
7 - 120
0.003 - 0.009
<0.03 - 0.05
0.003 - 0.012
<0.02 - 0.2
5.6 - 11.4
<0.5 - 6.5
92 - 257
<0.0005 - 0.001
4.6 - 48
0.1 - 0.6
29 - 1,400
0.2 - 6.7
0.8 - 4.0
11 - 4,800
<0.02 - 0.12
<1 - 4
<10 - 100
<2 - 5
0.05 - 0.5
<0.001 - 0.0086
<200
<0.005 - 0.018
1-4
115 - 19,100
1.1 - 7.6
327 - 25,000
0-31
0.04 - 0.26
7.5 - 7.9
B RETORTED
S teams -
Rogers
• 1976
'
! 0.066
' 8
0.03
• -
17
<0.02
210
<0.005
0.01
-
_
-
2,370
-
14
50
27
5,040
—
2.4
2.0
25
! <0.2
<0.005
—
—
-
7,090
—
16,000
240
-
7.6
OF LE ACHATES
SHALE
Cleave
et al.
1979
<0.009
<0.001
0.97
<0.078
-
243
0.016
7.0
-
<0.011
<0 . Oil
—
<0.025
172
-
7.4
58
<0.007
109
—
—
—
0.009
—
<0.001
-
878
—
1.518
11.3
0.025
8.33
(mg/L)
Woodward-
Clyde
1975
<0.009
<0.05 - 0.27
—
—
-
-
69 - 424
8-91
-
_
-
-
<0.05 - 20
4-32
-
3-85
5-55
mm
45 - 750
—
2-5
31 - 111
—
—
-
0.5 - 4
230 - 2,400
—
410 - 4,860
-
3.1 - 6.9
Oil Company, Januairy 1984.
12
!
1
I
1
I
1
1
1
1.
1
1
PPI
1
1
1
I"
f
1
image:
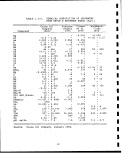 TABLE 1.2-6. RETORTED SHALE LEACHATES BY !
LEACHING METHOD (mg/L)
Shale
Paraho
TOSCO II
Lurgi
Paraho -
Several
Example
Source :
Parameter
pore volume
pH
EC ()jS/cm at 25°C)
HC03
C03
S04
Cl
F
Mg
Na
Ca
K
PH
EC (pS/cm at 25°C)
HC03
C03
S04
Cl
F
Mg
Na
Ca
K
PH
EC ((jS/cm at 25°C)
HC03
C03
S04
Cl
F
Mg
Na
Ca
K
0.198; TOSCO II - 1.03
Lurgi shales have been
provided is Lurgi shale
Field
9.57
21.100
-
-
12,350
526
11.9
7.7
5,591
421
834
8.9
10,000
-
-
30,270
-
13
156
10,270
463
110
_
-
-
-
-
-
-
-
-
-
~
; Lurgi -
RCRA
9.27
4,600
2,723
217
226
29
-
484
37
724
6.5
7.72
5,710
3,325
-
229
22
-
81
131
1,872
3.9
8.67
5,650
2,940
59
880
19
-
430
55
1,479
11
0.621.
ASTM
12.05
2,800
5
236
536
7
13.5
0.5
145
266
31
8.69
2,650
191
-
1,130
10
20.2
35
545
31
8
11.85
4,270
6.9
210
2,290
17
6.3
0.4
275
713
64
Column
initial
11.55!
9,230
15.3;
232|
3,840:
49 1
21:
1.6!
1,500
610;
140;
9.24^
35,080 ;
619 :
46 '
25,000
178 |
27 ,
628 ;
10,095 -
545 .
89 ;
12.24 i
59,500 ;
10.5 ;
775
34,000 ,
2,250 |
26.4 1
3.5 :
18,770 :
535 |
1,464 :
i
Column3
12.35
6,250
4.8
463
2,045
14
11.4
1.7
285
670
38
9.21
5,180
188
13
2,470
13
29.5
60
945
83
11
11.93
4,250
7
203
2,070
15
7.6
0.3
325
575
150
i
tested and results differ slightly.
provided by Rio Blanco Oil Shale.
EPA-600/D-84-036, March 1984.
13
i
i
f
i
image:
TABLE 1.2-6. RETORTED SHALE LEACHATES BY !
LEACHING METHOD (mg/L)
Shale
Paraho
TOSCO II
Lurgi
Paraho -
Several
Example
Source :
Parameter
pore volume
pH
EC ()jS/cm at 25°C)
HC03
C03
S04
Cl
F
Mg
Na
Ca
K
PH
EC (pS/cm at 25°C)
HC03
C03
S04
Cl
F
Mg
Na
Ca
K
PH
EC ((jS/cm at 25°C)
HC03
C03
S04
Cl
F
Mg
Na
Ca
K
0.198; TOSCO II - 1.03
Lurgi shales have been
provided is Lurgi shale
Field
9.57
21.100
-
-
12,350
526
11.9
7.7
5,591
421
834
8.9
10,000
-
-
30,270
-
13
156
10,270
463
110
_
-
-
-
-
-
-
-
-
-
~
; Lurgi -
RCRA
9.27
4,600
2,723
217
226
29
-
484
37
724
6.5
7.72
5,710
3,325
-
229
22
-
81
131
1,872
3.9
8.67
5,650
2,940
59
880
19
-
430
55
1,479
11
0.621.
ASTM
12.05
2,800
5
236
536
7
13.5
0.5
145
266
31
8.69
2,650
191
-
1,130
10
20.2
35
545
31
8
11.85
4,270
6.9
210
2,290
17
6.3
0.4
275
713
64
Column
initial
11.55!
9,230
15.3;
232|
3,840:
49 1
21:
1.6!
1,500
610;
140;
9.24^
35,080 ;
619 :
46 '
25,000
178 |
27 ,
628 ;
10,095 -
545 .
89 ;
12.24 i
59,500 ;
10.5 ;
775
34,000 ,
2,250 |
26.4 1
3.5 :
18,770 :
535 |
1,464 :
i
Column3
12.35
6,250
4.8
463
2,045
14
11.4
1.7
285
670
38
9.21
5,180
188
13
2,470
13
29.5
60
945
83
11
11.93
4,250
7
203
2,070
15
7.6
0.3
325
575
150
i
tested and results differ slightly.
provided by Rio Blanco Oil Shale.
EPA-600/D-84-036, March 1984.
13
i
i
f
i
image:
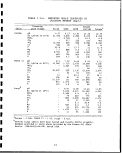 TABLE
Species
HC03
C03
TDS
F
Cl
P04
N03
S04
Zn
Fe
Co
Li
NH3
B
Cd
Be
Mg
P
Si
Mo
Mn
Ni
Na
Cu
Al
Ca
Ba
K
Cr
Sr
Pb
Ag
Se
As
Hg
1.2-7. RAW MINED
(MAXIMUM
Concentration ,
mg/L
579
5.68
72,660
113
366
0.28
2,564
45,900
0.597
2.02
1.17
0.339
2.55
1.97
0.168
0.300
12,830
7.0
13.2
1.5
2.34
1.12
2,030
0.073
5.28
505
0.822
16.4
0.290
15.4
1.036
0.012
0.007
0.013
0.007
0.003
i
OIL SHALES LEACHATES
OBSERVED CONCENTRATIONS )
Locationa
C-a, 15 ft
C-a, 15 ft
C-a, 15 ft
C-a, 15 ft
C-a, 15 ft
C-b, 20 ft
C-a, 15 ft
C-a, 15 ft
C-a, 15 ft
C-a, 15 ft
: C-a, 15 ft
C-b, 10 ft
C-a, 5 ft
C-b, 15 ft
C-a, 15 ft
C-b, 10 ft
C-a, 15 ft
C-a, 15 ft
C-a, 15 ft
C-b, 10 ft
C-a, 15 ft
C-a, 15 ft
C-a, 15 ft
; C-b, 10 ft
C-a, 5 ft
; C-a, 15 ft
! C-b, 10 ft
'• C-a, 15 ft
C-a, 15 ft
I C-a, 15 ft
; C-a, 15 ft
C-a, 15 ft
C-a, 15 ft
C-a, 15 ft
C-b, 20 ft
C-b, 20 ft
Date
9/21/82
7/19/82
8/16/82
7/26/82
7/01/82
2/25/82
7/26/82
5/10/82
8/16/82
8/11/82
8/23/82
7/26/82
8/30/82
7/26/82
7/26/82
7/06/82
9/06/82
8/04/82
6/02/82
7/06/82
6/02/82
6/02/82
8/02/82
7/06/82
7/01/82
3/22/82
9/23/82
7/19/82
6/02/82
7/19/82
8/11/82
3/17/82
4/12/82
7/01/82
8/04/82
2/25/82
1
1
1
1
1
•
•1
.
•«r
a5, 10, 15, and 20 foot deep Lysimeters on Federal lease
tracts Ca and Cb.
Source: EPA-600/D-84-228, 1984.
14 i
1
I
f
1
image:
TABLE
Species
HC03
C03
TDS
F
Cl
P04
N03
S04
Zn
Fe
Co
Li
NH3
B
Cd
Be
Mg
P
Si
Mo
Mn
Ni
Na
Cu
Al
Ca
Ba
K
Cr
Sr
Pb
Ag
Se
As
Hg
1.2-7. RAW MINED
(MAXIMUM
Concentration ,
mg/L
579
5.68
72,660
113
366
0.28
2,564
45,900
0.597
2.02
1.17
0.339
2.55
1.97
0.168
0.300
12,830
7.0
13.2
1.5
2.34
1.12
2,030
0.073
5.28
505
0.822
16.4
0.290
15.4
1.036
0.012
0.007
0.013
0.007
0.003
i
OIL SHALES LEACHATES
OBSERVED CONCENTRATIONS )
Locationa
C-a, 15 ft
C-a, 15 ft
C-a, 15 ft
C-a, 15 ft
C-a, 15 ft
C-b, 20 ft
C-a, 15 ft
C-a, 15 ft
C-a, 15 ft
C-a, 15 ft
: C-a, 15 ft
C-b, 10 ft
C-a, 5 ft
C-b, 15 ft
C-a, 15 ft
C-b, 10 ft
C-a, 15 ft
C-a, 15 ft
C-a, 15 ft
C-b, 10 ft
C-a, 15 ft
C-a, 15 ft
C-a, 15 ft
; C-b, 10 ft
C-a, 5 ft
; C-a, 15 ft
! C-b, 10 ft
'• C-a, 15 ft
C-a, 15 ft
I C-a, 15 ft
; C-a, 15 ft
C-a, 15 ft
C-a, 15 ft
C-a, 15 ft
C-b, 20 ft
C-b, 20 ft
Date
9/21/82
7/19/82
8/16/82
7/26/82
7/01/82
2/25/82
7/26/82
5/10/82
8/16/82
8/11/82
8/23/82
7/26/82
8/30/82
7/26/82
7/26/82
7/06/82
9/06/82
8/04/82
6/02/82
7/06/82
6/02/82
6/02/82
8/02/82
7/06/82
7/01/82
3/22/82
9/23/82
7/19/82
6/02/82
7/19/82
8/11/82
3/17/82
4/12/82
7/01/82
8/04/82
2/25/82
1
1
1
1
1
•
•1
.
•«r
a5, 10, 15, and 20 foot deep Lysimeters on Federal lease
tracts Ca and Cb.
Source: EPA-600/D-84-228, 1984.
14 i
1
I
f
1
image:
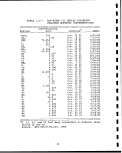 I
provided in Table 1.2-5 while results on several other retorted
shales (all without codisposed wastes) are presented in Table
1.2-6. Some raw mined oil shales have been leached (under field
conditions and the results are in Table 1.2-7. j
A significant volume of data such as that above exists.; This data
indicates that even if raw and retorted shale wastes are not de-
fined as hazardous, the leachates from these wastes are high in
dissolved salts as well as other contaminents and could seriously
impact surface or groundwater supplies, provided (Significant
amounts of leachate are produced. The amount of leachate produced
will depend to large extent on site specific characteristics and
the disposal controls employed. Since billions of tons of retort-
ed oil shale may eventially be produced, the cummulatiye impact on
water quality could be very great. Table 1.2-8 indicates the quan-
tity of some constituents leachable from oil shale pastes. As
previously discussed a 600,000 bbl/day oil shale industry would
produce about 270 million tons/per year of retorted Shale, which
would accumulate to nearly 8 billion tons after 30 years of opera-
tion. Such a quantity of waste will possess the potential for
leaching hugh quanitities of contaminents. For example assuming
8 billion tons of TOSCO II retorted shale, then 58 million tons of
sulfate are leachable along with 100 million tons of total dis-
solved solids and lessor amounts of many other contaminents._ The
key to preventing serious environmental impact does\ not lie in
preventing the leaching (since erosion of the disposal sites and
leaching will eventually occur) but rather in employing controls
to assure that the rate of release of contaminents is,slow enough
to be accomodated without substantial environmental damage. These
controls must be designed and built into the disposal sites from
the beginning since the huge size of the disposal sites will make
any retrofit operations extremely expensive and likely;impossible.
Mass Failure !
Retorted oil shale disposal sites will be the largest;solid waste
disposal sites ever constructed. A typical 50,000 bbl/day surface
retorting plant will produce about 450 million cubic feet/year of
solid waste, which over an operating plant life of 30;years would
cover an area of about 3.5 square miles to a depth Of 150 feet-
[EPA 600/2-80-205a, 1980]. Most disposals will be head of hollow
or cross canyon fills, miles in length and hundreds of feet deep.
Mass failure of one of these fills could have major impacts caus-
ing extensive property damage and threatening lives, j Failure of
one of several disposal piles proposed could destroy downstream
reservoirs, shale oil upgrading, storage, and loading; facilities,
and deposit millions of tons of leachable retorted shale in the
Colorado River. j
The most likely cause of a disposal pile failure would be satura-
tion of the waste pile and/or liquefaction of the ipile bottom
leading to slippage. Moisture contributing to this problem could
15
image:
I
provided in Table 1.2-5 while results on several other retorted
shales (all without codisposed wastes) are presented in Table
1.2-6. Some raw mined oil shales have been leached (under field
conditions and the results are in Table 1.2-7. j
A significant volume of data such as that above exists.; This data
indicates that even if raw and retorted shale wastes are not de-
fined as hazardous, the leachates from these wastes are high in
dissolved salts as well as other contaminents and could seriously
impact surface or groundwater supplies, provided (Significant
amounts of leachate are produced. The amount of leachate produced
will depend to large extent on site specific characteristics and
the disposal controls employed. Since billions of tons of retort-
ed oil shale may eventially be produced, the cummulatiye impact on
water quality could be very great. Table 1.2-8 indicates the quan-
tity of some constituents leachable from oil shale pastes. As
previously discussed a 600,000 bbl/day oil shale industry would
produce about 270 million tons/per year of retorted Shale, which
would accumulate to nearly 8 billion tons after 30 years of opera-
tion. Such a quantity of waste will possess the potential for
leaching hugh quanitities of contaminents. For example assuming
8 billion tons of TOSCO II retorted shale, then 58 million tons of
sulfate are leachable along with 100 million tons of total dis-
solved solids and lessor amounts of many other contaminents._ The
key to preventing serious environmental impact does\ not lie in
preventing the leaching (since erosion of the disposal sites and
leaching will eventually occur) but rather in employing controls
to assure that the rate of release of contaminents is,slow enough
to be accomodated without substantial environmental damage. These
controls must be designed and built into the disposal sites from
the beginning since the huge size of the disposal sites will make
any retrofit operations extremely expensive and likely;impossible.
Mass Failure !
Retorted oil shale disposal sites will be the largest;solid waste
disposal sites ever constructed. A typical 50,000 bbl/day surface
retorting plant will produce about 450 million cubic feet/year of
solid waste, which over an operating plant life of 30;years would
cover an area of about 3.5 square miles to a depth Of 150 feet-
[EPA 600/2-80-205a, 1980]. Most disposals will be head of hollow
or cross canyon fills, miles in length and hundreds of feet deep.
Mass failure of one of these fills could have major impacts caus-
ing extensive property damage and threatening lives, j Failure of
one of several disposal piles proposed could destroy downstream
reservoirs, shale oil upgrading, storage, and loading; facilities,
and deposit millions of tons of leachable retorted shale in the
Colorado River. j
The most likely cause of a disposal pile failure would be satura-
tion of the waste pile and/or liquefaction of the ipile bottom
leading to slippage. Moisture contributing to this problem could
15
image:
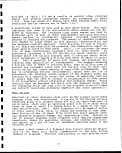 H
J-H *"**
<C CO
CO O
EH
1-3 O
M «C
O fe
, t |^
o S
P4 M
fe EH
m EH
Do
CO ^
M IH
S M
EH J
EH PQ
co 2
O M
1-3 o^
^ w
g^
CO &
fa
O >-j
CO M
W h3
II
D W
01 fit
Q O
£3 !Zi
EH w
S S
M CO
EH CO
co <;
rvi *^ -^
i
CO
1
CM
rH
S
pg
S
EH
*
.
n
•;
i
•r*
CD
id
C
•r-
E
£
8
1
a
n
-C
0;
n
a
•H
U
•H
0)
+J
U
CO
(0
o
rH
CM
1
O
O
CM
CO
CM
^
O
i-H
^
e—i
to
"w
0)
S
0
•a"
(L)
u
(0
<D
r-J
Cr>
^
4J
C
a>
4J
•H 4-
a 3
o
o
o co co in i>
«* r-H O CO CO
O O O CM rH rH
VO •
O 1 1 1 I | | |
o CM o c*>] en o vo
csj o o o in r-
oo..
o > o o o r~
0 O
o
ncMcMcncMiDocn
o o vo o en
CMcocM«*inocneo
^3* CO C*- O CM O • C^-
OOOOCMvOrHr-
O CM CO CM vO • §
O O O O r-H rH CO
OC^CMO^O-!>*i — 1
O O O O O O CM CO
i
•
cT
: Q
O
•^i
1 CO + I
I O 4-_r + •* W
iH CJ + D»' (0 O Q K
(— ' K K. S S CO EH Cli
16
CM
10
r-
«*
en
en
CO
r-
r-
0
CO
m
co
i
o
in
0
*.
r-4
in
en
o
in
c--
i-i
o
i-H
ro
o
in
CM
(0
in
o
X-**'
0)
1
u
1
CJ
0
co
en
in
o
CM
0
CO
i
CM
O
0
ID
gs
CM
w
<L>
u
Ll
3
o
to
1
fl
I
%
1
1
1
1
1
1
i
I
I
1
1
1
I
1
I
image:
H
J-H *"**
<C CO
CO O
EH
1-3 O
M «C
O fe
, t |^
o S
P4 M
fe EH
m EH
Do
CO ^
M IH
S M
EH J
EH PQ
co 2
O M
1-3 o^
^ w
g^
CO &
fa
O >-j
CO M
W h3
II
D W
01 fit
Q O
£3 !Zi
EH w
S S
M CO
EH CO
co <;
rvi *^ -^
i
CO
1
CM
rH
S
pg
S
EH
*
.
n
•;
i
•r*
CD
id
C
•r-
E
£
8
1
a
n
-C
0;
n
a
•H
U
•H
0)
+J
U
CO
(0
o
rH
CM
1
O
O
CM
CO
CM
^
O
i-H
^
e—i
to
"w
0)
S
0
•a"
(L)
u
(0
<D
r-J
Cr>
^
4J
C
a>
4J
•H 4-
a 3
o
o
o co co in i>
«* r-H O CO CO
O O O CM rH rH
VO •
O 1 1 1 I | | |
o CM o c*>] en o vo
csj o o o in r-
oo..
o > o o o r~
0 O
o
ncMcMcncMiDocn
o o vo o en
CMcocM«*inocneo
^3* CO C*- O CM O • C^-
OOOOCMvOrHr-
O CM CO CM vO • §
O O O O r-H rH CO
OC^CMO^O-!>*i — 1
O O O O O O CM CO
i
•
cT
: Q
O
•^i
1 CO + I
I O 4-_r + •* W
iH CJ + D»' (0 O Q K
(— ' K K. S S CO EH Cli
16
CM
10
r-
«*
en
en
CO
r-
r-
0
CO
m
co
i
o
in
0
*.
r-4
in
en
o
in
c--
i-i
o
i-H
ro
o
in
CM
(0
in
o
X-**'
0)
1
u
1
CJ
0
co
en
in
o
CM
0
CO
i
CM
O
0
ID
gs
CM
w
<L>
u
Ll
3
o
to
1
fl
I
%
1
1
1
1
1
1
i
I
I
1
1
1
I
1
I
image:
 come from codisposed wastewaters, precipitation and infiltration,
groundwater intrusion into the pile, or surface streams routed
over or through the disposal site. The principal approach to
prevent these problems is therefore to control the Movement of
moisture into or through the disposal pile. To accomplish this
requires the incorporation of a number of control technologies
into a complex site and material specific design. Although the
basic technologies to be employed are well known (i.;e., drains,
liners, covers, earth fill dams, benching) their construction on
the scale required and application to oil shale wastes have never
been demonstrated. I
i
1.3 PRESENT/PROPOSED DISPOSAL APPROACHES I
Due to the high volumes of solid wastes produced by all oil shale
facility, the environmentally safe disposal of these jwastes must
be engineered on a site and process specific basis. The slate of
solid wastes to be disposed and their chemical nature will vary in
response to the nature of the raw shale feed, the particular re-
torting process employed, the specific plant design including pol-
lution control technologies, and whether raw shale oil as upgraded
on site. The design of the solid waste disposal site! as well as
the selection and application of appropriate control technologies
must be tailored to accomodate not only the quantities and nature
of the wastes but also the characteristics of the specific dis-
posal site. Alternative disposal practices and contrdl technolo-
gies are generally well known. All have been proposed or consid-
ered by one developer or another though no developer has yet pro-
posed a plan incorporating all the control features that might be
desired into a specific design for solid waste disposal.
Disposal Approaches '
t-A |
!
The following discussion applies to the basic methods for handling
solid wastes produced by a surface retorting process. The key
features of each approach are summarized in Table 1.3-1. A
discussion of the control technologies applicable1 to these
disposal alternatives is presented. |
Landfills
A landfill basically entails placing the waste material as a com-
pacted fill in a suitable location. The wastes from the process-
ing facility are transported to the disposal site by conveyors or
trucks and then hauled to the active portion of the landfill.
Preferably, the solid wastes are then laid down in lifts of 9-18
inches and compacted to a suitable in-place denisity. The
compacted fill may be built with a proper slope to i a vertical
height of 40-50 feet and then flattened, or benched, to provide a
passageway for the disposal equipment and to facilitate runoff
collection. The overall landfill can be constructed gradually in
this fashion, using a multiple-bench arrangement. '<
17
image:
come from codisposed wastewaters, precipitation and infiltration,
groundwater intrusion into the pile, or surface streams routed
over or through the disposal site. The principal approach to
prevent these problems is therefore to control the Movement of
moisture into or through the disposal pile. To accomplish this
requires the incorporation of a number of control technologies
into a complex site and material specific design. Although the
basic technologies to be employed are well known (i.;e., drains,
liners, covers, earth fill dams, benching) their construction on
the scale required and application to oil shale wastes have never
been demonstrated. I
i
1.3 PRESENT/PROPOSED DISPOSAL APPROACHES I
Due to the high volumes of solid wastes produced by all oil shale
facility, the environmentally safe disposal of these jwastes must
be engineered on a site and process specific basis. The slate of
solid wastes to be disposed and their chemical nature will vary in
response to the nature of the raw shale feed, the particular re-
torting process employed, the specific plant design including pol-
lution control technologies, and whether raw shale oil as upgraded
on site. The design of the solid waste disposal site! as well as
the selection and application of appropriate control technologies
must be tailored to accomodate not only the quantities and nature
of the wastes but also the characteristics of the specific dis-
posal site. Alternative disposal practices and contrdl technolo-
gies are generally well known. All have been proposed or consid-
ered by one developer or another though no developer has yet pro-
posed a plan incorporating all the control features that might be
desired into a specific design for solid waste disposal.
Disposal Approaches '
t-A |
!
The following discussion applies to the basic methods for handling
solid wastes produced by a surface retorting process. The key
features of each approach are summarized in Table 1.3-1. A
discussion of the control technologies applicable1 to these
disposal alternatives is presented. |
Landfills
A landfill basically entails placing the waste material as a com-
pacted fill in a suitable location. The wastes from the process-
ing facility are transported to the disposal site by conveyors or
trucks and then hauled to the active portion of the landfill.
Preferably, the solid wastes are then laid down in lifts of 9-18
inches and compacted to a suitable in-place denisity. The
compacted fill may be built with a proper slope to i a vertical
height of 40-50 feet and then flattened, or benched, to provide a
passageway for the disposal equipment and to facilitate runoff
collection. The overall landfill can be constructed gradually in
this fashion, using a multiple-bench arrangement. '<
17
image:
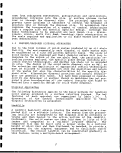 I
CO
TT*]
t^fl
r >
3
o
03
1
rf!
CO
O
P-t
CO
rH
Q
P3
£-1
CO
p
M
0
CO
fa
O
CO
1
H
g
t.
r*
HM
S^j
rH
CO
t
T*H
M
J-3
PQ
^R
EH
in
0)
to
4J
1
m
w
•H
a
10
<U
to
4->
to
i^
0)
a
•H
O
.3
Si
PH
rH r*
fO U
0 O
a. ^
w a
•H PL
O (0
•a
to
rH
0
Si
4-1
O
u
§
•H
W
O
Si
•a
§
4J
M
3
4J
S3
a)
0)
u
10
rH
a,
a>
iH
Q^
g
>1
rH
a)
-H
4J
to
rH
0)
-S
rH
rH
•rH
MH
W
10
W
0)
Ul
10
O)
u
10
rH
PM
u
rH
rH
-H
MH
T3
S3
to
01
(0
S3
0
-H
4J
to
<U
O>
0)
0)
•^^^
C
0
•H
4-1
to
(0
rH
U
0)
,
U)
(U
4-1
in
to
W-4
o
o
•H
4J
to
rH
o
-H
ro
§
a)
o
tfl
MH
Si
3
•M
S3
0)
-H
S3
§
0
U
to
0)
•H
(A
S3
0)
|
O
•9
rH
>1
iH
0)
5
4-1
10
rH
0)
<-^
4-1
•rH
*
a)
a)
Si
0)
4-J
-S
4-1
O
S3
W
0)
o
o
0)
to
rH
O
in
-H
T3
3
p*
0
-H
fO
U
O
rH
(0
in
(U
-H
a
u
u
0
*
w
S3
o
•H
4-1
fO
d)
o
.
o
-H
4J
U
3
O
a.
oi
I
o
<- 1
SM
w
<u
4J
E
0
i-l
KH
•a
to
rH
IH
o
4-1
O
4_>
S3
to
U •
•H <U
4-) U
-H fO
S3 MH
w in
,
S3
0
•H
>
O)
01
4J
0}
to
rH
O
-H
O
4-1
iH
U
•H
<4H
MH
-H
Q
T3
S3
(U
U
S3
0)
rr^
•H
in
1
(A
(U
M
to
(U
U
0)
a
.a
•H
rH
•H
W
to
in
<D
4-1
to
to
0)
u
<c
rH
PM
(1)
S3
•H
E
"a
§
O
Oi
Si
rrj
C"1
&
I
T3
. ^
O
t!
3
M
'5
C
:0
S-i
,"4-1
W
,0*
U
g
(U
u
to
Si
3
w
•H
4-1
S3
V
0)
u
to
rH
PH
•
4J
0)
O
-H
^
(3
0)
rH
10
S3
O
-H
-H
>sT3
Si
fO
M
- W
U
<u
!o
0)
N
-H
O
Si
10
0)
;-B
u
to
.a
s
(U
*cj
t 1 ^
^_l
^^
•H
•H
MH
U
(0
,
T3
tO
O
*
rH
rH
•H
MH
•O
rH
•
OJ
S3
•H
0)
<-*
4-1
0)
rH
&
0
u
h.
4_)
"3 "^
0 -H
MH w
-H 0)
fQ i-l
(U •
•H Si O
<U (U -H
> 4-1 4-1
•H S3 U
tO 'O
rH T3 O
(U S3 !i
Si 10 &
$3
o
•H
4_)
tO ^i (U
S (0 U
rH 3
rj o
01 • in
Si r^J Q)
O) Si
Si Si
O -H rH
3 fO
<u a"4-i
U (U O
S3 Si 4-1 •
tO >i
G W 0) Si
0) -H U <U
4J S3 >
S3 ,* to 0
-H Si 43 U
tO O S3 (U
E & <U Si
CO
CO
rH
rH
-H
Si
a<
».
n
o
o
co
00
CO
o
o
IO
rt!
It
0)
u
Si
3
o
18
I
i
I
I
I
I
I
I
I
1
1
I
I
I
t
I
I
image:
I
CO
TT*]
t^fl
r >
3
o
03
1
rf!
CO
O
P-t
CO
rH
Q
P3
£-1
CO
p
M
0
CO
fa
O
CO
1
H
g
t.
r*
HM
S^j
rH
CO
t
T*H
M
J-3
PQ
^R
EH
in
0)
to
4J
1
m
w
•H
a
10
<U
to
4->
to
i^
0)
a
•H
O
.3
Si
PH
rH r*
fO U
0 O
a. ^
w a
•H PL
O (0
•a
to
rH
0
Si
4-1
O
u
§
•H
W
O
Si
•a
§
4J
M
3
4J
S3
a)
0)
u
10
rH
a,
a>
iH
Q^
g
>1
rH
a)
-H
4J
to
rH
0)
-S
rH
rH
•rH
MH
W
10
W
0)
Ul
10
O)
u
10
rH
PM
u
rH
rH
-H
MH
T3
S3
to
01
(0
S3
0
-H
4J
to
<U
O>
0)
0)
•^^^
C
0
•H
4-1
to
(0
rH
U
0)
,
U)
(U
4-1
in
to
W-4
o
o
•H
4J
to
rH
o
-H
ro
§
a)
o
tfl
MH
Si
3
•M
S3
0)
-H
S3
§
0
U
to
0)
•H
(A
S3
0)
|
O
•9
rH
>1
iH
0)
5
4-1
10
rH
0)
<-^
4-1
•rH
*
a)
a)
Si
0)
4-J
-S
4-1
O
S3
W
0)
o
o
0)
to
rH
O
in
-H
T3
3
p*
0
-H
fO
U
O
rH
(0
in
(U
-H
a
u
u
0
*
w
S3
o
•H
4-1
fO
d)
o
.
o
-H
4J
U
3
O
a.
oi
I
o
<- 1
SM
w
<u
4J
E
0
i-l
KH
•a
to
rH
IH
o
4-1
O
4_>
S3
to
U •
•H <U
4-) U
-H fO
S3 MH
w in
,
S3
0
•H
>
O)
01
4J
0}
to
rH
O
-H
O
4-1
iH
U
•H
<4H
MH
-H
Q
T3
S3
(U
U
S3
0)
rr^
•H
in
1
(A
(U
M
to
(U
U
0)
a
.a
•H
rH
•H
W
to
in
<D
4-1
to
to
0)
u
<c
rH
PM
(1)
S3
•H
E
"a
§
O
Oi
Si
rrj
C"1
&
I
T3
. ^
O
t!
3
M
'5
C
:0
S-i
,"4-1
W
,0*
U
g
(U
u
to
Si
3
w
•H
4-1
S3
V
0)
u
to
rH
PH
•
4J
0)
O
-H
^
(3
0)
rH
10
S3
O
-H
-H
>sT3
Si
fO
M
- W
U
<u
!o
0)
N
-H
O
Si
10
0)
;-B
u
to
.a
s
(U
*cj
t 1 ^
^_l
^^
•H
•H
MH
U
(0
,
T3
tO
O
*
rH
rH
•H
MH
•O
rH
•
OJ
S3
•H
0)
<-*
4-1
0)
rH
&
0
u
h.
4_)
"3 "^
0 -H
MH w
-H 0)
fQ i-l
(U •
•H Si O
<U (U -H
> 4-1 4-1
•H S3 U
tO 'O
rH T3 O
(U S3 !i
Si 10 &
$3
o
•H
4_)
tO ^i (U
S (0 U
rH 3
rj o
01 • in
Si r^J Q)
O) Si
Si Si
O -H rH
3 fO
<u a"4-i
U (U O
S3 Si 4-1 •
tO >i
G W 0) Si
0) -H U <U
4J S3 >
S3 ,* to 0
-H Si 43 U
tO O S3 (U
E & <U Si
CO
CO
rH
rH
-H
Si
a<
».
n
o
o
co
00
CO
o
o
IO
rt!
It
0)
u
Si
3
o
18
I
i
I
I
I
I
I
I
I
1
1
I
I
I
t
I
I
image:
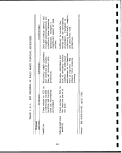 Depending upon the geography of the disposal site, the landfill
may be built on a level or nearly level surface, in the head of a
valley, or across a valley. The applicable control technologies
will vary somewhat with site topography but still will jbe designed
to protect the surface and subsurface waters. Applicable control
technologies include runon and runoff catchment ponds, 'embankments
and diversion systems, liners and cover, and revegetation. Provi-
sion for structural stability of the fill is also a major
consideration. !
I
A surface landfill of some type will need to be included in most
oil shale developments. This results from the shale undergoing a
volume expansion upon mining, crushing, and processing,1 which pre-
cludes all of the shale being returned to the mine. j
Underground Mine Backfill ;
11 * • ' • " _ i
In this disposal approach, the waste material is placed in the in-
active portion of the underground mine (e.g., a room-and-pillar
mine), while production continues in other parts of the mine. This
approach is attractive from several viewpoints. By returning
the wastes to the mine, the size of a surface landfill would be
greatly reduced. The potential for mine subsidence would be di-
minished. Backfilling the mine may enhance resource recovery by
increasing the amount of shale that can be mined safely. Disad-
vantages include possible release of volatiles underground in the
workplace and possible groundwater contamination. j
The major considerations in backfilling involve developing logis-
tics for carrying out simultaneous mining and disposal operations
while providing protection for workers and the groundwater. For
fine processed shales, like the TOSCO II, hydraulic or slurry
backfilling may be practical. However, additional water, above
the moistening needs, would be required and a drainage collection
system would be needed. The wastes may be transported :to the mine
by conveyors or trucks, then compacted in place, but the space
limitations reduce the practicability of this approach. Alterna-
tively, the wastes may be backfilled pneumatically, but this ap-
proach may be difficult to implement at the scale required.
A study on the above backfilling techniques has been conducted for
the wastes from the Colony project [Dravo Corp., 1975]. The re-
sults indicate that, while theoretically 80% of the wastes could
be returned to the mine, only 60% of the wastes can 'actually be
placed in the mine during the project life due to a time lag of
5-10 years between the mining and backfilling operations. It was
concluded that none of the placement techniques wer^ developed
sufficiently to be applied on a large scale.
19
image:
Depending upon the geography of the disposal site, the landfill
may be built on a level or nearly level surface, in the head of a
valley, or across a valley. The applicable control technologies
will vary somewhat with site topography but still will jbe designed
to protect the surface and subsurface waters. Applicable control
technologies include runon and runoff catchment ponds, 'embankments
and diversion systems, liners and cover, and revegetation. Provi-
sion for structural stability of the fill is also a major
consideration. !
I
A surface landfill of some type will need to be included in most
oil shale developments. This results from the shale undergoing a
volume expansion upon mining, crushing, and processing,1 which pre-
cludes all of the shale being returned to the mine. j
Underground Mine Backfill ;
11 * • ' • " _ i
In this disposal approach, the waste material is placed in the in-
active portion of the underground mine (e.g., a room-and-pillar
mine), while production continues in other parts of the mine. This
approach is attractive from several viewpoints. By returning
the wastes to the mine, the size of a surface landfill would be
greatly reduced. The potential for mine subsidence would be di-
minished. Backfilling the mine may enhance resource recovery by
increasing the amount of shale that can be mined safely. Disad-
vantages include possible release of volatiles underground in the
workplace and possible groundwater contamination. j
The major considerations in backfilling involve developing logis-
tics for carrying out simultaneous mining and disposal operations
while providing protection for workers and the groundwater. For
fine processed shales, like the TOSCO II, hydraulic or slurry
backfilling may be practical. However, additional water, above
the moistening needs, would be required and a drainage collection
system would be needed. The wastes may be transported :to the mine
by conveyors or trucks, then compacted in place, but the space
limitations reduce the practicability of this approach. Alterna-
tively, the wastes may be backfilled pneumatically, but this ap-
proach may be difficult to implement at the scale required.
A study on the above backfilling techniques has been conducted for
the wastes from the Colony project [Dravo Corp., 1975]. The re-
sults indicate that, while theoretically 80% of the wastes could
be returned to the mine, only 60% of the wastes can 'actually be
placed in the mine during the project life due to a time lag of
5-10 years between the mining and backfilling operations. It was
concluded that none of the placement techniques wer^ developed
sufficiently to be applied on a large scale.
19
image:
 I
Impacts of Disposal Alternatives gn the Use of Oil Shale and •
Other Natural Resources
t'
proaucea oy an on snaie lacinty, these wastes must be disposed
on or close to the plant site. In the case of open pit mines, m
such as the one proposed for federal lease tract Ca, huge amounts B
of overburden and subgrade oil shale will also require disposal. 9
These wastes could be disposed entirely on the surface as piles or
canyon fills or could partially be returned to the mine. Either B
way the leaching potential of these wastes must be carefully con- m
trolled or leachates will seriously impair the quality and use of
surface and groundwater supplies. Depending upon the specific «
placement of these wastes they could also impair future access to V
other oil shale resources. Returning some of the retorted oil
shale to an underground mine would be expensive and technically
difficult but could actually increase the potential for resource JB
recovery by facilitating mining of the support pillars. "
Potential Utilization of Oil Shale Solid Waste •
Oil shale solid wastes having some potential for utilization in-
elude retorted oil shale, raw shale fines, spent catalysts, ele- m
mental sulfur and biological treatment sludges. Retorted oil U
shales, particularly decarbonized shales, have some limited poten- *
tial for utilization on site. Decarbonized western oil shales
posses a significant capacity to cement similar to low grade com- fft
mercial cement. Hence a very limited amount of retorted shale may V
be used locally as a low grade cement substitute. Raw shale
rejects and fines, from mining and raw shale preparation, could be m
processed in specially designed retorts or possibly formed into I
bricketts and processed in the regular plant facilities. Spent
catalysts could potentially be reclaimed and reused in the upgrad- m
ing process, though facilities to reclaim them do not presently •
exist. Some air pollution control technologies remove elemental "*
sulfur which, if not contaminated by impurities, should have at
least a limited market for agricultural use. Biological treatment A
sludges may be useful on site as soil conditioners for m
revegetation if they do not contain significant quantities of harmful
contaminents. However, even if all the above wastes are utilized at
to the maximum extent possible, it will not make a significant •
impact on the amount of solid waste to be disposed. ~
20 :
I
1
I
I
image:
I
Impacts of Disposal Alternatives gn the Use of Oil Shale and •
Other Natural Resources
t'
proaucea oy an on snaie lacinty, these wastes must be disposed
on or close to the plant site. In the case of open pit mines, m
such as the one proposed for federal lease tract Ca, huge amounts B
of overburden and subgrade oil shale will also require disposal. 9
These wastes could be disposed entirely on the surface as piles or
canyon fills or could partially be returned to the mine. Either B
way the leaching potential of these wastes must be carefully con- m
trolled or leachates will seriously impair the quality and use of
surface and groundwater supplies. Depending upon the specific «
placement of these wastes they could also impair future access to V
other oil shale resources. Returning some of the retorted oil
shale to an underground mine would be expensive and technically
difficult but could actually increase the potential for resource JB
recovery by facilitating mining of the support pillars. "
Potential Utilization of Oil Shale Solid Waste •
Oil shale solid wastes having some potential for utilization in-
elude retorted oil shale, raw shale fines, spent catalysts, ele- m
mental sulfur and biological treatment sludges. Retorted oil U
shales, particularly decarbonized shales, have some limited poten- *
tial for utilization on site. Decarbonized western oil shales
posses a significant capacity to cement similar to low grade com- fft
mercial cement. Hence a very limited amount of retorted shale may V
be used locally as a low grade cement substitute. Raw shale
rejects and fines, from mining and raw shale preparation, could be m
processed in specially designed retorts or possibly formed into I
bricketts and processed in the regular plant facilities. Spent
catalysts could potentially be reclaimed and reused in the upgrad- m
ing process, though facilities to reclaim them do not presently •
exist. Some air pollution control technologies remove elemental "*
sulfur which, if not contaminated by impurities, should have at
least a limited market for agricultural use. Biological treatment A
sludges may be useful on site as soil conditioners for m
revegetation if they do not contain significant quantities of harmful
contaminents. However, even if all the above wastes are utilized at
to the maximum extent possible, it will not make a significant •
impact on the amount of solid waste to be disposed. ~
20 :
I
1
I
I
image:
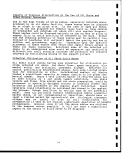 1.4 CONCLUSIONS AND ADDITIONAL RESEARCH NEEDED i
i
i
Conclusions '
1. The oil shale industry will produce unprecedented volumes of
solid waste mostly consisting of retorted oil shales, raw oil
shale fines, overburden and subgrade ore, codisppsed waste-
water, and much smaller quantities of known hazardous wastes.
Although the known hazardous wastes will be sent 'to licensed
disposal or recycling facilities, the high volume solid wastes
will be disposed on or close to the plant site. If not prop-
erly managed these high volume wastes are capable of producing
leachates that could contaminate the water supply for millions
of people. Some of the waste may also pose the hazard of auto
ignition unless proper controls are employed. Surface disposal
sites covering square miles in area and hundreds; of feet in
thickness would do extensive property damage and threaten lives
should they ever suffer sudden mass failure. j
2. Control technologies to prevent serious adverse impacts from
disposal of billion of tons of oil shale wastes have been
proposed but their application to oil shale waste materials
and on the scale required has not been demonstrated. Further,
to be effective, these technologies, must be applied in highly
technical and integrated disposal designs that are site and
process specific. There is no current experience in disposal
of wastes of similar composition or of volumes 'approaching
that which will result from the oil shale industry.!
Additional Research Needed |
a. Solid wastes (including codisposed wastewaters) from oil
shale facilities need to be characterized.
I
b. The effects from codisposal of liquid and solid wastes
need to be determined. Related question is to what ex-
tent should wastewater be treated prior to i codisposal
with retorted shale. , i
c. Effective means of controlling moisture movemejit into and
from retorted shale disposal site to achieve mass
stability and minimize leachate need to be developed and
demonstrated. Included are liners and covers made from
retorted shale, drains installed above and below liners,
use of vegetation to reduce infiltration, arid means of
relocating surface drainage in filled canyons.;
d. The nature and quantity of leachate produced from dis-
posal sites employing state-of-the-art technology needs
to be determined.
21
image:
1.4 CONCLUSIONS AND ADDITIONAL RESEARCH NEEDED i
i
i
Conclusions '
1. The oil shale industry will produce unprecedented volumes of
solid waste mostly consisting of retorted oil shales, raw oil
shale fines, overburden and subgrade ore, codisppsed waste-
water, and much smaller quantities of known hazardous wastes.
Although the known hazardous wastes will be sent 'to licensed
disposal or recycling facilities, the high volume solid wastes
will be disposed on or close to the plant site. If not prop-
erly managed these high volume wastes are capable of producing
leachates that could contaminate the water supply for millions
of people. Some of the waste may also pose the hazard of auto
ignition unless proper controls are employed. Surface disposal
sites covering square miles in area and hundreds; of feet in
thickness would do extensive property damage and threaten lives
should they ever suffer sudden mass failure. j
2. Control technologies to prevent serious adverse impacts from
disposal of billion of tons of oil shale wastes have been
proposed but their application to oil shale waste materials
and on the scale required has not been demonstrated. Further,
to be effective, these technologies, must be applied in highly
technical and integrated disposal designs that are site and
process specific. There is no current experience in disposal
of wastes of similar composition or of volumes 'approaching
that which will result from the oil shale industry.!
Additional Research Needed |
a. Solid wastes (including codisposed wastewaters) from oil
shale facilities need to be characterized.
I
b. The effects from codisposal of liquid and solid wastes
need to be determined. Related question is to what ex-
tent should wastewater be treated prior to i codisposal
with retorted shale. , i
c. Effective means of controlling moisture movemejit into and
from retorted shale disposal site to achieve mass
stability and minimize leachate need to be developed and
demonstrated. Included are liners and covers made from
retorted shale, drains installed above and below liners,
use of vegetation to reduce infiltration, arid means of
relocating surface drainage in filled canyons.;
d. The nature and quantity of leachate produced from dis-
posal sites employing state-of-the-art technology needs
to be determined.
21
image:
 I
I
e. A best management practices design manual needs to be m
developed to guide developers and permitters in the
selection of appropriate control technologies and the W
integration of these technologies into complex site and m
process specific disposal designs.
I
I
22
I
I
I
I
1
1
1
1
1
1
I
I
1
image:
I
I
e. A best management practices design manual needs to be m
developed to guide developers and permitters in the
selection of appropriate control technologies and the W
integration of these technologies into complex site and m
process specific disposal designs.
I
I
22
I
I
I
I
1
1
1
1
1
1
I
I
1
image:
 SECTION 2
CHARACTERISTICS OF U.S. OIL SHALE
2.1 INTRODUCTION
This section describes the location, geology,
the physicochemical properties of oil shale
United States.
resources
Oil shale is commonly defined as a fine-grained
containing organic matter (known as kerogen) that is
insoluble in petroleum solvents, but that yields
quantities of liquid oil, gases, and residual
pyrolysis [Culbertson et al., 1973].
2.2 LOCATION
composition
, and
in the
sedimentary
rock
essentially
substantial
carbon upon
The principal United States oil shale deposits are presented in
Figure 2.2-1 [Duncan et al., 1965]. These deposits occur in four
general locations; (a) the Tertiary period (Eocene) deposits of
the Green River Formation in Colorado, Utah, and Wyoming; (b) the
late Devonian and early Mississippian period marine shales of the
central and eastern United States, stretching from Michigan and
Pennsylvania southward through Indiana and Kentucky to Texas;
(c) the early Cretaceous and upper Triassic marine, shales in
Alaska; and (d) the small Tertiary shale deposits £>f Montana,
Nevada, Idaho, and California [EPA-600/2-80-205a, 1980].
It has been estimated that an equivalent of seven trillion barrels
(bbl) of oil are contained in the U.S. reserves of shale oil, but
not all of these deposits are sufficiently rich in organic matter
to be considered commercially attractive. Estimates place total
known U.S. oil shale resources for oil shales yielding 10 gal of
oil per ton of shale at well over 2 trillion bbl [Duncan et al.,
1965]. The Green River Formation oil shales in Colorado, Utah,
and Wyoming account for an estimated 90 percent of \ this total
resource and are therefore regarded as being the most important
commercially. I
The Devonian Marine black shales of the central and eastern United
States are estimated to contain at least 400 billion bbl of equiva-
lent oil. While they have not received as much commercial interest
as the Green River Shales, there are commercial projects proposed
23
image:
SECTION 2
CHARACTERISTICS OF U.S. OIL SHALE
2.1 INTRODUCTION
This section describes the location, geology,
the physicochemical properties of oil shale
United States.
resources
Oil shale is commonly defined as a fine-grained
containing organic matter (known as kerogen) that is
insoluble in petroleum solvents, but that yields
quantities of liquid oil, gases, and residual
pyrolysis [Culbertson et al., 1973].
2.2 LOCATION
composition
, and
in the
sedimentary
rock
essentially
substantial
carbon upon
The principal United States oil shale deposits are presented in
Figure 2.2-1 [Duncan et al., 1965]. These deposits occur in four
general locations; (a) the Tertiary period (Eocene) deposits of
the Green River Formation in Colorado, Utah, and Wyoming; (b) the
late Devonian and early Mississippian period marine shales of the
central and eastern United States, stretching from Michigan and
Pennsylvania southward through Indiana and Kentucky to Texas;
(c) the early Cretaceous and upper Triassic marine, shales in
Alaska; and (d) the small Tertiary shale deposits £>f Montana,
Nevada, Idaho, and California [EPA-600/2-80-205a, 1980].
It has been estimated that an equivalent of seven trillion barrels
(bbl) of oil are contained in the U.S. reserves of shale oil, but
not all of these deposits are sufficiently rich in organic matter
to be considered commercially attractive. Estimates place total
known U.S. oil shale resources for oil shales yielding 10 gal of
oil per ton of shale at well over 2 trillion bbl [Duncan et al.,
1965]. The Green River Formation oil shales in Colorado, Utah,
and Wyoming account for an estimated 90 percent of \ this total
resource and are therefore regarded as being the most important
commercially. I
The Devonian Marine black shales of the central and eastern United
States are estimated to contain at least 400 billion bbl of equiva-
lent oil. While they have not received as much commercial interest
as the Green River Shales, there are commercial projects proposed
23
image:
 EXPl.ANATION
Tertiary d»ponltn
<3repn River Formation
In Colorado, Utah, and
Wyomuiu; Monlen>y
Formation, California;
middle Torllary deposits
In Montana. Black srean
are known high-grade de-
posit.-!
Mer.oswlc deposits
Marine shale In Alaska
Permian deposits
J'hosphorla Formation,
Montana
Devonian and Mls.sln.slpplan
df>pi)nlts (resource ontl-
mati>s Included for
hanli'trod areas only).
Boundary dashed where
concealed or where
location Is uncertain
Figure 2.2-1. Principal United States Oil Shale Deposits.
Source: Duncan et al., 1965
for their development. The Institute of Gas Technology has demon-
strated that retorting in the presence of hydrogen (hydroretortina)
can increase the oil yield of the Eastern Devonian Shales, by a
?*£ °f 2'-5 CTarman et al- 1967]. The Alaskan marine shales
anj. .the Tertiary shales of California and elsewhere have received
iF~ attention to date and are not considered to be commercially
attractive. J
2-2.1 Green River Formation Oil Shale
As shown in Figure 2.2-2, the oil shale deposits of the Green
River Formation occur in a 16/988 mi2 area in northwestern
Colorado, northeastern Utah, and southwestern Wyoming. The richer
oil shales, those of highest commercial interest, are generally
more centrally located in the four depositional basins: Piceance
Creek basin, Colorado; Uinta basin, Utah; and the Green River and
Washakie basins of Wyoming. The Piceance Creek basin of Colorado
contains the thickest and richest; oil shale deposits within the
United States, and accordingly, the greatest interest related to
commercial development has been directed to that area.
Table 2.2-1 presents the total in-place shale oil resources of the
Green River Formation. Total identified shale oil resources in
place, which average 15 gal/ton or more in strata up to 2,000 ft
thick, are estimated to be 179 billion tons in Colorado's Piceance
I
I
I
I
1
I
I
I
I
I
I
I
I
I
I
1
24
image:
EXPl.ANATION
Tertiary d»ponltn
<3repn River Formation
In Colorado, Utah, and
Wyomuiu; Monlen>y
Formation, California;
middle Torllary deposits
In Montana. Black srean
are known high-grade de-
posit.-!
Mer.oswlc deposits
Marine shale In Alaska
Permian deposits
J'hosphorla Formation,
Montana
Devonian and Mls.sln.slpplan
df>pi)nlts (resource ontl-
mati>s Included for
hanli'trod areas only).
Boundary dashed where
concealed or where
location Is uncertain
Figure 2.2-1. Principal United States Oil Shale Deposits.
Source: Duncan et al., 1965
for their development. The Institute of Gas Technology has demon-
strated that retorting in the presence of hydrogen (hydroretortina)
can increase the oil yield of the Eastern Devonian Shales, by a
?*£ °f 2'-5 CTarman et al- 1967]. The Alaskan marine shales
anj. .the Tertiary shales of California and elsewhere have received
iF~ attention to date and are not considered to be commercially
attractive. J
2-2.1 Green River Formation Oil Shale
As shown in Figure 2.2-2, the oil shale deposits of the Green
River Formation occur in a 16/988 mi2 area in northwestern
Colorado, northeastern Utah, and southwestern Wyoming. The richer
oil shales, those of highest commercial interest, are generally
more centrally located in the four depositional basins: Piceance
Creek basin, Colorado; Uinta basin, Utah; and the Green River and
Washakie basins of Wyoming. The Piceance Creek basin of Colorado
contains the thickest and richest; oil shale deposits within the
United States, and accordingly, the greatest interest related to
commercial development has been directed to that area.
Table 2.2-1 presents the total in-place shale oil resources of the
Green River Formation. Total identified shale oil resources in
place, which average 15 gal/ton or more in strata up to 2,000 ft
thick, are estimated to be 179 billion tons in Colorado's Piceance
I
I
I
I
1
I
I
I
I
I
I
I
I
I
I
1
24
image:
 COLORADO
Area of 25 gal. /Ion or richer
oil shole 10 ft or more thick
MESA
GRAND MESA
KEY,MAP
>•—«T WYOMING""!
Area of
Map
I !
UT«H I COLORADO 1_
25 i 50
SCALE, MILES
100
Figure 2.2-2. Green River Formation Oil Shales-Utah,1 Colorado,
and Wyoming. Source: Baughman, 1978 I
TABLE 2.2-1. TOTAL IN-PLACE SHALE OIL RESOURCES
OF THE GREEN RIVER FORMATION
Type of shale (yield/ tonne)
62.6 L/ tonne
(15 gal/ ton)
or more
Location
Colorado
Utah
Wyoming
TOTAL
Billions
of
tonnes
163.2
43.7
43.7
250.6
Billions
of
equivalent
barrels
of oil
1,200
321
321
1,842
104. 3. L/ tonne
(25 gal/ton)
or more
Billions
of
tonnes
82.6
8.7
8.2
99.5
Billions
of
equivalent
barrels
of oil
607
64
60
731
125.2 L/ tonne
(30 gal/ ton)
lor more
i
i
Billions
of
tonnes
48.3 i
6.8 :
1.8 i
56.9 i
i
Billions
of
equivalent
barrles
of oil
355
50
13
418
In beds at least 10 ft thick.
Source: Ash, 1964.
25
image:
COLORADO
Area of 25 gal. /Ion or richer
oil shole 10 ft or more thick
MESA
GRAND MESA
KEY,MAP
>•—«T WYOMING""!
Area of
Map
I !
UT«H I COLORADO 1_
25 i 50
SCALE, MILES
100
Figure 2.2-2. Green River Formation Oil Shales-Utah,1 Colorado,
and Wyoming. Source: Baughman, 1978 I
TABLE 2.2-1. TOTAL IN-PLACE SHALE OIL RESOURCES
OF THE GREEN RIVER FORMATION
Type of shale (yield/ tonne)
62.6 L/ tonne
(15 gal/ ton)
or more
Location
Colorado
Utah
Wyoming
TOTAL
Billions
of
tonnes
163.2
43.7
43.7
250.6
Billions
of
equivalent
barrels
of oil
1,200
321
321
1,842
104. 3. L/ tonne
(25 gal/ton)
or more
Billions
of
tonnes
82.6
8.7
8.2
99.5
Billions
of
equivalent
barrels
of oil
607
64
60
731
125.2 L/ tonne
(30 gal/ ton)
lor more
i
i
Billions
of
tonnes
48.3 i
6.8 :
1.8 i
56.9 i
i
Billions
of
equivalent
barrles
of oil
355
50
13
418
In beds at least 10 ft thick.
Source: Ash, 1964.
25
image:
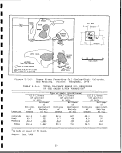 I
Creek Basin, 48 billion tons in Utah's Uinta Basin, and 48 billion T
tons in the combined Green River, Washakie, and Sand Wash basins
of Wyoming. The three-state total is thus 1,842 billion bbl. The jt
total in-place resource is not presently recoverable, but it is •
estimated by the U.S. Geological Survey (USGS) that approximately
80 percent of the known shale that yields 25 gal/ton or more, or •
some 88 billion tons of shale oil are suitably located and of I
adequate thickness to be reasonably regarded as the potentially
recoverable resource base. If 50 percent of the 25 gal/ton or m
more resource could be recovered, it would be large enough to •
produce 2 million bbl/day, or over one-fourth the present daily *
imports, for more than 400 years. Table 2.2-1 shows that 80 to 85
percent of the in-place, 25- to 30-gal/ton oil shale resource are •
in Colorado's Piceance Creek Basin, with the remainder divided |
between Utah's Uinta Basin and Wyoming.
2.2.2 Devonian-Mississippian Black Shales n
The black marine shales of the Deyonian/Mississippian periods are
located in the Eastern and Central States. These shales, part of •
an original shallow inland sea, occur over an area of more than B
400,000 mi2 in Ohio, Kentucky,; Tennessee, Indiana, Michigan,
Alabama, and extend as far southwest as Oklahoma and Texas. As •
shown in Figure 2.2-3 black shale deposits also occur in the I
northern great plains and extend into Canada.
The Devonian shales are lean by western shale standards, with an I
average Fisher assay of only 10 gal/ton; however, the carbon con- *
tent of Devonian shales is typically about 14 percent, or approxi-
mately the same as Green River shale assaying 30 gal/ton. The ft
difference in Fischer assay is due to the higher carbon to avail- m
able hydrogen weight ratio of thei10 gal/ton Devonian shale (11-2
to 1) as compared with the 30 gal/ton Green River shale (7.2 to f»
1). If, however, the 10 gal/ton Devonian shale is retorted in the •
presence of hydrogen (i.e., hydroretorted), oil yield can be
increased to 25 gal/ton, according to research conducted by the _>
Institute of Gas Technology (IGT) [Tarman et al., 1977]. •
The higher oil yields possible with hydroretorting can, of course,
have an influence on defining the Devonian shale resource base. fl
The USGS estimate of equivalent oil in place in Devonian shales is 9
400 billion bbl, without considering the effect of hydrogen in
retorting. With hydroretorting, this value could easily increase »
to 1 trillion bbl, or 250 percent of the conventional Fischer •
assay. •
The Institute of Gas Technology has surveyed the three-principal tf
Devonian shale basins (Appalachian, Illinois, and Michigan) and p
estimated that some 423 billion bbl of oil could be recovered from
the 6,200 mi2 of outcrops and relatively shallow deposits in these m
basins alone if hydroretorting were employed. Their criteria for jj
a recoverable resource required that a shale deposit have an
26
I
1
image:
I
Creek Basin, 48 billion tons in Utah's Uinta Basin, and 48 billion T
tons in the combined Green River, Washakie, and Sand Wash basins
of Wyoming. The three-state total is thus 1,842 billion bbl. The jt
total in-place resource is not presently recoverable, but it is •
estimated by the U.S. Geological Survey (USGS) that approximately
80 percent of the known shale that yields 25 gal/ton or more, or •
some 88 billion tons of shale oil are suitably located and of I
adequate thickness to be reasonably regarded as the potentially
recoverable resource base. If 50 percent of the 25 gal/ton or m
more resource could be recovered, it would be large enough to •
produce 2 million bbl/day, or over one-fourth the present daily *
imports, for more than 400 years. Table 2.2-1 shows that 80 to 85
percent of the in-place, 25- to 30-gal/ton oil shale resource are •
in Colorado's Piceance Creek Basin, with the remainder divided |
between Utah's Uinta Basin and Wyoming.
2.2.2 Devonian-Mississippian Black Shales n
The black marine shales of the Deyonian/Mississippian periods are
located in the Eastern and Central States. These shales, part of •
an original shallow inland sea, occur over an area of more than B
400,000 mi2 in Ohio, Kentucky,; Tennessee, Indiana, Michigan,
Alabama, and extend as far southwest as Oklahoma and Texas. As •
shown in Figure 2.2-3 black shale deposits also occur in the I
northern great plains and extend into Canada.
The Devonian shales are lean by western shale standards, with an I
average Fisher assay of only 10 gal/ton; however, the carbon con- *
tent of Devonian shales is typically about 14 percent, or approxi-
mately the same as Green River shale assaying 30 gal/ton. The ft
difference in Fischer assay is due to the higher carbon to avail- m
able hydrogen weight ratio of thei10 gal/ton Devonian shale (11-2
to 1) as compared with the 30 gal/ton Green River shale (7.2 to f»
1). If, however, the 10 gal/ton Devonian shale is retorted in the •
presence of hydrogen (i.e., hydroretorted), oil yield can be
increased to 25 gal/ton, according to research conducted by the _>
Institute of Gas Technology (IGT) [Tarman et al., 1977]. •
The higher oil yields possible with hydroretorting can, of course,
have an influence on defining the Devonian shale resource base. fl
The USGS estimate of equivalent oil in place in Devonian shales is 9
400 billion bbl, without considering the effect of hydrogen in
retorting. With hydroretorting, this value could easily increase »
to 1 trillion bbl, or 250 percent of the conventional Fischer •
assay. •
The Institute of Gas Technology has surveyed the three-principal tf
Devonian shale basins (Appalachian, Illinois, and Michigan) and p
estimated that some 423 billion bbl of oil could be recovered from
the 6,200 mi2 of outcrops and relatively shallow deposits in these m
basins alone if hydroretorting were employed. Their criteria for jj
a recoverable resource required that a shale deposit have an
26
I
1
image:
 Figure 2.2-3.
Distribution of Upper Devonian and Lower
Mississippian Black Shales in the Eastern
United States. Source: Baughman, 1978
organic content of more than 10 percent by weight, a unit rock
thickness of at least 10 ft, an overburden thickness oJF less than
200 ft, and a stripping ratio of less than 2.5 to 1. i The study
assumed hydroretprting yields of 85 percent of the organic carbon
present, and strip mining at 90 percent recovery of in-place shale.
2.2.3 Other Shale Deposits , ,
i
Among other U.S. shale deposits are the thin strata of carbona-
ceous shales associated with coal beds, particularly iti the Appa-
lachian coal region. It is estimated that perhaps 60 billion bbl
of equivalent oil may be present there in high grade shales assay-
ing from 25 to 100 gal/ton. In California, the Mioqene marine
shales are believed to constitute a 70-billion bbl resource in
shales varying from 5 to 25 gal/ton. In southwestern Montana,
beds of Permian black shale, ranging from 5 to 15 gal/ton, may
total up to 10 billion bbl of equivalent oil in place. As with the
Appalachian coal shales, however, neither the Alaskan, California,
nor the Montana shale are considered to be of near-term:commercial
importance [Duncan et al., 1965]. :
27
image:
Figure 2.2-3.
Distribution of Upper Devonian and Lower
Mississippian Black Shales in the Eastern
United States. Source: Baughman, 1978
organic content of more than 10 percent by weight, a unit rock
thickness of at least 10 ft, an overburden thickness oJF less than
200 ft, and a stripping ratio of less than 2.5 to 1. i The study
assumed hydroretprting yields of 85 percent of the organic carbon
present, and strip mining at 90 percent recovery of in-place shale.
2.2.3 Other Shale Deposits , ,
i
Among other U.S. shale deposits are the thin strata of carbona-
ceous shales associated with coal beds, particularly iti the Appa-
lachian coal region. It is estimated that perhaps 60 billion bbl
of equivalent oil may be present there in high grade shales assay-
ing from 25 to 100 gal/ton. In California, the Mioqene marine
shales are believed to constitute a 70-billion bbl resource in
shales varying from 5 to 25 gal/ton. In southwestern Montana,
beds of Permian black shale, ranging from 5 to 15 gal/ton, may
total up to 10 billion bbl of equivalent oil in place. As with the
Appalachian coal shales, however, neither the Alaskan, California,
nor the Montana shale are considered to be of near-term:commercial
importance [Duncan et al., 1965]. :
27
image:
 2.3 GEOLOGY
I
I
The geology of United States oil shales varies with the location fl
of each occurrence. The geologic factors which are similar from ™
deposit to deposit are related to the modes of origin for oil
shales. The origin of oil shale involved the deposition of organ- H
ic remains from quiescent organic-rich waters. The maintenance of H
reducing conditions during and after deposition and before indur-
ation was required to prevent oxidation of deposited organic mat- _.
ter. The similarities in geology appear to end at this point, as I
evidenced by the wide differences in the mineralogical composition *•
of the inorganic fraction of oil shale and the variance of the
properties of kerogen (altered organic material) from deposit to •
deposit. |
Oil shale interest to date has concentrated on the Green River •
Formation deposits and more recently the Devonian-Mississippian I
black shale deposits. For this reason, discussions of the geology ^
of these two major deposits are presented.
2.3.1 Green River Formation •
The Green River Formation oil shales were deposited 50 to 60 mil- •
lion years ago in two large Eocene-age lakes. Lake Uinta occupied H
the northwest part of Colorado and the northeast part of Utah.
Lake Gosiute occupied the southwest portion of Wyoming. During «
different periods of deposition of the Green River Formation the •
two lakes were probably connected in the area of northwest Colo- m
rado and southwest Wyoming near the east end of the Uinta Mountain
Uplift. ; M
Located within each of these ancifent lake complexes were individ-
ual depositional basins. Fluctuations in lake levels caused by m
tectonic and climatic changes resulted in alternating deposition g
of oil shales, saline minerals, fluvial sediments, fresh water
facies, and mud-flat type deposits. Figure 2.2-2, discussed u
previously, shows the individual depositonal basins. The thicker, 9
richer oil shales are generally located at the depositional ™
centers of these basins.
2.3.1.1 Piceance Creek Basin, Colorado p
The Piceance Creek basin is a large asymmetric structural downwarp «
[Doimell, 1961]. The axis of the basin trends northwest to south- •
west with the western and southern flanks gently sloping into the
basin. The northern and eastern flanks slope much more steeply
into the basin. The basin is bordered on the northwest and north •
by the Rangely-Skull Creek-White River anticlinal trends; on the m
east by the White River Uplift; on the southeast and south by the
Elk and West Elk Mountains and Gunnison Uplift; and along the west
by the Douglas Creek arch [Murray et al., 1964]. Numerous small
28
1
I
I
image:
2.3 GEOLOGY
I
I
The geology of United States oil shales varies with the location fl
of each occurrence. The geologic factors which are similar from ™
deposit to deposit are related to the modes of origin for oil
shales. The origin of oil shale involved the deposition of organ- H
ic remains from quiescent organic-rich waters. The maintenance of H
reducing conditions during and after deposition and before indur-
ation was required to prevent oxidation of deposited organic mat- _.
ter. The similarities in geology appear to end at this point, as I
evidenced by the wide differences in the mineralogical composition *•
of the inorganic fraction of oil shale and the variance of the
properties of kerogen (altered organic material) from deposit to •
deposit. |
Oil shale interest to date has concentrated on the Green River •
Formation deposits and more recently the Devonian-Mississippian I
black shale deposits. For this reason, discussions of the geology ^
of these two major deposits are presented.
2.3.1 Green River Formation •
The Green River Formation oil shales were deposited 50 to 60 mil- •
lion years ago in two large Eocene-age lakes. Lake Uinta occupied H
the northwest part of Colorado and the northeast part of Utah.
Lake Gosiute occupied the southwest portion of Wyoming. During «
different periods of deposition of the Green River Formation the •
two lakes were probably connected in the area of northwest Colo- m
rado and southwest Wyoming near the east end of the Uinta Mountain
Uplift. ; M
Located within each of these ancifent lake complexes were individ-
ual depositional basins. Fluctuations in lake levels caused by m
tectonic and climatic changes resulted in alternating deposition g
of oil shales, saline minerals, fluvial sediments, fresh water
facies, and mud-flat type deposits. Figure 2.2-2, discussed u
previously, shows the individual depositonal basins. The thicker, 9
richer oil shales are generally located at the depositional ™
centers of these basins.
2.3.1.1 Piceance Creek Basin, Colorado p
The Piceance Creek basin is a large asymmetric structural downwarp «
[Doimell, 1961]. The axis of the basin trends northwest to south- •
west with the western and southern flanks gently sloping into the
basin. The northern and eastern flanks slope much more steeply
into the basin. The basin is bordered on the northwest and north •
by the Rangely-Skull Creek-White River anticlinal trends; on the m
east by the White River Uplift; on the southeast and south by the
Elk and West Elk Mountains and Gunnison Uplift; and along the west
by the Douglas Creek arch [Murray et al., 1964]. Numerous small
28
1
I
I
image:
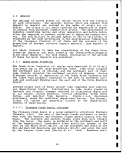 anticlines and synclines are found within the basin; faulting
(graben) systems are associated with some of the more pronounced
structural trends. I
Strata exposed in and around the margins of the basin range in age
from late Cretaceous to early Tertiary [Donnell, 1961]. The
oldest rocks are the late Cretaceous Mesaverde Group which is
composed of sandstones, shales, and some coal beds. Fossil content
indicates that deposition occurred near standlinesj in fresh,
brackish, and marine environments. The Mesaverde j rocks are
generally more resistant to erosion and form a series of prominent
benches which outcrop continuously around the southern ;and eastern
margin of the basin. Overlying the late Cretaceous is the Paleocene
series consisting of the Ohio Creek Conglomerate and; an unnamed
unit, composed of feldspathic sandstones, shales, and thin coal
beds, which is considered a Fort Union Formation equivalent. The
Wasatch Formation of early Eocene overlies the Paleocene rocks and
consists of thick sequences of lenticular sandstones and vari-
colored shales with some coal beds. Fossil evidencfe indicates
that) the Wasatch was deposited in a terrestrial fluvial environ-
ment,. The Wasatch Formation, being less resistive to erosion than
overlying and underlying strata, forms lowland areas between the
cuestas of the more resistive adjacent rocks. The Green Riyer
Formation, containing the oil shales of the Piceance Greek basin,
is generally thought of as overlying the Wasatch Formation. How-
ever,, upper tongues of the Wasatch Formation are time equivalent
to some Green River depositional sequences which represents either
fluyial depositional encroachment into the lacustrine !Green River
environment or regression of the Green River lacustrine environ-
ment,. Similarly, the fluvial (stream-bed) Uinta Formation inter-
tongues, but generally overlies, the lacustrine j (lake-bed)
deposits of the Green River Formation. The Green River Formation
in Piceance Creek basin has been divided into three main members
based on lithology, but locally a fourth clastic facies is present.
Each of the members is discussed in ascending order with emphasis
on the Parachute Creek Member, the main oil shale be'aring unit.
The Douglas Creek Member, basal member of the Green River Forma-
tion,, is composed of sandstones, shales, and limestones that con-
formably overlie the varicolored shale and sandstone units of the
Wasatch Formation. This member has been recognized only in the
southern, western, and central parts of the basin. Injthe eastern
part of the basin, aclastic facies replaces the Douglas Creek Mem-
ber. To the northwest, the Douglas Creek Member coalesces with
shales of the overlying Garden Gulch Member. Resistant strata of
the Douglas Creek Member form a series of light brpwn benches
along the base of the Green River Formation escarpmentJ
The Garden Gulch Member, overlying the Douglas Creek Member along
the basin margins, is composed of dark, finely laminated illite
shales and marlstone, some of which contain kerogen. With the ex-
ception of the eastern part of the basin, where equivalent sandy
29
image:
anticlines and synclines are found within the basin; faulting
(graben) systems are associated with some of the more pronounced
structural trends. I
Strata exposed in and around the margins of the basin range in age
from late Cretaceous to early Tertiary [Donnell, 1961]. The
oldest rocks are the late Cretaceous Mesaverde Group which is
composed of sandstones, shales, and some coal beds. Fossil content
indicates that deposition occurred near standlinesj in fresh,
brackish, and marine environments. The Mesaverde j rocks are
generally more resistant to erosion and form a series of prominent
benches which outcrop continuously around the southern ;and eastern
margin of the basin. Overlying the late Cretaceous is the Paleocene
series consisting of the Ohio Creek Conglomerate and; an unnamed
unit, composed of feldspathic sandstones, shales, and thin coal
beds, which is considered a Fort Union Formation equivalent. The
Wasatch Formation of early Eocene overlies the Paleocene rocks and
consists of thick sequences of lenticular sandstones and vari-
colored shales with some coal beds. Fossil evidencfe indicates
that) the Wasatch was deposited in a terrestrial fluvial environ-
ment,. The Wasatch Formation, being less resistive to erosion than
overlying and underlying strata, forms lowland areas between the
cuestas of the more resistive adjacent rocks. The Green Riyer
Formation, containing the oil shales of the Piceance Greek basin,
is generally thought of as overlying the Wasatch Formation. How-
ever,, upper tongues of the Wasatch Formation are time equivalent
to some Green River depositional sequences which represents either
fluyial depositional encroachment into the lacustrine !Green River
environment or regression of the Green River lacustrine environ-
ment,. Similarly, the fluvial (stream-bed) Uinta Formation inter-
tongues, but generally overlies, the lacustrine j (lake-bed)
deposits of the Green River Formation. The Green River Formation
in Piceance Creek basin has been divided into three main members
based on lithology, but locally a fourth clastic facies is present.
Each of the members is discussed in ascending order with emphasis
on the Parachute Creek Member, the main oil shale be'aring unit.
The Douglas Creek Member, basal member of the Green River Forma-
tion,, is composed of sandstones, shales, and limestones that con-
formably overlie the varicolored shale and sandstone units of the
Wasatch Formation. This member has been recognized only in the
southern, western, and central parts of the basin. Injthe eastern
part of the basin, aclastic facies replaces the Douglas Creek Mem-
ber. To the northwest, the Douglas Creek Member coalesces with
shales of the overlying Garden Gulch Member. Resistant strata of
the Douglas Creek Member form a series of light brpwn benches
along the base of the Green River Formation escarpmentJ
The Garden Gulch Member, overlying the Douglas Creek Member along
the basin margins, is composed of dark, finely laminated illite
shales and marlstone, some of which contain kerogen. With the ex-
ception of the eastern part of the basin, where equivalent sandy
29
image:
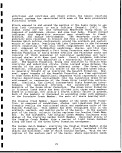 1
_
Garden Gulch outcrops as gray steep slopes between the white
cliffs of the Parachute Creek Member and the brown and buff {•
benches of the Douglas Creek Member. ffl
Problems with the correlation of the Garden Gulch and Douglas «
Creek Members, as they were previously described at type sections M
on the flank of the basin, to central basin deposits as they "
are presently mapped has been discussed [Roehler, 1974]. The
two members at the type sections have been described as being •
"...largely chronologic and lithologic equivalents." Others do •
not differentiate the two members because they are partly time-
equivalent. The thickness of the Garden Gulch-Douglas Creek •
(undifferentiated fresh water unit) in the more central portion •
of the basin is reported to be at least 1,000 feet. Two easily
discernible geologic markers in the subsurface, found on resis- _
tivity logs, exist in the vicinity of the Garden Gulch-Douglas •
Creek unit. Both markers exhibit an extremely low resistivity. P
The uppermost marker, the Blue marker, is considered the contact
between the clay (illite) shales of the Garden Gulch and the •
dolomitic marlstones of the overlying Parachute Creek Member. I
The lowermost marker, the Orange marker, has been described by
some as the contact between the Garden Gulch and Douglas Creek m
Members [Roehler, 1974]. •
A clastic facies equivalent to the Douglas Creek, Garden Gulch,
and( lower portion of Parachute Creek Members are assigned to the •
Anvil Points Member. This member is composed of sandstones, •
shales, marlstones, siltstones, and limestones. The Anvil Points
Member has been described along outcrops from the Parachute Creek •
valley around the eastern rim, to a little north of the headwaters 1
of Piceance Creek. The absence of the Anvil Points Member in the
Piceance Creek gas field indicates that the member is confined to H
the southeast and eastern parts of the basin. The maximum known B
thickness is 1,870 feet in the upper Piceance Creek area. The An- *
vil Points Member appears as a series of benches and cliffs below
the cliffs of the Parachute Creek Member. It interfingers with •
the overlying Parachute Creek Member and the underlying Wasatch I
Formation with both the upper and lower contacts conformable and
gradational. «
The Parachute Creek Member which overlies the Douglas Creek-Garden
Gulch_unit is of most interest because it contains the majority of _
the oil shale resources in the Piceance Creek basin. Although the I
term oil shale is used extensively, the lithology generally con- •
sists of kerogenetic dolomitic marlstone and differs considerably
from the true illite shales of the!underlying Garden Gulch Member. •
Weathering of the resistant Parachute Creek Member has produced p
precipitous and often spectacular1 escarpments around the rim of
the basin. The thickness of the Parachute Creek Member varies «
from over 2,000 feet in the north central part of the basin to I
about 500 feet along the margins. ' *
30
I
image:
1
_
Garden Gulch outcrops as gray steep slopes between the white
cliffs of the Parachute Creek Member and the brown and buff {•
benches of the Douglas Creek Member. ffl
Problems with the correlation of the Garden Gulch and Douglas «
Creek Members, as they were previously described at type sections M
on the flank of the basin, to central basin deposits as they "
are presently mapped has been discussed [Roehler, 1974]. The
two members at the type sections have been described as being •
"...largely chronologic and lithologic equivalents." Others do •
not differentiate the two members because they are partly time-
equivalent. The thickness of the Garden Gulch-Douglas Creek •
(undifferentiated fresh water unit) in the more central portion •
of the basin is reported to be at least 1,000 feet. Two easily
discernible geologic markers in the subsurface, found on resis- _
tivity logs, exist in the vicinity of the Garden Gulch-Douglas •
Creek unit. Both markers exhibit an extremely low resistivity. P
The uppermost marker, the Blue marker, is considered the contact
between the clay (illite) shales of the Garden Gulch and the •
dolomitic marlstones of the overlying Parachute Creek Member. I
The lowermost marker, the Orange marker, has been described by
some as the contact between the Garden Gulch and Douglas Creek m
Members [Roehler, 1974]. •
A clastic facies equivalent to the Douglas Creek, Garden Gulch,
and( lower portion of Parachute Creek Members are assigned to the •
Anvil Points Member. This member is composed of sandstones, •
shales, marlstones, siltstones, and limestones. The Anvil Points
Member has been described along outcrops from the Parachute Creek •
valley around the eastern rim, to a little north of the headwaters 1
of Piceance Creek. The absence of the Anvil Points Member in the
Piceance Creek gas field indicates that the member is confined to H
the southeast and eastern parts of the basin. The maximum known B
thickness is 1,870 feet in the upper Piceance Creek area. The An- *
vil Points Member appears as a series of benches and cliffs below
the cliffs of the Parachute Creek Member. It interfingers with •
the overlying Parachute Creek Member and the underlying Wasatch I
Formation with both the upper and lower contacts conformable and
gradational. «
The Parachute Creek Member which overlies the Douglas Creek-Garden
Gulch_unit is of most interest because it contains the majority of _
the oil shale resources in the Piceance Creek basin. Although the I
term oil shale is used extensively, the lithology generally con- •
sists of kerogenetic dolomitic marlstone and differs considerably
from the true illite shales of the!underlying Garden Gulch Member. •
Weathering of the resistant Parachute Creek Member has produced p
precipitous and often spectacular1 escarpments around the rim of
the basin. The thickness of the Parachute Creek Member varies «
from over 2,000 feet in the north central part of the basin to I
about 500 feet along the margins. ' *
30
I
image:
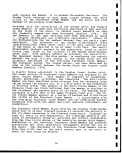 The most consistently rich and laterally persistent oil! shale zone
in the basin is designated the Mahogany ledge on putcrop and
Mahogany zone in the subsurface [Bradley, 1931]. Figiire 2.3-1, a
schematic cross section, shows the relative position of the
Mahogany zone as well as other members and zones within the Green
River Formation. The very resistant-to-weathering nature of the
Mahogany zone is due to its high kerogen content and! results in
vertical to near-vertical outcrops. The Mahogany zone is bounded
on the top and bottom by relatively thin barren zones' termed the
'A' and 'B' grooves, respectively. These barren zones are less
resistant to erosion, forming slopes on outcrops that resemble
grooves, hence their designation. In the subsurface both the 'A'
and ''B' grooves produce distinct lows on resistivity >. logs. The
thickness of the Mahogany zone ranges from approximately 100 feet
near the margins of the basin to about 200 feet in the north cen-
tral part of the basin. Generally, the grade of oil shale in the
Mahogany zone exceeds 20 gallons per ton with the richest sequence
comprising approximately 130 feet of 30 gallon per [ton shale.
I
Above the Mahogany zone there generally is 300 to 500 feet of
leaner oil shale. This sequence is thickest in the southern part
of the basin. Due to interfingering with the overlying Unita
Formation in the northern part of the basin, the upper sequence
thins to less than 300 feet. !
A sequence of oil shale below the Mahogany zone extends from the
top of the Blue marker to the base of the 'B1 groove. In the
southeastern part of the basin this lower oil shale sequence is
interfingered with, and in some instances replaced by; the Anvil
Points Member. In the extreme northwest part of the basin the
lower oil shale sequence is absent and the Mahogany zone and over-
lying oil shale rests conformably on the Garden Gulch Member
(Donnell, 1961). Elsewhere, the thickness of the lower oil shale
sequence ranges from a minimum of 20 feet in the southwest to over
1,300 feet in the north-central part of the basin. iToward the
central portion of the basin the lower sequence ofj oil shale
thickens due to the increased lacustrine type deposition,
resulting in significant accumulations of dolomitic marlstones,
organic material, and saline minerals. The saline' minerals,
depending on the particular mineral, have been fotmd finely
disseminated within the oil shale, as individual spherical crystal
growths or rosettes and as bedded layers and zones. j
The lower oil shale zone was subdivided into a series of alternat-
ing lean and rich zones [Cashion and Donnell, 1974] j The rich
zones were designated R-4, R-5, R-6, etc. This designation and
correlation was based on oil shale grade from the Modified Fischer
Assay or apparent grade from geophysical logs. The^ lower oil
shale sequence can also be subdivided into two zones, leached and
unleached, on the basis of removal by dissolution or leaching of
saline minerals, mainly consisting of minerals such as nahcolite
31
image:
The most consistently rich and laterally persistent oil! shale zone
in the basin is designated the Mahogany ledge on putcrop and
Mahogany zone in the subsurface [Bradley, 1931]. Figiire 2.3-1, a
schematic cross section, shows the relative position of the
Mahogany zone as well as other members and zones within the Green
River Formation. The very resistant-to-weathering nature of the
Mahogany zone is due to its high kerogen content and! results in
vertical to near-vertical outcrops. The Mahogany zone is bounded
on the top and bottom by relatively thin barren zones' termed the
'A' and 'B' grooves, respectively. These barren zones are less
resistant to erosion, forming slopes on outcrops that resemble
grooves, hence their designation. In the subsurface both the 'A'
and ''B' grooves produce distinct lows on resistivity >. logs. The
thickness of the Mahogany zone ranges from approximately 100 feet
near the margins of the basin to about 200 feet in the north cen-
tral part of the basin. Generally, the grade of oil shale in the
Mahogany zone exceeds 20 gallons per ton with the richest sequence
comprising approximately 130 feet of 30 gallon per [ton shale.
I
Above the Mahogany zone there generally is 300 to 500 feet of
leaner oil shale. This sequence is thickest in the southern part
of the basin. Due to interfingering with the overlying Unita
Formation in the northern part of the basin, the upper sequence
thins to less than 300 feet. !
A sequence of oil shale below the Mahogany zone extends from the
top of the Blue marker to the base of the 'B1 groove. In the
southeastern part of the basin this lower oil shale sequence is
interfingered with, and in some instances replaced by; the Anvil
Points Member. In the extreme northwest part of the basin the
lower oil shale sequence is absent and the Mahogany zone and over-
lying oil shale rests conformably on the Garden Gulch Member
(Donnell, 1961). Elsewhere, the thickness of the lower oil shale
sequence ranges from a minimum of 20 feet in the southwest to over
1,300 feet in the north-central part of the basin. iToward the
central portion of the basin the lower sequence ofj oil shale
thickens due to the increased lacustrine type deposition,
resulting in significant accumulations of dolomitic marlstones,
organic material, and saline minerals. The saline' minerals,
depending on the particular mineral, have been fotmd finely
disseminated within the oil shale, as individual spherical crystal
growths or rosettes and as bedded layers and zones. j
The lower oil shale zone was subdivided into a series of alternat-
ing lean and rich zones [Cashion and Donnell, 1974] j The rich
zones were designated R-4, R-5, R-6, etc. This designation and
correlation was based on oil shale grade from the Modified Fischer
Assay or apparent grade from geophysical logs. The^ lower oil
shale sequence can also be subdivided into two zones, leached and
unleached, on the basis of removal by dissolution or leaching of
saline minerals, mainly consisting of minerals such as nahcolite
31
image:
 »ooo'-
•000'-
700O%-
6000 -
5000'-
4000'-
3OOO'-
SOUTH
A1
9000'
Greovt
Groovt
- 8000'
GRE EN RIVER
F )RMATION
- TOOO'
GREEN f
RIVER <
FORMATION L
Wbsotch
Formation
- 6000'
- 5000'
- 4000
L 3000
Figure 2.3-1. Schematic North-South Cross Section of Piceance
Creek Showing Relationship of Oil Shale Bearing
Members of the Green River Formation and
Surrounding Strata.
Source: Baughman, 1978
and halite in the upper portions of the-saline section. Although
leaching is not confined to any one area of the basin, the effects
of leaching are most pronounced in the central part of the basin
where there was maximum saline deposition. An unleached or saline
zone is found below the leached zone in the central portion of the
basin. This zone contains potentially recoverable deposits of
nahcolite and dawsonite. From these two minerals, soda ash and
alumina can be produced. The thickness of the unleached saline
zone in the central part of the basin ranges from about 500 to
over 1,000 feet.
The interface of the leached and unleached zone, somewhat poorly
defined, is termed the dissolution surface. In reality, it is
probably a dissolution zone, as numerous cores have shown nahco-
lite to be present above the dissolution surface while vugs and
cavities are found below. At best, any designated dissolution
surface is an approximation.
1
I
1
I
I
I
I
32
1
I
I
I
I
I
I
I
I
I
I
image:
»ooo'-
•000'-
700O%-
6000 -
5000'-
4000'-
3OOO'-
SOUTH
A1
9000'
Greovt
Groovt
- 8000'
GRE EN RIVER
F )RMATION
- TOOO'
GREEN f
RIVER <
FORMATION L
Wbsotch
Formation
- 6000'
- 5000'
- 4000
L 3000
Figure 2.3-1. Schematic North-South Cross Section of Piceance
Creek Showing Relationship of Oil Shale Bearing
Members of the Green River Formation and
Surrounding Strata.
Source: Baughman, 1978
and halite in the upper portions of the-saline section. Although
leaching is not confined to any one area of the basin, the effects
of leaching are most pronounced in the central part of the basin
where there was maximum saline deposition. An unleached or saline
zone is found below the leached zone in the central portion of the
basin. This zone contains potentially recoverable deposits of
nahcolite and dawsonite. From these two minerals, soda ash and
alumina can be produced. The thickness of the unleached saline
zone in the central part of the basin ranges from about 500 to
over 1,000 feet.
The interface of the leached and unleached zone, somewhat poorly
defined, is termed the dissolution surface. In reality, it is
probably a dissolution zone, as numerous cores have shown nahco-
lite to be present above the dissolution surface while vugs and
cavities are found below. At best, any designated dissolution
surface is an approximation.
1
I
1
I
I
I
I
32
1
I
I
I
I
I
I
I
I
I
I
image:
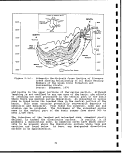 The leached zone is characterized by cavities, vugs, and collapsed
breccia. The thickness of the leached zone toward the central
part of the basin varies from about 400 to 1,100 feet. Leached
zone thickness is greater around the margins of the major saline
deposition. Leaching of the saline minerals has upgraded the oil
shale value within the leached zone by removing inorganic saline
minerals which would have had the effect of diluting the percent-
age of organic material. Leaching has also produced higher po-
rosity and permeability by removing evaporites thus producing an
aquifer while reducing bulk strength of the rock. j
Overlying the Green River Formation is the Uinta Formation, which
includes sandstones and siltstones which were formerly designated
as the Evacuation Creek Member of the Green River Formation. With
the exception of a few local unconformities described by Donnell
(1961), these formations represent a continuous depositional
sequence. The outcrop of the Uinta Formation forms! a buff to
rusty brown colored rounded cap receding from the white cliffs of
the Parachute Creek Member. :
The maximum thickness of the Uinta Formation is unknown because
the top has been removed by erosion; however, from: subsurface
information, it is known to exceed 1,200 feet. Because of inter-
tonguing with the Parachute Creek Member, the lower boundary
varies from location to location. i
2.3.1.2 Uinta Basin, Utah ;
The Uinta basin is sharply asymmetrical, the axis of which lies in
the northern portion of the basin trending east-west and parallel
to the Uinta Mountain uplift which borders the basin to the north
The Wasatch Mountains border the basin to the west and the Douglas
Creek Arch borders the basin on the East. The southern flank of
the basin is bordered by the San Rafael Swell, the Salt Creek
Anticline, and the Uncomphagre Uplift. Over 13,000 feet of sedi-
ments were deposited in the basin center during the Epcene time.
Eocene strata of the Uinta basin belong to the Wasatch Green
River, and Uinta Formations, consisting of rocks deposited in
fluvial and lacustrine type environments. The thickest and
richest oil shales of the Uinta basin are found in the east
central portion of the basin, as indicated on Figure 2.3-2.
The Wasatch Formation, the basal Eocene strata, is composed of
fluvial sandstones, shales, mudstones, and siltstones. The
Wasatch rocks vary in color from red and purple to browns and
light grays. The formation is divided into two parts, the main
body of the Wasatch and the Renegade tongue which intertongue with
the overlying Green River Formation.
33
image:
The leached zone is characterized by cavities, vugs, and collapsed
breccia. The thickness of the leached zone toward the central
part of the basin varies from about 400 to 1,100 feet. Leached
zone thickness is greater around the margins of the major saline
deposition. Leaching of the saline minerals has upgraded the oil
shale value within the leached zone by removing inorganic saline
minerals which would have had the effect of diluting the percent-
age of organic material. Leaching has also produced higher po-
rosity and permeability by removing evaporites thus producing an
aquifer while reducing bulk strength of the rock. j
Overlying the Green River Formation is the Uinta Formation, which
includes sandstones and siltstones which were formerly designated
as the Evacuation Creek Member of the Green River Formation. With
the exception of a few local unconformities described by Donnell
(1961), these formations represent a continuous depositional
sequence. The outcrop of the Uinta Formation forms! a buff to
rusty brown colored rounded cap receding from the white cliffs of
the Parachute Creek Member. :
The maximum thickness of the Uinta Formation is unknown because
the top has been removed by erosion; however, from: subsurface
information, it is known to exceed 1,200 feet. Because of inter-
tonguing with the Parachute Creek Member, the lower boundary
varies from location to location. i
2.3.1.2 Uinta Basin, Utah ;
The Uinta basin is sharply asymmetrical, the axis of which lies in
the northern portion of the basin trending east-west and parallel
to the Uinta Mountain uplift which borders the basin to the north
The Wasatch Mountains border the basin to the west and the Douglas
Creek Arch borders the basin on the East. The southern flank of
the basin is bordered by the San Rafael Swell, the Salt Creek
Anticline, and the Uncomphagre Uplift. Over 13,000 feet of sedi-
ments were deposited in the basin center during the Epcene time.
Eocene strata of the Uinta basin belong to the Wasatch Green
River, and Uinta Formations, consisting of rocks deposited in
fluvial and lacustrine type environments. The thickest and
richest oil shales of the Uinta basin are found in the east
central portion of the basin, as indicated on Figure 2.3-2.
The Wasatch Formation, the basal Eocene strata, is composed of
fluvial sandstones, shales, mudstones, and siltstones. The
Wasatch rocks vary in color from red and purple to browns and
light grays. The formation is divided into two parts, the main
body of the Wasatch and the Renegade tongue which intertongue with
the overlying Green River Formation.
33
image:
 The Green River Formation is divided into three members in the
Uinta basin: the basal Douglas Creek Member; and the overlying
Garden Gulch Member, and the uppermost Parachute Creek Member.
Figure 2.3-2 is a schematic cross section illustrating the Eocene
stratigraphy of the Uinta basin. ;
Index
Map
V'//////:,-'//.'.-/.Uinta format ion •/;/////////'.y'-V/V.;=b^==7?ciastic •'" •="-
Mahogany Zone
Lacustrine Facies
Green River Formation
Clastic Facies
Green River Formation
Figure 2.3-2.
Schematic Cross Section of Uinta Basin Showing
Relationship of Oil Shale Bearing Green River
Formation With Surrounding Strata.
Source: Baughman, 1978
The Douglas Creek Member is compqsed of shale, siltstone, sand-
stone, and oolitic, algal, and ostracodal limestones. Locally,
the Douglas Creek Member contains a few oil shale beds. The
member conformably intertongues with fluvial sediments of the
Wasatch Renegade Member. The maximum thickness of the member is
1,180 feet [Cashion, 1967].
The Garden Gulch Member outcrop is distinctly different from the
Douglas Creek Member outcrop, a$ the Garden Gulch forms gray
slopes which contrast with the brown ledge-forming sediments of
34
I
1
I
I
I
I
I
I
I
I
I
I
I
I
I
I
I
I
I
image:
The Green River Formation is divided into three members in the
Uinta basin: the basal Douglas Creek Member; and the overlying
Garden Gulch Member, and the uppermost Parachute Creek Member.
Figure 2.3-2 is a schematic cross section illustrating the Eocene
stratigraphy of the Uinta basin. ;
Index
Map
V'//////:,-'//.'.-/.Uinta format ion •/;/////////'.y'-V/V.;=b^==7?ciastic •'" •="-
Mahogany Zone
Lacustrine Facies
Green River Formation
Clastic Facies
Green River Formation
Figure 2.3-2.
Schematic Cross Section of Uinta Basin Showing
Relationship of Oil Shale Bearing Green River
Formation With Surrounding Strata.
Source: Baughman, 1978
The Douglas Creek Member is compqsed of shale, siltstone, sand-
stone, and oolitic, algal, and ostracodal limestones. Locally,
the Douglas Creek Member contains a few oil shale beds. The
member conformably intertongues with fluvial sediments of the
Wasatch Renegade Member. The maximum thickness of the member is
1,180 feet [Cashion, 1967].
The Garden Gulch Member outcrop is distinctly different from the
Douglas Creek Member outcrop, a$ the Garden Gulch forms gray
slopes which contrast with the brown ledge-forming sediments of
34
I
1
I
I
I
I
I
I
I
I
I
I
I
I
I
I
I
I
I
image:
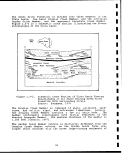 the Douglas Creek" Member. The member is chiefly fcomposed of
marlstones, oil shales, and siltstones. The Garden Gulch Member
is thickest along the eastern outcrop of the Green River Formation
of the Uinta basin/ Westerly, the Garden Gulch thickens, while
the overlying Parachute Creek and underlying Douglas Creek members
thicken basinward. The maximum thickness of the Garden Gulch
Member is 230 feet [Cashion, 1967]. ;
The Parachute Creek Member of the Green River Formation contains
the oil shales of significant interest in the Uinta ^basin. The
member is composed mostly of kerogenetic marlstone (:oil shale),
barren marlstone, sandstone, siltstone, and tuff. The oil shales
are for the most part finely laminated or varved. Individual beds
within the Parachute Creek Member are well known for their lateral
extent and relative continuity. Many of the mappable units of the
Piceance Creek basin oil shales are also recognized and mappable
in the Uinta basin. The thickest and richest sequence of oil
shale in the Uinta basin is found in the laterally persistent Ma-
hogany ledge, termed Mahogany zone in the subsurface.! Oil shale
also exists above and below the Mahogany zone, but is somewhat
leaner in grade. The maximum thickness of the Mahogany zone in
Utah is about 100 feet. The Parachute Creek Member is about 750
feet thick in the east central portion of the basin but thickens
to the north and west toward the synclinal axis of1 the basin.
Evidence of a saline zone exists in the upper one-third of the
member, where crystal cavities thought to have once contained the
mineral nahcolite have been observed. The leaching of the nahco-
lite by groundwater has given the appearance on verticjal outcrops
that swallows have nested there, thus giving rise to the name
"birds nest zone" [Cashion, 1967]. The upper section of the
Parachute Creek Member containing the "birds nest zone'" was named
Evacuation Creek Member [Bradley, 1931 and Cashion, 1967]. How-
ever, the nomenclature has since been revised to place those
sediments within the Parachute Creek Member [Cashion et al.,
1974]. The lacustrine sediments of the Parachute Creek member
intertongue with the overlying fluvial sediments of the Uinta
Formation. ;
Overlying the Green River Formation is the Uinta Formation, which
consists of approximately 1,750 feet of sandstones and claystones.
Colors range from brown and greenish gray in the lower section to
browns and reds, in the upper section [Cashion, 1967]. The Uinta
Formation covers most of the east central portion of the Uinta
basin where the thicker and richer oil shales are found.
2-3.1.3 Green River and Washakie Basins, Wyoming ;
Ancient Lake Gosiute covered a large portion of southwestern
Wyoming. The large lake was bordered to the north bys the Sweet-
water Uplift, the Wind River Uplift, and the Gros Ventre Uplift.
To the west, the lake was bordered by highlands created by the
Absaroka Thrust, the Uinta Arch, and the White River Uplift. The
35
image:
the Douglas Creek" Member. The member is chiefly fcomposed of
marlstones, oil shales, and siltstones. The Garden Gulch Member
is thickest along the eastern outcrop of the Green River Formation
of the Uinta basin/ Westerly, the Garden Gulch thickens, while
the overlying Parachute Creek and underlying Douglas Creek members
thicken basinward. The maximum thickness of the Garden Gulch
Member is 230 feet [Cashion, 1967]. ;
The Parachute Creek Member of the Green River Formation contains
the oil shales of significant interest in the Uinta ^basin. The
member is composed mostly of kerogenetic marlstone (:oil shale),
barren marlstone, sandstone, siltstone, and tuff. The oil shales
are for the most part finely laminated or varved. Individual beds
within the Parachute Creek Member are well known for their lateral
extent and relative continuity. Many of the mappable units of the
Piceance Creek basin oil shales are also recognized and mappable
in the Uinta basin. The thickest and richest sequence of oil
shale in the Uinta basin is found in the laterally persistent Ma-
hogany ledge, termed Mahogany zone in the subsurface.! Oil shale
also exists above and below the Mahogany zone, but is somewhat
leaner in grade. The maximum thickness of the Mahogany zone in
Utah is about 100 feet. The Parachute Creek Member is about 750
feet thick in the east central portion of the basin but thickens
to the north and west toward the synclinal axis of1 the basin.
Evidence of a saline zone exists in the upper one-third of the
member, where crystal cavities thought to have once contained the
mineral nahcolite have been observed. The leaching of the nahco-
lite by groundwater has given the appearance on verticjal outcrops
that swallows have nested there, thus giving rise to the name
"birds nest zone" [Cashion, 1967]. The upper section of the
Parachute Creek Member containing the "birds nest zone'" was named
Evacuation Creek Member [Bradley, 1931 and Cashion, 1967]. How-
ever, the nomenclature has since been revised to place those
sediments within the Parachute Creek Member [Cashion et al.,
1974]. The lacustrine sediments of the Parachute Creek member
intertongue with the overlying fluvial sediments of the Uinta
Formation. ;
Overlying the Green River Formation is the Uinta Formation, which
consists of approximately 1,750 feet of sandstones and claystones.
Colors range from brown and greenish gray in the lower section to
browns and reds, in the upper section [Cashion, 1967]. The Uinta
Formation covers most of the east central portion of the Uinta
basin where the thicker and richer oil shales are found.
2-3.1.3 Green River and Washakie Basins, Wyoming ;
Ancient Lake Gosiute covered a large portion of southwestern
Wyoming. The large lake was bordered to the north bys the Sweet-
water Uplift, the Wind River Uplift, and the Gros Ventre Uplift.
To the west, the lake was bordered by highlands created by the
Absaroka Thrust, the Uinta Arch, and the White River Uplift. The
35
image:
 I
Park Range and Rawlins Uplift border the lake to the east. The •
oil shales of primary interest in Wyoming are located in the Green
River and Washakie basins, which are contained within the areal H
extent of ancient Lake Gosiute. Other smaller basins within the H
extent of Lake Gosiute also contain oil shale but they are thin
and lean in comparison to those of the Washakie and Green River tm
basins. The other basins are the Fossil basin. Great Divide •
basin, and the Sand Wash basin, the latter extending into North-
western Colorado. The Washakie and Green River basins are now
separated by the Rock Springs Uplift, similar to the separation II
of the Uinta basin and Piceance Creek basins by the Douglas Creek •
Arch.
The stratigraphy of the sediments containing the oil shales in |
Wyoming is similar to that containing oil shales in Colorado and
Utah. The Wasatch Formation underlies the oil shale bearing Green «
River Formation. The Wasatch in Wyoming, as in Colorado and Utah, •
consists predominently of fluvial varicolored brown and gray sand- m
stones, siltstones, shales, and mudstones. Upper Wasatch sedi-
ments intertongue with the overlying Green River Formation. The •
Green River Formation has been divided into four basic members, in B
ascending order: Luman Tongue, Tipton Shale, Wilkins Peak, and
the Laney Shale Member. The fluvial Bridger Formation overlies m
and intertongues with the Green River Formation. Figure 2.3-3 is y
a schematic section, showing the general east-west stratigraphic
relationship of the rocks deposited during Eocene time in the
Green River and Washakie basins. I
Each of the members of the Green River Formation represents wide-
spread deposition of lacustrine facies of ancient Lake Gosiute. •
The Luman Tongue contains only lean oil shales. The Tipton Member H
contains oil shales considerably richer than those of the Luman in
the Green River basin. «
The Wilkins Peak Member consists mostly of marlstones, siltstones, ™
saline deposits, and oil shale. The saline section of the Wilkins
Peak Member contains bedded deposits of the mineral trona, from H
which soda ash is produced. The trona is presently being mined •
and processed. This saline section of the Wilkins Peak member
correlates time-wise with the saline section of the lower Para- •
chute Creek Member in the Piceance Creek basin [Roehler, 1974]. g
The oil shales of the Wilkins Peak Member, although relatively
rich, are thin and separated by lean or barren marlstones. The —
Wilkins Peak Member grades laterally to gray-green marlstones •
and is eventually replaced in section by fluvial tongues of the •
Wasatch Formation.
The uppermost member of the Greeii River Formation in Wyoming is I
the Laney Member. The widespread>distribution of the Laney indi-
cates that Lake Gosiute was most; extensive during Laney deposi- m
tion. Oil shales of the Laney Member in the eastern part of the ||
Washakie basin represent the thickest and richest oil shale
36
I
I
image:
I
Park Range and Rawlins Uplift border the lake to the east. The •
oil shales of primary interest in Wyoming are located in the Green
River and Washakie basins, which are contained within the areal H
extent of ancient Lake Gosiute. Other smaller basins within the H
extent of Lake Gosiute also contain oil shale but they are thin
and lean in comparison to those of the Washakie and Green River tm
basins. The other basins are the Fossil basin. Great Divide •
basin, and the Sand Wash basin, the latter extending into North-
western Colorado. The Washakie and Green River basins are now
separated by the Rock Springs Uplift, similar to the separation II
of the Uinta basin and Piceance Creek basins by the Douglas Creek •
Arch.
The stratigraphy of the sediments containing the oil shales in |
Wyoming is similar to that containing oil shales in Colorado and
Utah. The Wasatch Formation underlies the oil shale bearing Green «
River Formation. The Wasatch in Wyoming, as in Colorado and Utah, •
consists predominently of fluvial varicolored brown and gray sand- m
stones, siltstones, shales, and mudstones. Upper Wasatch sedi-
ments intertongue with the overlying Green River Formation. The •
Green River Formation has been divided into four basic members, in B
ascending order: Luman Tongue, Tipton Shale, Wilkins Peak, and
the Laney Shale Member. The fluvial Bridger Formation overlies m
and intertongues with the Green River Formation. Figure 2.3-3 is y
a schematic section, showing the general east-west stratigraphic
relationship of the rocks deposited during Eocene time in the
Green River and Washakie basins. I
Each of the members of the Green River Formation represents wide-
spread deposition of lacustrine facies of ancient Lake Gosiute. •
The Luman Tongue contains only lean oil shales. The Tipton Member H
contains oil shales considerably richer than those of the Luman in
the Green River basin. «
The Wilkins Peak Member consists mostly of marlstones, siltstones, ™
saline deposits, and oil shale. The saline section of the Wilkins
Peak Member contains bedded deposits of the mineral trona, from H
which soda ash is produced. The trona is presently being mined •
and processed. This saline section of the Wilkins Peak member
correlates time-wise with the saline section of the lower Para- •
chute Creek Member in the Piceance Creek basin [Roehler, 1974]. g
The oil shales of the Wilkins Peak Member, although relatively
rich, are thin and separated by lean or barren marlstones. The —
Wilkins Peak Member grades laterally to gray-green marlstones •
and is eventually replaced in section by fluvial tongues of the •
Wasatch Formation.
The uppermost member of the Greeii River Formation in Wyoming is I
the Laney Member. The widespread>distribution of the Laney indi-
cates that Lake Gosiute was most; extensive during Laney deposi- m
tion. Oil shales of the Laney Member in the eastern part of the ||
Washakie basin represent the thickest and richest oil shale
36
I
I
image:
 tn
o
LU
o
CD
tn
O
o
m
cc
5 -i
E'
"- oj
I i
(1)
>
•H
«
G
<U
0>
M
O
-H
W
O
•H
-P
(0
i-1
0) •
•P
&i fC
•H -P
O
-H
fi 73 00
o c r-
•P O rH
U M
0) H -
W 3 C
W 03
03 g
o -P tn
o ;s ra
U C
•H O
fC -P 0
£ 5 u
<U S M
U O O
CO
CO
»
CN
0)
37
image:
tn
o
LU
o
CD
tn
O
o
m
cc
5 -i
E'
"- oj
I i
(1)
>
•H
«
G
<U
0>
M
O
-H
W
O
•H
-P
(0
i-1
0) •
•P
&i fC
•H -P
O
-H
fi 73 00
o c r-
•P O rH
U M
0) H -
W 3 C
W 03
03 g
o -P tn
o ;s ra
U C
•H O
fC -P 0
£ 5 u
<U S M
U O O
CO
CO
»
CN
0)
37
image:
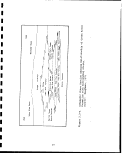 deposit, in Wyoming. The section of oil shale varies from about
150 to 500 feet in thickness [Roehler, 1973]. The oil shales of
the Laney Member in the Green River basin are not as thick as
those of the Washakie basin. The lacustrine Laney Member inter-
tongues with the overlying fluvial Bridger Formation.
Figures 2.3-4, 2.3-5, and 2.3-6 show the areal distribution of the
richer oil shale beds of the Green River basin [Culbertson, 1968].
Accompanying histograms indicate the grade of oil shale within
the Tipton, Wilkins Peak, and Laiiey Members of the Green River
Formation.
0 10 20 Tw
10 20 30
Oil yield in gallons per ton——
I
1
1
I
I
1
I
Figure 2.3-4.
Oil Yield of Tipton Shale Member.
Source: Baughman, 1978
2.3.2 Devonian And Mississippian
Until quite recntly there has been only limited research on the
black shales of the East and Midwest because of the emphasis on
the richer and thicker oil shales of the Green River Formation.
The term "black shale" refers to dark (principally black or dark
gray) shale deposits which owe their dark color to their organic
content and which were generally deposited under marine conditions.
38
I
1
I
I
I
I
I
I
I
image:
deposit, in Wyoming. The section of oil shale varies from about
150 to 500 feet in thickness [Roehler, 1973]. The oil shales of
the Laney Member in the Green River basin are not as thick as
those of the Washakie basin. The lacustrine Laney Member inter-
tongues with the overlying fluvial Bridger Formation.
Figures 2.3-4, 2.3-5, and 2.3-6 show the areal distribution of the
richer oil shale beds of the Green River basin [Culbertson, 1968].
Accompanying histograms indicate the grade of oil shale within
the Tipton, Wilkins Peak, and Laiiey Members of the Green River
Formation.
0 10 20 Tw
10 20 30
Oil yield in gallons per ton——
I
1
1
I
I
1
I
Figure 2.3-4.
Oil Yield of Tipton Shale Member.
Source: Baughman, 1978
2.3.2 Devonian And Mississippian
Until quite recntly there has been only limited research on the
black shales of the East and Midwest because of the emphasis on
the richer and thicker oil shales of the Green River Formation.
The term "black shale" refers to dark (principally black or dark
gray) shale deposits which owe their dark color to their organic
content and which were generally deposited under marine conditions.
38
I
1
I
I
I
I
I
I
I
image:
 Oil yield in gallons per ton
Figure 2.3-5. Oil Yield of Wilkins Peak Member.
Source: Baughman, 1978
*T v, +?'2^' 1re£ernred to previously, indicates the areas under
which the black shale of Devonian and Mississippian are known and
inferred to exist. Total land area indicated is nearly 400 000
square miles. The crosshatched areas contain the black shales
area bounded by the dashed line indicates where the location of
the black shales are uncertain or where it is concealed (i p
buried) [Duncan et al., 1965]. I '"
As may be noted, these black shales are widely distributed between
the Rocky Mountains and the Appalachian Mountains, with the prin-
cipal known resources contained in zones five or more; feet thick
and correlatable in Arkansas, Illinois, Indiana, Kentubky, Michi-
gan, Ohio, Oklahoma, Tennessee, and Texas [Conant et al., 1961].
Depending upon the location, various formation names! have been
applied to the black shales of the upper Devonian\ and lower
Mississippian. They include the Chattanooga, Antrim, New Albany,
196 1 Mountain Glen, Woodford, and the Lodgepole [Conant et al.,
Figure 2.2-3 illustrates the depositional conditions existing
during the Devonian and Mississippian. The figure also shows the
different names applied to the "black shales" deposited durina
this time [Conant et al., 1961]. !
39
image:
Oil yield in gallons per ton
Figure 2.3-5. Oil Yield of Wilkins Peak Member.
Source: Baughman, 1978
*T v, +?'2^' 1re£ernred to previously, indicates the areas under
which the black shale of Devonian and Mississippian are known and
inferred to exist. Total land area indicated is nearly 400 000
square miles. The crosshatched areas contain the black shales
area bounded by the dashed line indicates where the location of
the black shales are uncertain or where it is concealed (i p
buried) [Duncan et al., 1965]. I '"
As may be noted, these black shales are widely distributed between
the Rocky Mountains and the Appalachian Mountains, with the prin-
cipal known resources contained in zones five or more; feet thick
and correlatable in Arkansas, Illinois, Indiana, Kentubky, Michi-
gan, Ohio, Oklahoma, Tennessee, and Texas [Conant et al., 1961].
Depending upon the location, various formation names! have been
applied to the black shales of the upper Devonian\ and lower
Mississippian. They include the Chattanooga, Antrim, New Albany,
196 1 Mountain Glen, Woodford, and the Lodgepole [Conant et al.,
Figure 2.2-3 illustrates the depositional conditions existing
during the Devonian and Mississippian. The figure also shows the
different names applied to the "black shales" deposited durina
this time [Conant et al., 1961]. !
39
image:
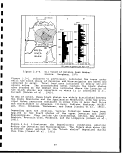 20 MILES
GREEN
RIVER
BASIN
Fo«t
Fwt
300
250 -
200
300
0 10 20 0 10 20 30 40
Oil yield in gallons per ton —
Figure 2.3-6.
Oil Yield of Laney Shale Member.
Source: Baughman, 1978
Basically, the area of deposition was in the Paleozoic Appalachian
Sea, which covered the Appalachian, Ohio, and Michigan basins.
Circulation of marine water carrying abundant mineral organic mat-
ter was enhanced by outlets from the Appalachian Sea via the St.
Lawrence seaway and by a southern opening into the Mexico Mediter-
ranean. Under sediment loading, the basins continued to subside,
and correspondingly more sediments were deposited, compressing and
forcing the black shales deeper into their respective basins.
Such conditions existed until the end of the Paleozoic when the
entire eastern part of the continent was emergent [Conant et al.,
1961]. :
The black shales of the Devonian and Mississippian, in contrast
to the oil shales of the Green River Formation, are true shales
composed dominantly of the micaceous clay illite.
Other important minerals associated with the black shales include
phosphate and uranium minerals, with uranium ranging in concentra-
tion from 0.001 to 0.008 weight percent. These minerals are found
in the Chattanooga formation.
40
I
1
I
I
I
I
I
1
I
I
I
I
I
I
I
I
I
I
I
image:
20 MILES
GREEN
RIVER
BASIN
Fo«t
Fwt
300
250 -
200
300
0 10 20 0 10 20 30 40
Oil yield in gallons per ton —
Figure 2.3-6.
Oil Yield of Laney Shale Member.
Source: Baughman, 1978
Basically, the area of deposition was in the Paleozoic Appalachian
Sea, which covered the Appalachian, Ohio, and Michigan basins.
Circulation of marine water carrying abundant mineral organic mat-
ter was enhanced by outlets from the Appalachian Sea via the St.
Lawrence seaway and by a southern opening into the Mexico Mediter-
ranean. Under sediment loading, the basins continued to subside,
and correspondingly more sediments were deposited, compressing and
forcing the black shales deeper into their respective basins.
Such conditions existed until the end of the Paleozoic when the
entire eastern part of the continent was emergent [Conant et al.,
1961]. :
The black shales of the Devonian and Mississippian, in contrast
to the oil shales of the Green River Formation, are true shales
composed dominantly of the micaceous clay illite.
Other important minerals associated with the black shales include
phosphate and uranium minerals, with uranium ranging in concentra-
tion from 0.001 to 0.008 weight percent. These minerals are found
in the Chattanooga formation.
40
I
1
I
I
I
I
I
1
I
I
I
I
I
I
I
I
I
I
I
image:
 2.4 COMPOSITION
2.4.1 Minerals
The proportions of inorganic and organic minerals in oil shale
vary with the grade of shale. Typical values are shown in
Table 2.4-1 [Stanfield, 1951]. Typical of the minerals present in
Green River oil shale of commercial grade is the listing presented
in Table 2.4-2 [Smith et al., 1978]. ;
TABLE 2.4-1. MINERAL CONTENT OF GREEN RIVER OIL SHALE| VERSUS GRADE
Fischer Assay, gallon oil/ton
Inorganic minerals, wt., %
Organic minerals, wt. , %
Oil Shale
10.5
92.2
7.8
100.0
26.7
84.0
16.0
100.0
3613
so:i
19:9
100.0
57.1
67.0
33.0
100.0
Source: Stanfield, 1951
TABLE 2.4-2. AVERAGE MINERAL COMPOSITION OF MAHOGANY
ZONE SHALE, COLORADO AND UTAH
Composition
,„• weight
Mineral Chemical formula
Dolomite
Calcite
Quartz
Illite
Albite
K feldspar
Pyrite
Analcime
(Mg,Fe)Ca(C03)2
CaC03
Si02
KAl2(AlSi3)Ol0(OH)2
NaAlSi308
KAlSi308
FeS2
NaAlSiO4 • 25H20
TOTAL
32
16
15
1'9
10
6
1
r-
100
Source: Smith et al., 1978 i
The chemical analyses of the inorganic mineral portions; of 16 sam-
ples of Green River oil shale varying in grade from 10.5 to 75.0
gallons per ton were reported [Stanfield, 1951]. The minimum,
maximum, and average values are shown in Table 2L4-3. The
variation of inorganic chemical composition with shale grade is
shown in Table 2.4-4, along with the inorganic chemical
composition of the spent shale.
41
image:
2.4 COMPOSITION
2.4.1 Minerals
The proportions of inorganic and organic minerals in oil shale
vary with the grade of shale. Typical values are shown in
Table 2.4-1 [Stanfield, 1951]. Typical of the minerals present in
Green River oil shale of commercial grade is the listing presented
in Table 2.4-2 [Smith et al., 1978]. ;
TABLE 2.4-1. MINERAL CONTENT OF GREEN RIVER OIL SHALE| VERSUS GRADE
Fischer Assay, gallon oil/ton
Inorganic minerals, wt., %
Organic minerals, wt. , %
Oil Shale
10.5
92.2
7.8
100.0
26.7
84.0
16.0
100.0
3613
so:i
19:9
100.0
57.1
67.0
33.0
100.0
Source: Stanfield, 1951
TABLE 2.4-2. AVERAGE MINERAL COMPOSITION OF MAHOGANY
ZONE SHALE, COLORADO AND UTAH
Composition
,„• weight
Mineral Chemical formula
Dolomite
Calcite
Quartz
Illite
Albite
K feldspar
Pyrite
Analcime
(Mg,Fe)Ca(C03)2
CaC03
Si02
KAl2(AlSi3)Ol0(OH)2
NaAlSi308
KAlSi308
FeS2
NaAlSiO4 • 25H20
TOTAL
32
16
15
1'9
10
6
1
r-
100
Source: Smith et al., 1978 i
The chemical analyses of the inorganic mineral portions; of 16 sam-
ples of Green River oil shale varying in grade from 10.5 to 75.0
gallons per ton were reported [Stanfield, 1951]. The minimum,
maximum, and average values are shown in Table 2L4-3. The
variation of inorganic chemical composition with shale grade is
shown in Table 2.4-4, along with the inorganic chemical
composition of the spent shale.
41
image:
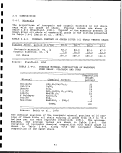 TABLE 2.4-3. FISCHER ASSAY DATA OF THE INORGANIC MINERAL
PORTIONS OF 16 SAMPLES OF GREEN RIVER OIL
SHALE RANGING FROM 10.5 to 75.0 gal/ton
OIL SHALE
Assay data, %
Minimum Maximum Average
Si02
Fe2C>3
A1203
CaO
MgO
S03
Na20 :
K20 I
Sub Total
Mineral C(>2 in raw shale
Mineral C02 in spent shale calculated to
raw shale
Mineral C02 in raw shale that was volatilized
by the assay
9.9
9.7
0.0
40.9
4.3
9.5
21.2
8.7
2.6
2.7
3.4
25.7
25.6
10.2
17.4
17.0
2.3
Source: Stanfield, 1961
Particle size measurements showed that 99.4 percent of the
inorganic constituents of the Green River oil shales are smaller
than 44 microns (325 mesh sieve), about 80 percent are smaller
than 10 microns, and about 10 percent are smaller than 0.5 micron
[Tisot, 1963]. Table 2.3-5 presents the typical mineralogical
composition of Devonian black shale [Bates et al., 1957].
2.4.2 Kerogen
Kerogen is that portion of the organic material in oil shale that
is insoluble in ordinary solvents for petroleum and that, upon the
application of heat, yields gas, oil, bitumen, and organic residue
(mainly fixed carbon). Bitumen, a benzene-soluble material gen-
erally comprises a small part of the total organic matter in oil
shale. The term kerogen is often used, however, to denote the
total organic material in oil shale.
Kerogen appears black in color to the unaided eye. Under the
microscope, thick sections of kerogen appear yellow in color, with
a minor portion appearing brown or black. It has no well defined
structure, appearing as stringers; masses, and irregular granules
all intermixed with the inorganic minerals in the rock.
42
I
I
I
I
I
I
1
1
1
I
I
I
I
I
I
I
I
I
I
image:
TABLE 2.4-3. FISCHER ASSAY DATA OF THE INORGANIC MINERAL
PORTIONS OF 16 SAMPLES OF GREEN RIVER OIL
SHALE RANGING FROM 10.5 to 75.0 gal/ton
OIL SHALE
Assay data, %
Minimum Maximum Average
Si02
Fe2C>3
A1203
CaO
MgO
S03
Na20 :
K20 I
Sub Total
Mineral C(>2 in raw shale
Mineral C02 in spent shale calculated to
raw shale
Mineral C02 in raw shale that was volatilized
by the assay
9.9
9.7
0.0
40.9
4.3
9.5
21.2
8.7
2.6
2.7
3.4
25.7
25.6
10.2
17.4
17.0
2.3
Source: Stanfield, 1961
Particle size measurements showed that 99.4 percent of the
inorganic constituents of the Green River oil shales are smaller
than 44 microns (325 mesh sieve), about 80 percent are smaller
than 10 microns, and about 10 percent are smaller than 0.5 micron
[Tisot, 1963]. Table 2.3-5 presents the typical mineralogical
composition of Devonian black shale [Bates et al., 1957].
2.4.2 Kerogen
Kerogen is that portion of the organic material in oil shale that
is insoluble in ordinary solvents for petroleum and that, upon the
application of heat, yields gas, oil, bitumen, and organic residue
(mainly fixed carbon). Bitumen, a benzene-soluble material gen-
erally comprises a small part of the total organic matter in oil
shale. The term kerogen is often used, however, to denote the
total organic material in oil shale.
Kerogen appears black in color to the unaided eye. Under the
microscope, thick sections of kerogen appear yellow in color, with
a minor portion appearing brown or black. It has no well defined
structure, appearing as stringers; masses, and irregular granules
all intermixed with the inorganic minerals in the rock.
42
I
I
I
I
I
I
1
1
1
I
I
I
I
I
I
I
I
I
I
image:
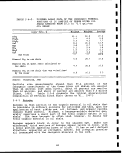 I
I
I
I
I
I
I
I
I
I
I
I
I
I
I
I
I
I
I
TABLE 2.4-4. CHEMICAL COMPOSITION OF THE INORGANIC PORTION OF
VARIOUS GRADES OF GREEN RIVER OIL SHALE AND OF
THE SPENT SHALE PRODUCTS !
Chemical
constituent
Raw shale
Si02, percent
Fe203
A1203
CaO
MgO
S03
Na20
K20
Spent shale
Si02
Fe203
A1203
CaO
MgO
Very low-
grade shale
(10.5 gal/ ton)
40.9
4.3
9.4
11.0
5.4
0.1
1.8
3.4
53.27
5.64
12.28
14.82
7.00
Medium
grade shale
(26.7 gal/ ton)
26.1
2.6
6.5
17.5
5.3
0.6
2.6
1.0
41.90
4.10
10.53
28.11
8.53
High-grade
shale
(36.3 gal/ ton)
25.5
2.9
6.3
14.2
5.6
1.2
2.7
1.9
42.36
4.74
10.46
23.54
9.30
• Very high-
i grade shale
(61.8 qal/ton)
'• 26.4
3.1
! 7.0
' 8.3
4.5
! 1.4
i
1.9
: 1.0
49.19
5.87
; 13.13
• 15.40
i 8.35
Source;: Stanfield, 1961
TABLE 2.4-5. TYPICAL MINERALOGICAL COMPOSITION
OF DEVONIAN BLACK SHALE
Mineral
Composition
weight
percent
Quartz
Feldspar
Illite + minor kaolinite and
muscovite
Carbon
Total organic matter
Pyrite and marcasite
Chlorite
Iron oxides
Tourmaline, zircon, and apatite
22
9 :
i
31 ;
13.6
16 - 22
11
2
2
i ;
Source: Bates et al., 1957
43
image:
I
I
I
I
I
I
I
I
I
I
I
I
I
I
I
I
I
I
I
TABLE 2.4-4. CHEMICAL COMPOSITION OF THE INORGANIC PORTION OF
VARIOUS GRADES OF GREEN RIVER OIL SHALE AND OF
THE SPENT SHALE PRODUCTS !
Chemical
constituent
Raw shale
Si02, percent
Fe203
A1203
CaO
MgO
S03
Na20
K20
Spent shale
Si02
Fe203
A1203
CaO
MgO
Very low-
grade shale
(10.5 gal/ ton)
40.9
4.3
9.4
11.0
5.4
0.1
1.8
3.4
53.27
5.64
12.28
14.82
7.00
Medium
grade shale
(26.7 gal/ ton)
26.1
2.6
6.5
17.5
5.3
0.6
2.6
1.0
41.90
4.10
10.53
28.11
8.53
High-grade
shale
(36.3 gal/ ton)
25.5
2.9
6.3
14.2
5.6
1.2
2.7
1.9
42.36
4.74
10.46
23.54
9.30
• Very high-
i grade shale
(61.8 qal/ton)
'• 26.4
3.1
! 7.0
' 8.3
4.5
! 1.4
i
1.9
: 1.0
49.19
5.87
; 13.13
• 15.40
i 8.35
Source;: Stanfield, 1961
TABLE 2.4-5. TYPICAL MINERALOGICAL COMPOSITION
OF DEVONIAN BLACK SHALE
Mineral
Composition
weight
percent
Quartz
Feldspar
Illite + minor kaolinite and
muscovite
Carbon
Total organic matter
Pyrite and marcasite
Chlorite
Iron oxides
Tourmaline, zircon, and apatite
22
9 :
i
31 ;
13.6
16 - 22
11
2
2
i ;
Source: Bates et al., 1957
43
image:
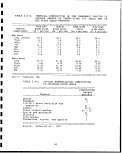 The organic matter content of oil shale increases with the grade
of shale. Reported values are plotted on Figure 2.4-1 to show the
range in organic content of shales varying from 10 to 75 gallons
per ton in grade, as determined by the Modified Fischer Assay.
DATA SOURCES •
• USBM R I No 4825
o USBM I C. No 62!6
x USBM R I No 4744
SHALE GRADE, GAL. OIL/TON
(PER MODIFIED 'FISCHER ASSAY)
I
1
I
I
1
1
I
Figure 2.4-1.
Organic matter content of Green River Oil Shales.
Source: Baughman, j 1978
44
1
I
I
I
I
I
I
I
I
image:
The organic matter content of oil shale increases with the grade
of shale. Reported values are plotted on Figure 2.4-1 to show the
range in organic content of shales varying from 10 to 75 gallons
per ton in grade, as determined by the Modified Fischer Assay.
DATA SOURCES •
• USBM R I No 4825
o USBM I C. No 62!6
x USBM R I No 4744
SHALE GRADE, GAL. OIL/TON
(PER MODIFIED 'FISCHER ASSAY)
I
1
I
I
1
1
I
Figure 2.4-1.
Organic matter content of Green River Oil Shales.
Source: Baughman, j 1978
44
1
I
I
I
I
I
I
I
I
image:
 2•4,2.1 Composition of Keroqen
Ultimate
The ultimate composition of the organic material in ten samples of
™e£V°f Mahogany zone oil shale from Colorado and Utah have been
s§r?k^ CSAlth/ 19613*>T£f similaritY among the compositions'was
Srf11?11!?' t average of the ultimate compositions of the samples
was taken to represent the typical composition of : the organic
matter of Mahogany zone oil shales of the Green River Formation?
This average composition is shown in Table 2.4-6. ; "»i.J.on.
TABLE 2.4-6. PROBABLE COMPOSITION OF MAHOGANY-ZONE ORGANIC MATTER
Component
Average amount of
component, wt. %
of organic matter
Carbon
Hydrogen
Nitrogen
Sulfur
Oxygen
C/H ratio
80.52
10.30
2.39
1.04
5.75
1.42
Source: Smith, 1961
WaS P.er.formed °n New Albany shale
-. . — -. —.. -.—,«.**_^ WAA^-U^ |_oinxL.ii 3.HQ
composition determined from this investigation
-L dXy «LC ^ • ~t"~ / »
TABLE 2.4-7.
ELEMENTAL COMPOSITION OF NEW ALBANY
SHALE ORGANIC MATTER
Component
Average
(weight % organic matter)
Carbon
Hydrogen
Nitrogen
Sulfur
Oxygen
82.0
7.4
2.3
2.0
6.3
Source: Smith and Young, 1967
45
image:
2•4,2.1 Composition of Keroqen
Ultimate
The ultimate composition of the organic material in ten samples of
™e£V°f Mahogany zone oil shale from Colorado and Utah have been
s§r?k^ CSAlth/ 19613*>T£f similaritY among the compositions'was
Srf11?11!?' t average of the ultimate compositions of the samples
was taken to represent the typical composition of : the organic
matter of Mahogany zone oil shales of the Green River Formation?
This average composition is shown in Table 2.4-6. ; "»i.J.on.
TABLE 2.4-6. PROBABLE COMPOSITION OF MAHOGANY-ZONE ORGANIC MATTER
Component
Average amount of
component, wt. %
of organic matter
Carbon
Hydrogen
Nitrogen
Sulfur
Oxygen
C/H ratio
80.52
10.30
2.39
1.04
5.75
1.42
Source: Smith, 1961
WaS P.er.formed °n New Albany shale
-. . — -. —.. -.—,«.**_^ WAA^-U^ |_oinxL.ii 3.HQ
composition determined from this investigation
-L dXy «LC ^ • ~t"~ / »
TABLE 2.4-7.
ELEMENTAL COMPOSITION OF NEW ALBANY
SHALE ORGANIC MATTER
Component
Average
(weight % organic matter)
Carbon
Hydrogen
Nitrogen
Sulfur
Oxygen
82.0
7.4
2.3
2.0
6.3
Source: Smith and Young, 1967
45
image:
 1
Carbon-hydrogen Ratio Comparisons •
The approximate ratio of carbon to hydrogen (C/H) in the organic «
matter from both Green River and New Albany oil shale is compared g)
to the C/H ratio of various other organic materials in Table
2.4-8. «
TABLE 2.4-8. APPROXIMATE CARBON/HYDROGEN RATIOS •
IN VARIOUS ORGANIC MATERIALS
Material C/H ratio
I
Conventional petroleum
Athabasca bitumen
Green River Kerogen ,
New Albany Organic Matter
Gilsonite
Lignitic coal
Low volatile bituminous
coal
Anthracitic coal
6.2 - 7
7.5
7.8
11.1
8.3
12.1
19.4
35.1
.5
I
I
Source: Baughman, 1978 H
Particle Bonding ; «
Tests on surface area led to the! conclusion that perhaps only a •
small amount of the organic matter is either directly or
chemically bonded to the inorganic mineral constituents. Green •
River Formation kerogen can be found either partly or entirely 11
encasing the inorganic mineral constituents of oil shale [Tisot,
1963]. Despite this conclusion^ bonding between kerogen and m
inorganic matter is such that kerogen has never been isolated in ]|
pure form by either mechanical or chemical separatory processes.
Chemical Formula H
Based on the' elemental analysis of kerogen from Green River oil
shale the following empirical formula was developed for the •
material: C6H9 8N0 18S0.o400.56 fstanfield, 1951]. This formula fl
is in substantial agreement , with that reported later:
CoisHasoOiaNsS [Vanderborgh, 1974]. The latter formula indicates «
a molecular weight of approximately 3200. It should be noted that |
these formulas are based only on the elemental analysis of
samples, and they are not necessarily applicable for use in
generallized correlations relating molecular weight to thermal or •
physical properties. H
1
I
46
I
image:
1
Carbon-hydrogen Ratio Comparisons •
The approximate ratio of carbon to hydrogen (C/H) in the organic «
matter from both Green River and New Albany oil shale is compared g)
to the C/H ratio of various other organic materials in Table
2.4-8. «
TABLE 2.4-8. APPROXIMATE CARBON/HYDROGEN RATIOS •
IN VARIOUS ORGANIC MATERIALS
Material C/H ratio
I
Conventional petroleum
Athabasca bitumen
Green River Kerogen ,
New Albany Organic Matter
Gilsonite
Lignitic coal
Low volatile bituminous
coal
Anthracitic coal
6.2 - 7
7.5
7.8
11.1
8.3
12.1
19.4
35.1
.5
I
I
Source: Baughman, 1978 H
Particle Bonding ; «
Tests on surface area led to the! conclusion that perhaps only a •
small amount of the organic matter is either directly or
chemically bonded to the inorganic mineral constituents. Green •
River Formation kerogen can be found either partly or entirely 11
encasing the inorganic mineral constituents of oil shale [Tisot,
1963]. Despite this conclusion^ bonding between kerogen and m
inorganic matter is such that kerogen has never been isolated in ]|
pure form by either mechanical or chemical separatory processes.
Chemical Formula H
Based on the' elemental analysis of kerogen from Green River oil
shale the following empirical formula was developed for the •
material: C6H9 8N0 18S0.o400.56 fstanfield, 1951]. This formula fl
is in substantial agreement , with that reported later:
CoisHasoOiaNsS [Vanderborgh, 1974]. The latter formula indicates «
a molecular weight of approximately 3200. It should be noted that |
these formulas are based only on the elemental analysis of
samples, and they are not necessarily applicable for use in
generallized correlations relating molecular weight to thermal or •
physical properties. H
1
I
46
I
image:
 2-4.2.2 Specific Gravity
2.4.3 Saline Minerals i
i
The Tertiary-age sedimentary Green River Formation oil shal<=
very complex material. In addition to its orglnic matte? con
of
in addition to
5
and
e
mineral and
•
°f 4°° tO 35°° fee
in a 1400 uare mile area
Another 36 billion tons of mixed trona and halite are
r^o1/ ASdS °f
part of the area. Occurrences of the mineral
^
Eie Nation"
47
image:
2-4.2.2 Specific Gravity
2.4.3 Saline Minerals i
i
The Tertiary-age sedimentary Green River Formation oil shal<=
very complex material. In addition to its orglnic matte? con
of
in addition to
5
and
e
mineral and
•
°f 4°° tO 35°° fee
in a 1400 uare mile area
Another 36 billion tons of mixed trona and halite are
r^o1/ ASdS °f
part of the area. Occurrences of the mineral
^
Eie Nation"
47
image:
 TABLE 2.4-9.
Mineral name
Carbonates
Trona
Eitelite b
Dawsonite ^
Burbankite
Shortite3 ,
Pirssonite
Gaylussite
Norsethite
(New Unnamed)
Nahcolite
Thermonatrite
Carb ona t e-pho sphate s
Bradleyite
Carbonate-chlorides
Northupite
Silicates
Albite
Analcite
Sepiolite
Loughlinite .
Labuntsovite
Acmite ,
Elpidite
Magnesioriebeckite
(crocidolite), etc.
Feldspar
Borosilicates
Re e dme r gne r i te
Searlesite
Leucosphenite
Halides
Neighborite
Cryolite
Halite
AUTHIGENIC SODIUM MINERALS IN
THE GREEN RIVER FORMATION
Chemical formula
Na2C03-NaHC03-2H20
Na2Mg(C03)2
Na3Al(C03)3-2Al(OH)3
Na2(Ca, Si, Ba, Ca)4(C03)s
Na2Ca2(C03)'3
Na2Ca(C03)2-2H20
Na2Ca(C03)2-5H20
BaMg(C03)2 (Check formula, no sodium shown)
3NaHC03 -Na2C03
NaHC03 ;
Na2C03-H20
Na3P04»MgC03
Na2C03«MgC03-NaCl
NaAlSi308
NaAlSi206-H20
H6Mg8Si1203o(OH)1o-8H20 (Check formula, no
sodium shown)
Na2Mg3Si6Ol6-8H20
(K, Ba, Na, Ca, Mn) (Ti, Nb) (Si, Al)2(0, OH)7H20
Na20'Fe203;4Si02
Na2ZrSi60!5*3H20
Na2(Mg, Fe}3(Fe, Al)2Si8022(OH)2
Variable composition
NaBSi308
NaBSi206-H20
CaBaNa3BTi3Si9029
NaMgF3
Na3AlF6
NaCl
aUnique to Green River Formation
Known elsewhere only in
Source: Jaffe, 1962
igneous or metamorphic rocks.
48 '
l]
1
1"
1
I
•
1
EJD
1
1
1
1
image:
TABLE 2.4-9.
Mineral name
Carbonates
Trona
Eitelite b
Dawsonite ^
Burbankite
Shortite3 ,
Pirssonite
Gaylussite
Norsethite
(New Unnamed)
Nahcolite
Thermonatrite
Carb ona t e-pho sphate s
Bradleyite
Carbonate-chlorides
Northupite
Silicates
Albite
Analcite
Sepiolite
Loughlinite .
Labuntsovite
Acmite ,
Elpidite
Magnesioriebeckite
(crocidolite), etc.
Feldspar
Borosilicates
Re e dme r gne r i te
Searlesite
Leucosphenite
Halides
Neighborite
Cryolite
Halite
AUTHIGENIC SODIUM MINERALS IN
THE GREEN RIVER FORMATION
Chemical formula
Na2C03-NaHC03-2H20
Na2Mg(C03)2
Na3Al(C03)3-2Al(OH)3
Na2(Ca, Si, Ba, Ca)4(C03)s
Na2Ca2(C03)'3
Na2Ca(C03)2-2H20
Na2Ca(C03)2-5H20
BaMg(C03)2 (Check formula, no sodium shown)
3NaHC03 -Na2C03
NaHC03 ;
Na2C03-H20
Na3P04»MgC03
Na2C03«MgC03-NaCl
NaAlSi308
NaAlSi206-H20
H6Mg8Si1203o(OH)1o-8H20 (Check formula, no
sodium shown)
Na2Mg3Si6Ol6-8H20
(K, Ba, Na, Ca, Mn) (Ti, Nb) (Si, Al)2(0, OH)7H20
Na20'Fe203;4Si02
Na2ZrSi60!5*3H20
Na2(Mg, Fe}3(Fe, Al)2Si8022(OH)2
Variable composition
NaBSi308
NaBSi206-H20
CaBaNa3BTi3Si9029
NaMgF3
Na3AlF6
NaCl
aUnique to Green River Formation
Known elsewhere only in
Source: Jaffe, 1962
igneous or metamorphic rocks.
48 '
l]
1
1"
1
I
•
1
EJD
1
1
1
1
image:
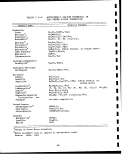 Organic acids of high molecular weight have been found in
dark-colored trona mineral brines from wells drilled in the
Eden-Farson area, approximately 40 miles north of Rock Springs
Wyoming. Both the dissolved trona and the dissolved organic
matter are contained in the Green River Formation.
Nahcolite occurrences are common in Colorado and Utah oil shales
but are not noted in Wyoming shales. In Colorado's Piceance Creek
/™Si™ bedded ^posits of the water soluble sodium salt nahcolite
(NaHC03) were discovered from examination of core samples drilled
in.1964 on Marathon Oil Company property in the north^central por-
tion of the basin. Subsequent drilling disclosed three principal
bedded units of nahcolite which occur at depth in a thickness from
°ne t? nine feet. Nahcolite in disseminated form has 'even greater
distribution. Reserves of approximately 130 million tons of
?SS? per s<Juare mile nave faeen estimated. [Kite et al.
19 6 / j . ;
The potential exists for recovery of nahcolite from oil shale
formations by in situ leaching, by leaching from mined and crushed
oil shale, or by mining directly from bedded deposits.;
Nahcolite may find commercial markets as a chemical reactant which
removes sulfur dioxide from stack gas streams, particularly those
streams associated with coal-fueled electric power generating
plants An obvious market for nahcolite is as the raw material
from which commercial-grade soda ash may be produced. A minor
market may be for household use as high-purity sodium bicarbonate.
The mineral dawsonite, a sodium-aluminum carbonate, was noted to
occur in great quantities in Colorado oil shale [Smith, 19631
Dawsonite occurrences show great vertical and areal distribution
in the northern (deeper) portions of the Piceance Creek basin, the
zone ranging from 900 feet to 1900 feet below the surface. In
place reserves of 42 million tons of alumina (recoverable from the
mineral dawsonite) per square mile in the area of the Juhan
corehole have been reported [Kite, 1967]. i
i
With proper heat treatment, avoiding temperatures high enough to
promote chemical reaction between silicon dioxide and alumina
(A120S), dawsonite can be converted to sodium aluminate. In this
form, alumina can be extracted from the spent shale waste by
leaching with water or with dilute soda carbonate brine. Alumina
may then be precipitated from the leachate. This method of ob-
taining alumina is attractive when compared with the imore costly
conventional method known as the Bayer process. ;
2.4.4 Sulfur and Nitrogen !
Table 2.4-10 presents the distribution of sulfur and Initrogen in
samples of mineable Colorado oil shale from the Mahogany zone
[Stanfield, 1951]. Additional data on the distribution of sulfur
49
image:
Organic acids of high molecular weight have been found in
dark-colored trona mineral brines from wells drilled in the
Eden-Farson area, approximately 40 miles north of Rock Springs
Wyoming. Both the dissolved trona and the dissolved organic
matter are contained in the Green River Formation.
Nahcolite occurrences are common in Colorado and Utah oil shales
but are not noted in Wyoming shales. In Colorado's Piceance Creek
/™Si™ bedded ^posits of the water soluble sodium salt nahcolite
(NaHC03) were discovered from examination of core samples drilled
in.1964 on Marathon Oil Company property in the north^central por-
tion of the basin. Subsequent drilling disclosed three principal
bedded units of nahcolite which occur at depth in a thickness from
°ne t? nine feet. Nahcolite in disseminated form has 'even greater
distribution. Reserves of approximately 130 million tons of
?SS? per s<Juare mile nave faeen estimated. [Kite et al.
19 6 / j . ;
The potential exists for recovery of nahcolite from oil shale
formations by in situ leaching, by leaching from mined and crushed
oil shale, or by mining directly from bedded deposits.;
Nahcolite may find commercial markets as a chemical reactant which
removes sulfur dioxide from stack gas streams, particularly those
streams associated with coal-fueled electric power generating
plants An obvious market for nahcolite is as the raw material
from which commercial-grade soda ash may be produced. A minor
market may be for household use as high-purity sodium bicarbonate.
The mineral dawsonite, a sodium-aluminum carbonate, was noted to
occur in great quantities in Colorado oil shale [Smith, 19631
Dawsonite occurrences show great vertical and areal distribution
in the northern (deeper) portions of the Piceance Creek basin, the
zone ranging from 900 feet to 1900 feet below the surface. In
place reserves of 42 million tons of alumina (recoverable from the
mineral dawsonite) per square mile in the area of the Juhan
corehole have been reported [Kite, 1967]. i
i
With proper heat treatment, avoiding temperatures high enough to
promote chemical reaction between silicon dioxide and alumina
(A120S), dawsonite can be converted to sodium aluminate. In this
form, alumina can be extracted from the spent shale waste by
leaching with water or with dilute soda carbonate brine. Alumina
may then be precipitated from the leachate. This method of ob-
taining alumina is attractive when compared with the imore costly
conventional method known as the Bayer process. ;
2.4.4 Sulfur and Nitrogen !
Table 2.4-10 presents the distribution of sulfur and Initrogen in
samples of mineable Colorado oil shale from the Mahogany zone
[Stanfield, 1951]. Additional data on the distribution of sulfur
49
image:
 TABLE 2.4-10. AVERAGE DISTRIBUTION OF SULFUR AND NITROGEN IN
OIL SHALE
Weight
percent
Remarks
Type of sulfur compound ;
Sulfide sulfur 67
Organic sulfur 33
Sulfate sulfur Trace
Type of nitrogen compound
Organic 100
As pyrite and marcasite,
FeS2
As CaS04, FeS04 and MgS04
No inorganic nitrogen found
Source: Stanfield, 1951
in various grades of oil shale were reported in the Annual Report
of the Secretary of the Interior' for 1949, Part II. These data
appear in Table 2.4-11.
TABLE 2.4-11.
DISTRIBUTION OF SULFUR AND NITROGEN IN COLORADO
OIL SHALE
Oil yield of shale,
gallons per ton
Total sulfur,
weight' percent
Total nitrogen,
weight percent
10.5
26.7
36.3
57.1
61.8
75.0
0.62
0;.56
0.73
1.96
1.99
1>86
0.28
0.54
0.44
0.66
Annual Report of the Seceretary of the Interior: Part II,
1949
2.4.5 Moisture
There is no consistent relationship between field moisture of oil
shale and oil yield from shale. Typical values for field moisture
varied from 0.38 to 2.93 percent [Stanfield, 1951].
A method for determining the moisture content of oil shale is pre-
sented in U.S. Bureau of Mines Report of Investigations No. 4477,
which deals with the modified Fischer Assay method.
I
1
I
I
I
1
I
I
I
1
1
1
I
50
I
I
I
I
I
image:
TABLE 2.4-10. AVERAGE DISTRIBUTION OF SULFUR AND NITROGEN IN
OIL SHALE
Weight
percent
Remarks
Type of sulfur compound ;
Sulfide sulfur 67
Organic sulfur 33
Sulfate sulfur Trace
Type of nitrogen compound
Organic 100
As pyrite and marcasite,
FeS2
As CaS04, FeS04 and MgS04
No inorganic nitrogen found
Source: Stanfield, 1951
in various grades of oil shale were reported in the Annual Report
of the Secretary of the Interior' for 1949, Part II. These data
appear in Table 2.4-11.
TABLE 2.4-11.
DISTRIBUTION OF SULFUR AND NITROGEN IN COLORADO
OIL SHALE
Oil yield of shale,
gallons per ton
Total sulfur,
weight' percent
Total nitrogen,
weight percent
10.5
26.7
36.3
57.1
61.8
75.0
0.62
0;.56
0.73
1.96
1.99
1>86
0.28
0.54
0.44
0.66
Annual Report of the Seceretary of the Interior: Part II,
1949
2.4.5 Moisture
There is no consistent relationship between field moisture of oil
shale and oil yield from shale. Typical values for field moisture
varied from 0.38 to 2.93 percent [Stanfield, 1951].
A method for determining the moisture content of oil shale is pre-
sented in U.S. Bureau of Mines Report of Investigations No. 4477,
which deals with the modified Fischer Assay method.
I
1
I
I
I
1
I
I
I
1
1
1
I
50
I
I
I
I
I
image:
 2-4.6 Trace Elements
are
A fi <?e^Ctied tra°f elements in raw oil shale are shown
' C Poulson' et al.f 1975]. Also shown -in the table
mean values of the trace element contents
Res_earch Institute, 1977]. Gold assays were also made on
J?°Je samPles representing the Mahogany , ledge. The
°f °'00°56 °UnC per Ion
TABLE 2.4-12. LEVELS OF TRACE ELEMENTS IN GREEN RIVER OIL SHALE
Element
Be
Hg
Cd
Sb
Se
Mo
Ni
Pb
As
Cr
Cu
Zr
B
Zn
V
Mn
F
Concentration as
by Poulson,
Mahogany
zone
2
0.5
0.1
0.4
3.0
15
300
3
30
400
45
30
80
15
100
250
2000
reported
ppm
Saline
zone
1
-
0.4
3
1.5
30
85
15
20
100
30
50
50
30
80
250
1000
Concentration as
reported by DRI,
ppm
0.4
1
1
:i.s
10
25
20
35
34
i
37
40
65
70
100
250
1000
Source: Poulson et al., 1975 and Denver Research Institute, 1977
51
image:
2-4.6 Trace Elements
are
A fi <?e^Ctied tra°f elements in raw oil shale are shown
' C Poulson' et al.f 1975]. Also shown -in the table
mean values of the trace element contents
Res_earch Institute, 1977]. Gold assays were also made on
J?°Je samPles representing the Mahogany , ledge. The
°f °'00°56 °UnC per Ion
TABLE 2.4-12. LEVELS OF TRACE ELEMENTS IN GREEN RIVER OIL SHALE
Element
Be
Hg
Cd
Sb
Se
Mo
Ni
Pb
As
Cr
Cu
Zr
B
Zn
V
Mn
F
Concentration as
by Poulson,
Mahogany
zone
2
0.5
0.1
0.4
3.0
15
300
3
30
400
45
30
80
15
100
250
2000
reported
ppm
Saline
zone
1
-
0.4
3
1.5
30
85
15
20
100
30
50
50
30
80
250
1000
Concentration as
reported by DRI,
ppm
0.4
1
1
:i.s
10
25
20
35
34
i
37
40
65
70
100
250
1000
Source: Poulson et al., 1975 and Denver Research Institute, 1977
51
image:
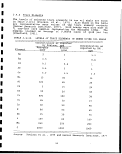 1
1
Recent studies have confirmed the magnitude of the mercury content •
shown in Table 2.4-13L [Donnell, 1977]. Using flameless atomic ab-
sorption, an oil shale sample, which had previously been found to M
contain 4.0 ppm mercury, (USGS in 1959) was found to actually con- (}
tain 0.35 ppm. Additional samples were tested an no relationship
between oil content and mercury was apparent. It has been shown -g
that the majority of the mercury present in oil shale ends up in ||
the gaseous Fischer Assay products.
2.5 PHYSICAL PROPERTIES I
2.5.1 Visual Features
The visual features of six specimens of Green River oil shale, Q
selected so as to range in grade: from 10 gallons per ton to 75
gallons per ton, are presented as Table 2.5-1 [Stanfield, 1951]. ft
Shale of most interest would assay in the 15 to 30 gallon per ton |
range.
The color of fragments of Green River oil shale varies with the •
richness or organic content of the material. Rich shale appears 0
dark in color due to the relative abundance of dark-colored
organic matter (kerogen) present. The inorganic materials pre- .
sent, such as clays, carbonates, iand silica, are generally light g
colored. Some rich shale is also light brown in color.
Easily visible in Green River oil shale are repetitive thin lami- •
nations, called varves. Each varve consists of thin bands, one »
light and one dark in color. These are minute seasonal pairs of
lamina which average between 20 and 30 microns in thickness, a m
micron representing 1/1000 of a millimeter. The mineral dolomite g
predominates in the layer made darker in color by higher organic
matter content. The mode of formation of the varves has been ™
described [Smith, 1968]. In overall effect, the varves present a •
woodgrained effect, a feature which probably has a bearing on the *-
naming of a persistently rich zone of oil shale as the "Mahogany"
I
zone .
The Green River oil shale often separates along bedding planes to
form slab-like fragments. When broken across bedding planes, the «
fracture is generally conchoidal. The laminated structure of oil g
shale has an important effect on measured physical properties of
the rock, depending upon whether the direction of the examination
is parallel with or perpendicular to the laminations. Lean shale •
has relatively uniform properties ;in both directions. m
2.5.2 Specific Gravity tt
There exists a relationship between the organic (kerogen) content
of oil shale and the specific gravity of oil shale. Since the or- .
ganic component of oil shale has , a specific gravity of about 1.1 g
I
52
I
image:
1
1
Recent studies have confirmed the magnitude of the mercury content •
shown in Table 2.4-13L [Donnell, 1977]. Using flameless atomic ab-
sorption, an oil shale sample, which had previously been found to M
contain 4.0 ppm mercury, (USGS in 1959) was found to actually con- (}
tain 0.35 ppm. Additional samples were tested an no relationship
between oil content and mercury was apparent. It has been shown -g
that the majority of the mercury present in oil shale ends up in ||
the gaseous Fischer Assay products.
2.5 PHYSICAL PROPERTIES I
2.5.1 Visual Features
The visual features of six specimens of Green River oil shale, Q
selected so as to range in grade: from 10 gallons per ton to 75
gallons per ton, are presented as Table 2.5-1 [Stanfield, 1951]. ft
Shale of most interest would assay in the 15 to 30 gallon per ton |
range.
The color of fragments of Green River oil shale varies with the •
richness or organic content of the material. Rich shale appears 0
dark in color due to the relative abundance of dark-colored
organic matter (kerogen) present. The inorganic materials pre- .
sent, such as clays, carbonates, iand silica, are generally light g
colored. Some rich shale is also light brown in color.
Easily visible in Green River oil shale are repetitive thin lami- •
nations, called varves. Each varve consists of thin bands, one »
light and one dark in color. These are minute seasonal pairs of
lamina which average between 20 and 30 microns in thickness, a m
micron representing 1/1000 of a millimeter. The mineral dolomite g
predominates in the layer made darker in color by higher organic
matter content. The mode of formation of the varves has been ™
described [Smith, 1968]. In overall effect, the varves present a •
woodgrained effect, a feature which probably has a bearing on the *-
naming of a persistently rich zone of oil shale as the "Mahogany"
I
zone .
The Green River oil shale often separates along bedding planes to
form slab-like fragments. When broken across bedding planes, the «
fracture is generally conchoidal. The laminated structure of oil g
shale has an important effect on measured physical properties of
the rock, depending upon whether the direction of the examination
is parallel with or perpendicular to the laminations. Lean shale •
has relatively uniform properties ;in both directions. m
2.5.2 Specific Gravity tt
There exists a relationship between the organic (kerogen) content
of oil shale and the specific gravity of oil shale. Since the or- .
ganic component of oil shale has , a specific gravity of about 1.1 g
I
52
I
image:
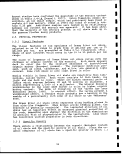 W
Ss
tO
rH
O
OS
J>
IH
PS
o
o
CO
W
£Zk
1
tj
t>
CO
rH
rH
in
'CN
IM
«
in
C <L>
C
•r-
4-
•r-
tf
C
g
c
CJ
i—
r-
1
O
Visible
qrains
Observed
structure
W
G
WH o
O -H
o> n3
H S
rH
<4-l 0)
O W
0) 4->
H£
S-i
o
tH
O
U
^
•S
03 C!
S-i O
0»4->
<U rH
rH nS
a tr
e
m
en
> (3
0
1 4-J
•s
c
4 (0
W
*^3 CT^
c a
03 -H
O^
rH 03
fl5 ii _Q
en
a>
|
anded with
dolomitic
sandstone
03
S
-H
Jxt
•H
-•3
-H
O
X!
g
O
O
g
?
o
XI
to
03
O
in
o
tH
*§
<0
<u cu
rH G
03 O
X! 4J
to to
C to
03
in
to
0)
03
03 rH
U MH
•H
TJ
8-8
U O rH <U
•H 4J O (8
-•s « ** 3 .g
SS'S^S
rH (O O3 W rH
O
Q
0)
•H
O
4-)
(U
rH 03
0> £
rH -H
(0 fo
i-. rH
nj
OH
C
XI
1
03
r-
VD
CJ
V
iH
(C
X!
to
G
en
Analcite
longated
concretions
w
0)
•iH
0
4-1
O)
rH 03
0) C
rH -H
(0 fO
lj rH
«
PH
0
O
XI
03
Q
OO
VO
(D
rH
5
10
1
•H
e
5
Calcite
Dncretions
and loop
bedding
u
OJ
-H
O
4-1
<V
rH 03
(U C
rH -H
rH S
(rj (C
l-l rH
03
04
T3
e
03
fO
0
^ fc-i
fe*
Q
rH
r-
10
0)
rH
OS
X!
U
1
•H
- &
(U
|
n<
§
G a
03 -H
4-1 0)
03 f*!
PM
S
-H
O
4->
0)
rH 03
0) G
rH -H
03 03
i-l rH
05
PH
T)
03
03
^^ S
•Q
*§*
Q
00
rH
VO
(U
03
X!
O
•H
i=>
Calcite
P4
O
rH
03 -H
T3
4-1 <U
rH ^
AH
•s
-H
tLl
O
4-1
0)
i — I tO
<U G
rH -H
O3 03
!M rH
03
PH
03 G
T3 S
•H
0
in
1
i
i
[
i
I
i
I
I
;
uv
en
tH,
•a";
•HI
•H;
<4H
SI
4-* :
cn ;
1
o !
JM
3 ;
O
1 en
53
image:
W
Ss
tO
rH
O
OS
J>
IH
PS
o
o
CO
W
£Zk
1
tj
t>
CO
rH
rH
in
'CN
IM
«
in
C <L>
C
•r-
4-
•r-
tf
C
g
c
CJ
i—
r-
1
O
Visible
qrains
Observed
structure
W
G
WH o
O -H
o> n3
H S
rH
<4-l 0)
O W
0) 4->
H£
S-i
o
tH
O
U
^
•S
03 C!
S-i O
0»4->
<U rH
rH nS
a tr
e
m
en
> (3
0
1 4-J
•s
c
4 (0
W
*^3 CT^
c a
03 -H
O^
rH 03
fl5 ii _Q
en
a>
|
anded with
dolomitic
sandstone
03
S
-H
Jxt
•H
-•3
-H
O
X!
g
O
O
g
?
o
XI
to
03
O
in
o
tH
*§
<0
<u cu
rH G
03 O
X! 4J
to to
C to
03
in
to
0)
03
03 rH
U MH
•H
TJ
8-8
U O rH <U
•H 4J O (8
-•s « ** 3 .g
SS'S^S
rH (O O3 W rH
O
Q
0)
•H
O
4-)
(U
rH 03
0> £
rH -H
(0 fo
i-. rH
nj
OH
C
XI
1
03
r-
VD
CJ
V
iH
(C
X!
to
G
en
Analcite
longated
concretions
w
0)
•iH
0
4-1
O)
rH 03
0) C
rH -H
(0 fO
lj rH
«
PH
0
O
XI
03
Q
OO
VO
(D
rH
5
10
1
•H
e
5
Calcite
Dncretions
and loop
bedding
u
OJ
-H
O
4-1
<V
rH 03
(U C
rH -H
rH S
(rj (C
l-l rH
03
04
T3
e
03
fO
0
^ fc-i
fe*
Q
rH
r-
10
0)
rH
OS
X!
U
1
•H
- &
(U
|
n<
§
G a
03 -H
4-1 0)
03 f*!
PM
S
-H
O
4->
0)
rH 03
0) G
rH -H
03 03
i-l rH
05
PH
T)
03
03
^^ S
•Q
*§*
Q
00
rH
VO
(U
03
X!
O
•H
i=>
Calcite
P4
O
rH
03 -H
T3
4-1 <U
rH ^
AH
•s
-H
tLl
O
4-1
0)
i — I tO
<U G
rH -H
O3 03
!M rH
03
PH
03 G
T3 S
•H
0
in
1
i
i
[
i
I
i
I
I
;
uv
en
tH,
•a";
•HI
•H;
<4H
SI
4-* :
cn ;
1
o !
JM
3 ;
O
1 en
53
image:
 and since the mineral components of oil shale have specific grav-
ities ranging from 2.2 (for anaicime) to 5.0 (for pyrite), an
increase in the organic content of an oil shale causes a decrease
in specific gravity of the oil shale.
The graph presented as Figure 2.5-1 displays average values for
oil shale samples from the Anvil Points area in Colorado
[Smith, 1956].
I
I
1
100 r
80
70
60
50
40
30
UJ
>•
6
£
to
S3
K
Ul
o
£
o
UJ
t 20
o
o
10
Reference :
Industrie! ond Engineering Chemistry
Vol 48 Wo. 3 fp 441-444 1956
14
i.5
1.6
1.7
1.8
1.9 2.0 2.1 2.2 2.3 2.4
SPECIFIC GRAVITY, 60/60° F
2.5 2.6 2.7 2.8
2.9
I
Figure 2.5-1.
Specific Gravity and Oil Yield of Colorado
Oil Shales. Source: Smith, 1956 (Reprinted
with permission from I.&E.C. Copyright
American Chemical Society.)
A basic equation for the relationship between organic content and
oil shale density was developed |[ Smith, 1969]. The equation is:
DADB
A(DB-DA) -f
54
I
I
I
I
I
I
I
I
I
I
I
I
I
image:
and since the mineral components of oil shale have specific grav-
ities ranging from 2.2 (for anaicime) to 5.0 (for pyrite), an
increase in the organic content of an oil shale causes a decrease
in specific gravity of the oil shale.
The graph presented as Figure 2.5-1 displays average values for
oil shale samples from the Anvil Points area in Colorado
[Smith, 1956].
I
I
1
100 r
80
70
60
50
40
30
UJ
>•
6
£
to
S3
K
Ul
o
£
o
UJ
t 20
o
o
10
Reference :
Industrie! ond Engineering Chemistry
Vol 48 Wo. 3 fp 441-444 1956
14
i.5
1.6
1.7
1.8
1.9 2.0 2.1 2.2 2.3 2.4
SPECIFIC GRAVITY, 60/60° F
2.5 2.6 2.7 2.8
2.9
I
Figure 2.5-1.
Specific Gravity and Oil Yield of Colorado
Oil Shales. Source: Smith, 1956 (Reprinted
with permission from I.&E.C. Copyright
American Chemical Society.)
A basic equation for the relationship between organic content and
oil shale density was developed |[ Smith, 1969]. The equation is:
DADB
A(DB-DA) -f
54
I
I
I
I
I
I
I
I
I
I
I
I
I
image:
 DT = Shale density j
A = Weight fraction of organic matter
B = Weight fraction of mineral matter ;
A = Average density of organic fraction,
(g/cm3) ;
B = Average density of mineral fraction,
(g/cm3)
Plotted values agree closely with those shown on Figure 2 5-1
when values in the range of natural occurrence in oil: shales are
assigned to DR(2.7 g/crn^ ) and DA(1.05 g/cm3). ,
Taking the specific gravity/organic content correlation one step
lurther, an empirical relationship between specific gravity and
01i>A m gallons per ton, as determined by the Fischer Assay
method was also developed [Smith, 1956]. This relationship is
expressed by: i c
Y = 31.563 X2-205.998 X + 326.624 j
I
Where Y = oil yield in gallons per ton ;
X = specific gravity of Green River
oil shale at 60/60 °F.
In another study an equation relating the oil yield of New Albany
™ deVel°*ed ^mith etal., 1964].
Y = 93.482 - 34.355 X
Where Y = oil yield in gallons per ton <
X = specific gravity of New Albany oil shale
The calculated relationships between grade, specific gravity,
weight (in place) and weight (broken 38 percent voids) for typical
Green River formation oil shale are presented in Table 2^5-2.
2-5.3 Porosity and Permeability !
The porosity of Green River oil shale before and after heating has
been reported [Dinneen, 1972]. The data were obtained on samp] es
ranging in grade from 1.0 to 60 gallons per ton. These shales
were heated under controlled conditions to 950 °F to remove the or-
ganic matter and further heated to 1500°F to decompose the mineral
carbonates. During the thermal treatment, the oil shale samples
were in a stress-free environment. Table 2.5-3 presents the mea-
surable porosities of the raw and treated oil shale samples
55
image:
DT = Shale density j
A = Weight fraction of organic matter
B = Weight fraction of mineral matter ;
A = Average density of organic fraction,
(g/cm3) ;
B = Average density of mineral fraction,
(g/cm3)
Plotted values agree closely with those shown on Figure 2 5-1
when values in the range of natural occurrence in oil: shales are
assigned to DR(2.7 g/crn^ ) and DA(1.05 g/cm3). ,
Taking the specific gravity/organic content correlation one step
lurther, an empirical relationship between specific gravity and
01i>A m gallons per ton, as determined by the Fischer Assay
method was also developed [Smith, 1956]. This relationship is
expressed by: i c
Y = 31.563 X2-205.998 X + 326.624 j
I
Where Y = oil yield in gallons per ton ;
X = specific gravity of Green River
oil shale at 60/60 °F.
In another study an equation relating the oil yield of New Albany
™ deVel°*ed ^mith etal., 1964].
Y = 93.482 - 34.355 X
Where Y = oil yield in gallons per ton <
X = specific gravity of New Albany oil shale
The calculated relationships between grade, specific gravity,
weight (in place) and weight (broken 38 percent voids) for typical
Green River formation oil shale are presented in Table 2^5-2.
2-5.3 Porosity and Permeability !
The porosity of Green River oil shale before and after heating has
been reported [Dinneen, 1972]. The data were obtained on samp] es
ranging in grade from 1.0 to 60 gallons per ton. These shales
were heated under controlled conditions to 950 °F to remove the or-
ganic matter and further heated to 1500°F to decompose the mineral
carbonates. During the thermal treatment, the oil shale samples
were in a stress-free environment. Table 2.5-3 presents the mea-
surable porosities of the raw and treated oil shale samples
55
image:
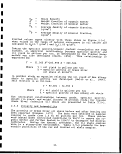 s
rH
H
CO
\ *|
o
CM
I
in
*
CM
o
en
•H
o
co
CO
*,
r-t
rH
0)
&
O
XI
4J
X!
tn
H>
3:
0)
U
ro
ft
pj
H
K
•P
XI
•H
0)
•
O
0)
p
CO
1*
re
jt*j
&
a)
rH
ro
X!
fco
1
"X
0}
PS
O
4->
P!
O
-P
•o
P
<5
in
\
in
XI
rH
0
>•
\
un
0
o
p
0
.p
'H
•3
V
^
tt
.M
Pi
C
"^
r~
fO
tr
CM
<tf CM CM rH rH i O
rH rH rH rH rH rH
CT» CM CO ^ ITl '• \D
rH CM CM CM CM CM
,
in CM ID co o co
O & CO CO CO £~~
H
CO O t-O O *^ CT*
CM O CO CO C-- «3
CM CM rH tH rH rH
co in in o in o
rH co ^ m in vo
tH rH tH rH rH rH
rH in CM ^Q CO CO
cn co co co cri in
<i> ^< CO CO CM ! CM
H rH rH rH tH rH
<^ co co in v^> ; CM
rH CO tH ^ t^- rH
l> CO CM rH O O
• •••••
CM CM CM CM CM CM
o in in o in o
rH CM CO CO •*
CO
o
o>
rH
C!
(0
rd
0)
o
O
CO
56
I
1
I
1
I
I
i
I
1
I
I
1
I
I
I
I
I
I
I
image:
s
rH
H
CO
\ *|
o
CM
I
in
*
CM
o
en
•H
o
co
CO
*,
r-t
rH
0)
&
O
XI
4J
X!
tn
H>
3:
0)
U
ro
ft
pj
H
K
•P
XI
•H
0)
•
O
0)
p
CO
1*
re
jt*j
&
a)
rH
ro
X!
fco
1
"X
0}
PS
O
4->
P!
O
-P
•o
P
<5
in
\
in
XI
rH
0
>•
\
un
0
o
p
0
.p
'H
•3
V
^
tt
.M
Pi
C
"^
r~
fO
tr
CM
<tf CM CM rH rH i O
rH rH rH rH rH rH
CT» CM CO ^ ITl '• \D
rH CM CM CM CM CM
,
in CM ID co o co
O & CO CO CO £~~
H
CO O t-O O *^ CT*
CM O CO CO C-- «3
CM CM rH tH rH rH
co in in o in o
rH co ^ m in vo
tH rH tH rH rH rH
rH in CM ^Q CO CO
cn co co co cri in
<i> ^< CO CO CM ! CM
H rH rH rH tH rH
<^ co co in v^> ; CM
rH CO tH ^ t^- rH
l> CO CM rH O O
• •••••
CM CM CM CM CM CM
o in in o in o
rH CM CO CO •*
CO
o
o>
rH
C!
(0
rd
0)
o
O
CO
56
I
1
I
1
I
I
i
I
1
I
I
1
I
I
I
I
I
I
I
image:
 TABLE 2.5-3. POROSITIES OF RAW AND THERMALLY TREATED
OIL SHALES (PERCENT OF BULK VOLUMES)
Oil yield,
liters per
metric ton
4.2
27.1
56.3
1104.3
125.2
164.8
244 . 1
Measurable
porosity of
raw oil shale
10.54
5.53
0.57
0.30
0.14
0.16
0.13
Porosity after
heating to
510°C (950°F)
13.36
14.70
19.09
30.41
36.34
45.35
61.16
Porosity after
heating to
816°C (1500°F)
1 24.83
20.89
; 32.03
.. 53.85
i 51.90
62.91
70.69
Source: Dinneen, 1972 i
The mineral matrices of the oil shales yielding less than about
9.6 gallons of oil per ton did not undergo noticeable structural
breakdown upon heating to 950°F. For richer shales,! the struc-
tural breakdown becomes more noticeable as the grade of shale in-
creases, so that for shales yielding more than 30 gallons per ton,
there is extensive fracturing and swelling. ;
The effect of heat, stress, and time on permeability of test
columns of Green River oil shale samples of various !grades were
determined [Tisot et al., 1971]. As compressive strain increased
with time, the columns' pre-geometry, porosity, and permeability
were concurrently undergoing change. Permeability was expressed
as the amount of nitrogen (STP) which passed through the column of
fragments (in cubic inches per square inch of cross-seqtional area
per minute). 'i
2.5.4 Mechanical Properties :
2.5.4.1 Shear Strength
Shear strengths of lean oil shale samples cut from the roof mater-
ial in the experimental underground oil shale mine of the U.S.
Bureeiu of Mines at Anvil Points, Colorado, are presented in
Table 2.5-4 [Agapito, 1972].
i
2.5.4.2 Compressive Strength i
[
The compressive strengths of core samples of Green River oil shale
before and after thermal treatment have been reported [Dinneen,
1968 and 1972], The untreated samples displayed high Gompressive
strength values that were about the same, whether determined per-
pendicular to or parallel to the bedding planes of !the shale.
57
image:
TABLE 2.5-3. POROSITIES OF RAW AND THERMALLY TREATED
OIL SHALES (PERCENT OF BULK VOLUMES)
Oil yield,
liters per
metric ton
4.2
27.1
56.3
1104.3
125.2
164.8
244 . 1
Measurable
porosity of
raw oil shale
10.54
5.53
0.57
0.30
0.14
0.16
0.13
Porosity after
heating to
510°C (950°F)
13.36
14.70
19.09
30.41
36.34
45.35
61.16
Porosity after
heating to
816°C (1500°F)
1 24.83
20.89
; 32.03
.. 53.85
i 51.90
62.91
70.69
Source: Dinneen, 1972 i
The mineral matrices of the oil shales yielding less than about
9.6 gallons of oil per ton did not undergo noticeable structural
breakdown upon heating to 950°F. For richer shales,! the struc-
tural breakdown becomes more noticeable as the grade of shale in-
creases, so that for shales yielding more than 30 gallons per ton,
there is extensive fracturing and swelling. ;
The effect of heat, stress, and time on permeability of test
columns of Green River oil shale samples of various !grades were
determined [Tisot et al., 1971]. As compressive strain increased
with time, the columns' pre-geometry, porosity, and permeability
were concurrently undergoing change. Permeability was expressed
as the amount of nitrogen (STP) which passed through the column of
fragments (in cubic inches per square inch of cross-seqtional area
per minute). 'i
2.5.4 Mechanical Properties :
2.5.4.1 Shear Strength
Shear strengths of lean oil shale samples cut from the roof mater-
ial in the experimental underground oil shale mine of the U.S.
Bureeiu of Mines at Anvil Points, Colorado, are presented in
Table 2.5-4 [Agapito, 1972].
i
2.5.4.2 Compressive Strength i
[
The compressive strengths of core samples of Green River oil shale
before and after thermal treatment have been reported [Dinneen,
1968 and 1972], The untreated samples displayed high Gompressive
strength values that were about the same, whether determined per-
pendicular to or parallel to the bedding planes of !the shale.
57
image:
 1
1
TABLE 2.5-4. SHEAR STRENGTHS OF LEAN OIL SHALE SPECIMENS FROM ROOF
MATERIAL OF USBM EXPERIMENTAL MINE (ANVIL POINTS) •
Direction ofShear\Standard
shearing force to strength, \ Number of deviation •
the bedding planes Ib/sq. in. samples tested (percent) •
Perpendicular 3,490 5 4.9 •
Perpendicular 4,640 5 3.1 J§
Parallel 1,770 5 . 10.5
Perpendicular 3,560 . 5 5.1 «.
Perpendicular 3,145 5 6.0 •
Parallel 890 5 8.3 *
Perpendicular 3,205 5 5.2
Parallel 920 5 9.1 •
Source: Agapito, 1972 w
After heating to 950°F, the lean shales retained high compressive
strength values in both horizontal and vertical planes, indicating _
a high degree of inorganic cementation between the mineral parti- I
cles comprising each lamina and between adjacent laminae. Dinneen "*
showed the compressive strength of rich shale is quite low after
removal of the organic matter. Decomposition of the mineral car- •
bonates at 1500°F apparently does not greatly affect the compres- p
sive strength. The results are presented in Table 2.5-5,
expressed in metric system units [Dinneen, 1968 and 1972]. sa
English system unit may be derived from Figure 2.5-2. |
A rather comprehensive report on the compressive strength of roof
and mine support pillar specimens cut perpendicular to bedding •
Planes was prepared [Agapito, 1972]. The specimens were obtained »
in the room-and-piliar system underground shale mine of Mobil Oil
Company, near Anvil Points, Colorado. The data are summarized in •
Table 2.5-6. H
That the compressive strength of \ oil shale varies with the grade «
of the shale is presented in Figure 2.5-3 [Sellers, 1971]. •
2.5.4.3 Hardness
u
For two Green River core samples tested, the hardness of the II
horizontal core was 61 (scleroscope hardness number) and.for the
vertical core was 55 [Matzick et al., 1956]. m
2.5.5 Leachate Quality and Quantity
The modified in-situ method of oil shale retorting and the various •
surface methods require that quantities of raw (unretorted) shale •
58
I
I
image:
1
1
TABLE 2.5-4. SHEAR STRENGTHS OF LEAN OIL SHALE SPECIMENS FROM ROOF
MATERIAL OF USBM EXPERIMENTAL MINE (ANVIL POINTS) •
Direction ofShear\Standard
shearing force to strength, \ Number of deviation •
the bedding planes Ib/sq. in. samples tested (percent) •
Perpendicular 3,490 5 4.9 •
Perpendicular 4,640 5 3.1 J§
Parallel 1,770 5 . 10.5
Perpendicular 3,560 . 5 5.1 «.
Perpendicular 3,145 5 6.0 •
Parallel 890 5 8.3 *
Perpendicular 3,205 5 5.2
Parallel 920 5 9.1 •
Source: Agapito, 1972 w
After heating to 950°F, the lean shales retained high compressive
strength values in both horizontal and vertical planes, indicating _
a high degree of inorganic cementation between the mineral parti- I
cles comprising each lamina and between adjacent laminae. Dinneen "*
showed the compressive strength of rich shale is quite low after
removal of the organic matter. Decomposition of the mineral car- •
bonates at 1500°F apparently does not greatly affect the compres- p
sive strength. The results are presented in Table 2.5-5,
expressed in metric system units [Dinneen, 1968 and 1972]. sa
English system unit may be derived from Figure 2.5-2. |
A rather comprehensive report on the compressive strength of roof
and mine support pillar specimens cut perpendicular to bedding •
Planes was prepared [Agapito, 1972]. The specimens were obtained »
in the room-and-piliar system underground shale mine of Mobil Oil
Company, near Anvil Points, Colorado. The data are summarized in •
Table 2.5-6. H
That the compressive strength of \ oil shale varies with the grade «
of the shale is presented in Figure 2.5-3 [Sellers, 1971]. •
2.5.4.3 Hardness
u
For two Green River core samples tested, the hardness of the II
horizontal core was 61 (scleroscope hardness number) and.for the
vertical core was 55 [Matzick et al., 1956]. m
2.5.5 Leachate Quality and Quantity
The modified in-situ method of oil shale retorting and the various •
surface methods require that quantities of raw (unretorted) shale •
58
I
I
image:
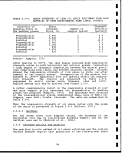 Q
H
<j
W
EH —
t-3 EH
£J §
i a
in O
Q ptl
§ Pj
^ 5j
|"*^
15 OJ
rtj co
CH
p"]
ft, y
O CM
CO CO
hrj JS
EH S3
O CM
S3 O
w o
EH M
CO £4
<*•**
W
> CO
CO J
co <cj
f« co
§ i— 1
O M
u o
•
LO
1
Lf)
*
CN
w
CQ
f£
EH
O
0
rH
00
O
4J
"dl
4->
0)
43
0)
CO
rH
•H
O
o
o
O
rH
LO
O
-P
T)
0)
(d
a;
0)
fd
M
rH
•H
0
PQ
<
CQ
^
CQ
a>
rt) CQ
43
CQ
•H
O <fl
<j
^
m
yv]
fl
5
- u
TJ-H
(U-P
-H (U
&*t £
\
rH CO
•H in
O 0)
•p
•H
rH
00 «3 O rH 00 00 CM
s}i IO VO rH
o cn CM
rH
O CM 00 CM 00 VO •*
cn o co H
O CM C^
rH rH
CO CM WD O O CO CM
CO CO "41
M. hfe
H H
10 co Lf> cn in LO CM
O 00 CO CM CM
"NJh cy^ o^
•k, Ik.
rH rH
*sj* r^ in co LT> cr» c^»
v*o cn ^^ c^ ^}* ^o c^
co cn vo co ^^ cn cn
».•.>.•.
rH rH rH rH
o *sj* o ^ *& cn ^
vo cn !>• cn cn o rH
LO rH CO CM vO 00 Cn
fc. «*. «fc ».
rH CM rH rH
CM rH CO CO CM CO rH
«••••••
^ r^- vo <^ in ^ "41
CM in o CM vo ^
rH rH rH CM
•
CO
0)
J-3 *
re CQ
rH 0)
Pi Pi
&> i—i
P5 p,
•H
"X? C7^
TH pJ
0) -H
45 ^
'O
<0 <u
5
0)
O 43
i > 'i i
rcJ S
rH -H
3 SSCM
o c~-
-H i-H <T>
C3 rH1"1
<D i-HTS
Pi t3 fl
W >H fO
0) «tf
Pi PiOO
t43 cn
-P rH
tT*
f3 P3 -
(U 0) f3
in in 0)
-P -P a)
co co (3
pj
0) O-H
-H -H
CQ CO
CO CQ ••
<D <U <1)
MHO
i* i1^
O O O
U O CO
(0 45
59
image:
Q
H
<j
W
EH —
t-3 EH
£J §
i a
in O
Q ptl
§ Pj
^ 5j
|"*^
15 OJ
rtj co
CH
p"]
ft, y
O CM
CO CO
hrj JS
EH S3
O CM
S3 O
w o
EH M
CO £4
<*•**
W
> CO
CO J
co <cj
f« co
§ i— 1
O M
u o
•
LO
1
Lf)
*
CN
w
CQ
f£
EH
O
0
rH
00
O
4J
"dl
4->
0)
43
0)
CO
rH
•H
O
o
o
O
rH
LO
O
-P
T)
0)
(d
a;
0)
fd
M
rH
•H
0
PQ
<
CQ
^
CQ
a>
rt) CQ
43
CQ
•H
O <fl
<j
^
m
yv]
fl
5
- u
TJ-H
(U-P
-H (U
&*t £
\
rH CO
•H in
O 0)
•p
•H
rH
00 «3 O rH 00 00 CM
s}i IO VO rH
o cn CM
rH
O CM 00 CM 00 VO •*
cn o co H
O CM C^
rH rH
CO CM WD O O CO CM
CO CO "41
M. hfe
H H
10 co Lf> cn in LO CM
O 00 CO CM CM
"NJh cy^ o^
•k, Ik.
rH rH
*sj* r^ in co LT> cr» c^»
v*o cn ^^ c^ ^}* ^o c^
co cn vo co ^^ cn cn
».•.>.•.
rH rH rH rH
o *sj* o ^ *& cn ^
vo cn !>• cn cn o rH
LO rH CO CM vO 00 Cn
fc. «*. «fc ».
rH CM rH rH
CM rH CO CO CM CO rH
«••••••
^ r^- vo <^ in ^ "41
CM in o CM vo ^
rH rH rH CM
•
CO
0)
J-3 *
re CQ
rH 0)
Pi Pi
&> i—i
P5 p,
•H
"X? C7^
TH pJ
0) -H
45 ^
'O
<0 <u
5
0)
O 43
i > 'i i
rcJ S
rH -H
3 SSCM
o c~-
-H i-H <T>
C3 rH1"1
<D i-HTS
Pi t3 fl
W >H fO
0) «tf
Pi PiOO
t43 cn
-P rH
tT*
f3 P3 -
(U 0) f3
in in 0)
-P -P a)
co co (3
pj
0) O-H
-H -H
CQ CO
CO CQ ••
<D <U <1)
MHO
i* i1^
O O O
U O CO
(0 45
59
image:
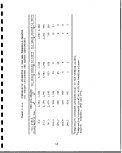 30,000 r
10,000
v>
Q.
X
0
UJ
55
in
o
1,000
100
RAW SHALE
V
\ HEATED SHALE
\
\
20 40
OIL YIELD;, 6AL./TON
60
Figure 2.5-2. Compressive Strength of Oil Shales.
Source: Dinneen, 1968 and 1972
be mined from shafts and drifts that provide access to the re-
torts. Raw shale is also mined to provide a void space into which
the shale in the retort expands upo;n rubblization by blasting. The
mined shale may be stored on the ground surface for a period of at
least a few years and possibly even permanently. Underground
mining and surface retorting will also require large storage piles
of raw, mined shale for retort feed material. In addition lean
shale and rejected raw shale fines may be permanently disposed.
The placement of the raw mined shale on the surface places it in
an t environment with which it is no longer in geochemical
equilibrium. Subsequent precipitation on the pile creates the
potential for the release of leachate containing a variety of
chemicals into percolating waters -at elevated levels relative to
the base line conditions.
A^econnaisance study of leachate quality from raw mined oil shale
with emphasis on shale from Federal lease tracts C-a and C-b has
been reported [EPA-600/7-80-181, ; 1980]. The study employed
laboratory leaching columns containing a variety of samples of raw
shale and soils which were obtained from the Piceance Basin of
Colorado. The purpose of extending the study to selected soil
samples was to provide a background and perspective from which to
view raw shale leachate properties.t Included were four raw
60
I
I
1
1
1
1
I
1
I
I
1
1
1
I
I
I
I
I
I
image:
30,000 r
10,000
v>
Q.
X
0
UJ
55
in
o
1,000
100
RAW SHALE
V
\ HEATED SHALE
\
\
20 40
OIL YIELD;, 6AL./TON
60
Figure 2.5-2. Compressive Strength of Oil Shales.
Source: Dinneen, 1968 and 1972
be mined from shafts and drifts that provide access to the re-
torts. Raw shale is also mined to provide a void space into which
the shale in the retort expands upo;n rubblization by blasting. The
mined shale may be stored on the ground surface for a period of at
least a few years and possibly even permanently. Underground
mining and surface retorting will also require large storage piles
of raw, mined shale for retort feed material. In addition lean
shale and rejected raw shale fines may be permanently disposed.
The placement of the raw mined shale on the surface places it in
an t environment with which it is no longer in geochemical
equilibrium. Subsequent precipitation on the pile creates the
potential for the release of leachate containing a variety of
chemicals into percolating waters -at elevated levels relative to
the base line conditions.
A^econnaisance study of leachate quality from raw mined oil shale
with emphasis on shale from Federal lease tracts C-a and C-b has
been reported [EPA-600/7-80-181, ; 1980]. The study employed
laboratory leaching columns containing a variety of samples of raw
shale and soils which were obtained from the Piceance Basin of
Colorado. The purpose of extending the study to selected soil
samples was to provide a background and perspective from which to
view raw shale leachate properties.t Included were four raw
60
I
I
1
1
1
1
I
1
I
I
1
1
1
I
I
I
I
I
I
image:
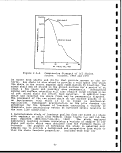 TABLE; 2.5-6.
COMPRESSIVE STRENGTH OF GREEN RIVER OIL SHALE SAMPLES
CUT PERPENDICULAR TO BEDDING (SAMPLES FRtiM USBM
EXPERIMENTAL MINE, ANVIL POINTS, COLORADO)
Distance from
Mahoqany marker,
feet
31.6 above
21. 5-26. 8 above
20 above
18 . 5 above
10 above
4.2 above
2.5 below
4.5 below
7 below
10 below
12 . 5 below
14 below
14.6 below
15.5 below
17 below
17.5 below
18.5 below
20 below
20.5 below
23 below
23 below
26.6 below
27 below
31 below
33 below
37 below
39.5 below
46.5 below
Bed
designation
Roof
do
do
A
B
C
D
D
D
D
E
E
E
F
F
F
F
G
G
G
G
G
G
H
H
H
H
I
Number of
specimens
tested
2
2
3
1
2
1
1
2
2
1
1
3
5
3
1
1
8
1
1
2
2
2
3
3
1
1
2
2
Compressive
strength,
psi
15,380
14,890
12,430
17,100
1!5,000
17,100
19,000
12,650
11,730
10,700
12,520
;8,280
7,350
11,910
12,080
9,190
'8,160
14,480
14,470
10,250
,8,600
14,090
12,960
18,560
13,600
3J5,390
17,280
12,700
Designations refer to arbitrarily-designated groups of
minesable beds, lettered A through I. j
Source: Agapito, 1972
shales, two soils, one sample of naturally leached 'outcropping
shale, and one sample of naturally retorted shale from a surface
fire of unknown age. ,
Leaching was conducted by passing deionized water through columns
of each material. Both saturated and unsaturated testis were con-
ducteid. Samples of the effluents were collected and s'ubjected to
chemical analyses. The ranges of concentration variation observed
61
image:
TABLE; 2.5-6.
COMPRESSIVE STRENGTH OF GREEN RIVER OIL SHALE SAMPLES
CUT PERPENDICULAR TO BEDDING (SAMPLES FRtiM USBM
EXPERIMENTAL MINE, ANVIL POINTS, COLORADO)
Distance from
Mahoqany marker,
feet
31.6 above
21. 5-26. 8 above
20 above
18 . 5 above
10 above
4.2 above
2.5 below
4.5 below
7 below
10 below
12 . 5 below
14 below
14.6 below
15.5 below
17 below
17.5 below
18.5 below
20 below
20.5 below
23 below
23 below
26.6 below
27 below
31 below
33 below
37 below
39.5 below
46.5 below
Bed
designation
Roof
do
do
A
B
C
D
D
D
D
E
E
E
F
F
F
F
G
G
G
G
G
G
H
H
H
H
I
Number of
specimens
tested
2
2
3
1
2
1
1
2
2
1
1
3
5
3
1
1
8
1
1
2
2
2
3
3
1
1
2
2
Compressive
strength,
psi
15,380
14,890
12,430
17,100
1!5,000
17,100
19,000
12,650
11,730
10,700
12,520
;8,280
7,350
11,910
12,080
9,190
'8,160
14,480
14,470
10,250
,8,600
14,090
12,960
18,560
13,600
3J5,390
17,280
12,700
Designations refer to arbitrarily-designated groups of
minesable beds, lettered A through I. j
Source: Agapito, 1972
shales, two soils, one sample of naturally leached 'outcropping
shale, and one sample of naturally retorted shale from a surface
fire of unknown age. ,
Leaching was conducted by passing deionized water through columns
of each material. Both saturated and unsaturated testis were con-
ducteid. Samples of the effluents were collected and s'ubjected to
chemical analyses. The ranges of concentration variation observed
61
image:
 CURVE IS FROM EQUATION
= J5;760-957A + 9.72A2
-2B9A (H/W) Whirl H/W= I 825
FISCHER ASSAY, GALLONS PER TON
Figure 2.5-3.
Compressive Strength versus Fischer Assay
of Colorado Oil Shale, Anvil Points Mine.
Source: Sellers, 1971
Table 2 5 7 fS"ttweac5 °f^ ^ Aerials tested are presented in
sSiSc: ;5~Zi ^ /aS f°U?d "^ the leachate contained dissolved
™°Jids at elevated concentrations relative to the background. The
mauor contributors to the dissolved solids content are caicium
magnesium, sodium, bicarbonate, chloride and sulfate. I compa™-
iS Table f I £lemS£ concentrations in the leachates is presented
tL7™i™£: i • ^.concentrations of four elements of potential
o?™C?*°gafal significance: Al, B, F, and Zn were found to be
significantly greater in the leachates from some of the mined
snaies than in the corresponding samples from the previously ex-
bv th^^1^18; iThe levels of a11 other trace elements produSd
«£M 3 6d .shales were comparable to those observed from the
soils and previously exposed shales.
. maximum observed concentrations of various
h -, dra:nk:Ln9 water criteria, it was concluded that
even the worst leachate from the columns did not exceed 100 times
drinking water standards for measured parameters ^ However thJ
maximum concentrations of Cr, F, Fe, Hg, Mn, NOa Pb? IS!!' TDS
and Zn were found to exceed drinking water criteria.
As a result of the laboratory study [EPA-600/7-80-
The mean concentrations of the major ionic species found in the
^aC^eSnfr0mT tlfeC-a and C-b tracts are Presented in Table 2.5-9
and 2.5-10. In the case of the C-a tract, the leachate from the
62
I
I
1
1
1
I
1
I
I
1
1
I
I
1
I
I
I
image:
CURVE IS FROM EQUATION
= J5;760-957A + 9.72A2
-2B9A (H/W) Whirl H/W= I 825
FISCHER ASSAY, GALLONS PER TON
Figure 2.5-3.
Compressive Strength versus Fischer Assay
of Colorado Oil Shale, Anvil Points Mine.
Source: Sellers, 1971
Table 2 5 7 fS"ttweac5 °f^ ^ Aerials tested are presented in
sSiSc: ;5~Zi ^ /aS f°U?d "^ the leachate contained dissolved
™°Jids at elevated concentrations relative to the background. The
mauor contributors to the dissolved solids content are caicium
magnesium, sodium, bicarbonate, chloride and sulfate. I compa™-
iS Table f I £lemS£ concentrations in the leachates is presented
tL7™i™£: i • ^.concentrations of four elements of potential
o?™C?*°gafal significance: Al, B, F, and Zn were found to be
significantly greater in the leachates from some of the mined
snaies than in the corresponding samples from the previously ex-
bv th^^1^18; iThe levels of a11 other trace elements produSd
«£M 3 6d .shales were comparable to those observed from the
soils and previously exposed shales.
. maximum observed concentrations of various
h -, dra:nk:Ln9 water criteria, it was concluded that
even the worst leachate from the columns did not exceed 100 times
drinking water standards for measured parameters ^ However thJ
maximum concentrations of Cr, F, Fe, Hg, Mn, NOa Pb? IS!!' TDS
and Zn were found to exceed drinking water criteria.
As a result of the laboratory study [EPA-600/7-80-
The mean concentrations of the major ionic species found in the
^aC^eSnfr0mT tlfeC-a and C-b tracts are Presented in Table 2.5-9
and 2.5-10. In the case of the C-a tract, the leachate from the
62
I
I
1
1
1
I
1
I
I
1
1
I
I
1
I
I
I
image:
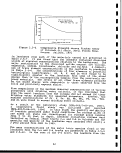 CO
CO
1
s
w
J
CO
§
I—I
EH
W
u
§
o
w
o
w
O
CO
(N
H
Irl
,=
•H L< 1-
^0)0)
C •<-> j->
•H (O -H
i-j i lj
Q U
i i i m o i co n i es) i i iini
C O
O 4J
•H Ol
C L.
v o
i tji a;
OS 0 --)
-a re
V V V
o?s«s ss s'sss
ii^isiiiti^.<^.?iti"5-iiiiji
fi'i'i'ii'i'ig'i'i' fi'
63
image:
CO
CO
1
s
w
J
CO
§
I—I
EH
W
u
§
o
w
o
w
O
CO
(N
H
Irl
,=
•H L< 1-
^0)0)
C •<-> j->
•H (O -H
i-j i lj
Q U
i i i m o i co n i es) i i iini
C O
O 4J
•H Ol
C L.
v o
i tji a;
OS 0 --)
-a re
V V V
o?s«s ss s'sss
ii^isiiiti^.<^.?iti"5-iiiiji
fi'i'i'ii'i'ig'i'i' fi'
63
image:
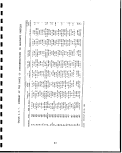 W
CO
CM
&3
EH
CO
•r*
Cn o)
5
W
3
0
H
>
0)
>-.
D
E*
T3
G
W
H
H
0
.0
u
<o
rH
CO
,G
(0
rrl
\J
a)
U]
0
P-<
rC
QJ
W
rH
fO
(A
•a
<D
-H
E
03
fvj
€
3
C
•3
W
(0
K
c
3
§
"d
nj
s
&
1
rH
•H
Sx
4J
W
CD
£•4
G
O
-H
4_)
m
^
p
G
CD
o
G
0
0
C
3
rH
0)
•H
F*i
•P
<U
H
g
O
•H
P
CO
^
£
O
rj
G
O
CJ
G
•H
M
_c
0
1
g
-H
M
CO
S
*.
""CJ
(U
111
o
M
g
3
S
•H
(0
»»
T3
>
a3
CO
o
4J
•r-
i.
0
d.
re
C
a
•H
re
i*
P
(^
aj
u
§
U
H-l
•v^^
^
E
G
O
•H
CO
4J
CD
O
i-3
~Oi
S
+J
G
0)
£
ai
rH
in
o
CM
in oo
o o oo ro o
in
o
in rH
o o
lOlrHIOrHlHOO
OI IOO
1T)
O
W
C
O
rH
0
U
4-1
to
rH G
"rH
O >H
10
UU
(U
• -H ,-H
P O ' O
CO W rH W
G -H
G G u G
o o o
•H iH ,Q rH
c o i o
t=> O U! U
' -H -H
•POO
•H
O
rH rH
-H -H
O O
G -H
O O O O
G O O I O
& O U U O
•H
U
C C
OO
,Oi-HiH
100
CJUU
m m
ro o en in o r> ro
m
o
in oincr>
in
o co o c-~ m vo
ooooooomoooooooooiHO
V V CM" V V CM
a)
P
to
B
to
u
§
in
tt) CO
4-> W
co
»-« CM
i P
i co -
to s
CM S-i
si
CQ rH
CD O
fO T3
W 0)
G ^;4J
P
tO
tfl
P>
CO
S-i
CO 3 to CO CO
^ilp !M S-, ^
P
• CO
l-i
P
re
S-i
4JQPUPP-P
E«E;
£30
• «
PPI
*
P
to
in
- to
• !M
O P>
to in
& -
dj pQ
i en
P
VI
§
en
in
«3* o
m o
m
oo CM co cr>
in
ro
o
coo
IHCOOO
v
v
W
(S <U Si J3
<U CP-H
O -H
<U -H G G
1
1
1
1
I
I
o
co
oo
o
oo
i
r~
o
o
Si
W
0)
g
3
O
CO
1
I
1
I
1
I
I
1
1
I
I
64
image:
W
CO
CM
&3
EH
CO
•r*
Cn o)
5
W
3
0
H
>
0)
>-.
D
E*
T3
G
W
H
H
0
.0
u
<o
rH
CO
,G
(0
rrl
\J
a)
U]
0
P-<
rC
QJ
W
rH
fO
(A
•a
<D
-H
E
03
fvj
€
3
C
•3
W
(0
K
c
3
§
"d
nj
s
&
1
rH
•H
Sx
4J
W
CD
£•4
G
O
-H
4_)
m
^
p
G
CD
o
G
0
0
C
3
rH
0)
•H
F*i
•P
<U
H
g
O
•H
P
CO
^
£
O
rj
G
O
CJ
G
•H
M
_c
0
1
g
-H
M
CO
S
*.
""CJ
(U
111
o
M
g
3
S
•H
(0
»»
T3
>
a3
CO
o
4J
•r-
i.
0
d.
re
C
a
•H
re
i*
P
(^
aj
u
§
U
H-l
•v^^
^
E
G
O
•H
CO
4J
CD
O
i-3
~Oi
S
+J
G
0)
£
ai
rH
in
o
CM
in oo
o o oo ro o
in
o
in rH
o o
lOlrHIOrHlHOO
OI IOO
1T)
O
W
C
O
rH
0
U
4-1
to
rH G
"rH
O >H
10
UU
(U
• -H ,-H
P O ' O
CO W rH W
G -H
G G u G
o o o
•H iH ,Q rH
c o i o
t=> O U! U
' -H -H
•POO
•H
O
rH rH
-H -H
O O
G -H
O O O O
G O O I O
& O U U O
•H
U
C C
OO
,Oi-HiH
100
CJUU
m m
ro o en in o r> ro
m
o
in oincr>
in
o co o c-~ m vo
ooooooomoooooooooiHO
V V CM" V V CM
a)
P
to
B
to
u
§
in
tt) CO
4-> W
co
»-« CM
i P
i co -
to s
CM S-i
si
CQ rH
CD O
fO T3
W 0)
G ^;4J
P
tO
tfl
P>
CO
S-i
CO 3 to CO CO
^ilp !M S-, ^
P
• CO
l-i
P
re
S-i
4JQPUPP-P
E«E;
£30
• «
PPI
*
P
to
in
- to
• !M
O P>
to in
& -
dj pQ
i en
P
VI
§
en
in
«3* o
m o
m
oo CM co cr>
in
ro
o
coo
IHCOOO
v
v
W
(S <U Si J3
<U CP-H
O -H
<U -H G G
1
1
1
1
I
I
o
co
oo
o
oo
i
r~
o
o
Si
W
0)
g
3
O
CO
1
I
1
I
1
I
I
1
1
I
I
64
image:
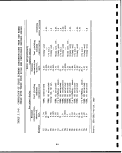 K
1
j
rt
o
fa
O
*z.
0
(—1
EH
H- t
rA
CQMPO!
§
M
P5
R
g
fa
CO
i_q
g
*
CTi
1
LO
*
CM
a
1
J
V^
1
Collector/
co
g
CO
o
ffl
r— 1
u
o
CO
Vv->
S
i1
fti
O
SH
rc)
0)
>i
000
CO LT> ^
o co oo
o co co
co in CM
<£> CM CM
CO O i-l
CM 00 CM
co co CM
vo in in
vo en o
<^ o in
rH
rH LO r~-
t~- CO rH
CM CO CO
^ r~- ^
CM CM rH
000
CM r- rH
CO ^ T}<
CO LD CM
CO CO ID
CT> I> CO
v£> CO LO
CO <£> CM
^D O rH
rH CO O
CO CM CM
rH rH CM
CO CO CO
CFi CTi CT>
rH r-l rH
4->4-> -P
<4H m IH
in ir> ir>
rH
1
o
1
/•N
O
fa
O
"^
0
I-H
EH
t-i
0
O
o
§
1— 1
g
h- s
"!^ ^^
00 _
cn c«!
•—i f~^i
,
fa
CO CO
<3< |JL]
i i n
^ <
CO >
Q S
"\, 15
o W
ii)
^
PM 0
H rH
U">
0) CM
U
M W
s tJ
0 CQ
co <q
J
tri
S
Collector/
CO
§
OQ
O
ffl
o
O
CO
K ^
rrt
a
Cn
S
(Tf
O
n
fti
gi
o o o o o o
LT) U1 rH CO 0 C--
^ o in o *£> ^
vi) r- vi> r- t»« ^£>
it) CO l> f- rH CTi
CM rH CM O rH rH
CTl CT> CO CTi ki) CM
CM CM CM CM CM CM
<* cn r» ^ LD in
o o o o o o
r- in **o *& cr> co
v£l CO ^£) tn ^f O
C^ CO l> CO C^ CO
CM rH rH CM CM rH
O O O O O O
<^< <£> IT) CO CO rH
in £~- CO t"- rH in
^ ^ <* ^ in ^
CT^ C^ CM CM in O
r- o cr> co co co
rH CM rH CM CO CM
in CTi CO U3 CTi VD
CM CM CM rH CO rH
CM CM CM CM rH CM
rH rH rH CM CM CM
CO CO CO CO CO CO
O"> CPi CT> C^* CT^ CTi
rH rH rH rH rH rH
4J 4J^J^>+J4J
IH m in iw m m
o in o o in o
rH rH CM rH rH CM
<*
CO
cr>
CO
^
rH
<tf
CO
4
0
Source: EPA-6(
65
image:
K
1
j
rt
o
fa
O
*z.
0
(—1
EH
H- t
rA
CQMPO!
§
M
P5
R
g
fa
CO
i_q
g
*
CTi
1
LO
*
CM
a
1
J
V^
1
Collector/
co
g
CO
o
ffl
r— 1
u
o
CO
Vv->
S
i1
fti
O
SH
rc)
0)
>i
000
CO LT> ^
o co oo
o co co
co in CM
<£> CM CM
CO O i-l
CM 00 CM
co co CM
vo in in
vo en o
<^ o in
rH
rH LO r~-
t~- CO rH
CM CO CO
^ r~- ^
CM CM rH
000
CM r- rH
CO ^ T}<
CO LD CM
CO CO ID
CT> I> CO
v£> CO LO
CO <£> CM
^D O rH
rH CO O
CO CM CM
rH rH CM
CO CO CO
CFi CTi CT>
rH r-l rH
4->4-> -P
<4H m IH
in ir> ir>
rH
1
o
1
/•N
O
fa
O
"^
0
I-H
EH
t-i
0
O
o
§
1— 1
g
h- s
"!^ ^^
00 _
cn c«!
•—i f~^i
,
fa
CO CO
<3< |JL]
i i n
^ <
CO >
Q S
"\, 15
o W
ii)
^
PM 0
H rH
U">
0) CM
U
M W
s tJ
0 CQ
co <q
J
tri
S
Collector/
CO
§
OQ
O
ffl
o
O
CO
K ^
rrt
a
Cn
S
(Tf
O
n
fti
gi
o o o o o o
LT) U1 rH CO 0 C--
^ o in o *£> ^
vi) r- vi> r- t»« ^£>
it) CO l> f- rH CTi
CM rH CM O rH rH
CTl CT> CO CTi ki) CM
CM CM CM CM CM CM
<* cn r» ^ LD in
o o o o o o
r- in **o *& cr> co
v£l CO ^£) tn ^f O
C^ CO l> CO C^ CO
CM rH rH CM CM rH
O O O O O O
<^< <£> IT) CO CO rH
in £~- CO t"- rH in
^ ^ <* ^ in ^
CT^ C^ CM CM in O
r- o cr> co co co
rH CM rH CM CO CM
in CTi CO U3 CTi VD
CM CM CM rH CO rH
CM CM CM CM rH CM
rH rH rH CM CM CM
CO CO CO CO CO CO
O"> CPi CT> C^* CT^ CTi
rH rH rH rH rH rH
4J 4J^J^>+J4J
IH m in iw m m
o in o o in o
rH rH CM rH rH CM
<*
CO
cr>
CO
^
rH
<tf
CO
4
0
Source: EPA-6(
65
image:
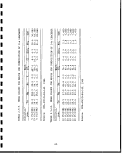 I
i
raw shale was highly saline with a mean concentration of dissolved
solids of 29,500 mg/L for the 5 ft. depth pile and 60,220 mg/L for
the 15 ft. depth pile. These waters were found to be a magnesium- •
sulfate type, with these two constituents accounting for 87% of •
the total equivalent weight of the dissolved solids. The pH
ranged from 6.9 to 7.9 throughout the study. " •
m
In the case of the C-b tract the ,quantity of dissolved solids in
the leachate was lower; averaging 6,850 mg/L and the pH ranged m
from 7.4 to 8.4. The composition of the C-b leachate is dominated ffl
by sodium and sulfate, rather than magnesium and sulfate exhibited ™
in the C-a leachate. In both cases it appeared that the calcium
concentration was controlled by the solubility of calcium sulfate. it
The mean values of trace element concentrations in the C-a and C-b
tract leachates are presented in \ Tables 2.5-11 and 2.5-12. The m
data are averaged over two years of sampling for various pile |J
depths. The concentrations of fluoride observed in the field
generated leachates were similar to those measured in the previous fc
laboratory column leaching study [EPA-600/7-80-181, 1980], even •
though the shale samples differed. The concentrations of zinc, *»
boron, and aluminum found in the field study were significantly
less than the maximum values observed in the laboratory column tt
studies (compare Tables 2.5-11 and 2.5-12 with Table 2.5-8). The B
differences may be due to the difference in materials used in the
two studies. The maximum values of the species analyzed in the *•
field study are presented in Table 2.5-13. Although the •
concentrations of many trace elements were sometimes observed to
be greater than various recommended maxima for particular uses
(e.g., drinking water), the large concentrations of the common m
species is more likely to be the significant quality m
characteristic of these leachates.
The cumulative volume of leachate per unit area measured over £
nearly three years at the C-a tract ranged from 6.26 to 13.72 cm
per year. These volumes represent 7 and 16 percent, respectively, «
of the incident precipitation over the same time period. The lar- •
ger value is believed to be more representative of the actual *
leachate volume generated in the pile. The cumulative volume of
leachate at the C-b tract ranged from 11.52 to 17.02 cm per year. jR
These volumes represent 12 and 17 percent, respectively, of the m
incident precipitation over the same time period. Leachate vol-
umes of these magnitudes are believed to be larger than the natur- M
al recharge rates on undisturbed lands receiving similar volumes g
of precipitation. The raw shale piles were formed from mine-run
size material and remained unvegetated. Therefore, infiltration ^
capacity was high and both evapotranspiration and direct runoff •
capacity were low. •
66
1
I
I
image:
I
i
raw shale was highly saline with a mean concentration of dissolved
solids of 29,500 mg/L for the 5 ft. depth pile and 60,220 mg/L for
the 15 ft. depth pile. These waters were found to be a magnesium- •
sulfate type, with these two constituents accounting for 87% of •
the total equivalent weight of the dissolved solids. The pH
ranged from 6.9 to 7.9 throughout the study. " •
m
In the case of the C-b tract the ,quantity of dissolved solids in
the leachate was lower; averaging 6,850 mg/L and the pH ranged m
from 7.4 to 8.4. The composition of the C-b leachate is dominated ffl
by sodium and sulfate, rather than magnesium and sulfate exhibited ™
in the C-a leachate. In both cases it appeared that the calcium
concentration was controlled by the solubility of calcium sulfate. it
The mean values of trace element concentrations in the C-a and C-b
tract leachates are presented in \ Tables 2.5-11 and 2.5-12. The m
data are averaged over two years of sampling for various pile |J
depths. The concentrations of fluoride observed in the field
generated leachates were similar to those measured in the previous fc
laboratory column leaching study [EPA-600/7-80-181, 1980], even •
though the shale samples differed. The concentrations of zinc, *»
boron, and aluminum found in the field study were significantly
less than the maximum values observed in the laboratory column tt
studies (compare Tables 2.5-11 and 2.5-12 with Table 2.5-8). The B
differences may be due to the difference in materials used in the
two studies. The maximum values of the species analyzed in the *•
field study are presented in Table 2.5-13. Although the •
concentrations of many trace elements were sometimes observed to
be greater than various recommended maxima for particular uses
(e.g., drinking water), the large concentrations of the common m
species is more likely to be the significant quality m
characteristic of these leachates.
The cumulative volume of leachate per unit area measured over £
nearly three years at the C-a tract ranged from 6.26 to 13.72 cm
per year. These volumes represent 7 and 16 percent, respectively, «
of the incident precipitation over the same time period. The lar- •
ger value is believed to be more representative of the actual *
leachate volume generated in the pile. The cumulative volume of
leachate at the C-b tract ranged from 11.52 to 17.02 cm per year. jR
These volumes represent 12 and 17 percent, respectively, of the m
incident precipitation over the same time period. Leachate vol-
umes of these magnitudes are believed to be larger than the natur- M
al recharge rates on undisturbed lands receiving similar volumes g
of precipitation. The raw shale piles were formed from mine-run
size material and remained unvegetated. Therefore, infiltration ^
capacity was high and both evapotranspiration and direct runoff •
capacity were low. •
66
1
I
I
image:
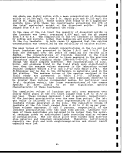 H
EH ^
tt 0
•3 <<
PT"] fxj
1-1 1-4
fC
tt 1
o o
^L
pq £n
H O
fri U)
O S
£5
CO rH
M EH
i— 1 K
H
W O
s o
*
rH
rH
1
in
*
CM
a
CQ
F^
H
-J
^s^
S
c/;
i —
<
•r
2
£
*
O
W
"1
N
Lj
\
SH
O
4-^ £_|
U nJ
0) 0)
r— I
0
o
T-l ^ LO O
vO CO *«0 C?
rH
in rH rH -^
CO CM O in
• . . .
0 0 CM rH
^O C^ ^d^ r**'
co co co in
o o o o
CO
o co r- co
* • • •
CM rH 0 rH
in in cn in
o o in cn
• • • •
o o o o
V V
C-- co rji co
CO CM ^i -^
^O ^O 00 C***
^^1 *5^ ^^4 c~ 3
O O O rH
<^ 00 VO CO
CM rH rH CM
• • * *
0 0 0 O
•* O CO rH
• • • •
O f- i-H O
rH rH CM CO
rH rH CM CM
CO CO 00 CO
cn cn cn cn
rH rH rH rH
-p -[_) | i _[_>
ij i ii i 1 1 i ii i
m LO in in
rH rH
w
W u
g <t!
rT1 r-j
(J J
w
w1?
u o
i^C
PM fcl
EH O
fa CO
f-N
CO rH
W EH
t-3 K
< EH
cn MO
rH SO
^
CO •
^J1 CM
rH rH
1 1
^ in
CO
1 CM
\ w
0 J
o CQ
^ S
i EH
FT"!
• *
0)
o
H
O
CO
\
s
x
s-l
o
4->
U
0)
rH
, 1
1 1
O
O
U.
r-
•r
S'
e
Si
u:
-H
14
M
fl3
0)
>.
O
en
CO
CO
rH
0
CM
O
<tf
rH
0
cn
CO
00
^
CO
in
o
cn
rH
o
in
f~»
•
r-
rH
CO
cn
rH
^^^
J ,)
<H
o
H
o
cn
^
CO
o
in
rH
O
U3
rH
O
in
CM
^
^
rH
in
O
in
CM
0
Ln
CO
•
00
rH
CO
cn
rH
'V.
1 >
IH
in
rH
rH
cn
cn
^
o
rH
CM
0
rH
rH
O
U3
rH
^
CO
CO
CO
0
^
rH
O
^
CM
•
^
rH
CO
cn
rH
N^
1}
<H
o
CM
in
VD
CM
rH
rH
CO
O
O
cn
rH
O
CO
cn
0
<£>
f-
f**.
C"^
o
v£»
0
o
0
in
•
in
CM
CO
cn
rH
*Xw
Ltj
MH
0
rH
CO
in
in
CM
rH
VD
0
cp
CO
o
o
00
00
Q
cn
CO
vb
o
c?
cn
rH
o
rH
00
1*
^•Q
CM
CO
cn
rH
"sj
1 j
m
in
i-H
f.
^
CO
CM
rH
m
O
O
rH
CM
O
•*
cn
0
rH
CO
o
t—
o
o
0
rH
rH
•
in
CM
CO
cn
rH
I \
MH
o
CM
CO
cn
rH
cn
^
rH
II
•vt<
03
O
O
o
O
w
67
image:
H
EH ^
tt 0
•3 <<
PT"] fxj
1-1 1-4
fC
tt 1
o o
^L
pq £n
H O
fri U)
O S
£5
CO rH
M EH
i— 1 K
H
W O
s o
*
rH
rH
1
in
*
CM
a
CQ
F^
H
-J
^s^
S
c/;
i —
<
•r
2
£
*
O
W
"1
N
Lj
\
SH
O
4-^ £_|
U nJ
0) 0)
r— I
0
o
T-l ^ LO O
vO CO *«0 C?
rH
in rH rH -^
CO CM O in
• . . .
0 0 CM rH
^O C^ ^d^ r**'
co co co in
o o o o
CO
o co r- co
* • • •
CM rH 0 rH
in in cn in
o o in cn
• • • •
o o o o
V V
C-- co rji co
CO CM ^i -^
^O ^O 00 C***
^^1 *5^ ^^4 c~ 3
O O O rH
<^ 00 VO CO
CM rH rH CM
• • * *
0 0 0 O
•* O CO rH
• • • •
O f- i-H O
rH rH CM CO
rH rH CM CM
CO CO 00 CO
cn cn cn cn
rH rH rH rH
-p -[_) | i _[_>
ij i ii i 1 1 i ii i
m LO in in
rH rH
w
W u
g <t!
rT1 r-j
(J J
w
w1?
u o
i^C
PM fcl
EH O
fa CO
f-N
CO rH
W EH
t-3 K
< EH
cn MO
rH SO
^
CO •
^J1 CM
rH rH
1 1
^ in
CO
1 CM
\ w
0 J
o CQ
^ S
i EH
FT"!
• *
0)
o
H
O
CO
\
s
x
s-l
o
4->
U
0)
rH
, 1
1 1
O
O
U.
r-
•r
S'
e
Si
u:
-H
14
M
fl3
0)
>.
O
en
CO
CO
rH
0
CM
O
<tf
rH
0
cn
CO
00
^
CO
in
o
cn
rH
o
in
f~»
•
r-
rH
CO
cn
rH
^^^
J ,)
<H
o
H
o
cn
^
CO
o
in
rH
O
U3
rH
O
in
CM
^
^
rH
in
O
in
CM
0
Ln
CO
•
00
rH
CO
cn
rH
'V.
1 >
IH
in
rH
rH
cn
cn
^
o
rH
CM
0
rH
rH
O
U3
rH
^
CO
CO
CO
0
^
rH
O
^
CM
•
^
rH
CO
cn
rH
N^
1}
<H
o
CM
in
VD
CM
rH
rH
CO
O
O
cn
rH
O
CO
cn
0
<£>
f-
f**.
C"^
o
v£»
0
o
0
in
•
in
CM
CO
cn
rH
*Xw
Ltj
MH
0
rH
CO
in
in
CM
rH
VD
0
cp
CO
o
o
00
00
Q
cn
CO
vb
o
c?
cn
rH
o
rH
00
1*
^•Q
CM
CO
cn
rH
"sj
1 j
m
in
i-H
f.
^
CO
CM
rH
m
O
O
rH
CM
O
•*
cn
0
rH
CO
o
t—
o
o
0
rH
rH
•
in
CM
CO
cn
rH
I \
MH
o
CM
CO
cn
rH
cn
^
rH
II
•vt<
03
O
O
o
O
w
67
image:
 TABLE 2.5-13. MAXIMUM OBSERVED CONCENTRATIONS
IN RAW SHALE LEACHATES
Concentration,
Species
HC03
C03
TDS
F
Cl
P04
N03
S04
Zn
Fe
Co
Li
NH3
B
Cd
Be
Mg
P
Si
Mo
Mn
Ni
Na
Cu
Al
Ca
Ba
K
Cr
Sr
Pb
Ag
Ti
Se
As
Hg
Source :
mg/L
579
5
72,660
113
366
0
2,564
45,900
0
2
1
0
2
I
0
0
12,830
7
13
1
2
1
2,030
0
5
505
0
16
0
15
1
0
0
0
0
0
.68
.28
.597
.02
.17
.339
.55
.97
.168
.300
.0
.2
.5
.34 ;
.12
.073
.28
.822
.4
.290
.4
.036 ;
.012
.007
.013
.007
.003 1
EPA-600/D-84-143 ,
68
Location
C-a,
C-a,
C-a,
C-a,
C-a,
C-b,
C-a,
C-a,
C-a,
C-a,
C-a,
C-b,
w"" a. /
C-b,
C-a,
C-b,
C-a,
C-a,
C-a,
C-b,
C-a,
C-a,
C-a,
C-b,
C-a,
C-a,
C-b,
V*™" Q. f
C-a,
C-a,
C-a,
C-a,
C-a,
C-a,
C-b,
C-b,
1984
15
15
15
15
15
20
15
15
15
15
15
10
5
15
15
10
15
15
15
10
15
15
15
10
5
15
10
15
15
15
15
15
15
15
20
20
ft
ft
ft
ft
ft
ft
ft
ft
ft
ft
ft
ft
ft
ft
ft
ft
ft
ft
ft
ft
ft
ft
ft
ft
ft
ft
ft
ft
ft
ft
ft
ft
ft
ft
ft
ft
Date
9/21/82
7/19/82
8/16/82
7/26/82
7/01/82
2/25/82
7/26/82
5/10/82
8/16/82
8/11/82
8/23/82
7/26/82
8/30/82
7/26/82
7/26/82
7/06/82
9/06/82
8/04/82
6/02/82
7/06/82
6/02/82
6/02/82
8/02/82
7/06/82
7/01/82
3/22/82
9/23/82
7/19/82
6/02/82
7/19/82
8/11/82
3/17/82
4/12/82
7/01/82
8/04/82
2/25/82
1
I
1
.
•
H
1
1
..
f
1
I
I
1
image:
TABLE 2.5-13. MAXIMUM OBSERVED CONCENTRATIONS
IN RAW SHALE LEACHATES
Concentration,
Species
HC03
C03
TDS
F
Cl
P04
N03
S04
Zn
Fe
Co
Li
NH3
B
Cd
Be
Mg
P
Si
Mo
Mn
Ni
Na
Cu
Al
Ca
Ba
K
Cr
Sr
Pb
Ag
Ti
Se
As
Hg
Source :
mg/L
579
5
72,660
113
366
0
2,564
45,900
0
2
1
0
2
I
0
0
12,830
7
13
1
2
1
2,030
0
5
505
0
16
0
15
1
0
0
0
0
0
.68
.28
.597
.02
.17
.339
.55
.97
.168
.300
.0
.2
.5
.34 ;
.12
.073
.28
.822
.4
.290
.4
.036 ;
.012
.007
.013
.007
.003 1
EPA-600/D-84-143 ,
68
Location
C-a,
C-a,
C-a,
C-a,
C-a,
C-b,
C-a,
C-a,
C-a,
C-a,
C-a,
C-b,
w"" a. /
C-b,
C-a,
C-b,
C-a,
C-a,
C-a,
C-b,
C-a,
C-a,
C-a,
C-b,
C-a,
C-a,
C-b,
V*™" Q. f
C-a,
C-a,
C-a,
C-a,
C-a,
C-a,
C-b,
C-b,
1984
15
15
15
15
15
20
15
15
15
15
15
10
5
15
15
10
15
15
15
10
15
15
15
10
5
15
10
15
15
15
15
15
15
15
20
20
ft
ft
ft
ft
ft
ft
ft
ft
ft
ft
ft
ft
ft
ft
ft
ft
ft
ft
ft
ft
ft
ft
ft
ft
ft
ft
ft
ft
ft
ft
ft
ft
ft
ft
ft
ft
Date
9/21/82
7/19/82
8/16/82
7/26/82
7/01/82
2/25/82
7/26/82
5/10/82
8/16/82
8/11/82
8/23/82
7/26/82
8/30/82
7/26/82
7/26/82
7/06/82
9/06/82
8/04/82
6/02/82
7/06/82
6/02/82
6/02/82
8/02/82
7/06/82
7/01/82
3/22/82
9/23/82
7/19/82
6/02/82
7/19/82
8/11/82
3/17/82
4/12/82
7/01/82
8/04/82
2/25/82
1
I
1
.
•
H
1
1
..
f
1
I
I
1
image:
 SECTION 3 ;
SOLID WASTES AND THEIR CHARACTERISTICS :
FOR OIL SHALE RETORTING PROCESSES .
3.1 LURGI-RUHRGAS OIL SHALE RETORTING j
3.1.1 Retorting Operation i
A schematic for the Lurgi retorting process [EPA-600/8-83-005,
1983] is shown in Figure 3.1-1. Initial crushing !in the pit
reduces the size of the run-of-mine shale to minus 8 inches.
Secondary and tertiary crushing further reduce the shale size to
minus 1/4 to 1/3 inches. The crushed oil shale is fed through a
feed hopper to a double screw mixer, where four to eight times its
weight of a hot (1,200-1,300°F) circulating heat carrier, such as
sand or processed shale from the collecting bin, is thoroughly
mixed in, thus heating the entire mixture to approximately
950-1,000°F within a few seconds. At this temperature, pyrolysis
of the kerogen in the oil shale occurs, resulting in the
production of retort gas, shale oil vapor and water vapor.
!
The circulating heat carrier and the partially retorted shale are
then dropped from the screw mixer into the surge vessel, where
residual oil components are distilled off. The mixture of heat
carrier and retorted shale residue is passed to the lower section
of the lift pipe, where combustion air (preheated to 450-900°F) is
introduced, raising the mixture pneumatically to the collecting
bin. Essentially all available organic carbon contained in the
retorted shale residue is burned in the lift pipe. Supplemental
fuel may be added to the bottom of the lift pipe to i sustain the
combustion of the organic residue when processing ; leaner oil
shales. Also, at the high lift pipe temperature, \ a moderate
amount of carbonate decomposition occurs in the processed shale.
At the top of the lift pipe, the hot, burned shale is separated
from the flue gases in the collecting bin. Fines arejcarried out
of the collecting bin with the flue gas stream. The coarse-
grained shale residue accumulates in the lower section of the
collecting bin and flows continuously to the mixer. Partial
removal of the solids to prevent accumulation in the collecting
bin may be required if the fines carry-over is not I sufficient.
The combustion air supplied to the lift pipe is preheated by
counter-current heat exchange with the flue gas stream in the
preheat section of the waste heat boiler. The calcined minerals
69
image:
SECTION 3 ;
SOLID WASTES AND THEIR CHARACTERISTICS :
FOR OIL SHALE RETORTING PROCESSES .
3.1 LURGI-RUHRGAS OIL SHALE RETORTING j
3.1.1 Retorting Operation i
A schematic for the Lurgi retorting process [EPA-600/8-83-005,
1983] is shown in Figure 3.1-1. Initial crushing !in the pit
reduces the size of the run-of-mine shale to minus 8 inches.
Secondary and tertiary crushing further reduce the shale size to
minus 1/4 to 1/3 inches. The crushed oil shale is fed through a
feed hopper to a double screw mixer, where four to eight times its
weight of a hot (1,200-1,300°F) circulating heat carrier, such as
sand or processed shale from the collecting bin, is thoroughly
mixed in, thus heating the entire mixture to approximately
950-1,000°F within a few seconds. At this temperature, pyrolysis
of the kerogen in the oil shale occurs, resulting in the
production of retort gas, shale oil vapor and water vapor.
!
The circulating heat carrier and the partially retorted shale are
then dropped from the screw mixer into the surge vessel, where
residual oil components are distilled off. The mixture of heat
carrier and retorted shale residue is passed to the lower section
of the lift pipe, where combustion air (preheated to 450-900°F) is
introduced, raising the mixture pneumatically to the collecting
bin. Essentially all available organic carbon contained in the
retorted shale residue is burned in the lift pipe. Supplemental
fuel may be added to the bottom of the lift pipe to i sustain the
combustion of the organic residue when processing ; leaner oil
shales. Also, at the high lift pipe temperature, \ a moderate
amount of carbonate decomposition occurs in the processed shale.
At the top of the lift pipe, the hot, burned shale is separated
from the flue gases in the collecting bin. Fines arejcarried out
of the collecting bin with the flue gas stream. The coarse-
grained shale residue accumulates in the lower section of the
collecting bin and flows continuously to the mixer. Partial
removal of the solids to prevent accumulation in the collecting
bin may be required if the fines carry-over is not I sufficient.
The combustion air supplied to the lift pipe is preheated by
counter-current heat exchange with the flue gas stream in the
preheat section of the waste heat boiler. The calcined minerals
69
image:
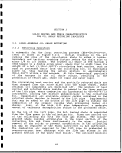 £
UI
o
UJ
a:
_i
5
o
s
ELECTROSTATIC
PRECIPITATOR
CO
(1)
U
O
B1
-H
4J
M
cu
M
QJ
CO
•H ro
o co
CT>
W rH
in
O
o
•H CO
t^ II
M CO
3 X
•J O
o
I &J
rH W
n
«4
<U 0)
M U
&H
js
•H O
1
I
i
I
1
70
I
1
1
I
f
t
I
1
I
I
I
I
I
image:
£
UI
o
UJ
a:
_i
5
o
s
ELECTROSTATIC
PRECIPITATOR
CO
(1)
U
O
B1
-H
4J
M
cu
M
QJ
CO
•H ro
o co
CT>
W rH
in
O
o
•H CO
t^ II
M CO
3 X
•J O
o
I &J
rH W
n
«4
<U 0)
M U
&H
js
•H O
1
I
i
I
1
70
I
1
1
I
f
t
I
1
I
I
I
I
I
image:
 in the burned shale combine with the sulfur dioxide \produced by
combustion of the organic sulfur to form calcium arid magnesium
sulfites and sulfates. ;
The pyrolysis products stream containing shale fines is withdrawn
at the end of the screw mixer and passed through two ^series-con-
nected cyclones to a product recovery section. The fines are
separated in these cyclones and returned to the recycle system.
The vapor stream then passes through a sequence of three scrubb-
ing coolers (not shown). The first scrubbing cooler removes dust
from the gas stream by condensation of heavier oil fractions. A
dusty heavy oil is obtained at this point. In the next scrubbing
cooler, further condensation of the oil takes place at a temper-
ature above the dew point of water to produce a water-free middle
oil. Final cooling of the gas produces an aqueous gas condensate
and a light oil fraction. The light oil is separated from the
condensate or gas liquor in an oil/water separator, finally, the
gas is scrubbed with a lean oil in the naphtha scrubber to recover
naphtha and noncondensable gases, as deemed desirable. \
i
The flue gas stream in the lift pipe is dedusted in a cyclone
after leaving the collecting bin; the dust is routed to the pro-
cessed shale mixer. The gas stream is then routed through a heat
exchcinger for preheating of combustion air, a waste heat boiler to
produce process steam, another cyclone, and a humidifier or flue
gas conditioner. Additional dust removed by the waste :heat boiler
and cyclone are routed to the processed shale mixer. The flue gas
stream is cooled somewhat and conditioned in the humidifier by
adding steam generated during processed shale quenching. After
humiclifi cation and cooling, residual dust is removed fr|om the flue '
gas stream using an electrostatic precipitator and discharged into
a processed shale quencher/moisturizer where more water is added
to cool the solids. The processed shale residue, cooled to ~200°F,
is moisturized to a suitable moisture content and discarded as
open pit backfill. j
3.1.2 Solid Wastes i
i
A block flow diagram for the basic processing and pollution con-
trol system for the Lurgi process is presented in Figure 3.1-2.
In the retort off-gas discharge system, the flue gas and entrained
processed shale particles are separated from each other via a
series of cyclones, waste heat recovery system, humidifier, etc.
The flue gas is then passed through an electrostatic precipitator
to remove the residual particulates and is eventually vented to
the atmosphere. The processed shale particulates separated along
these steps is sent to the processed shale mixer for quenching and
proper moisturizing before final disposal. !
The retort gas is cleaned for marketing. The gas is ; first com-
pressed to remove much of the moisture and ammonia, theri subjected
71
image:
in the burned shale combine with the sulfur dioxide \produced by
combustion of the organic sulfur to form calcium arid magnesium
sulfites and sulfates. ;
The pyrolysis products stream containing shale fines is withdrawn
at the end of the screw mixer and passed through two ^series-con-
nected cyclones to a product recovery section. The fines are
separated in these cyclones and returned to the recycle system.
The vapor stream then passes through a sequence of three scrubb-
ing coolers (not shown). The first scrubbing cooler removes dust
from the gas stream by condensation of heavier oil fractions. A
dusty heavy oil is obtained at this point. In the next scrubbing
cooler, further condensation of the oil takes place at a temper-
ature above the dew point of water to produce a water-free middle
oil. Final cooling of the gas produces an aqueous gas condensate
and a light oil fraction. The light oil is separated from the
condensate or gas liquor in an oil/water separator, finally, the
gas is scrubbed with a lean oil in the naphtha scrubber to recover
naphtha and noncondensable gases, as deemed desirable. \
i
The flue gas stream in the lift pipe is dedusted in a cyclone
after leaving the collecting bin; the dust is routed to the pro-
cessed shale mixer. The gas stream is then routed through a heat
exchcinger for preheating of combustion air, a waste heat boiler to
produce process steam, another cyclone, and a humidifier or flue
gas conditioner. Additional dust removed by the waste :heat boiler
and cyclone are routed to the processed shale mixer. The flue gas
stream is cooled somewhat and conditioned in the humidifier by
adding steam generated during processed shale quenching. After
humiclifi cation and cooling, residual dust is removed fr|om the flue '
gas stream using an electrostatic precipitator and discharged into
a processed shale quencher/moisturizer where more water is added
to cool the solids. The processed shale residue, cooled to ~200°F,
is moisturized to a suitable moisture content and discarded as
open pit backfill. j
3.1.2 Solid Wastes i
i
A block flow diagram for the basic processing and pollution con-
trol system for the Lurgi process is presented in Figure 3.1-2.
In the retort off-gas discharge system, the flue gas and entrained
processed shale particles are separated from each other via a
series of cyclones, waste heat recovery system, humidifier, etc.
The flue gas is then passed through an electrostatic precipitator
to remove the residual particulates and is eventually vented to
the atmosphere. The processed shale particulates separated along
these steps is sent to the processed shale mixer for quenching and
proper moisturizing before final disposal. !
The retort gas is cleaned for marketing. The gas is ; first com-
pressed to remove much of the moisture and ammonia, theri subjected
71
image:
 10
CO
rd
T)
C
a
o
-H
•P
«J
M
0) CO
W
[fl ^
0) Lf)
U O
O O
CO
CO I
<d oo
Cr> i
M 00
,3X
E3 O
»S O
H
• o
ro w
0)
§>
•H
72
I
I
I
1
I
I
I
I
1
I
I
1
I
I
i
l
1
l
i
image:
10
CO
rd
T)
C
a
o
-H
•P
«J
M
0) CO
W
[fl ^
0) Lf)
U O
O O
CO
CO I
<d oo
Cr> i
M 00
,3X
E3 O
»S O
H
• o
ro w
0)
§>
•H
72
I
I
I
1
I
I
I
I
1
I
I
1
I
I
i
l
1
l
i
image:
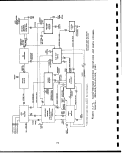 to treatment by diethanolamine and triethylene glycoli, which re-
move the acidic components and the residual moisture,!respective-
ly, from the compressed gas. The clean, dry gas is then sent to
the pipeline. A small amount of spent amines are generated in
this process, which are disposed with the processed shale. How-
ever, the spent amine is less than 1% of the processed|shale mass.
The acid gas obtained from the diethanolamine regeneration is
treated by the Stretford process, which converts the; H^S in the
gas to elemental sulfur. The clean gas is then vented to the
atmosphere. Spent Stretford liquor could be reclaimed on site or
sent off site for reclamation.
The gas liquor from the oil and gas recovery section is subjected
to oil/water separation, but it still contains dissolved ammonia
and sulfur compounds and its direct discharge or use may also cre-
ate pollution. Therefore, the ammonia and dissolved volatile com-
pounds from the liquor are removed by an ammonia recovery process.
The treated water is then used for processed shale moisturizing.
Overall water management activities consist of satisfying the pro-
cess steam and cooling water needs, as well as efficient manage-
ment of the aqueous waste effluents. Properly treated mine water
is .used as the boiler feedwater to produce the steam in the Lurgi
waste heat recovery boiler. Treated mine water is also used as
cooling water, process makeup water, cooling tower makeup water,
etc. Minor wastes generated from the water treatments are equal-
ized in a holding pond and then used for processed shale moistur-
izing.
Table 3.1-1 summarizes the final waste streams and the iintermediate
streams which make-up the final waste streams. These streams were
identified in Figure 3.1-2. The subgrade ore, overburden, and
processed shale (streams 2, 3, and 29) constitute the majority of
the wastes (greater than 97% of solid wastes). Several waste-
waters, such as equalization pond discharge, treated sanitary
wastewater, clarified mine water, and oil/water separator dis-
charge, are used to moisturize the processed shale. j
Table 3.1-1 also describes the general composition of these
streeims and component mass flow rate. Of the If inal -waste
streeims, the processed shale represents more than 50% of the
total volume. The components of concern and the composition
of the solid waste streams show that for all the waste streams
the leachable salts are of primary concern. The water for dust
control and revegetation (streams 90 and 91) has a isignificant
solids concentration which may contribute to salt leaching or met-
als leaching. Also of concern are the organics in the processed
shale (generated from both the unburned hydrocarbons in the pro-
cessed shale as well as from the moisturizing water (stream 73),
and the sludges to be added to the solid waste pile. 1
73
image:
to treatment by diethanolamine and triethylene glycoli, which re-
move the acidic components and the residual moisture,!respective-
ly, from the compressed gas. The clean, dry gas is then sent to
the pipeline. A small amount of spent amines are generated in
this process, which are disposed with the processed shale. How-
ever, the spent amine is less than 1% of the processed|shale mass.
The acid gas obtained from the diethanolamine regeneration is
treated by the Stretford process, which converts the; H^S in the
gas to elemental sulfur. The clean gas is then vented to the
atmosphere. Spent Stretford liquor could be reclaimed on site or
sent off site for reclamation.
The gas liquor from the oil and gas recovery section is subjected
to oil/water separation, but it still contains dissolved ammonia
and sulfur compounds and its direct discharge or use may also cre-
ate pollution. Therefore, the ammonia and dissolved volatile com-
pounds from the liquor are removed by an ammonia recovery process.
The treated water is then used for processed shale moisturizing.
Overall water management activities consist of satisfying the pro-
cess steam and cooling water needs, as well as efficient manage-
ment of the aqueous waste effluents. Properly treated mine water
is .used as the boiler feedwater to produce the steam in the Lurgi
waste heat recovery boiler. Treated mine water is also used as
cooling water, process makeup water, cooling tower makeup water,
etc. Minor wastes generated from the water treatments are equal-
ized in a holding pond and then used for processed shale moistur-
izing.
Table 3.1-1 summarizes the final waste streams and the iintermediate
streams which make-up the final waste streams. These streams were
identified in Figure 3.1-2. The subgrade ore, overburden, and
processed shale (streams 2, 3, and 29) constitute the majority of
the wastes (greater than 97% of solid wastes). Several waste-
waters, such as equalization pond discharge, treated sanitary
wastewater, clarified mine water, and oil/water separator dis-
charge, are used to moisturize the processed shale. j
Table 3.1-1 also describes the general composition of these
streeims and component mass flow rate. Of the If inal -waste
streeims, the processed shale represents more than 50% of the
total volume. The components of concern and the composition
of the solid waste streams show that for all the waste streams
the leachable salts are of primary concern. The water for dust
control and revegetation (streams 90 and 91) has a isignificant
solids concentration which may contribute to salt leaching or met-
als leaching. Also of concern are the organics in the processed
shale (generated from both the unburned hydrocarbons in the pro-
cessed shale as well as from the moisturizing water (stream 73),
and the sludges to be added to the solid waste pile. 1
73
image:
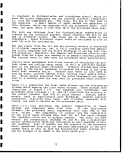 1
I
Sanitary wastewater treatment and aerated pond sludges although *
not determined, can be estimated to be 0.5 Ib/hr based on 18 gpm
influent rate, a typical TSS concentration of 250 mg/L, and a •
treatment efficiency of 75%. Thus, at 0.5 Ib/hr these sludges If
are of insignificant weight compared to the processed shale rates.
However, the solids from sanitary wastewater treatment and sludges
may pose special health risks and should not be dismissed lightly.
1
The rate of spent amine is difficult to estimate as the influent _
rate of rich amine and efficiency of the amine regenerator are •
unnerta in. ™
uncertain.
3.1.3 Characteristics of Solid Wastes
I
Tables 3.1-2 to 3.1-6 provide additional information on the com-
position of the processed moisturized shale (stream 29). The •*
nominal feed size of the particles associated with the Lurgi •
retorting process is less then 0.6 cm. As seen in Tables 3.1-2 ™
and 3.1-3, properly moistened and compacted processed shale has
low permeability; therefore, actual field leaching may not be
represented by laboratory column leaching experiments. The results
of column leaching and various other experiments performed on the
processed shale are given in Tables 3.1-7 to 3.1-12. Some soluble
elements are reported as their oxides.
74
I
I
I
1
I
I
i
i
i
i
i
image:
1
I
Sanitary wastewater treatment and aerated pond sludges although *
not determined, can be estimated to be 0.5 Ib/hr based on 18 gpm
influent rate, a typical TSS concentration of 250 mg/L, and a •
treatment efficiency of 75%. Thus, at 0.5 Ib/hr these sludges If
are of insignificant weight compared to the processed shale rates.
However, the solids from sanitary wastewater treatment and sludges
may pose special health risks and should not be dismissed lightly.
1
The rate of spent amine is difficult to estimate as the influent _
rate of rich amine and efficiency of the amine regenerator are •
unnerta in. ™
uncertain.
3.1.3 Characteristics of Solid Wastes
I
Tables 3.1-2 to 3.1-6 provide additional information on the com-
position of the processed moisturized shale (stream 29). The •*
nominal feed size of the particles associated with the Lurgi •
retorting process is less then 0.6 cm. As seen in Tables 3.1-2 ™
and 3.1-3, properly moistened and compacted processed shale has
low permeability; therefore, actual field leaching may not be
represented by laboratory column leaching experiments. The results
of column leaching and various other experiments performed on the
processed shale are given in Tables 3.1-7 to 3.1-12. Some soluble
elements are reported as their oxides.
74
I
I
I
1
I
I
i
i
i
i
i
image:
 CO
< I1O
CO
fe W
O O
Q («
W (i.
CO
O co *-*•
PL, < £
co O 0
t-H PH -H
Q E U 4->
b u
Mr*j —^
K 3
cq i -O
n O
O O SH
*g*
co i-q M
<3 M o
W ffl
K EH 4->
H H (U
I-H
fe Q
O M co
H PH
£M CO CQ
0 3: o
HO
a Q o
£x3 f— \ *»
p> t-Il PQ
3 O vO
w CO >—
rH
1
'
w
ff)
f^
EH
JQ
U*
ssL
§K .
^
03 U
C <
§<!
o c
r- f
<O U
U <4H 4-1 O
•i O O fl
,
o .c
"- -Q E
« C
01 n x—
re o
!C •— i
E
(C
£
U]
o
c
.3
O
•H
U
10
4>
e -
2 •§
to c
4)
u
O 4) 0) T3 T3
^ (-H j- a) 4, jj
Q,-< *J ^ ki u
O i-H 3
41 l-i J3 O O T3
J3 4J 4-> U 4J 4)
4J C -H +J L. .
^ p S C T3 w
.C U O V *O -M
•*-• UH o N i—i ^H
•H W O -H 3 «J
3 -H W I- O W
T3 -H ^ _g
'wo* « 4J w m
O C tA O> W O
•H O C -H Ul
"O -G D.-H O C at
0) n MA s 0 C
W 3 -H W -H -H
0 U -O 3 >,4J js
Q. O IM rH U O
•HE *c ° i- »o (0
T3 5 (OS Q. |*»H
1-4 o o o
T» *« TJ U 2 U 41
c at 4-1 a, u
« -U J=^ *!- fi
W W 4-> U) 4) 4)
'OS 3 W -H D.^
4) *O ki 3 ff
•C U Q 4) U >
wai fH a, >,
3 .C W (8 Jj
I- H -H • J3 -H
O • 41 • W • i— f
•H4)W -O^W 'So'^
4ICOO 3 O UV)EJ
i-js^jaTJ^: 4i«2
O Wl Q1 U4)0t U-H4)
|-gJS §82 £1^
S u"3 H a'S fi-8 S
o o o o
i/> r- co o
M M o%
CO
rsj
.3
w tn to 10
5 5 5 w
•3 -3 -33
U O U (0
•H -tH -rt j3
*J *J *J t>
<0 (0 its fli
CU &* fl* i-J
03 IT) rj»
ui o r*
<*I U1)
CM IT) f»1
cn r^. n
m CT*
<o
m
*a
a>
w
4}
U
O
W rt.
i g *
41 *a 4>
4 U C
O Li m
III
eg m CT»
j->
i
*j
(0
4>
i_i
4->
U
0)
4J
to
3
>i
u
5
•H
C
(0
VI
fli
3
S,
41
>
.**
U
C
•H
S
•H
ii-1
•H
4J
U
4)
<4-»
<0
in
4J
(13
E
*O
4>
N
•H
*O
•H
.3
ja
u
§
Ul
e
•H
03
O
IM
a
U
a
4J
c
4)
tn
to
•H
4J
t-H
U)
4J
i-H
(0 .
(0
N
•i-(
U
3
4J
Ul
•H
O
4J
Li
O
•H
U
a
w
w
4)
g
Lt
41
C
•H
s
4)
13
1
(D
3
Ul
•H
g
1
*3
C 41
4) .C •
4-)
<4-l
O
U)
Ul
•rt
Li
H
jj
4)
-1
•H
O
O
c
•H
N
•H
Li
S
U)
L.
§
cr
•H
Hi
Ul
S
I
c
•H
(0
•H
i
§•
-H
f-t
•s
a. CP
a a
•H -H
Li N
4J
en
4J
g
5
cu
«
•H
-H
Li
S
U3
•H
Q
S
4)
rH
S
U)
*O
§
-S
4-1
U
•S-i
•SJi
•H (0
iH 4)
CJ Ul
-H
tJ
4f
•H
d
<M
S
"D
3
r— t
1
c
1
4)
4->
e
1
•-*
4)
X
H
O 4_)
C CO
"H -H
•al
4)
4J (Q
4) X
Ul t/1
4)
rH
m
-g
4)
a.
CO
E
*O
0)
•H
*M
-H
L,
10
rH
U
•H
4)
Ul
3
41
L>
£
4f
J3
Ul
•o
4)
U)
VI
4)
U
£
a
•g ±1
«s c
•H
4)
4) -O
4) >
J= O
£-• U
u
ti
a.
Li
O
•s
U]
3
(U 5
D> e
<l> 5
> (0
-a
S
§4J
W
CT "O
U (O -H rH lo
75
image:
CO
< I1O
CO
fe W
O O
Q («
W (i.
CO
O co *-*•
PL, < £
co O 0
t-H PH -H
Q E U 4->
b u
Mr*j —^
K 3
cq i -O
n O
O O SH
*g*
co i-q M
<3 M o
W ffl
K EH 4->
H H (U
I-H
fe Q
O M co
H PH
£M CO CQ
0 3: o
HO
a Q o
£x3 f— \ *»
p> t-Il PQ
3 O vO
w CO >—
rH
1
'
w
ff)
f^
EH
JQ
U*
ssL
§K .
^
03 U
C <
§<!
o c
r- f
<O U
U <4H 4-1 O
•i O O fl
,
o .c
"- -Q E
« C
01 n x—
re o
!C •— i
E
(C
£
U]
o
c
.3
O
•H
U
10
4>
e -
2 •§
to c
4)
u
O 4) 0) T3 T3
^ (-H j- a) 4, jj
Q,-< *J ^ ki u
O i-H 3
41 l-i J3 O O T3
J3 4J 4-> U 4J 4)
4J C -H +J L. .
^ p S C T3 w
.C U O V *O -M
•*-• UH o N i—i ^H
•H W O -H 3 «J
3 -H W I- O W
T3 -H ^ _g
'wo* « 4J w m
O C tA O> W O
•H O C -H Ul
"O -G D.-H O C at
0) n MA s 0 C
W 3 -H W -H -H
0 U -O 3 >,4J js
Q. O IM rH U O
•HE *c ° i- »o (0
T3 5 (OS Q. |*»H
1-4 o o o
T» *« TJ U 2 U 41
c at 4-1 a, u
« -U J=^ *!- fi
W W 4-> U) 4) 4)
'OS 3 W -H D.^
4) *O ki 3 ff
•C U Q 4) U >
wai fH a, >,
3 .C W (8 Jj
I- H -H • J3 -H
O • 41 • W • i— f
•H4)W -O^W 'So'^
4ICOO 3 O UV)EJ
i-js^jaTJ^: 4i«2
O Wl Q1 U4)0t U-H4)
|-gJS §82 £1^
S u"3 H a'S fi-8 S
o o o o
i/> r- co o
M M o%
CO
rsj
.3
w tn to 10
5 5 5 w
•3 -3 -33
U O U (0
•H -tH -rt j3
*J *J *J t>
<0 (0 its fli
CU &* fl* i-J
03 IT) rj»
ui o r*
<*I U1)
CM IT) f»1
cn r^. n
m CT*
<o
m
*a
a>
w
4}
U
O
W rt.
i g *
41 *a 4>
4 U C
O Li m
III
eg m CT»
j->
i
*j
(0
4>
i_i
4->
U
0)
4J
to
3
>i
u
5
•H
C
(0
VI
fli
3
S,
41
>
.**
U
C
•H
S
•H
ii-1
•H
4J
U
4)
<4-»
<0
in
4J
(13
E
*O
4>
N
•H
*O
•H
.3
ja
u
§
Ul
e
•H
03
O
IM
a
U
a
4J
c
4)
tn
to
•H
4J
t-H
U)
4J
i-H
(0 .
(0
N
•i-(
U
3
4J
Ul
•H
O
4J
Li
O
•H
U
a
w
w
4)
g
Lt
41
C
•H
s
4)
13
1
(D
3
Ul
•H
g
1
*3
C 41
4) .C •
4-)
<4-l
O
U)
Ul
•rt
Li
H
jj
4)
-1
•H
O
O
c
•H
N
•H
Li
S
U)
L.
§
cr
•H
Hi
Ul
S
I
c
•H
(0
•H
i
§•
-H
f-t
•s
a. CP
a a
•H -H
Li N
4J
en
4J
g
5
cu
«
•H
-H
Li
S
U3
•H
Q
S
4)
rH
S
U)
*O
§
-S
4-1
U
•S-i
•SJi
•H (0
iH 4)
CJ Ul
-H
tJ
4f
•H
d
<M
S
"D
3
r— t
1
c
1
4)
4->
e
1
•-*
4)
X
H
O 4_)
C CO
"H -H
•al
4)
4J (Q
4) X
Ul t/1
4)
rH
m
-g
4)
a.
CO
E
*O
0)
•H
*M
-H
L,
10
rH
U
•H
4)
Ul
3
41
L>
£
4f
J3
Ul
•o
4)
U)
VI
4)
U
£
a
•g ±1
«s c
•H
4)
4) -O
4) >
J= O
£-• U
u
ti
a.
Li
O
•s
U]
3
(U 5
D> e
<l> 5
> (0
-a
S
§4J
W
CT "O
U (O -H rH lo
75
image:
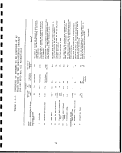 *«^*
-d
OJ
_3
-H
•y
a
o
u
*****
1
1
rH
*
CO
W
PQ
s
H
W
Jtf
L>
I
cc
UH
o »
iL
U^ O "-x.
U9 Q *™
ra u
32
in c
i |
fu
U-l
U 0
4-»
C rH
<u ra w
u w 4-1 tn
L. o O eg
O> 4-1 E
&.
1^-
*" 5 S
w 8
ra o
S -<
QJ
V)
Description of
re
g L.
re 0)
41 Xt
il
to c
u
o
t)
u •
in cn
3 C
•H
TO M
C -H
co L.
3
TO 4J
at to
XJ E
8|
•s
1!
4f 41
is §-
M
OJ
0* CO
(O VI
3
tn tn
re w
3 4T
u
tn o
I*
> UH
a
s»
tn
a
i
101
K
in
3 01
C rH
•H ro
e Streams (cont
al processed sh
oistening water
4J E
( O
CO
3 ""
rH
LI re
•H x:
re i in
o
TO i- TO
Of CU V
•ri in
UH TO in
•H Li 0>
TO O L)
••H U4 O
g 4-> L.
JT L>
4J C
0) W -r*
tD TO TO
C 01
.5^3
TO i- tn
O* W -H
tn >
D O C
O 3
Ol -H »
4-1 O O
Q rH
5 tli XI
C -C C
•rl C H -r*
E *H N
•H
TO W ' L.
0> L. Ul 3
4-1 QJ OJ 4->
CO rH UI «
Lt O 0> O
H U U E
cr»
t~*
i
\D
V
rH
O
U
•H
re
TO C
•H S
•rl rH
JXi
«-i
ro
x;
in
re
i
u
4J
U
Li
H
E
O
UH
1
TO
4>
CO >i
TO
4-1 4->
•s"
0) Ol
4-1 4-1
11
jrt1
iJ «-3 ij
111
Cn rH
^
CO
in cj w
a o :n
H Q S
,
o
p»
shale leachate
re
cc
O)
i
o
Li
O.
£
13
Of
in
3
•a
c
re
Ol
4->
u
0)
rH •
rH Cn
0 C
U -rl
N
tn -H
•H Li
L. 4-1
0) in
re o
UH OJ
11
Li
gl
4-» 4>
tn u
Ct
d
s:
i
o
in
UH
o
c
E
O
4-1
W
cn
c\
Ol
01 -H
.c re
in
cn
c TO
•H 01
LI tn
3 W
TO 01
U
•O 0
Ol Li
4-1 Q.
U
Ol L!
O
U TO
Ol
o> tn
"^
01 C
-H a
.Q C
-•H
TO re
c u
re -H
UH
TO LI
O O D*
tn c
U -H
TO 41 N
•SSt
C ^ 3
01 4J
CU D 10
3 -H O
W E E
Q
E
^
55
1
tn
0
O)
TJ
3
tn
Li
Ol
e walet clarifi
c
-H
E
"c
Ol
E
4->
re
4->
rH
Q
O.
•rH
•H
C
3
E
O
4-1
4-J
C
Ol
in
in
•H
Ol
4-J
re
L! O
re a.
4-> 'tn
•H -H
C TO
re
in o)
TO o
in 01
=3 XI
d
s;
^
•25
1
CO
rH
O
4-1 4-1
Li €
d sanitary wate
unicipal treatm
J3
TO Li 01 rH
01 o) * LI i re
tn c cn -H 3 4->
3 -rl C 3 XJ O
E -H cr 4-> tn i
in o> N o> 41 ai o
•H TO -H Li XI 41 4-J TO Li
1 Li 4-> J3 CO 01 O.
4-> TO 3 Cn H I- W
C C 4J C 0> 4-J W 0)
01 re tn -ri TO c oj x:
E -H rH 3 • O) U 4-1
4J CT> O O rH ---. U O
re C E O U CO C L. rH
O) -H U C 03 O Q* rH
Li C Ol *H U -H
4-> 10 C 4-1 § - O rH
•H UH x: re o 01 10 UH 3
ffl • O 10 rH C Li Ol UH
•S^ C* W TO a to w TO* oi o in
Tj -H Ol Ol Li Ol 3 tO 4-> TO
-iHN4->tnOO rH 3 Ol
C -r-l -H 10 UH TO C • tO TOO!
3 Li rH QJ S E TO DC
E3 0 0 TO C 0 g. -C W
LI in N LI tn > 3 Cn c
OJ -H D* 3 -H O <* • TO in -H
4J, O E Cf*rH CO OJ 01 -H tO
UH E O Lt in Xi c— • — • C -H
re u o -H >« - -H i- LI
QJ UH u-r 4-iL>rH to jb • QJ D
LirH Li-iHO) L. E Cn 4J 4J
QJ CO QJ TO QJ 4-> i-f QJ Q> O C retn
4J x: 4J01 4-iCOX) 4->U-H S-H
re tn tn to re re o co N o
» ro3 33UTO SOJ-H CUE
TO? CfrHOJLiLiC
>iOJ 10 01 L. 3 4-> (C 3 -H QJ
Li U) TO -H COI-HO W 4J ErH
4-ioj 4J c EH S'W'-HTOX:
•Hureo TOC coottn
CO Li-HTO Gl» WSE-H
ro L. QJ 4J QJ • -H o 3O UHTO
cn a. ere 4-» in UH TO o TJ QJ -H aj
QJ N rC 4J -H 3t -H 3 rH LiUl
JS O OlrH Li 0) -H rH (13 rH XI rH OJ
HU4 MftJ HEEX) >XltO U U
l.io) O u?
— r
TO O W
I ' I E~i E {H
III 1 1
co! rn r> LT> oj
rH rH O) OJ rH
* « •.
rH OJ OJ
4J cn -H
C Li C
E xl 0 4J
J-. 4-> C t) 4-> tO
oi re 3 w -H
4_> (U O -H QJ Li O
re Li TO TO rH Ol "E
S 4-1 s nj 4-J
' o TO x; re 01
>. Li rH t: tn 3 rH
4-> CO 4) Li Ol Cm
•rH, S 4-> O> fi W Cn -H
cl TOCOS oincETO
ro ' o> )-> o -H QJ -H QJ
Ifj 014-14-1 4-> U C TO M
UH C c3 O Ol 0) tn
TO ; oi Cn w L! 4-> -H 01
Ol Li U C -HO.WUHU
4-» 0) C -H rH -H -H O
ro rHOrH reOOLtLi
0) -HCJO 3-wEroo,
L. 0 0 O1 rH
H CO CJ U O
4-J
c:
1
o
»t
er
OJ
(11
x:
x:
•r—
3:
o
ro
c
o
o
o
4-J
c:
•r-
s
u
Ul
OJ
L.
4-1
I/I
CJ
t)
u
•5
JS
fl
Ol
L.
o
a.
a.
QJ
(/I
o
••-*
ra
E
ro
<D
L.
40
to
QJ
,C
O
T3
QJ
O-
rd
(/i
QJ
t!
s_
4->
•a
t/)
'o
4J
O
o
O)
JC
"
o
in
o
0.
-a
E
OJ
L.
4-> l/l
s indicate the s
Pit technologic
-^ C
L. 01
QJ I
L. -i—
Q) L.
1— _J
^
i
ai
u
u
,.
o
1/1
4-J
C
O)
c
o
t
o
0 CO
CO
c: a>
determined.
) indicate no kn
PA-600/8-83-005,
4-> 1 LU
O 1
C — *
1 * 01 <U
QJ U
• J= L.
2: Q on
j -u
76
1
I
I
I
1
I
I
1
I
I
I
I
I
I
I
I
1
I
1
image:
*«^*
-d
OJ
_3
-H
•y
a
o
u
*****
1
1
rH
*
CO
W
PQ
s
H
W
Jtf
L>
I
cc
UH
o »
iL
U^ O "-x.
U9 Q *™
ra u
32
in c
i |
fu
U-l
U 0
4-»
C rH
<u ra w
u w 4-1 tn
L. o O eg
O> 4-1 E
&.
1^-
*" 5 S
w 8
ra o
S -<
QJ
V)
Description of
re
g L.
re 0)
41 Xt
il
to c
u
o
t)
u •
in cn
3 C
•H
TO M
C -H
co L.
3
TO 4J
at to
XJ E
8|
•s
1!
4f 41
is §-
M
OJ
0* CO
(O VI
3
tn tn
re w
3 4T
u
tn o
I*
> UH
a
s»
tn
a
i
101
K
in
3 01
C rH
•H ro
e Streams (cont
al processed sh
oistening water
4J E
( O
CO
3 ""
rH
LI re
•H x:
re i in
o
TO i- TO
Of CU V
•ri in
UH TO in
•H Li 0>
TO O L)
••H U4 O
g 4-> L.
JT L>
4J C
0) W -r*
tD TO TO
C 01
.5^3
TO i- tn
O* W -H
tn >
D O C
O 3
Ol -H »
4-1 O O
Q rH
5 tli XI
C -C C
•rl C H -r*
E *H N
•H
TO W ' L.
0> L. Ul 3
4-1 QJ OJ 4->
CO rH UI «
Lt O 0> O
H U U E
cr»
t~*
i
\D
V
rH
O
U
•H
re
TO C
•H S
•rl rH
JXi
«-i
ro
x;
in
re
i
u
4J
U
Li
H
E
O
UH
1
TO
4>
CO >i
TO
4-1 4->
•s"
0) Ol
4-1 4-1
11
jrt1
iJ «-3 ij
111
Cn rH
^
CO
in cj w
a o :n
H Q S
,
o
p»
shale leachate
re
cc
O)
i
o
Li
O.
£
13
Of
in
3
•a
c
re
Ol
4->
u
0)
rH •
rH Cn
0 C
U -rl
N
tn -H
•H Li
L. 4-1
0) in
re o
UH OJ
11
Li
gl
4-» 4>
tn u
Ct
d
s:
i
o
in
UH
o
c
E
O
4-1
W
cn
c\
Ol
01 -H
.c re
in
cn
c TO
•H 01
LI tn
3 W
TO 01
U
•O 0
Ol Li
4-1 Q.
U
Ol L!
O
U TO
Ol
o> tn
"^
01 C
-H a
.Q C
-•H
TO re
c u
re -H
UH
TO LI
O O D*
tn c
U -H
TO 41 N
•SSt
C ^ 3
01 4J
CU D 10
3 -H O
W E E
Q
E
^
55
1
tn
0
O)
TJ
3
tn
Li
Ol
e walet clarifi
c
-H
E
"c
Ol
E
4->
re
4->
rH
Q
O.
•rH
•H
C
3
E
O
4-1
4-J
C
Ol
in
in
•H
Ol
4-J
re
L! O
re a.
4-> 'tn
•H -H
C TO
re
in o)
TO o
in 01
=3 XI
d
s;
^
•25
1
CO
rH
O
4-1 4-1
Li €
d sanitary wate
unicipal treatm
J3
TO Li 01 rH
01 o) * LI i re
tn c cn -H 3 4->
3 -rl C 3 XJ O
E -H cr 4-> tn i
in o> N o> 41 ai o
•H TO -H Li XI 41 4-J TO Li
1 Li 4-> J3 CO 01 O.
4-> TO 3 Cn H I- W
C C 4J C 0> 4-J W 0)
01 re tn -ri TO c oj x:
E -H rH 3 • O) U 4-1
4J CT> O O rH ---. U O
re C E O U CO C L. rH
O) -H U C 03 O Q* rH
Li C Ol *H U -H
4-> 10 C 4-1 § - O rH
•H UH x: re o 01 10 UH 3
ffl • O 10 rH C Li Ol UH
•S^ C* W TO a to w TO* oi o in
Tj -H Ol Ol Li Ol 3 tO 4-> TO
-iHN4->tnOO rH 3 Ol
C -r-l -H 10 UH TO C • tO TOO!
3 Li rH QJ S E TO DC
E3 0 0 TO C 0 g. -C W
LI in N LI tn > 3 Cn c
OJ -H D* 3 -H O <* • TO in -H
4J, O E Cf*rH CO OJ 01 -H tO
UH E O Lt in Xi c— • — • C -H
re u o -H >« - -H i- LI
QJ UH u-r 4-iL>rH to jb • QJ D
LirH Li-iHO) L. E Cn 4J 4J
QJ CO QJ TO QJ 4-> i-f QJ Q> O C retn
4J x: 4J01 4-iCOX) 4->U-H S-H
re tn tn to re re o co N o
» ro3 33UTO SOJ-H CUE
TO? CfrHOJLiLiC
>iOJ 10 01 L. 3 4-> (C 3 -H QJ
Li U) TO -H COI-HO W 4J ErH
4-ioj 4J c EH S'W'-HTOX:
•Hureo TOC coottn
CO Li-HTO Gl» WSE-H
ro L. QJ 4J QJ • -H o 3O UHTO
cn a. ere 4-» in UH TO o TJ QJ -H aj
QJ N rC 4J -H 3t -H 3 rH LiUl
JS O OlrH Li 0) -H rH (13 rH XI rH OJ
HU4 MftJ HEEX) >XltO U U
l.io) O u?
— r
TO O W
I ' I E~i E {H
III 1 1
co! rn r> LT> oj
rH rH O) OJ rH
* « •.
rH OJ OJ
4J cn -H
C Li C
E xl 0 4J
J-. 4-> C t) 4-> tO
oi re 3 w -H
4_> (U O -H QJ Li O
re Li TO TO rH Ol "E
S 4-1 s nj 4-J
' o TO x; re 01
>. Li rH t: tn 3 rH
4-> CO 4) Li Ol Cm
•rH, S 4-> O> fi W Cn -H
cl TOCOS oincETO
ro ' o> )-> o -H QJ -H QJ
Ifj 014-14-1 4-> U C TO M
UH C c3 O Ol 0) tn
TO ; oi Cn w L! 4-> -H 01
Ol Li U C -HO.WUHU
4-» 0) C -H rH -H -H O
ro rHOrH reOOLtLi
0) -HCJO 3-wEroo,
L. 0 0 O1 rH
H CO CJ U O
4-J
c:
1
o
»t
er
OJ
(11
x:
x:
•r—
3:
o
ro
c
o
o
o
4-J
c:
•r-
s
u
Ul
OJ
L.
4-1
I/I
CJ
t)
u
•5
JS
fl
Ol
L.
o
a.
a.
QJ
(/I
o
••-*
ra
E
ro
<D
L.
40
to
QJ
,C
O
T3
QJ
O-
rd
(/i
QJ
t!
s_
4->
•a
t/)
'o
4J
O
o
O)
JC
"
o
in
o
0.
-a
E
OJ
L.
4-> l/l
s indicate the s
Pit technologic
-^ C
L. 01
QJ I
L. -i—
Q) L.
1— _J
^
i
ai
u
u
,.
o
1/1
4-J
C
O)
c
o
t
o
0 CO
CO
c: a>
determined.
) indicate no kn
PA-600/8-83-005,
4-> 1 LU
O 1
C — *
1 * 01 <U
QJ U
• J= L.
2: Q on
j -u
76
1
I
I
I
1
I
I
1
I
I
I
I
I
I
I
I
1
I
1
image:
 w
1
CO
Q
fl^
CO
CO
w
u
§
PM
0
t3
•j
o
^•^
CO
W
H- i
H
H
PM
O
OS
u*
t"J
1^
o
I-H
vJ
j>j
s
•
CN
'
T~I
*
CO
W
tJ
1
1^
••-« 01 E.
X - a
s-*o
C a
•M C § '
u 11 S *
(0 U -H U
a u *j -i-
o a! o* i
C! £
o :
a. i-
cn c
u
I
a
I-* .c
11 V)
> 01
n e
iZ
q\o
-C
- w
in o
. o
-
E
i
o - •
-1 -U O
Jj — t 1
ro -- * £
i ^1
c
CN
1
^J
•—I C
u o
f u"H
= "^ ^
: i-t N
- a. w
t condition
<A
s
vO CV) CO
tft tO \o
rn in rs)
0 CO M •
ro ^>
CO CO
I- 1. I.
Ill if 5 Us
,nSiu « I i t! -H I 3 t!
•H U 1_ 4) -HLiLilU -HirfUV
-H i) ^J "S -"H 5 £ "w -H S *J *S
SSS SS« SSS f
a
'""•'"~ OOOO OOO OOO tf
"H-* OOOO OOO OOO k.
4
cr
^•^C vDCMi£^O vDOr^ tOvOCO
MVD to co \u «£i iop*co mcn-H
co*S| oacv»cro» fsiryi/i PJPOOT
p- *fl cd^r»r* eo'^rg ed vo m'
^ V ^-*n« ^.Tfrj. «m«
-nn (Nivotnin r*j oo ea PS) i— i co
r-tn vor-min *u co co \oocg
CO CO
cn'm' ' ' ' 'ii iii
, 1 1 I
> -o ' *J **
4) , 4J vo 4-> m £ m
o uo or— ut-in
v ro Q o (Beam Qinrsi
< 8^i£- cj ad- 3 Q£.
T3 C
|.S
T) *4-l W •
S §£
a c^t
C SO
o u
8 "O 1
W 01 0
tH i- (2; o
(0 3 eg
a u -H
'O -
4J O
(0 -H -M
U W U
3 a» C
"re "o
in u
e
o
•H -i-
S J °-
•S 5
-H rH «4H C
4 <n o o
tJ C -H
-< U. a; o
c c
I-H re
§
O •' C
"£ **
to,
.(-
,_ e
4J (NJ
J 'H
> «• w
4J TI Q
H (T3
-* O 0
H iJ O
U
1 -*w
O O
i-3 m
r-4fnojeor*co ro^r-vDrj"— HPMC^ r-Sr^cacoco
mp^mvo . cocoo^CT»<M.rs) mtncTi-Hcno
- i - » •
^rtSSS oor"t"3l!2SS -==>r-c-^;;J
"^ ^ 'CO
^ S3 S
. *** ' O
pa "^ •"*
^ «
""? o ; m
"^ PI 01
*0 VO • g
o o : o
,
I 1 : i
Ooo
CM m , ^
8 8 ; §
0 0* 0
-"* W Ifl*
•S 3 5
I Tj<oi , i «
'Sj-SS1** 5m 5o
2 S.Q1 IsB- SS~
» ISl>o I^S! f J^S
77
image:
w
1
CO
Q
fl^
CO
CO
w
u
§
PM
0
t3
•j
o
^•^
CO
W
H- i
H
H
PM
O
OS
u*
t"J
1^
o
I-H
vJ
j>j
s
•
CN
'
T~I
*
CO
W
tJ
1
1^
••-« 01 E.
X - a
s-*o
C a
•M C § '
u 11 S *
(0 U -H U
a u *j -i-
o a! o* i
C! £
o :
a. i-
cn c
u
I
a
I-* .c
11 V)
> 01
n e
iZ
q\o
-C
- w
in o
. o
-
E
i
o - •
-1 -U O
Jj — t 1
ro -- * £
i ^1
c
CN
1
^J
•—I C
u o
f u"H
= "^ ^
: i-t N
- a. w
t condition
<A
s
vO CV) CO
tft tO \o
rn in rs)
0 CO M •
ro ^>
CO CO
I- 1. I.
Ill if 5 Us
,nSiu « I i t! -H I 3 t!
•H U 1_ 4) -HLiLilU -HirfUV
-H i) ^J "S -"H 5 £ "w -H S *J *S
SSS SS« SSS f
a
'""•'"~ OOOO OOO OOO tf
"H-* OOOO OOO OOO k.
4
cr
^•^C vDCMi£^O vDOr^ tOvOCO
MVD to co \u «£i iop*co mcn-H
co*S| oacv»cro» fsiryi/i PJPOOT
p- *fl cd^r»r* eo'^rg ed vo m'
^ V ^-*n« ^.Tfrj. «m«
-nn (Nivotnin r*j oo ea PS) i— i co
r-tn vor-min *u co co \oocg
CO CO
cn'm' ' ' ' 'ii iii
, 1 1 I
> -o ' *J **
4) , 4J vo 4-> m £ m
o uo or— ut-in
v ro Q o (Beam Qinrsi
< 8^i£- cj ad- 3 Q£.
T3 C
|.S
T) *4-l W •
S §£
a c^t
C SO
o u
8 "O 1
W 01 0
tH i- (2; o
(0 3 eg
a u -H
'O -
4J O
(0 -H -M
U W U
3 a» C
"re "o
in u
e
o
•H -i-
S J °-
•S 5
-H rH «4H C
4 <n o o
tJ C -H
-< U. a; o
c c
I-H re
§
O •' C
"£ **
to,
.(-
,_ e
4J (NJ
J 'H
> «• w
4J TI Q
H (T3
-* O 0
H iJ O
U
1 -*w
O O
i-3 m
r-4fnojeor*co ro^r-vDrj"— HPMC^ r-Sr^cacoco
mp^mvo . cocoo^CT»<M.rs) mtncTi-Hcno
- i - » •
^rtSSS oor"t"3l!2SS -==>r-c-^;;J
"^ ^ 'CO
^ S3 S
. *** ' O
pa "^ •"*
^ «
""? o ; m
"^ PI 01
*0 VO • g
o o : o
,
I 1 : i
Ooo
CM m , ^
8 8 ; §
0 0* 0
-"* W Ifl*
•S 3 5
I Tj<oi , i «
'Sj-SS1** 5m 5o
2 S.Q1 IsB- SS~
» ISl>o I^S! f J^S
77
image:
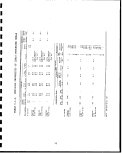 TABLE 3.1-3. SUMMARY OF HYDRAULIC CONDUCTIVITY MEASUREMENTS
FOR VARIOUS COMPACTION AND LOADINGS FOR LURGI
RETORTED SHALE
Material
Water
wt. %
Density,
g/cm3
Permeability, cm/s at various loadings
; 50 psi 100 psi 200 psi
LURGI-RG-r
LURGI-ULG-I
LURGI-RBa'b
a,b
26.6
10.4
dry
dry
1.41
1.33
1.81
1.22
1.0 x 10"6
3.0 x 10~^
8.3 x 10"5
1.2 x 10~^
6.5 x 10~?
1.9 x 10"^
6.5 x 10~?
2.0 x 10"^
Leaching columns.
Various source samples.
Source: EPA-600/D-84-228, 1984
TABLE 3.1-4.
WATER HOLDING CAPACITY OF LURGI PROCESSED SHALES
AT VARIOUS PRESSURES AND BULK DENSITIES
Sample
14.7 psi
(1 bar)
44.1 psi
(3 bar)
Pressure
73.5 psi
(5 bar)
147 psi
(10 bar)
200 psi
(13.6 bar)
No compaction
Lurgi 27.5
Packed to a
BDD=1.30 g/cc
Lurgi ash 62.4
BDb=1.45 g/cc
Lurgi ash 60.2
BDb=1.60 g/cc
Lurgi ash 47.2
Lurgi 20.7
27.6
62.3
58.7
46.3
20.2
26.9
62.2
56.6
45.8
19.8
25.3
62.0
55.5
44.4
19.8
15.5
61.7
55.2
43.7
19.0
aTable entries are moisture contents (w) expressed on a weight %
basis: weight of water per unit weight of dry solids.
v\
BD= bulk density. •
Source: EPA-600/D-84-228, 1984
78
I
I
I
I
1
I
i
i
I
I
i
I
1
1
1
I
1
I
1
image:
TABLE 3.1-3. SUMMARY OF HYDRAULIC CONDUCTIVITY MEASUREMENTS
FOR VARIOUS COMPACTION AND LOADINGS FOR LURGI
RETORTED SHALE
Material
Water
wt. %
Density,
g/cm3
Permeability, cm/s at various loadings
; 50 psi 100 psi 200 psi
LURGI-RG-r
LURGI-ULG-I
LURGI-RBa'b
a,b
26.6
10.4
dry
dry
1.41
1.33
1.81
1.22
1.0 x 10"6
3.0 x 10~^
8.3 x 10"5
1.2 x 10~^
6.5 x 10~?
1.9 x 10"^
6.5 x 10~?
2.0 x 10"^
Leaching columns.
Various source samples.
Source: EPA-600/D-84-228, 1984
TABLE 3.1-4.
WATER HOLDING CAPACITY OF LURGI PROCESSED SHALES
AT VARIOUS PRESSURES AND BULK DENSITIES
Sample
14.7 psi
(1 bar)
44.1 psi
(3 bar)
Pressure
73.5 psi
(5 bar)
147 psi
(10 bar)
200 psi
(13.6 bar)
No compaction
Lurgi 27.5
Packed to a
BDD=1.30 g/cc
Lurgi ash 62.4
BDb=1.45 g/cc
Lurgi ash 60.2
BDb=1.60 g/cc
Lurgi ash 47.2
Lurgi 20.7
27.6
62.3
58.7
46.3
20.2
26.9
62.2
56.6
45.8
19.8
25.3
62.0
55.5
44.4
19.8
15.5
61.7
55.2
43.7
19.0
aTable entries are moisture contents (w) expressed on a weight %
basis: weight of water per unit weight of dry solids.
v\
BD= bulk density. •
Source: EPA-600/D-84-228, 1984
78
I
I
I
I
1
I
i
i
I
I
i
I
1
1
1
I
1
I
1
image:
 TABLE 3.1-5. COMPOSITION OF LURGI PROCESSED MOISTURIZED SHALE
Weight
Component percent
Retorted shale
(moisturized) 100.00
Moisture 18 . 70
Oxygen (organic) 0.02
Nitrogen (organic) 0.08
Carbon (organic) 0.25
Sulfur (total) 0.93
Source: EPA-600/8-83-005, 1983
Mass flow, Flow,
10s Ib/hr 103 Ib-moles/hr
9,733
1,820 101.1
2 0.1
8 0.6
24 2.0
91 2.8
TABLE 3.1-6. INORGANIC ANALYSIS OF LURGI THE PROCESSED SHALE
Component
Silicon dioxide
Iron oxides
Aluminum oxide
Calcium oxide
Magnesium oxide
Sulfate
Sodium oxide
Potassium oxide
Carbonate
Chloride
Loss on ignition
Weight
percent
46.00
4.40
12.70
22.40
4.80
3.80
3.20
2.70
4.40
0.08
4.60
Source: EPA-600/8-83-005, 1983
79
image:
TABLE 3.1-5. COMPOSITION OF LURGI PROCESSED MOISTURIZED SHALE
Weight
Component percent
Retorted shale
(moisturized) 100.00
Moisture 18 . 70
Oxygen (organic) 0.02
Nitrogen (organic) 0.08
Carbon (organic) 0.25
Sulfur (total) 0.93
Source: EPA-600/8-83-005, 1983
Mass flow, Flow,
10s Ib/hr 103 Ib-moles/hr
9,733
1,820 101.1
2 0.1
8 0.6
24 2.0
91 2.8
TABLE 3.1-6. INORGANIC ANALYSIS OF LURGI THE PROCESSED SHALE
Component
Silicon dioxide
Iron oxides
Aluminum oxide
Calcium oxide
Magnesium oxide
Sulfate
Sodium oxide
Potassium oxide
Carbonate
Chloride
Loss on ignition
Weight
percent
46.00
4.40
12.70
22.40
4.80
3.80
3.20
2.70
4.40
0.08
4.60
Source: EPA-600/8-83-005, 1983
79
image:
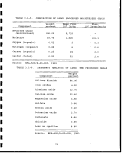 TABLE 3.1-7. MAJOR ION COMPOSITION OF COLUMN
LEACHATE-LURGI RETORTED SHALE
Vt
L
0.020
0.058
0.092
0.186
0.236
0.292
0.350
0.378
0.452
0.535
0.590
0.652
0.737
0.860
1.06
mg/L
Ca
575
560
540
520
530
540
560
570
580
600
590
590
600
610
590
Mg
0.3
0.2
0.4
0.6
0.7
0.7
0.8
0.7
0.7
0.7
0.6
0.7
0.7
0.7
0.8
Average
Source :
vt
L
Na
11970
11270
10590
5410
3150
1660
1000
795
600
575
535
405
530
385
365
K
950
760
830
300
220
160
120
110
110
100
110
100
110
80
120
TCf^
-•"— .j
permeability =
Cl
1360
1300
1150
450
230
131
75
65
45
: 48
39
30
; 41
26
23
f
"K = 8
HC03
136
67
57
29
25
26
26
22
21
21
20
18
23
20
20
.3 x K
CO3
393
351
328
208
149
123
101
111
105
118
90
93
105
136
137
3~^ cm/s
S04
23900
23400
21900
12600
5590
5450
3890
3480
3180
3110
3040
2760
3180
2770
2750
1
1
1
1
PH
10
11
11
11
11
11
10
11
11
11
11
11
11
11
11
.83
.09
.13
.22
.15
.05
.96
.07
.08
.12
.02
.07
.02
.21
.20
= pore volume
EPA-600/D-84-228,
1984
80
1
1
I
^v
1
1
1
1
Ir
t
1
mm
1
1
I
1
image:
TABLE 3.1-7. MAJOR ION COMPOSITION OF COLUMN
LEACHATE-LURGI RETORTED SHALE
Vt
L
0.020
0.058
0.092
0.186
0.236
0.292
0.350
0.378
0.452
0.535
0.590
0.652
0.737
0.860
1.06
mg/L
Ca
575
560
540
520
530
540
560
570
580
600
590
590
600
610
590
Mg
0.3
0.2
0.4
0.6
0.7
0.7
0.8
0.7
0.7
0.7
0.6
0.7
0.7
0.7
0.8
Average
Source :
vt
L
Na
11970
11270
10590
5410
3150
1660
1000
795
600
575
535
405
530
385
365
K
950
760
830
300
220
160
120
110
110
100
110
100
110
80
120
TCf^
-•"— .j
permeability =
Cl
1360
1300
1150
450
230
131
75
65
45
: 48
39
30
; 41
26
23
f
"K = 8
HC03
136
67
57
29
25
26
26
22
21
21
20
18
23
20
20
.3 x K
CO3
393
351
328
208
149
123
101
111
105
118
90
93
105
136
137
3~^ cm/s
S04
23900
23400
21900
12600
5590
5450
3890
3480
3180
3110
3040
2760
3180
2770
2750
1
1
1
1
PH
10
11
11
11
11
11
10
11
11
11
11
11
11
11
11
.83
.09
.13
.22
.15
.05
.96
.07
.08
.12
.02
.07
.02
.21
.20
= pore volume
EPA-600/D-84-228,
1984
80
1
1
I
^v
1
1
1
1
Ir
t
1
mm
1
1
I
1
image:
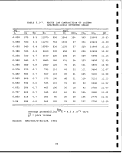 TABLE 3.1-8. CONCENTRATION OF SELECTED TRACE
ELEMENTS IN COLUMN LEACHATE OF
LURGI RETORTED SHALE
vt
L
0.020
0.058,
0.092
0.186
0.236
0.292
0.350
0.378
0.452
0.535
0.590
0 . 652
0.737
0.860
1.06
F
21.0
22.7
17.5
8.2
4.4
8.6
7.9
10.1
6.1
6.3
4.5
5.4
4.1
4.8
4.4
Average
17-1-
B
1.01
0.77
0.66
0.41
0.33
0.24
0.16
0.14
0.10
0.10
0.16
0.12
0.10
0.09
0.22
Si
20
11
15
11
11
11
8
8
8
8
5
9
9
9
8
Key
permeability =
mg/L
Mo
11
11
10
5.1
3.7
2.4
1.9
1.9
1.6
1.6
1.0
1.5
1.7
1.3
1.2
K = 8.3
Mn
0.037
0.023
0.022
0.018
0.017
0.019
0.015
0.013
0.013
0.010
0.016
0.024
0.019
0.012
0.015
x 10~?
' Al
29
23
18
i 5.8
4.6
' 3.8
J3.3
3.2
,2.9
2.8
1.5
!2.7
'2.9
12.5
2.3
cm/s |
Sr
7.8
7.9
16
6.9
8.4
13
13
15
16
17
19
19
19
17
22
|p = pore volume
Source :
EPA-600/D-84-228, 1984
81
image:
TABLE 3.1-8. CONCENTRATION OF SELECTED TRACE
ELEMENTS IN COLUMN LEACHATE OF
LURGI RETORTED SHALE
vt
L
0.020
0.058,
0.092
0.186
0.236
0.292
0.350
0.378
0.452
0.535
0.590
0 . 652
0.737
0.860
1.06
F
21.0
22.7
17.5
8.2
4.4
8.6
7.9
10.1
6.1
6.3
4.5
5.4
4.1
4.8
4.4
Average
17-1-
B
1.01
0.77
0.66
0.41
0.33
0.24
0.16
0.14
0.10
0.10
0.16
0.12
0.10
0.09
0.22
Si
20
11
15
11
11
11
8
8
8
8
5
9
9
9
8
Key
permeability =
mg/L
Mo
11
11
10
5.1
3.7
2.4
1.9
1.9
1.6
1.6
1.0
1.5
1.7
1.3
1.2
K = 8.3
Mn
0.037
0.023
0.022
0.018
0.017
0.019
0.015
0.013
0.013
0.010
0.016
0.024
0.019
0.012
0.015
x 10~?
' Al
29
23
18
i 5.8
4.6
' 3.8
J3.3
3.2
,2.9
2.8
1.5
!2.7
'2.9
12.5
2.3
cm/s |
Sr
7.8
7.9
16
6.9
8.4
13
13
15
16
17
19
19
19
17
22
|p = pore volume
Source :
EPA-600/D-84-228, 1984
81
image:
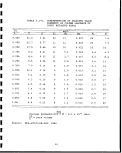 TABLE 3.1-9.
CONCENTRATIONS IN ASTM WATER SHAKE
TEST EXTRACTS - LURGI SPENT SHALES
Parameter
PH
EC
ALK
H2C03
HC03
C03
TDS
F
Cl
P04
N03
S04
Zn
Fe
Co
Li
V
NH3
B
Cd
Be
Mg
P
Si
Mo
Mn
Ni
Na
Cu
Al
Ca
Ba
K
Cr
Sr
Pb
Ag
Ti
Se
As
Hg
Units
—
|jmhos/cm @ 25°
mg/L
mg/L
mg/L
mg/L
mg/L
mg/L
mg/L
mg/L
mg/L
mg/L
mg/L
mg/L
mg/L
mg/L
mg/L
mg/L
mg/L
mg/L
mg/L
mg/L
mg/L
mg/L
mg/L
mg/L
mg/L
mg/L
mg/L
mg/L
mg/L
mg/L
mg/L
mg/L
mg/L
mg/L
mg/L
mg/L
mg/L
mg/L
mg/L
RG-Ia
11.43
3660
192
0.001
9.6
110.7
3700
2.0
; 23.7
0.62
8.7
2545
0.001
0.018
<0.005
0.371
0.053
8.4
0.173
<0.001
' <0.0005
0.6
0.22
5.5
<0.05
0.008
<0.005
324
<0.001
0.60
750
0.115
43
0.100
14
0.012
<0.001
<0.005
<0.020
0.016
<0.001
ULG-Ia
11.49
2650
160
0.001
7.0
92.5
2140
3.8
10.9
<0.1
1.7
1301
0.007
<0.005
<0.005
0.616
0.059
6.2
0.005
<0.001
<0.0005
0.5
0.20
3.4
<0.05
0.006
<0.005
180
0.003
<0.02
402
0.130
34
<0.005
13
<0.01
0.005
<0.005
<0.020
<0.01
0.001
RBS
11.85
4270
355
0.001
6.9
209.6
3350
6.34
17.1
0.5
2.52
2291
<0.001
<0.005
<0.005
0.887
0.082
-
0.096
<0.001
<0.0037
0.4
0.5
5.4
<0.05
0.029
<0.005
275
0.002
<0.02
713
0.157
64
0.095
20
<0.01
0.008
<0.005
<0.020
<0.01
<0.001
Various source samples.
Source: EPA-600/D-84-228, 1984
1
1
82
I
I
I
I
1
I
1
i
f
1
I
I
I
f
I
1
image:
TABLE 3.1-9.
CONCENTRATIONS IN ASTM WATER SHAKE
TEST EXTRACTS - LURGI SPENT SHALES
Parameter
PH
EC
ALK
H2C03
HC03
C03
TDS
F
Cl
P04
N03
S04
Zn
Fe
Co
Li
V
NH3
B
Cd
Be
Mg
P
Si
Mo
Mn
Ni
Na
Cu
Al
Ca
Ba
K
Cr
Sr
Pb
Ag
Ti
Se
As
Hg
Units
—
|jmhos/cm @ 25°
mg/L
mg/L
mg/L
mg/L
mg/L
mg/L
mg/L
mg/L
mg/L
mg/L
mg/L
mg/L
mg/L
mg/L
mg/L
mg/L
mg/L
mg/L
mg/L
mg/L
mg/L
mg/L
mg/L
mg/L
mg/L
mg/L
mg/L
mg/L
mg/L
mg/L
mg/L
mg/L
mg/L
mg/L
mg/L
mg/L
mg/L
mg/L
mg/L
RG-Ia
11.43
3660
192
0.001
9.6
110.7
3700
2.0
; 23.7
0.62
8.7
2545
0.001
0.018
<0.005
0.371
0.053
8.4
0.173
<0.001
' <0.0005
0.6
0.22
5.5
<0.05
0.008
<0.005
324
<0.001
0.60
750
0.115
43
0.100
14
0.012
<0.001
<0.005
<0.020
0.016
<0.001
ULG-Ia
11.49
2650
160
0.001
7.0
92.5
2140
3.8
10.9
<0.1
1.7
1301
0.007
<0.005
<0.005
0.616
0.059
6.2
0.005
<0.001
<0.0005
0.5
0.20
3.4
<0.05
0.006
<0.005
180
0.003
<0.02
402
0.130
34
<0.005
13
<0.01
0.005
<0.005
<0.020
<0.01
0.001
RBS
11.85
4270
355
0.001
6.9
209.6
3350
6.34
17.1
0.5
2.52
2291
<0.001
<0.005
<0.005
0.887
0.082
-
0.096
<0.001
<0.0037
0.4
0.5
5.4
<0.05
0.029
<0.005
275
0.002
<0.02
713
0.157
64
0.095
20
<0.01
0.008
<0.005
<0.020
<0.01
<0.001
Various source samples.
Source: EPA-600/D-84-228, 1984
1
1
82
I
I
I
I
1
I
1
i
f
1
I
I
I
f
I
1
image:
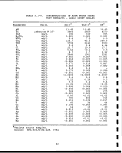 TABLE 3.1-10.
CONCENTRATIONS IN RCRA TEST EXTRACTS
LURGI SPENT SHALES
Parameter
pH
EC
ALK
H2COa
HC03
C03
TDS
Cl
P04
NOS
S04
Zn
Fe
Co
Li
V
NH3
B
Cd
Be
Mq
P"
Si
Mo
Mn -
Ni
Na
Cu
Al
Ca
Ba
K
Cr
Sr
Pb
Ag
Ti
Se
As
Hg
Units
^
pmhos/cm @ 25°
mg/L
mg/L
mg/L
mg/L
mg/L
mg/L
mg/L
mg/L
mg/L
mg/L
mg/L
mg/L
mg/L
mg/L
mg/L
mg/L
mg/L
mg/L
mg/L
mg/L
mg/L
mg/L
mg/L
mg/L
mg/L
mg/L
mg/L
mg/L
mg/L
mg/L
mg/L
mg/L
mg/L
mg/L
mg/L
mg/L
mg/L
mg/L
RG-Ia
8.06
4150
1612
37.8
1948
9.5
5690
7.1
<0.01
1.53
684
0.138
<0.005
<0.005
0.173
0.008
3.28
0.520
0.004
<0.0005
290
0.4
0.6
<0.05
0.110
0.012
43
0.032
<0.02
964
0.130
3.2
<0.005
8.9
<0.01
0.002
<0.005
<0.02
0.019
<0.001
ULG-Ia
i
7.99
4236
2188
59.7
2646
11.1
6520
6.4
<0.01
0.48
420
0.082
<0.005
< 0.005
0.135
0.006
1.08
0.270
0.003,
0.0016
269
0.7
7.0!
<0.05
0.410
0.075
28
0.017-
<0.02!
1280;
0.350;
5.0
<0.005:
13,
<0.01|
<0.002;
<0.005!
0.0201
0.020:
0.001;
RBa
8.67
5650
2505
14.1
2937
58.7
8520
18.9
<0.01
0.53
880
0.010
<0.005
<0.005
0.304
0.008
1.98
1.470
0.002
0.0026
430
0.7
7.9
<0.05
0.090
<0.005
55
0.009
<0.02
1479
0.180
11.0
<0.005
13
<0.01
<0.002
< 0,005
<0.02
0..047
<0..001
Various source samples.
Source: EPA-600/D-84-228, 1984
83
image:
TABLE 3.1-10.
CONCENTRATIONS IN RCRA TEST EXTRACTS
LURGI SPENT SHALES
Parameter
pH
EC
ALK
H2COa
HC03
C03
TDS
Cl
P04
NOS
S04
Zn
Fe
Co
Li
V
NH3
B
Cd
Be
Mq
P"
Si
Mo
Mn -
Ni
Na
Cu
Al
Ca
Ba
K
Cr
Sr
Pb
Ag
Ti
Se
As
Hg
Units
^
pmhos/cm @ 25°
mg/L
mg/L
mg/L
mg/L
mg/L
mg/L
mg/L
mg/L
mg/L
mg/L
mg/L
mg/L
mg/L
mg/L
mg/L
mg/L
mg/L
mg/L
mg/L
mg/L
mg/L
mg/L
mg/L
mg/L
mg/L
mg/L
mg/L
mg/L
mg/L
mg/L
mg/L
mg/L
mg/L
mg/L
mg/L
mg/L
mg/L
mg/L
RG-Ia
8.06
4150
1612
37.8
1948
9.5
5690
7.1
<0.01
1.53
684
0.138
<0.005
<0.005
0.173
0.008
3.28
0.520
0.004
<0.0005
290
0.4
0.6
<0.05
0.110
0.012
43
0.032
<0.02
964
0.130
3.2
<0.005
8.9
<0.01
0.002
<0.005
<0.02
0.019
<0.001
ULG-Ia
i
7.99
4236
2188
59.7
2646
11.1
6520
6.4
<0.01
0.48
420
0.082
<0.005
< 0.005
0.135
0.006
1.08
0.270
0.003,
0.0016
269
0.7
7.0!
<0.05
0.410
0.075
28
0.017-
<0.02!
1280;
0.350;
5.0
<0.005:
13,
<0.01|
<0.002;
<0.005!
0.0201
0.020:
0.001;
RBa
8.67
5650
2505
14.1
2937
58.7
8520
18.9
<0.01
0.53
880
0.010
<0.005
<0.005
0.304
0.008
1.98
1.470
0.002
0.0026
430
0.7
7.9
<0.05
0.090
<0.005
55
0.009
<0.02
1479
0.180
11.0
<0.005
13
<0.01
<0.002
< 0,005
<0.02
0..047
<0..001
Various source samples.
Source: EPA-600/D-84-228, 1984
83
image:
 TABLE 3.1-11.
LEACHABLE MASS AS INDICATED BY THE ASTM PROPOSED
WATER SHAKE TEST FOR LURGI SPENT SHALES - mg/g
Parameter
RG-I
ULG-I
RBC
Na
Ca
Mg
S04
Cl
F
B
Mo
Al
TDS
1
3
0
10
0
0
0
0
0
14
.296
.00
.002
.18
.095
.008
.0007
.004
.002
.80
0
1
0
5
0
0
0
0
8
.720
.608
.002
.204
.044
.015
-
.002
.006
.560
0
0
0
0
^
-
.0008
—
-
-
.0002
.010
.008
~
I
I
I
t
I
I
aVarious source samples.
Source: EPA-600/D--84-228, 1984
TABLE 3.1-12.
LEACHABLE MASS AS INDICATED BY THE RCRA EXTRACTION
TEST FOR LURGI SPENT SHALES - mg/g
Parameter
RG-I
ULG-I
RBC
Na
Ca
Mg
S04
Cl
B
Mo
Al
TDS
0.860
19.28
5.80
13.68
0.142
0.010
0.016
0.050
H3.8 ;
0.560
25.60
5.38
8.40
0.128
0.005
0.008
0.038
130.4
1.100
29.58
8.60
1.760
0.378
0.029
0.020
0.038
170.4.
Various source samples.
Source: EPA-600/D-84-228, 1984
84
I
I
I
I
I
1
I
I
I
1
1
I
image:
TABLE 3.1-11.
LEACHABLE MASS AS INDICATED BY THE ASTM PROPOSED
WATER SHAKE TEST FOR LURGI SPENT SHALES - mg/g
Parameter
RG-I
ULG-I
RBC
Na
Ca
Mg
S04
Cl
F
B
Mo
Al
TDS
1
3
0
10
0
0
0
0
0
14
.296
.00
.002
.18
.095
.008
.0007
.004
.002
.80
0
1
0
5
0
0
0
0
8
.720
.608
.002
.204
.044
.015
-
.002
.006
.560
0
0
0
0
^
-
.0008
—
-
-
.0002
.010
.008
~
I
I
I
t
I
I
aVarious source samples.
Source: EPA-600/D--84-228, 1984
TABLE 3.1-12.
LEACHABLE MASS AS INDICATED BY THE RCRA EXTRACTION
TEST FOR LURGI SPENT SHALES - mg/g
Parameter
RG-I
ULG-I
RBC
Na
Ca
Mg
S04
Cl
B
Mo
Al
TDS
0.860
19.28
5.80
13.68
0.142
0.010
0.016
0.050
H3.8 ;
0.560
25.60
5.38
8.40
0.128
0.005
0.008
0.038
130.4
1.100
29.58
8.60
1.760
0.378
0.029
0.020
0.038
170.4.
Various source samples.
Source: EPA-600/D-84-228, 1984
84
I
I
I
I
I
1
I
I
I
1
1
I
image:
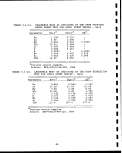 3.2 TOSCO II OIL SHALE RETORTING i
3.2.. 1 Retorting Operation ;
Figure 3.2-1 shows a conceptual flow diagram of the TOSCO II
retorting process [EPA-600/8-83-003, April 1983]. The process is
indirectly heated and employs a solid-to-solid heat exchange
(between hot ceramic balls and raw shale) as a means for providing
the heat of retorting. The integral parts of the TOSCO II
retorting system are: retort and accumulator; product
±rac:tionator; processed shale removal system; ceramic ball system-
and raw shale preheat system. ;
The TOSCO II retort is a slightly inclined, rotating drum to which
raw shale, minus 1/2-inch size, preheated to approximately 500°F
is fed. Ceramic balls, at 1.5 times the shale mass flow rate, and
previously heated to about 1,300°F, are also added toj the retort.
The rotating, mixing action results in pulverization: of the raw
shale. Heat transfer from the ceramic balls raises the shale
temperature to approximately 900°F, and pyrolysis, or retorting,
of the kerogen in .the shale occurs. The pyrolysis vapors and the
mixture of balls and pyrolyzed shale are then taken to an
accumulator vessel. This accumulator consists of ia rotating
perforated screen or trommel which retains the balls; but allows
t]2e Pulveri2ed shale to Pass through, thus affording k separation
o± the two. The pyrolysis vapors are removed from the vapor dome
at the top of the accumulator and sent to a fractionator for oil
recovery, while the ceramic balls are sent for recycling and the
processed shale is eventually sent for disposal. ;
In the oil recovery section (not shown in Figure 3.2-1), the pyro-
lysis vapors are separated by the fractionator into gas, naphtha
oil, gas oil, bottom oil, and gas condensate, or foul water. Each
stream is sent to its respective processing unit for' appropriate
treatment. ; '
Processed shale dust, contained with the ceramic balls as they
emerge from the accumulator, is removed by hot flue gas from the
steam superheater. The particulate matter is subsequently con-
verted to a sludge in the venturi wet scrubber and sent to the
disposal area. The clean flue gas is emitted to the atmosphere
through the scrubber stack. The clean ceramic balls are then
transported by a bucket elevator to the ball heater if or heating
and recycling back to the retort. In the ball heater, treated
fuel gas and shale oil are burned by atomizing the fuels with air
in a vertical combustion chamber at the top of the vessel. Hot
flue gas thus generated passes downward, concurrently with the
balls, thereby heating them. The flue gas is separated from the
balls in the gas disengagers and the hot balls are returned to the
retort.
85
image:
3.2 TOSCO II OIL SHALE RETORTING i
3.2.. 1 Retorting Operation ;
Figure 3.2-1 shows a conceptual flow diagram of the TOSCO II
retorting process [EPA-600/8-83-003, April 1983]. The process is
indirectly heated and employs a solid-to-solid heat exchange
(between hot ceramic balls and raw shale) as a means for providing
the heat of retorting. The integral parts of the TOSCO II
retorting system are: retort and accumulator; product
±rac:tionator; processed shale removal system; ceramic ball system-
and raw shale preheat system. ;
The TOSCO II retort is a slightly inclined, rotating drum to which
raw shale, minus 1/2-inch size, preheated to approximately 500°F
is fed. Ceramic balls, at 1.5 times the shale mass flow rate, and
previously heated to about 1,300°F, are also added toj the retort.
The rotating, mixing action results in pulverization: of the raw
shale. Heat transfer from the ceramic balls raises the shale
temperature to approximately 900°F, and pyrolysis, or retorting,
of the kerogen in .the shale occurs. The pyrolysis vapors and the
mixture of balls and pyrolyzed shale are then taken to an
accumulator vessel. This accumulator consists of ia rotating
perforated screen or trommel which retains the balls; but allows
t]2e Pulveri2ed shale to Pass through, thus affording k separation
o± the two. The pyrolysis vapors are removed from the vapor dome
at the top of the accumulator and sent to a fractionator for oil
recovery, while the ceramic balls are sent for recycling and the
processed shale is eventually sent for disposal. ;
In the oil recovery section (not shown in Figure 3.2-1), the pyro-
lysis vapors are separated by the fractionator into gas, naphtha
oil, gas oil, bottom oil, and gas condensate, or foul water. Each
stream is sent to its respective processing unit for' appropriate
treatment. ; '
Processed shale dust, contained with the ceramic balls as they
emerge from the accumulator, is removed by hot flue gas from the
steam superheater. The particulate matter is subsequently con-
verted to a sludge in the venturi wet scrubber and sent to the
disposal area. The clean flue gas is emitted to the atmosphere
through the scrubber stack. The clean ceramic balls are then
transported by a bucket elevator to the ball heater if or heating
and recycling back to the retort. In the ball heater, treated
fuel gas and shale oil are burned by atomizing the fuels with air
in a vertical combustion chamber at the top of the vessel. Hot
flue gas thus generated passes downward, concurrently with the
balls, thereby heating them. The flue gas is separated from the
balls in the gas disengagers and the hot balls are returned to the
retort.
85
image:
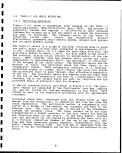 1 -
si
CDjUJ
1-
I
O.
<r
2
4
-/
S§t
«a>-z
01=)
-<•
a:
LJ
1
•<
n/ =
^ s
UJ
>
-it -<
1 1
1
1
I
i
E
I
i
I
I
I
I
1
86
I
I
1
1
1
1
image:
1 -
si
CDjUJ
1-
I
O.
<r
2
4
-/
S§t
«a>-z
01=)
-<•
a:
LJ
1
•<
n/ =
^ s
UJ
>
-it -<
1 1
1
1
I
i
E
I
i
I
I
I
I
1
86
I
I
1
1
1
1
image:
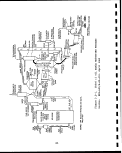 The hot processed shale from the accumulator is taken to a rotat-
ing drum steam generator/cooler where it is cooled to about 300°F
by indirect heat transfer to the feedwater to generate some
process steam. The cooled processed shale is then taken to
a^2 5er rotatln9 drum and processed shale moisturizing water is
added. Steam incidentally produced during the moisturizing oper-
ation entrains some processed shale dust which is removed in"the
venturi wet scrubber; the steam, along with a little; participate
matter, is released to the atmosphere through the scrubber stack
The processed shale, cooled to below 200°F is moisturized to
approximately 14% water by weight (to aid compaction and dust
control) and then transported to the disposal area. !
The disengaged hot flue gas is used to preheat the rawi shale feed
thereby recovering most of the waste heat. The preheating system
consists of a series of three lift pipes (or preheat zones), a
thermal oxidizer (incinerator), cyclones and wet scrubbers. The
flue gas is introduced at the bottom of the last lift1 pipe (first
preheat zone), where the raw shale stream from the -second lift
pipe (second preheat zone) is also received. The solids are lift-
ed pneumatically and heat transfer from the gas to the shale oc-
curs. The preheated shale is accumulated in a collecting bin at
the top of the lift pipe and sent to the retort. Residual dust in
the flue gas is separated by a cyclone and added to the feed going
to the retort. \
Since the flue gas temperature is at its highest when introduced
to the last lift pipe (first preheat zone), it partially retorts
the very fine shale, which results in hydrocarbon vapor release
into the flue gas. Therefore, the flue gas is introduced to a
thermal oxidizer (located between the first and second preheat
zones) to burn the hydrocarbons so that the hydrocarbon emission
to the atmosphere is not excessive. Some shale oil, !C4 liquids
and air are also added to the oxidizer to sustain combustion. The
resulting flue gas is cooled, and then introduced to the bottom of
the other two lift pipes. At this point, the temperature of the
flue gas is low enough so that the extent of retorting!of the fine
shale is less than in the first preheat zone. Hydrocarbons
released in these two lift pipes are emitted with the flue gas,
without incineration.
The flow diagram for a complete plant complex, emphasizing the
waste streams produced, is presented in Figure 3.2-2 [TOSCO, 1982].
Production-scale mining, of the oil shale is accomplished by con-
ventional underground room-and-pillar mining.
The acid gases (H^S, CO^ ) in the retort gas and hydrotreated flue
gas are separated.by absorption in a diethanolamine solution as a
pretreatment step. The treated sweet gas is eventually separated
into C4 liquids, LPG, and C-4 and lighter process gas. Sulfur from
the acid gases is recovered by the Claus/Wellman-Lord processes.
87
image:
The hot processed shale from the accumulator is taken to a rotat-
ing drum steam generator/cooler where it is cooled to about 300°F
by indirect heat transfer to the feedwater to generate some
process steam. The cooled processed shale is then taken to
a^2 5er rotatln9 drum and processed shale moisturizing water is
added. Steam incidentally produced during the moisturizing oper-
ation entrains some processed shale dust which is removed in"the
venturi wet scrubber; the steam, along with a little; participate
matter, is released to the atmosphere through the scrubber stack
The processed shale, cooled to below 200°F is moisturized to
approximately 14% water by weight (to aid compaction and dust
control) and then transported to the disposal area. !
The disengaged hot flue gas is used to preheat the rawi shale feed
thereby recovering most of the waste heat. The preheating system
consists of a series of three lift pipes (or preheat zones), a
thermal oxidizer (incinerator), cyclones and wet scrubbers. The
flue gas is introduced at the bottom of the last lift1 pipe (first
preheat zone), where the raw shale stream from the -second lift
pipe (second preheat zone) is also received. The solids are lift-
ed pneumatically and heat transfer from the gas to the shale oc-
curs. The preheated shale is accumulated in a collecting bin at
the top of the lift pipe and sent to the retort. Residual dust in
the flue gas is separated by a cyclone and added to the feed going
to the retort. \
Since the flue gas temperature is at its highest when introduced
to the last lift pipe (first preheat zone), it partially retorts
the very fine shale, which results in hydrocarbon vapor release
into the flue gas. Therefore, the flue gas is introduced to a
thermal oxidizer (located between the first and second preheat
zones) to burn the hydrocarbons so that the hydrocarbon emission
to the atmosphere is not excessive. Some shale oil, !C4 liquids
and air are also added to the oxidizer to sustain combustion. The
resulting flue gas is cooled, and then introduced to the bottom of
the other two lift pipes. At this point, the temperature of the
flue gas is low enough so that the extent of retorting!of the fine
shale is less than in the first preheat zone. Hydrocarbons
released in these two lift pipes are emitted with the flue gas,
without incineration.
The flow diagram for a complete plant complex, emphasizing the
waste streams produced, is presented in Figure 3.2-2 [TOSCO, 1982].
Production-scale mining, of the oil shale is accomplished by con-
ventional underground room-and-pillar mining.
The acid gases (H^S, CO^ ) in the retort gas and hydrotreated flue
gas are separated.by absorption in a diethanolamine solution as a
pretreatment step. The treated sweet gas is eventually separated
into C4 liquids, LPG, and C-4 and lighter process gas. Sulfur from
the acid gases is recovered by the Claus/Wellman-Lord processes.
87
image:
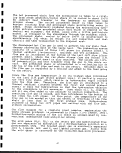 ]
I
[
r
I
i
3
I
i
|
I
i
Si
i
3s
|
-
§
i
i
s
•s
1
H
1
ii
*
5
K'
a
i
si
Is
' '
2
' '
3
i
|
I S
i
c
1
i
s
I
i
. ^
!i
1
1
J.* TAIL US
CUM UP
' '
s
3
i Ii
i i
«-
1 w/xn iro 'HT MSISI
,
&
1
i
5<
|
|
1
S
S
1
gK
1
1
i
i
3*
•*
5 i
S|
1
•S
1
I
1
1 KM MK-UP W1H
1
5
t
I
!
,
m««ii«
x
'
ii
l!
1 PUWI WSTE WKR
TO STOWC
5
i
j
5*
=
1
I
j
i
s
5
a
S
„
i
R
I ^
i !
'
•
i
E
S
i .
: :
ii
i
^
-
a!
!
3
S
4
•H
rH
•H
U
fd
tn
G
CO
ifl
0)
U
o
Pi
rt)
rrj
(TJ
CO
S
M
•H
T) CM
00
!£ cn
O H
r-l
44 U
U W
o o
rH E-l
W ••
CQ 0)
<D O
U M
P
M O
(X| CO
CM
CM
CO
(U
•H
^
I
I
I
1
88
1
I
I
I
I
I
I
I
I
I
I
I
I
I
image:
]
I
[
r
I
i
3
I
i
|
I
i
Si
i
3s
|
-
§
i
i
s
•s
1
H
1
ii
*
5
K'
a
i
si
Is
' '
2
' '
3
i
|
I S
i
c
1
i
s
I
i
. ^
!i
1
1
J.* TAIL US
CUM UP
' '
s
3
i Ii
i i
«-
1 w/xn iro 'HT MSISI
,
&
1
i
5<
|
|
1
S
S
1
gK
1
1
i
i
3*
•*
5 i
S|
1
•S
1
I
1
1 KM MK-UP W1H
1
5
t
I
!
,
m««ii«
x
'
ii
l!
1 PUWI WSTE WKR
TO STOWC
5
i
j
5*
=
1
I
j
i
s
5
a
S
„
i
R
I ^
i !
'
•
i
E
S
i .
: :
ii
i
^
-
a!
!
3
S
4
•H
rH
•H
U
fd
tn
G
CO
ifl
0)
U
o
Pi
rt)
rrj
(TJ
CO
S
M
•H
T) CM
00
!£ cn
O H
r-l
44 U
U W
o o
rH E-l
W ••
CQ 0)
<D O
U M
P
M O
(X| CO
CM
CM
CO
(U
•H
^
I
I
I
1
88
1
I
I
I
I
I
I
I
I
I
I
I
I
I
image:
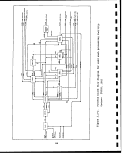 A tail gas stream containing a small amount of sulfut dioxide is
eventually emitted from the Wellman-Lord unit. An acidic conden-
sate is also obtained from the Wellman-Lord unit; it is neutral-
ized with alkali and then sent for disposal.
The naphtha and gas oils are hydrotreated to produce upgraded syn-
crude. An ammoniacal wash water is produced from the hydrogena-
tion and subjected to an ammonia recovery process. ; This latter
process produces a sulfurous overhead which is sent to the Glaus
Plant for recovery of sulfur. The hydrotreatment operations con-
sume process gas, thereby generating flue gases. >The ammonia
plant does not burn any fuels. The bottoms oil is coked to yield
a gaseous overhead, naphtha oil, and gas oil which are sent to
their respective units for treatment, and a coke residue which is
disposed of with the processed shale or marketed. A small amount
of aqueous condensate is also produced and sent to the foul water
stripper. A gas-fired furnace is used for heating the, feed to the
coke drums. The flue gas from the furnace is emitted to the atmos-
phere. Hydrogen for the oil hydrotreating is generated by steam
reforming, using the treated process gas (C2 and lighter fraction).
The reforming furnaces burn fuel and generate a flue emission.
Carbon dioxide, generated as a result of reforming, is separated
from the hydrogen and is also released to the atmosphere.
The foul water condensed from the pyrolysis vapors is steam strip-
ped to remove volatile matter which is sent to the Glaus plant for
recovery of sulfur. Ammonia in the stripper overheads is conver-
ted to elemental nitrogen during incineration in the Glaus pro-
cess. The stripped water is used in processed shale moisturizing.
3.2.2 Solid Wastes |
i
Large quantities of solid waste materials will be generated over
the life of a TOSCO Plant. Solid wastes are summarized in Tables
3.2-1 [TOSCO, May 1982] and 3.2-2 [EPA-600/8-83-003, April 1983].
3.2.3 Characteristics of Solid Wastes \
Various data on TOSCO II processed shales are presented in Tables
3.2-3 to 3.2-9. Table 3.2-10 presents the composition !of TOSCO II
combined process wastewater (retort water and other wastewaters).
m^™s 3-2~1:L to 3.2-13 depicts chemical composition data on the
TOSCO ii foul water. Lab leachate data on retorted shale are
shown in Tables 3.2-14 to 3.2-16. Tables 3.2-17 and 3J2-18 depict
field leachate data for the TOSCO II retorted shale. !
89
image:
A tail gas stream containing a small amount of sulfut dioxide is
eventually emitted from the Wellman-Lord unit. An acidic conden-
sate is also obtained from the Wellman-Lord unit; it is neutral-
ized with alkali and then sent for disposal.
The naphtha and gas oils are hydrotreated to produce upgraded syn-
crude. An ammoniacal wash water is produced from the hydrogena-
tion and subjected to an ammonia recovery process. ; This latter
process produces a sulfurous overhead which is sent to the Glaus
Plant for recovery of sulfur. The hydrotreatment operations con-
sume process gas, thereby generating flue gases. >The ammonia
plant does not burn any fuels. The bottoms oil is coked to yield
a gaseous overhead, naphtha oil, and gas oil which are sent to
their respective units for treatment, and a coke residue which is
disposed of with the processed shale or marketed. A small amount
of aqueous condensate is also produced and sent to the foul water
stripper. A gas-fired furnace is used for heating the, feed to the
coke drums. The flue gas from the furnace is emitted to the atmos-
phere. Hydrogen for the oil hydrotreating is generated by steam
reforming, using the treated process gas (C2 and lighter fraction).
The reforming furnaces burn fuel and generate a flue emission.
Carbon dioxide, generated as a result of reforming, is separated
from the hydrogen and is also released to the atmosphere.
The foul water condensed from the pyrolysis vapors is steam strip-
ped to remove volatile matter which is sent to the Glaus plant for
recovery of sulfur. Ammonia in the stripper overheads is conver-
ted to elemental nitrogen during incineration in the Glaus pro-
cess. The stripped water is used in processed shale moisturizing.
3.2.2 Solid Wastes |
i
Large quantities of solid waste materials will be generated over
the life of a TOSCO Plant. Solid wastes are summarized in Tables
3.2-1 [TOSCO, May 1982] and 3.2-2 [EPA-600/8-83-003, April 1983].
3.2.3 Characteristics of Solid Wastes \
Various data on TOSCO II processed shales are presented in Tables
3.2-3 to 3.2-9. Table 3.2-10 presents the composition !of TOSCO II
combined process wastewater (retort water and other wastewaters).
m^™s 3-2~1:L to 3.2-13 depicts chemical composition data on the
TOSCO ii foul water. Lab leachate data on retorted shale are
shown in Tables 3.2-14 to 3.2-16. Tables 3.2-17 and 3J2-18 depict
field leachate data for the TOSCO II retorted shale. !
89
image:
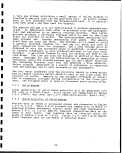 TABLE 3.2-1.
SUMMARY OF SOLID WASTES ESTIMATED FOR THE
TOSCO SAND WASH PROCESSING FACILITY
Waste material
Sanitary refuse
Construction debris
TOTAL
Source
Sanitary landfill
Surface mine and plant site
Surface mine and plant site
Estimated
quantity,
ton/yr
3,000
2,500
5,500
Estimated
volume ,
cubic
yards/yr
8,500
7,000
15,500
Potential hazardous wastes
Spent catalysts
Spent HDN catalyst
Guard bed catalyst
(proprietary solids)
Spent HDS catalyst
Spent ZnS catalyst
Spent FE-CR catalyst
Spent Cu-Zn catalyst
Spent reforming catalyst
Spent methanation catalyst
Spent alumina catalyst
Spent sludge (DEA
filtration)
TOTAL
Others
Separator sludge
Tank bottom sludge
Plant debris
TOTAL
Upgrading units
Upgrading units
Hydrogen unit
(hydrodesulfurizer)
Hydrogen unit
(ZnO guard bed reactor)
Hydrogen unit
(high temp Ishift converter)
Hydrogen unit
(low temp shift converter)
Hydrogen unit
(reformers)
Hydrogen unit
(methanation)
Sulfur unit
Gas recovery
API separator
Water treatment area
Mine and plant site
305
570
18.3
6.7
14.2
33.7
12.8
5.4
80
14.25
1,070.4
500
2,000
50
2,550
500
900
35.9
17.9
25.4
54.4
19.8
8.4
100
12.6
1,674.4
720
2,400
200
3,320
NOTE: This table does not list sedimentjproduced by treatment of the raw water
since the sediment may be suitable for reclamation and will be combined
with the spent shale in the spent shale moisturization procedure.
Source: TOSCO, May 1982
I
I
I
I
I
I
I
I
I
I
I
I
I
I
I
I
90
image:
TABLE 3.2-1.
SUMMARY OF SOLID WASTES ESTIMATED FOR THE
TOSCO SAND WASH PROCESSING FACILITY
Waste material
Sanitary refuse
Construction debris
TOTAL
Source
Sanitary landfill
Surface mine and plant site
Surface mine and plant site
Estimated
quantity,
ton/yr
3,000
2,500
5,500
Estimated
volume ,
cubic
yards/yr
8,500
7,000
15,500
Potential hazardous wastes
Spent catalysts
Spent HDN catalyst
Guard bed catalyst
(proprietary solids)
Spent HDS catalyst
Spent ZnS catalyst
Spent FE-CR catalyst
Spent Cu-Zn catalyst
Spent reforming catalyst
Spent methanation catalyst
Spent alumina catalyst
Spent sludge (DEA
filtration)
TOTAL
Others
Separator sludge
Tank bottom sludge
Plant debris
TOTAL
Upgrading units
Upgrading units
Hydrogen unit
(hydrodesulfurizer)
Hydrogen unit
(ZnO guard bed reactor)
Hydrogen unit
(high temp Ishift converter)
Hydrogen unit
(low temp shift converter)
Hydrogen unit
(reformers)
Hydrogen unit
(methanation)
Sulfur unit
Gas recovery
API separator
Water treatment area
Mine and plant site
305
570
18.3
6.7
14.2
33.7
12.8
5.4
80
14.25
1,070.4
500
2,000
50
2,550
500
900
35.9
17.9
25.4
54.4
19.8
8.4
100
12.6
1,674.4
720
2,400
200
3,320
NOTE: This table does not list sedimentjproduced by treatment of the raw water
since the sediment may be suitable for reclamation and will be combined
with the spent shale in the spent shale moisturization procedure.
Source: TOSCO, May 1982
I
I
I
I
I
I
I
I
I
I
I
I
I
I
I
I
90
image:
 TABLE 3.2-2.
MAJOR WASTE PRODUCED OVER A PERIOD OF 20 YEARS
FOR TOSCO II 47,000 bbl/day PLANT WITH UPGRADING
Stream description
Quantity,
tons
Material quantity
as a percent of
total waste quantity
Raw shale runoff and leachate N.D.a
Raw shale sludge - preheat system 11.31
Processed shale sludge - Ball 0.85
elutriator
Processed shale sludge - 0.57
moisturizer
Processed shale 350.84
Stripped foul water 18.49
Compression condensate - 1.73
Wellman-Lord unit
Coke 5.26
Stripped sour water purge stream 0.75
Revegetation water 14.59
Dust suppression water 9.70
Boiler blowdown 11.04
Boiler feedwater treatment 4.81
concentrate
Cooling tower blowdown 60.31
Storm runoff 4.34
Processed shale leachate N.D.
Spent catalysts 0.005
Treated sanitary water 0.55
Sanitary water treatment sludge N.D.
Service and fire water runoff 0.63
Source water clarifier sludge 2.37
Trash, construction debris, etc. N.D.
TOTAL 498.15
Ni.D.
2.27
0.17
0.11
7Q.43
3.71
0.35
| "
1.06
0.15
2.93
1.95
2.22
0.97
12.11
0.87
N:D.
6.001
0.11
NiD.
6.13
Q. 48
N;D.
99.93
N.D. - not determined.
May be a marketable by-product.
Source: EPA-600/8-83-003, April 1983
91
image:
TABLE 3.2-2.
MAJOR WASTE PRODUCED OVER A PERIOD OF 20 YEARS
FOR TOSCO II 47,000 bbl/day PLANT WITH UPGRADING
Stream description
Quantity,
tons
Material quantity
as a percent of
total waste quantity
Raw shale runoff and leachate N.D.a
Raw shale sludge - preheat system 11.31
Processed shale sludge - Ball 0.85
elutriator
Processed shale sludge - 0.57
moisturizer
Processed shale 350.84
Stripped foul water 18.49
Compression condensate - 1.73
Wellman-Lord unit
Coke 5.26
Stripped sour water purge stream 0.75
Revegetation water 14.59
Dust suppression water 9.70
Boiler blowdown 11.04
Boiler feedwater treatment 4.81
concentrate
Cooling tower blowdown 60.31
Storm runoff 4.34
Processed shale leachate N.D.
Spent catalysts 0.005
Treated sanitary water 0.55
Sanitary water treatment sludge N.D.
Service and fire water runoff 0.63
Source water clarifier sludge 2.37
Trash, construction debris, etc. N.D.
TOTAL 498.15
Ni.D.
2.27
0.17
0.11
7Q.43
3.71
0.35
| "
1.06
0.15
2.93
1.95
2.22
0.97
12.11
0.87
N:D.
6.001
0.11
NiD.
6.13
Q. 48
N;D.
99.93
N.D. - not determined.
May be a marketable by-product.
Source: EPA-600/8-83-003, April 1983
91
image:
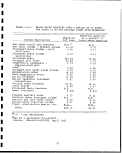 TABLE 3.2-3. PHYSICAL PROPERTIES OF TOSCO II PROCESSED SHALE
Parameter
Geometric mean size
Geometric standard deviation
Permeability
Bulk density
Solids density
Porosity
Maximum size
Minimum size
Unit
cm
—
cm2
g/cc
g/cc
-
cm
cm
_jQuantity
0.007
3.27
2.5 x 10"10
1.30
2.59
0.47
<0.476
>0. 00077
Source:
EPA-600/8-83-003, 1983
TABLE 3.2-4.
SIEVE ANALYSIS OF TOSCO II
SPENT OIL SHALE RESIDUE
Sieve
U.S. standard
No. 8
No. 16
No. 30
No. 50
No. 120
No. 200
Hydrometer
Summation
Opening, Weight retained Percent
mm in grams retained
2.38
1.19
0.595
0.297
0.125
0.074
0.0461
0.0346
0.0336
0.0268
0.0157
0.0077
0
567
390
588
1,170
784
1,134
1,125
2,043
2,882
287
69
11,038
0.00
5.14
3.53
15.33
10.60
7.10
10.28
10.20
18.50
26.10
2.60
0.62
100.00
Cumulative
percent
finer
100.00
94.86
91.33
86.00
75.40
68.30
58.02
47.82
29.32
3.22
0.62
0.00
Source: Margheim, May 1975
92
I
I
I
I
I
I
I
1
1
I
I
1
I
I
1
I
I
I
I
image:
TABLE 3.2-3. PHYSICAL PROPERTIES OF TOSCO II PROCESSED SHALE
Parameter
Geometric mean size
Geometric standard deviation
Permeability
Bulk density
Solids density
Porosity
Maximum size
Minimum size
Unit
cm
—
cm2
g/cc
g/cc
-
cm
cm
_jQuantity
0.007
3.27
2.5 x 10"10
1.30
2.59
0.47
<0.476
>0. 00077
Source:
EPA-600/8-83-003, 1983
TABLE 3.2-4.
SIEVE ANALYSIS OF TOSCO II
SPENT OIL SHALE RESIDUE
Sieve
U.S. standard
No. 8
No. 16
No. 30
No. 50
No. 120
No. 200
Hydrometer
Summation
Opening, Weight retained Percent
mm in grams retained
2.38
1.19
0.595
0.297
0.125
0.074
0.0461
0.0346
0.0336
0.0268
0.0157
0.0077
0
567
390
588
1,170
784
1,134
1,125
2,043
2,882
287
69
11,038
0.00
5.14
3.53
15.33
10.60
7.10
10.28
10.20
18.50
26.10
2.60
0.62
100.00
Cumulative
percent
finer
100.00
94.86
91.33
86.00
75.40
68.30
58.02
47.82
29.32
3.22
0.62
0.00
Source: Margheim, May 1975
92
I
I
I
I
I
I
I
1
1
I
I
1
I
I
1
I
I
I
I
image:
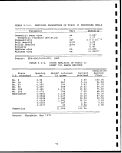 TABLE 3.2-5. HYDRAULIC CONDUCTIVITY MEASUREMENTS
OF TOSCO II RETORTED SHALE
Moisture, Density,
Material wt. % g/cm3
TOSCO II
20.8
11.0
11.4
TOSCO IIa Dry
Permeability at various loadings"
50 psi 100 psi ' 200 psi
1.56
1.39
1.29
1.46
6.8 x
5.6 x
6.7 x
2.8 x
6.2 x 10~6
4.6 x 10~§
4.0 x 10~§
5.6 x 10'
3.9 x 10'
2.5 x 10"
Leaching columns. • \
\
Source: EPA-600/D-84-228, 1984
TABLE 3.2-6. WATER HOLDING CAPACITY3 OF TOSCO II PROCESSED
SHALES AT VARIOUS PRESSURES AND BULK DENSITIES
Sample
Pressure
14.7 psi 44.1 psi 73.5 psi 147 psi
(1 bar) (3 bar) (5 bar) (10 bar)
200 psi
(13.6 bar)
No compaction
Packed to a
BDD=1.30 g/cc
BDb=1.45 g/cc
BDb=1.60 g/cc
48.0
42.2
36.0
34.6
45.8
42.0
33.8
33.5
45.9
41.9
32.9
32.1
43.8
41.6
32.1
30.8
44.7
41.4
30.5
30.5
Table entries are moisture contents (w) expressed on a! weight 7
basis: weight of water per unit weight of dry solids.!
DBD = bulk density. i
Source: EPA-600/D-84-228, 1984 i
93
image:
TABLE 3.2-5. HYDRAULIC CONDUCTIVITY MEASUREMENTS
OF TOSCO II RETORTED SHALE
Moisture, Density,
Material wt. % g/cm3
TOSCO II
20.8
11.0
11.4
TOSCO IIa Dry
Permeability at various loadings"
50 psi 100 psi ' 200 psi
1.56
1.39
1.29
1.46
6.8 x
5.6 x
6.7 x
2.8 x
6.2 x 10~6
4.6 x 10~§
4.0 x 10~§
5.6 x 10'
3.9 x 10'
2.5 x 10"
Leaching columns. • \
\
Source: EPA-600/D-84-228, 1984
TABLE 3.2-6. WATER HOLDING CAPACITY3 OF TOSCO II PROCESSED
SHALES AT VARIOUS PRESSURES AND BULK DENSITIES
Sample
Pressure
14.7 psi 44.1 psi 73.5 psi 147 psi
(1 bar) (3 bar) (5 bar) (10 bar)
200 psi
(13.6 bar)
No compaction
Packed to a
BDD=1.30 g/cc
BDb=1.45 g/cc
BDb=1.60 g/cc
48.0
42.2
36.0
34.6
45.8
42.0
33.8
33.5
45.9
41.9
32.9
32.1
43.8
41.6
32.1
30.8
44.7
41.4
30.5
30.5
Table entries are moisture contents (w) expressed on a! weight 7
basis: weight of water per unit weight of dry solids.!
DBD = bulk density. i
Source: EPA-600/D-84-228, 1984 i
93
image:
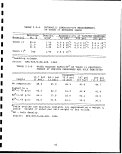 TABLE 3.2-7. REPORTED ANALYSIS OF TOSCO II PROCESSED SHALEa
I
I
I
Weight
Component percent «
Hydrogen (organic) 0^44 ™
Oxygen (organic) NR
Nitrogen (organic) 0.35 H
Carbon (organic) 4.49 •
Sulfur (total) 0.76
Na20 8.68
K20 3.28
CaO , 15.80
MgO 5.31
A1203 6.80
Si02 33.00
Fe2O3 2.52
C02 20.92 •
Loss on ignition H
at 900°C 27.60
aDry basis.
NR - not r
Source: EPA-600/D-84-228, 1984
NR - not reported.
TABLE 3.2-8. SELECTED ELEMENTAL CONCENTRATIONS IN
RAW AND RETORTED TOSCO II OIL SHALES •
I
I
I
I
I
Source: Wildung and Zachara, 198:0.
I
Weight, %
Raw shale Retorted
Org C
C
H
N
S
Ca
K
Mg
Na
Si
Al
Fe
_
_
_
_
_
9.
1.
2.
1.
13.
3.
1.
8
25
6
43
0
4
89
5.
—
—
-
—
11.
1.
3.
1.
16.
4.
2.
shale
5
3
50
9
74
0
2
45
F
Sr
Ba
Mn
B
As
Cu
Cr
Pb
Ni
Zn
Mo
Se
Cd
PPM
Raw shale Retorted
1,020
640
1,310
271
110
70
48
36
30
29
72
28
4.1
1.05
1,490
780
1,580
334
146
82
62
42
41
34
105
36
4
0
shale
.9
.98
94
I
image:
TABLE 3.2-7. REPORTED ANALYSIS OF TOSCO II PROCESSED SHALEa
I
I
I
Weight
Component percent «
Hydrogen (organic) 0^44 ™
Oxygen (organic) NR
Nitrogen (organic) 0.35 H
Carbon (organic) 4.49 •
Sulfur (total) 0.76
Na20 8.68
K20 3.28
CaO , 15.80
MgO 5.31
A1203 6.80
Si02 33.00
Fe2O3 2.52
C02 20.92 •
Loss on ignition H
at 900°C 27.60
aDry basis.
NR - not r
Source: EPA-600/D-84-228, 1984
NR - not reported.
TABLE 3.2-8. SELECTED ELEMENTAL CONCENTRATIONS IN
RAW AND RETORTED TOSCO II OIL SHALES •
I
I
I
I
I
Source: Wildung and Zachara, 198:0.
I
Weight, %
Raw shale Retorted
Org C
C
H
N
S
Ca
K
Mg
Na
Si
Al
Fe
_
_
_
_
_
9.
1.
2.
1.
13.
3.
1.
8
25
6
43
0
4
89
5.
—
—
-
—
11.
1.
3.
1.
16.
4.
2.
shale
5
3
50
9
74
0
2
45
F
Sr
Ba
Mn
B
As
Cu
Cr
Pb
Ni
Zn
Mo
Se
Cd
PPM
Raw shale Retorted
1,020
640
1,310
271
110
70
48
36
30
29
72
28
4.1
1.05
1,490
780
1,580
334
146
82
62
42
41
34
105
36
4
0
shale
.9
.98
94
I
image:
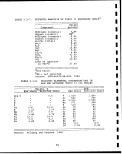 TABLE 3.2-9. SOME POLYCYCLIC AROMATIC HYDROCARBONS :THAT HAVE
BEEN DETECTED IN THE BENZENE EXTRACT OF TOSCO
II SPENT SHALES ;
Compound ppb (W/W)
Benzo(a)pyrene (BaP) 28-55 >
Alkyl I (BaP) _ \
Alkyl II (BaP) _ I
Benzo(ghi)fluoranthene _ j
Benzo(e)pyrene 18-29
Perylene 3_g >
Benzo(ghi)perylene 12-24 '
Anthanthrene 3_5 ; -
Pyrene 58-1021
Fluoranthene 21-23
Benz (a) anthracene. 27-45
Triphenylene 13-34 ;
Penanthrene !
7,12-DimethyIbenz(a)anthracene - !
i
3-Methy1cho1anthrene
Coronene 5 i
Chrysene 30_35 ;
Source: Fox, July 1983
95
image:
TABLE 3.2-9. SOME POLYCYCLIC AROMATIC HYDROCARBONS :THAT HAVE
BEEN DETECTED IN THE BENZENE EXTRACT OF TOSCO
II SPENT SHALES ;
Compound ppb (W/W)
Benzo(a)pyrene (BaP) 28-55 >
Alkyl I (BaP) _ \
Alkyl II (BaP) _ I
Benzo(ghi)fluoranthene _ j
Benzo(e)pyrene 18-29
Perylene 3_g >
Benzo(ghi)perylene 12-24 '
Anthanthrene 3_5 ; -
Pyrene 58-1021
Fluoranthene 21-23
Benz (a) anthracene. 27-45
Triphenylene 13-34 ;
Penanthrene !
7,12-DimethyIbenz(a)anthracene - !
i
3-Methy1cho1anthrene
Coronene 5 i
Chrysene 30_35 ;
Source: Fox, July 1983
95
image:
 •
1
1
TABLE 3.2-10. APPROXIMATE COMPOSITION OF TOSCO II COMBINED
PROCESS WASTEWATER (50,000 bb I/day upgraded fl
shale oil production)
i
Component
Ca+2
Mg+2
Na"1"1
NH4+1
Zn+2
As*5
Cr+6
C03~2
HCOs"1
S04~2
S203"2
P04"3
Cl
CN"1
Phenols
Amines
Organic acids
Neutral oils
TOTALS (rounded)
NOTE: In addition
(less than 1
Cu, Ni, Co,
Concentration ; in water (mg/L
added to spent shale
280
:iOO
670
16
5
0.015-0.3
2
j 360
100
850
90
5
570
5
315
410
1
1,330
960
6,100
to above, elements present in
mg/L) are Pb, ;Ce, Ag, Mo, Zr,
Fe, Mn, V, Ti, K, P, Al, F, B,
Source: DRI No. 5269, April 1980
96
•B
xxy/ ^
1
32
204 |
1
1.8 •
0.0045-0.09 •
0.45
109 |
32 I
261 I
1
1.8
175 1
1.81
127 g
409
295 |
n
1,870
^«w^ ^~v^— . —
Sr, Kb, Br, Se,
Li |
1
1
image:
•
1
1
TABLE 3.2-10. APPROXIMATE COMPOSITION OF TOSCO II COMBINED
PROCESS WASTEWATER (50,000 bb I/day upgraded fl
shale oil production)
i
Component
Ca+2
Mg+2
Na"1"1
NH4+1
Zn+2
As*5
Cr+6
C03~2
HCOs"1
S04~2
S203"2
P04"3
Cl
CN"1
Phenols
Amines
Organic acids
Neutral oils
TOTALS (rounded)
NOTE: In addition
(less than 1
Cu, Ni, Co,
Concentration ; in water (mg/L
added to spent shale
280
:iOO
670
16
5
0.015-0.3
2
j 360
100
850
90
5
570
5
315
410
1
1,330
960
6,100
to above, elements present in
mg/L) are Pb, ;Ce, Ag, Mo, Zr,
Fe, Mn, V, Ti, K, P, Al, F, B,
Source: DRI No. 5269, April 1980
96
•B
xxy/ ^
1
32
204 |
1
1.8 •
0.0045-0.09 •
0.45
109 |
32 I
261 I
1
1.8
175 1
1.81
127 g
409
295 |
n
1,870
^«w^ ^~v^— . —
Sr, Kb, Br, Se,
Li |
1
1
image:
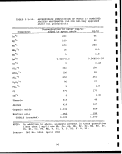 TABLE 3.2-11.
ORGANIC CONTENT OF GAS CONDENSATE
(FOUL WATER) FOR TOSCO II ;
Component
Acids
Phenols
Bases
Neutrals
TOTAL
TOC
Concentration ,
mg/L
1,710
510
680
1,424
4,324
3,160
Mass % of
organics
39
12 •
16 !
33 !
100 1
73
Source: EPA-600/8-83-003, April 1983
TABLE 3.2-12. COMPOSITION OF FOUL WATER FOR TOSCO II
Component
NH3
H2S
C02
Organic acids
Organic phenols
Organic bases
Organic neutrals
HgO
TOTAL
a
Amount in
raw shale'
Ib/ton
0.28
0.036
0.34
0.155
0.046
0.062
0.129
—
a Foul water Coker wash,
flow water flow
Ib/hr (opm) Ib/hr (qpm)
770
99 386
935 - .
426
127
170
355
213,300 (426) 36,050 (72^
216,182 36,436
Total fpul water
Ib/hr (gpm) ma/T,
770i
485:
935j
426'
mi
170;
355 j
249,350: (498)
252,618
3,088
1,945
3,749
1,710
c -i n
ftRO
1,424
Pilot plant data obtained from Metcalf & Eddy Engineers, Octoberi1975.
Estimated from material balances based on data from Colony Development
Operation, 1974, and Whitcombe and Vawter, March 1975. '
Source EPA-600/8-83-003, April 1983 ;
97
image:
TABLE 3.2-11.
ORGANIC CONTENT OF GAS CONDENSATE
(FOUL WATER) FOR TOSCO II ;
Component
Acids
Phenols
Bases
Neutrals
TOTAL
TOC
Concentration ,
mg/L
1,710
510
680
1,424
4,324
3,160
Mass % of
organics
39
12 •
16 !
33 !
100 1
73
Source: EPA-600/8-83-003, April 1983
TABLE 3.2-12. COMPOSITION OF FOUL WATER FOR TOSCO II
Component
NH3
H2S
C02
Organic acids
Organic phenols
Organic bases
Organic neutrals
HgO
TOTAL
a
Amount in
raw shale'
Ib/ton
0.28
0.036
0.34
0.155
0.046
0.062
0.129
—
a Foul water Coker wash,
flow water flow
Ib/hr (opm) Ib/hr (qpm)
770
99 386
935 - .
426
127
170
355
213,300 (426) 36,050 (72^
216,182 36,436
Total fpul water
Ib/hr (gpm) ma/T,
770i
485:
935j
426'
mi
170;
355 j
249,350: (498)
252,618
3,088
1,945
3,749
1,710
c -i n
ftRO
1,424
Pilot plant data obtained from Metcalf & Eddy Engineers, Octoberi1975.
Estimated from material balances based on data from Colony Development
Operation, 1974, and Whitcombe and Vawter, March 1975. '
Source EPA-600/8-83-003, April 1983 ;
97
image:
 TABLE 3.2-13. INORGANIC SPECIES IN TOSCO II FOUL WATER
Component
Concentration ,
mg/L
Ca
„„
Mg
Na
K
++
5
0.4
C03
Cl"
CN
Si
Other components
5
0.3
12
1.3
Range, mg/L
Fe
B ;
Ce, Ag, Sr, Rb, Br, Se, As,
Zn, Cu, Ni, Mn, Ti, P, Al
Pb, Ba, Mo, Zr, Co, Cr, Li
0.1-1.0
0.01-0.1
0.001-0.01
Source: EPA-600/8-83-003, April 1983
98
I
I
I
I
I
I
I
1
I
I
I
I
I
I
I
I
I
I
I
image:
TABLE 3.2-13. INORGANIC SPECIES IN TOSCO II FOUL WATER
Component
Concentration ,
mg/L
Ca
„„
Mg
Na
K
++
5
0.4
C03
Cl"
CN
Si
Other components
5
0.3
12
1.3
Range, mg/L
Fe
B ;
Ce, Ag, Sr, Rb, Br, Se, As,
Zn, Cu, Ni, Mn, Ti, P, Al
Pb, Ba, Mo, Zr, Co, Cr, Li
0.1-1.0
0.01-0.1
0.001-0.01
Source: EPA-600/8-83-003, April 1983
98
I
I
I
I
I
I
I
1
I
I
I
I
I
I
I
I
I
I
I
image:
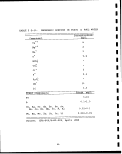 TABLE 3.2-14.
CONCENTRATIONS IN ASTM WATER SHAKE AND RCRA
EXTRACTS - TOSCO II SPENT SHALES ;
Parameter
p.H
EC
ALK
H2COS
HC03
C03
TDS
F
Cl
P04
N0a
S04
Zll
T™* j«*.
Fe
Co
Li
NH3
B
Cd
Be
Mg
P"
Si.
Mo
Mn
Ni
Na
Cu
y. -1
Al
Ca
Ba
K
Cr
Sr
Pb
Ag
TL
Se
As
Hg
Units
)—
p mhos/cm @ 25°
mg/L
mg/L
mg/L
mg/L
mg/L
mg/L
mg/L
mg/L
mg/L
mg/L
mg/L
mg/L
mg/L
mg/L
mg/L
mg/L
mg/L
mg/L
mg/L
mg/L
mg/L
mg/L
mg/L
mg/L
mg/L
mg/L
mg/L
mg/L
mg/L
mg/L
mg/L
mg/L
mg/L
mg/L
mg/L
mg/L
mg/L
mg/L
mg/L
ASTM
4:1
8.69
2650
164
0.88
191
4.0
1970
20.2
9.8
<0.03
16.0
1130
0.020
0.018
<0.005
0.079
0.007
0.644
2.500
<0.001
<0.0005
35
0.18
0.8
1.56
0.053
<0.005
545
<0.001
2.15
31
0.117
8
0.025
0.53
<0.010
<0.001
0.006
<0.020
0.018
<0.001
20:1
9.0l!
740
96 i
0.24:
107
4.7 i
510
7.5
1.9
<0.03 i
19.5 !
238 i
<0.005 l
<0.005
<0.005 !
0.039 i
<0.002
0.067
0.530
<o.ooi ;
<0.0005 ;
14 '•
<0.05
0.28 ;
0.35 i
0.004
0.070
116 i
0.018
3.75 !
17 ;
0.084
1.7 '
0.018 i
0.35 -
<o.oio :
<0.001
<0.005 ;
<0.020 :
0.010
0.001
RCRA
7 72
/ * / £*
5710
2737
140
3325
7.5
8180
22.2
<0.01
2.0
229
0.078
<0.005
<0.005
0.084
0.006
0.60
0.640
0.003
0.0045
81
0.6
1.2
<0.05
1.260
0.055
131
0.014
< 0 . 02
1872
0.780
3.. 9
0.007
16
<0.01
0.002
<0.005
<0.02
<0.01
0.075
Source: EPA-600/D-84-228, 1984
99
image:
TABLE 3.2-14.
CONCENTRATIONS IN ASTM WATER SHAKE AND RCRA
EXTRACTS - TOSCO II SPENT SHALES ;
Parameter
p.H
EC
ALK
H2COS
HC03
C03
TDS
F
Cl
P04
N0a
S04
Zll
T™* j«*.
Fe
Co
Li
NH3
B
Cd
Be
Mg
P"
Si.
Mo
Mn
Ni
Na
Cu
y. -1
Al
Ca
Ba
K
Cr
Sr
Pb
Ag
TL
Se
As
Hg
Units
)—
p mhos/cm @ 25°
mg/L
mg/L
mg/L
mg/L
mg/L
mg/L
mg/L
mg/L
mg/L
mg/L
mg/L
mg/L
mg/L
mg/L
mg/L
mg/L
mg/L
mg/L
mg/L
mg/L
mg/L
mg/L
mg/L
mg/L
mg/L
mg/L
mg/L
mg/L
mg/L
mg/L
mg/L
mg/L
mg/L
mg/L
mg/L
mg/L
mg/L
mg/L
mg/L
ASTM
4:1
8.69
2650
164
0.88
191
4.0
1970
20.2
9.8
<0.03
16.0
1130
0.020
0.018
<0.005
0.079
0.007
0.644
2.500
<0.001
<0.0005
35
0.18
0.8
1.56
0.053
<0.005
545
<0.001
2.15
31
0.117
8
0.025
0.53
<0.010
<0.001
0.006
<0.020
0.018
<0.001
20:1
9.0l!
740
96 i
0.24:
107
4.7 i
510
7.5
1.9
<0.03 i
19.5 !
238 i
<0.005 l
<0.005
<0.005 !
0.039 i
<0.002
0.067
0.530
<o.ooi ;
<0.0005 ;
14 '•
<0.05
0.28 ;
0.35 i
0.004
0.070
116 i
0.018
3.75 !
17 ;
0.084
1.7 '
0.018 i
0.35 -
<o.oio :
<0.001
<0.005 ;
<0.020 :
0.010
0.001
RCRA
7 72
/ * / £*
5710
2737
140
3325
7.5
8180
22.2
<0.01
2.0
229
0.078
<0.005
<0.005
0.084
0.006
0.60
0.640
0.003
0.0045
81
0.6
1.2
<0.05
1.260
0.055
131
0.014
< 0 . 02
1872
0.780
3.. 9
0.007
16
<0.01
0.002
<0.005
<0.02
<0.01
0.075
Source: EPA-600/D-84-228, 1984
99
image:
 TABLE 3.2-15. LEACHABLE MASS AS INDICATED BY RCRA AND
ASTM WATER SHAKE SHAKE EXTRACTION TEST
FOR TOSCO II SPENT SHALES - mg/g
Parameter
Na
Ca
Mg
S04
Cl
F
B
Mo
Al
TDS
RCRA
2.620
37.44
1.620
4.580
0.444
'•*>
10.013
0.010
.0.054
163 . 6
ASTM
2.18
0.124
0.140
4.52
0.039
0.081
0.010
0.006
0.009
7.88
Source: EPA-600/D-84-228, 1984
100
I
I
I
1
I
I
I
I
i
1
I
I
I
I
I
I
I
I
I
image:
TABLE 3.2-15. LEACHABLE MASS AS INDICATED BY RCRA AND
ASTM WATER SHAKE SHAKE EXTRACTION TEST
FOR TOSCO II SPENT SHALES - mg/g
Parameter
Na
Ca
Mg
S04
Cl
F
B
Mo
Al
TDS
RCRA
2.620
37.44
1.620
4.580
0.444
'•*>
10.013
0.010
.0.054
163 . 6
ASTM
2.18
0.124
0.140
4.52
0.039
0.081
0.010
0.006
0.009
7.88
Source: EPA-600/D-84-228, 1984
100
I
I
I
1
I
I
I
I
i
1
I
I
I
I
I
I
I
I
I
image:
 TABLE 3.2-16.
EFFLUENT CONCENTRATIONS - (TOSCO II) SPENT SHALES
CONSTANT RATE INJECTION INTO A DRY COLUMN
vt
L
0.020
0.050
0.100
0.121
0.264
0.287
0.308
0.333
0.355
0.375
0.397
0.418
0.440
0.464
0.488
0.511
0.534
0.556
0.579
0.629
0.965
1.030
1.120
1.191
1.886
2.013
2.25
Ca
545
540
520
505
495
425
410
455
435
395
415
380
345
352
320
330
300
275
265
252
120
83
90
72
26
14
13
Na
10,095
10,060
10,540
10,570
10,520
9,815
9,355
9,440
8,590
7,965
7,420
6,705
5,770
5,490
4,885
4,185
3,744
3,425
3,075
2,605
1,280
945
1,060
715
485
375
420
Cl
mg/L
178
172
176
167
154
163
152
139
133
114
100
92
84
74
61
54
49
45
32
29
19
13
16
12
7
6
7
S04
25,000
25,200
27,400
26,700
26,800
26,800
25,500
24,100
23,400
21,500
20,500
17,000
15,900
14,400
13,500
12,100
11,200
10,300
9,400
7,920
3,210
2,470
2,820
1,820
1,010
660
840
F !
27.0
29.0 !
30.0
30.2 !
39.2
36.3
34.0 :
23.2
28.4
15.9 :
17.2 i
37.8 :
32.6 ;
33.3 !
17.7 '
17.7
18.2 i
19.7 ;
18.3 -
19.1
29.2
29.5 :
29.1
30.5 :
33.5 ;
38.5 :
31.1 ;
i
pH
9.24
9.28
9.29
9.39
9.37
9.31
9.34
9.28
9.30
9.27
9.29
9.26
9.21
9.17
9.25
9.21
9.20
9.13
9.20
9.20
9.10
9.21
9.24
9.27
9.35
9.38
9.25
K = 2.8 x 10
vt ,
^— = pore volume
cm/s
Source: EPA-600/D-84-228, 1984
101
image:
TABLE 3.2-16.
EFFLUENT CONCENTRATIONS - (TOSCO II) SPENT SHALES
CONSTANT RATE INJECTION INTO A DRY COLUMN
vt
L
0.020
0.050
0.100
0.121
0.264
0.287
0.308
0.333
0.355
0.375
0.397
0.418
0.440
0.464
0.488
0.511
0.534
0.556
0.579
0.629
0.965
1.030
1.120
1.191
1.886
2.013
2.25
Ca
545
540
520
505
495
425
410
455
435
395
415
380
345
352
320
330
300
275
265
252
120
83
90
72
26
14
13
Na
10,095
10,060
10,540
10,570
10,520
9,815
9,355
9,440
8,590
7,965
7,420
6,705
5,770
5,490
4,885
4,185
3,744
3,425
3,075
2,605
1,280
945
1,060
715
485
375
420
Cl
mg/L
178
172
176
167
154
163
152
139
133
114
100
92
84
74
61
54
49
45
32
29
19
13
16
12
7
6
7
S04
25,000
25,200
27,400
26,700
26,800
26,800
25,500
24,100
23,400
21,500
20,500
17,000
15,900
14,400
13,500
12,100
11,200
10,300
9,400
7,920
3,210
2,470
2,820
1,820
1,010
660
840
F !
27.0
29.0 !
30.0
30.2 !
39.2
36.3
34.0 :
23.2
28.4
15.9 :
17.2 i
37.8 :
32.6 ;
33.3 !
17.7 '
17.7
18.2 i
19.7 ;
18.3 -
19.1
29.2
29.5 :
29.1
30.5 :
33.5 ;
38.5 :
31.1 ;
i
pH
9.24
9.28
9.29
9.39
9.37
9.31
9.34
9.28
9.30
9.27
9.29
9.26
9.21
9.17
9.25
9.21
9.20
9.13
9.20
9.20
9.10
9.21
9.24
9.27
9.35
9.38
9.25
K = 2.8 x 10
vt ,
^— = pore volume
cm/s
Source: EPA-600/D-84-228, 1984
101
image:
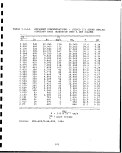 TABLE 3.2-17.
LEVELS OF TRACE ELEMENTS MEASURED IN
RUNOFF AND LEACHATES FROM FIELD TEST
PLOTS OF TOSCO II RETORTED SHALE (ppm)
Runoff from
typical rain
storms
First leachate
from sloping
section of plot
Source: EPA-600/8-83-003, 1983
First leachate
from deepest
portion of bed
Be
Hg
~-—^y
Cd
Sb
Se
Mo
Co
Ni
Pb
As
Cr
Cu
Zr
B
Zn
Li
V
Mn
F
Ba
Fe
0.00002-0.00007
_
_
0.004-0.007
0.03-0.09
0.01
0.05
0.009
0.005-0.008
0.01-0.07
0.02
0.001
_
0.01-0.09
0.02-0.2
0.003
0.004
0.02-3
0.02-0.04
0.09-0.6
0.0006
0.0005
0.006
0.001-0.003
0.002-2
3-74
0.01
0.05-0.02
0.004
0.02
0.004-0.009
0.06-0.2
0.001
0.02-0.9
1
0.007-0.076
0.003-0.006
0.06-0.2
; 2-17
0.06-0.1
0.6-2
—
0.0003
0.003
0.002
2
5-74
0.001-0.04
0.2-0.6
0.003
0.08-0.2
0.004
0.06-0.2
0.003
0.02
1-3
0.07-0.8
0.004-0.1
0.06-0.5
0.006-12
0.1
1-3
102
I
1
I
I
I
I
I
I
1
1
I
1
I
I
I
I
I
I
I
image:
TABLE 3.2-17.
LEVELS OF TRACE ELEMENTS MEASURED IN
RUNOFF AND LEACHATES FROM FIELD TEST
PLOTS OF TOSCO II RETORTED SHALE (ppm)
Runoff from
typical rain
storms
First leachate
from sloping
section of plot
Source: EPA-600/8-83-003, 1983
First leachate
from deepest
portion of bed
Be
Hg
~-—^y
Cd
Sb
Se
Mo
Co
Ni
Pb
As
Cr
Cu
Zr
B
Zn
Li
V
Mn
F
Ba
Fe
0.00002-0.00007
_
_
0.004-0.007
0.03-0.09
0.01
0.05
0.009
0.005-0.008
0.01-0.07
0.02
0.001
_
0.01-0.09
0.02-0.2
0.003
0.004
0.02-3
0.02-0.04
0.09-0.6
0.0006
0.0005
0.006
0.001-0.003
0.002-2
3-74
0.01
0.05-0.02
0.004
0.02
0.004-0.009
0.06-0.2
0.001
0.02-0.9
1
0.007-0.076
0.003-0.006
0.06-0.2
; 2-17
0.06-0.1
0.6-2
—
0.0003
0.003
0.002
2
5-74
0.001-0.04
0.2-0.6
0.003
0.08-0.2
0.004
0.06-0.2
0.003
0.02
1-3
0.07-0.8
0.004-0.1
0.06-0.5
0.006-12
0.1
1-3
102
I
1
I
I
I
I
I
I
1
1
I
1
I
I
I
I
I
I
I
image:
 TABLE 3.2-18.
INORGANIC COMPOSITION OF TOSCO II LEACHATFS
DURING LABORATORY AND FIELD L?S MTER
g/L)
Al
As
Ba
Br
Ca
Cd
Cl
Co
Cr
DOC
EC ((Jmhos/cm)
F
Fe
HC03
Hg
K
Li
Mg
Mn
Mn
11U
M =
Na
Ni
NH4
NOo
N03
Oil and grease
Pb
Rb
S
Sediment
Se
Q-i
WJ.
S04
Sn
Sr
IDS
TOC
U
V
Zn
pH (units)
Bulk density, g/cm3
Solid-to-liquid ratio
Contact time
No. of replicates
Batch
(Runnells
and
Eammaili,
1981)
7.6
<0.2
5.2
<0.02
1.6
<0.02
22
<0.02
<0.01
0.03
96
76
<0.01
<0.05
8
"0.4
0.01
3.2
815
<0.02
2
3
<0.5
<0 . 1
<:L
"*
530
<0.3
0.12
625
<0.15
0.07
2185
<0.5
0.12
<0.01
9.9
0.4 g/mL 1.
17 days 17
2 4
Ldlxadlory studl£ >—
Batch
{Runnells
and
Eanmaili,
1981)
20
0.6
11.5
0.017
1.0
<0.02
52
<0.02
<0.01
<0.01
155
<0.02
<0.06
"10.6
0.2
<0.3
0.01
6.3
1865
<0.02
<2
"3
<0.5
<0 . 1
3
—
1300
<0.3
1.4
1700
<0.18
0.05
5480
<0.5
0.61
<0.01
10.3
0 g/mL
days
Column first
pore volume
(Stollenwerk,
1980 )a
<
6.02
10
1.3
470
230
0.12
0.08
73
~
26
0.24
390
77
1700
0.42
3.9
4700
<0.04
7.7
<0.2
0.1
~
<0.03
0.18
0.18
0.02
6.5
15,700
<0.06
9.8
<0.03
8.0
1.15
2.8 g/mL
46 days
4
Blender ;
(Marqheim 1975)
_
114
7.6
-
,-
1750 !
;
20 :
32 ;
27
165
5.6 •
•"
— i
_
,
_ '
,
™* ,
i
730 ;
'
1262 |
~ |
8.4
0.1 g/mL '
5 min. '
i !
(continued)
103
image:
TABLE 3.2-18.
INORGANIC COMPOSITION OF TOSCO II LEACHATFS
DURING LABORATORY AND FIELD L?S MTER
g/L)
Al
As
Ba
Br
Ca
Cd
Cl
Co
Cr
DOC
EC ((Jmhos/cm)
F
Fe
HC03
Hg
K
Li
Mg
Mn
Mn
11U
M =
Na
Ni
NH4
NOo
N03
Oil and grease
Pb
Rb
S
Sediment
Se
Q-i
WJ.
S04
Sn
Sr
IDS
TOC
U
V
Zn
pH (units)
Bulk density, g/cm3
Solid-to-liquid ratio
Contact time
No. of replicates
Batch
(Runnells
and
Eammaili,
1981)
7.6
<0.2
5.2
<0.02
1.6
<0.02
22
<0.02
<0.01
0.03
96
76
<0.01
<0.05
8
"0.4
0.01
3.2
815
<0.02
2
3
<0.5
<0 . 1
<:L
"*
530
<0.3
0.12
625
<0.15
0.07
2185
<0.5
0.12
<0.01
9.9
0.4 g/mL 1.
17 days 17
2 4
Ldlxadlory studl£ >—
Batch
{Runnells
and
Eanmaili,
1981)
20
0.6
11.5
0.017
1.0
<0.02
52
<0.02
<0.01
<0.01
155
<0.02
<0.06
"10.6
0.2
<0.3
0.01
6.3
1865
<0.02
<2
"3
<0.5
<0 . 1
3
—
1300
<0.3
1.4
1700
<0.18
0.05
5480
<0.5
0.61
<0.01
10.3
0 g/mL
days
Column first
pore volume
(Stollenwerk,
1980 )a
<
6.02
10
1.3
470
230
0.12
0.08
73
~
26
0.24
390
77
1700
0.42
3.9
4700
<0.04
7.7
<0.2
0.1
~
<0.03
0.18
0.18
0.02
6.5
15,700
<0.06
9.8
<0.03
8.0
1.15
2.8 g/mL
46 days
4
Blender ;
(Marqheim 1975)
_
114
7.6
-
,-
1750 !
;
20 :
32 ;
27
165
5.6 •
•"
— i
_
,
_ '
,
™* ,
i
730 ;
'
1262 |
~ |
8.4
0.1 g/mL '
5 min. '
i !
(continued)
103
image:
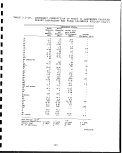 TABLE 3.2-18 (continued)
Field Ivsimeter studies
Al
As
B
Ba
Br
Ca
Cd
Cl
Co
Cr
Cu
DOC
EC (jjmhos/cm)
Fe
HC03
Hg
"3
K
Li
Hg
Hn
Ho
Na
Ki
NH4
K03
N02
Oil and grease
Pb
P04
Kb
s
Sediment
Se
Si
S04
MW^
sn
Sr
TDS
TOC
U
V
Zn
pH (units)
Bulk density, g/cm3
Solid-to-liquid ratio
Contact time
No. of replicates
Runoff
(Margheim,
1975)
-
_
-
.
10-232
-
—
-
-
-
88-1415
-
20-25
-
<0. 06-16
-
_
<l-74
-
-
-
—
_
-
-
_
1300-5500
_
7-726
_
_
-
:
_
7.74-8.52
1.39
0.46-1.0
3.6 hours
Snowmelt
runoff
(Ward and
Reinecke ,
1972)
-
-
-
- '
9-83
-
I :
-
-
- •
58-572
~
13-89
<0.1-1.8
0.9-22
-
- i
0.2-11
-
-
-
—
_ '
- .
-
«-
-
-
16-239
-
-
-
-
I;
_
7.58-8.95
1.39
<0. 01-0. 08
1.4, 4.2 hrs.
Rainfall
runoff
(Metcalf and
Eddy, 1975
0.06-0.2b ,
0.005-0.008
~ V,
0.02-0.04
0.02
15-140
-
o~oib
0.01b
0.02
-
300-1800
1.5-24 .
0.1-0.3b
0. 00002-0. 00007b
4.3-33,
0.02b
13-23 b
0.004
0.03b
35-518
0.02-0.05
~
~
"
7-18
b
0.004-0.03
-
1790-27,450
0.004-0,. 007
0.3-16
-
"~ >>
0.2b
243-4518
2-10
o~oib b
0.01-0.09
7.4-8.15
1.36
0.79
20 min-48 hrs
Percolation
(Metcalf
and Eddy,
1975)
0.09-2
0.02-0.2
0.02-0.9
0.01-0.1
' 0.1-0.7
420-550
0.003-0.006
0.001-0.07
0.003-0.009
0.06-0.2
™
5.2-18
<l-8
<3xlO"6-5x!0"4
59-140
' 0.007-0.8
64-315
0.06-0.5
3-76
7820-17,825
0.05-0.6
"
™
50-163
0.003-0.004
~
0.01-0.03
~
14-120
0.4-2
4-8
29,110-31,120
0.003-0.005
4-6
28,425-57,137
284-647
0.003-0.01
0.9-3
2.5-4.8
1.36
0.79
-
aSamples collected and analyzed in quarter pore volumes. Recorded value is
average for four samples collected over first completed pore volume.
baverage or # range for two samples of runoff collected 16 and 48 hrs. after
start of rainfall. Analyses by spark source mass spectrometry,
is by flameless atomic absorption spectrometry.
Source: Fox, July 1983
104
except H which
I
I
I
I
1
I
I
I
1
I
1
I
I
I
I
1
I
I
image:
TABLE 3.2-18 (continued)
Field Ivsimeter studies
Al
As
B
Ba
Br
Ca
Cd
Cl
Co
Cr
Cu
DOC
EC (jjmhos/cm)
Fe
HC03
Hg
"3
K
Li
Hg
Hn
Ho
Na
Ki
NH4
K03
N02
Oil and grease
Pb
P04
Kb
s
Sediment
Se
Si
S04
MW^
sn
Sr
TDS
TOC
U
V
Zn
pH (units)
Bulk density, g/cm3
Solid-to-liquid ratio
Contact time
No. of replicates
Runoff
(Margheim,
1975)
-
_
-
.
10-232
-
—
-
-
-
88-1415
-
20-25
-
<0. 06-16
-
_
<l-74
-
-
-
—
_
-
-
_
1300-5500
_
7-726
_
_
-
:
_
7.74-8.52
1.39
0.46-1.0
3.6 hours
Snowmelt
runoff
(Ward and
Reinecke ,
1972)
-
-
-
- '
9-83
-
I :
-
-
- •
58-572
~
13-89
<0.1-1.8
0.9-22
-
- i
0.2-11
-
-
-
—
_ '
- .
-
«-
-
-
16-239
-
-
-
-
I;
_
7.58-8.95
1.39
<0. 01-0. 08
1.4, 4.2 hrs.
Rainfall
runoff
(Metcalf and
Eddy, 1975
0.06-0.2b ,
0.005-0.008
~ V,
0.02-0.04
0.02
15-140
-
o~oib
0.01b
0.02
-
300-1800
1.5-24 .
0.1-0.3b
0. 00002-0. 00007b
4.3-33,
0.02b
13-23 b
0.004
0.03b
35-518
0.02-0.05
~
~
"
7-18
b
0.004-0.03
-
1790-27,450
0.004-0,. 007
0.3-16
-
"~ >>
0.2b
243-4518
2-10
o~oib b
0.01-0.09
7.4-8.15
1.36
0.79
20 min-48 hrs
Percolation
(Metcalf
and Eddy,
1975)
0.09-2
0.02-0.2
0.02-0.9
0.01-0.1
' 0.1-0.7
420-550
0.003-0.006
0.001-0.07
0.003-0.009
0.06-0.2
™
5.2-18
<l-8
<3xlO"6-5x!0"4
59-140
' 0.007-0.8
64-315
0.06-0.5
3-76
7820-17,825
0.05-0.6
"
™
50-163
0.003-0.004
~
0.01-0.03
~
14-120
0.4-2
4-8
29,110-31,120
0.003-0.005
4-6
28,425-57,137
284-647
0.003-0.01
0.9-3
2.5-4.8
1.36
0.79
-
aSamples collected and analyzed in quarter pore volumes. Recorded value is
average for four samples collected over first completed pore volume.
baverage or # range for two samples of runoff collected 16 and 48 hrs. after
start of rainfall. Analyses by spark source mass spectrometry,
is by flameless atomic absorption spectrometry.
Source: Fox, July 1983
104
except H which
I
I
I
I
1
I
I
I
1
I
1
I
I
I
I
1
I
I
image:
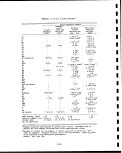 3.3 PARAHO DIRECT HEATING MODE OIL SHALE RETORTING
3.3.1 Retorting Operation I
The Paraho retort was developed by modifying the USBM vertical
kiln technology [Shih, 1979]]. In demonstration runs at Anvil
Points, Colorado, the Paraho direct mode was used to produce more
than 100,0000 barrels of shale oil for the U.S. Navy. It was
refined to products meeting all specifications. i
A schematic diagram of the Paraho direct mode is presented in
Figure 3.3-1. The crushed shale, flowing downward, is contacted
with a countercurrent stream of hot gases having sufficient heat
content to pryolyze the kerogen in the shale. The oil is carried
out of the top of the retort as a stable mist with the1 gas stream,
and the retorted shale is removed from the bottom of the retort
through a hydraulically-operated grate. The process is continuous.
Raw oil shale, crushed to a 1/4 to 3 in. size, is spread evenly
across the top of the shale bed in the retort where it; is preheated
by the rising hot gases. Raw shale fines, less than a/4 in. are
screened from the retort feed to avoid lowering the bed porosity
and increasing the resistance to the countercurrent gas flow. The
shale moves downward by gravity through the mist formation and
preheating zone into the retorting zone where the temperature is
increased to retorting temperatures to produce gas, oil, and coke.
This residue of coke, or char, about 4.5 per cent by weight of
organic carbon, remains on the shale. As the shale continues
downward into the combustion zone, much of the heat used for
direct mode retorting is supplied by the combustion iof the coke
residue. Air, used for combustion, is mixed with recycle gas to
control flame temperatures and assure even gas distribution.
This air-gas mixture is introduced at several levels ;in the com-
bustion zone. Additional recycle gas is introduced;through the
bottom grate to cool the shale as it passes throughithe cooling
zone. The retorted shale leaves the retort at approximatley 300°F.
The hot gases are cooled by the incoming shale in the mist
formation zone to approximately 145°F to produce a stable oil mist.
The oil mist is separated from the offgas by oil mist separators
(coalescers) and an electrostatic precipitator. The oil yield
from the Paraho direct mode is about 93 percent of Fischer assay.
Part of the oil-free gas is recycled to the retdrt and the
remainder is available as plant fuel. !
3.3.2 Solid Waste \
The process operations for the Paraho direct mode process are
presented in Figure 3.3-2. This figure shows the block-flow dia-
gram for commercial-scale operations designed for the Paraho-Ute
project in Utah [Paraho, June 1982]. Raw shale mining, crushing,
screening, and stockpiling will generate dusts that will be
controlled by a variety of control devices. The raw shale dust,
105
image:
3.3 PARAHO DIRECT HEATING MODE OIL SHALE RETORTING
3.3.1 Retorting Operation I
The Paraho retort was developed by modifying the USBM vertical
kiln technology [Shih, 1979]]. In demonstration runs at Anvil
Points, Colorado, the Paraho direct mode was used to produce more
than 100,0000 barrels of shale oil for the U.S. Navy. It was
refined to products meeting all specifications. i
A schematic diagram of the Paraho direct mode is presented in
Figure 3.3-1. The crushed shale, flowing downward, is contacted
with a countercurrent stream of hot gases having sufficient heat
content to pryolyze the kerogen in the shale. The oil is carried
out of the top of the retort as a stable mist with the1 gas stream,
and the retorted shale is removed from the bottom of the retort
through a hydraulically-operated grate. The process is continuous.
Raw oil shale, crushed to a 1/4 to 3 in. size, is spread evenly
across the top of the shale bed in the retort where it; is preheated
by the rising hot gases. Raw shale fines, less than a/4 in. are
screened from the retort feed to avoid lowering the bed porosity
and increasing the resistance to the countercurrent gas flow. The
shale moves downward by gravity through the mist formation and
preheating zone into the retorting zone where the temperature is
increased to retorting temperatures to produce gas, oil, and coke.
This residue of coke, or char, about 4.5 per cent by weight of
organic carbon, remains on the shale. As the shale continues
downward into the combustion zone, much of the heat used for
direct mode retorting is supplied by the combustion iof the coke
residue. Air, used for combustion, is mixed with recycle gas to
control flame temperatures and assure even gas distribution.
This air-gas mixture is introduced at several levels ;in the com-
bustion zone. Additional recycle gas is introduced;through the
bottom grate to cool the shale as it passes throughithe cooling
zone. The retorted shale leaves the retort at approximatley 300°F.
The hot gases are cooled by the incoming shale in the mist
formation zone to approximately 145°F to produce a stable oil mist.
The oil mist is separated from the offgas by oil mist separators
(coalescers) and an electrostatic precipitator. The oil yield
from the Paraho direct mode is about 93 percent of Fischer assay.
Part of the oil-free gas is recycled to the retdrt and the
remainder is available as plant fuel. !
3.3.2 Solid Waste \
The process operations for the Paraho direct mode process are
presented in Figure 3.3-2. This figure shows the block-flow dia-
gram for commercial-scale operations designed for the Paraho-Ute
project in Utah [Paraho, June 1982]. Raw shale mining, crushing,
screening, and stockpiling will generate dusts that will be
controlled by a variety of control devices. The raw shale dust,
105
image:
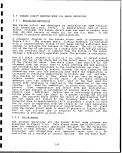 1
1
PRODUCT I
GAS
RAW SHALE
A
/
^ RETOF
MIST FORMATION ZONE
J
RETORTING ZONE
I TOP
COMBUSTION D'STRIBUT
ZONE
1 ' MID
i k DISTRIBUT
RPTCJHTCn CMAI C
nc iwn i cu OFIMI.C
COOLING ZONE
V
\ ,
y
\ ^
0 hi- GAS OIL/GAS £") *"
'T SEPARATORS ^^
1 RECYCLE GAS
PRODUCT OIL BLOWER
^ ! TOP DILUTION GAS \
TOP AIR
MID DILUTION GAS 1
OR jk
MID
AIR ** r^i AIR
AIR BLOWER
^ BOTTOM COOLING GAS 1
/
1
i
RECYCLE
, MS 1
I
I
1
1
. RETORTED SHALE •
1
Figure 3.3-1. Schematic of Paraho direct heating mode process.
Source :
DOE/EV-0086, June. 1980 1
1
1
1
106 •
image:
1
1
PRODUCT I
GAS
RAW SHALE
A
/
^ RETOF
MIST FORMATION ZONE
J
RETORTING ZONE
I TOP
COMBUSTION D'STRIBUT
ZONE
1 ' MID
i k DISTRIBUT
RPTCJHTCn CMAI C
nc iwn i cu OFIMI.C
COOLING ZONE
V
\ ,
y
\ ^
0 hi- GAS OIL/GAS £") *"
'T SEPARATORS ^^
1 RECYCLE GAS
PRODUCT OIL BLOWER
^ ! TOP DILUTION GAS \
TOP AIR
MID DILUTION GAS 1
OR jk
MID
AIR ** r^i AIR
AIR BLOWER
^ BOTTOM COOLING GAS 1
/
1
i
RECYCLE
, MS 1
I
I
1
1
. RETORTED SHALE •
1
Figure 3.3-1. Schematic of Paraho direct heating mode process.
Source :
DOE/EV-0086, June. 1980 1
1
1
1
106 •
image:
 to
u
o
*!
g CS
g cb
o e^
o TTI
o d)
43 C
fl3 0
M *~>
(0 '
6
ca* I
V rt
en to
..
0) (1)
M O
£j M
&> 3
•H O
fa W
107
image:
to
u
o
*!
g CS
g cb
o e^
o TTI
o d)
43 C
fl3 0
M *~>
(0 '
6
ca* I
V rt
en to
..
0) (1)
M O
£j M
&> 3
•H O
fa W
107
image:
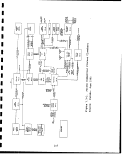 I
1
collected by these devices will be disposed as a solid in the raw »
shalS fines storage area. Future plans call for the utilization
of these raw shale fines for their energy value The total raw |
shal? rejects (fines plus dust) will be about 7,500 tons per day. fl]
The Paraho direct mode retorting operation, designed to Produce «,
42?300 barrels of hydrotreated shale oil per day, will produce |
about 52,000 tons of retorted shale per day. This represents by
far, the largest solid waste stream. The retorted shale will be
disposed in an above-ground site designed to minimize water •
infiltration, runoff, and percolation. The retorted shale will be •
Sansferred from the retort to the disposal area using covered
conveyors, an enclosed silo, and covered bottom dump trucks. The H
bulk of tlie shale will be spread in 8 to 10 in. layers, wetted to |
about 10% by weight on the surface for dust control, and subjected
to light compaction. v flj
Additional water will be used to construct special water- imperious
liners and, in case of emergencies, to control excessive tempera-
tures This water, used for retorted shale dust control, liner |
construction, and emergency temperature control, will consist of a H
mixture of treated process water and river water. Water usage tor
both raw shale fines storage and retorted shale disposal will be m
about 925 gal. per minute. H
The crude shale oil, obtained from the oil recovery system, is
dewatered and subjected to on-site hydrotreating to produce a •
pipeline quality, marketable product. This hydrotreating and its W»
auxiliary processes produce a variety of spent catalysts which
constitute potential solid wastes. •
The product gas, hydrotreater off gas, and wastewater _ off gas are
subjected to ammonia and sulfur irecovery prior to being used as «
plant fuel. Sulfur recovery, will produce additional solid ||
wastes .
Sour water from oil recovery, hydrotreating, ammonia plant •
and Stretford units is treated in a wastewater treater. B
This treatment will produce additional solid wastes.
Finally, solid wastes will be generated from normal construction, §
scrap, and sanitary wastes.
The amounts of these solid waste streams and their characteristics |
have been compiled in Table 3.3-1. Although these, wastes are
presented as average annual rates, most of these materials are not
processed on a daily basis. Detailed characterization data are |
™
not available.
108
I
I
image:
I
1
collected by these devices will be disposed as a solid in the raw »
shalS fines storage area. Future plans call for the utilization
of these raw shale fines for their energy value The total raw |
shal? rejects (fines plus dust) will be about 7,500 tons per day. fl]
The Paraho direct mode retorting operation, designed to Produce «,
42?300 barrels of hydrotreated shale oil per day, will produce |
about 52,000 tons of retorted shale per day. This represents by
far, the largest solid waste stream. The retorted shale will be
disposed in an above-ground site designed to minimize water •
infiltration, runoff, and percolation. The retorted shale will be •
Sansferred from the retort to the disposal area using covered
conveyors, an enclosed silo, and covered bottom dump trucks. The H
bulk of tlie shale will be spread in 8 to 10 in. layers, wetted to |
about 10% by weight on the surface for dust control, and subjected
to light compaction. v flj
Additional water will be used to construct special water- imperious
liners and, in case of emergencies, to control excessive tempera-
tures This water, used for retorted shale dust control, liner |
construction, and emergency temperature control, will consist of a H
mixture of treated process water and river water. Water usage tor
both raw shale fines storage and retorted shale disposal will be m
about 925 gal. per minute. H
The crude shale oil, obtained from the oil recovery system, is
dewatered and subjected to on-site hydrotreating to produce a •
pipeline quality, marketable product. This hydrotreating and its W»
auxiliary processes produce a variety of spent catalysts which
constitute potential solid wastes. •
The product gas, hydrotreater off gas, and wastewater _ off gas are
subjected to ammonia and sulfur irecovery prior to being used as «
plant fuel. Sulfur recovery, will produce additional solid ||
wastes .
Sour water from oil recovery, hydrotreating, ammonia plant •
and Stretford units is treated in a wastewater treater. B
This treatment will produce additional solid wastes.
Finally, solid wastes will be generated from normal construction, §
scrap, and sanitary wastes.
The amounts of these solid waste streams and their characteristics |
have been compiled in Table 3.3-1. Although these, wastes are
presented as average annual rates, most of these materials are not
processed on a daily basis. Detailed characterization data are |
™
not available.
108
I
I
image:
 feedstocks on offsite reclamation plants. The hazardous wastes
will be transported to an approved offsite hazardous waste
disposal area. :
The dusts (raw shale, retorted shale, surficial soils,' overburden,
and unit operations) produced from the Paraho-Ute facility will be
about 250 tons per day [Paraho, 1982]. i
i
3 .3.. 3 Characteristics of Solid Wastes I
The retorted shale produced by the Paraho direct mode operations
has been subjected to extensive characterization studies. These
retorted shale physical and chemical characteristics :are compiled
Tables 3.3-2 to 3.3-4. Detailed physical properties are available
in the literature. Due to the varied research operations
performed during most of these characterization studies, along
with variations of these studies, these data exhibit wide
variations and inevitable uncertainty. '
Since all of the water produced during the retorting and auxiliary
operations will be treated and used for dust control >(co-disposed
with the retorted shale), the characteristics of these process
waters are listed in Tables 3.3-4 to 3.3-9. At the present time,
there have been two types of process water that have been studied:
the product water (Tables 3.3-4 to 3.3-8), co-produced with the
crude shale oil and separated from oil tank bottoms; gas
condensate, (Table 3.3-9) water condensed from the iproduct gas
after oil-water separation. The data in Table 3.3-9 contain
uncertainties about the operation and may not depict actual
commercial operations. '
Tables 3.3-10 and 3.3-11 present leachate data from the RCRA and
ASTM water shake tests. Table 3.3-12 presents data from laboratory
tests in which certain pore volumes of water were passed through
a column of shale. Finally Table 3.3-13 summarizes field data
obtained from field lysimeter studies. i
It should be noted that various investigators have studied
characteristics of solid wastes for Paraho Direct process.
Only selected data are presented in the above mentioned
Tables 3.3-2 to 3.3-13.
109
image:
feedstocks on offsite reclamation plants. The hazardous wastes
will be transported to an approved offsite hazardous waste
disposal area. :
The dusts (raw shale, retorted shale, surficial soils,' overburden,
and unit operations) produced from the Paraho-Ute facility will be
about 250 tons per day [Paraho, 1982]. i
i
3 .3.. 3 Characteristics of Solid Wastes I
The retorted shale produced by the Paraho direct mode operations
has been subjected to extensive characterization studies. These
retorted shale physical and chemical characteristics :are compiled
Tables 3.3-2 to 3.3-4. Detailed physical properties are available
in the literature. Due to the varied research operations
performed during most of these characterization studies, along
with variations of these studies, these data exhibit wide
variations and inevitable uncertainty. '
Since all of the water produced during the retorting and auxiliary
operations will be treated and used for dust control >(co-disposed
with the retorted shale), the characteristics of these process
waters are listed in Tables 3.3-4 to 3.3-9. At the present time,
there have been two types of process water that have been studied:
the product water (Tables 3.3-4 to 3.3-8), co-produced with the
crude shale oil and separated from oil tank bottoms; gas
condensate, (Table 3.3-9) water condensed from the iproduct gas
after oil-water separation. The data in Table 3.3-9 contain
uncertainties about the operation and may not depict actual
commercial operations. '
Tables 3.3-10 and 3.3-11 present leachate data from the RCRA and
ASTM water shake tests. Table 3.3-12 presents data from laboratory
tests in which certain pore volumes of water were passed through
a column of shale. Finally Table 3.3-13 summarizes field data
obtained from field lysimeter studies. i
It should be noted that various investigators have studied
characteristics of solid wastes for Paraho Direct process.
Only selected data are presented in the above mentioned
Tables 3.3-2 to 3.3-13.
109
image:
 TABLE 3.3-1. PARAHO DIRECT SOLID WASTES:
(42,300 barrel per day plant)
Quantity & design
Solids waste case rates
Construction debris 16,000 cu yd (first
and garbage 3 years)
Raw shale fines 7,385 TPSD (max)
Retorted shale 52,235 TPSD
Wastewater treatment 2,468 TPSD (wet
sludge basis, 0.6% solids)
Sulfur, crystalline 95 TPSD
cake
Scrap and garbage 4.6 T/D
Oil filter particles 64 TPSD (50% oil)
ZnO catalyst 250 cu ft/6 mo
Lo-temp CO shift 2,600 cu ft/2 yr
catalyst
Methanator catalyst 600 cu ft/2 yr
Reformer catalyst 1,500 cu ft/2 yr
Hydrotreater catalyst (Confidential)
(ICR-106)
API separator bottoms 0.9 T/D
Air floatation unit 0.09 T/D
float
High- temp CO shift 1,750 cu ft/2 yr
catalyst
Arsenic guard bed 9,600 cu ft/6 mo
catalyst
aEstimated solids
•u
Construction only.
GNot a waste; feeds taken for future use.
^Not a waste; feeds taken for reclamation.
eOff-site disposal, EPA-approved site.
TYPES AND QUANTITIES
Thousand tons/yeara
5.3b
2,450°
17,250
4.8
31.4
1.6
21. ld
18.8;;
488°
^
25d
0 .3
0.03
32. 8e
_
720
1
1
1
Ov
1
*
1
1
I
1
1
n
.
•
Source: Paraho , June 1982 and Heistand, 1984. V
i
110
1
1
image:
TABLE 3.3-1. PARAHO DIRECT SOLID WASTES:
(42,300 barrel per day plant)
Quantity & design
Solids waste case rates
Construction debris 16,000 cu yd (first
and garbage 3 years)
Raw shale fines 7,385 TPSD (max)
Retorted shale 52,235 TPSD
Wastewater treatment 2,468 TPSD (wet
sludge basis, 0.6% solids)
Sulfur, crystalline 95 TPSD
cake
Scrap and garbage 4.6 T/D
Oil filter particles 64 TPSD (50% oil)
ZnO catalyst 250 cu ft/6 mo
Lo-temp CO shift 2,600 cu ft/2 yr
catalyst
Methanator catalyst 600 cu ft/2 yr
Reformer catalyst 1,500 cu ft/2 yr
Hydrotreater catalyst (Confidential)
(ICR-106)
API separator bottoms 0.9 T/D
Air floatation unit 0.09 T/D
float
High- temp CO shift 1,750 cu ft/2 yr
catalyst
Arsenic guard bed 9,600 cu ft/6 mo
catalyst
aEstimated solids
•u
Construction only.
GNot a waste; feeds taken for future use.
^Not a waste; feeds taken for reclamation.
eOff-site disposal, EPA-approved site.
TYPES AND QUANTITIES
Thousand tons/yeara
5.3b
2,450°
17,250
4.8
31.4
1.6
21. ld
18.8;;
488°
^
25d
0 .3
0.03
32. 8e
_
720
1
1
1
Ov
1
*
1
1
I
1
1
n
.
•
Source: Paraho , June 1982 and Heistand, 1984. V
i
110
1
1
image:
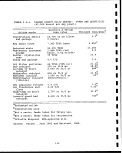 TABLE 3.3-2. PARAHO DIRECT RETORTED SHALE CHARACTERISTICS
A.
Size Classification
'
Unified Soil Classification System !
B.
C.
.D.
Designation
Cobble
Gravel
Sand
Silt
Clay
Density
Compactive effort
ft.-lb/cu. ft.
Light, 6,200
Std. Proctor, 12,375
Heavy, 56,250
Strength
Days curing
28
60
Permeability
Compactive effort
ft.-lb/cu. ft.
Light, 6,200
Heavy, 56,250
Size, mm Weight percent
+38.1 ! 3.9
4.76 - 38.1 ; 51.8
0.074 - 4.76 ! 21.7
0.005 - 0.074 ! 20.7
-0.005 ; 1.9
i
Water Added ;
Density, Ib/cu. ft.
None Optimum, 22 wt._%
86 88
90 93
96 9!8
i
i
Compressive strength, psi
19ti
200
;
Permeability, ft/yr
Loading No | Optimum
psi water i water
50 40 6.3
100 27 1.3
200 18 i 0.8
50 35 ; 1.0
100 30 i 0.6
200 23 0.1
Source: Holtz, 1976.
Ill
image:
TABLE 3.3-2. PARAHO DIRECT RETORTED SHALE CHARACTERISTICS
A.
Size Classification
'
Unified Soil Classification System !
B.
C.
.D.
Designation
Cobble
Gravel
Sand
Silt
Clay
Density
Compactive effort
ft.-lb/cu. ft.
Light, 6,200
Std. Proctor, 12,375
Heavy, 56,250
Strength
Days curing
28
60
Permeability
Compactive effort
ft.-lb/cu. ft.
Light, 6,200
Heavy, 56,250
Size, mm Weight percent
+38.1 ! 3.9
4.76 - 38.1 ; 51.8
0.074 - 4.76 ! 21.7
0.005 - 0.074 ! 20.7
-0.005 ; 1.9
i
Water Added ;
Density, Ib/cu. ft.
None Optimum, 22 wt._%
86 88
90 93
96 9!8
i
i
Compressive strength, psi
19ti
200
;
Permeability, ft/yr
Loading No | Optimum
psi water i water
50 40 6.3
100 27 1.3
200 18 i 0.8
50 35 ; 1.0
100 30 i 0.6
200 23 0.1
Source: Holtz, 1976.
Ill
image:
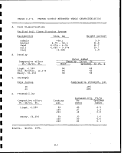 TABLE 3.3-3. PARAHO DIRECT RETORTED SHALE
MAJOR ELEMENTS (wt. %)
Elements
WCC
BNW1
CSM
BNW2
Battelle Paraho DRI
Aluminum 1.27 4.7 4.6 4.83
Calcium 11.5 13.4 12.0 13.4 13.3
Carbon, min. 4.95 3.73 4.42
Carbon, org. 1.86 2.39 2.31
Iron 2.03 2.45 2.31 2.56 2.40
Magnesium 4.22 4.21 4.47 4.32
Nitrogen 0.58 0.22 0.3
Potassium 0.6 1.82 1.85 1.86
Silicon 16.1 17.7 18.0 13.2
Sodium 1.48 2.24 2.36 2.19
Sulfur .. 0.48 0.77 0.8
Titanium 0.22 0.22
NOTES AND SOURCES:
WCC [Holtz, 1976]
BNW1 - weighted means, August 1977 [DOE/EV-0086, June 1980]
CSM - means, August-September 1977 [DOE/EV-0086, June 1980]
BNW2 - weighted means, November 1977 [DOE/EV-0086, June 1980]
Battelle [Battelle PNL 3830]
Paraho - means, 1977-1978 [DOE/EV-0086, June 1980]
DRI [DRI, June 1977]
112
I
I
I
I
I
I
I
I
I
I
I
I
I
I
I
I
I
1
I
image:
TABLE 3.3-3. PARAHO DIRECT RETORTED SHALE
MAJOR ELEMENTS (wt. %)
Elements
WCC
BNW1
CSM
BNW2
Battelle Paraho DRI
Aluminum 1.27 4.7 4.6 4.83
Calcium 11.5 13.4 12.0 13.4 13.3
Carbon, min. 4.95 3.73 4.42
Carbon, org. 1.86 2.39 2.31
Iron 2.03 2.45 2.31 2.56 2.40
Magnesium 4.22 4.21 4.47 4.32
Nitrogen 0.58 0.22 0.3
Potassium 0.6 1.82 1.85 1.86
Silicon 16.1 17.7 18.0 13.2
Sodium 1.48 2.24 2.36 2.19
Sulfur .. 0.48 0.77 0.8
Titanium 0.22 0.22
NOTES AND SOURCES:
WCC [Holtz, 1976]
BNW1 - weighted means, August 1977 [DOE/EV-0086, June 1980]
CSM - means, August-September 1977 [DOE/EV-0086, June 1980]
BNW2 - weighted means, November 1977 [DOE/EV-0086, June 1980]
Battelle [Battelle PNL 3830]
Paraho - means, 1977-1978 [DOE/EV-0086, June 1980]
DRI [DRI, June 1977]
112
I
I
I
I
I
I
I
I
I
I
I
I
I
I
I
I
I
1
I
image:
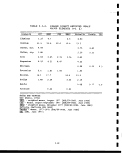 TABLE 3.3-4. PARAHO DIRECT RETORTED SHALE
TRACE ELEMENTS (ppm)
Elements A B C D E F
Antimony 2.8 2.9 0.7
Arsenic 59 60 44 21 59 30
Barium 625 586 737 800
Beryllium - - - 2
Boron 120 190 96 52 107 65
Bromine 0.8 <l 0.6
Cadmium 0.9 0.6
Cerium 52
Cesium 4.7
Chromium 41 37 136 44
Cobalt 10 11 13
Copper 53 42 57 44 56
Dysprosium 2.4
Europium 0.71 0.82
Fluorine 1900 1000 1660 1000 150
Gallium 11.5 7.8 11.7
Hafnium 2.1 2.1
Holmium 0.9
Lanthanum 24
Lead 34 32 33 18 35
Lutecium 0.4
113
! ' ' '
G
i
54
-
100
(continued)
image:
TABLE 3.3-4. PARAHO DIRECT RETORTED SHALE
TRACE ELEMENTS (ppm)
Elements A B C D E F
Antimony 2.8 2.9 0.7
Arsenic 59 60 44 21 59 30
Barium 625 586 737 800
Beryllium - - - 2
Boron 120 190 96 52 107 65
Bromine 0.8 <l 0.6
Cadmium 0.9 0.6
Cerium 52
Cesium 4.7
Chromium 41 37 136 44
Cobalt 10 11 13
Copper 53 42 57 44 56
Dysprosium 2.4
Europium 0.71 0.82
Fluorine 1900 1000 1660 1000 150
Gallium 11.5 7.8 11.7
Hafnium 2.1 2.1
Holmium 0.9
Lanthanum 24
Lead 34 32 33 18 35
Lutecium 0.4
113
! ' ' '
G
i
54
-
100
(continued)
image:
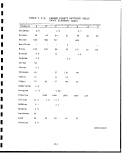 TABLE 3.3-4 (continued)
Elements
Manganese
Mercury
Molybdenum
Nickel
Niobium
Rubidium
Samarium
Scandium
Selenium
Strontium
Tantalum
Terbium
Thorium
Uranium
Ytterbium
Zinc
Zirconium
A
416
0.03
33
34
10.3
85
4.1
7.1
2.9
832
0.7
0.4
7.0
5.2
16
85
70
B CD E F G
332 411 600 396
0.02 0.07 0.04 0.06
43 33 12 31 16 28
35 35 38 32
7.0 7.0
97 87
3.6
7.0
1.6 3.3 0.3 3.3 0.5 2.0
935 877 800
7.5 :
1
14 15
68 71 16 82
68 71 42
NOTES AND SOURCES:
A - BNW, weighted means, August 1977 [DOE/EV-0086, June 1980]
B - CSM, means, August-September 1977 [DOE/EV-0086, June 1980]
C - BNW, weighted means, November 1977 [DOE/EV-0086, June 1980]
D - TRW, May 1977
E - Battelle PNL 3830 ;
F - DRI, June 1977
G - Stollenwork and Rumell, 1981
114
I
I
I
1
1
1
1
1
I
I
I
I
I
I
I
I
I
I
I
image:
TABLE 3.3-4 (continued)
Elements
Manganese
Mercury
Molybdenum
Nickel
Niobium
Rubidium
Samarium
Scandium
Selenium
Strontium
Tantalum
Terbium
Thorium
Uranium
Ytterbium
Zinc
Zirconium
A
416
0.03
33
34
10.3
85
4.1
7.1
2.9
832
0.7
0.4
7.0
5.2
16
85
70
B CD E F G
332 411 600 396
0.02 0.07 0.04 0.06
43 33 12 31 16 28
35 35 38 32
7.0 7.0
97 87
3.6
7.0
1.6 3.3 0.3 3.3 0.5 2.0
935 877 800
7.5 :
1
14 15
68 71 16 82
68 71 42
NOTES AND SOURCES:
A - BNW, weighted means, August 1977 [DOE/EV-0086, June 1980]
B - CSM, means, August-September 1977 [DOE/EV-0086, June 1980]
C - BNW, weighted means, November 1977 [DOE/EV-0086, June 1980]
D - TRW, May 1977
E - Battelle PNL 3830 ;
F - DRI, June 1977
G - Stollenwork and Rumell, 1981
114
I
I
I
1
1
1
1
1
I
I
I
I
I
I
I
I
I
I
I
image:
 TABLE 3.3-5.
PARAHO DIRECT PRODUCT WATER'
BULK PROPERTIES (wt. %)
Date
5/77
6/77
7/77
8/77
8/77
9/77
9/77
10/77
11/77
11/77
12/77
1/78
2/78
4/78
5/78
6/78
6/78
7/78
7/78
8/78
8/78
9/78
Other
H2S,
TOC,
a
Lab
PAR
PAR
PAR
BNW
PAR
PAR
CSM
PAR
BNW
PAR
PAR
PAR
PAR
PAR
PAR
CSM
PAR
CSM
PAR
PAR
BNW
PAR
C
5
.1
4.3
4
2.
3.
4.
4.
4.
2.
3.
5.
4.
7.
5.
4.
6.
8.
1
4
0
5
6
3
4
6
4
0
4
9
8
1
1
3
2
3
2
2
3
2
2
2
2
3
1
3
6
3
4
N
.7
.9
.1
.2
.1
.0
.9
.8
.6
.4
.0
.7
.8
.1
.9
.4
5.6
S
3
.5
4.3
5.
3.9 -
3.
1
• 5.1
5
2.7
3.
8
2.2 - 4.8
4.4
4.
4.
3.
3.
5.
2.8 -
4.
2.7 -
4.
4.
6.
5
4
9
1
7
3.1
3
2.9
3
4
5
Mm
3
CO? Alkalinity t>H
.0
3,4 1
1
2.7 !
4
3.
4
4.
3.
4.
3.
0.
4.
?
2.
3 .
3.
1.
1
o
5
9
4
5
8
7
8.8 - 8.9
8.5 - 8.6
ft R
2.6 - 7 . 8i 8.6 - 9.1
2
5 2.9 - 3.7
2
0
0
species :
<10 ppm
1.4-4.4
; so4,
Wt. %;
0.02-1
Cl, 1
.08 wt
.3-2.8
wt!
NH3, 1.4-3.6 w
<y
A>
8.5 - 8.9
8 fi
'r— %;
Product water - water CO-produced with oil in the gas-oil
separator.
Source: DOE/EV-0086, June 1980.
115
image:
TABLE 3.3-5.
PARAHO DIRECT PRODUCT WATER'
BULK PROPERTIES (wt. %)
Date
5/77
6/77
7/77
8/77
8/77
9/77
9/77
10/77
11/77
11/77
12/77
1/78
2/78
4/78
5/78
6/78
6/78
7/78
7/78
8/78
8/78
9/78
Other
H2S,
TOC,
a
Lab
PAR
PAR
PAR
BNW
PAR
PAR
CSM
PAR
BNW
PAR
PAR
PAR
PAR
PAR
PAR
CSM
PAR
CSM
PAR
PAR
BNW
PAR
C
5
.1
4.3
4
2.
3.
4.
4.
4.
2.
3.
5.
4.
7.
5.
4.
6.
8.
1
4
0
5
6
3
4
6
4
0
4
9
8
1
1
3
2
3
2
2
3
2
2
2
2
3
1
3
6
3
4
N
.7
.9
.1
.2
.1
.0
.9
.8
.6
.4
.0
.7
.8
.1
.9
.4
5.6
S
3
.5
4.3
5.
3.9 -
3.
1
• 5.1
5
2.7
3.
8
2.2 - 4.8
4.4
4.
4.
3.
3.
5.
2.8 -
4.
2.7 -
4.
4.
6.
5
4
9
1
7
3.1
3
2.9
3
4
5
Mm
3
CO? Alkalinity t>H
.0
3,4 1
1
2.7 !
4
3.
4
4.
3.
4.
3.
0.
4.
?
2.
3 .
3.
1.
1
o
5
9
4
5
8
7
8.8 - 8.9
8.5 - 8.6
ft R
2.6 - 7 . 8i 8.6 - 9.1
2
5 2.9 - 3.7
2
0
0
species :
<10 ppm
1.4-4.4
; so4,
Wt. %;
0.02-1
Cl, 1
.08 wt
.3-2.8
wt!
NH3, 1.4-3.6 w
<y
A>
8.5 - 8.9
8 fi
'r— %;
Product water - water CO-produced with oil in the gas-oil
separator.
Source: DOE/EV-0086, June 1980.
115
image:
 nr
p»
^•x
K
n
*3
w
a
to
to
CO
o
^
CO
W
r-H
o
W
CO
o
rf»
*g
jy]
H
1
H
0
1
PH
B
ptj
p*i
M
Q
O
gj
S
PH
*
vo
1
CO
•
CO
a
H
w
4->
§
0
0
rrj
CO W
rH > T3
re r-H -H
4-> O i-H
O (Q O
H W W
•rH
-a
•rH
CO
11 *
0
CO
m
j*5
•g
0)
re
o
!_;
0
r—
0)
L)
i.
C
CO
<u
4J
n
3 S co
3 S gj w
f^i ^^ j^»
O ^* ro
rH
V
in
rH
T"H
O -^i-H
O ID rH
rH O i-H
V i-H
o co r-
O CO rH
rH
V
0 0
O VD
rH *•}*
V
in
O CO rH
o
rH
V
«•
o co
o ro
rH
V
VO
ro
•
0 O
0 V
rH
V
5
c-
c—
1
CM
1
co
r3< C/l Ix< ^ CO
^j; ^^ r-r"! i*v^ fiy pr*| f*fj
t
1
IT) CM CO •*
CM CM CM CM
co
O vO
_J t
^^
«3< rH CO
O rH
i-H
o co m
CM VD
V
o co o
CM in vD
CM CM CT>
CO vD <M
rH CM ^l1
&
o in ^
O CO vD
o
CM
tn
vD
vD
CM C*-
CD 0
CO m :
c~- r-
r- i>
in VD
CM CM
co co
-S-
o
a>
r^ ^-i
^*
cr>
rH
rH
CO
O
0
0
in
in
rH
CM
CM
CO
O
O
in
«
CO
ro
CM
rH
V
PH
CO
D-
1
">}*
O
i-H
is i
vD
rH
0
ro
VD
co
rH
O
CO
VO
*3*
CO
O
ro
o
rH
V
CM
CO
r~
i
rH
O
VO
.-&
^ u
U 0)
H PM
rH
CO
i-H
O
O
ro
CO
rH
CO
•5"
(U
.1
4-)
rj
0
u
'***'
116
1
I
I
1
B
1
I
I
I
I
I
I
I
I
I
I
I
I
image:
nr
p»
^•x
K
n
*3
w
a
to
to
CO
o
^
CO
W
r-H
o
W
CO
o
rf»
*g
jy]
H
1
H
0
1
PH
B
ptj
p*i
M
Q
O
gj
S
PH
*
vo
1
CO
•
CO
a
H
w
4->
§
0
0
rrj
CO W
rH > T3
re r-H -H
4-> O i-H
O (Q O
H W W
•rH
-a
•rH
CO
11 *
0
CO
m
j*5
•g
0)
re
o
!_;
0
r—
0)
L)
i.
C
CO
<u
4J
n
3 S co
3 S gj w
f^i ^^ j^»
O ^* ro
rH
V
in
rH
T"H
O -^i-H
O ID rH
rH O i-H
V i-H
o co r-
O CO rH
rH
V
0 0
O VD
rH *•}*
V
in
O CO rH
o
rH
V
«•
o co
o ro
rH
V
VO
ro
•
0 O
0 V
rH
V
5
c-
c—
1
CM
1
co
r3< C/l Ix< ^ CO
^j; ^^ r-r"! i*v^ fiy pr*| f*fj
t
1
IT) CM CO •*
CM CM CM CM
co
O vO
_J t
^^
«3< rH CO
O rH
i-H
o co m
CM VD
V
o co o
CM in vD
CM CM CT>
CO vD <M
rH CM ^l1
&
o in ^
O CO vD
o
CM
tn
vD
vD
CM C*-
CD 0
CO m :
c~- r-
r- i>
in VD
CM CM
co co
-S-
o
a>
r^ ^-i
^*
cr>
rH
rH
CO
O
0
0
in
in
rH
CM
CM
CO
O
O
in
«
CO
ro
CM
rH
V
PH
CO
D-
1
">}*
O
i-H
is i
vD
rH
0
ro
VD
co
rH
O
CO
VO
*3*
CO
O
ro
o
rH
V
CM
CO
r~
i
rH
O
VO
.-&
^ u
U 0)
H PM
rH
CO
i-H
O
O
ro
CO
rH
CO
•5"
(U
.1
4-)
rj
0
u
'***'
116
1
I
I
1
B
1
I
I
I
I
I
I
I
I
I
I
I
I
image:
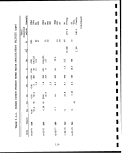 •T3
(U
•H
•8
o
u
1
m
CO
§
M
«
. 4-
0
c
c.
T3
<1) V
rH > -C
<C rH -r-
•M O rH
owe
fH W M
•H
CO
it ^
O
tO
fS
M
CT
s
(U
IB
rH
U
rH
<1>
U
S-4
g
cn
0)
Q
! -A
1 -H-H
; ^ C/3 t^ CO rfi CO Ixi t , [ t
MpnS WfeS (-HOHSx <iE-iS
'"'S1 m O CO vD rH fs]
CO CO CM CM CO <* rH
O
O
in
co"
"£ VO CO O rH «tf«
CO rH t^ r- CM
co co m
in
ooo i>! t^.
C? C? v1 S
O O O O (U
£- <Tl CM CT> rH
» C- CO rH
rH
°^ O~> •* rH O
1-1 <-i r- m CM co co
V csj
CO
CO CM rH o CO
"* «* «* CO rH
rH rH ^
^M CO
V V ^
o
1
111 s s
r- t- i> co
777 ^
in v£ r- fj,
rH rH rH CO rH
' ' ' r- i
"-J rH rH 1 CM
rH rH i — | CT» i — 1
O
CO
T~H
1
VJD
CO
O
O
1
(a
o
Q
ii
u
S-,
3
o
to
117
image:
•T3
(U
•H
•8
o
u
1
m
CO
§
M
«
. 4-
0
c
c.
T3
<1) V
rH > -C
<C rH -r-
•M O rH
owe
fH W M
•H
CO
it ^
O
tO
fS
M
CT
s
(U
IB
rH
U
rH
<1>
U
S-4
g
cn
0)
Q
! -A
1 -H-H
; ^ C/3 t^ CO rfi CO Ixi t , [ t
MpnS WfeS (-HOHSx <iE-iS
'"'S1 m O CO vD rH fs]
CO CO CM CM CO <* rH
O
O
in
co"
"£ VO CO O rH «tf«
CO rH t^ r- CM
co co m
in
ooo i>! t^.
C? C? v1 S
O O O O (U
£- <Tl CM CT> rH
» C- CO rH
rH
°^ O~> •* rH O
1-1 <-i r- m CM co co
V csj
CO
CO CM rH o CO
"* «* «* CO rH
rH rH ^
^M CO
V V ^
o
1
111 s s
r- t- i> co
777 ^
in v£ r- fj,
rH rH rH CO rH
' ' ' r- i
"-J rH rH 1 CM
rH rH i — | CT» i — 1
O
CO
T~H
1
VJD
CO
O
O
1
(a
o
Q
ii
u
S-,
3
o
to
117
image:
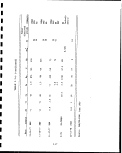 TABLE 3.3-7. PARAHO DIRECT PRODUCT WATER TRACE ELEMENTS (ppm)
6/77
PARa
Sb
As 9.0
Ba <0.5
B 30
Cd 0.3
CN 8.8
Cr
Cu 0.2
F 3.8
Pb <0 . 1
Li
Mn
Hg
Mo 3
Ni
Se <1
Ag <0.2
Sr
Th
Zn 1.0
Sources:
aDOE/EV-0086
8/77 9/77
BNW GE-T
3.1- 22.2
6.9
0.8 0.4
43 13
0.5- 2.6
0.9
1.4- 43
10.0
<0.4 0.4
0.04
0.1-
0.3
1.5- 7.9
11.0
0.2- 1.5
1.1
, June 1980.
11/77 12/77
BNWa GSRI
4.9- 6
18.2
<3 0.3
16- 0.2
43
<0.2
0.5-
11.8
16- 0.8
36
<0.3 0.3
'
0.005
o.i- ; 0.3
0.5
3.9- 0.2
8.3
<0.2
0.1- 0.5
8.5
1/78 , DRIC ang
PARa Jackson Jackson
1
9 1.5- 0.01
9.0 (5.1)
<0.5 0.1
40 0.1- 3
3.6
0.1 0.1 0.5
1.6
0.14 (0.1)
2.5
0.1 6
3.5 0.1
0.4- 1
2.9
0.2
<0.01
0.7 <0.1- 0.1
0.5
0.1-
0.4
0.4- 0.1
4.4 (0.8)
0.4 <0.1
<0.1-
0.8
0.1-
1.7
0.6 (2.0)
1
1
1
1
I
1
1
1
fl
H
1
1
1
1
I
I
1
Jackson & Jackon, 1982.
CDRI, June,
1977.
118
1
1
image:
TABLE 3.3-7. PARAHO DIRECT PRODUCT WATER TRACE ELEMENTS (ppm)
6/77
PARa
Sb
As 9.0
Ba <0.5
B 30
Cd 0.3
CN 8.8
Cr
Cu 0.2
F 3.8
Pb <0 . 1
Li
Mn
Hg
Mo 3
Ni
Se <1
Ag <0.2
Sr
Th
Zn 1.0
Sources:
aDOE/EV-0086
8/77 9/77
BNW GE-T
3.1- 22.2
6.9
0.8 0.4
43 13
0.5- 2.6
0.9
1.4- 43
10.0
<0.4 0.4
0.04
0.1-
0.3
1.5- 7.9
11.0
0.2- 1.5
1.1
, June 1980.
11/77 12/77
BNWa GSRI
4.9- 6
18.2
<3 0.3
16- 0.2
43
<0.2
0.5-
11.8
16- 0.8
36
<0.3 0.3
'
0.005
o.i- ; 0.3
0.5
3.9- 0.2
8.3
<0.2
0.1- 0.5
8.5
1/78 , DRIC ang
PARa Jackson Jackson
1
9 1.5- 0.01
9.0 (5.1)
<0.5 0.1
40 0.1- 3
3.6
0.1 0.1 0.5
1.6
0.14 (0.1)
2.5
0.1 6
3.5 0.1
0.4- 1
2.9
0.2
<0.01
0.7 <0.1- 0.1
0.5
0.1-
0.4
0.4- 0.1
4.4 (0.8)
0.4 <0.1
<0.1-
0.8
0.1-
1.7
0.6 (2.0)
1
1
1
1
I
1
1
1
fl
H
1
1
1
1
I
I
1
Jackson & Jackon, 1982.
CDRI, June,
1977.
118
1
1
image:
 TABLE 3.3-8. COMPOUNDS IDENTIFIED IN PARAHO
DIRECT OIL SHALE WAS.TEWATERS3 I
__________^ I
Compounds
Total Organic ;
Carbon (ppm) 41,900 \
Toluene
Phenol |
o-Cresol l
m-Cresol
p-Cresol '
C2-Phenol i
C3-Phenol '
2,6-Dimethylphenol !
3,5-Dimethylphenol i
Methoxyphenol
Naphthalene ;
2-Methylnaphthalene '
C2-Naphthalene
. 2-Methylpyridine x i
4-Methylpyridine x
2,3-Dimethylpyridine •,
2,4-Dimethylpyridine x i
2,5-Dimethylpyridine x :
2,6-Dimethylpyridine x ;
2-Ethylpyridine ;
C2-Pyridines x ;
2,4,6-Trimethylpyridine x '•.
C3-Pyridines x
4-(n-propyl)pyridine •
C4-Pyridines x ;
4-(3-pentyl)pyridine x I
C5-Pyridines x i
Aniline x
3-Methylaniline :
N-methy1aniline x ;
N,N-dimethylaniline x ;
N-ethylaniline x i
2,4-Diethylaniline x ;
N,N-diethy1aniline x :
Quinoline x |
Isoguinoline x '
(continued)
119
image:
TABLE 3.3-8. COMPOUNDS IDENTIFIED IN PARAHO
DIRECT OIL SHALE WAS.TEWATERS3 I
__________^ I
Compounds
Total Organic ;
Carbon (ppm) 41,900 \
Toluene
Phenol |
o-Cresol l
m-Cresol
p-Cresol '
C2-Phenol i
C3-Phenol '
2,6-Dimethylphenol !
3,5-Dimethylphenol i
Methoxyphenol
Naphthalene ;
2-Methylnaphthalene '
C2-Naphthalene
. 2-Methylpyridine x i
4-Methylpyridine x
2,3-Dimethylpyridine •,
2,4-Dimethylpyridine x i
2,5-Dimethylpyridine x :
2,6-Dimethylpyridine x ;
2-Ethylpyridine ;
C2-Pyridines x ;
2,4,6-Trimethylpyridine x '•.
C3-Pyridines x
4-(n-propyl)pyridine •
C4-Pyridines x ;
4-(3-pentyl)pyridine x I
C5-Pyridines x i
Aniline x
3-Methylaniline :
N-methy1aniline x ;
N,N-dimethylaniline x ;
N-ethylaniline x i
2,4-Diethylaniline x ;
N,N-diethy1aniline x :
Quinoline x |
Isoguinoline x '
(continued)
119
image:
 1
I
I
TABLE 3.3-8 (continued)
Compounds fl
2-Methylquinoline x
3-Methylquinoline x «
7-Methylquinoline x U
2,4-Dimethylquinoline x m
2, 6-Dimethylquinoline
2,7-Dimethylquinoline x •
Trimethylquinoline •
Acridine x
1
aCompounds marked with "X" were
identified in each sample.
Those not marked are not •
necessarily absent. P
Source: Engineering Science,
June 1983
120
I
I
1
I
I
1
I
I
I
I
image:
1
I
I
TABLE 3.3-8 (continued)
Compounds fl
2-Methylquinoline x
3-Methylquinoline x «
7-Methylquinoline x U
2,4-Dimethylquinoline x m
2, 6-Dimethylquinoline
2,7-Dimethylquinoline x •
Trimethylquinoline •
Acridine x
1
aCompounds marked with "X" were
identified in each sample.
Those not marked are not •
necessarily absent. P
Source: Engineering Science,
June 1983
120
I
I
1
I
I
1
I
I
I
I
image:
 TABLE 3.3-9. PARAHO DIRECT RECYCLE GAS LINE DRAIN* (ppm)
m
1
w
1"
1
.
1
1
^
1
1
I
•
1
m
I
1
Analyses
Aluminum
Arsenic
Barium
Boron
Cadmium
Calcium
Chromium
Copper
Iron
Lead
Magnesium
Mercury
Molybdenum
Potassium
Selenium
Silver
Sodium
Silicon
Zinc
Alkalinity as CaCOs
Carbonates
. Carbon, total
Carbon, organic
Chemical oxygen demand
Chloride
Cyanide
Fluoride
Hydrogen, total
Nitrogen, total
Nitrogen , ammonia
Nitrogen, nitrate
PH
Phenol
Phosphate , total
, Total suspended solids.
Total dissolved solids
Sulfur, sulfate
Sulfur, sulfide
Sulfur, total
After oil separation.
CE -TEMPO
9-09-77
10.3
<0.1
13.7
<0.03
0.2
1.5
0.2
29.5
2.4
1.8
27.6
0.1
1.6
8.9
1540
GSRI
12-13-77
0.2
0.9
0.1
<0.02
<0.01
4
0.02
0.9
2
0.04
1
4.8 ppb
0.04
0.1
<0.01
3
0.6
0.5
-0.07
Values reported are for TDS after vacuum evaporation
and after evaporation at 180°C, respectively.
Source: DOE/EV-0086, June
1980
121
PAR ;
1-04-78
i
<i
<2
<0.5
<20
<0.01
2.8
o.oi
0.09
2.2
<0.5
26
<5
<0.2
6.82
2
0.7
11
<2
0.02
19,400
13,410
7,400
3,740
l,60d
750
60. Q
0.96
106,900
4,900
5,960
<0.02
8.9'
19.2
<1
9'
3.3
1,400
<1
<500
PAR
6-01-78
<1
<2
<0.5
<20
<0.05
21
0.00
<0.05
0.9
<1
30
<7
2
2.1
<1
1.0 :
60 '
7
0.03
25,000
2,514
6,970
6,280 ;
1 , 850
32
5.3
<0.04
5,910
6,985
<0.1
9.0
67
<0.1
<0.02
11.9/9.3
460
<0.01
2,570
at ambient temperature
image:
TABLE 3.3-9. PARAHO DIRECT RECYCLE GAS LINE DRAIN* (ppm)
m
1
w
1"
1
.
1
1
^
1
1
I
•
1
m
I
1
Analyses
Aluminum
Arsenic
Barium
Boron
Cadmium
Calcium
Chromium
Copper
Iron
Lead
Magnesium
Mercury
Molybdenum
Potassium
Selenium
Silver
Sodium
Silicon
Zinc
Alkalinity as CaCOs
Carbonates
. Carbon, total
Carbon, organic
Chemical oxygen demand
Chloride
Cyanide
Fluoride
Hydrogen, total
Nitrogen, total
Nitrogen , ammonia
Nitrogen, nitrate
PH
Phenol
Phosphate , total
, Total suspended solids.
Total dissolved solids
Sulfur, sulfate
Sulfur, sulfide
Sulfur, total
After oil separation.
CE -TEMPO
9-09-77
10.3
<0.1
13.7
<0.03
0.2
1.5
0.2
29.5
2.4
1.8
27.6
0.1
1.6
8.9
1540
GSRI
12-13-77
0.2
0.9
0.1
<0.02
<0.01
4
0.02
0.9
2
0.04
1
4.8 ppb
0.04
0.1
<0.01
3
0.6
0.5
-0.07
Values reported are for TDS after vacuum evaporation
and after evaporation at 180°C, respectively.
Source: DOE/EV-0086, June
1980
121
PAR ;
1-04-78
i
<i
<2
<0.5
<20
<0.01
2.8
o.oi
0.09
2.2
<0.5
26
<5
<0.2
6.82
2
0.7
11
<2
0.02
19,400
13,410
7,400
3,740
l,60d
750
60. Q
0.96
106,900
4,900
5,960
<0.02
8.9'
19.2
<1
9'
3.3
1,400
<1
<500
PAR
6-01-78
<1
<2
<0.5
<20
<0.05
21
0.00
<0.05
0.9
<1
30
<7
2
2.1
<1
1.0 :
60 '
7
0.03
25,000
2,514
6,970
6,280 ;
1 , 850
32
5.3
<0.04
5,910
6,985
<0.1
9.0
67
<0.1
<0.02
11.9/9.3
460
<0.01
2,570
at ambient temperature
image:
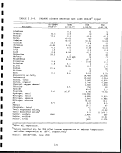 I
TABLE 3.3-10,
CONCENTRATIONS IN RCRA AND WATER SHAKE TEST
EXTRACTS - PARAHO DIRECT SPENT SHALES
Parameter
pH
EC
ALK
H2C03
HC03
C03
TDS
F
Cl
P04
N03
S04
Zn
Fe
Co
Li
V
NH3
B
Cd
Be
Mg
P
Si
Mo
Mn
Ni
Na
Cu
Al
Ca
Ba
K
Cr
Sr
Pb
Ag
Ti
Se
As
Hg
Units
mm
|jmhos/cm @ 25°
mg/L
mg/L
mg/L
mg/L
mg/L
mg/L
mg/L
mg/L
mg/L
mg/L
mg/L
mg/L
mg/L
mg/L
mg/L
mg/L
mg/L
mg/L
mg/L
mg/L
mg/L
mg/L
mg/L
mg/L
mg/L
mg/L
mg/L
mg/L
mg/L
mg/L
mg/L
mg/L
mg/L
mg/L
mg/L
mg/L
mg/L
mg/L
mg/L
RCRA
9.27
4600
2593
3.5
2723
217
6220
-
28.8
<0.05
1.75
220
<0.001
0.020
0.044
0.503
0.018
0.161
0.333
<0.001
<0.0005
484
0.49
4.0
<0.05
0.016
<0.05
37
0.019
3.0
724
0.915
6.5
<0.10
8.4
<0.010
<0.002
<0.005
< 0.020
0.010
<0.001
ASTM
12.05
2800
398
<0.001
5.0
236
1425
13.5
7.2
<0.1
3.5
536
0.0003
<0.005
<0.005
0.944
0.035
2.2
0.513
<0.001
<0.0005
0.5
0.3
2.3
<0.05
0.002
<0.005
145
0.002
<0.02
266
0.157
31
<0.005
5.0
<0.01
0.003
<0.005
<0.020
<0.01
<0.001
Source: EPA-600/D-84-228, 1984
122
1
1
I
I
I
1
1
1
1
I
I
I
I
I
I
I
image:
I
TABLE 3.3-10,
CONCENTRATIONS IN RCRA AND WATER SHAKE TEST
EXTRACTS - PARAHO DIRECT SPENT SHALES
Parameter
pH
EC
ALK
H2C03
HC03
C03
TDS
F
Cl
P04
N03
S04
Zn
Fe
Co
Li
V
NH3
B
Cd
Be
Mg
P
Si
Mo
Mn
Ni
Na
Cu
Al
Ca
Ba
K
Cr
Sr
Pb
Ag
Ti
Se
As
Hg
Units
mm
|jmhos/cm @ 25°
mg/L
mg/L
mg/L
mg/L
mg/L
mg/L
mg/L
mg/L
mg/L
mg/L
mg/L
mg/L
mg/L
mg/L
mg/L
mg/L
mg/L
mg/L
mg/L
mg/L
mg/L
mg/L
mg/L
mg/L
mg/L
mg/L
mg/L
mg/L
mg/L
mg/L
mg/L
mg/L
mg/L
mg/L
mg/L
mg/L
mg/L
mg/L
mg/L
RCRA
9.27
4600
2593
3.5
2723
217
6220
-
28.8
<0.05
1.75
220
<0.001
0.020
0.044
0.503
0.018
0.161
0.333
<0.001
<0.0005
484
0.49
4.0
<0.05
0.016
<0.05
37
0.019
3.0
724
0.915
6.5
<0.10
8.4
<0.010
<0.002
<0.005
< 0.020
0.010
<0.001
ASTM
12.05
2800
398
<0.001
5.0
236
1425
13.5
7.2
<0.1
3.5
536
0.0003
<0.005
<0.005
0.944
0.035
2.2
0.513
<0.001
<0.0005
0.5
0.3
2.3
<0.05
0.002
<0.005
145
0.002
<0.02
266
0.157
31
<0.005
5.0
<0.01
0.003
<0.005
<0.020
<0.01
<0.001
Source: EPA-600/D-84-228, 1984
122
1
1
I
I
I
1
1
1
1
I
I
I
I
I
I
I
image:
 TABLE 3.3-11.
LEACHABLE MASS AS INDICATED BY THE ASTM
PROPOSED WATER SHAKE EXTRACTION TEST FOR
PARAHO DIRECT SPENT SHALES - mg/gI
Parameter
Na
Ca
Mg
S04
Cl
F
B
Mo
Al
TDS
Paraho
0.580
1.064
0.002
2.144
0.029
0.054
0.002
0.003
0.005
5.700
Source: EPA-600/D-84-228, 1984
123
image:
TABLE 3.3-11.
LEACHABLE MASS AS INDICATED BY THE ASTM
PROPOSED WATER SHAKE EXTRACTION TEST FOR
PARAHO DIRECT SPENT SHALES - mg/gI
Parameter
Na
Ca
Mg
S04
Cl
F
B
Mo
Al
TDS
Paraho
0.580
1.064
0.002
2.144
0.029
0.054
0.002
0.003
0.005
5.700
Source: EPA-600/D-84-228, 1984
123
image:
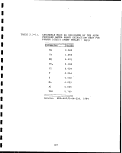 TABLE 3.3-12.
COLUMN LEACHING EFFLUENT CONCENTRATIONS
FOR PARAHO DIRECT SPENT SHALES
vt
L
0.022
0.032
0.047
0.070
0.088
0.105
0.128
0.151
0.167
0.178
0.190
0.202
0.220
0.244
0.263
0.275
0.294
0.312
0.353
0.367
0.412
0.423
0.473
0.483
0.606
0.644
0.726
0.836
0.918
1.642
1.978
2.177
Ca
610
605
610
625
625
640
660
635
635
610
650
605
635
670
660
670
680
620
685
665
700
655
715
710
700
730
660
680
670
560
380
390
Na
1,500
1,445
1,385
1,305
1,280
1,165
1,095
1005
955
965
935
895
875
830
785
780
760
705
640
595
565
525
490
460
430
370
340
305
285
140
100
105
Cl
mg/L
49
47
47
42
39
35
33
31
3d
27
26
26
23
24
27
32
30
23
25
24
26
21
17
19
18
14
16
13
14
9
6
6
S04
3,840
3,805
3,735
3,695
3,525
3,485
3,320
3,270
3,180
3,185
3,175
3,085
3,060
3,065
2,975
2,930
2,890
2,890
2,815
2,605
2,615
2,530
2,500
2,395
2,390
2,290
2,205
2,105
2,045
1,500
1,000
860
F
21.0
22.2
21.9
22.0
22.6
21.0
21.0
21.5
22.0
20.4
20.9
21.4
21.1
21.8
21.8
22.5
21.9
21.6
14.2
12.4
14.4
14.5
12.7
12.8
12.5
11.5
12.4
11.4
11.4
10.2
8.1
8.3
PH
11.55
11.60
11.66
11.73
11.78
11.81
11.86
11.89
11.91
11.83
11.94
11.95
11.99
12.02
12.01
12.03
12.06
11.96
12.06
12.10
12.13
12.07
12.14
12.17
12.21
12.24
12.27
12.31
12.35
12.46
12.57
12.60
Source:
EPA-600/D-84-228, 1984
K = 4.6 x 10~4 cm/s
vt = pore volume.
L
124
I
I
I
1
1
1
1
1
1
I
I
I
I
I
I
I
image:
TABLE 3.3-12.
COLUMN LEACHING EFFLUENT CONCENTRATIONS
FOR PARAHO DIRECT SPENT SHALES
vt
L
0.022
0.032
0.047
0.070
0.088
0.105
0.128
0.151
0.167
0.178
0.190
0.202
0.220
0.244
0.263
0.275
0.294
0.312
0.353
0.367
0.412
0.423
0.473
0.483
0.606
0.644
0.726
0.836
0.918
1.642
1.978
2.177
Ca
610
605
610
625
625
640
660
635
635
610
650
605
635
670
660
670
680
620
685
665
700
655
715
710
700
730
660
680
670
560
380
390
Na
1,500
1,445
1,385
1,305
1,280
1,165
1,095
1005
955
965
935
895
875
830
785
780
760
705
640
595
565
525
490
460
430
370
340
305
285
140
100
105
Cl
mg/L
49
47
47
42
39
35
33
31
3d
27
26
26
23
24
27
32
30
23
25
24
26
21
17
19
18
14
16
13
14
9
6
6
S04
3,840
3,805
3,735
3,695
3,525
3,485
3,320
3,270
3,180
3,185
3,175
3,085
3,060
3,065
2,975
2,930
2,890
2,890
2,815
2,605
2,615
2,530
2,500
2,395
2,390
2,290
2,205
2,105
2,045
1,500
1,000
860
F
21.0
22.2
21.9
22.0
22.6
21.0
21.0
21.5
22.0
20.4
20.9
21.4
21.1
21.8
21.8
22.5
21.9
21.6
14.2
12.4
14.4
14.5
12.7
12.8
12.5
11.5
12.4
11.4
11.4
10.2
8.1
8.3
PH
11.55
11.60
11.66
11.73
11.78
11.81
11.86
11.89
11.91
11.83
11.94
11.95
11.99
12.02
12.01
12.03
12.06
11.96
12.06
12.10
12.13
12.07
12.14
12.17
12.21
12.24
12.27
12.31
12.35
12.46
12.57
12.60
Source:
EPA-600/D-84-228, 1984
K = 4.6 x 10~4 cm/s
vt = pore volume.
L
124
I
I
I
1
1
1
1
1
1
I
I
I
I
I
I
I
image:
 TABLE 3.3-13.
INORGANIC COMPOSITION OF
i
i
l
i
PARAHO DIRECT
SPENT SHALE LEACHATES PRODUCED DURING
Al
As
B
Ba
Br
Ca
Cd
Cl
C03
Cr
Cu
DOC
EC, (.imhos/cm
F
Fe
HC03
K
Li
Mg
Mn
Mo
Na
Ni
NH4
N03
N02
Pb
P04
FIELD LYSIMETER STUDIES,
Lysimeter3 Percolate
Colorado Shale
(Garland
et al., 1979)
0,0005 - 0.1
0.007 - 0.08
0.5 - 3
0.03 - 0.55
M
,140 - 530
—
70 - 2,200
_
<0.001 - 0.02
<0.001 - 0.07
<2 - 400
'8,000 - 30,000
3-13
<0.01 - 0.3
1
320 - 1,230
6 - 20
0.2 - 140
<0.01 - 0.075
1.2 - 9.5
1,500 - 10,400
<0.005 - 0.04
<1 - 11
<0.1 - 6
0.001 - 4
_
-
125
(mg/L) ,
Lysimeter3 Runoff
Colorado Shale
; (Kilkelly
et al., 1981)
i '
,
1
7-10
i <4
i
1
; _ •
i
.70 - 170
\ _
!
18 - 50
i 4 _ 5
: 3 - 14
i
_
1 ~
2-5
;
i
;
I
; (continued)
i
i
i
image:
TABLE 3.3-13.
INORGANIC COMPOSITION OF
i
i
l
i
PARAHO DIRECT
SPENT SHALE LEACHATES PRODUCED DURING
Al
As
B
Ba
Br
Ca
Cd
Cl
C03
Cr
Cu
DOC
EC, (.imhos/cm
F
Fe
HC03
K
Li
Mg
Mn
Mo
Na
Ni
NH4
N03
N02
Pb
P04
FIELD LYSIMETER STUDIES,
Lysimeter3 Percolate
Colorado Shale
(Garland
et al., 1979)
0,0005 - 0.1
0.007 - 0.08
0.5 - 3
0.03 - 0.55
M
,140 - 530
—
70 - 2,200
_
<0.001 - 0.02
<0.001 - 0.07
<2 - 400
'8,000 - 30,000
3-13
<0.01 - 0.3
1
320 - 1,230
6 - 20
0.2 - 140
<0.01 - 0.075
1.2 - 9.5
1,500 - 10,400
<0.005 - 0.04
<1 - 11
<0.1 - 6
0.001 - 4
_
-
125
(mg/L) ,
Lysimeter3 Runoff
Colorado Shale
; (Kilkelly
et al., 1981)
i '
,
1
7-10
i <4
i
1
; _ •
i
.70 - 170
\ _
!
18 - 50
i 4 _ 5
: 3 - 14
i
_
1 ~
2-5
;
i
;
I
; (continued)
i
i
i
image:
 TABLE 3.3-13 (continued)
Lysimeter Percolate
Colorado Shale
(Garland
et al., 1979)
Lysimeter Runoff
Colorado Shale
(Kilkelly
et al., 1981)
1
I
I
I
1
Rb
Se
Si
S04
Sn
Sr
TDS
TOG
U
V
Zn
pH
0.0005
i 5
3,000
<0
! 4
2
<0.0003
0.1
0.005
6.9
» —
- 0.04
-16
- 20,000 5-14
.04
-13
- -
- 429
- 0.003
- 0.45
- 1.1
- 11.5
Bulk density, g/cm3
Solid-to-liquid ratio, g/mL
Contact time, min
Particle size, dso
Number of replicates
1.55
NA
aAnvil Points lysimet'er, high elevation site. Runoff values are for spring
snowmelt. The first reported value for runoff is from spent shale with
20-cm soil cover and the second value is for runoff from preleached, bare
spent shale.
Source: Fox, July 1983
126
I
I
I
1
I
1
f
I
I
1
I
I
I
image:
TABLE 3.3-13 (continued)
Lysimeter Percolate
Colorado Shale
(Garland
et al., 1979)
Lysimeter Runoff
Colorado Shale
(Kilkelly
et al., 1981)
1
I
I
I
1
Rb
Se
Si
S04
Sn
Sr
TDS
TOG
U
V
Zn
pH
0.0005
i 5
3,000
<0
! 4
2
<0.0003
0.1
0.005
6.9
» —
- 0.04
-16
- 20,000 5-14
.04
-13
- -
- 429
- 0.003
- 0.45
- 1.1
- 11.5
Bulk density, g/cm3
Solid-to-liquid ratio, g/mL
Contact time, min
Particle size, dso
Number of replicates
1.55
NA
aAnvil Points lysimet'er, high elevation site. Runoff values are for spring
snowmelt. The first reported value for runoff is from spent shale with
20-cm soil cover and the second value is for runoff from preleached, bare
spent shale.
Source: Fox, July 1983
126
I
I
I
1
I
1
f
I
I
1
I
I
I
image:
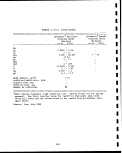 3.4 PARAHO INDIRECT HEATING MODE OIL SHALE RETORTING!
3.4.1 Retorting Operation
in?ir? Ct m-°de of 0Peration is basically ' the same as
.
equipment. In the indirect mode, the air blower! are
^16 is eliminated
i -
The principal zones within the retort are essentially! the same a^
d 1
Because of changes in the nature and flows of the recycle eras the
^r" fE-e%h°f ^ th,S °f fgas and retorted shale Yare Sm4wha?
^?^er .for the. ^direct mode. Both the retorted shale and the
offgas temperatures average approximately 300°F.
rHT-^M- mn* ind^ect "L0^6 J138. not been tested as extensively as the
direct mode. Thus, the indirect mode data are auite limited -mrf
since the Paraho retort had not been operated for extensive^ Se?l
iods of time, much of the samples and data that have bet£obtained
expensive e^What- .uns,ta^le start-up or shutdown ?ondi?ions No
extensive engineering designs have been made for a commercial-size
facility using Paraho indirect mode retorting technology^
3.4.2 Solid Wastes ;
Although no block-flow diagram is available for the Paraho indi-
n?S^22 ?oPr0<^SS' th,e Odla9.ram Provided for the Paraho :direct mode
£oreUraeteFs19pUfrepro?eLe-dn Ulll^ ^er^d^st^ <?^ln
commerce,1 facility using Paraho indirect -'
the o»™ieff?1?8^ fines storage, and dusts will be approximately
the same for both processes. It is likely that the indirect mode
process will produce a slightly higher rate of retorted
because of the lower carbonate decomposition and higher
San°ni Tf^f' £Ut the °rra^ rat-e Should not incase
shSe rate &* S^f-l ?^K th,1S Sli-ght increase in the retorted
snale rate and the likelihood of increased temperatures
127
image:
3.4 PARAHO INDIRECT HEATING MODE OIL SHALE RETORTING!
3.4.1 Retorting Operation
in?ir? Ct m-°de of 0Peration is basically ' the same as
.
equipment. In the indirect mode, the air blower! are
^16 is eliminated
i -
The principal zones within the retort are essentially! the same a^
d 1
Because of changes in the nature and flows of the recycle eras the
^r" fE-e%h°f ^ th,S °f fgas and retorted shale Yare Sm4wha?
^?^er .for the. ^direct mode. Both the retorted shale and the
offgas temperatures average approximately 300°F.
rHT-^M- mn* ind^ect "L0^6 J138. not been tested as extensively as the
direct mode. Thus, the indirect mode data are auite limited -mrf
since the Paraho retort had not been operated for extensive^ Se?l
iods of time, much of the samples and data that have bet£obtained
expensive e^What- .uns,ta^le start-up or shutdown ?ondi?ions No
extensive engineering designs have been made for a commercial-size
facility using Paraho indirect mode retorting technology^
3.4.2 Solid Wastes ;
Although no block-flow diagram is available for the Paraho indi-
n?S^22 ?oPr0<^SS' th,e Odla9.ram Provided for the Paraho :direct mode
£oreUraeteFs19pUfrepro?eLe-dn Ulll^ ^er^d^st^ <?^ln
commerce,1 facility using Paraho indirect -'
the o»™ieff?1?8^ fines storage, and dusts will be approximately
the same for both processes. It is likely that the indirect mode
process will produce a slightly higher rate of retorted
because of the lower carbonate decomposition and higher
San°ni Tf^f' £Ut the °rra^ rat-e Should not incase
shSe rate &* S^f-l ?^K th,1S Sli-ght increase in the retorted
snale rate and the likelihood of increased temperatures
127
image:
 RAW
SHALE
A
MIST
FORMATION
AND
PREHEATING
RETORTING
ZONE
HEATING
RESIDUE
COOLING
AND
GAS
PREHEATING
•^ jf.
V /
RESIDUE
Figure 3.4-1.
1
I
1
1
OIL MIST R
SEPARATORS U
~yw i ,
T W
\ *-OIL
OIL ; r- |
— STACK -\
"* i rAo tLliCIHOSIAIIC— ' H
T X'SpArro PRFC-IPITATOR •
HtATcn H
< „ _' i»,..-—- n(r^*vr*i c r*f\f
- . ( •* ] '' Rl OU/FR H
^ i - x_>^ - •
I
1'
-• ... rnni PP _^— . __
•" V^UUl_C.r\ n*
1
Paraho indirect mode process flow diagram. •
Source: EPA-600/7-79-075, 1979.
1
1
1
128 |
image:
RAW
SHALE
A
MIST
FORMATION
AND
PREHEATING
RETORTING
ZONE
HEATING
RESIDUE
COOLING
AND
GAS
PREHEATING
•^ jf.
V /
RESIDUE
Figure 3.4-1.
1
I
1
1
OIL MIST R
SEPARATORS U
~yw i ,
T W
\ *-OIL
OIL ; r- |
— STACK -\
"* i rAo tLliCIHOSIAIIC— ' H
T X'SpArro PRFC-IPITATOR •
HtATcn H
< „ _' i»,..-—- n(r^*vr*i c r*f\f
- . ( •* ] '' Rl OU/FR H
^ i - x_>^ - •
I
1'
-• ... rnni PP _^— . __
•" V^UUl_C.r\ n*
1
Paraho indirect mode process flow diagram. •
Source: EPA-600/7-79-075, 1979.
1
1
1
128 |
image:
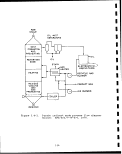 As there is no information available for other solid wastes
produced by a facility based upon Paraho indirect mode technology,
a general estimate of these wastes is available from information
based upon the Paraho direct mode process (see Table 3.3-] in
Section 3.3.2). i
The product gas will experience the biggest single change between
the Paraho indirect mode and the Paraho direct mode processes.
The offgas volume decrease is largely offset by increases in con-
centrations. Thus, the overall energy (MBtu/hr),< the sulfur
production, ammonia production and the estimated rates for
catalysts, sludges, non-marketable byproducts, and 'other solid
wastes will be essentially the same. ;
3.4.3 Characteristics- of Solid Wastes !
Except for retorted shale, the characteristics of Parjaho indirect
process solid wastes should be quite similar to Paraho direct
process solid wastes. Available characterization datk for Paraho
indirect retorted shale are presented in Tables 3.4-il to 3.4-3.
Available information regarding process water characteristics
produced from the Paraho indirect mode technology is presented in
Tables 3.4-4 and 3.4-5. The limited amount of data Ion leachate
characteristics produced from experiments using retorted shale
produced by the Paraho indirect mode is presented in Table 3.4-6.
129
image:
As there is no information available for other solid wastes
produced by a facility based upon Paraho indirect mode technology,
a general estimate of these wastes is available from information
based upon the Paraho direct mode process (see Table 3.3-] in
Section 3.3.2). i
The product gas will experience the biggest single change between
the Paraho indirect mode and the Paraho direct mode processes.
The offgas volume decrease is largely offset by increases in con-
centrations. Thus, the overall energy (MBtu/hr),< the sulfur
production, ammonia production and the estimated rates for
catalysts, sludges, non-marketable byproducts, and 'other solid
wastes will be essentially the same. ;
3.4.3 Characteristics- of Solid Wastes !
Except for retorted shale, the characteristics of Parjaho indirect
process solid wastes should be quite similar to Paraho direct
process solid wastes. Available characterization datk for Paraho
indirect retorted shale are presented in Tables 3.4-il to 3.4-3.
Available information regarding process water characteristics
produced from the Paraho indirect mode technology is presented in
Tables 3.4-4 and 3.4-5. The limited amount of data Ion leachate
characteristics produced from experiments using retorted shale
produced by the Paraho indirect mode is presented in Table 3.4-6.
129
image:
 TABLE 3.4-1.
A. Size Classification
PARAHO INDIRECT RETORTED
SHALE CHARACTERISTICS3
Unified Soil Classification System
Designation
Cobble
Gravel
Sand
Silt
Clay
B. Density
Compactive effort
ft.-lb/cu. ft.
Light, 6,200
Std. Proctor, 12,375
Heavy, 56,250
C . Strength
Days curing
28
60
120
D. Permeability
Compactive effort
ft.-lb/cu. ft.
Light, 6,200
Heavy, 56,250
ja
aHoltz, 1976.
Size, mm Weight percent
+38.1
4.76 - 38.1 52.4
0.074 - 4.76 , 31.9
0.005 - 0.074 13.3
-0.005 2.4
Water Added
Density, Ib/cu. ft.
None Optimum, 22 wt. %
89.0 93.9
94.4 98.8/99.2
102.1 105.8
Compressive strength, psi
11.8
15.3
10.8
Permeability, ft/yr
Loading No Optimum
psi water water
50 71
100 52
200 . 30
50 2 -
100 2.5
200 2.4
130
1
1
1
1
1
1
1
1
I
"f^
i
1
••
I
1
image:
TABLE 3.4-1.
A. Size Classification
PARAHO INDIRECT RETORTED
SHALE CHARACTERISTICS3
Unified Soil Classification System
Designation
Cobble
Gravel
Sand
Silt
Clay
B. Density
Compactive effort
ft.-lb/cu. ft.
Light, 6,200
Std. Proctor, 12,375
Heavy, 56,250
C . Strength
Days curing
28
60
120
D. Permeability
Compactive effort
ft.-lb/cu. ft.
Light, 6,200
Heavy, 56,250
ja
aHoltz, 1976.
Size, mm Weight percent
+38.1
4.76 - 38.1 52.4
0.074 - 4.76 , 31.9
0.005 - 0.074 13.3
-0.005 2.4
Water Added
Density, Ib/cu. ft.
None Optimum, 22 wt. %
89.0 93.9
94.4 98.8/99.2
102.1 105.8
Compressive strength, psi
11.8
15.3
10.8
Permeability, ft/yr
Loading No Optimum
psi water water
50 71
100 52
200 . 30
50 2 -
100 2.5
200 2.4
130
1
1
1
1
1
1
1
1
I
"f^
i
1
••
I
1
image:
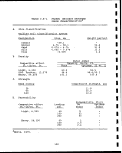 TABLE 3.4-2. PARAHO INDIRECT RETORTED SHALE
CHEMICAL COMPOSITION '[
Major componenta
Ash
Min C02
Organic C
Si
Al
Fe
Ca
Mg
S
Na
K
Trace components
Be
Hg
Cd
Sb
Se
Mo
Co
Ni
Pb
As
Cr
Cu
Zr
B
Zn
V
Mn
F
Concentration, wt. %
79.4, 79.1 '
18.1 !
1.8
10.8 :
4.2 •
1.9
10.9 :
3.9
0.7 :
1.7 i
2.0 i
Concentration, ppm:
0.7 '
0.03 i
^ '
0.8
0.2 ;
10
16 :
14 i
11
18 ;
66
26
62 :
18
21
88
272
450
aWCC (Holtz), 1976
bTRW, 1977.
131
image:
TABLE 3.4-2. PARAHO INDIRECT RETORTED SHALE
CHEMICAL COMPOSITION '[
Major componenta
Ash
Min C02
Organic C
Si
Al
Fe
Ca
Mg
S
Na
K
Trace components
Be
Hg
Cd
Sb
Se
Mo
Co
Ni
Pb
As
Cr
Cu
Zr
B
Zn
V
Mn
F
Concentration, wt. %
79.4, 79.1 '
18.1 !
1.8
10.8 :
4.2 •
1.9
10.9 :
3.9
0.7 :
1.7 i
2.0 i
Concentration, ppm:
0.7 '
0.03 i
^ '
0.8
0.2 ;
10
16 :
14 i
11
18 ;
66
26
62 :
18
21
88
272
450
aWCC (Holtz), 1976
bTRW, 1977.
131
image:
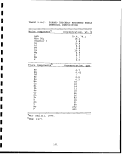 TABLE 3.4-3.
COMPOSITION OF PARAHO INDIRECT
SPENT OIL SHALES
Component
Weight, %
Si02
CaO
MgO
A1203
Fe2O3
Na20
K2O
S03
Mineral C02
Organic C
Inorganic C
23.1
15.3
6.5
8.0
2.7
2.3
2.4
0.7
18.1
1.84
4.95
Texture
pH
silty gravel
10.9
Source: EPA-600/2-80-205a,
1980
132
I
I
1
1
1
I
I
I
1
I
I
I
1
I
I
I
I
I
I
image:
TABLE 3.4-3.
COMPOSITION OF PARAHO INDIRECT
SPENT OIL SHALES
Component
Weight, %
Si02
CaO
MgO
A1203
Fe2O3
Na20
K2O
S03
Mineral C02
Organic C
Inorganic C
23.1
15.3
6.5
8.0
2.7
2.3
2.4
0.7
18.1
1.84
4.95
Texture
pH
silty gravel
10.9
Source: EPA-600/2-80-205a,
1980
132
I
I
1
1
1
I
I
I
1
I
I
I
1
I
I
I
I
I
I
image:
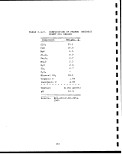 TABLE 3.4-4. PARAHO INDIRECT PROCESS WATER COMPOSITION
Element
Lead
Mercury
Cesium
Barium
Molybdenum
Strontium
Bromine
Selenium
Arsenic
Gallium
Zinc
Copper
Nickel
Cobalt
Germanium
Iron
Manganese
Chromium
Vanadium
Titanium
Scandium
Calcium
Potassium
Chlorine
Sulfur
Phosphorus
Silicon
Aluminum
Magnesium
Sodium
Fluorine
Boron
Lithium
Mg/mL
0.2
<0.01
0.01
2.0
0.1
3.0
0.009
0.1
1.0
<0.02
0.4
0.2
0.2
<0.04
<0.05
5.0
0.3
0.3
0.03
0.3
<0.05
>10
>10
2.0
>10
5.0
>10
0.8
>10
>10
7
5.0
1.0
Source: EPA-600/2-80-205a,
1980
133
image:
TABLE 3.4-4. PARAHO INDIRECT PROCESS WATER COMPOSITION
Element
Lead
Mercury
Cesium
Barium
Molybdenum
Strontium
Bromine
Selenium
Arsenic
Gallium
Zinc
Copper
Nickel
Cobalt
Germanium
Iron
Manganese
Chromium
Vanadium
Titanium
Scandium
Calcium
Potassium
Chlorine
Sulfur
Phosphorus
Silicon
Aluminum
Magnesium
Sodium
Fluorine
Boron
Lithium
Mg/mL
0.2
<0.01
0.01
2.0
0.1
3.0
0.009
0.1
1.0
<0.02
0.4
0.2
0.2
<0.04
<0.05
5.0
0.3
0.3
0.03
0.3
<0.05
>10
>10
2.0
>10
5.0
>10
0.8
>10
>10
7
5.0
1.0
Source: EPA-600/2-80-205a,
1980
133
image:
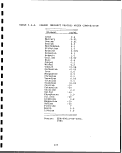 I
„. .. „
FROM THE PARAHO INDIRECT PROCESS
Parameter mg/L
I
Cations: H
Calcium 39.16 I
Magnesium <0.1
Sodium 0.29 m
Potassium 0.18 I
Ammonium, NH4 13,440-calc.
Anions: I
Carbonates 3,030-calc. •
Bicarbonates 6,280-calc.
Sulfate 1.65 H
Sulfide 390 I
Chloride TR
Fluoride 0.10 H
Nitrate 1.0 •
Nitrite <0.002 •
Nutrients: ffi
NH3-N 16,800-calc. H
Phosphate, total 0.75
Gross parameters: I
BOD 4,850
COD 17,100 _
TOC 9,800-36,900 •
TIC 1,600 •
Oil and grease 33.3
Solids, total 429 •
Solids, upon H
evaporation 406
Total alkalinity 12,900 M
Hardness 98-calc. I
Phenols 42
pH 9.5 •
Source: EPA-600/2-80-205a, 1980 •
I
134
I
image:
I
„. .. „
FROM THE PARAHO INDIRECT PROCESS
Parameter mg/L
I
Cations: H
Calcium 39.16 I
Magnesium <0.1
Sodium 0.29 m
Potassium 0.18 I
Ammonium, NH4 13,440-calc.
Anions: I
Carbonates 3,030-calc. •
Bicarbonates 6,280-calc.
Sulfate 1.65 H
Sulfide 390 I
Chloride TR
Fluoride 0.10 H
Nitrate 1.0 •
Nitrite <0.002 •
Nutrients: ffi
NH3-N 16,800-calc. H
Phosphate, total 0.75
Gross parameters: I
BOD 4,850
COD 17,100 _
TOC 9,800-36,900 •
TIC 1,600 •
Oil and grease 33.3
Solids, total 429 •
Solids, upon H
evaporation 406
Total alkalinity 12,900 M
Hardness 98-calc. I
Phenols 42
pH 9.5 •
Source: EPA-600/2-80-205a, 1980 •
I
134
I
image:
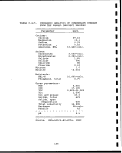 TABLE 3.4-6.
COMPOSITION OF BATCH GENERATED LEACHATE
FROM PARAHO INDIRECT RETORTED SHALE
Element
Al
Ca
Fe
K
Mg
Si
Na
S04
C03
HC03
Cl
PH
mg/L
<0.03
4.3
0.04
3.3
1.8
8.5
65
25
1.4
<0.1
44
10.9
Source: Holtz, 1976
135
image:
TABLE 3.4-6.
COMPOSITION OF BATCH GENERATED LEACHATE
FROM PARAHO INDIRECT RETORTED SHALE
Element
Al
Ca
Fe
K
Mg
Si
Na
S04
C03
HC03
Cl
PH
mg/L
<0.03
4.3
0.04
3.3
1.8
8.5
65
25
1.4
<0.1
44
10.9
Source: Holtz, 1976
135
image:
 3.5 OCCIDENTAL MODIFIED IN SITU OIL SHALE RETORTING
3.5.1 Retorting Operation
The recovery of shale oil by the Occidental modified in situ (MIS)
process involves the underground- pyrolysis of large chambers of
rubblized shale [Fox, July 1983]. These chambers are constructed
by mining out about 20% of the volume of the retort and blasting
the balance so that the entire chamber is filled with fractured
rock. A commercial-sized retort will measure about 333 ft by
166 ft in cross section and 400 ft high. Oil is recovered from
such a retort, shown in Figure 3.5-1, by initiating combustion at
the top of the retort with an external fuel supply and propagating
the^ reaction zone, which consists of a pyrolysis zone and a
trailing combustion zone, down the bed of rubblized with input
gas. The volatile hydrocarbons condense in the cool region at the
bottom of the retort and are pumped to the surface.
INPUT GAS
Overburden
EXIT GAS
Pillar =
,V BURNED OUT ZONE •"..•• =
ii COMBUSTION ZONE
. * •• s * .,v f '.., '..•'.
'-••*.:'"PYROLYSi'10N E|f
.•;. CONDENSATION ZONE" .' =
OIL
0 500 1000
Temperature (°C)
XBL 612-623!
Figure 3.5-1. Schematic of the Occidental modified
in situ retorting process.
Source: Fox, July 1983.
Occidental has tested eight experimental retorts at Logan Wash,
Colorado. Leaching studies have been conducted on materials from
Retort 3. Retort 3 was operated between February and July of
1975 in air-recycle gas mode. Yield was around 60% Fischer Assay.
This retort was cored in December 1978, and the spent shales have
been characterized and subjected to leaching studies.
Figure 3.5-2 presents a conceptual illustration of a rubblized MIS
retort [EPA-600/8-83-004, 1983]. In the operation of an MIS
retort, air and steam (streams 37 and 70) are admitted at the top
I
I
I
I
I
1
I
I
I
I
I
136
I
I
1
I
I
image:
3.5 OCCIDENTAL MODIFIED IN SITU OIL SHALE RETORTING
3.5.1 Retorting Operation
The recovery of shale oil by the Occidental modified in situ (MIS)
process involves the underground- pyrolysis of large chambers of
rubblized shale [Fox, July 1983]. These chambers are constructed
by mining out about 20% of the volume of the retort and blasting
the balance so that the entire chamber is filled with fractured
rock. A commercial-sized retort will measure about 333 ft by
166 ft in cross section and 400 ft high. Oil is recovered from
such a retort, shown in Figure 3.5-1, by initiating combustion at
the top of the retort with an external fuel supply and propagating
the^ reaction zone, which consists of a pyrolysis zone and a
trailing combustion zone, down the bed of rubblized with input
gas. The volatile hydrocarbons condense in the cool region at the
bottom of the retort and are pumped to the surface.
INPUT GAS
Overburden
EXIT GAS
Pillar =
,V BURNED OUT ZONE •"..•• =
ii COMBUSTION ZONE
. * •• s * .,v f '.., '..•'.
'-••*.:'"PYROLYSi'10N E|f
.•;. CONDENSATION ZONE" .' =
OIL
0 500 1000
Temperature (°C)
XBL 612-623!
Figure 3.5-1. Schematic of the Occidental modified
in situ retorting process.
Source: Fox, July 1983.
Occidental has tested eight experimental retorts at Logan Wash,
Colorado. Leaching studies have been conducted on materials from
Retort 3. Retort 3 was operated between February and July of
1975 in air-recycle gas mode. Yield was around 60% Fischer Assay.
This retort was cored in December 1978, and the spent shales have
been characterized and subjected to leaching studies.
Figure 3.5-2 presents a conceptual illustration of a rubblized MIS
retort [EPA-600/8-83-004, 1983]. In the operation of an MIS
retort, air and steam (streams 37 and 70) are admitted at the top
I
I
I
I
I
1
I
I
I
I
I
136
I
I
1
I
I
image:
 s\ /\
I
gs
§2
) UJ
t
137
i—
|S
fin
©
*
(e)
X^v
^f
"
jg;
±
©
H
*
J^^.
rt^
V2/
"lo]
^s»X^
Si
$
u>
ce
(0
5
z !2
51
^g
u
o
11
11
W-QUALITY
STEAM
o
_j
CEO
L UJ
a. ar
II
^o
1_ UJ I
si*
Q=
U>
1
gfe
= O
I—
U)
cr
i
CO
_J
en°
~ >-
3 >
<I
UJ
g
_ K
• %
|
—
1 o:
i«
— .
Uj =
-j t:
z
v _
gi
_j z
o —
_
i z
- o
*o —
1
O
m
fO
in
to
t^
g
to r<
in c
-
5|
jfs
— 0
o co'
•<r OT_
CO
0
s
<\i
^>
— ""
to
CD
O
in"
~
|||
i's's
o
I
~*
1
o
1:
o '
o :
CVJ «
£
S
D
0
o
•)
3
r
Q-
.
CD J
CT
?
: tn
UJ
**•
!
i
§
"
i
1 i
£ ;
!
n '
£>
NJ r
J
i
1
i
1
i
i
i
f
4J
C
i
o
U
•H
>
C
r
r-t
•g f
° jj
c 0
5
o C
-c — o
*"" o
O — 4J
— S "J
I* 5
°? I
= o i
So "
Uj'' "
C C
i "
tn «;
!
j
C
•H
-H
rt
a
o
-H
-P
PJ
CO
(1)
•p
nJ
-H
O
M
o
•P
PS
co
S
n3
ti
O
O
0)
I
•H
CO
t-)
O
I
en
co
£
o
o
CM
0)
U
M
O
to
image:
s\ /\
I
gs
§2
) UJ
t
137
i—
|S
fin
©
*
(e)
X^v
^f
"
jg;
±
©
H
*
J^^.
rt^
V2/
"lo]
^s»X^
Si
$
u>
ce
(0
5
z !2
51
^g
u
o
11
11
W-QUALITY
STEAM
o
_j
CEO
L UJ
a. ar
II
^o
1_ UJ I
si*
Q=
U>
1
gfe
= O
I—
U)
cr
i
CO
_J
en°
~ >-
3 >
<I
UJ
g
_ K
• %
|
—
1 o:
i«
— .
Uj =
-j t:
z
v _
gi
_j z
o —
_
i z
- o
*o —
1
O
m
fO
in
to
t^
g
to r<
in c
-
5|
jfs
— 0
o co'
•<r OT_
CO
0
s
<\i
^>
— ""
to
CD
O
in"
~
|||
i's's
o
I
~*
1
o
1:
o '
o :
CVJ «
£
S
D
0
o
•)
3
r
Q-
.
CD J
CT
?
: tn
UJ
**•
!
i
§
"
i
1 i
£ ;
!
n '
£>
NJ r
J
i
1
i
1
i
i
i
f
4J
C
i
o
U
•H
>
C
r
r-t
•g f
° jj
c 0
5
o C
-c — o
*"" o
O — 4J
— S "J
I* 5
°? I
= o i
So "
Uj'' "
C C
i "
tn «;
!
j
C
•H
-H
rt
a
o
-H
-P
PJ
CO
(1)
•p
nJ
-H
O
M
o
•P
PS
co
S
n3
ti
O
O
0)
I
•H
CO
t-)
O
I
en
co
£
o
o
CM
0)
U
M
O
to
image:
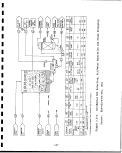 I
through several openings which connect the retort air level to the
top of the rubblized shale. The steam is produced from process
waters, using kettle evaporators and Lurgi waste heat recovery B
boilers. Steam promotes the water/gas reaction and provides a •
means of controlling the combustion zone temperature. Retort
start-up is accomplished through introduction of hot inert gas. •
When the temperature of the broken rock at the top of the retort g|
is high enough, air is introduced to initiate combustion.
An operating retort contains four major zones. In the first, or •
preheat zone, the air/steam feed gas is preheated through contact m
with hot processed shale. The heated gas then reaches a combus-
tion zone where oxygen is consumed by burning residual carbon in B
the processed shale. Below the combustion zone is the retorting B
zone where hot combustion gases heat the raw shale rubble to ap-
proximately 900°F, and the retorting process commences. During m
retorting, the kerogen is pyrolyzed to produce gas, oil and oil g
vapor, and solid residue with residual carbon. The shale oil
moves downward by gravity and precedes the advancing combustion
front by six to ten feet. In the final zone, the combustion and •
retorting gases are cooled as they flow downward, condensing most •
of the vaporized oil. During the early stages of the burn, when
the rock is still cool, some water is also condensed. H
Oil, water, and retort gas exit the bottom of the MIS retort and
undergo separation in a three-phase separation sump located under- «
ground. Heavy oils (stream 39) obtained from this sump are pumped •
to storage. The retort water (stream 41) is also pumped to the
surface and steam stripped to remove volatile compounds. The
overhead vapors (stream 43) are sent to the Phosam-W unit, while •
the stripped water is used in the production of low-quality steam H
to be injected back into the MIS retorts. The retort gas mixture
(stream 38) consists of light hydrocarbons from shale pyrolysis, n
carbon dioxide and water vapor from the combustion of carbonaceous ||
residue, water vapor from steam injection, carbon dioxide from the
decomposition of inorganic carbonate (primarily dolomite and cal- _.
cite), and nitrogen from the combustion air. In addition, the gas B
contains ammonia and sulfur-bearing gaseous products such as H2S "
and COS. The gases are drawn to the surface by large blowers and
fed to an absorption/cooling oil recovery unit. •
3.5.2 Solid Wastes
Table 3.5-1 presents an inventory of solid and liquid waste Q
streams. From a commercial size development with 229 retorts
operating simultaneously, each 120 ft x 120 ft x 250 ft and
containing oil shale with an average Fischer assay of 15 gpt, the B
Occidental modified in-situ process will generate among other •
products the following: Mined rock - 56,685 tons per calender
day; Wastewater - 1,458 gpm [EPA-6'00/7-79-075, 1979]. B
I
138
I
image:
I
through several openings which connect the retort air level to the
top of the rubblized shale. The steam is produced from process
waters, using kettle evaporators and Lurgi waste heat recovery B
boilers. Steam promotes the water/gas reaction and provides a •
means of controlling the combustion zone temperature. Retort
start-up is accomplished through introduction of hot inert gas. •
When the temperature of the broken rock at the top of the retort g|
is high enough, air is introduced to initiate combustion.
An operating retort contains four major zones. In the first, or •
preheat zone, the air/steam feed gas is preheated through contact m
with hot processed shale. The heated gas then reaches a combus-
tion zone where oxygen is consumed by burning residual carbon in B
the processed shale. Below the combustion zone is the retorting B
zone where hot combustion gases heat the raw shale rubble to ap-
proximately 900°F, and the retorting process commences. During m
retorting, the kerogen is pyrolyzed to produce gas, oil and oil g
vapor, and solid residue with residual carbon. The shale oil
moves downward by gravity and precedes the advancing combustion
front by six to ten feet. In the final zone, the combustion and •
retorting gases are cooled as they flow downward, condensing most •
of the vaporized oil. During the early stages of the burn, when
the rock is still cool, some water is also condensed. H
Oil, water, and retort gas exit the bottom of the MIS retort and
undergo separation in a three-phase separation sump located under- «
ground. Heavy oils (stream 39) obtained from this sump are pumped •
to storage. The retort water (stream 41) is also pumped to the
surface and steam stripped to remove volatile compounds. The
overhead vapors (stream 43) are sent to the Phosam-W unit, while •
the stripped water is used in the production of low-quality steam H
to be injected back into the MIS retorts. The retort gas mixture
(stream 38) consists of light hydrocarbons from shale pyrolysis, n
carbon dioxide and water vapor from the combustion of carbonaceous ||
residue, water vapor from steam injection, carbon dioxide from the
decomposition of inorganic carbonate (primarily dolomite and cal- _.
cite), and nitrogen from the combustion air. In addition, the gas B
contains ammonia and sulfur-bearing gaseous products such as H2S "
and COS. The gases are drawn to the surface by large blowers and
fed to an absorption/cooling oil recovery unit. •
3.5.2 Solid Wastes
Table 3.5-1 presents an inventory of solid and liquid waste Q
streams. From a commercial size development with 229 retorts
operating simultaneously, each 120 ft x 120 ft x 250 ft and
containing oil shale with an average Fischer assay of 15 gpt, the B
Occidental modified in-situ process will generate among other •
products the following: Mined rock - 56,685 tons per calender
day; Wastewater - 1,458 gpm [EPA-6'00/7-79-075, 1979]. B
I
138
I
image:
 3.5.3 Characteristics of Solid Wastes !
Compositions of solid and liquid waste streams are shown in
Table 3.5-2. Available data on spent shale are presented in
Tables 3.5-3 and 3.5-4. Analytical data on core samples are given
in Tables 3.5-5 and 3.5-6. Data on steam boiler blowdown and
wastewaters are shown in Tables 3.5-7 to 3.5-9. Finally, various
leachate data are presented in Tables 3.5-10 to 3.5-12.
139
image:
3.5.3 Characteristics of Solid Wastes !
Compositions of solid and liquid waste streams are shown in
Table 3.5-2. Available data on spent shale are presented in
Tables 3.5-3 and 3.5-4. Analytical data on core samples are given
in Tables 3.5-5 and 3.5-6. Data on steam boiler blowdown and
wastewaters are shown in Tables 3.5-7 to 3.5-9. Finally, various
leachate data are presented in Tables 3.5-10 to 3.5-12.
139
image:
 CO
CO
w
0
o
«
CO
M
s
a
W
M
O
o
o
£
o
CO
<cj
H
CO
p,J
CO
s
p
M
ED
ot
M
"ttT
Pj N
p^ "rH
< CO
y "£j
•j S
O rH
CO A4
(Xj f"|
O CO
Qj
13
00
Ho
So
S cr>
•
t
t
in
12
U
«
1
CC
IJ,
2° |S
O
.3 g
§4»
U
C
O O
r
ff^
» --
53
w'o
Ul *H
i
£
scription of s
«
IS
ei
SI
41 C
3-S to
re 4J u
O IB 41
>i'H m
ss*
4-1 A)
g g u
•rt O IM
4J Li
CO 41 3
J- O 10
i!g-§
•rl J3 W
(4-1
C -rH
•H 01 Q
C U
U -3 3
4> JS *J
4J U IB
re re c
•S3*
§»)5
O B
kl O <*4
U Ul 0
u
Q
X
3
to
Ul
rH
•s
•g
re
rH
CM
rH
rH
4!
1
•a
41 — *
Ul 01
ui U
oi re
8-i
a.s
W •— '
X
IB
m
O CM
CO CM Tj«
CO M fl"
CM CM PH rH
1 1 I 1
O O O CM
co \o M r*
P* rH r>
Ul CM*
u
-H en
S-S
o»c
O d
•a tJ
?>cn w to
X M^H .H
2 S Q Q
^^
*^
o <n
CM O
in m
IS
CM rH
VO
rt)
m
si
u
•— '
4) C T3
5'iH 41
41 fc* 1 T3
§-H 41 > O 4J
4-1 U) 6 C rO
u rrj 3 U l-
M-t i— 1 41 0) 4J
U 41 4) U
I! H 41 rO*S ° £
a^ -u ^g i- 4J
is§* •III'
5 tZ T3 4J Ul O **
4J 4) O CP S rH
4-) ki to v en u 4-*
•H 4-> IM t-t 4}
i-i T3 c a: 4> M
3 tt C I-I 4) *r4 41
O JJ O J3 C O C
iJ 10 U 4J <H > *H
O
CM 4>
1 1 1
O O CO
m en »H
rH CM
m »
CM
to
u
•H 01
g.3
ff|
•S 0
41 OI
53
O O
Ul U
» ui to
i'5 2
.— *
vD
VD m
rH CO
co en
i i
en a*
rH •
o m
rH rH
in
u
5
11
Bl
!l
cu u
•S*rB
*J
CM
to n
ro 4-1 o *a <M
rH ffl O.J2 W
> 41 S "S rH HI O>
U ^ tu 3 -H
** ffl 5 ° S"S-H
> > ^£ tfl *H Ul 4-*
2i c 5 -H i 3 i
41 T5 . 13 rH
e*^.5>irH OU^rH
O. ^ "O rH £ .O J3
••H W 4J 3 t* C
4J C U C 41 rHf-40)
C C > « O W
4JOOC1H j; 4J SM
tnuuna. HOC.
gigg
vo_ rM in ui i ^
S rt z
u
u
W -H Ul
•H m *H
C O» rH
&u o
o *a M
It C 'o C
O -M 1 (0 "O
TJ T) ' T3 *0
O O O M
IO Ul Ul 3
run w to u to
3; "j4.H -H -H
S K ca a a
en
r> rH co en
Cn CT> rH P-
rH
"2S
•H
£ St
-rt w
Ij 1«
4-* 4-> cn nt
IS 4) tfl M CJ
to 4-i E '•x-'
C ro I*
CU U) 41 g Ul
T3 C 4J S 1-
C 41 (d U 41
0 T3 S ^ IWrH
U C 41 0
o 4J a, co
So fc* cu So
O *rt O
CJ! B 4J fc* 'O W
W 41 JM CO O fO
3C 03 CO
i m re
0 1
1
s
41
3
u
Ul
41
Ul
.C
2
i
2
41
5
4)
ffl*
(0
4-1
CO
41
•a
J 5
g 2
11 §
*> 41 C
5 • 'S
•rt C
3 -S 5
4-J 4-) C
U -H OI
1 S i
*o u
o
: 1 I
i » . o
" IH . I
tO 't-t T3 4J
j- 4i o 41 re
4-> 4J U C U
(0 A* -H -H
10 U 6 T3
g <rt M C C
S *a *W 4) -H
41 C <W 4J
U. -rt 3 «J 1
4-1 rH 'D
tO Li rH O 1
re 4) T3 1 M
JJs^J
m
CO
en
o
ro
CO
CO
o
?
£
Ul
V
s
9
o
CO
EH
140
I
I
I
1
1
I
I
I
1
I
I
I
I
I
I
I
I
I
I
image:
CO
CO
w
0
o
«
CO
M
s
a
W
M
O
o
o
£
o
CO
<cj
H
CO
p,J
CO
s
p
M
ED
ot
M
"ttT
Pj N
p^ "rH
< CO
y "£j
•j S
O rH
CO A4
(Xj f"|
O CO
Qj
13
00
Ho
So
S cr>
•
t
t
in
12
U
«
1
CC
IJ,
2° |S
O
.3 g
§4»
U
C
O O
r
ff^
» --
53
w'o
Ul *H
i
£
scription of s
«
IS
ei
SI
41 C
3-S to
re 4J u
O IB 41
>i'H m
ss*
4-1 A)
g g u
•rt O IM
4J Li
CO 41 3
J- O 10
i!g-§
•rl J3 W
(4-1
C -rH
•H 01 Q
C U
U -3 3
4> JS *J
4J U IB
re re c
•S3*
§»)5
O B
kl O <*4
U Ul 0
u
Q
X
3
to
Ul
rH
•s
•g
re
rH
CM
rH
rH
4!
1
•a
41 — *
Ul 01
ui U
oi re
8-i
a.s
W •— '
X
IB
m
O CM
CO CM Tj«
CO M fl"
CM CM PH rH
1 1 I 1
O O O CM
co \o M r*
P* rH r>
Ul CM*
u
-H en
S-S
o»c
O d
•a tJ
?>cn w to
X M^H .H
2 S Q Q
^^
*^
o <n
CM O
in m
IS
CM rH
VO
rt)
m
si
u
•— '
4) C T3
5'iH 41
41 fc* 1 T3
§-H 41 > O 4J
4-1 U) 6 C rO
u rrj 3 U l-
M-t i— 1 41 0) 4J
U 41 4) U
I! H 41 rO*S ° £
a^ -u ^g i- 4J
is§* •III'
5 tZ T3 4J Ul O **
4J 4) O CP S rH
4-) ki to v en u 4-*
•H 4-> IM t-t 4}
i-i T3 c a: 4> M
3 tt C I-I 4) *r4 41
O JJ O J3 C O C
iJ 10 U 4J <H > *H
O
CM 4>
1 1 1
O O CO
m en »H
rH CM
m »
CM
to
u
•H 01
g.3
ff|
•S 0
41 OI
53
O O
Ul U
» ui to
i'5 2
.— *
vD
VD m
rH CO
co en
i i
en a*
rH •
o m
rH rH
in
u
5
11
Bl
!l
cu u
•S*rB
*J
CM
to n
ro 4-1 o *a <M
rH ffl O.J2 W
> 41 S "S rH HI O>
U ^ tu 3 -H
** ffl 5 ° S"S-H
> > ^£ tfl *H Ul 4-*
2i c 5 -H i 3 i
41 T5 . 13 rH
e*^.5>irH OU^rH
O. ^ "O rH £ .O J3
••H W 4J 3 t* C
4J C U C 41 rHf-40)
C C > « O W
4JOOC1H j; 4J SM
tnuuna. HOC.
gigg
vo_ rM in ui i ^
S rt z
u
u
W -H Ul
•H m *H
C O» rH
&u o
o *a M
It C 'o C
O -M 1 (0 "O
TJ T) ' T3 *0
O O O M
IO Ul Ul 3
run w to u to
3; "j4.H -H -H
S K ca a a
en
r> rH co en
Cn CT> rH P-
rH
"2S
•H
£ St
-rt w
Ij 1«
4-* 4-> cn nt
IS 4) tfl M CJ
to 4-i E '•x-'
C ro I*
CU U) 41 g Ul
T3 C 4J S 1-
C 41 (d U 41
0 T3 S ^ IWrH
U C 41 0
o 4J a, co
So fc* cu So
O *rt O
CJ! B 4J fc* 'O W
W 41 JM CO O fO
3C 03 CO
i m re
0 1
1
s
41
3
u
Ul
41
Ul
.C
2
i
2
41
5
4)
ffl*
(0
4-1
CO
41
•a
J 5
g 2
11 §
*> 41 C
5 • 'S
•rt C
3 -S 5
4-J 4-) C
U -H OI
1 S i
*o u
o
: 1 I
i » . o
" IH . I
tO 't-t T3 4J
j- 4i o 41 re
4-> 4J U C U
(0 A* -H -H
10 U 6 T3
g <rt M C C
S *a *W 4) -H
41 C <W 4J
U. -rt 3 «J 1
4-1 rH 'D
tO Li rH O 1
re 4) T3 1 M
JJs^J
m
CO
en
o
ro
CO
CO
o
?
£
Ul
V
s
9
o
CO
EH
140
I
I
I
1
1
I
I
I
1
I
I
I
I
I
I
I
I
I
I
image:
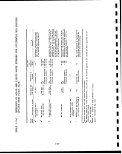 CO
CO
w
o
O
PM
CO
g
j
irf*
EH
13
W
Q
i— i
O
o
o
rv*
o
fa
CO
W
03
EH
CO
rTi
H
CO
(^
te"
^s
<
Q
1— 1
0
CO ^
OJ
CO jj
iz; G
O ^
EH ^
CO CO
O f-<
o§
0 0
&l
vD
01
1
in
en
M
CQ
E-i
c
H
Si
l-G CJ
-C
r— i
CO
O
rH
ns c,
w
jj
C
0)
§
r
o
U
c
H
h.
3 Si
0 .C
i-H --,
W
WCO
fB O
f£* r~H
§
•H
4_)
&
-H
Si
W
<L>
73
£
5
<U
IM
4-J
fO (IJ
£i
•p 3
co G
• . * 1
D
O. O
C
rH
o r*-
> c-~
CM
: o
) O
o
CM
rH
^
X
"Q-
^j
CO
JJ
g
V
c
o
i
o
U
o
X
W
U
•r-
G
n
S1-
O
cjju
CO
co co
Q H
^-l
CO
ex
ffi
CO
§
O
U
a
&>,-,
'g|
CO
w o
W rH
(B ^^
a
1 1
o o r~ co oo o o
o o o ^j* r- o o
o o m oo a~> o in
o o vo r- r- o o->
O VD O O in 01 VD
vo CM in cv oo co
CM" rn" r-T
i |
CM CM 00 r}< «* o
c~- "sJ* t— i in oo Q
r-- «* CM co m .
CM o CM" oo" T-H" ^
rH
1 |
O O O O O O
CO CM CO CM CM Q
rH CO rH CO in .
rH . rH
SS ° §' ° °
CM CM
o oo o ^ o o fi
00 00 CO rH in
C~- CTi rH VO
CM VD"
CM
*3* in CD
r- co o
CM o co"
rH CO
CO VD .
o co VD in ^~*
CM O rH CO CTl
m co oo CTI vo • o tT>
•*CMCOrHrHCTlOO CO
II 1 1 C~- rH rH p-
o in co CT> co CTI
O • rH • rH
CM rH O CO •-— '
rH rH rH rH
VD m
M tO
0> rH W
•PS Si
* ' § = rH
os o
'=' V 'S^ Si (0 O
r""j SiS-PSdJ <UW rHSi ^--
"J 1> -H 0) -H W JJ E -H CO
•S . -PXJSiJxic (OSi CO
fv TO TO tt) WO £ ^-i
»> & CO S ^J Q 4_l Q .(J -^J
S t rr^ P O 'O & !i UH "H JJ
u r^ J? C7^ o Go MH co
& S>Q!§!& O-HO-HW
w ^ro, "rj"3 reaijj SPCJ
S s co g co m
J2 rH CM 1 rO 43
rH
• ,
n3
i °
•^
w
-H
*G
U
•H
•i
Si
rr^
;,_)
i w
O JJ
<D W
jj e 73
a 2 -H
<U 0 rH
U Si 0
«! -H W
i G t3
: - <U <L)
W T3
rH <U G
ro -C a)
-H JJ ft
Si CQ
:(L) r< ^j
•P JJ W
(0 -H
S & rH
nj
MH JJ jj
O U O
nj jJ
C* i i
6 G •
•H O
JJ U CO
Si CO
:o o H
ft JJ
; G co
U -H -CO
•H W CTi
G <U 73 rH
fO g -H
CP 0 rH
Si U O <*
O WO
JJ O
Si <0 T3 1
O X! (U CO
KH jJ > oo
rH 1
T3 W O 00
<L» g W "-^
JJ fO WO
Si <U -H O
O Si 73 vO
ft JJ 1
(U W i-H <j
Si (B Pi
W JJ W
in v o
jj jj jj
01 u i a!
S -H U
<l> T) CO Si
«H G Q 3
W M EH 0
H3 XI CJ W
141
image:
CO
CO
w
o
O
PM
CO
g
j
irf*
EH
13
W
Q
i— i
O
o
o
rv*
o
fa
CO
W
03
EH
CO
rTi
H
CO
(^
te"
^s
<
Q
1— 1
0
CO ^
OJ
CO jj
iz; G
O ^
EH ^
CO CO
O f-<
o§
0 0
&l
vD
01
1
in
en
M
CQ
E-i
c
H
Si
l-G CJ
-C
r— i
CO
O
rH
ns c,
w
jj
C
0)
§
r
o
U
c
H
h.
3 Si
0 .C
i-H --,
W
WCO
fB O
f£* r~H
§
•H
4_)
&
-H
Si
W
<L>
73
£
5
<U
IM
4-J
fO (IJ
£i
•p 3
co G
• . * 1
D
O. O
C
rH
o r*-
> c-~
CM
: o
) O
o
CM
rH
^
X
"Q-
^j
CO
JJ
g
V
c
o
i
o
U
o
X
W
U
•r-
G
n
S1-
O
cjju
CO
co co
Q H
^-l
CO
ex
ffi
CO
§
O
U
a
&>,-,
'g|
CO
w o
W rH
(B ^^
a
1 1
o o r~ co oo o o
o o o ^j* r- o o
o o m oo a~> o in
o o vo r- r- o o->
O VD O O in 01 VD
vo CM in cv oo co
CM" rn" r-T
i |
CM CM 00 r}< «* o
c~- "sJ* t— i in oo Q
r-- «* CM co m .
CM o CM" oo" T-H" ^
rH
1 |
O O O O O O
CO CM CO CM CM Q
rH CO rH CO in .
rH . rH
SS ° §' ° °
CM CM
o oo o ^ o o fi
00 00 CO rH in
C~- CTi rH VO
CM VD"
CM
*3* in CD
r- co o
CM o co"
rH CO
CO VD .
o co VD in ^~*
CM O rH CO CTl
m co oo CTI vo • o tT>
•*CMCOrHrHCTlOO CO
II 1 1 C~- rH rH p-
o in co CT> co CTI
O • rH • rH
CM rH O CO •-— '
rH rH rH rH
VD m
M tO
0> rH W
•PS Si
* ' § = rH
os o
'=' V 'S^ Si (0 O
r""j SiS-PSdJ <UW rHSi ^--
"J 1> -H 0) -H W JJ E -H CO
•S . -PXJSiJxic (OSi CO
fv TO TO tt) WO £ ^-i
»> & CO S ^J Q 4_l Q .(J -^J
S t rr^ P O 'O & !i UH "H JJ
u r^ J? C7^ o Go MH co
& S>Q!§!& O-HO-HW
w ^ro, "rj"3 reaijj SPCJ
S s co g co m
J2 rH CM 1 rO 43
rH
• ,
n3
i °
•^
w
-H
*G
U
•H
•i
Si
rr^
;,_)
i w
O JJ
<D W
jj e 73
a 2 -H
<U 0 rH
U Si 0
«! -H W
i G t3
: - <U <L)
W T3
rH <U G
ro -C a)
-H JJ ft
Si CQ
:(L) r< ^j
•P JJ W
(0 -H
S & rH
nj
MH JJ jj
O U O
nj jJ
C* i i
6 G •
•H O
JJ U CO
Si CO
:o o H
ft JJ
; G co
U -H -CO
•H W CTi
G <U 73 rH
fO g -H
CP 0 rH
Si U O <*
O WO
JJ O
Si <0 T3 1
O X! (U CO
KH jJ > oo
rH 1
T3 W O 00
<L» g W "-^
JJ fO WO
Si <U -H O
O Si 73 vO
ft JJ 1
(U W i-H <j
Si (B Pi
W JJ W
in v o
jj jj jj
01 u i a!
S -H U
<l> T) CO Si
«H G Q 3
W M EH 0
H3 XI CJ W
141
image:
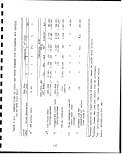 TABLE 3.5-3. COMPOSITION OF OCCIDENTAL MIS PROCESSED SHALE
Component
Weight
percent
Mass flow,
103 Ib/hr
Flow,
103 Ib-moles/hr
Processed shale
(in-place) 100.00
Carbon (organic) 2.40
Sulfur (total) 0.62
11,421
274
71
23
2.2
Source: EPA-600/8-83-004, 1983. 69,000 BPSD Plant Size
TABLE 3.5-4. BORON AND FLUORIDE IN OXY RETORT 3E SPENT SHALE
Sample
number
Depth, ft.
±10%
|jg/g
_±io%
i
3
4
14
15
17
18
442 - 445
457 - 460
460 - 463
483 - 485
483.5 - 485.5
500 - 506
506 - 515
470
530
680
1,200
1,100
2,600
2,300
210
140
110
275
210
470
550
aF - gas diffusion-colorimetric
DB - colorimetric (Azomethine-H).
Source: DOE/EV-0078, May 1980
TABLE 3.5-5.
MINERALOGICAL ANALYSES FOR SELECTED SAMPLES
OF OXY REPORT 3E SPENT SHALE CORE
No. 5
No. 16
Mean depth (ft)
Major mineral (s)
Minor mineral (s)
Trace mineral (s)
464.5
Calcite
Diopside
a-quartz
Aragonite
Kalsilite
Akermanite
493
Akermanite
Diopside
Kalsilite
2 Unidentified phases
Source: DOE/EV-0078, May 1980
142
1
I
I
1
I
I
1
1
I
I
I
I
I
I
I
I
I
I
I
image:
TABLE 3.5-3. COMPOSITION OF OCCIDENTAL MIS PROCESSED SHALE
Component
Weight
percent
Mass flow,
103 Ib/hr
Flow,
103 Ib-moles/hr
Processed shale
(in-place) 100.00
Carbon (organic) 2.40
Sulfur (total) 0.62
11,421
274
71
23
2.2
Source: EPA-600/8-83-004, 1983. 69,000 BPSD Plant Size
TABLE 3.5-4. BORON AND FLUORIDE IN OXY RETORT 3E SPENT SHALE
Sample
number
Depth, ft.
±10%
|jg/g
_±io%
i
3
4
14
15
17
18
442 - 445
457 - 460
460 - 463
483 - 485
483.5 - 485.5
500 - 506
506 - 515
470
530
680
1,200
1,100
2,600
2,300
210
140
110
275
210
470
550
aF - gas diffusion-colorimetric
DB - colorimetric (Azomethine-H).
Source: DOE/EV-0078, May 1980
TABLE 3.5-5.
MINERALOGICAL ANALYSES FOR SELECTED SAMPLES
OF OXY REPORT 3E SPENT SHALE CORE
No. 5
No. 16
Mean depth (ft)
Major mineral (s)
Minor mineral (s)
Trace mineral (s)
464.5
Calcite
Diopside
a-quartz
Aragonite
Kalsilite
Akermanite
493
Akermanite
Diopside
Kalsilite
2 Unidentified phases
Source: DOE/EV-0078, May 1980
142
1
I
I
1
I
I
1
1
I
I
I
I
I
I
I
I
I
I
I
image:
 TABLE 3.5-6. ANALYSIS OF CORE SAMPLES FROM OXY
RETORT 3E PRELIMINARY DATAa ;
Average
cpncentrati on
Element
Average
concentration
Al
As
°
Ba*
Cu
Fe
d
b
d
K
b'd
4.7 ± 2%
26 ± 2 ppm
256 ppm
593 ± 60 ppm
19 ± 1.4%
5.0 ± 0.5 ppm
44 ± 4.4 ppm
2.43 ± 0.07 ppm
41 ± 6.2 ppb
3.0 ± 0.3%
Mg"
Mn
Mod
Nab
Nid
Pbd
~d
sid
sr
5.8 j± 0.6%
520 :± 52 ppm
10 ;± 1 ppm
1.26 ± 0.03%
29 ifc 3 ppm
26 ± 3 ppm
0.45 ± 0.07%
19 ± 2%
i
1100 ± 110 ppm
0.26 ± 3%
Neutron activation analysis.
£*
DC Plasma Emission Spectroscopy.
X-ray fluorescence.
6
Flameless atomic absorption.
Source: DOE/EV-0078, May 1980
143
image:
TABLE 3.5-6. ANALYSIS OF CORE SAMPLES FROM OXY
RETORT 3E PRELIMINARY DATAa ;
Average
cpncentrati on
Element
Average
concentration
Al
As
°
Ba*
Cu
Fe
d
b
d
K
b'd
4.7 ± 2%
26 ± 2 ppm
256 ppm
593 ± 60 ppm
19 ± 1.4%
5.0 ± 0.5 ppm
44 ± 4.4 ppm
2.43 ± 0.07 ppm
41 ± 6.2 ppb
3.0 ± 0.3%
Mg"
Mn
Mod
Nab
Nid
Pbd
~d
sid
sr
5.8 j± 0.6%
520 :± 52 ppm
10 ;± 1 ppm
1.26 ± 0.03%
29 ifc 3 ppm
26 ± 3 ppm
0.45 ± 0.07%
19 ± 2%
i
1100 ± 110 ppm
0.26 ± 3%
Neutron activation analysis.
£*
DC Plasma Emission Spectroscopy.
X-ray fluorescence.
6
Flameless atomic absorption.
Source: DOE/EV-0078, May 1980
143
image:
 TABLE 3.5-7. OXY RETORT
Collected
except as
Aluminum
Arsenic
Antimony
Bromine
Calcium
Chlorine
Chromium
Cobalt
Iron
Magnesium
Manganese
Molybdenum
Nickel
Nitrogen
Selenium
Sodium
Sulfur (%)
Uranium
Vanadium
Zinc
6 STEAM BOILER BLOWDOWN
- March 6, 1979 (in ppm
noted )
NAA
<4.01
2.8 ± 0.2
; 0.09 ± 0.01
6.8 ± 0.2
<80
2,220 ± 25
! <o.l
<0.01
<5
120 ± 20
<0.2
7.3 ± 0.6
<1
216 ± 10
0.15 ± 0.02
14,100 ± 100
0.50 ± 0.08
0.22 ± 0.03
<0.01
±0.3
Source: DOE/EV-0078, May 1980
144
1
1
I
1
I
I
I
1
1
1
1
1
1
1
1
1
1
image:
TABLE 3.5-7. OXY RETORT
Collected
except as
Aluminum
Arsenic
Antimony
Bromine
Calcium
Chlorine
Chromium
Cobalt
Iron
Magnesium
Manganese
Molybdenum
Nickel
Nitrogen
Selenium
Sodium
Sulfur (%)
Uranium
Vanadium
Zinc
6 STEAM BOILER BLOWDOWN
- March 6, 1979 (in ppm
noted )
NAA
<4.01
2.8 ± 0.2
; 0.09 ± 0.01
6.8 ± 0.2
<80
2,220 ± 25
! <o.l
<0.01
<5
120 ± 20
<0.2
7.3 ± 0.6
<1
216 ± 10
0.15 ± 0.02
14,100 ± 100
0.50 ± 0.08
0.22 ± 0.03
<0.01
±0.3
Source: DOE/EV-0078, May 1980
144
1
1
I
1
I
I
I
1
1
1
1
1
1
1
1
1
1
image:
 TABLE 3.5-8. COMPOUNDS IDENTIFIED IN OCCIDENTAL
OIL SHALE RETORT WASTEWATERS i
m <- -. - 2,300
Total organic carbon ppm
Toluene x
Phenol xa
o-Cresol x
m-Cresol x
p-Cresol x
C2-Phenol x
Cs-Phenol
2,6-Dimethylphenol
3,5-Dimethylphenol x
Methoxyphenol
Naphthalene
2-Methylnaphthalene
C2-Naphthalene
2-Methylpyridine
4-MethyIpyridine
2,3-DimethyIpyridine
2,4-Dimethylpyridine
2,5-DimethyIpyridine
2,6-DimethyIpyridine
2-Ethylpyridine
C2-Pyridines
2,4,6-TrimethyIpyridine x
C3-Pyridines
4-(n-propylJpyridine
C4-Pyridines
4-(3-pentyl)pyridine
C5-Pyridines
Aniline x
3-Methylaniline
N-methylaniline
N,N-dimethylaniline
N-ethylaniline
2,4-Diethylaniline
N,N-diethylaniline x
Quinoline x
Isoguinoline x
(continued)
145
image:
TABLE 3.5-8. COMPOUNDS IDENTIFIED IN OCCIDENTAL
OIL SHALE RETORT WASTEWATERS i
m <- -. - 2,300
Total organic carbon ppm
Toluene x
Phenol xa
o-Cresol x
m-Cresol x
p-Cresol x
C2-Phenol x
Cs-Phenol
2,6-Dimethylphenol
3,5-Dimethylphenol x
Methoxyphenol
Naphthalene
2-Methylnaphthalene
C2-Naphthalene
2-Methylpyridine
4-MethyIpyridine
2,3-DimethyIpyridine
2,4-Dimethylpyridine
2,5-DimethyIpyridine
2,6-DimethyIpyridine
2-Ethylpyridine
C2-Pyridines
2,4,6-TrimethyIpyridine x
C3-Pyridines
4-(n-propylJpyridine
C4-Pyridines
4-(3-pentyl)pyridine
C5-Pyridines
Aniline x
3-Methylaniline
N-methylaniline
N,N-dimethylaniline
N-ethylaniline
2,4-Diethylaniline
N,N-diethylaniline x
Quinoline x
Isoguinoline x
(continued)
145
image:
 TABLE 3.5-8 (continued)
2,300
Total organic carbon ppm
2-Methylquinoline x
3-Methylquinoline x
7-Methylquinoline x
2 , 4-Dimethylquinoline x
2 , 6-Dimethylquino;iine
2 , 7-Dimethylquinoline
Trimethylquinoline
Acridine
Compounds marked with "X" were
identified in each sample.
Those not marked are not
necessarily absent.
Source: ESI, June 1983
i
;
146
1
1
1
I
•
1
1
I
1
1
I
1
1
1
1
I
1
1
1
image:
TABLE 3.5-8 (continued)
2,300
Total organic carbon ppm
2-Methylquinoline x
3-Methylquinoline x
7-Methylquinoline x
2 , 4-Dimethylquinoline x
2 , 6-Dimethylquino;iine
2 , 7-Dimethylquinoline
Trimethylquinoline
Acridine
Compounds marked with "X" were
identified in each sample.
Those not marked are not
necessarily absent.
Source: ESI, June 1983
i
;
146
1
1
1
I
•
1
1
I
1
1
I
1
1
1
1
I
1
1
1
image:
 TABLE 3.5-9. OXY RETORT 6 PRODUCT WATER ANALYSIS ^RESULTS
(ppm) j
Aluminum
!Antimony
Arsejnic
Boron
Bromine
Calcium
Chlorine
Chromium
Cobalt
Copper
Fluoride
Gallium
Iron
Lead
Lithium
Magnesium
Manganese
Mercury
Molybdenum
Nickel
Nitrogen
Potassium
Selenium
Silicon
Sodium
Strontium
Sulfide
Sulfur
Titanium
Uranium
Vanadium
Zinc
NAA
XRF
Other
0.018 ± 0.008
1.32 ± 0.06
0.34 ± 0.06
232 ±9
<0.8
<0.2
<4
<120
<30
0.3 ± 0.1
<0.3
0.04 ± 0.01
2810 ± 20
3100 ± 870
<0.06
<0.04
<0.2
0.87 ± 0.01
0.28 ± 0.04
0.72 ± 0.43
183 ± 8
<0.07
<0.02
0.03 ± 0.01
<0.01
0.19 ± 0.02
<0.04
<0.04
<0.02
36 ± 2
<160
0.57 ± 0.08
2720 ± 150
0.53 ± 0.07
<0.12
12.6 ± 0.5a 113.1 ± 0.03]
34.8 ±! 1.0°
[
1.80 ±; 0.05e
<0.02d
0.257a
1500 ±1100
112 ±;15
DC plasma emission spectroscopy.
Colorimetric.
Selective ion electrode.
Cold vapor atomic absorption.
Q
Conventional atomic absorption.
Source: DOE/EV-0078, May 1980
147
image:
TABLE 3.5-9. OXY RETORT 6 PRODUCT WATER ANALYSIS ^RESULTS
(ppm) j
Aluminum
!Antimony
Arsejnic
Boron
Bromine
Calcium
Chlorine
Chromium
Cobalt
Copper
Fluoride
Gallium
Iron
Lead
Lithium
Magnesium
Manganese
Mercury
Molybdenum
Nickel
Nitrogen
Potassium
Selenium
Silicon
Sodium
Strontium
Sulfide
Sulfur
Titanium
Uranium
Vanadium
Zinc
NAA
XRF
Other
0.018 ± 0.008
1.32 ± 0.06
0.34 ± 0.06
232 ±9
<0.8
<0.2
<4
<120
<30
0.3 ± 0.1
<0.3
0.04 ± 0.01
2810 ± 20
3100 ± 870
<0.06
<0.04
<0.2
0.87 ± 0.01
0.28 ± 0.04
0.72 ± 0.43
183 ± 8
<0.07
<0.02
0.03 ± 0.01
<0.01
0.19 ± 0.02
<0.04
<0.04
<0.02
36 ± 2
<160
0.57 ± 0.08
2720 ± 150
0.53 ± 0.07
<0.12
12.6 ± 0.5a 113.1 ± 0.03]
34.8 ±! 1.0°
[
1.80 ±; 0.05e
<0.02d
0.257a
1500 ±1100
112 ±;15
DC plasma emission spectroscopy.
Colorimetric.
Selective ion electrode.
Cold vapor atomic absorption.
Q
Conventional atomic absorption.
Source: DOE/EV-0078, May 1980
147
image:
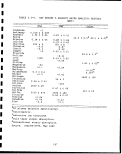 TABLE 3.5-10.
CONCENTRATIONS OF DISSOLVED SPECIES
IN THE LEACHATE FROM OCCIDENTAL MIS
PROCESSED SHALE
Ore
sample
number
1
2
3
4
Constituent
F
1.2
2.0
6.0
11.0
B
3.5
2.1
2.6
7.6
Mo
2.4
0.9
8.8
5.6
As
0.01
0.09
0.16
0.03
concentration
0
0
0
0
Se
.02
.02
.10
.15
S203
0
0
260
210
2
5
6
, mg/L
S04
990
,970
,340
,530
Ca
16
250
180
920
TDS
2,370
4,700
8,250
10,300
I
1
I
1
1
Source: EPA-600/8-83-004, 1983
TABLE 3.5-11.
CONCENTRATION RANGE OF MACRO IONS FOUND
IN THE FIRST FRACTION OF LEACHATES FROM
OCCIDENTAL MIS RETORTED SHALE
Core/samples
Quantity of shale in column (g)
Column volume collected (v/v )
PH °
Conductivity (pmhos/cm)
Organic C (ng/mL)
Inorganic C (as c03)(Mg/mL)
Boron (pg/mL)
Calcium (pg/mL)
Magnesium (pg/mL
Potassium (jjg/mL)
Sodium ((jjg/mL)
Lithium (pg/mL)
Strontium (pg/mL)
Silicon (pg/mL)
Zinc (jjg/mL)
. 4.0
0.28
7.75
1300
152
30
1.9
11
0.5
70
370
0.2
0.7
5.4
<0.01
- 7.7
- 1.11
- 10.6
- 15,000
- 2455
- 280
- 46
- 513
- 265
- 3360
- 14,400
- 87
- 10.8
- 122
- 0.48
Source: DOE/EV-0078, May 1980
148
I
1
I
1
I
I
I
I
1
I
1
I
image:
TABLE 3.5-10.
CONCENTRATIONS OF DISSOLVED SPECIES
IN THE LEACHATE FROM OCCIDENTAL MIS
PROCESSED SHALE
Ore
sample
number
1
2
3
4
Constituent
F
1.2
2.0
6.0
11.0
B
3.5
2.1
2.6
7.6
Mo
2.4
0.9
8.8
5.6
As
0.01
0.09
0.16
0.03
concentration
0
0
0
0
Se
.02
.02
.10
.15
S203
0
0
260
210
2
5
6
, mg/L
S04
990
,970
,340
,530
Ca
16
250
180
920
TDS
2,370
4,700
8,250
10,300
I
1
I
1
1
Source: EPA-600/8-83-004, 1983
TABLE 3.5-11.
CONCENTRATION RANGE OF MACRO IONS FOUND
IN THE FIRST FRACTION OF LEACHATES FROM
OCCIDENTAL MIS RETORTED SHALE
Core/samples
Quantity of shale in column (g)
Column volume collected (v/v )
PH °
Conductivity (pmhos/cm)
Organic C (ng/mL)
Inorganic C (as c03)(Mg/mL)
Boron (pg/mL)
Calcium (pg/mL)
Magnesium (pg/mL
Potassium (jjg/mL)
Sodium ((jjg/mL)
Lithium (pg/mL)
Strontium (pg/mL)
Silicon (pg/mL)
Zinc (jjg/mL)
. 4.0
0.28
7.75
1300
152
30
1.9
11
0.5
70
370
0.2
0.7
5.4
<0.01
- 7.7
- 1.11
- 10.6
- 15,000
- 2455
- 280
- 46
- 513
- 265
- 3360
- 14,400
- 87
- 10.8
- 122
- 0.48
Source: DOE/EV-0078, May 1980
148
I
1
I
1
I
I
I
I
1
I
1
I
image:
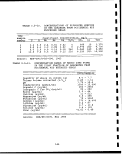 s
f^*
EH
$5
S
n
U
O
O
|j
tn
1/3 «£
EH ^
5l O
!s
O
(JL4 O
0
O CO:
FH X
M
CO S
O <j
p | r_*3
SJ o
O
0 W
rH CO
<3 EH
O OS
gg
iSi W
rH ft!
CS]
rH
IT)
CO
1
£
<u
&
<U
rH
(— 1
O
4->
CO
O
co
rH
W
O
Q
CO
13
C
I
C
i
<
C
cc
en
rH
, x
(U i.
C
o
CO
el)
PL.
X
(f
I
It
O CO
co
en co
rH !*
c
u
r- f (13
W 4->
Tf
<U
Sf
csj ro o
O CS] O •
tj . • CO
III
U Cs] Cs] rH
* Cs] O C--
3 O O rH
000
V
cs] cs] in
•J cs] o in
1 rH O VO
1 1 1
3 O O CS]
OOO
V
o
o
co cs] r-
1 • * •
1 ID O vD
) III
csi in ro
) O O •
i . o O
> O • V
V 0
rH VO
o t-~
1 1 1
rH rH
0 •
• Cs]
o
vO
•*
1 1 1
o~>
rH
CS]
o
VD O
en • ro
* CD en
O V Cs]
III
O rH VD
CS] O •
O O rH
0 0
V
VD
O
O O
CO • VD
• O VD
csi v in
1 1 1
0 0 •
0 0
V
o
ro
rH
1 1 1
o
CM
1 1 1
rH
CO
rH
1 1 1
rH
rH
CS]
CO CO rH
OOO
000
CS] rH rH
OOO
• • O
o o •
V V 0
V
rH
co r- r^
O rH rH
• o o
0 • •
v o o
i i i
OOO
OOO
V V V
C"** *^J*
0 0
0 0
1 1 1 1
tJ1 Cs]
0 0
o o
V V
1 1 1 1
in
in
Cs]
in
rH
CJ
rHW (B(Un3'OO!3O
0
<n
- rH
vD CO
till
in
0
co
r-
- rH
CM CS]
i i i
CO •
ro o
Ln
CS]
Cs]
III
CO
o
0
r-
*~J_
rH rl
^H •
CO rH
CO
O
o
o
o -
co m
CS] rH
1 1 1
0 0
ro o
ro
rH
e
u
o
e
CJ -
rH CJ 0
t~*i rvi r-r. FT
C--
O
1
O
O
V
CO
0
1
o
o
V
co
vO
1
Cs]
o
o
V
,
> c
. *T
en co
rH O
• co t— en
o m • cs]
V CO rH rH
• vo in o
o • o o
v m • •
0 0
o
in
csi r— cs]
• in en •
0 rH -CO
V CS] rH rH
1 1 1 1
O O Cs]
O O O
V
r^
ro
o
V
1 1 1 1
o
vD
ro in
ro co cs]
i i i i
o cs] m
r-~ • •
o o
•" "-H 0> C
rH C-
CSJ ^< co
o co i-
0 CS] rH
1 1 1
o co csi
0 0
o o
v
rH in
O vD CO
• • 0
O rH CO
1 1 1
O Cs]
0 0
V
CO O
t-n in o
• • o
CD CD VD
CS] «3< CO
o o co
o o'
V V
CO
1 1 1
en
d
o
o
rH
o
CO
: o to -r
VD
VD rH
o >*
0 0
1 1
rH O
o •
• o
O V
o
00 rH
O <tf
0 0*
o o
0 0
v v
m
o
o
o
1 1
in
0
o
o
o
V
, ,
1 1
H XI
^•N
T3
1
•H
4-1
§
CJ
->«•'
149
image:
s
f^*
EH
$5
S
n
U
O
O
|j
tn
1/3 «£
EH ^
5l O
!s
O
(JL4 O
0
O CO:
FH X
M
CO S
O <j
p | r_*3
SJ o
O
0 W
rH CO
<3 EH
O OS
gg
iSi W
rH ft!
CS]
rH
IT)
CO
1
£
<u
&
<U
rH
(— 1
O
4->
CO
O
co
rH
W
O
Q
CO
13
C
I
C
i
<
C
cc
en
rH
, x
(U i.
C
o
CO
el)
PL.
X
(f
I
It
O CO
co
en co
rH !*
c
u
r- f (13
W 4->
Tf
<U
Sf
csj ro o
O CS] O •
tj . • CO
III
U Cs] Cs] rH
* Cs] O C--
3 O O rH
000
V
cs] cs] in
•J cs] o in
1 rH O VO
1 1 1
3 O O CS]
OOO
V
o
o
co cs] r-
1 • * •
1 ID O vD
) III
csi in ro
) O O •
i . o O
> O • V
V 0
rH VO
o t-~
1 1 1
rH rH
0 •
• Cs]
o
vO
•*
1 1 1
o~>
rH
CS]
o
VD O
en • ro
* CD en
O V Cs]
III
O rH VD
CS] O •
O O rH
0 0
V
VD
O
O O
CO • VD
• O VD
csi v in
1 1 1
0 0 •
0 0
V
o
ro
rH
1 1 1
o
CM
1 1 1
rH
CO
rH
1 1 1
rH
rH
CS]
CO CO rH
OOO
000
CS] rH rH
OOO
• • O
o o •
V V 0
V
rH
co r- r^
O rH rH
• o o
0 • •
v o o
i i i
OOO
OOO
V V V
C"** *^J*
0 0
0 0
1 1 1 1
tJ1 Cs]
0 0
o o
V V
1 1 1 1
in
in
Cs]
in
rH
CJ
rHW (B(Un3'OO!3O
0
<n
- rH
vD CO
till
in
0
co
r-
- rH
CM CS]
i i i
CO •
ro o
Ln
CS]
Cs]
III
CO
o
0
r-
*~J_
rH rl
^H •
CO rH
CO
O
o
o
o -
co m
CS] rH
1 1 1
0 0
ro o
ro
rH
e
u
o
e
CJ -
rH CJ 0
t~*i rvi r-r. FT
C--
O
1
O
O
V
CO
0
1
o
o
V
co
vO
1
Cs]
o
o
V
,
> c
. *T
en co
rH O
• co t— en
o m • cs]
V CO rH rH
• vo in o
o • o o
v m • •
0 0
o
in
csi r— cs]
• in en •
0 rH -CO
V CS] rH rH
1 1 1 1
O O Cs]
O O O
V
r^
ro
o
V
1 1 1 1
o
vD
ro in
ro co cs]
i i i i
o cs] m
r-~ • •
o o
•" "-H 0> C
rH C-
CSJ ^< co
o co i-
0 CS] rH
1 1 1
o co csi
0 0
o o
v
rH in
O vD CO
• • 0
O rH CO
1 1 1
O Cs]
0 0
V
CO O
t-n in o
• • o
CD CD VD
CS] «3< CO
o o co
o o'
V V
CO
1 1 1
en
d
o
o
rH
o
CO
: o to -r
VD
VD rH
o >*
0 0
1 1
rH O
o •
• o
O V
o
00 rH
O <tf
0 0*
o o
0 0
v v
m
o
o
o
1 1
in
0
o
o
o
V
, ,
1 1
H XI
^•N
T3
1
•H
4-1
§
CJ
->«•'
149
image:
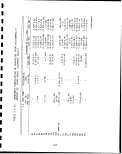 ^d
0)
£f
a
•H
4->
P*
O
O
<N
rH
I
If)
*
co
S
1
iH
CO
CT»
r-l
k.
(
r-i-[
n)
4J
g
w
0)
co
P-4
oo
u
pr)
CO
o
CM
U)
CO
CO
o
o
rH
W
oo
o
u
„
^
J-l rH
5 o m
S3 CO
co en co
rH rH IJ
rH O
0 0
[O
o
CO
en »—»
rH rH fC
-00 rt
w" T.
BO)
0 £
• CJ p.
en —
m "4* co o
F-COM cOrHincMO r-
O • rH VD • O CO f- •
. OO • • O • • • rH rH
O^O inVOOrHOr-H1
1 1 1 1 1 1 1 1 1 1 1 • 1
O • O CM O O O rH V 00
O rH • O • O O O •
0 . 0 • • • CO
O V O V O O O
V V V
O ^D ^J1 O
rH CM c^ CM rr* co en CD oo ^•£)
f-> i (ir) c*^ • co en en • •
• iO • • O • • • O rH
1 1 1 1 1 1 1 1 1 1 1 1 1
CM^O o^cooominco
C3 * yD CO ^O C3 *^* O"^ * r*"
omo oooooo •
o o o o o o o
v v v v v
oo
o M
o in co «3* t~-
. O iO r-t •
o • • • o
V 0 CM 0 rH
1 1 1 1 1 1 1 1 1 1 1 1 1
CM T-H O CO 00
O O rH O •
o o • o co
. . O •
o o v o
v v v
o
in oo
O rH in O
CM o o en
i i i i i i i i i i i i i
O CM O CO
o en
o
CO CO ^D
CM • ^* •
CM O • O
i-H t-H O r-H
1 1 1 1 1 1 1 1 1 1 1 1 1
<H r~ rH in
0 C-
m o • •
o o
V
"
CO
O ^*
e^43CO-H(3OSHrH-iH C K
£^
W J W
co g \~t
^ 2-^. 3
co Cn o ii
»ifi! CD 43
03 O CM
43 rH -CO
IO 1 O •*
43
W iJ W
, <y s %
I* S ~~~~ 3
CO &> O II
(C 0 CM
43 rH -00
rf\ | f™^ ^41
w j w
CO g ^
ij g ^~~ P i i
CO O> O
*•>« Q r-*
0} O CM
43 rH -CO
CO 1 O *}<
CO
C
g rH
U O
w m
CO 1 Ol rH O rH
3 O "O W
r-H o m (0
O t-H rH • rH
U 1 OO rH Ou
W
^1^1
U 3 rH
43 rH •
W W in O rH
CO 1 S-i rH U
i £ o X! w
3 O 43 W 00
I-H o r~ nj CM
O rH <* • i-H •
U 1 CM O tJiO
o
•H
1 |
* C
lj S-i O
CO -H
4J rrj .p
CO -H O,
>i g 3 -H
'O ns o* co >-i w
3 -H -H g U CO
J-) 13 i-H -H W g
CO O T3 rH
MH r-H 4J P O
O CJ 1 U S3 >
-H T3 (0 S
CO 4.) -rH 4-> 3 CO
CL in i — 1 S3 rH i-i
>H (0 O O O O
EH Pn W U U CM
CO
en
rH
>i
i-H
j3
r^
*•
*^
O
ttl
tt
OJ
u
^4
a
o
tn
150
1
I
1
1
1
1
1
1
I
1
I
I
I
I
I
I
1
I
I
image:
^d
0)
£f
a
•H
4->
P*
O
O
<N
rH
I
If)
*
co
S
1
iH
CO
CT»
r-l
k.
(
r-i-[
n)
4J
g
w
0)
co
P-4
oo
u
pr)
CO
o
CM
U)
CO
CO
o
o
rH
W
oo
o
u
„
^
J-l rH
5 o m
S3 CO
co en co
rH rH IJ
rH O
0 0
[O
o
CO
en »—»
rH rH fC
-00 rt
w" T.
BO)
0 £
• CJ p.
en —
m "4* co o
F-COM cOrHincMO r-
O • rH VD • O CO f- •
. OO • • O • • • rH rH
O^O inVOOrHOr-H1
1 1 1 1 1 1 1 1 1 1 1 • 1
O • O CM O O O rH V 00
O rH • O • O O O •
0 . 0 • • • CO
O V O V O O O
V V V
O ^D ^J1 O
rH CM c^ CM rr* co en CD oo ^•£)
f-> i (ir) c*^ • co en en • •
• iO • • O • • • O rH
1 1 1 1 1 1 1 1 1 1 1 1 1
CM^O o^cooominco
C3 * yD CO ^O C3 *^* O"^ * r*"
omo oooooo •
o o o o o o o
v v v v v
oo
o M
o in co «3* t~-
. O iO r-t •
o • • • o
V 0 CM 0 rH
1 1 1 1 1 1 1 1 1 1 1 1 1
CM T-H O CO 00
O O rH O •
o o • o co
. . O •
o o v o
v v v
o
in oo
O rH in O
CM o o en
i i i i i i i i i i i i i
O CM O CO
o en
o
CO CO ^D
CM • ^* •
CM O • O
i-H t-H O r-H
1 1 1 1 1 1 1 1 1 1 1 1 1
<H r~ rH in
0 C-
m o • •
o o
V
"
CO
O ^*
e^43CO-H(3OSHrH-iH C K
£^
W J W
co g \~t
^ 2-^. 3
co Cn o ii
»ifi! CD 43
03 O CM
43 rH -CO
IO 1 O •*
43
W iJ W
, <y s %
I* S ~~~~ 3
CO &> O II
(C 0 CM
43 rH -00
rf\ | f™^ ^41
w j w
CO g ^
ij g ^~~ P i i
CO O> O
*•>« Q r-*
0} O CM
43 rH -CO
CO 1 O *}<
CO
C
g rH
U O
w m
CO 1 Ol rH O rH
3 O "O W
r-H o m (0
O t-H rH • rH
U 1 OO rH Ou
W
^1^1
U 3 rH
43 rH •
W W in O rH
CO 1 S-i rH U
i £ o X! w
3 O 43 W 00
I-H o r~ nj CM
O rH <* • i-H •
U 1 CM O tJiO
o
•H
1 |
* C
lj S-i O
CO -H
4J rrj .p
CO -H O,
>i g 3 -H
'O ns o* co >-i w
3 -H -H g U CO
J-) 13 i-H -H W g
CO O T3 rH
MH r-H 4J P O
O CJ 1 U S3 >
-H T3 (0 S
CO 4.) -rH 4-> 3 CO
CL in i — 1 S3 rH i-i
>H (0 O O O O
EH Pn W U U CM
CO
en
rH
>i
i-H
j3
r^
*•
*^
O
ttl
tt
OJ
u
^4
a
o
tn
150
1
I
1
1
1
1
1
1
I
1
I
I
I
I
I
I
1
I
I
image:
 3.6 T3 OIL SHALE RETORTING |
3.6.. 1 Retorting Operating !
The process (NTU/T3) incorporates the salient features of the NTU
batch retorting process developed in the U.S. in the 1920«s and
improved by the Bureau of Mines and Department of Energy through
extensive experiments with 10-ton and 150-ton batch retorts FBLM
February 1983]. , L' '
The name T3 was derived from the three major Moroccan oil shale
deposits at Timahdit, Tarfaya, and Tangiers [Bouch'ta et al.,
1981J. The process includes significant improvements based on
recent technology development including the vertical modified
in-situ oil shale process. '
The T3 process basically consists of two retorts; retorting and
cooling sections as shown in Figure 3.6-1. The air;enters into
the Bottom of the retort charged with hot spent shale, The water
is injected into the air stream by fog nozzles or atomizers. The
air mixed with water passes through holes in the retort bottom
discharge cones. The water in the air is 'evaporated when it
contacts the hot spent shale. The bottom layer of :spent shale
is cooled and most of the sensible heat contained in the spent
shale is recovered in the form of steam. The mixture of air and
steam flows through the hot spent shale bed. Since the residual
carbon produced from kerogen thermal decomposition is not com-
pletely consumed during retorting, the additional heatienergy will
be recovered by burning the residual carbon in the spent shale.
The cooled spent shale near the retort bottom is discharged and
an equal volume of raw shale is loaded at the top of i the retort
The process is repeated until the retort is recharged with the
raw shale. The mixture of air and steam will heat the raw shale
entering into the retort from the top. The water in the raw shale
is also evaporated to produce additional steam. The; mixture of
air and steam exiting the retort being operated in Ithe cooling
mode, is introduced into the retort being operated in the retort-
ing mode. The supplemental steam from the topping; turbine is
mixed with the steam from the retort in the cooling mode if
necessary, to obtain the required steam concentration of the inlet
gas into the retort in retorting mode. However, the supplemental
steam is not expected to be required.
The product gas leaving the retort in the retorting mode passes
tnrough knock-out pots and a gas cooler located before the blower.
Because of high water concentration in the product gas, the blower
is located after the gas cooler to reduce the actual volume of
off-gass to be handled by the blower. The liquid and gas products
are collected and separated in a space below the retort bottom.
The liquid products flow into the oil and water separator during
retorting. The water is subsequently used during the cooling
151
image:
3.6 T3 OIL SHALE RETORTING |
3.6.. 1 Retorting Operating !
The process (NTU/T3) incorporates the salient features of the NTU
batch retorting process developed in the U.S. in the 1920«s and
improved by the Bureau of Mines and Department of Energy through
extensive experiments with 10-ton and 150-ton batch retorts FBLM
February 1983]. , L' '
The name T3 was derived from the three major Moroccan oil shale
deposits at Timahdit, Tarfaya, and Tangiers [Bouch'ta et al.,
1981J. The process includes significant improvements based on
recent technology development including the vertical modified
in-situ oil shale process. '
The T3 process basically consists of two retorts; retorting and
cooling sections as shown in Figure 3.6-1. The air;enters into
the Bottom of the retort charged with hot spent shale, The water
is injected into the air stream by fog nozzles or atomizers. The
air mixed with water passes through holes in the retort bottom
discharge cones. The water in the air is 'evaporated when it
contacts the hot spent shale. The bottom layer of :spent shale
is cooled and most of the sensible heat contained in the spent
shale is recovered in the form of steam. The mixture of air and
steam flows through the hot spent shale bed. Since the residual
carbon produced from kerogen thermal decomposition is not com-
pletely consumed during retorting, the additional heatienergy will
be recovered by burning the residual carbon in the spent shale.
The cooled spent shale near the retort bottom is discharged and
an equal volume of raw shale is loaded at the top of i the retort
The process is repeated until the retort is recharged with the
raw shale. The mixture of air and steam will heat the raw shale
entering into the retort from the top. The water in the raw shale
is also evaporated to produce additional steam. The; mixture of
air and steam exiting the retort being operated in Ithe cooling
mode, is introduced into the retort being operated in the retort-
ing mode. The supplemental steam from the topping; turbine is
mixed with the steam from the retort in the cooling mode if
necessary, to obtain the required steam concentration of the inlet
gas into the retort in retorting mode. However, the supplemental
steam is not expected to be required.
The product gas leaving the retort in the retorting mode passes
tnrough knock-out pots and a gas cooler located before the blower.
Because of high water concentration in the product gas, the blower
is located after the gas cooler to reduce the actual volume of
off-gass to be handled by the blower. The liquid and gas products
are collected and separated in a space below the retort bottom.
The liquid products flow into the oil and water separator during
retorting. The water is subsequently used during the cooling
151
image:
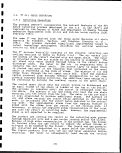 W
W
(U
u
o
M
oo
O >i
-P M
PS |3
V-l
H
En
CO
a; a)
M u
1
I
1
I
1
I
I
I
1
152
I
I
I
I
I
I
I
1
I
image:
W
W
(U
u
o
M
oo
O >i
-P M
PS |3
V-l
H
En
CO
a; a)
M u
1
I
1
I
1
I
I
I
1
152
I
I
I
I
I
I
I
1
I
image:
 of spent shale. The liquid products are separated in the
collector into the oil and water phases. The oil is pumped into
the heater treater to remove the water. The purging line is
provided to remove the combustible gases from the space below' the
%£?* • ? Hu When th\ ret°rting is complete. The isteam intro-
~S5 ° -^ ueto2? bottom wil1 also generate the hydrogen and
carbon monoxide by the reaction of steam with the residual carbon
in the spent shale. This gas may be used as a start-up fuel.
f
Since the major mechanism for transferring the heat! energy from
hot spent shale to the gas stream is the evaporation of water
?^™J:S^n air(. ^ ^s necess*ry to carry the water droplets
through the spent shale bed. The spent shale absorbs the water,
Slnw ?nno-30% nS,f ^ Spe^ ?hale Wei9ht, ^ the temperature is
below 200°F. Therefore, it is necessary to discharge the spent
shale incrementally from the retort bottom to avoid the water ab-
Sh?™101% Y the- Sfe.nt S^ale' In addition, the incremental dis-
?^5 2S ? spent shale will also allow the incremental loading of
K^h ?i!Uf £hS retort- Because of a large retort height, the
batch loading of raw shale may cause a serious damage to the re-
tort wall and may also cause degradation of shale particles. In
order to obtain radially even movement of shale, it may be neces-
sary to use multiple vibrating retort bottoms such as bin acti-
vators. The charging and discharging cycle is dependent mainly on
the air velocity and water injection rate. i
In the T3 process the spent shale is cooled before discharge and
the significant amount of sensible heat contained in the spent
shale is recovered in the form of steam. A mixture! of air and
steam instead of air and recycle gas mixture is used for retorting
?ii01?a.le ln lhe T3 process. In addition to controlling maximuS
retort temperature, the use of steam has the following!advantages:
1. The steam increases the combustion rate of residual carbon
in spent shale through the water gas shift reactions.
i
2. The steam increases the hydrogen production per ton to oil
shale by reacting with the carbon monoxide. The steam
increases the reaction rate of residual carbon Jwith carbon
dioxide by increasing the porosity of spent shale.! The
residual carbon in the spent shale reacts with; the carbon
dioxide to produce carbon monoxide which reacts with the
steam to produce hydrogen.
3. The steam reduces the oil loss due to thermal cracking in
the retorting zone by increasing C02 production rate in the
combustion zone. The steam minimizes the oil loss when it
is released from the raw shale surface. '
4. The steam increases the retorting rate compared with the
recycle gas. .' , '
153
image:
of spent shale. The liquid products are separated in the
collector into the oil and water phases. The oil is pumped into
the heater treater to remove the water. The purging line is
provided to remove the combustible gases from the space below' the
%£?* • ? Hu When th\ ret°rting is complete. The isteam intro-
~S5 ° -^ ueto2? bottom wil1 also generate the hydrogen and
carbon monoxide by the reaction of steam with the residual carbon
in the spent shale. This gas may be used as a start-up fuel.
f
Since the major mechanism for transferring the heat! energy from
hot spent shale to the gas stream is the evaporation of water
?^™J:S^n air(. ^ ^s necess*ry to carry the water droplets
through the spent shale bed. The spent shale absorbs the water,
Slnw ?nno-30% nS,f ^ Spe^ ?hale Wei9ht, ^ the temperature is
below 200°F. Therefore, it is necessary to discharge the spent
shale incrementally from the retort bottom to avoid the water ab-
Sh?™101% Y the- Sfe.nt S^ale' In addition, the incremental dis-
?^5 2S ? spent shale will also allow the incremental loading of
K^h ?i!Uf £hS retort- Because of a large retort height, the
batch loading of raw shale may cause a serious damage to the re-
tort wall and may also cause degradation of shale particles. In
order to obtain radially even movement of shale, it may be neces-
sary to use multiple vibrating retort bottoms such as bin acti-
vators. The charging and discharging cycle is dependent mainly on
the air velocity and water injection rate. i
In the T3 process the spent shale is cooled before discharge and
the significant amount of sensible heat contained in the spent
shale is recovered in the form of steam. A mixture! of air and
steam instead of air and recycle gas mixture is used for retorting
?ii01?a.le ln lhe T3 process. In addition to controlling maximuS
retort temperature, the use of steam has the following!advantages:
1. The steam increases the combustion rate of residual carbon
in spent shale through the water gas shift reactions.
i
2. The steam increases the hydrogen production per ton to oil
shale by reacting with the carbon monoxide. The steam
increases the reaction rate of residual carbon Jwith carbon
dioxide by increasing the porosity of spent shale.! The
residual carbon in the spent shale reacts with; the carbon
dioxide to produce carbon monoxide which reacts with the
steam to produce hydrogen.
3. The steam reduces the oil loss due to thermal cracking in
the retorting zone by increasing C02 production rate in the
combustion zone. The steam minimizes the oil loss when it
is released from the raw shale surface. '
4. The steam increases the retorting rate compared with the
recycle gas. .' , '
153
image:
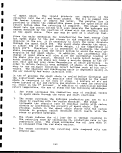 I
3.6.2 Solid Wastes
According to the Magic Circle proposed alternative process for •
their operation in Utah for 35,000 bbl/day plant, about 49,000 H
tons per stream day of spent shale would require disposal. It
would be carried to the disposal area from the processing plant
on a covered belt conveyor. Because of the continuous flow of
spent shale from the processing plant, the conveyor and associated
equipment are scheduled to operate continuously. There is no
other information available for solid waste streams composition. II
3.6.3 Characteristics of Solid Wastes
the Magic Circle proposal utilizing T? technology.
I
154
1
I
I
I
I
I
I
1
I
1
I
image:
I
3.6.2 Solid Wastes
According to the Magic Circle proposed alternative process for •
their operation in Utah for 35,000 bbl/day plant, about 49,000 H
tons per stream day of spent shale would require disposal. It
would be carried to the disposal area from the processing plant
on a covered belt conveyor. Because of the continuous flow of
spent shale from the processing plant, the conveyor and associated
equipment are scheduled to operate continuously. There is no
other information available for solid waste streams composition. II
3.6.3 Characteristics of Solid Wastes
the Magic Circle proposal utilizing T? technology.
I
154
1
I
I
I
I
I
I
1
I
1
I
image:
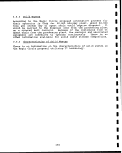 3.7 HYTORT OIL SHALE RETORTING j
3.7,. 1 Retorting Operation :
Controlled heating of oil shale in hydrogen at elevated pressures
can be used to produce synthetic natural gas (SNG) of a synthetic
crude oil [DRI, SAI & KSC; 68-03-2795]. The relative amSunts of
rne£:e products can be varied by proper selection of tlhe operating
r^M x0nS* P11. shale research at the Institute of Gas Technology
UL.I; Degan in the 1950s, sponsored by the American Gas Associa-
S°?i,Snd i by the fas Research Institute, and this: program led
to the development of the HYTORT process. It has been tested in a
Sf??JSS devlelopmei\t unit (p.DU> whicn is a one-tonne per hour adia-
batic reactor and is claimed to increase shale organic carbon
conversions relative to other processes. ' t-arcon
I
The design of the PDU is shown in Figure 3.7-1. oil shale
S™ed t0 °'5 ln<rhes. average size, with the fines rempved, is fed
through screw mechanisms to two adiabatic reactors, the first for
rSssu^eS u"sedghnatl°n and the second fo? shale gasifibation. The
from 1200 - 1475°F. For Colorado shales the oil-to-gas ratio^in
peJatur cha^ from 4:1 to about 0.5:1 as the average tern-
shale and tSeS?I?e of^emperaLre" rise°aisoTinfluencfthf ratiS of
proaucts. HYTORT shale oils from both eastern and western shales
nave relatively low viscosities and pour points. They can be
5S?!d ""irough pipelines in the raw state, in contrast to most
^*KS%»£™^^^2^ processes. HYTORT shale oil
C°lor md «» 30 prcent
les sultaha! f prcent
less sulfur than oils from conventional retorting, because of the
treatment. However, like* all shale oils
The conceptual design of a zoned reactor for the HYTORT process i<?
shown in Figure 3.7-2. Crushed shale (fines removed) iSPf2d?o the
high pressure reactor through liquid sealed lockhoppers. The shale
moves downward countercurrent to the hydrogen-rich gas flow through
neL ??f SfAi- A Jmali a^n? °f °Xygen is in3ected intp the reactor
near its center for heat balance purposes. Processed shale is re-
moved from the reactor through liquid sealed lockhoppers. Product
gas is scrubbed to recover water and shale oil. A bleed stream of
™L ^ ga! ^ !ent to the steam reformer where hydrocarbons are
converted into hydrogen. All the make up hydrogen requirements of
hydroretorting and catalytic hydrotreating are to be produced in
this fashion and it is expected that no hydrogen will i need to be
purchased !n some trials by the HYTORT precise, 2,5(>0t2 4? 000
?Sf °5 ^^en is chemically consumed per ton of Devonian shale.
The shale oil is catalytically hydrotreated to produce a low sulfur
low nitrogen refinery feedstock product and a plant utility fuel
s "c.trs 9,111 *
155
image:
3.7 HYTORT OIL SHALE RETORTING j
3.7,. 1 Retorting Operation :
Controlled heating of oil shale in hydrogen at elevated pressures
can be used to produce synthetic natural gas (SNG) of a synthetic
crude oil [DRI, SAI & KSC; 68-03-2795]. The relative amSunts of
rne£:e products can be varied by proper selection of tlhe operating
r^M x0nS* P11. shale research at the Institute of Gas Technology
UL.I; Degan in the 1950s, sponsored by the American Gas Associa-
S°?i,Snd i by the fas Research Institute, and this: program led
to the development of the HYTORT process. It has been tested in a
Sf??JSS devlelopmei\t unit (p.DU> whicn is a one-tonne per hour adia-
batic reactor and is claimed to increase shale organic carbon
conversions relative to other processes. ' t-arcon
I
The design of the PDU is shown in Figure 3.7-1. oil shale
S™ed t0 °'5 ln<rhes. average size, with the fines rempved, is fed
through screw mechanisms to two adiabatic reactors, the first for
rSssu^eS u"sedghnatl°n and the second fo? shale gasifibation. The
from 1200 - 1475°F. For Colorado shales the oil-to-gas ratio^in
peJatur cha^ from 4:1 to about 0.5:1 as the average tern-
shale and tSeS?I?e of^emperaLre" rise°aisoTinfluencfthf ratiS of
proaucts. HYTORT shale oils from both eastern and western shales
nave relatively low viscosities and pour points. They can be
5S?!d ""irough pipelines in the raw state, in contrast to most
^*KS%»£™^^^2^ processes. HYTORT shale oil
C°lor md «» 30 prcent
les sultaha! f prcent
less sulfur than oils from conventional retorting, because of the
treatment. However, like* all shale oils
The conceptual design of a zoned reactor for the HYTORT process i<?
shown in Figure 3.7-2. Crushed shale (fines removed) iSPf2d?o the
high pressure reactor through liquid sealed lockhoppers. The shale
moves downward countercurrent to the hydrogen-rich gas flow through
neL ??f SfAi- A Jmali a^n? °f °Xygen is in3ected intp the reactor
near its center for heat balance purposes. Processed shale is re-
moved from the reactor through liquid sealed lockhoppers. Product
gas is scrubbed to recover water and shale oil. A bleed stream of
™L ^ ga! ^ !ent to the steam reformer where hydrocarbons are
converted into hydrogen. All the make up hydrogen requirements of
hydroretorting and catalytic hydrotreating are to be produced in
this fashion and it is expected that no hydrogen will i need to be
purchased !n some trials by the HYTORT precise, 2,5(>0t2 4? 000
?Sf °5 ^^en is chemically consumed per ton of Devonian shale.
The shale oil is catalytically hydrotreated to produce a low sulfur
low nitrogen refinery feedstock product and a plant utility fuel
s "c.trs 9,111 *
155
image:
 K< ^ ^^^s^^S=:
vr\!7%////////WJ~^ 4
m a« 6 ' !
4J
•H
g
I
iH
D
Cfl
Cfl
0)
U
o
Pi LO
O C71
-H r-
-P CM
rt i
u ro
•H O
<W I
•H 00
U 10
rcl
o •-
CJ
0) W
en
-H CO
O
O «
1-1 O
4-f
O ••
(U
&> O
fO CO
-H
Q
CO
0)
M
&
•H
I
1
1
1
I
I
156
1
I
I
I
I
I
I
I
1
I
I
I
image:
K< ^ ^^^s^^S=:
vr\!7%////////WJ~^ 4
m a« 6 ' !
4J
•H
g
I
iH
D
Cfl
Cfl
0)
U
o
Pi LO
O C71
-H r-
-P CM
rt i
u ro
•H O
<W I
•H 00
U 10
rcl
o •-
CJ
0) W
en
-H CO
O
O «
1-1 O
4-f
O ••
(U
&> O
fO CO
-H
Q
CO
0)
M
&
•H
I
1
1
1
I
I
156
1
I
I
I
I
I
I
I
1
I
I
I
image:
 3.7.2 Solid Wastes !
i
There is no information on the subject of solid wastes or waste
streams of the HYTORT process. l
3 - 7., 3 Characteristics of Solid Wastes '
Leaching characteristics and hydraulic properties of retorted oil
shales have been investigated by McWhorter [EPA-600/D-84-228 19841
The data are presented in Tables 3.7-1'to 3.7-3.
157
image:
3.7.2 Solid Wastes !
i
There is no information on the subject of solid wastes or waste
streams of the HYTORT process. l
3 - 7., 3 Characteristics of Solid Wastes '
Leaching characteristics and hydraulic properties of retorted oil
shales have been investigated by McWhorter [EPA-600/D-84-228 19841
The data are presented in Tables 3.7-1'to 3.7-3.
157
image:
 RUN-OF-MINE
RAW SHALE
-I * r ",,
W Li
jssf
wf
f5^i6®^ :•-
F«.?'e?»X il
baSy y £
>/ "S^T
r?<":*
^
0
Qj .fe?
ACTIVE-'1"'"/
DISTRIBUTORS £K-
\ X".~"
i U- ~~\
\s»
HYTORT
REACTOR
Figure 3.
ro,HALE F1NE5TODI5PQ-A1 RAW SHALE OIL
CRUSHING ' IIILJ iu uiinJoAL
1 SULI-UH ANDNH,
f BYPRODUCTS
T |
QUID-SEALED :^~" SCRUBBING
OCKHOPPERS • »-•?•" ». AND «. GAS
I — 1 ^IP PHASE SCRUBBING
1 DP^a trpAD^Tinki — ._ _
! / \ 4^^\ P^ RETORT PRODUCT
' -*' ^^M^f GAS AND 01L
_L' f N^^;:
! rn •*'• v ^^&2)
"'\ / /$\l \^
**•** * * ^**\ i *n V^ ^S
'•'/?' '"'"" '•'-'•t ;'/':-*4:"i?'
• . .'•;?.
•..N u- :...-..•..-/:..>; ;s:. /•> '" " ,
Qz AIR
L T.™-r-T—~.— SEPARATION ~
;'-.\k>; ' ~
'•'•'•••'•'--" -'••.. -M^VJITT RECYCLE HZ- RICH GAS r HZ
/ — UA?PIID MANUFACTURE
I'.^Kf"-!1.-;/-.:' r,y m«nc.ur (Cfeom Reformer
IS ^7 xjgi J " r~
VJ^v^f yi^fi's- HYDROTREATING
\$W s&&r)&l PLANT FUEL-*- AND
^^gr/&f£&, ; OIL UPGRADING
•r.'-£i£«g> [.'•*•'• l>^*v?J
t&HJr Rv|^> PRODUCT
£^F %^^ SYNCRUDE
1
1
1
1
1
1
1
1
1
1
1
I
w/ \>vi'if " II
/\s Psiiii "
^c.^^,^Wv^^». . |
. _. ^ - - - .,
Source: DRI, SAI & KSC; 68-03-2795
1
1
158 |
image:
RUN-OF-MINE
RAW SHALE
-I * r ",,
W Li
jssf
wf
f5^i6®^ :•-
F«.?'e?»X il
baSy y £
>/ "S^T
r?<":*
^
0
Qj .fe?
ACTIVE-'1"'"/
DISTRIBUTORS £K-
\ X".~"
i U- ~~\
\s»
HYTORT
REACTOR
Figure 3.
ro,HALE F1NE5TODI5PQ-A1 RAW SHALE OIL
CRUSHING ' IIILJ iu uiinJoAL
1 SULI-UH ANDNH,
f BYPRODUCTS
T |
QUID-SEALED :^~" SCRUBBING
OCKHOPPERS • »-•?•" ». AND «. GAS
I — 1 ^IP PHASE SCRUBBING
1 DP^a trpAD^Tinki — ._ _
! / \ 4^^\ P^ RETORT PRODUCT
' -*' ^^M^f GAS AND 01L
_L' f N^^;:
! rn •*'• v ^^&2)
"'\ / /$\l \^
**•** * * ^**\ i *n V^ ^S
'•'/?' '"'"" '•'-'•t ;'/':-*4:"i?'
• . .'•;?.
•..N u- :...-..•..-/:..>; ;s:. /•> '" " ,
Qz AIR
L T.™-r-T—~.— SEPARATION ~
;'-.\k>; ' ~
'•'•'•••'•'--" -'••.. -M^VJITT RECYCLE HZ- RICH GAS r HZ
/ — UA?PIID MANUFACTURE
I'.^Kf"-!1.-;/-.:' r,y m«nc.ur (Cfeom Reformer
IS ^7 xjgi J " r~
VJ^v^f yi^fi's- HYDROTREATING
\$W s&&r)&l PLANT FUEL-*- AND
^^gr/&f£&, ; OIL UPGRADING
•r.'-£i£«g> [.'•*•'• l>^*v?J
t&HJr Rv|^> PRODUCT
£^F %^^ SYNCRUDE
1
1
1
1
1
1
1
1
1
1
1
I
w/ \>vi'if " II
/\s Psiiii "
^c.^^,^Wv^^». . |
. _. ^ - - - .,
Source: DRI, SAI & KSC; 68-03-2795
1
1
158 |
image:
 TABLE 3.7-1. WATER HOLDING CAPACITY OF HYTORT PROCESSED
SHALES AT VARIOUS PRESSURES AND BULK DENSITIES51
Sample
Packed to a
BD=1.30 g/cc
BD=1.45 g/cc
BD=1 . 60 g/cc
14.7 psi
(1 bar)
35.2
31.0
30.5
44.1 psi
(3 bar)
33.7
27.6
30.3
Pressure
73.5 psi
(5 bar)
32.6
25.3
28.9
P
147 psi ;
(10 bar) >
L
31.8
23.8 '.
25.4
200 psi
(13.6 bar)
31.0
23.2
24.6
BD = Bulk density
Table entries are moisture contents (w) expressed on a weight 7
basis (weight of water per unit weight of dry solids):. °
Source: EPA-600/D-84-228, 1984 \
159
image:
TABLE 3.7-1. WATER HOLDING CAPACITY OF HYTORT PROCESSED
SHALES AT VARIOUS PRESSURES AND BULK DENSITIES51
Sample
Packed to a
BD=1.30 g/cc
BD=1.45 g/cc
BD=1 . 60 g/cc
14.7 psi
(1 bar)
35.2
31.0
30.5
44.1 psi
(3 bar)
33.7
27.6
30.3
Pressure
73.5 psi
(5 bar)
32.6
25.3
28.9
P
147 psi ;
(10 bar) >
L
31.8
23.8 '.
25.4
200 psi
(13.6 bar)
31.0
23.2
24.6
BD = Bulk density
Table entries are moisture contents (w) expressed on a weight 7
basis (weight of water per unit weight of dry solids):. °
Source: EPA-600/D-84-228, 1984 \
159
image:
 TABLE 3.7-2
CONCENTRATIONS IN ASTM WATER SHAKE AND
RCRA TESTS EXTRACTS - HYTORT SPENT SHALES
Parameter
pH
EC
ALK
H2CO3
HC03
C03
TDS
F
Cl
P04
N03
S04
Zn
Fe
Co
Li
V
NH3
B
Cd
Be
Mg
P
Si
Mo
Mn
Ni
Na
Cu
Al
Ca
Ba
K
Cr
Sr
Pb
Ag
TL
Se
As
Hg
Units
— ,
|jmhos/cm @ 25°
mg/L
mg/L
mg/L
mg/L
mg/L
mg/L
mg/L
mg/L
mg/L
mg/L
mg/L
mg/L
mg/L
mg/L
mg/L
mg/L
mg/L
mg/L
mg/L
mg/L
mg/L
mg/L
mg/L
mg/L
mg/L
mg/L
mg/L
mg/L
mg/L
mg/L
mg/L
mg/L
mg/L
mg/L
mg/L
mg/L
mg/L
mg/L
mg/L
ASTM
9.76
1160
205
0.08
166
41.1
1060
3.4
12.4
0.59
5.2
178
0.212
0.033
<0.005
0.005
<0.002
16.4
1.110
<0.001
<0.0005
0.23
0.33
21
1.92
0.015
<0.005
26
0.013
0.86
250
0.120
60
0.030
0.85
<0.01
<0.001
<0.005
<0.020
0.037
<0.001
RCRA
4.94
1540
430
13278
525
0.002
1740
8.95
<0.1
2.3
97
0.477
0.078
0.120
0.019
<0.002
1.66
0.340
0.013
<0.0005
85
0.4
3.7
<0.05
8.98
0.971
11
0.023
0.44
319
0.210
22
<0.005
1.0
<0.01
0.003
<0.005
<0.02
0.010
<0.001
Source: EPA-600/D-84-228, 1984
I
I
i
i
160
I
1
1
I
1
1
1
I
I
I
1
I
I
image:
TABLE 3.7-2
CONCENTRATIONS IN ASTM WATER SHAKE AND
RCRA TESTS EXTRACTS - HYTORT SPENT SHALES
Parameter
pH
EC
ALK
H2CO3
HC03
C03
TDS
F
Cl
P04
N03
S04
Zn
Fe
Co
Li
V
NH3
B
Cd
Be
Mg
P
Si
Mo
Mn
Ni
Na
Cu
Al
Ca
Ba
K
Cr
Sr
Pb
Ag
TL
Se
As
Hg
Units
— ,
|jmhos/cm @ 25°
mg/L
mg/L
mg/L
mg/L
mg/L
mg/L
mg/L
mg/L
mg/L
mg/L
mg/L
mg/L
mg/L
mg/L
mg/L
mg/L
mg/L
mg/L
mg/L
mg/L
mg/L
mg/L
mg/L
mg/L
mg/L
mg/L
mg/L
mg/L
mg/L
mg/L
mg/L
mg/L
mg/L
mg/L
mg/L
mg/L
mg/L
mg/L
mg/L
ASTM
9.76
1160
205
0.08
166
41.1
1060
3.4
12.4
0.59
5.2
178
0.212
0.033
<0.005
0.005
<0.002
16.4
1.110
<0.001
<0.0005
0.23
0.33
21
1.92
0.015
<0.005
26
0.013
0.86
250
0.120
60
0.030
0.85
<0.01
<0.001
<0.005
<0.020
0.037
<0.001
RCRA
4.94
1540
430
13278
525
0.002
1740
8.95
<0.1
2.3
97
0.477
0.078
0.120
0.019
<0.002
1.66
0.340
0.013
<0.0005
85
0.4
3.7
<0.05
8.98
0.971
11
0.023
0.44
319
0.210
22
<0.005
1.0
<0.01
0.003
<0.005
<0.02
0.010
<0.001
Source: EPA-600/D-84-228, 1984
I
I
i
i
160
I
1
1
I
1
1
1
I
I
I
1
I
I
image:
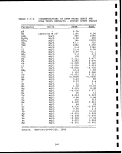 TABLE 3.7-3.
LEACHABLE MASS FROM HYTORT SHALE AS
INDICATED BY THE ASTM PROPOSED WATER
SHAKE TEST AND RCRA EXTRACTION
TEST - mg/g
Parameter
Na
Ca
Mg
S04
Cl
F
E
Mo
Al
TDS
ASTM
0.104
1.00
0.001
0.712
0.050
0.014
0.004
0.008
0.003
4.24
RCRA
0.220
6.380
1.700
1.940
0.179
— •
0.007
0.006
0.044
34.80
Source: EPA-600/D-84-228, 1984
161
image:
TABLE 3.7-3.
LEACHABLE MASS FROM HYTORT SHALE AS
INDICATED BY THE ASTM PROPOSED WATER
SHAKE TEST AND RCRA EXTRACTION
TEST - mg/g
Parameter
Na
Ca
Mg
S04
Cl
F
E
Mo
Al
TDS
ASTM
0.104
1.00
0.001
0.712
0.050
0.014
0.004
0.008
0.003
4.24
RCRA
0.220
6.380
1.700
1.940
0.179
— •
0.007
0.006
0.044
34.80
Source: EPA-600/D-84-228, 1984
161
image:
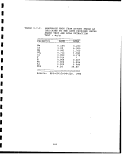 3.8 GEOKINETICS HORIZONTAL IN SITU OIL SHALE RETORTING
3.8.1 Retorting Operation
In the Geokinetics, Inc (GKI) horizontal in situ retorting process,
known as LOFRECO (low front end cost)(U.S. Patent 4037657), a
specific pattern of blast holes is drilled from the cleared surface
through any overburden and into the oil shale bed. The schematics
of the process is shown in Figure 3.8-1. Explosives are placed in
these holes and detonated by use of a carefully timed and planned
blast system. The blast yields a well-fragmented mass of shale
with high permeability, and also produces a slightly sloping
(approximately 4°) bottom surface that allows the produced oil to
drain into a sump for collection. The fragmented zone constitutes
the in situ retort. The void space in the fragmented zone comes
from lifting the overburden, produces small uplift of the surface.
Submerged-type oil well pumps are used to lift the recovered oil
to surface storage tanks.
Burning charcoal is introduced into drilled holes at the upper
end of the rubblized zone to ignite the retort. Air inlet piping
is also installed at this end of the retort. The burn front,
consisting of a vertical wall approximately 30-ft high, travels
toward the deep or low end of the retort. The objective is to
retort the shale from one end to the other in a plug-flow fashion
by maintaining a burn front that occupies the entire cross section
of the bed. Typically the front travels at a speed of one foot
per day.
3.8.2 Solid Wastes
Since this is an in situ process very little above ground solid
waste is expected to be generated. The largest volume of solid
waste is the retorted shale which is left below ground.
3.8.3 Characteristics of Solid Wastes
The chemical composition of leachates is summarized in Table 3.8-1
[Fox, 1983]. Recent data are presented in Tables 3.8-2 and 3.8-3;
and in Figure 3.8-2 [DOE/FE/60177-1590, April 1984].
1
I
1
I
1
162
I
1
I
I
1
I
1
1
1
I
I
i
I
image:
3.8 GEOKINETICS HORIZONTAL IN SITU OIL SHALE RETORTING
3.8.1 Retorting Operation
In the Geokinetics, Inc (GKI) horizontal in situ retorting process,
known as LOFRECO (low front end cost)(U.S. Patent 4037657), a
specific pattern of blast holes is drilled from the cleared surface
through any overburden and into the oil shale bed. The schematics
of the process is shown in Figure 3.8-1. Explosives are placed in
these holes and detonated by use of a carefully timed and planned
blast system. The blast yields a well-fragmented mass of shale
with high permeability, and also produces a slightly sloping
(approximately 4°) bottom surface that allows the produced oil to
drain into a sump for collection. The fragmented zone constitutes
the in situ retort. The void space in the fragmented zone comes
from lifting the overburden, produces small uplift of the surface.
Submerged-type oil well pumps are used to lift the recovered oil
to surface storage tanks.
Burning charcoal is introduced into drilled holes at the upper
end of the rubblized zone to ignite the retort. Air inlet piping
is also installed at this end of the retort. The burn front,
consisting of a vertical wall approximately 30-ft high, travels
toward the deep or low end of the retort. The objective is to
retort the shale from one end to the other in a plug-flow fashion
by maintaining a burn front that occupies the entire cross section
of the bed. Typically the front travels at a speed of one foot
per day.
3.8.2 Solid Wastes
Since this is an in situ process very little above ground solid
waste is expected to be generated. The largest volume of solid
waste is the retorted shale which is left below ground.
3.8.3 Characteristics of Solid Wastes
The chemical composition of leachates is summarized in Table 3.8-1
[Fox, 1983]. Recent data are presented in Tables 3.8-2 and 3.8-3;
and in Figure 3.8-2 [DOE/FE/60177-1590, April 1984].
1
I
1
I
1
162
I
1
I
I
1
I
1
1
1
I
I
i
I
image:
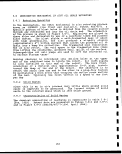 CO
<z
UJ
N3aungu3Ao
-M
H
O
4J
0)
OS
'(0
-i-:
G
O
N
•H
w
o
•H
+J
OJ
O
OJ
rH
I
CO
•
CO
CD
Cn
•H
163
image:
CO
<z
UJ
N3aungu3Ao
-M
H
O
4J
0)
OS
'(0
-i-:
G
O
N
•H
w
o
•H
+J
OJ
O
OJ
rH
I
CO
•
CO
CD
Cn
•H
163
image:
 TABLE 3.8-1.
As
B
Ca
Cl
EC, |Jmhos/cm
F
HC03
K
Mg
Mo
Na
Se
S04
pH
Type of study
Particle diameter
Solid- to-liquid ratio,
Contact time
Other
Source: Fox, July 1983
INORGANIC COMPOSITION OF LEACHATES FROM
GEOKINETICS SPENT SHALE (mg/L)
Cleave et al., Krause et al., Krause, et al.,
1979 1980 1980
0.01 - 0.2 0.03 •- 0.3
0.5 - 6.7 0.6 - 2.6
747
29
321 - 16,200 741 - 8,430
0.32 - 10.1 2.3 - 13
797
34.4
0.2
0.4 - 17.1 0.7 - 6.4
542
<0.001 - 1.3 0.006 •- 0.16
2,298 170 - 16,435 790 •- 5,595
8.8 - 11.6 9.2 - 11.6
shaker Column Ball mill/batch
-1 in. -10 mesh
g/mL 0.5 - 0.4
48 hr 1 hr 2 wk
3 x 50 cm glass
column
164
1
1
1
1
I
1
1
1
1
1
1
1
1
1
f
1
1
1
image:
TABLE 3.8-1.
As
B
Ca
Cl
EC, |Jmhos/cm
F
HC03
K
Mg
Mo
Na
Se
S04
pH
Type of study
Particle diameter
Solid- to-liquid ratio,
Contact time
Other
Source: Fox, July 1983
INORGANIC COMPOSITION OF LEACHATES FROM
GEOKINETICS SPENT SHALE (mg/L)
Cleave et al., Krause et al., Krause, et al.,
1979 1980 1980
0.01 - 0.2 0.03 •- 0.3
0.5 - 6.7 0.6 - 2.6
747
29
321 - 16,200 741 - 8,430
0.32 - 10.1 2.3 - 13
797
34.4
0.2
0.4 - 17.1 0.7 - 6.4
542
<0.001 - 1.3 0.006 •- 0.16
2,298 170 - 16,435 790 •- 5,595
8.8 - 11.6 9.2 - 11.6
shaker Column Ball mill/batch
-1 in. -10 mesh
g/mL 0.5 - 0.4
48 hr 1 hr 2 wk
3 x 50 cm glass
column
164
1
1
1
1
I
1
1
1
1
1
1
1
1
1
f
1
1
1
image:
 w
CO
fH
fXl
to
to
CJ
O
M
O
w
H
W
iJ
O
§
to
o
I
u
53
O
eel
O
cs
00
n
W
PQ
H
TCU
o ^
CO OH
O CL,
U '
O,
O.X.
PL,
(X,
(OX,
U 04
! CU O
Oi
u
W 0
e
K
O.
oooooooooooo
§
§
CXI
I • I
§
CT>
O
1 1 1 1 • 1 1 1 1 1 1 1 1 1 1 1 | | | | . |
ooooooooooooo
CNMCXlcNrxlCXICXlCNCXiCJrHCNCXlCxlCXJrHrHCNCNfHrHrHrHrH
O t_J ^J O
I
O
rH (1J
X 3
rH
ID O
O
H IM a,
o|
«l 11 n
>t -PI
m
!H
<u
165
image:
w
CO
fH
fXl
to
to
CJ
O
M
O
w
H
W
iJ
O
§
to
o
I
u
53
O
eel
O
cs
00
n
W
PQ
H
TCU
o ^
CO OH
O CL,
U '
O,
O.X.
PL,
(X,
(OX,
U 04
! CU O
Oi
u
W 0
e
K
O.
oooooooooooo
§
§
CXI
I • I
§
CT>
O
1 1 1 1 • 1 1 1 1 1 1 1 1 1 1 1 | | | | . |
ooooooooooooo
CNMCXlcNrxlCXICXlCNCXiCJrHCNCXlCxlCXJrHrHCNCNfHrHrHrHrH
O t_J ^J O
I
O
rH (1J
X 3
rH
ID O
O
H IM a,
o|
«l 11 n
>t -PI
m
!H
<u
165
image:
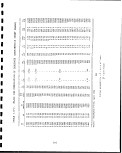 TABLE 3.8-3. CONCENTRATION (mg/L) OF TRACE ELEMENTS
FOR SELECTED PORE VOLUMES OF LEACHATE
(GEOKINETICS SPENT SHALE)
0.021
P 0.4
Al 0.6
Fe 0 . 04
Mn 0.03
Cu 0.18
Zn 0.03
Ni 0.03
Mo 33.1
Cd 0.01
Cr 0.07
Sr 2.3
B 11.9
Ba 0.19
Pb 0.1
As <0.1
Se 2.4
vt
L
0.090
0.3
0.4
0.02
0.01
0.15
0.02
0.01
17.4
0.01
0.03
13.4
7.7
0.21
<0.1
<0 . 1
1.1
Source: DOE/FE/60177-1590,
K
vt
L
Key
= 4.6 x 10~
0.510 1.977
0.2 0.1
0.5 0.3
0.01 <0.01
0.01 <0.01
0.14 <0.01
0.06 <0.01
0.01 <0.01
6.0 0.7
0.01 <0.01
0.01 <0.01
15.4 13.5
6.1 2.6
0.14 0.09
<0 . 1 <0 . 1
<0.1 <0.1
0.4 <0.1
April 1984
cm/s
= pore volume
166
ll
1
1
1
1
g
•V
1
1
>^M-
1
1
I
1
1
I
1
1
I
1
image:
TABLE 3.8-3. CONCENTRATION (mg/L) OF TRACE ELEMENTS
FOR SELECTED PORE VOLUMES OF LEACHATE
(GEOKINETICS SPENT SHALE)
0.021
P 0.4
Al 0.6
Fe 0 . 04
Mn 0.03
Cu 0.18
Zn 0.03
Ni 0.03
Mo 33.1
Cd 0.01
Cr 0.07
Sr 2.3
B 11.9
Ba 0.19
Pb 0.1
As <0.1
Se 2.4
vt
L
0.090
0.3
0.4
0.02
0.01
0.15
0.02
0.01
17.4
0.01
0.03
13.4
7.7
0.21
<0.1
<0 . 1
1.1
Source: DOE/FE/60177-1590,
K
vt
L
Key
= 4.6 x 10~
0.510 1.977
0.2 0.1
0.5 0.3
0.01 <0.01
0.01 <0.01
0.14 <0.01
0.06 <0.01
0.01 <0.01
6.0 0.7
0.01 <0.01
0.01 <0.01
15.4 13.5
6.1 2.6
0.14 0.09
<0 . 1 <0 . 1
<0.1 <0.1
0.4 <0.1
April 1984
cm/s
= pore volume
166
ll
1
1
1
1
g
•V
1
1
>^M-
1
1
I
1
1
I
1
1
I
1
image:
 M
(U
3
(1)
O
d)
0)
O
£3.
J*l 0)
(^ ft
d) CO
OQ CO
u
-H 0)
> fl
•H-H
U O
T3 O
O S
O O
^
U <U
•H-P
M irS
U U
<u ra
rH 0)
W 11
I
CO
(U
I
CO
rH
r-H
•H
ft
O
LO
iH
I
O
O
Cl
O
n
3
O
03
O
<0
d
(M
O
Ul,
03/03
167
image:
M
(U
3
(1)
O
d)
0)
O
£3.
J*l 0)
(^ ft
d) CO
OQ CO
u
-H 0)
> fl
•H-H
U O
T3 O
O S
O O
^
U <U
•H-P
M irS
U U
<u ra
rH 0)
W 11
I
CO
(U
I
CO
rH
r-H
•H
ft
O
LO
iH
I
O
O
Cl
O
n
3
O
03
O
<0
d
(M
O
Ul,
03/03
167
image:
 I
3.9 SUPERIOR CIRCULAR GRATE OIL SHALE RETORTING "
3.9.1 Retorting Operation H
A commercial-sized Superior retort incorporates a circular travel-
ing grate retort about 200 ft in diameter, covered by a hood and ffl
made gas-tight by water seals at the sides (Figure 3.9-1). The H
doughnut-shaped retort is divided into five separately enclosed
sections: a loading zone, a retorting zone, a residual carbon m
recovery zone, a cooling zone, and finally an unloading zone. •
The raw shale is fed to the traveling grate retort so that the
finest material is at the bottom and coarsest on top. The. pre- A
pared bed of shale passes first into the retorting zone where it »
contacts a stream of hot gases, and retorting occurs as the hot
gases pass down through the bed of shale. The oil and gas mixture m
passes to a separator/condenser system where shale oil is recover- ||
ed, and the cooled recycle gases then pass through the retorted
shale bed in the cooling zone of the retort to cool the processed M
shale before dumping, and heat the recycle gas. m
The retorted shale travels from the retorting zone to the carbon
recovery zone where evolution of shale oil vapors is completed, •
and residual carbon is burned in a mixture of recycle gas and Ms
preheated combustion air. From the combustion zone, the processed
shale travels to the shale cooling zone where recycle gas is M
heated by the hot shale. The shale is cooled further by ambient B
air. See Figure 3.9-2 for schematics of directly heated operation
of the Superior retort. Processed shale is discharged through
mechanical seals or a water seal which wets the shale for dust m
control. The traveling grate is sealed between stationary hoods •»
on top of the bed and the windboxes underneath by water troughs
on both sides, which allows for expansion and contraction of the •
retort structural members. •
^*"
Preheated recycle gas from the shale cooling zone is heated fur- «.
ther by mixing with hot combustion gases and the mixture is sent 9
to the shale heating zone to complete the cycle. *
Retort product gas is taken as a side stream from the recycle gas. ffl
A high Btu (400-600 Btu/scf) gas is produced in the indirect- ra
heated mode. Gas from the direct-heated mode is low-Btu (80-130
Btu/scf). ip
3.9.2 Solid Wastes
Figure 3.9-3 presents the process operations and projected waste W
streams for the Superior Circular Grate Process. Dust fines are •
generated in the raw shale mining and crushing phase and are
disposed of in the solid waste pile. Retorted shale is moistened JH
prior to the discharge from the circular grate. Hi
168
I
I
image:
I
3.9 SUPERIOR CIRCULAR GRATE OIL SHALE RETORTING "
3.9.1 Retorting Operation H
A commercial-sized Superior retort incorporates a circular travel-
ing grate retort about 200 ft in diameter, covered by a hood and ffl
made gas-tight by water seals at the sides (Figure 3.9-1). The H
doughnut-shaped retort is divided into five separately enclosed
sections: a loading zone, a retorting zone, a residual carbon m
recovery zone, a cooling zone, and finally an unloading zone. •
The raw shale is fed to the traveling grate retort so that the
finest material is at the bottom and coarsest on top. The. pre- A
pared bed of shale passes first into the retorting zone where it »
contacts a stream of hot gases, and retorting occurs as the hot
gases pass down through the bed of shale. The oil and gas mixture m
passes to a separator/condenser system where shale oil is recover- ||
ed, and the cooled recycle gases then pass through the retorted
shale bed in the cooling zone of the retort to cool the processed M
shale before dumping, and heat the recycle gas. m
The retorted shale travels from the retorting zone to the carbon
recovery zone where evolution of shale oil vapors is completed, •
and residual carbon is burned in a mixture of recycle gas and Ms
preheated combustion air. From the combustion zone, the processed
shale travels to the shale cooling zone where recycle gas is M
heated by the hot shale. The shale is cooled further by ambient B
air. See Figure 3.9-2 for schematics of directly heated operation
of the Superior retort. Processed shale is discharged through
mechanical seals or a water seal which wets the shale for dust m
control. The traveling grate is sealed between stationary hoods •»
on top of the bed and the windboxes underneath by water troughs
on both sides, which allows for expansion and contraction of the •
retort structural members. •
^*"
Preheated recycle gas from the shale cooling zone is heated fur- «.
ther by mixing with hot combustion gases and the mixture is sent 9
to the shale heating zone to complete the cycle. *
Retort product gas is taken as a side stream from the recycle gas. ffl
A high Btu (400-600 Btu/scf) gas is produced in the indirect- ra
heated mode. Gas from the direct-heated mode is low-Btu (80-130
Btu/scf). ip
3.9.2 Solid Wastes
Figure 3.9-3 presents the process operations and projected waste W
streams for the Superior Circular Grate Process. Dust fines are •
generated in the raw shale mining and crushing phase and are
disposed of in the solid waste pile. Retorted shale is moistened JH
prior to the discharge from the circular grate. Hi
168
I
I
image:
 3.9.3 Characteristics of Solid Wastes i
N°x,da^ are aXailable on the characteristics of the retorted shale
and other solid wastes. The soluble materials extracted by water
Ma 19^m10r Spent shale has been reported as 142 {Lb/ton (TRW,
i
Table 3.9-1 presents process water quality parameters. Tables
f> It an<J ^9-3 show results of leachate tests. It is not known
. nown
the shale used in these tests had undergone moisturization or
? ^o ?r a^umjna and soda ash removal. The information in
'4 and 3.9-5 summarizes Superior leachate! data using
water and process water on process shale. ;
169
image:
3.9.3 Characteristics of Solid Wastes i
N°x,da^ are aXailable on the characteristics of the retorted shale
and other solid wastes. The soluble materials extracted by water
Ma 19^m10r Spent shale has been reported as 142 {Lb/ton (TRW,
i
Table 3.9-1 presents process water quality parameters. Tables
f> It an<J ^9-3 show results of leachate tests. It is not known
. nown
the shale used in these tests had undergone moisturization or
? ^o ?r a^umjna and soda ash removal. The information in
'4 and 3.9-5 summarizes Superior leachate! data using
water and process water on process shale. ;
169
image:
 £ w
•H QJ
O O
A N
W
ID
•P 3
5-1 O
O-H
i I ti
0) US
t I ^^
00
W XH 00
03 Cn <^t
OJ 3 iH
U O
O 5-) >i
ftp fS
Cn D M
C t^ ,Q
•H >-i d)
•P (C fa
n,c
4J ">"
OJ'+H 13
M-P
o rt
•H <U
M E
(1) (U
ft >
3 O
to g
CO
OJ
U
O
r/j
0)
5-1
&
•H
170
11
1
1
1
1
I
1
1
1
I
I
1
I
I
I
1
I
I
1
image:
£ w
•H QJ
O O
A N
W
ID
•P 3
5-1 O
O-H
i I ti
0) US
t I ^^
00
W XH 00
03 Cn <^t
OJ 3 iH
U O
O 5-) >i
ftp fS
Cn D M
C t^ ,Q
•H >-i d)
•P (C fa
n,c
4J ">"
OJ'+H 13
M-P
o rt
•H <U
M E
(1) (U
ft >
3 O
to g
CO
OJ
U
O
r/j
0)
5-1
&
•H
170
11
1
1
1
1
I
1
1
1
I
I
1
I
I
I
1
I
I
1
image:
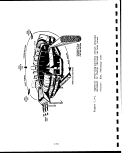 COOL RECYCLE GAS
HOT RECYCLE GAS
SHALE
FEED
PREHEATED COMBUSTION AIR
DIRECT |
HEATING
BURNERS
AIR IN
HEATING |
COOLING BY iCOOLING
RECYCLE | BY AIR
GAS
V
CARBON
RECOVERY
PROC-
ESSED
S'HALE
LIQUID
SEAL
GAS BLOWER
-»»*
EDO] :
GAS COMPRESSOR
OIL 8 WATER
SURPLUS RETORT
iGAS
NOTE:
THE CIRCULAR PATH OF THE
SOLIDS BED IS PICTURED AS A
STRAIGHT PATH FOR CLARITY
c
G
C
C
Figure 3.9-2. Superior direct-heated process^
Source: DRI, SAI & KSC; 68-03-2795
171
image:
COOL RECYCLE GAS
HOT RECYCLE GAS
SHALE
FEED
PREHEATED COMBUSTION AIR
DIRECT |
HEATING
BURNERS
AIR IN
HEATING |
COOLING BY iCOOLING
RECYCLE | BY AIR
GAS
V
CARBON
RECOVERY
PROC-
ESSED
S'HALE
LIQUID
SEAL
GAS BLOWER
-»»*
EDO] :
GAS COMPRESSOR
OIL 8 WATER
SURPLUS RETORT
iGAS
NOTE:
THE CIRCULAR PATH OF THE
SOLIDS BED IS PICTURED AS A
STRAIGHT PATH FOR CLARITY
c
G
C
C
Figure 3.9-2. Superior direct-heated process^
Source: DRI, SAI & KSC; 68-03-2795
171
image:
 I
TABLE 3.9-2.
INORGANIC COMPOSITION OF SUPERIOR LEACHATE
PRODUCED BY THE ASTM TEST METHOD D3987
I
Element
Concentration0
mg/L
Ag
As
B
Ba
Cd
Cl
Cr
EC (Mmho/cm)
Li
Mn
Mo
NH3
Ni
Pb
Se
SO
Sr
Th
TOG
pH
0.6 - 0.22
<5
2400 - 3250
0.51 - 0.80
0.39 - 0.46
0-2
0.14 - 0.20
896 - 1908
0.33 - 0.58
0.43 - 0.56
<20
9.4
Samples were prewetted to 20 wt % with distilled
water, compacted, equilibrated for 0 to 4 weeks,
fractured, and leached by ASTM D3987. In this
test, 350 g of solid are leached in 1.4 liters
of distilled water and the leachate diluted to
2 liters prior to analysis. Chemical analysis
was by inductively coupled argon plasma spec-
trometry and other methods.
Source: Fox, July 1983
I
I
r
I;
r
r
r
174
image:
I
TABLE 3.9-2.
INORGANIC COMPOSITION OF SUPERIOR LEACHATE
PRODUCED BY THE ASTM TEST METHOD D3987
I
Element
Concentration0
mg/L
Ag
As
B
Ba
Cd
Cl
Cr
EC (Mmho/cm)
Li
Mn
Mo
NH3
Ni
Pb
Se
SO
Sr
Th
TOG
pH
0.6 - 0.22
<5
2400 - 3250
0.51 - 0.80
0.39 - 0.46
0-2
0.14 - 0.20
896 - 1908
0.33 - 0.58
0.43 - 0.56
<20
9.4
Samples were prewetted to 20 wt % with distilled
water, compacted, equilibrated for 0 to 4 weeks,
fractured, and leached by ASTM D3987. In this
test, 350 g of solid are leached in 1.4 liters
of distilled water and the leachate diluted to
2 liters prior to analysis. Chemical analysis
was by inductively coupled argon plasma spec-
trometry and other methods.
Source: Fox, July 1983
I
I
r
I;
r
r
r
174
image:
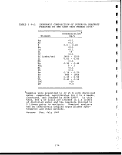 TABLE 3.9-3. THE EFFECT OF COPRODUCTED RETORT WATERS ON THE
QUALITY OF SUPERIOR LEACHATES FROM SPENT SHALES'
,
As
B
Ba
Cl
Cr
EC, (j mhos/cm
Li
Mn
Mo
Ni
Se
S04
Sr
TOC
pH
Moisturization
water
composition
Retort water
0.25
1.83
<0 . 1
350
<0 . 1
>8,500
0.18
1.23
<0 . 1
<0.1
<0 . 1
3,000
0.21
5,000
7.0
Leachate composition
Spent shale
Distilled water
<0.1
0.16
<0 . 1
>5
<0. 1
3,250
0.51
<0 .1
0.39
<0 .1
0.14
896
0.33
>20
9.4
moisturized
Retort water
1 0.14
! 0.29
<0 .1
18
<0 . 1
3,900
i 0.63
<0.1
0.38
<0 .1
! 0.15 ,
! 1,073
0.39
53
i 9.2
All values in ppm except EC which is in pmho/cm. '•.
Samples produced by leaching fractured cores cured for 4 weeks
using ASTM D3987 (350 g of spent shale are batch leached in
1,400 mL distilled water; the final leachate was diluted to
2,000 mL prior to analysis). Spent shale cores were produced
by moisturizing each sample (12.5% water (w/w)) and compacting
it according to ASTM D698-78.
Source: Fox, July 1983
175
image:
TABLE 3.9-3. THE EFFECT OF COPRODUCTED RETORT WATERS ON THE
QUALITY OF SUPERIOR LEACHATES FROM SPENT SHALES'
,
As
B
Ba
Cl
Cr
EC, (j mhos/cm
Li
Mn
Mo
Ni
Se
S04
Sr
TOC
pH
Moisturization
water
composition
Retort water
0.25
1.83
<0 . 1
350
<0 . 1
>8,500
0.18
1.23
<0 . 1
<0.1
<0 . 1
3,000
0.21
5,000
7.0
Leachate composition
Spent shale
Distilled water
<0.1
0.16
<0 . 1
>5
<0. 1
3,250
0.51
<0 .1
0.39
<0 .1
0.14
896
0.33
>20
9.4
moisturized
Retort water
1 0.14
! 0.29
<0 .1
18
<0 . 1
3,900
i 0.63
<0.1
0.38
<0 .1
! 0.15 ,
! 1,073
0.39
53
i 9.2
All values in ppm except EC which is in pmho/cm. '•.
Samples produced by leaching fractured cores cured for 4 weeks
using ASTM D3987 (350 g of spent shale are batch leached in
1,400 mL distilled water; the final leachate was diluted to
2,000 mL prior to analysis). Spent shale cores were produced
by moisturizing each sample (12.5% water (w/w)) and compacting
it according to ASTM D698-78.
Source: Fox, July 1983
175
image:
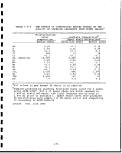 TABLE 3.9-4. EFFECT OF DISTILLED WATER, AND TIME ON THE LEACHATE
QUALITY OF MOISTENED, COMPACTED SUPERIOR SPENT SHALES
Shale
core aqe
0 Week
4 Week
PH
9.4
9.4
Conductivity
|jmhos/cm
2400
3250
Water quality parameters
Cl , mcr/L S04~, mg/L NH2-N, mq/L TOC, mq/L
>5 1908 0 >20
>5 896 2 >20
Source: Jackson & Jackson, 1982
176
1
I
1
I
I
I
I
1
1
I
i
1
I
1
I
I
1
I
I
image:
TABLE 3.9-4. EFFECT OF DISTILLED WATER, AND TIME ON THE LEACHATE
QUALITY OF MOISTENED, COMPACTED SUPERIOR SPENT SHALES
Shale
core aqe
0 Week
4 Week
PH
9.4
9.4
Conductivity
|jmhos/cm
2400
3250
Water quality parameters
Cl , mcr/L S04~, mg/L NH2-N, mq/L TOC, mq/L
>5 1908 0 >20
>5 896 2 >20
Source: Jackson & Jackson, 1982
176
1
I
1
I
I
I
I
1
1
I
i
1
I
1
I
I
1
I
I
image:
 3.10 UNION OIL A OIL SHALE RETORTING !
I
3.. 10.1 Retorting Operation
All three of the processes developed by Union Oil are variations
of an upflow vertical kiln retort using a rock-pump shale feeding
mechanism [EPA-600/2-80-205a, 1980]. The retorts are known as
Retort A, Retort B, and SGR-3. In all three processes, the oil
shale is pushed upward through the retort while the gas flow is
downward. In Retort A, the heat for pyrolysis is generated by the
internal combustion of residual carbon on the spent shale. In
Retort B and the SGR retort, the heat is supplied indirectly by
externally heated hot gases. !
The Retort A process was developed through 2-, 50-,: and 1,000-
ton/day pilot plants that were operated before I960.! A view of
the Retort A process is shown in Figure 3.10-1, The retort is an
inverted cone fitted with a rock-pump shale feeder that pushes the
oil shale upward through the vessel. Air is injected at the top
of the retort to support combustion of the residual carbon on the
retorted shale fragments in the upper portion of the retort. This
combustion provides the heat necessary to retort the upward-flow-
ing shale.
The crushed shale feed is removed from the hopper and transferred
to the bottom of the retort by a shale feeder. As the shale
enters the retort, it is contacted by a countercurrent flow of hot
product gases leaving the combustion and retorting zones above.
In this lower zone, the gas-cooling zone, heat is transferred from
the hot gases to the cool incoming shale. The feed is preheated,
and the oil vapors are condensed while the gases are cooled.
Passing up through the retort, the preheated shale ! enters the
retorting or pyrolysis zone. The gases passing downward in this
area,, having just left the combustion zone, heat the; shale to a
temperature such that organic material is pyrolyzed:, producing
shale oil vapor, product gas, and residual carbon on the surface
of the shale. As the gaseous products of pyrolysis are evolved,
they are swept downward by the flow of combustion gases.
The retorted shale fragments then enter the combustion zone where
they encounter preheated combustion air passing down 'through the
retort. This air sustains the combustion of the residual carbon
that remains on the surface of the shale after retorting.
Temperatures in this zone may reach 2000°F, high enough
to fuse a portion of the shale. In earlier versions of the
retort, retorting spiral plows were used to break clinkers and
remove retorted shale. In later versions, these plows were not
used. :
177
image:
3.10 UNION OIL A OIL SHALE RETORTING !
I
3.. 10.1 Retorting Operation
All three of the processes developed by Union Oil are variations
of an upflow vertical kiln retort using a rock-pump shale feeding
mechanism [EPA-600/2-80-205a, 1980]. The retorts are known as
Retort A, Retort B, and SGR-3. In all three processes, the oil
shale is pushed upward through the retort while the gas flow is
downward. In Retort A, the heat for pyrolysis is generated by the
internal combustion of residual carbon on the spent shale. In
Retort B and the SGR retort, the heat is supplied indirectly by
externally heated hot gases. !
The Retort A process was developed through 2-, 50-,: and 1,000-
ton/day pilot plants that were operated before I960.! A view of
the Retort A process is shown in Figure 3.10-1, The retort is an
inverted cone fitted with a rock-pump shale feeder that pushes the
oil shale upward through the vessel. Air is injected at the top
of the retort to support combustion of the residual carbon on the
retorted shale fragments in the upper portion of the retort. This
combustion provides the heat necessary to retort the upward-flow-
ing shale.
The crushed shale feed is removed from the hopper and transferred
to the bottom of the retort by a shale feeder. As the shale
enters the retort, it is contacted by a countercurrent flow of hot
product gases leaving the combustion and retorting zones above.
In this lower zone, the gas-cooling zone, heat is transferred from
the hot gases to the cool incoming shale. The feed is preheated,
and the oil vapors are condensed while the gases are cooled.
Passing up through the retort, the preheated shale ! enters the
retorting or pyrolysis zone. The gases passing downward in this
area,, having just left the combustion zone, heat the; shale to a
temperature such that organic material is pyrolyzed:, producing
shale oil vapor, product gas, and residual carbon on the surface
of the shale. As the gaseous products of pyrolysis are evolved,
they are swept downward by the flow of combustion gases.
The retorted shale fragments then enter the combustion zone where
they encounter preheated combustion air passing down 'through the
retort. This air sustains the combustion of the residual carbon
that remains on the surface of the shale after retorting.
Temperatures in this zone may reach 2000°F, high enough
to fuse a portion of the shale. In earlier versions of the
retort, retorting spiral plows were used to break clinkers and
remove retorted shale. In later versions, these plows were not
used. :
177
image:
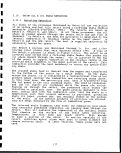 TABLE 3.9-5.
CONCENTRATION OF METALS IN LEACHATES
FROM SUPERIOR RETORTED SHALES:
Element
shale
Arsenic
Barium
Boron
Cadmium
Chromium
Lead
Lithium
Manganese
Molybdenum
Nickel
Selenium
Silver
Strontium
Thorium
Oa
<0 . 1
<0 . 1
0.22
Less
<0 .1
0.1
0.80
<0 . 1
0.46
<0 . 1
0.20
Less
0.58
0.56
ASTM
• 4a
<0 .1
<0 . 1
0.16
than 0.1
<0 . 1
<0 . 1
0.51
<0 . 1
0.39
<0. 1
0.14
than 0.1
0.33
0.43
oa
0.13
0.84
0.96
mg/1 for
0.10
0.16
0.36
3.3
0.25
0.19
0.45
mg/L for
10.5
1.4
RCRA
4a
0.1
0.63
0.71
all cases
<0 .1
0.32
0.49
3.8
0.22
0.18
0.48
all cases
10.0
1.4
Shale age in weeks after moistening with
distilled water.
Source: Jackson and Jackson, 1982
178
1
I
1
1
I
1
I
1
1
1
1
1
I
1
1
I
I
I
1
image:
TABLE 3.9-5.
CONCENTRATION OF METALS IN LEACHATES
FROM SUPERIOR RETORTED SHALES:
Element
shale
Arsenic
Barium
Boron
Cadmium
Chromium
Lead
Lithium
Manganese
Molybdenum
Nickel
Selenium
Silver
Strontium
Thorium
Oa
<0 . 1
<0 . 1
0.22
Less
<0 .1
0.1
0.80
<0 . 1
0.46
<0 . 1
0.20
Less
0.58
0.56
ASTM
• 4a
<0 .1
<0 . 1
0.16
than 0.1
<0 . 1
<0 . 1
0.51
<0 . 1
0.39
<0. 1
0.14
than 0.1
0.33
0.43
oa
0.13
0.84
0.96
mg/1 for
0.10
0.16
0.36
3.3
0.25
0.19
0.45
mg/L for
10.5
1.4
RCRA
4a
0.1
0.63
0.71
all cases
<0 .1
0.32
0.49
3.8
0.22
0.18
0.48
all cases
10.0
1.4
Shale age in weeks after moistening with
distilled water.
Source: Jackson and Jackson, 1982
178
1
I
1
1
I
1
I
1
1
1
1
1
I
1
1
I
I
I
1
image:
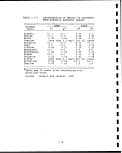 3.10.2 Solid Wastes j
-r ? '-- '
There is not much information available on the amounts of solid
wastes or solid waste streams of the Union Oil A process.
3.10.3 Characteristics of Solid Wastes
!
Pertinent data are presented in Tables 3.10-1 to 3.10-4.
179
image:
3.10.2 Solid Wastes j
-r ? '-- '
There is not much information available on the amounts of solid
wastes or solid waste streams of the Union Oil A process.
3.10.3 Characteristics of Solid Wastes
!
Pertinent data are presented in Tables 3.10-1 to 3.10-4.
179
image:
 TABLE 3.10-1. PHYSICAL PROPERTIES OF UNION A SPENT SHALE
Shale ash 16 years "old"
Composite sample in-place
t
I
1
Particle size •
Percent cobble (1" - 6") 8-28 m
gravel (4.76 mm - 1") 43 - 57
sand (0.074 - 4.76 mm) 15-23 •
silt (0.005 - 0.074 mm) , 8-13
Texture clay (-°-005 n™) Graded gravel to silty gravel #
Color Light brown w
Solids density, g/cc 2.36 »
Dry bulk density, pcf 60.3 - 90.5
Field, moisture, wt. % 12.1-45.0 •
Source: TRW/DRI, May 1977.
TABLE 3.10-2. CHEMICAL PROPERTIES OF UNION A RETORTED SHALE
Components a,
Si02
CaO
MgO
A1203
Fe20
Na2O
K20
S03
P205
Mineral C02
Organic C
Ignition loss @ 950°C
Free silica (quartz)
pH of slurry
Retort A
shale ash,
wt. % •
35.3
27.2
9.0
8.5
7.3
5.5
2.8
0.1
2.2
1.6
0.5
2.1
<2.0
12.5 - 13 (est. )
I
I
I
1
I
1
I
I
1
Analyses determined by heating sample to
950°C except for pH measurement. Analyses
by Union Research Department.
Source: Wildung and Zachara, 1980
180
I
1
image:
TABLE 3.10-1. PHYSICAL PROPERTIES OF UNION A SPENT SHALE
Shale ash 16 years "old"
Composite sample in-place
t
I
1
Particle size •
Percent cobble (1" - 6") 8-28 m
gravel (4.76 mm - 1") 43 - 57
sand (0.074 - 4.76 mm) 15-23 •
silt (0.005 - 0.074 mm) , 8-13
Texture clay (-°-005 n™) Graded gravel to silty gravel #
Color Light brown w
Solids density, g/cc 2.36 »
Dry bulk density, pcf 60.3 - 90.5
Field, moisture, wt. % 12.1-45.0 •
Source: TRW/DRI, May 1977.
TABLE 3.10-2. CHEMICAL PROPERTIES OF UNION A RETORTED SHALE
Components a,
Si02
CaO
MgO
A1203
Fe20
Na2O
K20
S03
P205
Mineral C02
Organic C
Ignition loss @ 950°C
Free silica (quartz)
pH of slurry
Retort A
shale ash,
wt. % •
35.3
27.2
9.0
8.5
7.3
5.5
2.8
0.1
2.2
1.6
0.5
2.1
<2.0
12.5 - 13 (est. )
I
I
I
1
I
1
I
I
1
Analyses determined by heating sample to
950°C except for pH measurement. Analyses
by Union Research Department.
Source: Wildung and Zachara, 1980
180
I
1
image:
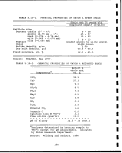 TABLE 3.10-3.
ANALYSIS OF LEACHATE OBTAINED IN LABORATORY
TESTS OF UNION A RAW AND RETORTED SHALE
Quantity extracted per
unit weight of shale
(kg/tonne) :
Retorted
Raw shale
Shale,
Inorganics
K+
Na+
Ca++
Mg++
HC03~
Cl"
S04
Total
kg/tonne
Ibs/ton
0.24
0.48
0.1
0.01
0.75
0.22
0.79
2.59
5.18
>
6.25
21.0-
3.27
0.91
0.28
0.33
62.3 i
1
94.3 '
188 :
Source: TRW/DRI, May 1977.
TABLE 3.10-4.
INORGANIC COMPOSITION OF LEACHATES
FROM UNION A SPENT SHALE, '
Components
Ca
Cl
C03
F
HC03
K
Mg
Na
S04
TDS
EC, (jmhos/cm
PH
Particle diameter
Solid- to-liquid ratio, g/mL
Contact time, min
mg/L
327
33
21
3.4
28
625
91
2,100
6,230
10,011
11,050
9.94
-40 mesh
0.1
5
Source: Fox, 1983
181
image:
TABLE 3.10-3.
ANALYSIS OF LEACHATE OBTAINED IN LABORATORY
TESTS OF UNION A RAW AND RETORTED SHALE
Quantity extracted per
unit weight of shale
(kg/tonne) :
Retorted
Raw shale
Shale,
Inorganics
K+
Na+
Ca++
Mg++
HC03~
Cl"
S04
Total
kg/tonne
Ibs/ton
0.24
0.48
0.1
0.01
0.75
0.22
0.79
2.59
5.18
>
6.25
21.0-
3.27
0.91
0.28
0.33
62.3 i
1
94.3 '
188 :
Source: TRW/DRI, May 1977.
TABLE 3.10-4.
INORGANIC COMPOSITION OF LEACHATES
FROM UNION A SPENT SHALE, '
Components
Ca
Cl
C03
F
HC03
K
Mg
Na
S04
TDS
EC, (jmhos/cm
PH
Particle diameter
Solid- to-liquid ratio, g/mL
Contact time, min
mg/L
327
33
21
3.4
28
625
91
2,100
6,230
10,011
11,050
9.94
-40 mesh
0.1
5
Source: Fox, 1983
181
image:
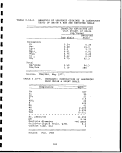 3.11 UNION OIL B OIL SHALE RETORTING ~
3.11.1 Retorting Operation 9[
In the Retort B process, shown in Figure 3.11-1, crushed oil shale
in the 1/8 to 2 in. size range flows through two feed chutes to m
the solids pump. The solids pump consists of two piston and ]|
cylinder assemblies which alternately feed shale to the retort.
As shale is moved upward through the retort by the upstroke of the
piston, it is met by a stream of 950 to 1,000°F recycle gas from •
the recycle gas heater flowing downward. The rising oil shale bed w
is heated to retorting temperature by countercurrent contact with
the hot recycle gas, resulting in the evolution of shale oil vapor tt
and make gas. This mixture of shale oil vapor and make gas is J|
forced downward by the recycle gas, and cooled by contact with the
cold incoming shale in the lower section of the retort cone. In g»
the disengaging section surrounding the lower cone, the liquid M
level is controlled by withdrawing the oil product, and the **
recycle and make gas are removed from the space above the liquid
level. •
The make gas is first sent to a venturi scrubber for cooling and
heavy ends removal by oil scrubbing. A portion of the 800 Btu/SCF H
make gas is then processed by compression and oil scrubbing to Q
remove additional heavy ends, followed by a Stretford unit to
remove hydrogen sulfide. The sweetened make gas is used as plant ^
fuel. The remaining gas, taken off after the venturi scrubber, is B
recycled to the retort through the recycle gas heater to provide *
the heat for oil retorting.
The rundown oil from the retort is treated sequentially for A
solids, arsenic, and lightends removal. The solids removal is
accomplished by two stages of water washing. The shale fines are M
collected in the water phase which is recycled to the water seal. g
The water seal is a Union Oil concept, in which a water level is
maintained in the conveyor for retorted shale removal to seal the ^
retort pressure from atmosphere. For arsenic removal, a V
proprietary Union Oil process employing an adsorbent is utilized •
to reduce the arsenic content of the raw shale oil from 50 ppm to
2 ppm. The dearsenated shale oil is sent to a stripping column •
for stabilization and stripping prior to shipment. This partially (|
upgraded shale oil can now be marketed as a low sulfur burner fuel
in various locations in the United States, and is also a suitable »
feedstock for refineries that have adequate hydrotreating •
capacity. The crude shale oil from the Retort B process has a *•
specific gravity of 0.918 (22.7°API), a pour point of 60°F, and a
kinematic viscosity of 20 centistokes (98.2 SUS) at 100°F. It H
typically contains 1.74 weight percent nitrogen and 0.81 weight m
percent sulfur.
182
1
I
1
image:
3.11 UNION OIL B OIL SHALE RETORTING ~
3.11.1 Retorting Operation 9[
In the Retort B process, shown in Figure 3.11-1, crushed oil shale
in the 1/8 to 2 in. size range flows through two feed chutes to m
the solids pump. The solids pump consists of two piston and ]|
cylinder assemblies which alternately feed shale to the retort.
As shale is moved upward through the retort by the upstroke of the
piston, it is met by a stream of 950 to 1,000°F recycle gas from •
the recycle gas heater flowing downward. The rising oil shale bed w
is heated to retorting temperature by countercurrent contact with
the hot recycle gas, resulting in the evolution of shale oil vapor tt
and make gas. This mixture of shale oil vapor and make gas is J|
forced downward by the recycle gas, and cooled by contact with the
cold incoming shale in the lower section of the retort cone. In g»
the disengaging section surrounding the lower cone, the liquid M
level is controlled by withdrawing the oil product, and the **
recycle and make gas are removed from the space above the liquid
level. •
The make gas is first sent to a venturi scrubber for cooling and
heavy ends removal by oil scrubbing. A portion of the 800 Btu/SCF H
make gas is then processed by compression and oil scrubbing to Q
remove additional heavy ends, followed by a Stretford unit to
remove hydrogen sulfide. The sweetened make gas is used as plant ^
fuel. The remaining gas, taken off after the venturi scrubber, is B
recycled to the retort through the recycle gas heater to provide *
the heat for oil retorting.
The rundown oil from the retort is treated sequentially for A
solids, arsenic, and lightends removal. The solids removal is
accomplished by two stages of water washing. The shale fines are M
collected in the water phase which is recycled to the water seal. g
The water seal is a Union Oil concept, in which a water level is
maintained in the conveyor for retorted shale removal to seal the ^
retort pressure from atmosphere. For arsenic removal, a V
proprietary Union Oil process employing an adsorbent is utilized •
to reduce the arsenic content of the raw shale oil from 50 ppm to
2 ppm. The dearsenated shale oil is sent to a stripping column •
for stabilization and stripping prior to shipment. This partially (|
upgraded shale oil can now be marketed as a low sulfur burner fuel
in various locations in the United States, and is also a suitable »
feedstock for refineries that have adequate hydrotreating •
capacity. The crude shale oil from the Retort B process has a *•
specific gravity of 0.918 (22.7°API), a pour point of 60°F, and a
kinematic viscosity of 20 centistokes (98.2 SUS) at 100°F. It H
typically contains 1.74 weight percent nitrogen and 0.81 weight m
percent sulfur.
182
1
I
1
image:
 aj
iH
CM
(U
o
n
0)
OS
ti
o
•H
-H
S
W
M
O
•p
(U
o c--
^w c-^
S S
(0
M 43
tn o
n3 M
05
EH
rH
1
0)
U
• o
CO to
183
image:
aj
iH
CM
(U
o
n
0)
OS
ti
o
•H
-H
S
W
M
O
•p
(U
o c--
^w c-^
S S
(0
M 43
tn o
n3 M
05
EH
rH
1
0)
U
• o
CO to
183
image:
 1
3.11.2 Solid Wastes
Figure 3.11-2 presents the process operations and-waste streams JB
for the Union B prototype plant. The solid waste streams are m
highlighted in the figure. Dusts and fines are generated from the
primary crushing, screening, and storage of raw shale prior to the
retorting phase. Retorted shale is cooled and moistened for dis-
posal.
Table 3.11-1 lists an inventory of the solid waste streams, the ffl
percent each stream represents of the total mass requiring dis- J»
posal, and the components of each waste stream.
3.11.3 Characteristics of Solid Wastes fjf
Tables 3.11-2 through 3.11-3 provide chemical and physical proper-
ties of retorted shale. Table 3.11-4 shows results of analysis of
the process water to be used to moisturize the spent shale.
Table 3.11-5 list leachate data. Table 3.11-6 shows results of
RCRA testing conducted on Union B shale. It
a
i
I
i
I
184
i
i
i
i
i
image:
1
3.11.2 Solid Wastes
Figure 3.11-2 presents the process operations and-waste streams JB
for the Union B prototype plant. The solid waste streams are m
highlighted in the figure. Dusts and fines are generated from the
primary crushing, screening, and storage of raw shale prior to the
retorting phase. Retorted shale is cooled and moistened for dis-
posal.
Table 3.11-1 lists an inventory of the solid waste streams, the ffl
percent each stream represents of the total mass requiring dis- J»
posal, and the components of each waste stream.
3.11.3 Characteristics of Solid Wastes fjf
Tables 3.11-2 through 3.11-3 provide chemical and physical proper-
ties of retorted shale. Table 3.11-4 shows results of analysis of
the process water to be used to moisturize the spent shale.
Table 3.11-5 list leachate data. Table 3.11-6 shows results of
RCRA testing conducted on Union B shale. It
a
i
I
i
I
184
i
i
i
i
i
image:
 III
i
1
•
15
Is
i
35
s
• s
3"S
1 3
S
2
0
3
1
-»
i!
'•"
:
a
I
S
*
u
«•
i£
I
I
? •
s i
"•
«
s
*
1
t
-< EC
-S
s
w
i
S,
M*
r
J
— — H
|
$
i
QNC3
r
j
SON 3
|
5
=
H0»
O
J i
S?
p
n
1
s°
£
a
£
5
s
k
r
5s
<£
i
5
£
a
£
if
l». ,
v S
I 5
0
1
f
.!
5 «
.
j
1
s
: i
s s
i f
j
ty
*SJ
—
-
_
* S
*
0
r=
!
oS
^
s
s
s
•••
J!
*t
3 =
r
r
-fc
I'll
ilfl
*" < °
as s
is*l
ii
o
-P
•H C~-
O CT>
fH
fl
OX!
-H O
m 3:
Pi
SB
-H (0
O <D
J* O
U-P
O O
r-H M
« CM
ro
0)
s-i
•H
185
image:
III
i
1
•
15
Is
i
35
s
• s
3"S
1 3
S
2
0
3
1
-»
i!
'•"
:
a
I
S
*
u
«•
i£
I
I
? •
s i
"•
«
s
*
1
t
-< EC
-S
s
w
i
S,
M*
r
J
— — H
|
$
i
QNC3
r
j
SON 3
|
5
=
H0»
O
J i
S?
p
n
1
s°
£
a
£
5
s
k
r
5s
<£
i
5
£
a
£
if
l». ,
v S
I 5
0
1
f
.!
5 «
.
j
1
s
: i
s s
i f
j
ty
*SJ
—
-
_
* S
*
0
r=
!
oS
^
s
s
s
•••
J!
*t
3 =
r
r
-fc
I'll
ilfl
*" < °
as s
is*l
ii
o
-P
•H C~-
O CT>
fH
fl
OX!
-H O
m 3:
Pi
SB
-H (0
O <D
J* O
U-P
O O
r-H M
« CM
ro
0)
s-i
•H
185
image:
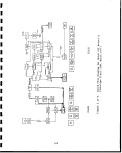 o
Q
W CO
CO CO
O W
PH O
CO O
Q PH
W PQ
O O
H JH
^?^
CO P
*-J J
^j 1^4
pcJ rH
f>i
EH co
co w
H
b co
O ^
^g
^H
O M
E^ f~l
a o
K?
t*^|
^fii CO
HH <J
*
H
1
H
H
CO
W
1
10
ph£
j. I
OS
S
Ol
OS
°g
d oj
0) U
G c
o o
P u
€
O
o
13
t|_i B_J
O rH
o co
4-J W 4->
0) rH OS
U 05 S
Si 4-1
0) O
(J-t 4-1
Si
O
OJ 03
4-J rH
05 O.
$^
d) *& 'O
G a.--.
tt) ,Q 4J
Oi
o
4-J 0
G 0
o o
E m
^
1
0)
w
UH
o
d
O
•H
,J__*
•&
t ,
U
(U
a
^_)
c
<u
o
o
0)
Si
3
4-1
in
•r)
o
£
CM
w
rH
ro
en
D- O
« *
in •*
en
0 0
o in
o eo
»3< in
10
ai
i-H
05
in
•a
O)
^_i
o
4-J
4-J O)
in s-<
3
O)
0) N
rH -H
OS Si
,C 3
in 4->
S -H
OS O
OS g
TJ
G •
OS
rH
-a
G
03
•a
0)
N
•H
Si
4) "O
G V
•H rH
OS rH
4-> -H
o
CJ
^
4-1
rH
OS
XI a)
O 4->
U 03
0) r-H
M O
U S
-H
&
0
«^*
rH
0
-S
•a
OS
u
Oi
a.
^
4-J
in
os
OS
u
PJ
0)
en
ej
-r)
G
0)
Ul
Ji.4
05
o\°
4-1
O
U
-H
G
<U
in
a
t-H
O
O
t
O
r-
oo
0
u
G
<u
•S
o
•a
05
G
0)
£U
en
0)
4-1
T3-H
Si a) in
(UNI
4-J -r) <4H
rH Si <4H
•H 0) O
4H G
•H T3
r4j OS O)
W 4-J rH
O G rH
0 -H
4-> U "4H
•H
•H OS
tt) 05 i— 1
•H TJ c$J
•5
ro
o
o
o
o
»
0
rH
CM
O
Si
0)
rH
-H
UH
C
0
•H
_|_1
3
rH
O
u
G
O
•rH
4_J u2
&<1)
rM
O OS
U U
f>
<Q
in
0)
•a
3
rH
M
1
O
CM
*
O
O
r-
T-H
in
0)
Oi
3
in
i *
G
1>
B
05
0)
i-i
4_)
0)
4-J
10
OS
3=
Si
(U
4-J
03
1
OJ
UH
Si 4-J
OJ G
rH OJ
•H £
0 4-J
Xt os
flj
0 4J
Si
o
rH
O
O
W
<L>
•H
r-H
O
N
jj
G
0)
&.
en
"(0
w
o
10
•H
13
(U
•H
M
1
M-l
O
>H
a>
•rH
Si
OS
r-
o
0
o
o
4
O
*sj*
"*
• o
*£•
G
rH
CU
G
0,
o
^1
•a
^i
f*t
s^^*>
4_)
in
os
4-J
OS
u
4J
G
a>
&
en
(U
4-J
•H
03
^
G
CU
&.
en
0
v«O
O
O
4~)
U3
K*1
i_f
05
4J
05
U
4J
•H
G
3
in
3
os
i— i
u
.
^
- CO
^f *• O
O « <N G
en O en os
CM en 00,0
os eg os 4-J
S os S
2 W
o\°<tf>o\° w
0) O
4J 4-J 4-> rH (N
IS & & ffi
T3
0 0 i-H G o\°
C— CM rH OS rH
f".
• 0
O
0
0
*
o
CO
•*
o
>l
O)
o
u
0)
£t4
I (
3 Tl
«4H -H
rH rH
3 0
W- U
T3 0)
0 VJ
iJ 3
t 0.
G
as 4-J
G -H
r3 C
rH 3
0)
2=
r*»_
L^
1—1
rC^
U
1
sT
CO
E~*
G
O
""O
0)
in
OS
PQ
«*
CO
rH
4-J
<n
3
•k
o
1 *
G
03
W
§
S
§«
a>
u
3
0
en
I
I
I
186
1
I
I
1
1
I
I
1
I
I
1
I
1
I
1
image:
o
Q
W CO
CO CO
O W
PH O
CO O
Q PH
W PQ
O O
H JH
^?^
CO P
*-J J
^j 1^4
pcJ rH
f>i
EH co
co w
H
b co
O ^
^g
^H
O M
E^ f~l
a o
K?
t*^|
^fii CO
HH <J
*
H
1
H
H
CO
W
1
10
ph£
j. I
OS
S
Ol
OS
°g
d oj
0) U
G c
o o
P u
€
O
o
13
t|_i B_J
O rH
o co
4-J W 4->
0) rH OS
U 05 S
Si 4-1
0) O
(J-t 4-1
Si
O
OJ 03
4-J rH
05 O.
$^
d) *& 'O
G a.--.
tt) ,Q 4J
Oi
o
4-J 0
G 0
o o
E m
^
1
0)
w
UH
o
d
O
•H
,J__*
•&
t ,
U
(U
a
^_)
c
<u
o
o
0)
Si
3
4-1
in
•r)
o
£
CM
w
rH
ro
en
D- O
« *
in •*
en
0 0
o in
o eo
»3< in
10
ai
i-H
05
in
•a
O)
^_i
o
4-J
4-J O)
in s-<
3
O)
0) N
rH -H
OS Si
,C 3
in 4->
S -H
OS O
OS g
TJ
G •
OS
rH
-a
G
03
•a
0)
N
•H
Si
4) "O
G V
•H rH
OS rH
4-> -H
o
CJ
^
4-1
rH
OS
XI a)
O 4->
U 03
0) r-H
M O
U S
-H
&
0
«^*
rH
0
-S
•a
OS
u
Oi
a.
^
4-J
in
os
OS
u
PJ
0)
en
ej
-r)
G
0)
Ul
Ji.4
05
o\°
4-1
O
U
-H
G
<U
in
a
t-H
O
O
t
O
r-
oo
0
u
G
<u
•S
o
•a
05
G
0)
£U
en
0)
4-1
T3-H
Si a) in
(UNI
4-J -r) <4H
rH Si <4H
•H 0) O
4H G
•H T3
r4j OS O)
W 4-J rH
O G rH
0 -H
4-> U "4H
•H
•H OS
tt) 05 i— 1
•H TJ c$J
•5
ro
o
o
o
o
»
0
rH
CM
O
Si
0)
rH
-H
UH
C
0
•H
_|_1
3
rH
O
u
G
O
•rH
4_J u2
&<1)
rM
O OS
U U
f>
<Q
in
0)
•a
3
rH
M
1
O
CM
*
O
O
r-
T-H
in
0)
Oi
3
in
i *
G
1>
B
05
0)
i-i
4_)
0)
4-J
10
OS
3=
Si
(U
4-J
03
1
OJ
UH
Si 4-J
OJ G
rH OJ
•H £
0 4-J
Xt os
flj
0 4J
Si
o
rH
O
O
W
<L>
•H
r-H
O
N
jj
G
0)
&.
en
"(0
w
o
10
•H
13
(U
•H
M
1
M-l
O
>H
a>
•rH
Si
OS
r-
o
0
o
o
4
O
*sj*
"*
• o
*£•
G
rH
CU
G
0,
o
^1
•a
^i
f*t
s^^*>
4_)
in
os
4-J
OS
u
4J
G
a>
&
en
(U
4-J
•H
03
^
G
CU
&.
en
0
v«O
O
O
4~)
U3
K*1
i_f
05
4J
05
U
4J
•H
G
3
in
3
os
i— i
u
.
^
- CO
^f *• O
O « <N G
en O en os
CM en 00,0
os eg os 4-J
S os S
2 W
o\°<tf>o\° w
0) O
4J 4-J 4-> rH (N
IS & & ffi
T3
0 0 i-H G o\°
C— CM rH OS rH
f".
• 0
O
0
0
*
o
CO
•*
o
>l
O)
o
u
0)
£t4
I (
3 Tl
«4H -H
rH rH
3 0
W- U
T3 0)
0 VJ
iJ 3
t 0.
G
as 4-J
G -H
r3 C
rH 3
0)
2=
r*»_
L^
1—1
rC^
U
1
sT
CO
E~*
G
O
""O
0)
in
OS
PQ
«*
CO
rH
4-J
<n
3
•k
o
1 *
G
03
W
§
S
§«
a>
u
3
0
en
I
I
I
186
1
I
I
1
1
I
I
1
I
I
1
I
1
I
1
image:
 TABLE 3.11-2. PHYSICAL PROPERTIES OF UNION B SPENT I SHALE
;.After
• compaction
at 12.375
Initial ft. Ibs/cf
Particle size
Percent cobble (1" - 6")
gravel (4.76 mm - 1")
sand (0.074 - 4.76 mm)
silt (0.005 - 0.074 mm)
clay (-0.005 mm)
Texture
Color
Solids density, g/cc
Dry bulk density, g/cc
Field moisture, wt. %
—
74
16
9
1
2.59
0.98
16
!
: _.
37
39
: 17
7
Silty gravel
Black
! 1.45
'• 21-23
a, , , , i
Source: TRW, May 1977.
TABLE 3.11-3.
CHEMICAL PROPERTIES OF
UNION B RETORTED SHALE
Components a,
SiO2
CaO
MgO
A12O3
Fe2O3
Na20
K20
S03
P/"\
o \J c
Mineral C02
Organic C
Nitrogen, Kjeldahl
Ignition loss @ 950°C
Free silica (quartz)
pH of slurry
wt %
31.5
19.6
5.7
6.9
2.8
2.2
1.6
1.9
0.4
22.9
4.3
0.2
26.9
8.0
8.7
Analyses determined by heating
sample to 950°C except for pH
measurement. Analyses by
Union Research Department.
Source: Battelle PNL 3830
187
image:
TABLE 3.11-2. PHYSICAL PROPERTIES OF UNION B SPENT I SHALE
;.After
• compaction
at 12.375
Initial ft. Ibs/cf
Particle size
Percent cobble (1" - 6")
gravel (4.76 mm - 1")
sand (0.074 - 4.76 mm)
silt (0.005 - 0.074 mm)
clay (-0.005 mm)
Texture
Color
Solids density, g/cc
Dry bulk density, g/cc
Field moisture, wt. %
—
74
16
9
1
2.59
0.98
16
!
: _.
37
39
: 17
7
Silty gravel
Black
! 1.45
'• 21-23
a, , , , i
Source: TRW, May 1977.
TABLE 3.11-3.
CHEMICAL PROPERTIES OF
UNION B RETORTED SHALE
Components a,
SiO2
CaO
MgO
A12O3
Fe2O3
Na20
K20
S03
P/"\
o \J c
Mineral C02
Organic C
Nitrogen, Kjeldahl
Ignition loss @ 950°C
Free silica (quartz)
pH of slurry
wt %
31.5
19.6
5.7
6.9
2.8
2.2
1.6
1.9
0.4
22.9
4.3
0.2
26.9
8.0
8.7
Analyses determined by heating
sample to 950°C except for pH
measurement. Analyses by
Union Research Department.
Source: Battelle PNL 3830
187
image:
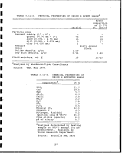 TABLE 3.11-4. ESTIMATED3 COMPOSITION OF UNION B PROCESS WATER
IN THE ACTIVE BASIN AND THE REUSE WATER SUMP
Parameter
Alkalinity (as CaC03
Carbonate ( as C03 )
Bicarbonate ( as HC03 )
Chemical Oxygen Demand
Total Organic Carbon
Total Dissolved Solids
Total Solids
Hardness (as CaC03 )
Ammonia
Sulfides (as H2S)
Phenols
Cyanide ( CN )
Oil & Grease
Sulfate
Sodium
Arsenic
Chromium
pH units
aThese values are maximum
Active
Basin
(mg/1 )
5,800
2,500
1,000
200
50
4,500
4,500
1,100
2
0
10
-
50
3,000
1,500
0
5
8-10
design case
based on preliminary bench-scale
engineering calculations.
Reuse
Water Sump
(mg/1)
2,000
400
1,700
5,500
1,350
2,600
3,100
900
35
100
125
20
1,300
500
1,500
6.5
0.5
8-10
estimates
tests and
Source: Union. Oil, January 1984
188
I
1
I
I
1
1
1
H
I
1
1
1
1
1
1
1
image:
TABLE 3.11-4. ESTIMATED3 COMPOSITION OF UNION B PROCESS WATER
IN THE ACTIVE BASIN AND THE REUSE WATER SUMP
Parameter
Alkalinity (as CaC03
Carbonate ( as C03 )
Bicarbonate ( as HC03 )
Chemical Oxygen Demand
Total Organic Carbon
Total Dissolved Solids
Total Solids
Hardness (as CaC03 )
Ammonia
Sulfides (as H2S)
Phenols
Cyanide ( CN )
Oil & Grease
Sulfate
Sodium
Arsenic
Chromium
pH units
aThese values are maximum
Active
Basin
(mg/1 )
5,800
2,500
1,000
200
50
4,500
4,500
1,100
2
0
10
-
50
3,000
1,500
0
5
8-10
design case
based on preliminary bench-scale
engineering calculations.
Reuse
Water Sump
(mg/1)
2,000
400
1,700
5,500
1,350
2,600
3,100
900
35
100
125
20
1,300
500
1,500
6.5
0.5
8-10
estimates
tests and
Source: Union. Oil, January 1984
188
I
1
I
I
1
1
1
H
I
1
1
1
1
1
1
1
image:
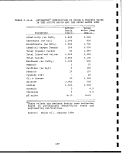 TABLE 3.11-5.
INORGANIC COMPOSITION OF LEACHAT.ES
FROM UNION B SPENT SHALE, mg/L •
Ag
Al
As
B
Ba
Be
Ca
Cd
Cl
CN
Co
cos
Cr
Cu
EC, |jmhos/cm
F
Fe
HC03
Hg
K
Li
Mg
Mn
Mo
Na
Ni
N, Kjeldahl
NH3-N
NOS
N02
Oil and grease
Pb
Phenols
PQ4
s
Se
S04
Sr
TDS
TOC
V
Zn
pH
Particle diameter
Solid- to-liquid ratio, g/mL
Contact time, min
Union, 1979c
<0.02
0.2
0.004
0.68
0.07
<0.01
95
<0.01
<2
<0.01
<0 . 1
0
<0.005
0.02
750
6.1
<0.05
25
0.0005
2.5
0.09
24
0.02
0.4
130
<0.04
0.6
<1. 0
<10
<5
6
<0.05
<1
<10
<0.01
<0.005
570
1.2
800
<1
<0.03
0.02
7.7
_
0.1
5
Cleave et al. , 197'
<0.0009
'' -
OJ001
0.97
O.;078
1 —
;243
0.016
7.0
; —
—
i —
<o.;on
<o.:on
i
H
<OJ025
172
-
;7.4
! —
i 58
<o.:oo7
! -
109
: —
i
'•
' —
| -
-
0.009
f
\
-
<0.|001
878
: —
1,518
11.3
': —
0.025
8.33
1 _
0.1
i 30
Source: Fox, 1983.
189
image:
TABLE 3.11-5.
INORGANIC COMPOSITION OF LEACHAT.ES
FROM UNION B SPENT SHALE, mg/L •
Ag
Al
As
B
Ba
Be
Ca
Cd
Cl
CN
Co
cos
Cr
Cu
EC, |jmhos/cm
F
Fe
HC03
Hg
K
Li
Mg
Mn
Mo
Na
Ni
N, Kjeldahl
NH3-N
NOS
N02
Oil and grease
Pb
Phenols
PQ4
s
Se
S04
Sr
TDS
TOC
V
Zn
pH
Particle diameter
Solid- to-liquid ratio, g/mL
Contact time, min
Union, 1979c
<0.02
0.2
0.004
0.68
0.07
<0.01
95
<0.01
<2
<0.01
<0 . 1
0
<0.005
0.02
750
6.1
<0.05
25
0.0005
2.5
0.09
24
0.02
0.4
130
<0.04
0.6
<1. 0
<10
<5
6
<0.05
<1
<10
<0.01
<0.005
570
1.2
800
<1
<0.03
0.02
7.7
_
0.1
5
Cleave et al. , 197'
<0.0009
'' -
OJ001
0.97
O.;078
1 —
;243
0.016
7.0
; —
—
i —
<o.;on
<o.:on
i
H
<OJ025
172
-
;7.4
! —
i 58
<o.:oo7
! -
109
: —
i
'•
' —
| -
-
0.009
f
\
-
<0.|001
878
: —
1,518
11.3
': —
0.025
8.33
1 _
0.1
i 30
Source: Fox, 1983.
189
image:
 TABLE 3.11-6
Igniti ability
Causes fire through
friction
Oxidation
Corrosivity
a) pH
b) steel corrosion
(in./yr)
Reactivity
Yield gases, vapors
or flames when ex-
posed to water
Yields H2S or HCN
when exposed to pH
2 buffer
Reacts Explosively
(a) when subjected
to burner flame
. RCRA TESTING OF SIMULATED UNION B
OIL SHALE PLANT WASTES
Moistened
UNISULF Retorted shale Maximum Minimum
sulfur plus fines allowed allowed
No No - -
0°F 0°F
12.5 2.0
0.25
No No
No No
No No
(b) when under heated
confinement
EP Toxicity, mg/1
Arsenic
Barium
Cadmium
Lead
Mercury
Selenium
Silver
No No
<0.01 0.07 5.0
0.2 <2.7 100.0
<0.01 <0.01 1.0
<0.05 <0.05 5.0
0.002 <0.0005 0.2
<0.0005 <0.0005 1.0
<0.02 <0.02 5.0
woistened with simulated process water.
Source: Union Oil,
January 1984
190
1
1
1
I
1
1
1
1
1
1
I
1
image:
TABLE 3.11-6
Igniti ability
Causes fire through
friction
Oxidation
Corrosivity
a) pH
b) steel corrosion
(in./yr)
Reactivity
Yield gases, vapors
or flames when ex-
posed to water
Yields H2S or HCN
when exposed to pH
2 buffer
Reacts Explosively
(a) when subjected
to burner flame
. RCRA TESTING OF SIMULATED UNION B
OIL SHALE PLANT WASTES
Moistened
UNISULF Retorted shale Maximum Minimum
sulfur plus fines allowed allowed
No No - -
0°F 0°F
12.5 2.0
0.25
No No
No No
No No
(b) when under heated
confinement
EP Toxicity, mg/1
Arsenic
Barium
Cadmium
Lead
Mercury
Selenium
Silver
No No
<0.01 0.07 5.0
0.2 <2.7 100.0
<0.01 <0.01 1.0
<0.05 <0.05 5.0
0.002 <0.0005 0.2
<0.0005 <0.0005 1.0
<0.02 <0.02 5.0
woistened with simulated process water.
Source: Union Oil,
January 1984
190
1
1
1
I
1
1
1
1
1
1
I
1
image:
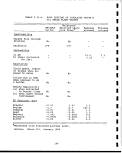 3.12 UNION OIL SGR OIL SHALE RETORTING ',
3.12.1 Retorting Operation !
In early 1977, Union Oil announced a process, that, when
retrofitted to a Retort B prototype unit, would further! improve
the economics of the process by utilizing the residual barbon left
on the spent shale. This process, known as Steam-Gas Recircula-
tion (SGR-3), [DRI, SAI & KSC; 68-03-2795; EPA-600/2-80-205a,
1980], provides for the combustion of the residual carbon in a
separate vessel, thus producing enough hot flue gas to supply all
of the retort heat requirements. This two-vessel SGR-3 process
produces a high BTU (980-BTU/scf) product gas from the retort
vessel while maintaining a high thermal efficiency (83 percent) by
using the residual carbon on the spent shale in the combustor
vessel. Following the removal of C^ plus hydrocarbons and acid
gases from the gas stream, the heating value is reduced; to approx-
imately 800 BTU/scf. This value can be increased to more than
1,000 BTU/scf by methanation. A flow diagram for the process is
shown in Figure 3.12-1. !
Because of the design of the rock pump feed mechanism, all of the
proposed Union Oil processes utilize fairly large shale: fragments
of 2 to 1/8 inches. As in the other vertical kiln typeiprocesses,
very little attrition occurs during the retorting process, and
thus the spent shale fragments leave the retort essentially the
same size as they entered. The spent shale from the direct-heated
Union retorts would be gray in color, having had some of the
residual carbon burned off. The indirect-heated retorts, on the
other hand, would discharge shale still containing the residual
carbon. The SGR-3 process employs a separate spent shale combus-
tor unit. The spent shale from these processes, therefore, would
be light-colored, containing very little residual carbon.
The composition of the product gas from the retort largely depends
on the mode of heating. Indirectly heated retorts like'• the SGR
will produce a high-BTU gas product whereas the product;from
direct-heated retorts will have a low BTU content because of
nitrogen dilution. ;
3.12.2 Solid Wastes [
i •
Nothing is available on this subject. ,
3.12.3 Characteristics of Solid Wastes '-.
--- - •• - •"" • ' —— [
Pertinent data are presented in Tables 3.12-1 to 3.12-10.
191
image:
3.12 UNION OIL SGR OIL SHALE RETORTING ',
3.12.1 Retorting Operation !
In early 1977, Union Oil announced a process, that, when
retrofitted to a Retort B prototype unit, would further! improve
the economics of the process by utilizing the residual barbon left
on the spent shale. This process, known as Steam-Gas Recircula-
tion (SGR-3), [DRI, SAI & KSC; 68-03-2795; EPA-600/2-80-205a,
1980], provides for the combustion of the residual carbon in a
separate vessel, thus producing enough hot flue gas to supply all
of the retort heat requirements. This two-vessel SGR-3 process
produces a high BTU (980-BTU/scf) product gas from the retort
vessel while maintaining a high thermal efficiency (83 percent) by
using the residual carbon on the spent shale in the combustor
vessel. Following the removal of C^ plus hydrocarbons and acid
gases from the gas stream, the heating value is reduced; to approx-
imately 800 BTU/scf. This value can be increased to more than
1,000 BTU/scf by methanation. A flow diagram for the process is
shown in Figure 3.12-1. !
Because of the design of the rock pump feed mechanism, all of the
proposed Union Oil processes utilize fairly large shale: fragments
of 2 to 1/8 inches. As in the other vertical kiln typeiprocesses,
very little attrition occurs during the retorting process, and
thus the spent shale fragments leave the retort essentially the
same size as they entered. The spent shale from the direct-heated
Union retorts would be gray in color, having had some of the
residual carbon burned off. The indirect-heated retorts, on the
other hand, would discharge shale still containing the residual
carbon. The SGR-3 process employs a separate spent shale combus-
tor unit. The spent shale from these processes, therefore, would
be light-colored, containing very little residual carbon.
The composition of the product gas from the retort largely depends
on the mode of heating. Indirectly heated retorts like'• the SGR
will produce a high-BTU gas product whereas the product;from
direct-heated retorts will have a low BTU content because of
nitrogen dilution. ;
3.12.2 Solid Wastes [
i •
Nothing is available on this subject. ,
3.12.3 Characteristics of Solid Wastes '-.
--- - •• - •"" • ' —— [
Pertinent data are presented in Tables 3.12-1 to 3.12-10.
191
image:
 SV9 3XVW
^
— tr
truj
PCD
UJCT
>o
CO
= 5
^^
*!^
j
L/WATER ,
"PARATnO
OV
P*-<
T* /
^ V
;
}r*4—
r.
r
UfO>—4a
<_r
U31VM SSBOOHd
lOnOOBd 110
U31VM dflBMVW
CO
to
CD
0)
P-i
cn
Pi
•H
-M
M O
o oo
•P en
n
O
LO
o
o
CO
•H
O C\]
Pi O
o o
-H v£>
>-i U
fd 0
-H O
Q co
i
Ov]
CO
a>
&
•H
192
I
I
a
1
i
i
I
9
I
i
I
I
I
I
a
i
a
a
a
image:
SV9 3XVW
^
— tr
truj
PCD
UJCT
>o
CO
= 5
^^
*!^
j
L/WATER ,
"PARATnO
OV
P*-<
T* /
^ V
;
}r*4—
r.
r
UfO>—4a
<_r
U31VM SSBOOHd
lOnOOBd 110
U31VM dflBMVW
CO
to
CD
0)
P-i
cn
Pi
•H
-M
M O
o oo
•P en
n
O
LO
o
o
CO
•H
O C\]
Pi O
o o
-H v£>
>-i U
fd 0
-H O
Q co
i
Ov]
CO
a>
&
•H
192
I
I
a
1
i
i
I
9
I
i
I
I
I
I
a
i
a
a
a
image:
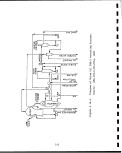 TABLE 3.12-1.
PHYSICAL PROPERTIES OF UNION
SGR SPENT SHALE
Decarbonized Shale
Fresh ;
After
Compaction
at 12j375
Initial ft.lbs/cf
Particle Size:
% Cobble (I11 -
% Gravel (4.76
% Sand (0.074
% Silt (0.005
% Clay (-0.005
6")
mm - 1")
- 4.76 mm)
- 0.074 mm)
mm)
75
16
5
4
1
53
14;
33 ;
Texture
Color
Solids Density, g/cc
Dry Bulk Density, pcf
Silty Gravel
Buff
2.69
68.5
Analyses by Woodward-Clyde Consultants
Source: TRW, May 1977.
TABLE 3.12-2.
PARTICLE SIZE, pH, AND ELECTRICAL
CONDUCTIVITY OF SPENT OIL SHALES
PRODUCED BY UNION SGR RETORTING I
PROCESS :
Process
Union decarbonized
Particles
Size
>2mm <2mm pHa
87 13 11.4
Electrical
Conductivity
(|j mhos/cm)
3
i
1
Electrical conductivity and pH were determined on ai
saturated paste extract prepared from spent shale
particles less than 2mm in size.
Source: Schuman et al., 1976.
193
image:
TABLE 3.12-1.
PHYSICAL PROPERTIES OF UNION
SGR SPENT SHALE
Decarbonized Shale
Fresh ;
After
Compaction
at 12j375
Initial ft.lbs/cf
Particle Size:
% Cobble (I11 -
% Gravel (4.76
% Sand (0.074
% Silt (0.005
% Clay (-0.005
6")
mm - 1")
- 4.76 mm)
- 0.074 mm)
mm)
75
16
5
4
1
53
14;
33 ;
Texture
Color
Solids Density, g/cc
Dry Bulk Density, pcf
Silty Gravel
Buff
2.69
68.5
Analyses by Woodward-Clyde Consultants
Source: TRW, May 1977.
TABLE 3.12-2.
PARTICLE SIZE, pH, AND ELECTRICAL
CONDUCTIVITY OF SPENT OIL SHALES
PRODUCED BY UNION SGR RETORTING I
PROCESS :
Process
Union decarbonized
Particles
Size
>2mm <2mm pHa
87 13 11.4
Electrical
Conductivity
(|j mhos/cm)
3
i
1
Electrical conductivity and pH were determined on ai
saturated paste extract prepared from spent shale
particles less than 2mm in size.
Source: Schuman et al., 1976.
193
image:
 TABLE 3.12-3.
CHEMICAL PROPERTIES OF UNION
SGR RETORTED SHALE
Components
SiO2 39.2
CaO 27.3
MgO 8.2
A12O3 8.9
Fe203 3.8
Na20 3.7
K2O 2.7
S03 1.4
P205 0.5
Mineral C02 3.1
Organic C 0.3
Nitrogen, Kjeldahl
Ignition loss @ 950°C 3.4
Free Silica, quartz 2.5
pH of slurry 12.5
Analyses determined by heating
sample to 950°C except for pH
measurement. Analyses by Union
Research Department. All num-
bers except that for pH are in
weight percent.
Source: Wildung & Zachara, 1980
I
I
I
I
I
I
I
194
I
I
I
I
I
I
I
I
I
I
image:
TABLE 3.12-3.
CHEMICAL PROPERTIES OF UNION
SGR RETORTED SHALE
Components
SiO2 39.2
CaO 27.3
MgO 8.2
A12O3 8.9
Fe203 3.8
Na20 3.7
K2O 2.7
S03 1.4
P205 0.5
Mineral C02 3.1
Organic C 0.3
Nitrogen, Kjeldahl
Ignition loss @ 950°C 3.4
Free Silica, quartz 2.5
pH of slurry 12.5
Analyses determined by heating
sample to 950°C except for pH
measurement. Analyses by Union
Research Department. All num-
bers except that for pH are in
weight percent.
Source: Wildung & Zachara, 1980
I
I
I
I
I
I
I
194
I
I
I
I
I
I
I
I
I
I
image:
 r^
Q
S3 ^3
O H
Q* ff\
fa
fa W
fa EH
O W
^H ^1|
P rH
03 CO
^|
W J
O
fa n
|«J H_{
CO CO
pti Q
o w
tX M
rH 0
i— i ro
< S
cxo
w
S Q
^3 cv*
*^I P5
O
CO CO
EH
<Z* 123
p*^ f*"^
O *-H
P*J jgi
***< I—*
*
<^J<
1
.
1 '
*
CO
w
£— I
PQ
*^
H
(U
i-H
ttJ
CO
Dl
co G
C— -i-
cn Si
rH a
to
O <L
rH 3
to
en
r- C
C-- -H
O** S^
rH O
to
vO U
rH 3
CO
Dl
ViO C]
> -H
rH a
CO
G
o
•H
m P
> re
-H -H
S-i
J-i
r-i
Dl
in G
C-- -H
7^ Si
rH a
CO
rH O 5 CO & O
ro O O rH
rH eg 1-4 o 1-4
rH in s en s «*
rH o o eg
o eg 1-4 o J
S v
in •* 3 «* S m rH
o -H • o ro re
rH \S3 TJ O t-4 .£3
0) CO
a
0!
o
rH o 3 eg S ro J-i
ID -H • o ro <u
o eg T3 o 1-4 >
0) O
a u
rH
•H
<0 CO
in o 3 ^H & en s
• en -H • o eg u
rH eg t5 o 1-4
a) m
a rH
eg o 43 eg s
* co CT^ * o i
o co -H eg ,j
X
^
VO *3* S rH S
eg o o i
o eg j o 1-4
C7
co f.
O^ S-
rH a
CO
r- a
r- s
en s
rH 5
CO
01
r~ G
r- -i-
cn s-i
rH a
CO
^
10 <t
r- I
en E
rH 3
co
&
> -H
en Si
rH a
CO
G
o
-H
in 4->
*"- re
en o
rH -H
Si
Si
M
&
> -H
en Si
rH a
CO
*.
^i O
P -H
-H 4-> re
> re 43
•H OS ^~.
•P Cn
rj r^ K^I
S3 0
U "O TJ -H
jUj ^_t 4*^ T3
o re a t3 rH
<4-l U N S-i !H 0)
m re o re -H
O ^H £ ^C W N ^i
CH ^C O T3 fO
S u -«» Jx rt! 53 -u
Si -H W 4-> G
^ O -H S S <U
rH 4-> 43 G 3 3 S
« U S -H -H -H -H
P 0) U. rH T3 T3 T)
o >-H re o o a)
H W CO CO CO CO
ro ro S rH S *sf '
<* O O ro
r— t-4 O 1-4 rH }
V0 O S CM 5 O
• VD O • O ^*
rH rH i-4 O 1-4 CM '
O
rH !
,
,
in o S ro & i
CM O O rH i
CO rH i-4 O i-4 :
•
I
1
!
r-- co S eg > -3< ,
• -5J1 o • o co
o eg 1-4 o 1-4 ID
rH 1
1
,
1
re ;
m o & ^}< s
o o o ro l
<J3 rH 1-4 O 1-4 (
t
!
e i
CO rO 3 rH &
• vD -H -Oil
f~ ^ t^> ^J r~* .3 !
a
I
i
'-
+ rQ |
• UD O • O 1 ;
i-l J O i-J
,
», i
Ex O i
4-> -H
-H 4-> re
> re 43 :
•H 03 — ,
4-1 Ql .
U 3 0 "^ '
TU Tj "H *•
** f"« 5ni | * ^rt
MH o re a *a rH
IH O N Si Si <i>
o re o re -H j
G rH £ 53 w N !»
G re o T3 re '
3 U ---, >i rt! 53 4->
Ji -H W 4-> G
Si O *H ga g flj
« U S -H -H -H -H i
P 0) 12. rH T3 T3 T3
o i— i re o o o)
H w co co cn co
^
o
rH
03
-H
g
rH
W
-H
+->
1
^"
en
rH
-S
re
0)
rH
o
n3
£N
3
o
MH
0)
Si •
(1) (/]
S T3
•H
M r— 1
P O
G w
<u
P O)
re >
O> rH O
si o co
P w en
0} rH
(U -H
W T3 -
0) i— 1
43 r-i re
P re
4-1 P
GOO)
O P
WHO
Si O Si
O Si Si
4-J M-H d)
U 53
rH <D
rH P ••
o re aj
a) P 3
43 U O
H W W
re 43
195
image:
r^
Q
S3 ^3
O H
Q* ff\
fa
fa W
fa EH
O W
^H ^1|
P rH
03 CO
^|
W J
O
fa n
|«J H_{
CO CO
pti Q
o w
tX M
rH 0
i— i ro
< S
cxo
w
S Q
^3 cv*
*^I P5
O
CO CO
EH
<Z* 123
p*^ f*"^
O *-H
P*J jgi
***< I—*
*
<^J<
1
.
1 '
*
CO
w
£— I
PQ
*^
H
(U
i-H
ttJ
CO
Dl
co G
C— -i-
cn Si
rH a
to
O <L
rH 3
to
en
r- C
C-- -H
O** S^
rH O
to
vO U
rH 3
CO
Dl
ViO C]
> -H
rH a
CO
G
o
•H
m P
> re
-H -H
S-i
J-i
r-i
Dl
in G
C-- -H
7^ Si
rH a
CO
rH O 5 CO & O
ro O O rH
rH eg 1-4 o 1-4
rH in s en s «*
rH o o eg
o eg 1-4 o J
S v
in •* 3 «* S m rH
o -H • o ro re
rH \S3 TJ O t-4 .£3
0) CO
a
0!
o
rH o 3 eg S ro J-i
ID -H • o ro <u
o eg T3 o 1-4 >
0) O
a u
rH
•H
<0 CO
in o 3 ^H & en s
• en -H • o eg u
rH eg t5 o 1-4
a) m
a rH
eg o 43 eg s
* co CT^ * o i
o co -H eg ,j
X
^
VO *3* S rH S
eg o o i
o eg j o 1-4
C7
co f.
O^ S-
rH a
CO
r- a
r- s
en s
rH 5
CO
01
r~ G
r- -i-
cn s-i
rH a
CO
^
10 <t
r- I
en E
rH 3
co
&
> -H
en Si
rH a
CO
G
o
-H
in 4->
*"- re
en o
rH -H
Si
Si
M
&
> -H
en Si
rH a
CO
*.
^i O
P -H
-H 4-> re
> re 43
•H OS ^~.
•P Cn
rj r^ K^I
S3 0
U "O TJ -H
jUj ^_t 4*^ T3
o re a t3 rH
<4-l U N S-i !H 0)
m re o re -H
O ^H £ ^C W N ^i
CH ^C O T3 fO
S u -«» Jx rt! 53 -u
Si -H W 4-> G
^ O -H S S <U
rH 4-> 43 G 3 3 S
« U S -H -H -H -H
P 0) U. rH T3 T3 T)
o >-H re o o a)
H W CO CO CO CO
ro ro S rH S *sf '
<* O O ro
r— t-4 O 1-4 rH }
V0 O S CM 5 O
• VD O • O ^*
rH rH i-4 O 1-4 CM '
O
rH !
,
,
in o S ro & i
CM O O rH i
CO rH i-4 O i-4 :
•
I
1
!
r-- co S eg > -3< ,
• -5J1 o • o co
o eg 1-4 o 1-4 ID
rH 1
1
,
1
re ;
m o & ^}< s
o o o ro l
<J3 rH 1-4 O 1-4 (
t
!
e i
CO rO 3 rH &
• vD -H -Oil
f~ ^ t^> ^J r~* .3 !
a
I
i
'-
+ rQ |
• UD O • O 1 ;
i-l J O i-J
,
», i
Ex O i
4-> -H
-H 4-> re
> re 43 :
•H 03 — ,
4-1 Ql .
U 3 0 "^ '
TU Tj "H *•
** f"« 5ni | * ^rt
MH o re a *a rH
IH O N Si Si <i>
o re o re -H j
G rH £ 53 w N !»
G re o T3 re '
3 U ---, >i rt! 53 4->
Ji -H W 4-> G
Si O *H ga g flj
« U S -H -H -H -H i
P 0) 12. rH T3 T3 T3
o i— i re o o o)
H w co co cn co
^
o
rH
03
-H
g
rH
W
-H
+->
1
^"
en
rH
-S
re
0)
rH
o
n3
£N
3
o
MH
0)
Si •
(1) (/]
S T3
•H
M r— 1
P O
G w
<u
P O)
re >
O> rH O
si o co
P w en
0} rH
(U -H
W T3 -
0) i— 1
43 r-i re
P re
4-1 P
GOO)
O P
WHO
Si O Si
O Si Si
4-J M-H d)
U 53
rH <D
rH P ••
o re aj
a) P 3
43 U O
H W W
re 43
195
image:
 TABLE 3.12-5. WATER
QUALITY OF
SGR DECARBONIZED
1975
1976
Irrigation Spring
Total Percolate, cm 0.6
Electrical Conductivity,
jjmhos/cm 7 , 352
Salinity Hazard Very
High
Sodium Adsorption Ratio 72.5
Sodium Hazard High
pH 9.1
3.7+
9,400
Very
High
99.5
High
12.1
PERCOLATE FROM
SHALE
1976
Summer
0.1
7,770
Very
High
74.1
High
9.5
UNION
LYSIMETERS
1977
Spring
0.1
3,573
Very
High
58.5
High
9.5
1977
Summer
0.1
3,700
Very
High
60.2
High
10.6
1978
Spring
7.3
10,000
Very
High
115.6
High
11.8
1
1
1
1
1
e
i
n
Source: Herron et al., 1980 •
I
196
I
I
I
I
I
I
I
image:
TABLE 3.12-5. WATER
QUALITY OF
SGR DECARBONIZED
1975
1976
Irrigation Spring
Total Percolate, cm 0.6
Electrical Conductivity,
jjmhos/cm 7 , 352
Salinity Hazard Very
High
Sodium Adsorption Ratio 72.5
Sodium Hazard High
pH 9.1
3.7+
9,400
Very
High
99.5
High
12.1
PERCOLATE FROM
SHALE
1976
Summer
0.1
7,770
Very
High
74.1
High
9.5
UNION
LYSIMETERS
1977
Spring
0.1
3,573
Very
High
58.5
High
9.5
1977
Summer
0.1
3,700
Very
High
60.2
High
10.6
1978
Spring
7.3
10,000
Very
High
115.6
High
11.8
1
1
1
1
1
e
i
n
Source: Herron et al., 1980 •
I
196
I
I
I
I
I
I
I
image:
 TABLE 3.12-6. ANALYSIS OF SPRING SNOWMELT RUNOFF AND !PERCOLATE
FROM UNION SGR DECARBONIZED SHALE LYSIMETER STUDY.
APRIL 21,1976
Lysimeter number
Total runoff on percolate
(liters/plot)
EC pmhos/cm
@ 25°C
PH
Suspended solids, ppm
Dissolved solids, ppm
Settleable solids, ml/L
Na , ppm
Ca, ppm
Mg, ppm
K , ppm
Cl , ppm
S04 , ppm
CO3 , ppm
HC03 , ppm
P04, ppm
NO3, ppm
As , ppm
SAR
Runoff
4
143.8
260
7.7
8.0
152.0
0.1
10.0
13.7
15.7
3.6
17.5
44.0
0
77.6
0.7
0.5
0.005
0.43
samples
5
132.5
320
7.9
2.6
174.0
0.1
11.0
16.3
19.5
4.2
7.5
61.0
0
77.4
0.8
7.9
0.005
0.43
Percolate
4
280.1+
8,000
12.0
14.7
3,382
0.1;
1,050
19.3
2.7
170.0
37.5
271.0;
1,154.0;
236.0!
1.6:
2.5!
0.35:
i
60.4
samples
5
382.3+
10,800
12.2
11.3
3 , 922
0.1
1,480
8.6
0.0
210.0
65.0
625.0
1,065.0
487.0
0.6
11 ..4
0.31
138. .6
Source: Herron, et al, 1980
197
image:
TABLE 3.12-6. ANALYSIS OF SPRING SNOWMELT RUNOFF AND !PERCOLATE
FROM UNION SGR DECARBONIZED SHALE LYSIMETER STUDY.
APRIL 21,1976
Lysimeter number
Total runoff on percolate
(liters/plot)
EC pmhos/cm
@ 25°C
PH
Suspended solids, ppm
Dissolved solids, ppm
Settleable solids, ml/L
Na , ppm
Ca, ppm
Mg, ppm
K , ppm
Cl , ppm
S04 , ppm
CO3 , ppm
HC03 , ppm
P04, ppm
NO3, ppm
As , ppm
SAR
Runoff
4
143.8
260
7.7
8.0
152.0
0.1
10.0
13.7
15.7
3.6
17.5
44.0
0
77.6
0.7
0.5
0.005
0.43
samples
5
132.5
320
7.9
2.6
174.0
0.1
11.0
16.3
19.5
4.2
7.5
61.0
0
77.4
0.8
7.9
0.005
0.43
Percolate
4
280.1+
8,000
12.0
14.7
3,382
0.1;
1,050
19.3
2.7
170.0
37.5
271.0;
1,154.0;
236.0!
1.6:
2.5!
0.35:
i
60.4
samples
5
382.3+
10,800
12.2
11.3
3 , 922
0.1
1,480
8.6
0.0
210.0
65.0
625.0
1,065.0
487.0
0.6
11 ..4
0.31
138. .6
Source: Herron, et al, 1980
197
image:
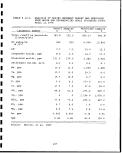 I
TABLE 3.12-7. ANALYSIS OF RUNOFF AND PERCOLATE SAMPLES
COLLECTED AUGUST 5, 1976 FROM UNION SGR
DECARBONIZED SHALE LYSIMETER STUDY
1
Runoff samples
Lysimeter number
Total runoff on percolate
(liters/plot)
EC p mhos/cm
@ 25°C
pH
Suspended solids, ppm
Dissolved solids, ppm
Settleable solids, ml/L
Na , ppm
Ca , ppm
Mg, ppm
K, ppm
Cl , ppm
SO4, ppm
C03/ ppm
HC03 , ppm
N03/ ppm
P04/ ppm
As , ppm
SAR
aNo runoff.
No percolate.
Source: Herron, et al,
4
3.5
260
7.2
1,452.0
216.0
13.0
0.21
1.79
0.87
3.3
7.5
25.6
0
109.0
3.2
1.2
0.001
0.18
1980
198
5
0
_a
_a
_a
_a
_a
_a
_a
_a
_a
-a
_a
—
_a
_a
_a
Percolate
4
0
7,700
_b
_b
_b
_b
_b
_b
_b
_b
-b
_b
Jo
b
_b
-b
_b
samples
5
8.0
460
9.5
190.0
6,628.0
5.5
85.2
2.64
0
470.0
5.0
835.0
782.0
3,489.0
7.2
1.9
0.49
74.1
I
1
tmm
1
I
•
1
1
I
1
1
1
1
1
1
image:
I
TABLE 3.12-7. ANALYSIS OF RUNOFF AND PERCOLATE SAMPLES
COLLECTED AUGUST 5, 1976 FROM UNION SGR
DECARBONIZED SHALE LYSIMETER STUDY
1
Runoff samples
Lysimeter number
Total runoff on percolate
(liters/plot)
EC p mhos/cm
@ 25°C
pH
Suspended solids, ppm
Dissolved solids, ppm
Settleable solids, ml/L
Na , ppm
Ca , ppm
Mg, ppm
K, ppm
Cl , ppm
SO4, ppm
C03/ ppm
HC03 , ppm
N03/ ppm
P04/ ppm
As , ppm
SAR
aNo runoff.
No percolate.
Source: Herron, et al,
4
3.5
260
7.2
1,452.0
216.0
13.0
0.21
1.79
0.87
3.3
7.5
25.6
0
109.0
3.2
1.2
0.001
0.18
1980
198
5
0
_a
_a
_a
_a
_a
_a
_a
_a
_a
-a
_a
—
_a
_a
_a
Percolate
4
0
7,700
_b
_b
_b
_b
_b
_b
_b
_b
-b
_b
Jo
b
_b
-b
_b
samples
5
8.0
460
9.5
190.0
6,628.0
5.5
85.2
2.64
0
470.0
5.0
835.0
782.0
3,489.0
7.2
1.9
0.49
74.1
I
1
tmm
1
I
•
1
1
I
1
1
1
1
1
1
image:
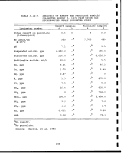 TABLE 3.12-8. ANALYSIS OF SPRING SNOWMELT RUNOFF; AND
PERCOLATE FROM UNION SGR DECARBONIZED
SHALE LYSIMETER STUDY. MARCH 30, 1977
1
^B
1
1
1
1
1
1
1
1"
1
1
Lysimeter number
Total runoff on percolate
(liters/plot)
EC p mhos/cm
@ 25°C
pH
Suspended solids, ppm
Dissolved solids, ppm
Settleable solids, ml/L
Na , ppm
Ca, ppm
Mg, ppm
K, ppm
Cl, ppm
SO4 , ppm
C03, ppm
HC03 , ppm
PO4, ppm
N03, ppm
As , ppm
SAR
aThis reading is felt to
verses dissolved solids,
678 |j mhos/cm.
Source: Herron, et al,
Runoff samples
4 5
132.5
530
6.75
2.25
346
<0.1
19.4
29.12
28.52
17.6
10.0
190
0.0
81.2
0.54
8.62
<0.001
0.62
be in error
143.8
3,500a
6.9
4.75
496
<0.1
11.8
48.25
66
10.1
10
294
0.0
91.03
0.34
17.51
<0.001
0.26
Using
this reading should
1980
199
Percolate
4 '
6.1:
|
3,150:
9.05i
67.33
2,454!
1.61
'910!
19.13
3.0
i
258
5.0J
6631
90.6
1,690
1.78
!
22.18i
0 . 16
50.9
a regress ion
samples
5
17.8
4,000
10.0
40.88
2,792
0.4
875
8.3
3.0
274
24
1,080
266
1,329
1.0
10.41
0.14
66.1
Of EC
be approximately
image:
TABLE 3.12-8. ANALYSIS OF SPRING SNOWMELT RUNOFF; AND
PERCOLATE FROM UNION SGR DECARBONIZED
SHALE LYSIMETER STUDY. MARCH 30, 1977
1
^B
1
1
1
1
1
1
1
1"
1
1
Lysimeter number
Total runoff on percolate
(liters/plot)
EC p mhos/cm
@ 25°C
pH
Suspended solids, ppm
Dissolved solids, ppm
Settleable solids, ml/L
Na , ppm
Ca, ppm
Mg, ppm
K, ppm
Cl, ppm
SO4 , ppm
C03, ppm
HC03 , ppm
PO4, ppm
N03, ppm
As , ppm
SAR
aThis reading is felt to
verses dissolved solids,
678 |j mhos/cm.
Source: Herron, et al,
Runoff samples
4 5
132.5
530
6.75
2.25
346
<0.1
19.4
29.12
28.52
17.6
10.0
190
0.0
81.2
0.54
8.62
<0.001
0.62
be in error
143.8
3,500a
6.9
4.75
496
<0.1
11.8
48.25
66
10.1
10
294
0.0
91.03
0.34
17.51
<0.001
0.26
Using
this reading should
1980
199
Percolate
4 '
6.1:
|
3,150:
9.05i
67.33
2,454!
1.61
'910!
19.13
3.0
i
258
5.0J
6631
90.6
1,690
1.78
!
22.18i
0 . 16
50.9
a regress ion
samples
5
17.8
4,000
10.0
40.88
2,792
0.4
875
8.3
3.0
274
24
1,080
266
1,329
1.0
10.41
0.14
66.1
Of EC
be approximately
image:
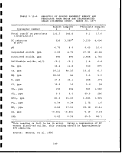 1
1
TABLE 3.12-9. ANALYSIS OF RUNOFF AND PERCOLATE SAMPLES
COLLECTED AUGUST 30, 1977 FROM UNION
DECARBONIZED SHALE LYSIMETER STUDY
Lysimeter number
Total runoff on percolate
(liters/plot)
EC pmhos/cm
@ 25°C
pH
Suspended solids, ppm
Dissolved solids, ppm
Settleable solids, ml/L
Na , ppm
Ca, ppm
Mg, ppm
K, ppm
Cl , ppm
304 , ppm
C03 , ppm
HC03 , ppm
P04, ppm
N03, ppm
As , ppm
SAR
Source: Herron, et al, 1980
Runoff samples Percolate
45 4
4.5 0 0
215
7.0
2,080
158
6.3
4.8
16.41
6.21
6.0
5.0
10.9
0.0
98.45
6.56
1 . 32
< 0.001
0.87
200
SGR
samples
5
11.3
3,700
10.6
50.8
5,878
0.2
1,870
3.12
45.52
590
17.5
1,090
1,006
4,329
1.99
37.84
0.122
60.2
1
1
I
1
I
•
1
1
1
1
1
•
1
1
1
image:
1
1
TABLE 3.12-9. ANALYSIS OF RUNOFF AND PERCOLATE SAMPLES
COLLECTED AUGUST 30, 1977 FROM UNION
DECARBONIZED SHALE LYSIMETER STUDY
Lysimeter number
Total runoff on percolate
(liters/plot)
EC pmhos/cm
@ 25°C
pH
Suspended solids, ppm
Dissolved solids, ppm
Settleable solids, ml/L
Na , ppm
Ca, ppm
Mg, ppm
K, ppm
Cl , ppm
304 , ppm
C03 , ppm
HC03 , ppm
P04, ppm
N03, ppm
As , ppm
SAR
Source: Herron, et al, 1980
Runoff samples Percolate
45 4
4.5 0 0
215
7.0
2,080
158
6.3
4.8
16.41
6.21
6.0
5.0
10.9
0.0
98.45
6.56
1 . 32
< 0.001
0.87
200
SGR
samples
5
11.3
3,700
10.6
50.8
5,878
0.2
1,870
3.12
45.52
590
17.5
1,090
1,006
4,329
1.99
37.84
0.122
60.2
1
1
I
1
I
•
1
1
1
1
1
•
1
1
1
image:
 TABLE 3.12-10. ANALYSIS OF SPRING SNOWMELT, RUNOFF;, AND
PERCOLATE FROM UNION SGR DECARBONIZED
SHALE LYSIMETER STUDY. MAY 3, 1978'
1
Lysimeter number
Total runoff 'on percolate
(liters/plot)
EC |j mhos/cm
@ 25°C
pH
Suspended solids, ppm
Dissolved solids, ppm
Settleable solids, ml/L
Na , ppm
Ca, ppm
Mg, ppm
K, ppm
Cl , ppm
SO4 , ppm
CO3, ppm
HCOs , ppm
P04, ppm
N03 , ppm
As , ppm
SAR
Runoff
4
46.0
230
7.4
9.4
124
0.1
4.95
15.3
15.3
33.8
33.6
47.8
0.0
84.27
0.21
0.14
0.0
0.21
samples
5
155.2
230
8.5
3.10
140
<0.1
7.9
23.37
14.62
3.9
2.8
90.5
5.97
62.6
0.20
1.37
0.0
0.32
Percolate
4 ;
10.0 ;
7,100 ;
11.5 '
4,798 '•
l
754.9 ;
<0.1 :
1,200 i
25.5 ;
8.1 ;
380 ;
8.8 1
1,870 !
212 :
1,083 i
0.81 '
3.72 |
0.40 :
53.0
samples
5
3.6
12,900
12.5
5 , 032
549.2
<0.1
1,430
3.4
0.90
510
29.4
1,662
985
1,083
0.84
4.10
1.28
178.1
Source: Herron, et al, 1980
201
image:
TABLE 3.12-10. ANALYSIS OF SPRING SNOWMELT, RUNOFF;, AND
PERCOLATE FROM UNION SGR DECARBONIZED
SHALE LYSIMETER STUDY. MAY 3, 1978'
1
Lysimeter number
Total runoff 'on percolate
(liters/plot)
EC |j mhos/cm
@ 25°C
pH
Suspended solids, ppm
Dissolved solids, ppm
Settleable solids, ml/L
Na , ppm
Ca, ppm
Mg, ppm
K, ppm
Cl , ppm
SO4 , ppm
CO3, ppm
HCOs , ppm
P04, ppm
N03 , ppm
As , ppm
SAR
Runoff
4
46.0
230
7.4
9.4
124
0.1
4.95
15.3
15.3
33.8
33.6
47.8
0.0
84.27
0.21
0.14
0.0
0.21
samples
5
155.2
230
8.5
3.10
140
<0.1
7.9
23.37
14.62
3.9
2.8
90.5
5.97
62.6
0.20
1.37
0.0
0.32
Percolate
4 ;
10.0 ;
7,100 ;
11.5 '
4,798 '•
l
754.9 ;
<0.1 :
1,200 i
25.5 ;
8.1 ;
380 ;
8.8 1
1,870 !
212 :
1,083 i
0.81 '
3.72 |
0.40 :
53.0
samples
5
3.6
12,900
12.5
5 , 032
549.2
<0.1
1,430
3.4
0.90
510
29.4
1,662
985
1,083
0.84
4.10
1.28
178.1
Source: Herron, et al, 1980
201
image:
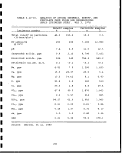 I
3.13 CHEVRON STB OIL SHALE RETORTING •
3.13.1 Retorting Operation •
Details of Chevron's retorting technology have not been revealed,
but a recent U.S. Patent to Chevron, No. 4,199,432 entitled •
"Staged Turbulent Bed Retorting Process" may give some insight •
into the process [DRI, SAI and KSC, 68-03-2795].
The Staged Turbulent Bed (STB) Retort is a small-particle I
retorting process in which retorted shale is burned in a separate •
combustor and recycled to the retort to supply the process heat
requirement. The flow scheme for the core of the process is •
shown schematically in Figure 3.13-1 [Tamm et al., May 1981]. |
The environment in the retort section can best be described as a n
staged, moving bed of particles, in which a portion of the parti- •
cles are "fluidized." Solids move downward through the retort
with an average velocity of 2-5 ft/min. Proprietary internals
within the retort restrict mixing in the vertical dimension and •
thereby produce "staging" of the solids flow. The "staging" •
gives an approach to plug flow for the solids and thereby
improves the stripping action of the countercurrent gas flow and H
minimizes the residence time required to assure complete retort- I
ing. Locally, conditions within the bed have all the appearances
of fluidized state, although the superficial gas velocity is far „
below the minimum fluidization velocity of many of the particles. I
Rapid local mixing and a high rate of heat transfer keep the *
temperature profile in the retort very nearly isothermal.
The retort can be operated with a stripping gas consisting of I
either recycled product gas, steam, or an inert gas. The super-
ficial gas velocity at the bottom of the retort is within the range m
of 1-5 ft/sec. The volumetric flow of gas in the retort increases I
significantly in going from the bottom to the top because of the
vapor traffic added by the pyrolysis products.
The combination of thermal shock experienced by the fresh shale on •
entering the retort, removal of the binding kerogen, and the tur-
bulent conditions within the retort causes some breakup of the •
shale. The finest particles (<200 mesh) are swept overhead from U
the retort with the product vapors. Most of the elutriated parti-
cles are recovered from the vapor stream before condensation of «
the oil. The recovered particles, collected by primary and I
secondary devices, contain carbonaceous residue; and they are, *
therefore, sent to the combustor section for recovery of their
fuel value. •
In the product recovery section, the product vapors are condensed
in_ stages producing several oil fractions and foul water. The •
initial condensation stage has to be capable of handling some H
I
202
I
image:
I
3.13 CHEVRON STB OIL SHALE RETORTING •
3.13.1 Retorting Operation •
Details of Chevron's retorting technology have not been revealed,
but a recent U.S. Patent to Chevron, No. 4,199,432 entitled •
"Staged Turbulent Bed Retorting Process" may give some insight •
into the process [DRI, SAI and KSC, 68-03-2795].
The Staged Turbulent Bed (STB) Retort is a small-particle I
retorting process in which retorted shale is burned in a separate •
combustor and recycled to the retort to supply the process heat
requirement. The flow scheme for the core of the process is •
shown schematically in Figure 3.13-1 [Tamm et al., May 1981]. |
The environment in the retort section can best be described as a n
staged, moving bed of particles, in which a portion of the parti- •
cles are "fluidized." Solids move downward through the retort
with an average velocity of 2-5 ft/min. Proprietary internals
within the retort restrict mixing in the vertical dimension and •
thereby produce "staging" of the solids flow. The "staging" •
gives an approach to plug flow for the solids and thereby
improves the stripping action of the countercurrent gas flow and H
minimizes the residence time required to assure complete retort- I
ing. Locally, conditions within the bed have all the appearances
of fluidized state, although the superficial gas velocity is far „
below the minimum fluidization velocity of many of the particles. I
Rapid local mixing and a high rate of heat transfer keep the *
temperature profile in the retort very nearly isothermal.
The retort can be operated with a stripping gas consisting of I
either recycled product gas, steam, or an inert gas. The super-
ficial gas velocity at the bottom of the retort is within the range m
of 1-5 ft/sec. The volumetric flow of gas in the retort increases I
significantly in going from the bottom to the top because of the
vapor traffic added by the pyrolysis products.
The combination of thermal shock experienced by the fresh shale on •
entering the retort, removal of the binding kerogen, and the tur-
bulent conditions within the retort causes some breakup of the •
shale. The finest particles (<200 mesh) are swept overhead from U
the retort with the product vapors. Most of the elutriated parti-
cles are recovered from the vapor stream before condensation of «
the oil. The recovered particles, collected by primary and I
secondary devices, contain carbonaceous residue; and they are, *
therefore, sent to the combustor section for recovery of their
fuel value. •
In the product recovery section, the product vapors are condensed
in_ stages producing several oil fractions and foul water. The •
initial condensation stage has to be capable of handling some H
I
202
I
image:
 -p
M
O
-P
13
CO
I
0)
43
u
(A
O
rH
MH
to
W
0)
U
O
H
CM
rH
I
CO
rH
•
00
M
&
•H
00
cr>
ns
a)
0)
U
o
CO
203
image:
-p
M
O
-P
13
CO
I
0)
43
u
(A
O
rH
MH
to
W
0)
U
O
H
CM
rH
I
CO
rH
•
00
M
&
•H
00
cr>
ns
a)
0)
U
o
CO
203
image:
 I
solids, as the fines removal equipment is never 100% efficient.
The noncondensable gases are either produced directly or a portion m
is recycled to the retort for stripping. With very lean shales, •
some or all of the product gas can be used as a supplemental fuel *
in the combustor.
The combustion section receives coarse retorted shale withdrawn I
from the bottom of the retort and retorted shale fines removed
from the product vapors. Air injected at the bottom of the com- n
bustor both transports the shale pneumatically and combusts the I
carbonaceous residue. The temperature of the solids rises rapid
ly. At the outlet of the combustor, a solids separator splits the _
stream once again into fine and coarse fractions. Most of the I
hot, coarse fraction is recycled to the retort to provide the •
necessary process heat. The excess coarse shale is sent on to the
heat recovery section, from which it eventually discharges as net •
coarse spent shale. The fine fraction exits the separator with |
the flue gas. This stream is also sent to the heat recovery sec-
tion where it is cooled and then separated into a net fine spent m
shale stream and a flue gas stream. The SO content of the flue I
gas is claimed to be unusually low (<20 ppm)Because of the scrub-
bing action of the shale itself.
Nominal operating conditions for the process are summarized in •
Table 3.13-1. The fresh shale throughput for this process is
5-10 times that of most other retorting processes. The use of •
small shale particles, the excellent heat transfer conditions in I
the retort, and the "staging" effect in the retort make the resi-
dence time required for complete retorting quite low. The m
extremely low residence time required in the combustor is a conse- I
quence of the high reactivity of the carbonaceous residue. •
The STB Retorting Process has been tested by Chevron Research in •
several pilot units including a one-ton/day integrated pilot I
plant. In 1984 Chevron commenced testing at a 350 ton/day semi-
works plant in Salt Lake City in Utah. Figure 3.12-2 is a simpli- «
fied block flow diagram for the semiworks facility adjacent to •
Chevron's Salt Lake refinery. The oil shale feed for the semi-
works unit is obtained from the Chevron property in Piceance basin _.
in Colorado. •
3.13.2 Solid Wastes
In the retorting process, the spent shale produced is a hot dry |
powder. Treated process water will be used to moisten the spent
shale. The moistened spent shale leaving the pugmill will have •
between 10 and 25% water on a dry basis. •
According to Chevron's Final Environmental Impact Statement [BLM,
September 1983], wastewater generated from the process plant and 9
ancillary facilities would include effluent from the oil separ- "
ation unit, cooling tower and boiler blowdown, clarifier sludge,
I
204
I
image:
I
solids, as the fines removal equipment is never 100% efficient.
The noncondensable gases are either produced directly or a portion m
is recycled to the retort for stripping. With very lean shales, •
some or all of the product gas can be used as a supplemental fuel *
in the combustor.
The combustion section receives coarse retorted shale withdrawn I
from the bottom of the retort and retorted shale fines removed
from the product vapors. Air injected at the bottom of the com- n
bustor both transports the shale pneumatically and combusts the I
carbonaceous residue. The temperature of the solids rises rapid
ly. At the outlet of the combustor, a solids separator splits the _
stream once again into fine and coarse fractions. Most of the I
hot, coarse fraction is recycled to the retort to provide the •
necessary process heat. The excess coarse shale is sent on to the
heat recovery section, from which it eventually discharges as net •
coarse spent shale. The fine fraction exits the separator with |
the flue gas. This stream is also sent to the heat recovery sec-
tion where it is cooled and then separated into a net fine spent m
shale stream and a flue gas stream. The SO content of the flue I
gas is claimed to be unusually low (<20 ppm)Because of the scrub-
bing action of the shale itself.
Nominal operating conditions for the process are summarized in •
Table 3.13-1. The fresh shale throughput for this process is
5-10 times that of most other retorting processes. The use of •
small shale particles, the excellent heat transfer conditions in I
the retort, and the "staging" effect in the retort make the resi-
dence time required for complete retorting quite low. The m
extremely low residence time required in the combustor is a conse- I
quence of the high reactivity of the carbonaceous residue. •
The STB Retorting Process has been tested by Chevron Research in •
several pilot units including a one-ton/day integrated pilot I
plant. In 1984 Chevron commenced testing at a 350 ton/day semi-
works plant in Salt Lake City in Utah. Figure 3.12-2 is a simpli- «
fied block flow diagram for the semiworks facility adjacent to •
Chevron's Salt Lake refinery. The oil shale feed for the semi-
works unit is obtained from the Chevron property in Piceance basin _.
in Colorado. •
3.13.2 Solid Wastes
In the retorting process, the spent shale produced is a hot dry |
powder. Treated process water will be used to moisten the spent
shale. The moistened spent shale leaving the pugmill will have •
between 10 and 25% water on a dry basis. •
According to Chevron's Final Environmental Impact Statement [BLM,
September 1983], wastewater generated from the process plant and 9
ancillary facilities would include effluent from the oil separ- "
ation unit, cooling tower and boiler blowdown, clarifier sludge,
I
204
I
image:
 TABLE 3.13-1. NOMINAL PROCESS OPERATING CONDITIONS
FOR THE CHEVRON STB RETORT
Fresh Shale Throughput 2000-5000 Lb/hr/ft2: Retort
Retort Temperature 890-950°F
1
Retort Residence Time 2-8 Min. •
i
Stripping Gas Velocity 1-5 Ft/Sec.
Combustor Residence Time 1-5 Sec. !
Combustor Outlet Temperature 1100-1500°F ;
Recycle Shale Ratio 2:1 to 5:1
Source: Tamm et al., May 1981
205
image:
TABLE 3.13-1. NOMINAL PROCESS OPERATING CONDITIONS
FOR THE CHEVRON STB RETORT
Fresh Shale Throughput 2000-5000 Lb/hr/ft2: Retort
Retort Temperature 890-950°F
1
Retort Residence Time 2-8 Min. •
i
Stripping Gas Velocity 1-5 Ft/Sec.
Combustor Residence Time 1-5 Sec. !
Combustor Outlet Temperature 1100-1500°F ;
Recycle Shale Ratio 2:1 to 5:1
Source: Tamm et al., May 1981
205
image:
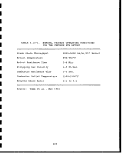 3 K . T * g
S * T&K 1
= £ £ o *
g «*
|l
W «J
c tsi
11
•s «s
t c «•
~ -si* S
QC C £ "Sj
«"•§ - |
S ^ &
•J
kn
£
0-
1
6- s g- 21
*•«= s
K -»W =S
^ £s *^
!
si « <
£ E K •-
„. f r S-f
si It
= 3 ^3
8.
^ B
£• i| 1?
R - • v. S S-s.
0 — t ^
* «*
i
S s
^ r .. . 5
? *t Is "~t~
I"-5 s "".^t
* a^ 5 s ._ §
I sl -^ 1 t
•« f JS =:
,'. | es1 —
ll 2
2 - 1
. 1
„ 5 |
S-.'S .•,."
l'I "
fil
§*" &
* £
.. ••
I
t
n
i
3
;
1
t/i
£.
i/t
^ =
n_-
J S"^ E
£uS£
(ti
i-t
P.
0>
rH
fO
£3
CO
•H
O
to
O
•H
I
W
I
u
o co
cr>
ffl
•H
TJ
•s
o
rH
PQ
I U
CO 5-4
CO
&
•H
206
I
I
I
I
I
I
I
I
I
I
I
I
I
I
I
I
I
I
I
image:
3 K . T * g
S * T&K 1
= £ £ o *
g «*
|l
W «J
c tsi
11
•s «s
t c «•
~ -si* S
QC C £ "Sj
«"•§ - |
S ^ &
•J
kn
£
0-
1
6- s g- 21
*•«= s
K -»W =S
^ £s *^
!
si « <
£ E K •-
„. f r S-f
si It
= 3 ^3
8.
^ B
£• i| 1?
R - • v. S S-s.
0 — t ^
* «*
i
S s
^ r .. . 5
? *t Is "~t~
I"-5 s "".^t
* a^ 5 s ._ §
I sl -^ 1 t
•« f JS =:
,'. | es1 —
ll 2
2 - 1
. 1
„ 5 |
S-.'S .•,."
l'I "
fil
§*" &
* £
.. ••
I
t
n
i
3
;
1
t/i
£.
i/t
^ =
n_-
J S"^ E
£uS£
(ti
i-t
P.
0>
rH
fO
£3
CO
•H
O
to
O
•H
I
W
I
u
o co
cr>
ffl
•H
TJ
•s
o
rH
PQ
I U
CO 5-4
CO
&
•H
206
I
I
I
I
I
I
I
I
I
I
I
I
I
I
I
I
I
I
I
image:
 filtration backwash, demineralizer waste, wash waters' from boiler
feedwater treatment, sour water from retort and upgrading facili-
ties, and sanitary wastewater. All collected waters would be sent
through the water treatment system before being used for spent
shale conditioning. i
3.13.3 Characteristics of Solid Wastes ,
The chemical and physical properties of the spent shale [Chevron,
May 1981] are presented in Table 3.13-2. The information was
generated during process development tests using Anvil Point Oil
Shale. It is anticipated that the spent shale produced using
shale from the Chevron property will have similar i properties.
Calcite and feldspars comprise approximately one-half of the
shale, depending on the feed source. The physical properties of
the spent shale, important in the disposal, are primarily a
function of moisture content though degree of compaction and
curing are factors. Permeability, dry density and; unconfined
compressive strength data are also presented in the foregoing
Table. The chemical and physical data shown are characteristic
of the material to be disposed. The results of leachate testing
conducted on spent shale samples from the Clear Creek Shale Oil
Project are presented in Table 3.13.3. '.
207
image:
filtration backwash, demineralizer waste, wash waters' from boiler
feedwater treatment, sour water from retort and upgrading facili-
ties, and sanitary wastewater. All collected waters would be sent
through the water treatment system before being used for spent
shale conditioning. i
3.13.3 Characteristics of Solid Wastes ,
The chemical and physical properties of the spent shale [Chevron,
May 1981] are presented in Table 3.13-2. The information was
generated during process development tests using Anvil Point Oil
Shale. It is anticipated that the spent shale produced using
shale from the Chevron property will have similar i properties.
Calcite and feldspars comprise approximately one-half of the
shale, depending on the feed source. The physical properties of
the spent shale, important in the disposal, are primarily a
function of moisture content though degree of compaction and
curing are factors. Permeability, dry density and; unconfined
compressive strength data are also presented in the foregoing
Table. The chemical and physical data shown are characteristic
of the material to be disposed. The results of leachate testing
conducted on spent shale samples from the Clear Creek Shale Oil
Project are presented in Table 3.13.3. '.
207
image:
 1
CO
W
rH
FH
s
r?
fJ-4
O
erf
F^-l
m
W
H-i
CO
H
W
CO
EH
^S5
il
1—4
PM
EH
O
i *]
M
fM
yVl
tu
E"H
CO
S3
^J
CtJ
>>•>
fr*\
rr"i
o
CO
EH
t>
CO
jjM
»H
*?
Si
J*5i
M
^g
Ji
r4
fjj
PH
P_[
0«1
1
CO
r*i
*
CO
s
po
*"C
EH
u
0)
TJ rH
ru re
C -C
re
4J
C
0)
H
CJ
rH
re
LI
S
•rt
a
0)
4->
re
.§
£cj
o
LI
1
4J
W
H
4-J
•H
U
•H
0
H
OH
W
•^
£j
CJ
OS
0) U
4J
(0 4-J
•H C
O 0)
U
O rO
0)
W 4-J
0) U
•H re
4-J a
OJ O
ft U
° _-
Li t3
PH G
In o\°
"**•»•, *?J* C"*" ^^
XI w 04 CT> in
1 jj ^*| ^Jf
i re
-P Q
m IH 0\°
r> CM in o
ro rH o> o
cs
rH
XI
D>
(U
4-1
<D
CO W
4-J M
4-J [ti 0)
IW 4-1 O -H
<U (3 - U W
O >< ft
OJ CJ 4-1 T3
> <1) -H 0) *
•H E «J W C X!
4-J -H Li G -H 4J
CJ 4-J 3 0) 4-t C7i
re 4J T) G G
ft (!) W O CJ
g Li -H >i U Li
O 3 O Li G 4-1
CJ CJ S Q & CO
^
4-J
•H
rH
-H
•9
OJ
g
OJ
f-: ••
1 4-J
0 C
rH OJ
4-J •
o G <y
4-> O g
U -H
CM 4-1
1 OJ
O Li 0)
rH 3 Ll
•M 3
g U CJ
0 -H
iVi O 'w
MH g C
re
w G
<u o -
en 4J
G t7> Li
re G o
Li -H U-l
4-i aj
-H ft <1>
rH 0) >
•H t3 -H
re o u
aj 0) rB
E w ft
Li ---. E
Q) g O
PH U U
S
G
•H
G
(U
CO
•H
O
OJ
OJ
m
0\°
g
<L>
LD o m in oo m u
rH rH CM CM rH rd
E-i
SV1
re
rH
3
O
G
O
rH -H
re 4-J
LI re
<u c
it
flj
*rt
O co Xi E
w o « o
JTf CO CM ^^^
1 -H x—, o
<0 CO CO H-
O rH O O
CMriJ CJ CO
co re co co
CM rH p^! O C7^ CO
O t£ -O g O rH
•rH (o ^Ct re re C7> ie£
CO 13 ^-^ CJ CJ S X
u (u
N 0) Ll 0) M
4-J c re <u 4-1 re
S U OT -H E U 4-J
3 rH Tl U O -rl -H
CX « rH rH rH Li rH
i c <u re o a) rH
re TO b cj o P-I n
OJ
M 4-J
G re
QJ S
E
5-* £3
•H Li O
3 0 T>
<u re
Li SI
re
g -a
CJ O
Ctf G
t 1
rH
CO
CJ
§ i
y-^ tf f— P- S ^ ffi pg
§ -H 3 3 § '3 3 i3
pj^jgpig^g^s
•H (0 "H -H -H (0 -H -H
(Q n3 (B ro* (0 rd
a gaaa ess
aft g g g ft g g
O. O. Q! O( J|jj
o o
i i i i i i i i
W re PO Li XI C7* QJ CT1
rtraucjp.Kco*!
WWCOWWU3WW
flJflJ(l)(D(l)<D<UflJ
CrOtOCOtrQCrOtrQtrOlA
cowwwwcncnw
^C^pHpHpHp-ipMPn
4-J
c
O)
G
0
CJ
g
XI
Ll
re
CJ
u
:H
c
re
tr
Ll
o
0\°
4_)
rH
C
re
4-J
in
(U
«
OJ
CJ
$_i
3
O
C/2
•o
<u
M-4
x:
•H
£&
t7
>
rH
rH •
•rH **~^
^ ~ '
0) tfl
4J 4-> W
C! -M (U
«J Li CJ
4-J <U 0
d fcyl t .
O G CU
u <a
rH ^ H
re co
Li On
<u g <u
a o
'w a
•H
• G
C 0 T3
O -H <U
-H 4J G
4-1 3 OJ rH
CJ 4-> 4-J CO
re -H w cr>
Li 4-> -H rH
U-l W O
*4H Xt g ^*
TJ w <u a
rH XI
« 0) rH G'
Ll (H rH O
1 -H Li
X! «J S >
g <u
>i O OJ X!
XI W rH O
re
to w x!
-H S3 W
(fl -H 0)
>i re 4-J u
rH 4-1 C Ll
re G <u 3
GO ft O
S cj co co
re xi u
208
I
I
I
I
I
I
I
I
I
I
I
I
1
I
I
I
image:
1
CO
W
rH
FH
s
r?
fJ-4
O
erf
F^-l
m
W
H-i
CO
H
W
CO
EH
^S5
il
1—4
PM
EH
O
i *]
M
fM
yVl
tu
E"H
CO
S3
^J
CtJ
>>•>
fr*\
rr"i
o
CO
EH
t>
CO
jjM
»H
*?
Si
J*5i
M
^g
Ji
r4
fjj
PH
P_[
0«1
1
CO
r*i
*
CO
s
po
*"C
EH
u
0)
TJ rH
ru re
C -C
re
4J
C
0)
H
CJ
rH
re
LI
S
•rt
a
0)
4->
re
.§
£cj
o
LI
1
4J
W
H
4-J
•H
U
•H
0
H
OH
W
•^
£j
CJ
OS
0) U
4J
(0 4-J
•H C
O 0)
U
O rO
0)
W 4-J
0) U
•H re
4-J a
OJ O
ft U
° _-
Li t3
PH G
In o\°
"**•»•, *?J* C"*" ^^
XI w 04 CT> in
1 jj ^*| ^Jf
i re
-P Q
m IH 0\°
r> CM in o
ro rH o> o
cs
rH
XI
D>
(U
4-1
<D
CO W
4-J M
4-J [ti 0)
IW 4-1 O -H
<U (3 - U W
O >< ft
OJ CJ 4-1 T3
> <1) -H 0) *
•H E «J W C X!
4-J -H Li G -H 4J
CJ 4-J 3 0) 4-t C7i
re 4J T) G G
ft (!) W O CJ
g Li -H >i U Li
O 3 O Li G 4-1
CJ CJ S Q & CO
^
4-J
•H
rH
-H
•9
OJ
g
OJ
f-: ••
1 4-J
0 C
rH OJ
4-J •
o G <y
4-> O g
U -H
CM 4-1
1 OJ
O Li 0)
rH 3 Ll
•M 3
g U CJ
0 -H
iVi O 'w
MH g C
re
w G
<u o -
en 4J
G t7> Li
re G o
Li -H U-l
4-i aj
-H ft <1>
rH 0) >
•H t3 -H
re o u
aj 0) rB
E w ft
Li ---. E
Q) g O
PH U U
S
G
•H
G
(U
CO
•H
O
OJ
OJ
m
0\°
g
<L>
LD o m in oo m u
rH rH CM CM rH rd
E-i
SV1
re
rH
3
O
G
O
rH -H
re 4-J
LI re
<u c
it
flj
*rt
O co Xi E
w o « o
JTf CO CM ^^^
1 -H x—, o
<0 CO CO H-
O rH O O
CMriJ CJ CO
co re co co
CM rH p^! O C7^ CO
O t£ -O g O rH
•rH (o ^Ct re re C7> ie£
CO 13 ^-^ CJ CJ S X
u (u
N 0) Ll 0) M
4-J c re <u 4-1 re
S U OT -H E U 4-J
3 rH Tl U O -rl -H
CX « rH rH rH Li rH
i c <u re o a) rH
re TO b cj o P-I n
OJ
M 4-J
G re
QJ S
E
5-* £3
•H Li O
3 0 T>
<u re
Li SI
re
g -a
CJ O
Ctf G
t 1
rH
CO
CJ
§ i
y-^ tf f— P- S ^ ffi pg
§ -H 3 3 § '3 3 i3
pj^jgpig^g^s
•H (0 "H -H -H (0 -H -H
(Q n3 (B ro* (0 rd
a gaaa ess
aft g g g ft g g
O. O. Q! O( J|jj
o o
i i i i i i i i
W re PO Li XI C7* QJ CT1
rtraucjp.Kco*!
WWCOWWU3WW
flJflJ(l)(D(l)<D<UflJ
CrOtOCOtrQCrOtrQtrOlA
cowwwwcncnw
^C^pHpHpHp-ipMPn
4-J
c
O)
G
0
CJ
g
XI
Ll
re
CJ
u
:H
c
re
tr
Ll
o
0\°
4_)
rH
C
re
4-J
in
(U
«
OJ
CJ
$_i
3
O
C/2
•o
<u
M-4
x:
•H
£&
t7
>
rH
rH •
•rH **~^
^ ~ '
0) tfl
4J 4-> W
C! -M (U
«J Li CJ
4-J <U 0
d fcyl t .
O G CU
u <a
rH ^ H
re co
Li On
<u g <u
a o
'w a
•H
• G
C 0 T3
O -H <U
-H 4J G
4-1 3 OJ rH
CJ 4-> 4-J CO
re -H w cr>
Li 4-> -H rH
U-l W O
*4H Xt g ^*
TJ w <u a
rH XI
« 0) rH G'
Ll (H rH O
1 -H Li
X! «J S >
g <u
>i O OJ X!
XI W rH O
re
to w x!
-H S3 W
(fl -H 0)
>i re 4-J u
rH 4-1 C Ll
re G <u 3
GO ft O
S cj co co
re xi u
208
I
I
I
I
I
I
I
I
I
I
I
I
1
I
I
I
image:
 I
I
I
I
I
I
I
I
I
I
I
I
I
I
I
I
I
I
I
TABLE 3.13-3. CHEVRON STB SPE
,
Sulfur Species
H?S (Hydrogen Sulfide)
Thiol
Sulfate
Thiosulfate
CN (Cyanide)
Nitrogen
NH3 (Nitrate)
Metals
Antimony
Arsenic
Barium
Beryllium
Boron
Cadmium
Chromium
Copper
Iron
Lead
. tfercury
Nickel
Potassium
Sodium
Seilenium
Silver
Thallium
Zinc
General Water Quality
BOD (Biochemical Oxygen demand)
COD (Chemical Oxygen demand)
TDS (Total dissolved solids)
TSS (Total suspended solids)
O and G (oil and grasses)
Chloride
Calcium/as CaC03
Magnesium/as MgC03
Hardness
CO2 (Carbon dioxide)
pH
Organics
TOG (Total organic carbon)
Phenol
aA=E'irst 1280 ml collected (1 pore
bB=Third 1280 ml
°ND-Not detected, below detection
Source: BLM, September 1983
%
NT SHALE LEACH TEST
Run 45 Aa
3.5
30
3,250
140
1
415
0.03
0.03
0.2
0.01
3.2
0.03
0.02
0.05
0.1
0.12
1 ppb
0.08
NA
1,700
0.03
0.02
0.1
0.14
500
1,100
10,900
14
12
17
85/212
0.06/0.24
212
26
10.9
660
18
volume )
limits
RESULTS
Run 45 Bb
:
1.1
4.2
1,133
21
4.5
37
0.03
0.01
0.3
0.01
1.9
0.03
0.02
0.03
0.1
0.05
1 ppb
0.04
NA
84
0.02
0.01
0.1
0.01
80
120
4,120
15
12
5.5
180/450
0 . 12/048
450
6
10.8
230
209
image:
I
I
I
I
I
I
I
I
I
I
I
I
I
I
I
I
I
I
I
TABLE 3.13-3. CHEVRON STB SPE
,
Sulfur Species
H?S (Hydrogen Sulfide)
Thiol
Sulfate
Thiosulfate
CN (Cyanide)
Nitrogen
NH3 (Nitrate)
Metals
Antimony
Arsenic
Barium
Beryllium
Boron
Cadmium
Chromium
Copper
Iron
Lead
. tfercury
Nickel
Potassium
Sodium
Seilenium
Silver
Thallium
Zinc
General Water Quality
BOD (Biochemical Oxygen demand)
COD (Chemical Oxygen demand)
TDS (Total dissolved solids)
TSS (Total suspended solids)
O and G (oil and grasses)
Chloride
Calcium/as CaC03
Magnesium/as MgC03
Hardness
CO2 (Carbon dioxide)
pH
Organics
TOG (Total organic carbon)
Phenol
aA=E'irst 1280 ml collected (1 pore
bB=Third 1280 ml
°ND-Not detected, below detection
Source: BLM, September 1983
%
NT SHALE LEACH TEST
Run 45 Aa
3.5
30
3,250
140
1
415
0.03
0.03
0.2
0.01
3.2
0.03
0.02
0.05
0.1
0.12
1 ppb
0.08
NA
1,700
0.03
0.02
0.1
0.14
500
1,100
10,900
14
12
17
85/212
0.06/0.24
212
26
10.9
660
18
volume )
limits
RESULTS
Run 45 Bb
:
1.1
4.2
1,133
21
4.5
37
0.03
0.01
0.3
0.01
1.9
0.03
0.02
0.03
0.1
0.05
1 ppb
0.04
NA
84
0.02
0.01
0.1
0.01
80
120
4,120
15
12
5.5
180/450
0 . 12/048
450
6
10.8
230
209
image:
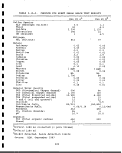 3.14 ALLIS-CHALMERS OIL SHALE RETORTING
3.14.1 Roller Grate Retorting Operation
I
I
I
The Allis-Chalmers approach [Faulkner et al, 1983] to the retort-
ing of oil shale is shown in Figure 3.14-1. This is only one of H
many possible flowsheets that may be used depending on the shale I
grade and type. Raw shale with a size distribution of 1-3/4" x
1/4" enters the Preheat Zone after a minimum amount of crushing
and screening. Minus 1/4" material generated in the crushing •
circuit is agglomerated and fed on top of the crushed material. •
The shale is conveyed by a series of closely spaced, slotted
rollers rotating in the same direction. Beds up to three feet •
deep are used. H
In the Preheating Zone the shale is heated by the off-gas from «
the adjacent first retorting zone. In addition to heating the •
shale, the energy in the gas is recovered and the light oils B
contained in the gas stream are condensed.
After preheating, the shale is conveyed to the first retorting B
zone where recycled noncondensible retort gases with a temperature
in the range of 900-1000°F are induced down through the bed of a
shale and through the slotted rollers. In this zone and in the |
Preheat Zone, the oils driven off and condensed will be lighter
and more heavily hydrogenated than the oils driven off in the _
following zone. u
Upon exiting Retorting I, the partially retorted shale enters
the second retorting zone where a 1200°F on-gas of recycled non- H
condensible retort gases is used to complete the retorting. In H
this zone, the heavier and less highly hydrogenated oils are
evolved. At the exit of the zone, the gases are directed to Heat a
Exchanger I where the heat is recovered and the oils condensed. H
When retorting is complete, the shale is conveyed through a seal-
ing zone to the Combustion Zone. In the sealing zone, solid •
rollers are used to help the underbed windboxes to prevent mixing •
of the two atmospheres. The most difficult area to seal is at the
top of the bed. This is accomplished by using hinged drag plates •
at the entrance and exit of the Sealing Zone and by maintaining |
equal overbed pressures. In the combustion zone, the residual
carbon and hydrogen are combusted with ambient air to recover g
energy for driving the retorting process. Contrary to the pro- •
ceeding three zones, air flows up through the rollers and exits *
from the top of the bed. By doing this, the mechanical elements
are not exposed to the hot off-gas and a low temperature fan is fl
used to blow ambient air through the bed. I
After removal of the thermal energy in the Combustion Zone, the n
shale proceeds to the Cooling I Zone where the shale is cooled and g
its sensible heat is recovered by an ambient air stream. Final
210
I
I
image:
3.14 ALLIS-CHALMERS OIL SHALE RETORTING
3.14.1 Roller Grate Retorting Operation
I
I
I
The Allis-Chalmers approach [Faulkner et al, 1983] to the retort-
ing of oil shale is shown in Figure 3.14-1. This is only one of H
many possible flowsheets that may be used depending on the shale I
grade and type. Raw shale with a size distribution of 1-3/4" x
1/4" enters the Preheat Zone after a minimum amount of crushing
and screening. Minus 1/4" material generated in the crushing •
circuit is agglomerated and fed on top of the crushed material. •
The shale is conveyed by a series of closely spaced, slotted
rollers rotating in the same direction. Beds up to three feet •
deep are used. H
In the Preheating Zone the shale is heated by the off-gas from «
the adjacent first retorting zone. In addition to heating the •
shale, the energy in the gas is recovered and the light oils B
contained in the gas stream are condensed.
After preheating, the shale is conveyed to the first retorting B
zone where recycled noncondensible retort gases with a temperature
in the range of 900-1000°F are induced down through the bed of a
shale and through the slotted rollers. In this zone and in the |
Preheat Zone, the oils driven off and condensed will be lighter
and more heavily hydrogenated than the oils driven off in the _
following zone. u
Upon exiting Retorting I, the partially retorted shale enters
the second retorting zone where a 1200°F on-gas of recycled non- H
condensible retort gases is used to complete the retorting. In H
this zone, the heavier and less highly hydrogenated oils are
evolved. At the exit of the zone, the gases are directed to Heat a
Exchanger I where the heat is recovered and the oils condensed. H
When retorting is complete, the shale is conveyed through a seal-
ing zone to the Combustion Zone. In the sealing zone, solid •
rollers are used to help the underbed windboxes to prevent mixing •
of the two atmospheres. The most difficult area to seal is at the
top of the bed. This is accomplished by using hinged drag plates •
at the entrance and exit of the Sealing Zone and by maintaining |
equal overbed pressures. In the combustion zone, the residual
carbon and hydrogen are combusted with ambient air to recover g
energy for driving the retorting process. Contrary to the pro- •
ceeding three zones, air flows up through the rollers and exits *
from the top of the bed. By doing this, the mechanical elements
are not exposed to the hot off-gas and a low temperature fan is fl
used to blow ambient air through the bed. I
After removal of the thermal energy in the Combustion Zone, the n
shale proceeds to the Cooling I Zone where the shale is cooled and g
its sensible heat is recovered by an ambient air stream. Final
210
I
I
image:
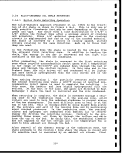 cooling of the shale to an acceptable discharge temperature is
performed in the Cooling II Zone also with ambient air.
The hot off-gas streams from the Combustion and Codling I Zones
are combined and sent to Heat Exchanger II where the heat is
transferred to the recycled retort gases used in the retorting
zones. Depending on the grade of shale and its carbonate content;
a portion of the retort gases generated may need to [be combusted
to achieve adequate heat transfer in the second heat exchanger. A
portion of the reheated retort gases coming from HeatiExchanger II
are sent directly to Retorting II. The remainder is'blended with
the reheated retort gases from Heat Exchanger I and1 are used as
the on-gas for Retorting I. I
Commercial Roller Grate Retort modules have been designed with a
raw shale capacity of 20,000 TPD which results in; the need of
only three such modules in parallel to produce 43,000 BPD of oil
from a 30 GPT shale. Such a device would have an active width of
15 teet and a working length of 500 feet.
The size of the raw feed shale is a trade-off between !the benefits
of a small shale size and costs associated with obtaining that
size and disposing of the fine shale. The Allis-Chalmers process
uses the largest size that can be efficiently processed. Under-
size material that results from the crushing operation can be
agglomerated into flakes and fed directly to the top ;of the shale
bed. Tests have confirmed that these agglomerates maintain their
integrity throughout the entire retorting and combustion process.
The rollers used to convey the bed of shale give it relative
motion along with causing a natural size segregatidn to occur
The relative motion keeps exposing fresh shale surface and allows
tne theoretical heat transfer potential to be achieved. Fines
carried in with the feed quickly migrate to the bottoh of the bed
and fall into the underbed windbox. This prevents pockets of
fines from forming and causing gas channeling. Natural size segra-
tion puts the larger particles on top and the smaller on the bottom
o± the bed. Thus .the downdraft retorting gases give the largest
thermal driving force to the particles that need ifc the most.
For any process to reach its maximum efficiency, the residual
carbon and hydrogen in the retorted shale must be utilized. The
energy contained in these components amounts to 10-15% of the
energy in the raw shale. In the Allis-Chalmers process ambJent
air alone is used to combust the residual carbon and hydrogen.
The excess air to the Combustion zone along with the moderating
effect of the calcination reaction prevent unacceptable tempera-
tures from being reached. In the case of a very high! grade shale
with a higher level of residual carbon and hydrogen, ^a tempering
gas such as recycled heat exchanger II off-gas can be used. The
retorting gases used in the Roller Grate Retorting Process are the
recycled gases generated from the decomposition of the kerogen.
211
image:
cooling of the shale to an acceptable discharge temperature is
performed in the Cooling II Zone also with ambient air.
The hot off-gas streams from the Combustion and Codling I Zones
are combined and sent to Heat Exchanger II where the heat is
transferred to the recycled retort gases used in the retorting
zones. Depending on the grade of shale and its carbonate content;
a portion of the retort gases generated may need to [be combusted
to achieve adequate heat transfer in the second heat exchanger. A
portion of the reheated retort gases coming from HeatiExchanger II
are sent directly to Retorting II. The remainder is'blended with
the reheated retort gases from Heat Exchanger I and1 are used as
the on-gas for Retorting I. I
Commercial Roller Grate Retort modules have been designed with a
raw shale capacity of 20,000 TPD which results in; the need of
only three such modules in parallel to produce 43,000 BPD of oil
from a 30 GPT shale. Such a device would have an active width of
15 teet and a working length of 500 feet.
The size of the raw feed shale is a trade-off between !the benefits
of a small shale size and costs associated with obtaining that
size and disposing of the fine shale. The Allis-Chalmers process
uses the largest size that can be efficiently processed. Under-
size material that results from the crushing operation can be
agglomerated into flakes and fed directly to the top ;of the shale
bed. Tests have confirmed that these agglomerates maintain their
integrity throughout the entire retorting and combustion process.
The rollers used to convey the bed of shale give it relative
motion along with causing a natural size segregatidn to occur
The relative motion keeps exposing fresh shale surface and allows
tne theoretical heat transfer potential to be achieved. Fines
carried in with the feed quickly migrate to the bottoh of the bed
and fall into the underbed windbox. This prevents pockets of
fines from forming and causing gas channeling. Natural size segra-
tion puts the larger particles on top and the smaller on the bottom
o± the bed. Thus .the downdraft retorting gases give the largest
thermal driving force to the particles that need ifc the most.
For any process to reach its maximum efficiency, the residual
carbon and hydrogen in the retorted shale must be utilized. The
energy contained in these components amounts to 10-15% of the
energy in the raw shale. In the Allis-Chalmers process ambJent
air alone is used to combust the residual carbon and hydrogen.
The excess air to the Combustion zone along with the moderating
effect of the calcination reaction prevent unacceptable tempera-
tures from being reached. In the case of a very high! grade shale
with a higher level of residual carbon and hydrogen, ^a tempering
gas such as recycled heat exchanger II off-gas can be used. The
retorting gases used in the Roller Grate Retorting Process are the
recycled gases generated from the decomposition of the kerogen.
211
image:
 Tests have shown that the fully combusted and cooled shale exiting
the Allis-Chalmers Process still maintains its integrity. Fines
generated in processing represent a small fraction of the total
feed. Residual carbon in the combusted shale is less than 1%.
A Roller Grate Process Development Unit was designed and built.
This unit is capable of processing charge weights up to 1500 Ibs
with bed depth up to 21 inches. It is designed to simulate the
process from raw shale to fully combusted spent shale. A
schematic of the entire system is shown in Figure 3.14-2.
Table 3.14-1 depicts results for a typical test starting with raw
shale continuing through retorting and combustion and ending with
fully processed and cooled spent shale. During a test less than
0.2% of the raw shale was carried out of the retort as dust. A
relatively small 1.1% of the shale reported to the windbox as
fines. Size analysis comparison between the raw and fully com-
busted shale showed that there was very little size degradation
during processing. Agglomerated fines also maintained their
integrity after retorting and combustion.
It should, however, be emphasized that studies by Allis-Chalmers
have been limited to process development unit (PDU) bench scale,
batch equipment only. The system has not been tested in any con-
tinuous retorts; the 500 TPD and 60,000 TPD units have not been
built and operated. Also no demonstration units have been built
or operated.
3.14.2 Solid Wastes
There is no information on this subject.
3.14.3 Characteristics of Solid Wastes
There is no information on this subject.
I
I
1
I
I
I
I
1
I
1
212
I
1
1
image:
Tests have shown that the fully combusted and cooled shale exiting
the Allis-Chalmers Process still maintains its integrity. Fines
generated in processing represent a small fraction of the total
feed. Residual carbon in the combusted shale is less than 1%.
A Roller Grate Process Development Unit was designed and built.
This unit is capable of processing charge weights up to 1500 Ibs
with bed depth up to 21 inches. It is designed to simulate the
process from raw shale to fully combusted spent shale. A
schematic of the entire system is shown in Figure 3.14-2.
Table 3.14-1 depicts results for a typical test starting with raw
shale continuing through retorting and combustion and ending with
fully processed and cooled spent shale. During a test less than
0.2% of the raw shale was carried out of the retort as dust. A
relatively small 1.1% of the shale reported to the windbox as
fines. Size analysis comparison between the raw and fully com-
busted shale showed that there was very little size degradation
during processing. Agglomerated fines also maintained their
integrity after retorting and combustion.
It should, however, be emphasized that studies by Allis-Chalmers
have been limited to process development unit (PDU) bench scale,
batch equipment only. The system has not been tested in any con-
tinuous retorts; the 500 TPD and 60,000 TPD units have not been
built and operated. Also no demonstration units have been built
or operated.
3.14.2 Solid Wastes
There is no information on this subject.
3.14.3 Characteristics of Solid Wastes
There is no information on this subject.
I
I
1
I
I
I
I
1
I
1
212
I
1
1
image:
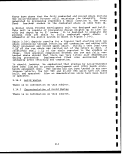 m
rH O-H
<; co co
rH
I
ro
Q)
O
J3
u
• m ,Q to
•P d>
Q) T3 CO M
O Q) C7> P^
.G -P G
0) C-H CO
£ -H T! a)
O J-l (U C!
rH Oj Q) -rl
&-, CD o s;
# o
CO — M "4-1
co &4 o
Q) CO
U 00 g rH
O <Ti 3 O
SH rH -H
ft CQ
- O
d) • pi CO
rH rH g
fC fd ^ O
& CO ^
CO -P rtf
Q) a rj
rH rH O
•H M ftf rH
O (UJ5 O
C C/J CJ
CQ >;
M rH rH m
0) S-iH O
g jOO
G
J5 O
-P -rH
cj •• f4 co
I 0) <U CD
CQ CJ 0)
•H rj -P
rH
-H
g
SH
Q)
UJ
213
image:
m
rH O-H
<; co co
rH
I
ro
Q)
O
J3
u
• m ,Q to
•P d>
Q) T3 CO M
O Q) C7> P^
.G -P G
0) C-H CO
£ -H T! a)
O J-l (U C!
rH Oj Q) -rl
&-, CD o s;
# o
CO — M "4-1
co &4 o
Q) CO
U 00 g rH
O <Ti 3 O
SH rH -H
ft CQ
- O
d) • pi CO
rH rH g
fC fd ^ O
& CO ^
CO -P rtf
Q) a rj
rH rH O
•H M ftf rH
O (UJ5 O
C C/J CJ
CQ >;
M rH rH m
0) S-iH O
g jOO
G
J5 O
-P -rH
cj •• f4 co
I 0) <U CD
CQ CJ 0)
•H rj -P
rH
-H
g
SH
Q)
UJ
213
image:
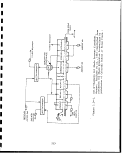 if
2S
T
J
N
1 {!*
1
i
1
JL
XoJ
x
mi
> II
II
^ —
+**
*--^
1 T-€>
T'lj
5j|ss .•
i?:i£ii|.
inn
"TTT
CD H •
w nj w
o> i 01
O -P O 0)
O 0) M M
(-1 ft ft
CU g 01
C C! 3 <D
o X-H a
•H i-) 01 -H
-P 3 O S
01 (d ft
e
O
O
O
O
(D <1J
OH
5-1 (0
^^ O
O CO 03
CO
•H «
-P O
M -H
O -P
-P (d
(0 g
« <U
X!
0) O
H CO
td
co 6
•-I
pti
•H
o
CQ
•H
0)
g -P
rH P!
(d OJ
X! g
o
W r-l
•H Q) 00
rH > 00
rH <D 0\
<; Q H
CN
I
ro
0)
M
3
di
•H
O td
& O
-P H
G O
Q) CJ
0)
I 1 tj_l
X O
•H
CO G
O
O W
M 01
l[l >(_1
g
d) cu
-p ft
Q) 01
I
1
1
I
I
214
I
I
I
I
I
I
I
I
I
I
image:
if
2S
T
J
N
1 {!*
1
i
1
JL
XoJ
x
mi
> II
II
^ —
+**
*--^
1 T-€>
T'lj
5j|ss .•
i?:i£ii|.
inn
"TTT
CD H •
w nj w
o> i 01
O -P O 0)
O 0) M M
(-1 ft ft
CU g 01
C C! 3 <D
o X-H a
•H i-) 01 -H
-P 3 O S
01 (d ft
e
O
O
O
O
(D <1J
OH
5-1 (0
^^ O
O CO 03
CO
•H «
-P O
M -H
O -P
-P (d
(0 g
« <U
X!
0) O
H CO
td
co 6
•-I
pti
•H
o
CQ
•H
0)
g -P
rH P!
(d OJ
X! g
o
W r-l
•H Q) 00
rH > 00
rH <D 0\
<; Q H
CN
I
ro
0)
M
3
di
•H
O td
& O
-P H
G O
Q) CJ
0)
I 1 tj_l
X O
•H
CO G
O
O W
M 01
l[l >(_1
g
d) cu
-p ft
Q) 01
I
1
1
I
I
214
I
I
I
I
I
I
I
I
I
I
image:
 TABLE 3.14-1.
Basis:
ALLIS-CHALMERS WESTERN SHALE TESTS
100 kg dry raw shale i
Total
Carbon
Sulfur
IN
Dry raw shale
100.0
11.7
1.33
OUT
Residual solids
Windbox fines
Cyclone fines
Dry gas produced
Water produced
Oil produced
Co2 calcined in retorting
C02 calcined in combustion
Carbon combusted
Sulfur combusted
TOTAL
74.2
1.1
0.2
2.1
1.5
9.9
1.2
8.0
1.8
0.01
100.0
0.5
_
-
1.1
-
8.3
-
-
1.8
—
11.7
0.90
—
-
0.35
-
0.10
-
-
-
0.01
1.33
Oil produced: 100% of Fischer assay.
""organic removal: 97% of initial kerogen
Source: Faulkner et al., 1983
215
image:
TABLE 3.14-1.
Basis:
ALLIS-CHALMERS WESTERN SHALE TESTS
100 kg dry raw shale i
Total
Carbon
Sulfur
IN
Dry raw shale
100.0
11.7
1.33
OUT
Residual solids
Windbox fines
Cyclone fines
Dry gas produced
Water produced
Oil produced
Co2 calcined in retorting
C02 calcined in combustion
Carbon combusted
Sulfur combusted
TOTAL
74.2
1.1
0.2
2.1
1.5
9.9
1.2
8.0
1.8
0.01
100.0
0.5
_
-
1.1
-
8.3
-
-
1.8
—
11.7
0.90
—
-
0.35
-
0.10
-
-
-
0.01
1.33
Oil produced: 100% of Fischer assay.
""organic removal: 97% of initial kerogen
Source: Faulkner et al., 1983
215
image:
 3.15 DRAVO OIL SHALE RETORTING
3.15.1 Retorting Operation
In the _ Dravo Retorting Process [Forbes & Kinsey, 1981] the raw
shale is retorted on a traveling grate (Figure 3.15-1). The
retorting section is divided into three parts: an initial heat-up
zone; the burning of residual carbon; and initial cooling of re-
torted shale. The shale is then cooled for disposal. Off-gases
from the retorting and cooling sections, after cooling and oil
recovery, are reused in the process as heat carriers. Excess, or
by-product gas, is bled from the system as necessary.
Dravo Traveling Grate Oil Shale Retorting Process
Figure 3.15-1. Dravo Retorting Process
Source: Forbes & Kinsey, 1981
During retorting there is no relative movement between particles
where abrasion could degrade the particles and disrupt the pro-
cess . _ Free water can be removed from the shale concurrently with
retorting or in a separate zone ahead of the retorting zone, if
necessary.
The heating value and quantity of byproduct gas are principally
determined by the amount and purity of oxygen added, the effi-
ciency of processing, and the amount of kerogen in the shale. A
heating value of 100-110 BTU/SCF is indicated in this process for
28 GPT Western oil shale. The ultimate use of air or oxy-
gen would depend on an economic evaluation.
The weight of spent shale for a 28 GPT Colorado shale would be 83%
of the shale charged to the grate. Less than 10% of the carbonate
is calcined and about half the carbon is burned out. Disposal
problems are not unique.
216
I
I
1
1
1
1
I
I
1
I
1
I
1
I
I
I
I
image:
3.15 DRAVO OIL SHALE RETORTING
3.15.1 Retorting Operation
In the _ Dravo Retorting Process [Forbes & Kinsey, 1981] the raw
shale is retorted on a traveling grate (Figure 3.15-1). The
retorting section is divided into three parts: an initial heat-up
zone; the burning of residual carbon; and initial cooling of re-
torted shale. The shale is then cooled for disposal. Off-gases
from the retorting and cooling sections, after cooling and oil
recovery, are reused in the process as heat carriers. Excess, or
by-product gas, is bled from the system as necessary.
Dravo Traveling Grate Oil Shale Retorting Process
Figure 3.15-1. Dravo Retorting Process
Source: Forbes & Kinsey, 1981
During retorting there is no relative movement between particles
where abrasion could degrade the particles and disrupt the pro-
cess . _ Free water can be removed from the shale concurrently with
retorting or in a separate zone ahead of the retorting zone, if
necessary.
The heating value and quantity of byproduct gas are principally
determined by the amount and purity of oxygen added, the effi-
ciency of processing, and the amount of kerogen in the shale. A
heating value of 100-110 BTU/SCF is indicated in this process for
28 GPT Western oil shale. The ultimate use of air or oxy-
gen would depend on an economic evaluation.
The weight of spent shale for a 28 GPT Colorado shale would be 83%
of the shale charged to the grate. Less than 10% of the carbonate
is calcined and about half the carbon is burned out. Disposal
problems are not unique.
216
I
I
1
1
1
1
I
I
1
I
1
I
1
I
I
I
I
image:
 The technical feasibility of agglomerating oil shale fines and
recycling solids separated from the oil was verified by Dravo
^em Iatte5 Processing would eliminate a difficult disposal
pioblem. One would expect agglomeration to be used, however, only
if economically viable for a given property.
Dravo's Shale Oil Pilot Plant is located in Cleveland, Ohio. It
was originally constructed in 1974, and operated for several runs
snrt i? i n- ,revamPed to conform with the latest Dravo techno] ogy
SSiiar^JfJ?11,reclove1ry methods. It is a circular grate havincf 88
square feet of actual grate area. It can process 300 tons-per-day
°! L11 S£?Ie^ -The pllot Plant flowsheet (Figure 3Jl5-2) illu-
strates the basic flow scheme of this facility. Raw shale is
crushed and screened. Belt conveyors move the crushed shale to
the traveling grate over a weigh belt scale for material weiaht
hoodrdl^g-' H The +-Shale ,bed travels under the first retorting zone
k°°d' . c contains hot, oxygen-free, process gas.! The first
retorting zone covers several of the machine's 12 windBoxes.
Th! <ffCOnd arld ??ird retorting zones cover additional windboxes.
The second retorting zone is fed by oxygen-enriched, recycled pro^
cess gas. The third retorting zone is fed with oxygen-free pro-
£™lgaS' he a\r th.at ls in:iected into the second retorting zone
hoods causes combustion of shale carbon to provide the heat for
further retorting. At the discharge end of the retort zone 160%
°£ ^e °x^ ha^ bten extracted from the shale, approximately 50%
Sh.t vcarbon has been burned, and a significant percentage of the
shale has_ been cooled. The cooling zone consists o;f the last
several windboxes which has been fed with cool, oxygen-free pro-
?S T???'*. Sha^S 1S then conveved ^ the discharge area where
the pallets are tipped and the shale falls into a water-sealed
discharge hopper A belt conveys the shale to a refuse pile for
aiS^i^J^SpOSa1---, ThS ret°rt gases are collected in windboxes
and ducted to an oil recovery system.
3.15.2 Solid Wastes '
There is no information on the subject. !
3.15.3 Characteristics of Solid Wastes i
There is no information on the subject. |
217
image:
The technical feasibility of agglomerating oil shale fines and
recycling solids separated from the oil was verified by Dravo
^em Iatte5 Processing would eliminate a difficult disposal
pioblem. One would expect agglomeration to be used, however, only
if economically viable for a given property.
Dravo's Shale Oil Pilot Plant is located in Cleveland, Ohio. It
was originally constructed in 1974, and operated for several runs
snrt i? i n- ,revamPed to conform with the latest Dravo techno] ogy
SSiiar^JfJ?11,reclove1ry methods. It is a circular grate havincf 88
square feet of actual grate area. It can process 300 tons-per-day
°! L11 S£?Ie^ -The pllot Plant flowsheet (Figure 3Jl5-2) illu-
strates the basic flow scheme of this facility. Raw shale is
crushed and screened. Belt conveyors move the crushed shale to
the traveling grate over a weigh belt scale for material weiaht
hoodrdl^g-' H The +-Shale ,bed travels under the first retorting zone
k°°d' . c contains hot, oxygen-free, process gas.! The first
retorting zone covers several of the machine's 12 windBoxes.
Th! <ffCOnd arld ??ird retorting zones cover additional windboxes.
The second retorting zone is fed by oxygen-enriched, recycled pro^
cess gas. The third retorting zone is fed with oxygen-free pro-
£™lgaS' he a\r th.at ls in:iected into the second retorting zone
hoods causes combustion of shale carbon to provide the heat for
further retorting. At the discharge end of the retort zone 160%
°£ ^e °x^ ha^ bten extracted from the shale, approximately 50%
Sh.t vcarbon has been burned, and a significant percentage of the
shale has_ been cooled. The cooling zone consists o;f the last
several windboxes which has been fed with cool, oxygen-free pro-
?S T???'*. Sha^S 1S then conveved ^ the discharge area where
the pallets are tipped and the shale falls into a water-sealed
discharge hopper A belt conveys the shale to a refuse pile for
aiS^i^J^SpOSa1---, ThS ret°rt gases are collected in windboxes
and ducted to an oil recovery system.
3.15.2 Solid Wastes '
There is no information on the subject. !
3.15.3 Characteristics of Solid Wastes i
There is no information on the subject. |
217
image:
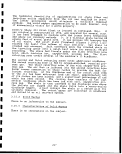 OIL SHALE
FEED CHUTE BLEED
TO INCINERATOR
SHALE OIL
STORAGE TANK
TO INCINERATOR
(INERT GAS GENERATOR)
ELECTROSTATIC
PHECIPlTATORS
Figure 3.15-2. Dravo Pilot Plant Flowsheet Schematic
Source: Forbes & Kinsey, 1981
218
ll
I
I
1
I
I
I
I
I
I
I
I
I
I
I
1
I
I
I
image:
OIL SHALE
FEED CHUTE BLEED
TO INCINERATOR
SHALE OIL
STORAGE TANK
TO INCINERATOR
(INERT GAS GENERATOR)
ELECTROSTATIC
PHECIPlTATORS
Figure 3.15-2. Dravo Pilot Plant Flowsheet Schematic
Source: Forbes & Kinsey, 1981
218
ll
I
I
1
I
I
I
I
I
I
I
I
I
I
I
1
I
I
I
image:
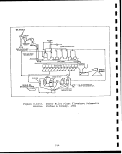 SECTION 4 ;
ENVIRONMENTAL CONTROL TECHNOLOGIES
4.1 ENVIRONMENTAL IMPACTS
4.1.1 Introduction i
An oil shale operation will result in significant land'disturbance
on and near the development site [DRI, SAI & KSC; 68-03-27951.
Land will be required for access to the site for mining, process-
ing facilities, and for waste disposal, all of which will perma-
nently modify the surrounding terrain and influence the ecosystem
by causing changes in the vegetation and habitat. Local aesthe-
tics will also be affected. ;
The most prominent impacts will probably result from the disposal
of the shale wastes. Unlike potential impacts on air and water
systems, the solid waste impacts will linger long after a mine has
been depleted and the shale processing facility is closed down
For this reason, the measures taken for mitigating the impacts of
solid waste disposal must withstand a minimum test of.time, with-
out the possibility of a breakdown. I
One factor of paramount importance in the disposal o;f the solid
wastes is the surface and groundwater regime of the site. While a
waste landfill should blend in cosmetically with the surroundings,
so_t]?a'!: lts existence can go practically undetected, it should be
sufficiently isolated from the surrounding strata s|o that the
hydro-logic environment is protected. Other factors ;influencing
the waste disposal and land disturbance impacts are the scale and
duration of the oil shale operation, and the mining and retorting
technologies used. '
|
The surface and subsurface impacts will vary depending upon the
waste disposal approach used. Available disposal methqds are can-
yon or valley fill, surface landfill, open pit backfill, under-
ground mine backfill and least likely, a commercial i market for
waste utilization. Selection of any of these approaches, or their
combination, is largely dependent on the site-specific features
mining method used, and the properties of the processed shale
(retorting method used). '
219
image:
SECTION 4 ;
ENVIRONMENTAL CONTROL TECHNOLOGIES
4.1 ENVIRONMENTAL IMPACTS
4.1.1 Introduction i
An oil shale operation will result in significant land'disturbance
on and near the development site [DRI, SAI & KSC; 68-03-27951.
Land will be required for access to the site for mining, process-
ing facilities, and for waste disposal, all of which will perma-
nently modify the surrounding terrain and influence the ecosystem
by causing changes in the vegetation and habitat. Local aesthe-
tics will also be affected. ;
The most prominent impacts will probably result from the disposal
of the shale wastes. Unlike potential impacts on air and water
systems, the solid waste impacts will linger long after a mine has
been depleted and the shale processing facility is closed down
For this reason, the measures taken for mitigating the impacts of
solid waste disposal must withstand a minimum test of.time, with-
out the possibility of a breakdown. I
One factor of paramount importance in the disposal o;f the solid
wastes is the surface and groundwater regime of the site. While a
waste landfill should blend in cosmetically with the surroundings,
so_t]?a'!: lts existence can go practically undetected, it should be
sufficiently isolated from the surrounding strata s|o that the
hydro-logic environment is protected. Other factors ;influencing
the waste disposal and land disturbance impacts are the scale and
duration of the oil shale operation, and the mining and retorting
technologies used. '
|
The surface and subsurface impacts will vary depending upon the
waste disposal approach used. Available disposal methqds are can-
yon or valley fill, surface landfill, open pit backfill, under-
ground mine backfill and least likely, a commercial i market for
waste utilization. Selection of any of these approaches, or their
combination, is largely dependent on the site-specific features
mining method used, and the properties of the processed shale
(retorting method used). '
219
image:
 I
1
4.1.2 Raw Shale Mining and Handling
A substantial amount of raw shale would need to be mined and pro- •
cessed to produce oil. This is primarily because the oil shale H
can be considered as a low-grade ore. A Mahogany Zone oil shale
averaging 26 gal/ton contains approximately 17 percent kerpgen by «
weight, of which about 75 percent can be converted to oil (-13 ||
percent of the raw shale weight). An oil shale plant producing
66,700 bbl/day of crude shale oil from the 26 gal/ton shale will
need to process 70,000 ton/day of raw shale as a minimum (at 100 •
percent of Fischer assay yield). This is a large quantity by the m
existing standards of the mining industry.
I
The shale handling will include blasting, conveying, stockpiling Hi
and several stages of crushing to prepare the feed for the re-
torts. The particulate control operations will produce raw shale „
fines which cannot be retorted by many of the retorting processes •
therefore, they must be disposed. The preheat system of the TOSCO
II process produces a raw shale sludge which also must be
discarded. As much as 10 percent of the mined out shale (or 7,000 ffi
ton/day for 66,700 bbl/day production) may be disposed of in the «
case of Paraho, while the raw shale waste for the TOSCO II process
may range from 1.5 to 2 percent of the run-off-mine shale (or ffi
1,000 to 1,400 ton/day). When compared with the amount of the ||
processed shale (e.g., 80 percent of the raw shale weight, or
56,000 ton/day), the raw shale quantities seem insignificant, but „
they will increase the carbon content of the waste piles. For the •
Paraho direct-heated, processed shale, the carbon content will ™
change from an initial 2 percent to approximately 3 percent, or a
50 percent increase in the amount of carbon. The impact on TOSCO fU
II processed shale is less significant, because of its already &
high carbon content. This increase in the carbon value,
nonetheless, increases a potential for volatiles release from the m
waste pile, in the event that self-heating (autooxidation) occurs g
within the pile. The physico-chemical impact of mixing the raw
and processed shales is unknown. There could be problems with the
waste pile stability or increased permeability, hence leaching. •
Several conceptual measures are available for mitigating the im-
pact of raw shale disposal. The raw shale can be disposed of sep- •
arately from other wastes. This approach can have its own pro- H
blems as additinal maintenance and monitoring may be required, but
they should be easily manageable due to the much smaller size of ..
the raw shale disposal pile. It would also allow future recovery ||
of the resource. The resource recovery simultaneous with the pro-
cessing, however, may be a preferred approach, because it will not •
require the additional handling of the raw shale. Several alter- «
natives can be pursued and developed regarding the utilization of m
the shale fines. The fines can be briquetted into larger pieces,
then processed by the same retorting technology. Another option •
is to have a small fines handling retort on the site. Current §
thinking by some oil shale developers is to burn the fines in a
1
I
220
image:
I
1
4.1.2 Raw Shale Mining and Handling
A substantial amount of raw shale would need to be mined and pro- •
cessed to produce oil. This is primarily because the oil shale H
can be considered as a low-grade ore. A Mahogany Zone oil shale
averaging 26 gal/ton contains approximately 17 percent kerpgen by «
weight, of which about 75 percent can be converted to oil (-13 ||
percent of the raw shale weight). An oil shale plant producing
66,700 bbl/day of crude shale oil from the 26 gal/ton shale will
need to process 70,000 ton/day of raw shale as a minimum (at 100 •
percent of Fischer assay yield). This is a large quantity by the m
existing standards of the mining industry.
I
The shale handling will include blasting, conveying, stockpiling Hi
and several stages of crushing to prepare the feed for the re-
torts. The particulate control operations will produce raw shale „
fines which cannot be retorted by many of the retorting processes •
therefore, they must be disposed. The preheat system of the TOSCO
II process produces a raw shale sludge which also must be
discarded. As much as 10 percent of the mined out shale (or 7,000 ffi
ton/day for 66,700 bbl/day production) may be disposed of in the «
case of Paraho, while the raw shale waste for the TOSCO II process
may range from 1.5 to 2 percent of the run-off-mine shale (or ffi
1,000 to 1,400 ton/day). When compared with the amount of the ||
processed shale (e.g., 80 percent of the raw shale weight, or
56,000 ton/day), the raw shale quantities seem insignificant, but „
they will increase the carbon content of the waste piles. For the •
Paraho direct-heated, processed shale, the carbon content will ™
change from an initial 2 percent to approximately 3 percent, or a
50 percent increase in the amount of carbon. The impact on TOSCO fU
II processed shale is less significant, because of its already &
high carbon content. This increase in the carbon value,
nonetheless, increases a potential for volatiles release from the m
waste pile, in the event that self-heating (autooxidation) occurs g
within the pile. The physico-chemical impact of mixing the raw
and processed shales is unknown. There could be problems with the
waste pile stability or increased permeability, hence leaching. •
Several conceptual measures are available for mitigating the im-
pact of raw shale disposal. The raw shale can be disposed of sep- •
arately from other wastes. This approach can have its own pro- H
blems as additinal maintenance and monitoring may be required, but
they should be easily manageable due to the much smaller size of ..
the raw shale disposal pile. It would also allow future recovery ||
of the resource. The resource recovery simultaneous with the pro-
cessing, however, may be a preferred approach, because it will not •
require the additional handling of the raw shale. Several alter- «
natives can be pursued and developed regarding the utilization of m
the shale fines. The fines can be briquetted into larger pieces,
then processed by the same retorting technology. Another option •
is to have a small fines handling retort on the site. Current §
thinking by some oil shale developers is to burn the fines in a
1
I
220
image:
 fluidized bed or lift pipe and utilize the energy to provide pro-
cess heat and steam. The process fuels saved by this Approach can
be put to better use or sold commercially.
4.1.3 Processed Shale Handling and Disposal ;
The processed shale will be the major waste produced by oil shale
processing; therefore, its disposal will be of primary concern.
The vast quantities of the processed shale produced may make its
safe handling and disposal the greatest environmental issue of oil
shale processing. The environmental repercussions can be long
lasting; therefore, utmost care should be taken before implement-
ing any long-term plans. To the extent possible, the processed
shale disposal should occur in such a manner as to return the
disturbed land to its original state of landscape, use and bio-
logical productivity. This would require proper handling and dis-
posal practices, protection of air and water quality and surface
reclamation. ' \
The physical and chemical properties of the processed shale will
be the determining factors in the selection of disposal and rec-
lamation approaches. Every retorting method produces a processed
shale that is unique in quality, and every development site has
features not found elsewhere; therefore, their combination should
be analyzed on an individual basis. The physical and chemical
characteristics of the processed shale are determined by the
source of the raw shale, its particle size after crushing and
retorting, the retorting parameters, and most importantly, the
temperature of retorting.
There are primarily two types of processed shale—carbonaceous and
burned (decarbonized). Carbonaceous processed shales are produced
by indirect retorting in which residual coke on the retorted
material is not incinerated. Examples of this type of retorting
are the TOSCO II and Union B processes. Burned shales originate
either from direct-heated processes, such as Paraho and Modified
In Situ (MIS), in which the air is introduced in the retort to
cause combustion of'the residual carbon, or from combination-mode
processes, such as, Lurgi Superior and Union C, in which the re-
torting primarily occurs in the indirect-mode, but the resid.ual
coke on the processed shale is incinerated in a separate stage.
The carbonaceous processed shales have usually been subjected to
low enough temperatures (980°F) so that significant 'calcination
and other mineral transformations do not occur. These type of
shales normally yield less water soluble material than burned
shales but have poor cementation properties which result in in-
creased water permeability, hence leaching. The buirned shales
(1290-1830°F), indicate considerable calcination and mineral
transformation. As a result, they behave more like Portland
cement and thus form an impermeable mass upon wetting and setting.
221
image:
fluidized bed or lift pipe and utilize the energy to provide pro-
cess heat and steam. The process fuels saved by this Approach can
be put to better use or sold commercially.
4.1.3 Processed Shale Handling and Disposal ;
The processed shale will be the major waste produced by oil shale
processing; therefore, its disposal will be of primary concern.
The vast quantities of the processed shale produced may make its
safe handling and disposal the greatest environmental issue of oil
shale processing. The environmental repercussions can be long
lasting; therefore, utmost care should be taken before implement-
ing any long-term plans. To the extent possible, the processed
shale disposal should occur in such a manner as to return the
disturbed land to its original state of landscape, use and bio-
logical productivity. This would require proper handling and dis-
posal practices, protection of air and water quality and surface
reclamation. ' \
The physical and chemical properties of the processed shale will
be the determining factors in the selection of disposal and rec-
lamation approaches. Every retorting method produces a processed
shale that is unique in quality, and every development site has
features not found elsewhere; therefore, their combination should
be analyzed on an individual basis. The physical and chemical
characteristics of the processed shale are determined by the
source of the raw shale, its particle size after crushing and
retorting, the retorting parameters, and most importantly, the
temperature of retorting.
There are primarily two types of processed shale—carbonaceous and
burned (decarbonized). Carbonaceous processed shales are produced
by indirect retorting in which residual coke on the retorted
material is not incinerated. Examples of this type of retorting
are the TOSCO II and Union B processes. Burned shales originate
either from direct-heated processes, such as Paraho and Modified
In Situ (MIS), in which the air is introduced in the retort to
cause combustion of'the residual carbon, or from combination-mode
processes, such as, Lurgi Superior and Union C, in which the re-
torting primarily occurs in the indirect-mode, but the resid.ual
coke on the processed shale is incinerated in a separate stage.
The carbonaceous processed shales have usually been subjected to
low enough temperatures (980°F) so that significant 'calcination
and other mineral transformations do not occur. These type of
shales normally yield less water soluble material than burned
shales but have poor cementation properties which result in in-
creased water permeability, hence leaching. The buirned shales
(1290-1830°F), indicate considerable calcination and mineral
transformation. As a result, they behave more like Portland
cement and thus form an impermeable mass upon wetting and setting.
221
image:
 I
1
Once penetrated, however, usually more water soluble material may **
be leached out than can be leached from carbonaceous processed
shales . I
The particle size, or the texture of the processed shale, also has
significant impact on the physical properties. The TOSCO II and «
Lurgi processes use finely crushed raw shale as the retort feed. |f
In the former process, the shale is further divided due to the
ball-milling action in the retort. Some disintegration of the
Lurgi processed shale occurs in the lift pipe and recycle loop. As •
a result, both of these processes produce an even finer, silty w
processed shale. Although better compaction, cementation, and
lower permeability are obtained with the fine material, the •
potential for erosion due to wind and run-off is increased. The f|
Union B, Superior, and Paraho processes use rather coarse shale
for retorting. Accordingly, the processed shale also has a coarse »
texture. While resistant to erosion, the coarse material does not •
have good cementation properties and water permeability is higher. m
The characteristics for some of these processed shales have been
discussed in Section 3 . •
4.2 DISPOSAL ALTERNATIVES
The mining and processing of oil shale actually results in an f
increase in the volume of the shale. In-place density of the raw
shale is approximately 2.16 g/cm3, but the processed shale can be _
compacted to only about 1.6 g/cm3 by practical means. Even after •
losing about 20 percent of the original weight, which is a ™
reasonable assumption, the shale after retorting will occupy about
10 to 15 percent more volume than it originally occupied. This is tf
an important factor when considering different approaches for the fli
processed shale disposal.
Processed shale moisturizing will be an essential ingredient in •
disposing of the processed shale. It will serve numerous func-
tions. The processed shale will emerge from most retorts at an
elevated temperature; therefore, it will require cooling and/or ffi
moisturizing prior to handling and disposal. Transportation of •
the processed shale to the disposal area will involve extensive
materials handling and transfers which are potential sources of ffi
airborne particulates . The particulate emissions can be p
minimized, by moisturizing and using covered transport. Perhaps
the most significant advantage of moisturizing is in obtaining «
proper compaction, and cementing reaction, which in turn will al- •
low disposal of a maximum quantity of the material in a given **
space and will provide greater stability to a waste landfill.
Several alternatives are available for the disposal of the shale •
processing wastes. The mining and retorting methods used, geo-
graphy of the disposal site, and the surface and subsurface hydro- •
logy of the area will dictate the selection of the disposal |j
approach (es) .
222
1
I
image:
I
1
Once penetrated, however, usually more water soluble material may **
be leached out than can be leached from carbonaceous processed
shales . I
The particle size, or the texture of the processed shale, also has
significant impact on the physical properties. The TOSCO II and «
Lurgi processes use finely crushed raw shale as the retort feed. |f
In the former process, the shale is further divided due to the
ball-milling action in the retort. Some disintegration of the
Lurgi processed shale occurs in the lift pipe and recycle loop. As •
a result, both of these processes produce an even finer, silty w
processed shale. Although better compaction, cementation, and
lower permeability are obtained with the fine material, the •
potential for erosion due to wind and run-off is increased. The f|
Union B, Superior, and Paraho processes use rather coarse shale
for retorting. Accordingly, the processed shale also has a coarse »
texture. While resistant to erosion, the coarse material does not •
have good cementation properties and water permeability is higher. m
The characteristics for some of these processed shales have been
discussed in Section 3 . •
4.2 DISPOSAL ALTERNATIVES
The mining and processing of oil shale actually results in an f
increase in the volume of the shale. In-place density of the raw
shale is approximately 2.16 g/cm3, but the processed shale can be _
compacted to only about 1.6 g/cm3 by practical means. Even after •
losing about 20 percent of the original weight, which is a ™
reasonable assumption, the shale after retorting will occupy about
10 to 15 percent more volume than it originally occupied. This is tf
an important factor when considering different approaches for the fli
processed shale disposal.
Processed shale moisturizing will be an essential ingredient in •
disposing of the processed shale. It will serve numerous func-
tions. The processed shale will emerge from most retorts at an
elevated temperature; therefore, it will require cooling and/or ffi
moisturizing prior to handling and disposal. Transportation of •
the processed shale to the disposal area will involve extensive
materials handling and transfers which are potential sources of ffi
airborne particulates . The particulate emissions can be p
minimized, by moisturizing and using covered transport. Perhaps
the most significant advantage of moisturizing is in obtaining «
proper compaction, and cementing reaction, which in turn will al- •
low disposal of a maximum quantity of the material in a given **
space and will provide greater stability to a waste landfill.
Several alternatives are available for the disposal of the shale •
processing wastes. The mining and retorting methods used, geo-
graphy of the disposal site, and the surface and subsurface hydro- •
logy of the area will dictate the selection of the disposal |j
approach (es) .
222
1
I
image:
 Surface landfill—Disposal in a valley or canyon near the plant
site may be the preferred approach by many oil shale developers.
This selection is influenced by the rugged terrain i of the oil
shale areas in Colorado and Utah. Usually, large valleys and/or
canyons are available on the development sites to accomodate the
wastes generated throughout the operational life of the projects.
With proper reclamation the landfill can be blended into the sur-
rounding terrain so that it can go unnoticed. The landfill can be
built as deep as the valley or canyon so that the bulk of the ma-
terial is protected from the weather. Additionally,1 this would
reduce the surface area that would need to be reclaimed or revege-
tated. Water contamination due to run-on and run-off,land mechan-
ical _ failure due to mass movement and slippage are some adverse
possibilities in this type of landfill.
To avoid or reduce the mechanical instability, the face of the
pile should be built at an angle well below the internal angle of
friction. The laboratory data for most processed shale would in-
dicate that a waste pile with a 2:1 slope (2 units horizontal for
every unit vertically, or approximately a 27° angle) would be me-
chanically stable, but potential operational safety, lerosion and
revegetation problems suggest that the slope should be no steeper
than 3:1 and possibly 4:1. ;
If the disposal area is flat, then the landfill would' need to be
built above the surface. This type of waste pile will not blend
into the surrounding environment and will be visible from a dis-
tance. The run-on and run-off problems would be limited and per-
haps, easily manageable. The pile-up operations may be somewhat
difficult when compared with the valley fill operations. Also,
exposure to wind and water may result in excessive erosion.
Solid waste management employs several integrated controls and
practices. Techniques for controlling erosion due t!o wind and
water, controlling natural water contamination due to xun-off and
leachate, controlling permeability through the waste pile, run-on
and run-off diversion, leachate collection, monitoring', revegeta-
tion, etc., are employed to mitigate the adverse impacts of the
solid waste disposal. \
The processed shale and other processing wastes, when disposed of
in a surface landfill, will be exposed to rain, snow;, and wind.
These natural forces will disturb or erode the waste particles on
the surface. Upon disturbance, these particles may either become
airborne or may be carried with the run-off. While a direct im-
pingement of the wind and water on the waste pile is unavoidable,
the erosion can be minimized by proper sloping and Compaction,
surface stabilization and vegetation. Surface stabilization con-
sists of the application of water or chemical spray, oir the addi-
tion of emulsified asphalt or limestone. These techniques help in
binding particles together and in hardening the surface, thereby
minimizing erosion. ;
223
image:
Surface landfill—Disposal in a valley or canyon near the plant
site may be the preferred approach by many oil shale developers.
This selection is influenced by the rugged terrain i of the oil
shale areas in Colorado and Utah. Usually, large valleys and/or
canyons are available on the development sites to accomodate the
wastes generated throughout the operational life of the projects.
With proper reclamation the landfill can be blended into the sur-
rounding terrain so that it can go unnoticed. The landfill can be
built as deep as the valley or canyon so that the bulk of the ma-
terial is protected from the weather. Additionally,1 this would
reduce the surface area that would need to be reclaimed or revege-
tated. Water contamination due to run-on and run-off,land mechan-
ical _ failure due to mass movement and slippage are some adverse
possibilities in this type of landfill.
To avoid or reduce the mechanical instability, the face of the
pile should be built at an angle well below the internal angle of
friction. The laboratory data for most processed shale would in-
dicate that a waste pile with a 2:1 slope (2 units horizontal for
every unit vertically, or approximately a 27° angle) would be me-
chanically stable, but potential operational safety, lerosion and
revegetation problems suggest that the slope should be no steeper
than 3:1 and possibly 4:1. ;
If the disposal area is flat, then the landfill would' need to be
built above the surface. This type of waste pile will not blend
into the surrounding environment and will be visible from a dis-
tance. The run-on and run-off problems would be limited and per-
haps, easily manageable. The pile-up operations may be somewhat
difficult when compared with the valley fill operations. Also,
exposure to wind and water may result in excessive erosion.
Solid waste management employs several integrated controls and
practices. Techniques for controlling erosion due t!o wind and
water, controlling natural water contamination due to xun-off and
leachate, controlling permeability through the waste pile, run-on
and run-off diversion, leachate collection, monitoring', revegeta-
tion, etc., are employed to mitigate the adverse impacts of the
solid waste disposal. \
The processed shale and other processing wastes, when disposed of
in a surface landfill, will be exposed to rain, snow;, and wind.
These natural forces will disturb or erode the waste particles on
the surface. Upon disturbance, these particles may either become
airborne or may be carried with the run-off. While a direct im-
pingement of the wind and water on the waste pile is unavoidable,
the erosion can be minimized by proper sloping and Compaction,
surface stabilization and vegetation. Surface stabilization con-
sists of the application of water or chemical spray, oir the addi-
tion of emulsified asphalt or limestone. These techniques help in
binding particles together and in hardening the surface, thereby
minimizing erosion. ;
223
image:
 I
I
Depending upon the surface permeability, the impinged water will •*
run off the pile, infiltrate the pile, or both. The water can in-
filtrate the waste pile by permeation through the surface and/or by •
channeling through cracks and other artifacts. In such an event, H
the potential of leaching the water soluble material from the waste
is greatly increased. In the case of more permeable, coarse pro- «
cessed shales, some fines can be added to fill the void spaces, ||
thereby reducing the water permeability. Creating an impervious
cover on the surface of the waste pile using a processed shale/ ^
soil-cement mixture can also reduce the water permeability. H
Several feet of plant growth medium. would then have to be placed *
on top of the cover in order to vegetate the pile. Low precipita-
tion and high evaporation rates in the semi-arid oil shale area Bj
help to minimize the potential of leaching. I
Water flow diversion and collection structures would greatly re- »
duce the erosion and leaching potential. The waste piles would be M
built in benches, perhaps 50 ft. high. Each bench can then be back- m
sloped into a drainage system at the base of each bench. The run-
off from a section of the bench would be collected by the drainage •
system rather than letting the run-off flow onto the next bench. W
Similar collection and diversion systems can be built around the as
waste pile at the junction of the pile and the surrounding strata, J|
to divert any run-on, thus preventing its contact with the waste.
Catchment basins at the bottom and perhaps above the landfill, are fl
practically essential for any surface landfill. While the pile •
impermeability is preferred in order to reduce the leachate poten-
tial, it will increase the run-off potential. The uncontaminated m
run-on can be collected in the catchment pond above the pile, re- H
ducing the quantity of water to run off the pile. This uncontam-
inated water can be diverted around the landfill into natural n
drainage. f§
The catchment pond at the base of the pile will collect the con- &
taminated run-off. The area of this basin should be large enough •
so that the average evaporation rate is higher than the average •
in-flow rate and be designed with a capacity for containing the
run-off from major (100 year) storms. The basin should be lined •
with impervious material to prevent infiltration. 9
In the event of excess water collection in the catchment basin, »
some mitigating measures can be taken. During the processing •
operations, the necessary amount of collected water can be ^
treated to meet the discharge or underground injection standards
and disposed of accordingly. Since most of the contaminants in H
the collected water would have originated from the waste pile, •
the excess water can be reused for moisturizing the process wastes
and for dust suppression at the disposal site. These reuse options m
may reduce the overall water consumption by the plant. f|
I
224
I
image:
I
I
Depending upon the surface permeability, the impinged water will •*
run off the pile, infiltrate the pile, or both. The water can in-
filtrate the waste pile by permeation through the surface and/or by •
channeling through cracks and other artifacts. In such an event, H
the potential of leaching the water soluble material from the waste
is greatly increased. In the case of more permeable, coarse pro- «
cessed shales, some fines can be added to fill the void spaces, ||
thereby reducing the water permeability. Creating an impervious
cover on the surface of the waste pile using a processed shale/ ^
soil-cement mixture can also reduce the water permeability. H
Several feet of plant growth medium. would then have to be placed *
on top of the cover in order to vegetate the pile. Low precipita-
tion and high evaporation rates in the semi-arid oil shale area Bj
help to minimize the potential of leaching. I
Water flow diversion and collection structures would greatly re- »
duce the erosion and leaching potential. The waste piles would be M
built in benches, perhaps 50 ft. high. Each bench can then be back- m
sloped into a drainage system at the base of each bench. The run-
off from a section of the bench would be collected by the drainage •
system rather than letting the run-off flow onto the next bench. W
Similar collection and diversion systems can be built around the as
waste pile at the junction of the pile and the surrounding strata, J|
to divert any run-on, thus preventing its contact with the waste.
Catchment basins at the bottom and perhaps above the landfill, are fl
practically essential for any surface landfill. While the pile •
impermeability is preferred in order to reduce the leachate poten-
tial, it will increase the run-off potential. The uncontaminated m
run-on can be collected in the catchment pond above the pile, re- H
ducing the quantity of water to run off the pile. This uncontam-
inated water can be diverted around the landfill into natural n
drainage. f§
The catchment pond at the base of the pile will collect the con- &
taminated run-off. The area of this basin should be large enough •
so that the average evaporation rate is higher than the average •
in-flow rate and be designed with a capacity for containing the
run-off from major (100 year) storms. The basin should be lined •
with impervious material to prevent infiltration. 9
In the event of excess water collection in the catchment basin, »
some mitigating measures can be taken. During the processing •
operations, the necessary amount of collected water can be ^
treated to meet the discharge or underground injection standards
and disposed of accordingly. Since most of the contaminants in H
the collected water would have originated from the waste pile, •
the excess water can be reused for moisturizing the process wastes
and for dust suppression at the disposal site. These reuse options m
may reduce the overall water consumption by the plant. f|
I
224
I
image:
 Monitoring the changes in the geologic conditions of the area
groundwater quality, waste properties, etc., should be an integral
part of the overall solid waste management. Any! significant
change in these indicators may dictate a change in disposal strat-
egy, or replacement/repair in the built-in structures, etc
Thermocouples can be installed in the pile to monitor self-heating
processes. Volatile components can also be monitored for any in-
dications of self-heating in the pile. A sudden degradation of
groundwater quality may indicate breakthrough of the ileachate or
run-off. A preventive cure may not be possible for all of the
causes. However, retrofit measures can be taken in some case to
reduce further degradation or hazard. •
i
Open pit backfill—This method of disposal may be viewed as a type
of surface landfill. As a prerequisite, the mining operation must
have been performed by open pit mining to allow this type of dis-
posal. This mining allows more resource recovery than the under-
ground methods, but additional handling of the overburden and sub-
ore is also necessary. '
The logistics of simultaneous mining and backfilling operations
require that the mine be developed for 20-30 years at a commer-
cial scale rate (100,000 ton/day) before backfilling can com-
mence. The overburden, subbre, and processing wastes generated
during these years must be temporarily stored or permanently dis-
posed somewhere else so that the full resource can be developed
Even after all the backfilling has been done, some off-site dis-
posal may be necessary because the volume of the backfill material
W1Z *>e greater than the volume being created by the mining. With-
out additional off-site disposal, the backfilling operations will
catch up with and inhibit the mining operations. ',
I
After the project shutdown some waste from the off-tract' disposal
can be returned to the mine, but approximately 20-30' percent of
the total mined out volume would need to be stored or 'disposed of
permanently outside_the pit. By complete backfilling, 'the land can
be brought back to its original contour. If the pit is; backfilled
to a level surface, a depression may later develop due to compac-
tion and settling, allowing water collection and possible infil-
tration. Hence it may be desirable to pile the wast^ above the
existing terrain. However, the surface reclamation and aesthe-
tics, in this case, may be of inferior quality compared to the
leveled backfill. i
It is likely that not all of the controls necessary fojr a surface
landfill may be required for the open pit backfill. The erosion
potential will be greatly reduced, because a bulk of the material
will be unexposed to the weather elements. Certainly,: the catch-
ment ponds will not be required. Use of extensive diversion and
collection systems may be discontinued if original drainage pat-
terns can be restored. !
225
image:
Monitoring the changes in the geologic conditions of the area
groundwater quality, waste properties, etc., should be an integral
part of the overall solid waste management. Any! significant
change in these indicators may dictate a change in disposal strat-
egy, or replacement/repair in the built-in structures, etc
Thermocouples can be installed in the pile to monitor self-heating
processes. Volatile components can also be monitored for any in-
dications of self-heating in the pile. A sudden degradation of
groundwater quality may indicate breakthrough of the ileachate or
run-off. A preventive cure may not be possible for all of the
causes. However, retrofit measures can be taken in some case to
reduce further degradation or hazard. •
i
Open pit backfill—This method of disposal may be viewed as a type
of surface landfill. As a prerequisite, the mining operation must
have been performed by open pit mining to allow this type of dis-
posal. This mining allows more resource recovery than the under-
ground methods, but additional handling of the overburden and sub-
ore is also necessary. '
The logistics of simultaneous mining and backfilling operations
require that the mine be developed for 20-30 years at a commer-
cial scale rate (100,000 ton/day) before backfilling can com-
mence. The overburden, subbre, and processing wastes generated
during these years must be temporarily stored or permanently dis-
posed somewhere else so that the full resource can be developed
Even after all the backfilling has been done, some off-site dis-
posal may be necessary because the volume of the backfill material
W1Z *>e greater than the volume being created by the mining. With-
out additional off-site disposal, the backfilling operations will
catch up with and inhibit the mining operations. ',
I
After the project shutdown some waste from the off-tract' disposal
can be returned to the mine, but approximately 20-30' percent of
the total mined out volume would need to be stored or 'disposed of
permanently outside_the pit. By complete backfilling, 'the land can
be brought back to its original contour. If the pit is; backfilled
to a level surface, a depression may later develop due to compac-
tion and settling, allowing water collection and possible infil-
tration. Hence it may be desirable to pile the wast^ above the
existing terrain. However, the surface reclamation and aesthe-
tics, in this case, may be of inferior quality compared to the
leveled backfill. i
It is likely that not all of the controls necessary fojr a surface
landfill may be required for the open pit backfill. The erosion
potential will be greatly reduced, because a bulk of the material
will be unexposed to the weather elements. Certainly,: the catch-
ment ponds will not be required. Use of extensive diversion and
collection systems may be discontinued if original drainage pat-
terns can be restored. !
225
image:
 I
One potential problem of the open pit backfill could be ground- *
water contamination. If the pit intersects any existing aquifer,
the waste will be placed in the course of the aquifer. After mix- •
ing when the aquifer dewatering is discontinued, the water will V
penetrate the waste mass and eventually saturate it.
Underground mine backfill—Return of the processed shale to the |
underground mine is an attractive disposal approach. Several of
the problems associated with the exposed (surface) landfills will
be nonexistent in the underground disposal. Since the waste would •
be protected from the weather, erosion potential is diminished. m
Surface reclamation and vegetation would be reduced. Most impor-
tantly, the danger of mine subsidence would be greatly reduced. •
However, the logistics of simultaneous mining and backfilling oper-
ations could be complex and may require substantial aboveground —
disposal capacity. Furthermore, due to volume expansion on re- •
torting, not all of the processed shale can be accomodated under-
ground using practical compaction machinery. Total accomodation
of the waste may be achieved if it is compacted in excess of 1.84 •
g/cm3. While this magnitude of compactive effort is attainable V
aboveground with very large, heavy equipment, operation of such
equipment would be very difficult in the underground mine. if
Several underground backfilling methods are available, but none of
these have been tested on a large scale. Slurry backfilling via
pipelines is practical for fine processed shale disposal but not •
suitable for the coarse materials. This method would have the •»
disadvantages of adding water enhancing groundwater contamination,
and would require excess water collection systems. Other methods • V
involve transportation, either by conveyors or by trucks, followed ffl
by compaction using standard machinery. Pneumatic transport is
also a possibility. A combination of these methods, perhaps, »
would yield the best results, but realistically, not more than 60 |y
percent of the processed shale can be returned to the mine. Re-
lease of volatiles may create a worker safety and fire hazard.
In situ retort abandonment—Even though the in situ retorting pro- P
cesses do not involve disposal of the processed shale per se, the
retorted mass underground represents the shale waste that must be H
attended. Perhaps one can consider the spent retorts as equiv- f|
alent to the backfilled underground mine. Some differences do
exist, however. The groundwater seepage in an underground mine is -
detectable and manageable before backfilling. In the case of an H
in situ retort, the problem, if existent, must be taken care of •*
after the retort is spent. The size and placement of the material
in backfilling is controllable, while the same is not possible •
with the in situ retorts. •
Of greatest concern in the abandonment of the in situ retorts may n
be the groundwater infiltration, heat retained in the retorted ||
1
226
I
image:
I
One potential problem of the open pit backfill could be ground- *
water contamination. If the pit intersects any existing aquifer,
the waste will be placed in the course of the aquifer. After mix- •
ing when the aquifer dewatering is discontinued, the water will V
penetrate the waste mass and eventually saturate it.
Underground mine backfill—Return of the processed shale to the |
underground mine is an attractive disposal approach. Several of
the problems associated with the exposed (surface) landfills will
be nonexistent in the underground disposal. Since the waste would •
be protected from the weather, erosion potential is diminished. m
Surface reclamation and vegetation would be reduced. Most impor-
tantly, the danger of mine subsidence would be greatly reduced. •
However, the logistics of simultaneous mining and backfilling oper-
ations could be complex and may require substantial aboveground —
disposal capacity. Furthermore, due to volume expansion on re- •
torting, not all of the processed shale can be accomodated under-
ground using practical compaction machinery. Total accomodation
of the waste may be achieved if it is compacted in excess of 1.84 •
g/cm3. While this magnitude of compactive effort is attainable V
aboveground with very large, heavy equipment, operation of such
equipment would be very difficult in the underground mine. if
Several underground backfilling methods are available, but none of
these have been tested on a large scale. Slurry backfilling via
pipelines is practical for fine processed shale disposal but not •
suitable for the coarse materials. This method would have the •»
disadvantages of adding water enhancing groundwater contamination,
and would require excess water collection systems. Other methods • V
involve transportation, either by conveyors or by trucks, followed ffl
by compaction using standard machinery. Pneumatic transport is
also a possibility. A combination of these methods, perhaps, »
would yield the best results, but realistically, not more than 60 |y
percent of the processed shale can be returned to the mine. Re-
lease of volatiles may create a worker safety and fire hazard.
In situ retort abandonment—Even though the in situ retorting pro- P
cesses do not involve disposal of the processed shale per se, the
retorted mass underground represents the shale waste that must be H
attended. Perhaps one can consider the spent retorts as equiv- f|
alent to the backfilled underground mine. Some differences do
exist, however. The groundwater seepage in an underground mine is -
detectable and manageable before backfilling. In the case of an H
in situ retort, the problem, if existent, must be taken care of •*
after the retort is spent. The size and placement of the material
in backfilling is controllable, while the same is not possible •
with the in situ retorts. •
Of greatest concern in the abandonment of the in situ retorts may n
be the groundwater infiltration, heat retained in the retorted ||
1
226
I
image:
 mass, and air leakage in the retort causing a potential for com-
fai tv\?aha^?°??e Average- temperature in a spent retort may Se
fare £nig <532 *)• .Some retorting and/or softening of the pil-
lars, will occur reducing their structural strength. Due to the
?u?ldh^LPreSSUre mai?tained in the retorts, air inflow may occur?
Furthermore, some partially retorted shale pieces may lexis t in the
bus?ion in ™ °f
The spent retorts can be grouted by injecting cement slurry at
high pressure in the retort. While this approach may not prevent
the groundwater from entering the retort, it will slow the water
atl- V? ^r°Ugh the rubble and Caching the shale Filling the
poWtentiaT.r°Ve structural strength and reduce the subsl?
4.3 CONTROL TECHNOLOGIES
be rlon
be done on
ooTUSfq°£iiS draWn Princi.Pally from EPA! publication
• t ' 1983] and summarizes the major control
technologies to prevent contamination of surface and^ groundwater
supplies by runoff or leachate, prevent generation of wSdblSSn
dusts and prevent mass failure of a surface landfill The
0n and aPPllcat%lon of appropriate control technologies must
a site and plant specific basis wherein the controls
no -1^°-f sPecific disposal design. A few specific
examples of individual control technology costs : have been
idea °f Boosts involved. The
and compacting the solid wastes
a, estimated costs since these activities must
accomplished for process rather than environmental purposes?
4 • 3 . 1 Surface Hydrology Control Technologies ;
,man,a?ement practices in the area of surface hydrology
handling of surface waters on and around the disposal
Specifically, surface streams and precipitation a?e
wa s rrnn?1 f™^? fntO the Waste Pile' and contaminated
watSrs. (runoff' leachate) are kept from mixing with the natural
su3facenHfi th°Se that are Applicable to
suiface landfill, and they are summarized in Figure !4.3-l The
key features of the technologies are highlighted in Table "4.3-1
and a more detailed description with cost data is presented in the
T^GX^. *
Runon Diversion System i
A runon diversion system will generally be needed with any surface
landfill to prevent surface water from flowing onto the waste ma-
terial and becoming contaminated or causing erosion. The system
227
image:
mass, and air leakage in the retort causing a potential for com-
fai tv\?aha^?°??e Average- temperature in a spent retort may Se
fare £nig <532 *)• .Some retorting and/or softening of the pil-
lars, will occur reducing their structural strength. Due to the
?u?ldh^LPreSSUre mai?tained in the retorts, air inflow may occur?
Furthermore, some partially retorted shale pieces may lexis t in the
bus?ion in ™ °f
The spent retorts can be grouted by injecting cement slurry at
high pressure in the retort. While this approach may not prevent
the groundwater from entering the retort, it will slow the water
atl- V? ^r°Ugh the rubble and Caching the shale Filling the
poWtentiaT.r°Ve structural strength and reduce the subsl?
4.3 CONTROL TECHNOLOGIES
be rlon
be done on
ooTUSfq°£iiS draWn Princi.Pally from EPA! publication
• t ' 1983] and summarizes the major control
technologies to prevent contamination of surface and^ groundwater
supplies by runoff or leachate, prevent generation of wSdblSSn
dusts and prevent mass failure of a surface landfill The
0n and aPPllcat%lon of appropriate control technologies must
a site and plant specific basis wherein the controls
no -1^°-f sPecific disposal design. A few specific
examples of individual control technology costs : have been
idea °f Boosts involved. The
and compacting the solid wastes
a, estimated costs since these activities must
accomplished for process rather than environmental purposes?
4 • 3 . 1 Surface Hydrology Control Technologies ;
,man,a?ement practices in the area of surface hydrology
handling of surface waters on and around the disposal
Specifically, surface streams and precipitation a?e
wa s rrnn?1 f™^? fntO the Waste Pile' and contaminated
watSrs. (runoff' leachate) are kept from mixing with the natural
su3facenHfi th°Se that are Applicable to
suiface landfill, and they are summarized in Figure !4.3-l The
key features of the technologies are highlighted in Table "4.3-1
and a more detailed description with cost data is presented in the
T^GX^. *
Runon Diversion System i
A runon diversion system will generally be needed with any surface
landfill to prevent surface water from flowing onto the waste ma-
terial and becoming contaminated or causing erosion. The system
227
image:
 SURFACE
HYDROLOGY
CONTROL
TECHNOLOGIES
RUNON
DIVERSION
SYSTEM
RUNOFF
COLLECTION
SYSTEM
RUNOFF/LEACHATE
COLLECTION PONDS
— WITH RETENTION
- NO RETENTION
Figure 4.3-1. Surface Hydrology Control Technologies
Source: EPA-600/8-83-003, 1983
I
1
I
I
1
228
1
I
I
I
I
I
I
I
I
image:
SURFACE
HYDROLOGY
CONTROL
TECHNOLOGIES
RUNON
DIVERSION
SYSTEM
RUNOFF
COLLECTION
SYSTEM
RUNOFF/LEACHATE
COLLECTION PONDS
— WITH RETENTION
- NO RETENTION
Figure 4.3-1. Surface Hydrology Control Technologies
Source: EPA-600/8-83-003, 1983
I
1
I
I
1
228
1
I
I
I
I
I
I
I
I
image:
 TECHNOLOGIES
c-1
• HI
o
r '
fe!
o
Q
N
O
o
0
OH
C^
Lj
^T^
(-M
fl^
u
o
£
JD
fe
0
CO
W
1
W
fa
rH
1
n
r^i
^•7
ff\
tH
«
4-
c
C-.
4>
O
&
3
Principle
rH &
0 0
i* rH
£ °
o ji
u u
4)
4J
^^ ^-1 Ii i rj , -
0 0> rc >, 3 T3 &i G
4J-0 fl-ti T3 Si 4> C £
Cm t! TJ 4) 4-> 4-J 4> -H 4-J
3 4J tn . . TJ r3 2 4> W (0 Si W 4)
§mcw o£v'£$ >: * c'ZS* *
111 riil^il i*
ap: ssi*s* si^s:*
ssjrl S - sli 9 " sssilf
§ fcll -HSSSJSg -Sc W^S|
•§£ £ S §-SS£^3.,il£5tl
O-gSi! $£fe°e° -H § 3 rc g"|
03?4->4-J OSUDlfLi-rlCJ W Si 4-J g £ §
tn
fl V^
4) -H 4)
W 43 U 4J
4) 4) 4-> 3 <0
W 43 T3 S
4) G >-i 4)
SM W -H U
O 4) 4-) >H (C
G U 043 MH
-H 3 03 4) Si
T3 4) G 4) t/1
G OS 043
<C U 4J Si
o
C > S-l -<4H
O >H 4) rH
•H 4-> 4J (0 rH
W -H (0 -H rc
0 rH S Si -H
Si -H 4) 4-J •
4) 43 *W 4-> G G
(0 O (C 4) O
W 4-J H 4-1 -H
4) W 4-J O 4J
U G 4) ft 3
3 4J 3 4-> rH
T3 4-J O W 4) rH
4) -H S rc 43 O
OS W rc |5 4-J O<
i «.s -^ si §
§ *" s. ° S
pi asia :i°
111,. -aiSs 1SI
w>§™ i^a-s gs^
rH4)U-H -OOrC U&S
|^§^ -a^l ^8S
|5*| gfiJti - ^5o
U,n, -S WrHT3 0) G,
g-Sft^1 SSSSg g.'g.aSj
llgi SSs^S, ^-3-nlo
I->te33 WM-fiM^CT* UW^S
/-t
o c
•H §
^ Z> 0
> Si •"
*^ <U j_i
0 § « g
4-J Si Zj
C w a}
C CO 5 ^
3 -H o
1 1 OS B S
tion and controlled
discharge of the peak
flow.
Decreases erosion and
infiltration. Requires
maintenance.
1 01
G 4-J
•H U
T3 i — I &i
G rH Si
(0 O ro
CJ 43
rH U
rH 05
-H • -H
MH rH T3
i-H
O MH O
G O 4)
O 4-J U}
•H G 3
W -H O)
O Si
-i 5
4) O Si
•H 0
W 4-J 14H
4) rC
U Si Si
3 4-J 4)
4) -H (0
OS *4H j£
4-J O rH
U -H 1C
Drained benches colle
and remove precipitat
falling on the dispos
site.
G
O
•H
U
4)
rH
rH
O
° §
MH 4-J
tw w
0 >H
G co
«
CdlTects water for
reuse, treatment and
discharge .
!
•o
<u
4-t
(0
G
-H
4-1
c
O
I
O
4)
U)
(0
4)
i-H
4)
Si
A
G (Q
O £-i
t> <JJ
0) 4-1
S* ro
O
4-J
•0
4) T3
W G
3 ro
S-i 4-J
(0 ro
. 43
W U
T3 (0
G 41
O rH
Di
> G <4H
T3 -H MH
4) ro O
G 4-> C
-H, 4) 3
i
4)
ro.
43: C
Oi O
rol-H
I-H. u
•^-.' 4) W
MHIrH T3
<4H!rH G
o; o o
G;U a.
&' I
oo
CO
m'
o
o
fO
co
CO
£-.
o
1
CW
w
tl
4)
o
3
O
CO
229
image:
TECHNOLOGIES
c-1
• HI
o
r '
fe!
o
Q
N
O
o
0
OH
C^
Lj
^T^
(-M
fl^
u
o
£
JD
fe
0
CO
W
1
W
fa
rH
1
n
r^i
^•7
ff\
tH
«
4-
c
C-.
4>
O
&
3
Principle
rH &
0 0
i* rH
£ °
o ji
u u
4)
4J
^^ ^-1 Ii i rj , -
0 0> rc >, 3 T3 &i G
4J-0 fl-ti T3 Si 4> C £
Cm t! TJ 4) 4-> 4-J 4> -H 4-J
3 4J tn . . TJ r3 2 4> W (0 Si W 4)
§mcw o£v'£$ >: * c'ZS* *
111 riil^il i*
ap: ssi*s* si^s:*
ssjrl S - sli 9 " sssilf
§ fcll -HSSSJSg -Sc W^S|
•§£ £ S §-SS£^3.,il£5tl
O-gSi! $£fe°e° -H § 3 rc g"|
03?4->4-J OSUDlfLi-rlCJ W Si 4-J g £ §
tn
fl V^
4) -H 4)
W 43 U 4J
4) 4) 4-> 3 <0
W 43 T3 S
4) G >-i 4)
SM W -H U
O 4) 4-) >H (C
G U 043 MH
-H 3 03 4) Si
T3 4) G 4) t/1
G OS 043
<C U 4J Si
o
C > S-l -<4H
O >H 4) rH
•H 4-> 4J (0 rH
W -H (0 -H rc
0 rH S Si -H
Si -H 4) 4-J •
4) 43 *W 4-> G G
(0 O (C 4) O
W 4-J H 4-1 -H
4) W 4-J O 4J
U G 4) ft 3
3 4J 3 4-> rH
T3 4-J O W 4) rH
4) -H S rc 43 O
OS W rc |5 4-J O<
i «.s -^ si §
§ *" s. ° S
pi asia :i°
111,. -aiSs 1SI
w>§™ i^a-s gs^
rH4)U-H -OOrC U&S
|^§^ -a^l ^8S
|5*| gfiJti - ^5o
U,n, -S WrHT3 0) G,
g-Sft^1 SSSSg g.'g.aSj
llgi SSs^S, ^-3-nlo
I->te33 WM-fiM^CT* UW^S
/-t
o c
•H §
^ Z> 0
> Si •"
*^ <U j_i
0 § « g
4-J Si Zj
C w a}
C CO 5 ^
3 -H o
1 1 OS B S
tion and controlled
discharge of the peak
flow.
Decreases erosion and
infiltration. Requires
maintenance.
1 01
G 4-J
•H U
T3 i — I &i
G rH Si
(0 O ro
CJ 43
rH U
rH 05
-H • -H
MH rH T3
i-H
O MH O
G O 4)
O 4-J U}
•H G 3
W -H O)
O Si
-i 5
4) O Si
•H 0
W 4-J 14H
4) rC
U Si Si
3 4-J 4)
4) -H (0
OS *4H j£
4-J O rH
U -H 1C
Drained benches colle
and remove precipitat
falling on the dispos
site.
G
O
•H
U
4)
rH
rH
O
° §
MH 4-J
tw w
0 >H
G co
«
CdlTects water for
reuse, treatment and
discharge .
!
•o
<u
4-t
(0
G
-H
4-1
c
O
I
O
4)
U)
(0
4)
i-H
4)
Si
A
G (Q
O £-i
t> <JJ
0) 4-1
S* ro
O
4-J
•0
4) T3
W G
3 ro
S-i 4-J
(0 ro
. 43
W U
T3 (0
G 41
O rH
Di
> G <4H
T3 -H MH
4) ro O
G 4-> C
-H, 4) 3
i
4)
ro.
43: C
Oi O
rol-H
I-H. u
•^-.' 4) W
MHIrH T3
<4H!rH G
o; o o
G;U a.
&' I
oo
CO
m'
o
o
fO
co
CO
£-.
o
1
CW
w
tl
4)
o
3
O
CO
229
image:
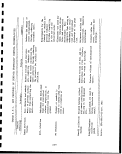 may include ditches, lined channels, conduits, and embankments
arranged to direct the flow of surface water around or away from
the waste material, and energy dissipators to moderate the impact
of the flow.
The complexity and extent of the system will vary widely based on
the amount of water to be diverted and the arrangement of the
site. For a fill on a relatively level site, runon diversion may
be only a system of channels and small embankments to deflect sur-
face flow away from the landfill. In the case of a head-of-valley
fill or a cross-valley fill, runon diversion might include an em-
bankment dam to retain peak flows from the design storm until they
can be passed through a conduit beneath or around the fill. Alter
natively, the system may consist of a conduit or channel large
enough to pass the design flow without an embankment (without re-
tention) .
The costs for three runon diversion systems were estimated and
they are plotted in Figure 4.3-2. Examples 1 and 2 consisted of
runon retention in combination with continuous release. Example
3 was designed for no retention, which necessitated a large chan-
nel and extensive use of reinforced concrete energy dissipators;
the higher cost associated with such a system is illustrated in
the figure.
Examples 1 and 2 also consisted of an earth embankment for the re-
tention of runon and an embedded conduit for controlled release.
Channeling of the controlled release flow around the _waste pile in
Example 1 was accomplished with a lined canal, while Example 2
utilized an extension of the embedded conduit for the controlled
release.
The cost of a runon diversion system will be influenced by: the
size of the drainage area and topography which affect the runon
rates, retentions, and embankment material .quantities; the size,
length, and complexity of controlled release structures and chan-
neling systems; and the need for and extent of energy dissipators
and/or drop structures. For example, the runon from a site with
a large drainage area in a gently sloping topography could *>e di-
verted quite efficiently by an unlined canal or channel; another
site with small runoff rates, but high erodible steep topography,
may necessitate cost-intensive lined channels, flumes or conduits,
as well as drop structures or energy dissipators. In summary, the
cost of this sytem is highly site-specific.
Runoff Collection System
A runoff collection system usually consists of a system of chan-
nels, ditches, and conduits arranged to prevent the surface water
that has contacted the waste material from leaving the site.
I
I
I
I
I
I
230
1
1
1
1
1
I
I
I
I
I
image:
may include ditches, lined channels, conduits, and embankments
arranged to direct the flow of surface water around or away from
the waste material, and energy dissipators to moderate the impact
of the flow.
The complexity and extent of the system will vary widely based on
the amount of water to be diverted and the arrangement of the
site. For a fill on a relatively level site, runon diversion may
be only a system of channels and small embankments to deflect sur-
face flow away from the landfill. In the case of a head-of-valley
fill or a cross-valley fill, runon diversion might include an em-
bankment dam to retain peak flows from the design storm until they
can be passed through a conduit beneath or around the fill. Alter
natively, the system may consist of a conduit or channel large
enough to pass the design flow without an embankment (without re-
tention) .
The costs for three runon diversion systems were estimated and
they are plotted in Figure 4.3-2. Examples 1 and 2 consisted of
runon retention in combination with continuous release. Example
3 was designed for no retention, which necessitated a large chan-
nel and extensive use of reinforced concrete energy dissipators;
the higher cost associated with such a system is illustrated in
the figure.
Examples 1 and 2 also consisted of an earth embankment for the re-
tention of runon and an embedded conduit for controlled release.
Channeling of the controlled release flow around the _waste pile in
Example 1 was accomplished with a lined canal, while Example 2
utilized an extension of the embedded conduit for the controlled
release.
The cost of a runon diversion system will be influenced by: the
size of the drainage area and topography which affect the runon
rates, retentions, and embankment material .quantities; the size,
length, and complexity of controlled release structures and chan-
neling systems; and the need for and extent of energy dissipators
and/or drop structures. For example, the runon from a site with
a large drainage area in a gently sloping topography could *>e di-
verted quite efficiently by an unlined canal or channel; another
site with small runoff rates, but high erodible steep topography,
may necessitate cost-intensive lined channels, flumes or conduits,
as well as drop structures or energy dissipators. In summary, the
cost of this sytem is highly site-specific.
Runoff Collection System
A runoff collection system usually consists of a system of chan-
nels, ditches, and conduits arranged to prevent the surface water
that has contacted the waste material from leaving the site.
I
I
I
I
I
I
230
1
1
1
1
1
I
I
I
I
I
image:
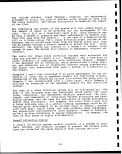 250
500 750
RUNOFF RATE, cfs
1000
NOTES :
i*1 f 2 incjude retention with embankments and contin-
uous controlled release through an embedded conduit.
i
retention was desi9ned to handle the maximum flow without
Example 2 is specific to the TOSCO II case studies, except the
embankment dam is smaller than the one proposed by .Colony.
Mid 1980 $ '
Source: EPA-600/8-83-003, 1983 ;
Figure 4.3-2. Runon Diversion Costs
231
image:
250
500 750
RUNOFF RATE, cfs
1000
NOTES :
i*1 f 2 incjude retention with embankments and contin-
uous controlled release through an embedded conduit.
i
retention was desi9ned to handle the maximum flow without
Example 2 is specific to the TOSCO II case studies, except the
embankment dam is smaller than the one proposed by .Colony.
Mid 1980 $ '
Source: EPA-600/8-83-003, 1983 ;
Figure 4.3-2. Runon Diversion Costs
231
image:
 Another purpose of this system is to drain the surface water from
the wastes to limit the erosion and infiltration potential. Col-
lected water may also be used to meet process needs.
The basic elements of this system are backsloped benches on the
face of the landfill and a means of collecting the water from the
fill surface. Generally, half-round pipes, impervious membranes,
or highly compacted soil or wastes are used to line ditches which
collect the runoff from the bench and the segment of the landfill
slope above it. The ditches then must be drained to a containment/
evaporation pond at the toe of the landfill, or the water must be
impounded on the benches or top of the landfill. A problem with
using embankments on the waste pile is that the water ponded on
the landfill will have a greater tendency to infiltrate the waste
material. This increased infiltration could have a detrimental
effect on the stability of the slope and will somewhat increase
the amount of water which must be handled by the leachate collec-
tion system (discussed under subsurface hydrology).
The costs for a variety of runoff collection system designs were
estimated and these are plotted in Figure 4.3-3. Example 1 used
shaped benches with unlined ditches for lateral conveyance and
concrete weir collectors and corrugated metal pipe with energy
dissipators for vertical conveyance. It also incorporated some
temporary retention of runoff on the waste pile surface, which re-
duced the necessary capacity and cost of the vertical conveyance
portion of the system. Example 2 used split corrugated metal pipe
to line the collection ditches to facilitate lateral conveyance,
and concrete weir collectors and corrugated metal pipe with energy
dissipators for vertical conveyance. Example 3 used the lined
ditches for lateral conveyance, with a concrete flume and a
stilling basin for vertical conveyance.
The cost data, as can be seen in the plot, are highly dependent on
the particular design, an no single cost curve relationship can be
drawn through the data points. Example 1, which assumes a more
modest design, defines the lower boundary of the cost envelope,
and Example 3 defines the high end of the cost envelope.
Runoff/Leachate Collection Ponds
At the outlet of the collection system for surface runoff, a
structure is needed to contain the collected water for reuse,
treatment and discharge, or for evaporation. The structure would
consist of an embankment across a former stream channel to form a
pond, and the pond may be lined or unlined depending upon the na-
ture of the impounded material. If a liner is needed, it would be
protected from wave action, as necessary, using rip-rap, a sand
layer, soil cement or similar materials. Since the pond would be
located at the base of the landfill, it might also be used to col-
lect the leachate from the fill.
1
I
I
I
1
1
I
I
232
1
I
1
1
1
I
1
I
I
1
image:
Another purpose of this system is to drain the surface water from
the wastes to limit the erosion and infiltration potential. Col-
lected water may also be used to meet process needs.
The basic elements of this system are backsloped benches on the
face of the landfill and a means of collecting the water from the
fill surface. Generally, half-round pipes, impervious membranes,
or highly compacted soil or wastes are used to line ditches which
collect the runoff from the bench and the segment of the landfill
slope above it. The ditches then must be drained to a containment/
evaporation pond at the toe of the landfill, or the water must be
impounded on the benches or top of the landfill. A problem with
using embankments on the waste pile is that the water ponded on
the landfill will have a greater tendency to infiltrate the waste
material. This increased infiltration could have a detrimental
effect on the stability of the slope and will somewhat increase
the amount of water which must be handled by the leachate collec-
tion system (discussed under subsurface hydrology).
The costs for a variety of runoff collection system designs were
estimated and these are plotted in Figure 4.3-3. Example 1 used
shaped benches with unlined ditches for lateral conveyance and
concrete weir collectors and corrugated metal pipe with energy
dissipators for vertical conveyance. It also incorporated some
temporary retention of runoff on the waste pile surface, which re-
duced the necessary capacity and cost of the vertical conveyance
portion of the system. Example 2 used split corrugated metal pipe
to line the collection ditches to facilitate lateral conveyance,
and concrete weir collectors and corrugated metal pipe with energy
dissipators for vertical conveyance. Example 3 used the lined
ditches for lateral conveyance, with a concrete flume and a
stilling basin for vertical conveyance.
The cost data, as can be seen in the plot, are highly dependent on
the particular design, an no single cost curve relationship can be
drawn through the data points. Example 1, which assumes a more
modest design, defines the lower boundary of the cost envelope,
and Example 3 defines the high end of the cost envelope.
Runoff/Leachate Collection Ponds
At the outlet of the collection system for surface runoff, a
structure is needed to contain the collected water for reuse,
treatment and discharge, or for evaporation. The structure would
consist of an embankment across a former stream channel to form a
pond, and the pond may be lined or unlined depending upon the na-
ture of the impounded material. If a liner is needed, it would be
protected from wave action, as necessary, using rip-rap, a sand
layer, soil cement or similar materials. Since the pond would be
located at the base of the landfill, it might also be used to col-
lect the leachate from the fill.
1
I
I
I
1
1
I
I
232
1
I
1
1
1
I
1
I
I
1
image:
 (C
O
•**-
V)
O
O
< 3
cc 5
LiJ
Q.
O
I- 2
O
LU
o i U
0
o.
O
_L
IOO 200 300
RUNOFF QUANTITY, ACRE-FT
4OD
NOTES: :
|
j
Example 1 utilizes shaped benches as unlined ditches for
lateral runoff conveyance. |
Examples 2 & 3 utilize buried corrugated metal pipe to line
ditches for lateral runoff conveyance.
Examples 1 & 2 utilize buried corrugated metal pipe and energy
dissipators for vertical runoff conveyance. ;
Example 3 utilizes a concrete flume with stilling basin for
vertical runoff conveyance. ;
Mid 1980 $ :
The costs indicated are cumulative for the project life.
Source: EPA-600/8-83-003, 1983
Figure 4.3-3. Runoff Collection Costs i
233
image:
(C
O
•**-
V)
O
O
< 3
cc 5
LiJ
Q.
O
I- 2
O
LU
o i U
0
o.
O
_L
IOO 200 300
RUNOFF QUANTITY, ACRE-FT
4OD
NOTES: :
|
j
Example 1 utilizes shaped benches as unlined ditches for
lateral runoff conveyance. |
Examples 2 & 3 utilize buried corrugated metal pipe to line
ditches for lateral runoff conveyance.
Examples 1 & 2 utilize buried corrugated metal pipe and energy
dissipators for vertical runoff conveyance. ;
Example 3 utilizes a concrete flume with stilling basin for
vertical runoff conveyance. ;
Mid 1980 $ :
The costs indicated are cumulative for the project life.
Source: EPA-600/8-83-003, 1983
Figure 4.3-3. Runoff Collection Costs i
233
image:
 Cost data for four examples of runoff/leachate collection ™
ponds are presented in Figures 4.3-4 and 4.3-5. Figure 4.3-4
presents the total cost of the embankment and liner as a fl
function of the construction material quantities used in each QJ
case, while Figure 4.3-5 isolates the cost of the liner as a
function of the liner material quantity only. n
Examples 1, 2 and 3 utilized compacted processed shale as a
liner, while Example 4 used Mancos Shale as the liner. The «
relatively high cost of using an off-tract material (Example 4) •
is evident in the figures. The cost increase is incurred due m
to the source development, processing and hauling of Mancos
Shale. •
Slight cost differences may be observed between similar systems,
and these can be attributed to site-specific features, such as
the arrangement and configuration of the embankment and ponds.
4.3.2 Subsurface Hydrology Control Technologies gj
The technologies and practices in the area of subsurface hydrology •
involve the handling of groundwater seepage under a landfill . to pi
prevent infiltration of the pile and the control of water from the
pile to prevent contamination of the groundwater. «
The technologies, as summarized in Figure 4.3-6, are applicable
to a surface landfill, and their key features are presented in at
Table 4.3-2. Detailed descriptions of the technologies, along J|
with cost information, are presented below.
234
I
Liners and Covers
A liner is essentially a material with low water permeability •
that is installed at the bottom of a landfill or pond. Its m
purpose is to prevent the contaminated waters from the wastes
from mixing with the groundwater. It also prevents groundwater •
from infiltrating the bottom of the landfill. H
A cover is also made up of a low-permeability material and it is I
used as a surface sealer for the landfill. It prevents the •
runoff from infiltrating the pile, thereby reducing the quantity
of the leachate and minimizing stability problems. ffi
1
1
1
image:
Cost data for four examples of runoff/leachate collection ™
ponds are presented in Figures 4.3-4 and 4.3-5. Figure 4.3-4
presents the total cost of the embankment and liner as a fl
function of the construction material quantities used in each QJ
case, while Figure 4.3-5 isolates the cost of the liner as a
function of the liner material quantity only. n
Examples 1, 2 and 3 utilized compacted processed shale as a
liner, while Example 4 used Mancos Shale as the liner. The «
relatively high cost of using an off-tract material (Example 4) •
is evident in the figures. The cost increase is incurred due m
to the source development, processing and hauling of Mancos
Shale. •
Slight cost differences may be observed between similar systems,
and these can be attributed to site-specific features, such as
the arrangement and configuration of the embankment and ponds.
4.3.2 Subsurface Hydrology Control Technologies gj
The technologies and practices in the area of subsurface hydrology •
involve the handling of groundwater seepage under a landfill . to pi
prevent infiltration of the pile and the control of water from the
pile to prevent contamination of the groundwater. «
The technologies, as summarized in Figure 4.3-6, are applicable
to a surface landfill, and their key features are presented in at
Table 4.3-2. Detailed descriptions of the technologies, along J|
with cost information, are presented below.
234
I
Liners and Covers
A liner is essentially a material with low water permeability •
that is installed at the bottom of a landfill or pond. Its m
purpose is to prevent the contaminated waters from the wastes
from mixing with the groundwater. It also prevents groundwater •
from infiltrating the bottom of the landfill. H
A cover is also made up of a low-permeability material and it is I
used as a surface sealer for the landfill. It prevents the •
runoff from infiltrating the pile, thereby reducing the quantity
of the leachate and minimizing stability problems. ffi
1
1
1
image:
 (0
o
V)
o
o
Q.
<
O
O
UJ
X
NOTES:
O
J_
_L
°-l 0.2 0.3 0.4
CONSTRUCTION MATERIAL VOLUME, I06 yd3
0.5
All Examples include cost of embankments and pond liners.
Examples 1,2 & 3 include pond liners constructed of processed
snale.
Example 4 includes a liner constructed of Mancos Shale (off-
tract material); cost is increased due to processing and
transport. •
Mid 1980 $ |
Source: EPA-600/8-83-003, 1983
Figure 4.3-4. Runoff/Leachate Pond Costs
235
image:
(0
o
V)
o
o
Q.
<
O
O
UJ
X
NOTES:
O
J_
_L
°-l 0.2 0.3 0.4
CONSTRUCTION MATERIAL VOLUME, I06 yd3
0.5
All Examples include cost of embankments and pond liners.
Examples 1,2 & 3 include pond liners constructed of processed
snale.
Example 4 includes a liner constructed of Mancos Shale (off-
tract material); cost is increased due to processing and
transport. •
Mid 1980 $ |
Source: EPA-600/8-83-003, 1983
Figure 4.3-4. Runoff/Leachate Pond Costs
235
image:
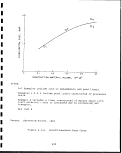 I
1000
800
10
O
_- 600
cn
o
o
G.
g 400
Q
UJ
X
20O
NOTES:
O,
1
100 200
LINER MATERIAL QUANTITY, I03 yd3
Examples 1, 2 & 3 include liners constructed of processed
shale.
Example 4 includes a liner constructed of Mancos Shale (off-
tract material); cost is increased due to processing and
transport.
Mid 1980 $
Source: EPA-600/8-83-003, 1983
Figure 4.3-5. Runoff/Leachate Pond Liner Costs
236
8
I
I
I
I
I
I
I
I
I
I
image:
I
1000
800
10
O
_- 600
cn
o
o
G.
g 400
Q
UJ
X
20O
NOTES:
O,
1
100 200
LINER MATERIAL QUANTITY, I03 yd3
Examples 1, 2 & 3 include liners constructed of processed
shale.
Example 4 includes a liner constructed of Mancos Shale (off-
tract material); cost is increased due to processing and
transport.
Mid 1980 $
Source: EPA-600/8-83-003, 1983
Figure 4.3-5. Runoff/Leachate Pond Liner Costs
236
8
I
I
I
I
I
I
I
I
I
I
image:
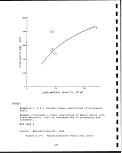 SUBSURFACE
HYDROLOGY
CONTROL
TECHNOLOGIES
LINERS
AND
COVERS
LEACHATE
COLLECTION
SYSTEM
GROUNDWATER
COLLECTION
SYSTEM
r- SYNTHETIC !
OFF-SITE i
NATURAL MATERIAL
i— COMPACTED i
PROCESSED i
SHALE
Source: EPA-600/8-83-003, 1983
Figure 4.3-6. Subsurface Hydrology Control Technologies
237
image:
SUBSURFACE
HYDROLOGY
CONTROL
TECHNOLOGIES
LINERS
AND
COVERS
LEACHATE
COLLECTION
SYSTEM
GROUNDWATER
COLLECTION
SYSTEM
r- SYNTHETIC !
OFF-SITE i
NATURAL MATERIAL
i— COMPACTED i
PROCESSED i
SHALE
Source: EPA-600/8-83-003, 1983
Figure 4.3-6. Subsurface Hydrology Control Technologies
237
image:
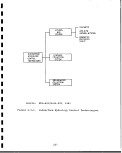 CO
1
S
o
J
o
C_)
0
o
s^
f^\
S
§
r^
m
1
H-l
fyj
r—s
**rt
e
w
o
CO
g
tD
iuHl
^•4
r^
P4
fxj
S
S
•
i
CO
•
«*
S
po
^c
EH
M
4-
(
C
0
a
c
f-
£
4)
iH
O
*H
U
-5
^
PM
>x
rH CT
o o
l_i OH!
•M r~t
4-> O
3 "S
4)
4J
4_1
£ •§
4J -H
4> 4) £ -H
4-1 43 O 43 TJ
CO 4-1 Si Si O TJ
43 <H 4) -H fO
U IH 4J 43
CO O 4) CO & T3
41 4-J & G
rH G tO 'S - fO
0 43 C rH
MH -H U 3 rH >i
O 4-J CO O -H 4J
CO 4) Ji IH -H
C C rH Dl rH .
O -H 4) -H 4)
•H £ >(4-l 43 43 4J
4J tO 43 G 4J fO CO
« 4J 41 4J 43
S C Si > MH W U
Si O 4) 4) O G CO
O U 4-1 Si -H 4)
<H ro pti G rH
4J S 0 4)
4) G TJ -H O rH
O 41 G • 10 3 CO
3 > 3 rH CO T3 G
T3 41 0 rH > 0 0
4> Si Si -H G Si -H
OS CM OllH -H Q,4J
Si
4)
CO
rH W
4-1
ix o
4-> -H
•H Si
rH 4J
•H W
43 41
to Si
Si rH 41
41 4) C7>
CU Si fO
O 41 41
hJ W W
Cfl
Si
41
O
O
1
(0
Si
CD
-S
hJ
4-1
4) 4) -H
> >s CJiiH
CO 4J CO -H
4-J 43 -H 4-> XI
W • iH G CO
4) 4-1 4J -H • to Si
S 3 W XI 4) > 3
O r^ O fo p"H *t3 '"O
iH fj Si XI rt!
4) 4-1 4J T3 G Si
43 -H W O -41
4-1 rH 4) £ -H 4-14-1
-H 43 Si 4-J W 1
4) 43 O> 41 tfl O Dl
rrj 10 -H 4J 41 U G
•H 41 43 1 3 O
> £ C7> O1 43 iH
O Si 41 G &>
Si 4) 43 O to -H to
FM O. 4J hJ "H X -H
rH
fO
Si
3
CO
G iH
rj to
•H 4) -H
4J 4J Si
41 -H 4>
43 W 4-)
4-J I CO
^*t M— f
co o
.
to
rHrH-rH
rH -H CO 1
to IH Si Cn
£ G TJ G •
en -H o >i
>i G -H
• CO 41 W rH
4-1 £ U -H -H
W fC 43
O W -i—i 41 CO
U 41 TJ tJl Si
rH CO CO 3
4-1 fj 4-J TJ
10 -H 4) G
4) 4-J 4J CO £
5 Si CO > Si
O tO Si "tf 41
41
rH
to
43
W
TJ
41
TJ W
4) M
4-1 41
U u
CO O
a< si
£ a,
o
CJ
41 10
43 TJ
. 4)
cO G
S w
Si IQ
41 4)
4-> U
CO O
S Si
T3 °*
4> Si
4J O
u m
4)
• — i 'O
rH 4)
O W
a 3
G
O rH
•rH i-H
4-> -H
to <H
G
•H 41 m c
£ 43 0 0
CO 4-) -H
4-1 10 4-1
C O* tfl co
O C O Si
U -H rH 3
> 4J
Si o w co
4> £ 4-1 W
4-1 41 G
CO Si 4) O
S > 4-1
Tj >^i QJ
G rH Si 4)
3 4) CM 3
0 > T)
,^."1
tn 4-i • >i
U 41 4-J
W 4) 4-1 -H
4) "H CO rH
U 4H 43 -H
3 4) U 43
T3 CO CO
41 t>i 41 4-1
OS 43 rH W
4) T3
43 G
4-1 CO
4-1 iH T3
CO rH G
•H 0
41 <H (2,
4J T3
CO G 4>
43 fO 43
U rH 4-1
cO
41 41 O
rH 43 4-J
4-> G
tfl -H
4-J m
U O M
4) C
rH 4> -H
rH tfl CO
O CO Si
CJ XI T)
1
U
41
•H £
rH 4)
0 4-1
u to
41 10
4-1
(i O
U -H
CO 4-1
41
41 to
^f} ri^
41
£>t 4)
CO G
£
to
41 4)
4J u
fO O
3: Si
41 Si
4-J 0
CJ (H
4)
rH TJ
rH 41
o to
U 3
^1
4-1
-H Si
iH 41
-H 4-1 •
XI tO Si
CO S 4)
4J T3 G
W C -H
rH O
rH Si 41
-H O>43
*H | '
*H
MH 0 43
O 4-J
a. to
W 3 41
to T5 G
0 rH 4)
rH -H XI
tO 43 41
4-J Si
G 0 3
4) 4-1 to
> W
4) 41 41
Si 3 Si
p j ni5 Q.
i
C
(0
p"H
Si
4) 41
4J ,rj
CO 4-J
rQ rcj i
G 4-> C
3 (0 -H
O 4) co
Si G Si
CJ* 4) T3
XI
W T)
4-1 41 G
CJ O> CO
4) CO
rH OirH
rH 41 iH
O 41 -H
CJ to IH
Si §
4) -H
4-1 4-J
CO U £
S 41 41
"6 iH 4J
G rH tfl
3 O tx
O U W
O
.
CO
oo
rH
ro
o
o
i
00
00
00
o
o
1
h5
Kx3
4)
fj
Si
3
o
CO
I
1
I
I
I
I
I
238
image:
CO
1
S
o
J
o
C_)
0
o
s^
f^\
S
§
r^
m
1
H-l
fyj
r—s
**rt
e
w
o
CO
g
tD
iuHl
^•4
r^
P4
fxj
S
S
•
i
CO
•
«*
S
po
^c
EH
M
4-
(
C
0
a
c
f-
£
4)
iH
O
*H
U
-5
^
PM
>x
rH CT
o o
l_i OH!
•M r~t
4-> O
3 "S
4)
4J
4_1
£ •§
4J -H
4> 4) £ -H
4-1 43 O 43 TJ
CO 4-1 Si Si O TJ
43 <H 4) -H fO
U IH 4J 43
CO O 4) CO & T3
41 4-J & G
rH G tO 'S - fO
0 43 C rH
MH -H U 3 rH >i
O 4-J CO O -H 4J
CO 4) Ji IH -H
C C rH Dl rH .
O -H 4) -H 4)
•H £ >(4-l 43 43 4J
4J tO 43 G 4J fO CO
« 4J 41 4J 43
S C Si > MH W U
Si O 4) 4) O G CO
O U 4-1 Si -H 4)
<H ro pti G rH
4J S 0 4)
4) G TJ -H O rH
O 41 G • 10 3 CO
3 > 3 rH CO T3 G
T3 41 0 rH > 0 0
4> Si Si -H G Si -H
OS CM OllH -H Q,4J
Si
4)
CO
rH W
4-1
ix o
4-> -H
•H Si
rH 4J
•H W
43 41
to Si
Si rH 41
41 4) C7>
CU Si fO
O 41 41
hJ W W
Cfl
Si
41
O
O
1
(0
Si
CD
-S
hJ
4-1
4) 4) -H
> >s CJiiH
CO 4J CO -H
4-J 43 -H 4-> XI
W • iH G CO
4) 4-1 4J -H • to Si
S 3 W XI 4) > 3
O r^ O fo p"H *t3 '"O
iH fj Si XI rt!
4) 4-1 4J T3 G Si
43 -H W O -41
4-1 rH 4) £ -H 4-14-1
-H 43 Si 4-J W 1
4) 43 O> 41 tfl O Dl
rrj 10 -H 4J 41 U G
•H 41 43 1 3 O
> £ C7> O1 43 iH
O Si 41 G &>
Si 4) 43 O to -H to
FM O. 4J hJ "H X -H
rH
fO
Si
3
CO
G iH
rj to
•H 4) -H
4J 4J Si
41 -H 4>
43 W 4-)
4-J I CO
^*t M— f
co o
.
to
rHrH-rH
rH -H CO 1
to IH Si Cn
£ G TJ G •
en -H o >i
>i G -H
• CO 41 W rH
4-1 £ U -H -H
W fC 43
O W -i—i 41 CO
U 41 TJ tJl Si
rH CO CO 3
4-1 fj 4-J TJ
10 -H 4) G
4) 4-J 4J CO £
5 Si CO > Si
O tO Si "tf 41
41
rH
to
43
W
TJ
41
TJ W
4) M
4-1 41
U u
CO O
a< si
£ a,
o
CJ
41 10
43 TJ
. 4)
cO G
S w
Si IQ
41 4)
4-> U
CO O
S Si
T3 °*
4> Si
4J O
u m
4)
• — i 'O
rH 4)
O W
a 3
G
O rH
•rH i-H
4-> -H
to <H
G
•H 41 m c
£ 43 0 0
CO 4-) -H
4-1 10 4-1
C O* tfl co
O C O Si
U -H rH 3
> 4J
Si o w co
4> £ 4-1 W
4-1 41 G
CO Si 4) O
S > 4-1
Tj >^i QJ
G rH Si 4)
3 4) CM 3
0 > T)
,^."1
tn 4-i • >i
U 41 4-J
W 4) 4-1 -H
4) "H CO rH
U 4H 43 -H
3 4) U 43
T3 CO CO
41 t>i 41 4-1
OS 43 rH W
4) T3
43 G
4-1 CO
4-1 iH T3
CO rH G
•H 0
41 <H (2,
4J T3
CO G 4>
43 fO 43
U rH 4-1
cO
41 41 O
rH 43 4-J
4-> G
tfl -H
4-J m
U O M
4) C
rH 4> -H
rH tfl CO
O CO Si
CJ XI T)
1
U
41
•H £
rH 4)
0 4-1
u to
41 10
4-1
(i O
U -H
CO 4-1
41
41 to
^f} ri^
41
£>t 4)
CO G
£
to
41 4)
4J u
fO O
3: Si
41 Si
4-J 0
CJ (H
4)
rH TJ
rH 41
o to
U 3
^1
4-1
-H Si
iH 41
-H 4-1 •
XI tO Si
CO S 4)
4J T3 G
W C -H
rH O
rH Si 41
-H O>43
*H | '
*H
MH 0 43
O 4-J
a. to
W 3 41
to T5 G
0 rH 4)
rH -H XI
tO 43 41
4-J Si
G 0 3
4) 4-1 to
> W
4) 41 41
Si 3 Si
p j ni5 Q.
i
C
(0
p"H
Si
4) 41
4J ,rj
CO 4-J
rQ rcj i
G 4-> C
3 (0 -H
O 4) co
Si G Si
CJ* 4) T3
XI
W T)
4-1 41 G
CJ O> CO
4) CO
rH OirH
rH 41 iH
O 41 -H
CJ to IH
Si §
4) -H
4-1 4-J
CO U £
S 41 41
"6 iH 4J
G rH tfl
3 O tx
O U W
O
.
CO
oo
rH
ro
o
o
i
00
00
00
o
o
1
h5
Kx3
4)
fj
Si
3
o
CO
I
1
I
I
I
I
I
238
image:
 There are several materials which can be considered for the
liners and covers. Probably the least expensive material would
be compacted processed shale. It has the advantage of being
readily available at the site. A similar lining could be made, of
processed shale or clay from off site if the quality of the
processed shale from the site is unsuitable; however, these
options would be relatively expensive due to the extra handling
and hauling costs. There is also a variety of synthetic liners
which could be considered. High-density polyethylene, for example,
would range upward from a price similar to that for the off-site
materials, depending upon the thickness used. This would make it
very expensive for use in a processed shale landfill and it may
have questionable long-term durability.
Linings made of natural or synthetic materials may dry and crack
if they are left exposed to the weathering elements for long
periods. The catchment and evaporation ponds presumably will need
only one liner or no liner since they will not contain hazardous
materials. If a combination of two liners is used, the synthetic
liner may be placed above the natural material linerj to prevent
its drying and cracking. In cases where a synthetic liner is
used,, it should be covered by a layer of sand or gravel to protect
it from traffic and wave action. Also, because of the weight of
the fill and because the fill may be placed above an iunderground
mine,, the liner must accommodate a certain amount of subsidence
and stretching and still function properly. !
The cost of liners and covers depend on the quantity and type of
material used. Figure 4.3-7 presents the costs for three separate
liner and cover systems. Examples 1 and 2 assumed the use of
highly compacted processed shale for construction of ithe liners,
while Example 3 assumed the use of Mancos Shale. The compacted
processed shale represents the lowest material cost option, while
Mancos Shales is a more expensive natural material since it has
associated source development, processing and hauling costs. The
cost curve in the figure may be used to obtain an "orde;r-of-magni-
tude" estimate of liner cost utilizing highly compacted processed
shale as the construction material. The estimated cost for other
liner materials would fall above this curve to a degrbe which is
dependent on the source development, processing, and hauling costs
associated with delivering these materials to the disposal site.
Leachate Collection System - j
The purpose of a leachate collection system is to collect water
which infiltrates a landfill and drain it efficiently ;in order to
prevent the saturation of the landfill and contamination of
grouridwater beneath the waste pile, as well as to; facilitate
handling of the leachate.
Leachate collection systems typically consist of blankets, or
zones, of highly pervious sand and gravel. In some cases this is
239
image:
There are several materials which can be considered for the
liners and covers. Probably the least expensive material would
be compacted processed shale. It has the advantage of being
readily available at the site. A similar lining could be made, of
processed shale or clay from off site if the quality of the
processed shale from the site is unsuitable; however, these
options would be relatively expensive due to the extra handling
and hauling costs. There is also a variety of synthetic liners
which could be considered. High-density polyethylene, for example,
would range upward from a price similar to that for the off-site
materials, depending upon the thickness used. This would make it
very expensive for use in a processed shale landfill and it may
have questionable long-term durability.
Linings made of natural or synthetic materials may dry and crack
if they are left exposed to the weathering elements for long
periods. The catchment and evaporation ponds presumably will need
only one liner or no liner since they will not contain hazardous
materials. If a combination of two liners is used, the synthetic
liner may be placed above the natural material linerj to prevent
its drying and cracking. In cases where a synthetic liner is
used,, it should be covered by a layer of sand or gravel to protect
it from traffic and wave action. Also, because of the weight of
the fill and because the fill may be placed above an iunderground
mine,, the liner must accommodate a certain amount of subsidence
and stretching and still function properly. !
The cost of liners and covers depend on the quantity and type of
material used. Figure 4.3-7 presents the costs for three separate
liner and cover systems. Examples 1 and 2 assumed the use of
highly compacted processed shale for construction of ithe liners,
while Example 3 assumed the use of Mancos Shale. The compacted
processed shale represents the lowest material cost option, while
Mancos Shales is a more expensive natural material since it has
associated source development, processing and hauling costs. The
cost curve in the figure may be used to obtain an "orde;r-of-magni-
tude" estimate of liner cost utilizing highly compacted processed
shale as the construction material. The estimated cost for other
liner materials would fall above this curve to a degrbe which is
dependent on the source development, processing, and hauling costs
associated with delivering these materials to the disposal site.
Leachate Collection System - j
The purpose of a leachate collection system is to collect water
which infiltrates a landfill and drain it efficiently ;in order to
prevent the saturation of the landfill and contamination of
grouridwater beneath the waste pile, as well as to; facilitate
handling of the leachate.
Leachate collection systems typically consist of blankets, or
zones, of highly pervious sand and gravel. In some cases this is
239
image:
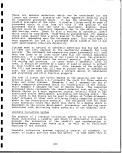 I
I
25
20
K>
O
*»-
H"
g '5
O
o
z
H
o:
UJ
fe lo
I-
o
LJ
EC
a
5
0
[3e/2
/
/
/
/
/
/
^
/
/
/
/
/
/
/
/
/
/
/
1 I 1 1
I
I
I
4 6 IE
MATERIAL QUANTITY, I06 yd3
16
NOTES:
1
1
1
Examples 1 & 2 utilize 3 feet of highly compacted processed
shale for liner material.
Example 3 utilizes 3 feet of compacted Mancos Shale (off-
tract material) for liner material; cost of processing and
hauling this material makes this option more expensive than
the others.
Mid 1980 $
Source: EPA-600/8-83-003, 1983
Figure 4.3-7. Liner Costs
240
I
I
I
1
1
I
image:
I
I
25
20
K>
O
*»-
H"
g '5
O
o
z
H
o:
UJ
fe lo
I-
o
LJ
EC
a
5
0
[3e/2
/
/
/
/
/
/
^
/
/
/
/
/
/
/
/
/
/
/
1 I 1 1
I
I
I
4 6 IE
MATERIAL QUANTITY, I06 yd3
16
NOTES:
1
1
1
Examples 1 & 2 utilize 3 feet of highly compacted processed
shale for liner material.
Example 3 utilizes 3 feet of compacted Mancos Shale (off-
tract material) for liner material; cost of processing and
hauling this material makes this option more expensive than
the others.
Mid 1980 $
Source: EPA-600/8-83-003, 1983
Figure 4.3-7. Liner Costs
240
I
I
I
1
1
I
image:
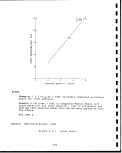 augmented with embedded perforated pipe to increase the capacity,
and it may also include collector ditches where the system emerges
onto a broad level area. The sand or gravel layer would be lo-
cated just above the bottom liner and it may be wrapped in filter
fabric or surrounded by carefully graded sand filters to prevent
infiltration by the processed shale particles. In either case,
collection system should be designed so that movement jand settle-
ment do not result in discontinuity of the gravel layer or impede
drainage to the collection or evaporation ponds. j
The costs for four distinct leachate collection systems were esti-
mated and these are presented in Figure 4.3-8. In Examples 1 and
2, due to the valley shape of the disposal site, onliy the drain
material was necessary for the collection system. The!leachate in
these two cases was drained in the runoff/leachate collection pond
located downstream from the landfill. In Example 3, ia toe ditch
was necessary to collect the leachate due to the presence of the
broad valley area at the toe of the landfill. The ditch was then
drained into the common runoff/leachate collection pond. Example
4 also required a toe ditch which was drained into a leachate col-
lection pond, while the runoff was impounded separately in evapor-
ation ponds on the waste pile surface. Examples 3 and 4 required
the same drainage material quantity. The cost difference between
the two examples is due to the inclusion of a separate collection
pond in Example 4. Data point 5 on the figure represents the cost
of drainage material only for Examples 3 and 4. The cost of the
toe ditch may be obtained by subtracting data point 5 from 4.
The costs for similar systems should be proportional to the volume
of drainage material used, but slight deviations may! be encoun-
tered due to the site-specific conditions.
Groundwater Collection System j
The purpose of a groundwater collection system is to relieve pres-
sure from the seeps and springs beneath a landfill. !This situa-
tion is most likely in the cases of cross-valley or head-of valley
landfills. The system will be essentially identical to the leach-
ate collection system except it would be below the bottom liner
rather than above it. i
f
Groundwater collection systems typically consist of blankets or
zones of pervious sand and gravel drained beyond the perimeter of
the landfill. This may be augmented with embedded perforated pipe
to increase capacity and with collector ditches. The sand or gra-
vel layer would be lined as necessary with filter fabric or sur-
rounded by properly graded sand filters to prevent infiltration
of smaller particles from adjacent materials. The system must
also be designed to maintain its continuity despite possible sub-
sidence or settlement of the landfill. ,
241
image:
augmented with embedded perforated pipe to increase the capacity,
and it may also include collector ditches where the system emerges
onto a broad level area. The sand or gravel layer would be lo-
cated just above the bottom liner and it may be wrapped in filter
fabric or surrounded by carefully graded sand filters to prevent
infiltration by the processed shale particles. In either case,
collection system should be designed so that movement jand settle-
ment do not result in discontinuity of the gravel layer or impede
drainage to the collection or evaporation ponds. j
The costs for four distinct leachate collection systems were esti-
mated and these are presented in Figure 4.3-8. In Examples 1 and
2, due to the valley shape of the disposal site, onliy the drain
material was necessary for the collection system. The!leachate in
these two cases was drained in the runoff/leachate collection pond
located downstream from the landfill. In Example 3, ia toe ditch
was necessary to collect the leachate due to the presence of the
broad valley area at the toe of the landfill. The ditch was then
drained into the common runoff/leachate collection pond. Example
4 also required a toe ditch which was drained into a leachate col-
lection pond, while the runoff was impounded separately in evapor-
ation ponds on the waste pile surface. Examples 3 and 4 required
the same drainage material quantity. The cost difference between
the two examples is due to the inclusion of a separate collection
pond in Example 4. Data point 5 on the figure represents the cost
of drainage material only for Examples 3 and 4. The cost of the
toe ditch may be obtained by subtracting data point 5 from 4.
The costs for similar systems should be proportional to the volume
of drainage material used, but slight deviations may! be encoun-
tered due to the site-specific conditions.
Groundwater Collection System j
The purpose of a groundwater collection system is to relieve pres-
sure from the seeps and springs beneath a landfill. !This situa-
tion is most likely in the cases of cross-valley or head-of valley
landfills. The system will be essentially identical to the leach-
ate collection system except it would be below the bottom liner
rather than above it. i
f
Groundwater collection systems typically consist of blankets or
zones of pervious sand and gravel drained beyond the perimeter of
the landfill. This may be augmented with embedded perforated pipe
to increase capacity and with collector ditches. The sand or gra-
vel layer would be lined as necessary with filter fabric or sur-
rounded by properly graded sand filters to prevent infiltration
of smaller particles from adjacent materials. The system must
also be designed to maintain its continuity despite possible sub-
sidence or settlement of the landfill. ,
241
image:
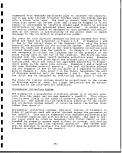 100
tn
o
ce
LU
o
UJ
IE
50
o.
03
5,000 10,000
VOLUME OF DRAIN MATERIAL, yd3
NOTES:
Examples 1 & 2 require only drain material due to the valley
shape; leachate containment is performed by the contaminated
runoff catchment pond of which the leachate is a negligible
component.
Example 3 includes cost of toe ditch for collection due to
broad valley at waste pile toe; containment is also by the
contaminated runoff catchment pond.
Example 4 includes toe ditch collection and separate contain-
ment pond because, in this case, contaminated runoff is con-
tained in evaporation ponds on the waste pile surface.
Example 5 includes only the drain material cost of Examples
3 & 4.
Mid 1980 $
The costs indicated are cumulative for the project like.
Source: EPA-600/8-83-003, 1983
Figure 4.3-8. Leachate Collection Costs
I
I
I
1
242
I
1
1
I
1
I
I
I
1
I
image:
100
tn
o
ce
LU
o
UJ
IE
50
o.
03
5,000 10,000
VOLUME OF DRAIN MATERIAL, yd3
NOTES:
Examples 1 & 2 require only drain material due to the valley
shape; leachate containment is performed by the contaminated
runoff catchment pond of which the leachate is a negligible
component.
Example 3 includes cost of toe ditch for collection due to
broad valley at waste pile toe; containment is also by the
contaminated runoff catchment pond.
Example 4 includes toe ditch collection and separate contain-
ment pond because, in this case, contaminated runoff is con-
tained in evaporation ponds on the waste pile surface.
Example 5 includes only the drain material cost of Examples
3 & 4.
Mid 1980 $
The costs indicated are cumulative for the project like.
Source: EPA-600/8-83-003, 1983
Figure 4.3-8. Leachate Collection Costs
I
I
I
1
242
I
1
1
I
1
I
I
I
1
I
image:
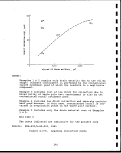 The costs of two groundwater collection systems were estimated and
these are plotted in Figure 4.3-9. Both systems used gravel blan-
kets under the pile to collect the groundwater seepage. In Exam-
ple 2 the gravel blankets were used only above the seeps and
springs, while in Example 1 an extensive network of the blankets
was considered, resulting in a higher cost. The cost;of the col-
lection system should be proportional to the quantity of the
drainage material used. :
4.3.3 Surface Stabilization Technologies ;
i
The activities and technologies in the area of surface stabiliza-
tion involve the treatment of the disturbed land surface and the
problems associated with the disposal and reclamation of the waste
material. These technologies are outlined in Figure; 4.3-10 and
their key features are presented in Table 4.3-3.
Dust Control
The purpose of dust suppression is to limit pollution from air-
borne dust, particularly during the placement of the yaste mater-
ial in a fill. Dust suppression can be accomplished 'by spraying
the haul roads and fill surface with water or a combination of
water and a chemical binder. Haul roads could, alternatively, be
paved. ;
Use of water along for dust suppression would necessitate repeated
applications, often more than one per day, to be effective. Water
with a chemical binder should necessitate only a few applications
to a given surface to stabilize it for a year or more unless it
receives heavy traffic. Finally, vegetation would provide perhaps
the most permanent means of dust control, but this would not be
practical except on surfaces which would not be disturbed for a
number of years. i
E
The dust suppression technology assumed in developing the cost
data for two examples consisted of routine spraying pf the pro-
cessed shale pile with water and additives to minimize the dust
generated due to the wind and the waste hauling and placement
activities. Depending on the processed shale characteristics,
this operation could either be continuous or intermittent. The
cost curve in Figure 4.3-11 is based on the assumption that both
the manpower and equipment operation requirements are !continuous.
Theoretically, these requirements could differ depending on the
rate of waste production and the surface area of the; particular
waste pile; however, both cases estimated were assumed to be
equivalent in this respect. j
Erosion Control \
I
The purpose of erosion control is to keep the waste material in
place so that the surface drains remain free flowing, | the slopes
243
image:
The costs of two groundwater collection systems were estimated and
these are plotted in Figure 4.3-9. Both systems used gravel blan-
kets under the pile to collect the groundwater seepage. In Exam-
ple 2 the gravel blankets were used only above the seeps and
springs, while in Example 1 an extensive network of the blankets
was considered, resulting in a higher cost. The cost;of the col-
lection system should be proportional to the quantity of the
drainage material used. :
4.3.3 Surface Stabilization Technologies ;
i
The activities and technologies in the area of surface stabiliza-
tion involve the treatment of the disturbed land surface and the
problems associated with the disposal and reclamation of the waste
material. These technologies are outlined in Figure; 4.3-10 and
their key features are presented in Table 4.3-3.
Dust Control
The purpose of dust suppression is to limit pollution from air-
borne dust, particularly during the placement of the yaste mater-
ial in a fill. Dust suppression can be accomplished 'by spraying
the haul roads and fill surface with water or a combination of
water and a chemical binder. Haul roads could, alternatively, be
paved. ;
Use of water along for dust suppression would necessitate repeated
applications, often more than one per day, to be effective. Water
with a chemical binder should necessitate only a few applications
to a given surface to stabilize it for a year or more unless it
receives heavy traffic. Finally, vegetation would provide perhaps
the most permanent means of dust control, but this would not be
practical except on surfaces which would not be disturbed for a
number of years. i
E
The dust suppression technology assumed in developing the cost
data for two examples consisted of routine spraying pf the pro-
cessed shale pile with water and additives to minimize the dust
generated due to the wind and the waste hauling and placement
activities. Depending on the processed shale characteristics,
this operation could either be continuous or intermittent. The
cost curve in Figure 4.3-11 is based on the assumption that both
the manpower and equipment operation requirements are !continuous.
Theoretically, these requirements could differ depending on the
rate of waste production and the surface area of the; particular
waste pile; however, both cases estimated were assumed to be
equivalent in this respect. j
Erosion Control \
I
The purpose of erosion control is to keep the waste material in
place so that the surface drains remain free flowing, | the slopes
243
image:
 NOTES:
u>
O
*»• 4
V)
O
O
O
z
tr
ui
CL
o
o
LU
o
I
1
1
I
I
I
I
1
_L
I
'
0-1 0.2 0.3 0.4 0.5 0.6 0.7 0.8 0.9
VOLUME OF DRAIN MATERIAL, I06 yd3
Examples 1 & 2 consist of gravel blankets for collection of
groundwater from springs and seeps; extent of blankets dic-
tated by the existence and extent of such conditions.
Mid 1980 $
The costs indicated are cumulative for the project life.
Source: EPA-600/8-83-003, 1983
Figure 4.3-9. Groundwater Collection Costs
244
I
I
I
I
I
I
I
I
I
I
image:
NOTES:
u>
O
*»• 4
V)
O
O
O
z
tr
ui
CL
o
o
LU
o
I
1
1
I
I
I
I
1
_L
I
'
0-1 0.2 0.3 0.4 0.5 0.6 0.7 0.8 0.9
VOLUME OF DRAIN MATERIAL, I06 yd3
Examples 1 & 2 consist of gravel blankets for collection of
groundwater from springs and seeps; extent of blankets dic-
tated by the existence and extent of such conditions.
Mid 1980 $
The costs indicated are cumulative for the project life.
Source: EPA-600/8-83-003, 1983
Figure 4.3-9. Groundwater Collection Costs
244
I
I
I
I
I
I
I
I
I
I
image:
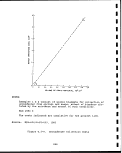 SURFACE .
STABILIZATION
CONTROL
TECHNOLOGIES
DUST
CONTROL
EROSION
CONTROL
STABLE SLOPE
DESIGN
WATER AND
BINDERS
PAVE HAUL
ROADS
"— REVEGETATION
i— MULCH
— REVEGETATION
Source: EPA-600/8-83-003, 1983 ;
Figure 4.3-10. Surface Stabilization Technologies
245
image:
SURFACE .
STABILIZATION
CONTROL
TECHNOLOGIES
DUST
CONTROL
EROSION
CONTROL
STABLE SLOPE
DESIGN
WATER AND
BINDERS
PAVE HAUL
ROADS
"— REVEGETATION
i— MULCH
— REVEGETATION
Source: EPA-600/8-83-003, 1983 ;
Figure 4.3-10. Surface Stabilization Technologies
245
image:
 CO
w
IH
O
o
o
o
fr*!
EH!
*•"'
§
1— (
rf*
N
M
. n
I I
rf\
§
to
w
1
{z^
to
O
w
fe
w
CO
1
CO
*
w
H
u
4-
a
c
tU
tf
o
&
P-I
0)
rH
O
•H
rV
O O
S-i rH
4-> 0
3 C
3 .*"!
U U
0)
4->
C
O 73
•H ai
4-> ID
3 O
SB-
O 0)
a.
10
4-> CO
W O
3 S-i
73 U
to
U
4-> tjl
I-S
rH O
rH
S-i XI
5l
c :s
<l>
> £
0) 0
P4 tW
iH
O
S-i
4J
C
0
U
4.)
U)
3
Q
5-j
10
rH
U
•H
X!
ai
>
§
J_4
M-J
^
w •
O) U
U -H
to m
S-i (0
U 4->
ii
a) o
•p u
73 w &>
<U -H £3
O< -H
O -P C •
iH (0 -H W
a> X! e C
> 4-)
(U
•a >
Ol (0
rH O T3 >-i
r-l iH (U <U
0) O W Q<
& C 3 O
O
-H
3
U]
O)
4-1 G sJ
•H OJ
G (*-l X!
O 4-J
0) <l>
73 X5 Oi
(U 4-J O
>H 4-J
to u
S-i 73 cn
(X G (U
W -H rH
_ XI U
7j -H
•H (1) 4-»
3 U S-<
iH fO to
U 13
•H «
tw o
UH !M
(0
!-< 0)
•P J3
4-1
0)
> c
o o
•H O
•H
.§§
w o
G
|£
w >-
g^^-M
O> 4-> <4-4
<u > w MH
<u 3 |0
w ^3 w
U
10
•a M
a >-<
m ai
T3
i* C
0) -H
to
v< MH
3 73 O
u to
n-, P S -i
73 S-j O 3
S-i -H U
tO rH 4-> -H
XI 3 flj X!
tO S-i 0)
rt! XI tt) >
-a
re
o
rH
•H
10
1C
o>
S-I
(0
c
•H
o
14-4
(4-1
(C
S-i
4-J
4-J
G
-H
01
U
(0
(4-1
SH
3
u>
0)
>•<
XI
73
Ol
XI
*
U)
<U
•H
4_)
-H
73
<1)
£
-H
G
O
U
0) 3 SH
98*1
4-1 >1
O G S-!
S (0 O
<U -H U
SH 73 10
<U
-g
ui
0)
<l) 73
^ C
D.-H
§>,
13-0
to 73
4-> a>
a> u
Cn 3
O) 10
> u
o
•H
4->
(0
0)
246
I
I
I
I
I
I
I
I
I
I
I
I
I
I
I
I
I
1
I
image:
CO
w
IH
O
o
o
o
fr*!
EH!
*•"'
§
1— (
rf*
N
M
. n
I I
rf\
§
to
w
1
{z^
to
O
w
fe
w
CO
1
CO
*
w
H
u
4-
a
c
tU
tf
o
&
P-I
0)
rH
O
•H
rV
O O
S-i rH
4-> 0
3 C
3 .*"!
U U
0)
4->
C
O 73
•H ai
4-> ID
3 O
SB-
O 0)
a.
10
4-> CO
W O
3 S-i
73 U
to
U
4-> tjl
I-S
rH O
rH
S-i XI
5l
c :s
<l>
> £
0) 0
P4 tW
iH
O
S-i
4J
C
0
U
4.)
U)
3
Q
5-j
10
rH
U
•H
X!
ai
>
§
J_4
M-J
^
w •
O) U
U -H
to m
S-i (0
U 4->
ii
a) o
•p u
73 w &>
<U -H £3
O< -H
O -P C •
iH (0 -H W
a> X! e C
> 4-)
(U
•a >
Ol (0
rH O T3 >-i
r-l iH (U <U
0) O W Q<
& C 3 O
O
-H
3
U]
O)
4-1 G sJ
•H OJ
G (*-l X!
O 4-J
0) <l>
73 X5 Oi
(U 4-J O
>H 4-J
to u
S-i 73 cn
(X G (U
W -H rH
_ XI U
7j -H
•H (1) 4-»
3 U S-<
iH fO to
U 13
•H «
tw o
UH !M
(0
!-< 0)
•P J3
4-1
0)
> c
o o
•H O
•H
.§§
w o
G
|£
w >-
g^^-M
O> 4-> <4-4
<u > w MH
<u 3 |0
w ^3 w
U
10
•a M
a >-<
m ai
T3
i* C
0) -H
to
v< MH
3 73 O
u to
n-, P S -i
73 S-j O 3
S-i -H U
tO rH 4-> -H
XI 3 flj X!
tO S-i 0)
rt! XI tt) >
-a
re
o
rH
•H
10
1C
o>
S-I
(0
c
•H
o
14-4
(4-1
(C
S-i
4-J
4-J
G
-H
01
U
(0
(4-1
SH
3
u>
0)
>•<
XI
73
Ol
XI
*
U)
<U
•H
4_)
-H
73
<1)
£
-H
G
O
U
0) 3 SH
98*1
4-1 >1
O G S-!
S (0 O
<U -H U
SH 73 10
<U
-g
ui
0)
<l) 73
^ C
D.-H
§>,
13-0
to 73
4-> a>
a> u
Cn 3
O) 10
> u
o
•H
4->
(0
0)
246
I
I
I
I
I
I
I
I
I
I
I
I
I
I
I
I
I
1
I
image:
 CO
4-J
G
O)
O
U
continued
CO
I
CO
H
4-1
G
Ol
0) T3
o>
u
3
W
Ol
CO
o
el
PH
G
o
•H
e -a
(0
o re
•H
w G *H
G O 01
'H -r) 4-J
re 4-1 re
GS
-H T3
S Ol
ro T)
G 2
O Ol
u
X!
4-J
<+-)
o
•H 0) M XI
•H re G w
rH M O) in
Oi U > O>
S O tt) -P
-H i—i in re
CO Xi ft S
H
-H
S-i
PH
&
O O
S-i rH
4-1 O
II
o
i-,
4-1
§
u
§
-H
U
O
o
u
u
re re
O >i O>
4-1 rH S*
G 3
>i O W
w re
re w 01
a) -H e
T3 4-1 ><
G 3 i*
re X! re
SH
44 X! 0
u in p
•rH -H E
3 i-H O)
CX O.4-I
O
0) 4-1
S-f
re <u
a.
w o
i— 1 i-H
re w
•H
*-< o G
0) X! O
4-1 4-J -H
re w
EGO
O i-i
O 0) 4-1
•H U -H
S-i re E
re rH -H
X!
u
r~H
£3
£3
jj
^
X)
i-H
O •
i~4 01
4-1 >
G 0)
O -H
U X!
u
4-J re
G
O> O
re
E S
S-i O
O> i-H
PH CO
T3
0)
4-J 4-)
S* -H
4-1 -3
W i-H
W O
-H 4-1
X! 0)
O i-H
S-i W •
tn G
0) O
4-1 X! -H
G 4-J W
re o
>H G SH
PH O O)
g
O
•H
I \
re
o>
^
01
«
re
<u re
0) O
> • 4J •
o> !M re
S-i <U i-H (U
•H re SM
•» w -H re
IH re ^
O <l) O) T3
l-> 4-l(U
4-1 o> re G
G 0< S -H
o ro m
U C 0) 0)
•H 4-> T3
c ro w o>
o ^ re IH
•H "0 S 0,
VI
O -O W -
S- G 4-> 0>
o» re u 4-J
-H -H
w - ^ G
01 G 4-J -H
44 O W MH
ro -H <o <u
g 4J as -a
N
-H T3
S G
-H ro
-S«
• £ E
01
O rH
^•g
<LI !M •
a, o. o)
0 U
ut 4-J re
•H XI G
w ro -H
o> 4-1 ro
QWE
O)
S
O» -H
rH W
X! Ol
ro T3
4-)
CO
ro
00
ro"
o
o
i
ro
00
00
o
o
ID
r$
W
0)
U
!M
3
O
CO
247
image:
CO
4-J
G
O)
O
U
continued
CO
I
CO
H
4-1
G
Ol
0) T3
o>
u
3
W
Ol
CO
o
el
PH
G
o
•H
e -a
(0
o re
•H
w G *H
G O 01
'H -r) 4-J
re 4-1 re
GS
-H T3
S Ol
ro T)
G 2
O Ol
u
X!
4-J
<+-)
o
•H 0) M XI
•H re G w
rH M O) in
Oi U > O>
S O tt) -P
-H i—i in re
CO Xi ft S
H
-H
S-i
PH
&
O O
S-i rH
4-1 O
II
o
i-,
4-1
§
u
§
-H
U
O
o
u
u
re re
O >i O>
4-1 rH S*
G 3
>i O W
w re
re w 01
a) -H e
T3 4-1 ><
G 3 i*
re X! re
SH
44 X! 0
u in p
•rH -H E
3 i-H O)
CX O.4-I
O
0) 4-1
S-f
re <u
a.
w o
i— 1 i-H
re w
•H
*-< o G
0) X! O
4-1 4-J -H
re w
EGO
O i-i
O 0) 4-1
•H U -H
S-i re E
re rH -H
X!
u
r~H
£3
£3
jj
^
X)
i-H
O •
i~4 01
4-1 >
G 0)
O -H
U X!
u
4-J re
G
O> O
re
E S
S-i O
O> i-H
PH CO
T3
0)
4-J 4-)
S* -H
4-1 -3
W i-H
W O
-H 4-1
X! 0)
O i-H
S-i W •
tn G
0) O
4-1 X! -H
G 4-J W
re o
>H G SH
PH O O)
g
O
•H
I \
re
o>
^
01
«
re
<u re
0) O
> • 4J •
o> !M re
S-i <U i-H (U
•H re SM
•» w -H re
IH re ^
O <l) O) T3
l-> 4-l(U
4-1 o> re G
G 0< S -H
o ro m
U C 0) 0)
•H 4-> T3
c ro w o>
o ^ re IH
•H "0 S 0,
VI
O -O W -
S- G 4-> 0>
o» re u 4-J
-H -H
w - ^ G
01 G 4-J -H
44 O W MH
ro -H <o <u
g 4J as -a
N
-H T3
S G
-H ro
-S«
• £ E
01
O rH
^•g
<LI !M •
a, o. o)
0 U
ut 4-J re
•H XI G
w ro -H
o> 4-1 ro
QWE
O)
S
O» -H
rH W
X! Ol
ro T3
4-)
CO
ro
00
ro"
o
o
i
ro
00
00
o
o
ID
r$
W
0)
U
!M
3
O
CO
247
image:
 50
40
<D
o
en
8 30
o
z
ft.
UJ
O 20
H
O
LU
CC
O
10
I
I
I
I
I
1
_L
_L
10 20
PROJECT LIFE, YEARS
30
NOTES:
•
Example 1 assumes a 30-year project life, while Example 2
assumes a 20-year life.
Mid 1980 $
The costs indicated are cumulative for the project life.
Source: EPA-600/8-83-003, 1983
Figure 4.3-11. Dust Control Costs
248
1
1
I
I
I
I
I
I
I
I
I
I
image:
50
40
<D
o
en
8 30
o
z
ft.
UJ
O 20
H
O
LU
CC
O
10
I
I
I
I
I
1
_L
_L
10 20
PROJECT LIFE, YEARS
30
NOTES:
•
Example 1 assumes a 30-year project life, while Example 2
assumes a 20-year life.
Mid 1980 $
The costs indicated are cumulative for the project life.
Source: EPA-600/8-83-003, 1983
Figure 4.3-11. Dust Control Costs
248
1
1
I
I
I
I
I
I
I
I
I
I
image:
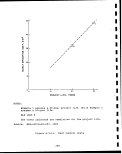 remain stable, eroded material does not pollute surface streams,
and reclamation and revegetation efforts are not hampered. Some
means of limiting erosion include contouring the surface with
short and gentle slopes, providing for drainage of the slopes at
frequent intervals, using mulch or filter fabric to dampen the im-
pact of water flow, and revegetating the completed! faces. Of
these measures, grading and drainage are essential, take effect
immediately, and last as long as they are maintained. Mulch or
filter fabric also provide a quick control, but they are of a tem-
porary nature. Revegetation provides a permanent control, but it
is generally slower to take effect. !
A major consideration in planning erosion control measures is the
severity of rainfall in the area. A large proportion of the water
from a high-intensity rainfall would run off the surface, thus in-
creasing the erosion.
1
Reclamation and revegetation consist of placing a subsoil and top-
soil strata of sufficient thickness to support vegetation, and
then seeding the disposal area with native or introduced species.
The greatest contributor to the magnitude of cost for this control
technology is the thickness of the soil strata and the'costs asso-
ciated with the delivered soil material, i.e., the source develop-
ment, processing and hauling costs. Soil and subsoil stripped
from the disposal site may not be available in sufficient quantity
to meet the reclamation needs. The cost curves presented in Fig-
ure 4.3-12 illustrate five examples. Examples 1 and 5 included 2
feet of subsoil (sand-gravel material) and 30 inches iof topsoil,
both of which were brought in from off-site sources and thus had
additional costs involved. Examples 2 and 3 also used the same
thicknesses, but the soils were available on the site. Example 4
used no subsoil and only 6 inches of topsoil which wa|s available
on the site; therefore, additional material costs were not in-
volved. All examples included the cost of revegetation. It is
evident from the figure that the cost of erosion control can vary
significantly depending on the factors considered; however, in any
category, the costs are proportional to the area reclaimed and
revegetated. \
Besides improving the appearance of the landscape, the vegetation
of the waste landfill will serve other purposes that ate important
from the pollution control point of view. The physical effect of
wind and water will be greatly influenced by the presence of vege-
tation on the surface. Dense vegetation and root systems will re-
duce the weathering impacts, thereby reducing the erosion by wind
and precipitation run-off. The vegetation will aid in levapotrans-
piration of the surface-absorbed water thereby reducing water
infiltration and leaching. Vegetation will also provide a suit-
able environment for other biological activity which will aid in
restoring the local ecosystem. ;
249
image:
remain stable, eroded material does not pollute surface streams,
and reclamation and revegetation efforts are not hampered. Some
means of limiting erosion include contouring the surface with
short and gentle slopes, providing for drainage of the slopes at
frequent intervals, using mulch or filter fabric to dampen the im-
pact of water flow, and revegetating the completed! faces. Of
these measures, grading and drainage are essential, take effect
immediately, and last as long as they are maintained. Mulch or
filter fabric also provide a quick control, but they are of a tem-
porary nature. Revegetation provides a permanent control, but it
is generally slower to take effect. !
A major consideration in planning erosion control measures is the
severity of rainfall in the area. A large proportion of the water
from a high-intensity rainfall would run off the surface, thus in-
creasing the erosion.
1
Reclamation and revegetation consist of placing a subsoil and top-
soil strata of sufficient thickness to support vegetation, and
then seeding the disposal area with native or introduced species.
The greatest contributor to the magnitude of cost for this control
technology is the thickness of the soil strata and the'costs asso-
ciated with the delivered soil material, i.e., the source develop-
ment, processing and hauling costs. Soil and subsoil stripped
from the disposal site may not be available in sufficient quantity
to meet the reclamation needs. The cost curves presented in Fig-
ure 4.3-12 illustrate five examples. Examples 1 and 5 included 2
feet of subsoil (sand-gravel material) and 30 inches iof topsoil,
both of which were brought in from off-site sources and thus had
additional costs involved. Examples 2 and 3 also used the same
thicknesses, but the soils were available on the site. Example 4
used no subsoil and only 6 inches of topsoil which wa|s available
on the site; therefore, additional material costs were not in-
volved. All examples included the cost of revegetation. It is
evident from the figure that the cost of erosion control can vary
significantly depending on the factors considered; however, in any
category, the costs are proportional to the area reclaimed and
revegetated. \
Besides improving the appearance of the landscape, the vegetation
of the waste landfill will serve other purposes that ate important
from the pollution control point of view. The physical effect of
wind and water will be greatly influenced by the presence of vege-
tation on the surface. Dense vegetation and root systems will re-
duce the weathering impacts, thereby reducing the erosion by wind
and precipitation run-off. The vegetation will aid in levapotrans-
piration of the surface-absorbed water thereby reducing water
infiltration and leaching. Vegetation will also provide a suit-
able environment for other biological activity which will aid in
restoring the local ecosystem. ;
249
image:
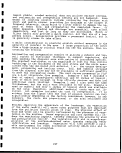 60
O
•*• 50
CO
8 40
O
< 30
tr
UJ
Q.
O
UJ
cr
5 10
i
i
i
500 I.OOO 1,500
RECLAIMED AREA, ACRES
I
2,000
I
I
I
I
I
I
I
I
I
NOTES:
Examples 1 & 5 include 2 feet of subsoil and 30 inches of
topsoil, both obtained off site.
Examples 2 & 3 include 2 feet of subsoil and 30 inches of
topsoil obtained on site.
Example 4"includes no subsoil and only 6 inches of topsoil
obtained on site.
Mid 1980 $
The costs indicated are cumulative for the project life.
Source: EPA-600/8-83-003, 1983
Figure 4.3-12. Reclamation and Revegetation Costs
250
1
I
I
1
I
1
I
i
1
image:
60
O
•*• 50
CO
8 40
O
< 30
tr
UJ
Q.
O
UJ
cr
5 10
i
i
i
500 I.OOO 1,500
RECLAIMED AREA, ACRES
I
2,000
I
I
I
I
I
I
I
I
I
NOTES:
Examples 1 & 5 include 2 feet of subsoil and 30 inches of
topsoil, both obtained off site.
Examples 2 & 3 include 2 feet of subsoil and 30 inches of
topsoil obtained on site.
Example 4"includes no subsoil and only 6 inches of topsoil
obtained on site.
Mid 1980 $
The costs indicated are cumulative for the project life.
Source: EPA-600/8-83-003, 1983
Figure 4.3-12. Reclamation and Revegetation Costs
250
1
I
I
1
I
1
I
i
1
image:
 The use of the processed shale itself as a plant growth medium may
be questionable. The texture, salinity, alkalinity,!color, etc,
of the processed shales play an important role in the growth of
vegetation. Some type of modification in the processed shale
properties and/or application of a natural soil cover may be ne-
cessary to induce and sustain vegetation on the processed shale.
If the top layers of the processed shales are thoroughly leached
so that the salinity is within acceptable range, the;planting or
seed germination may be possible in the processed shale itself.
Otherwise topsoil may need to be placed on the shale '• waste, or a
nu_xture of rock, topsoil and subsoil can be mixed into the top
layers. Topsoil in the oil shale area is usually insufficient to
provide a good cover; therefore, mixing with rocks and subsoils
may be necessary to give proper depth. Also, a proper selection
of the plant species that would survive the climate of the region
and high salt concentration of the processed shale should be made.
Soil fertilization should be carried out to make up for the nutri-
ent deficiency, and sufficient water should be made available
while establishing the vegetation. ;
I
Stable Slope Design ;
The purpose of designing the slopes to be stable under prevailing
conditions is to minimize the maintenance of the landfill and to
avoid hampering of the reclamation and revegetation efforts. The
techniques used in designing stable slopes are a wel'l developed
part of soils engineering. To arrive at the most advantageous
slope design, other factors besides basic stability, such as ero-
sion, ease of placement, reclamation and revegetation, must be
considered. However, the physical characteristics ot the waste
material will dictate a limiting slope angle. The costs of
achieving a stable slope design are incidental to the placement
and revegetation of the fill material; hence, additional costs are
not involved. j
4.3.4 Summary of Control Technologies i
Table 4.3-4 presents a summary of the control technologies and es-
timated costs (1980 dollars) for disposal of retorted shale from a
small (47,000 bbl/day) oil shale plant. Not included are the
costs for offsite disposal of hazardous wastes. Also excluded are
the considerable costs for transporting the retorted Shale to the
disposal site and compacting it in lifts which would! have to be
done for process reasons rather than environmental control.
251
image:
The use of the processed shale itself as a plant growth medium may
be questionable. The texture, salinity, alkalinity,!color, etc,
of the processed shales play an important role in the growth of
vegetation. Some type of modification in the processed shale
properties and/or application of a natural soil cover may be ne-
cessary to induce and sustain vegetation on the processed shale.
If the top layers of the processed shales are thoroughly leached
so that the salinity is within acceptable range, the;planting or
seed germination may be possible in the processed shale itself.
Otherwise topsoil may need to be placed on the shale '• waste, or a
nu_xture of rock, topsoil and subsoil can be mixed into the top
layers. Topsoil in the oil shale area is usually insufficient to
provide a good cover; therefore, mixing with rocks and subsoils
may be necessary to give proper depth. Also, a proper selection
of the plant species that would survive the climate of the region
and high salt concentration of the processed shale should be made.
Soil fertilization should be carried out to make up for the nutri-
ent deficiency, and sufficient water should be made available
while establishing the vegetation. ;
I
Stable Slope Design ;
The purpose of designing the slopes to be stable under prevailing
conditions is to minimize the maintenance of the landfill and to
avoid hampering of the reclamation and revegetation efforts. The
techniques used in designing stable slopes are a wel'l developed
part of soils engineering. To arrive at the most advantageous
slope design, other factors besides basic stability, such as ero-
sion, ease of placement, reclamation and revegetation, must be
considered. However, the physical characteristics ot the waste
material will dictate a limiting slope angle. The costs of
achieving a stable slope design are incidental to the placement
and revegetation of the fill material; hence, additional costs are
not involved. j
4.3.4 Summary of Control Technologies i
Table 4.3-4 presents a summary of the control technologies and es-
timated costs (1980 dollars) for disposal of retorted shale from a
small (47,000 bbl/day) oil shale plant. Not included are the
costs for offsite disposal of hazardous wastes. Also excluded are
the considerable costs for transporting the retorted Shale to the
disposal site and compacting it in lifts which would! have to be
done for process reasons rather than environmental control.
251
image:
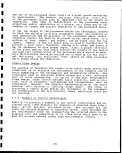 CO
EH >i
tn rd
§ \
rH
Q43
(J "^
O o
tn o
o
oc-^
o**
f«i
S Pi
rH O
EH to
Q tn
rfj hH
tn M
EH>
tn M
O EH
U CJ
O
55 EH
S
M rt!
o 5
M S
•
^1
CO
*
£3
EH
^^
CO
M
rd
rH
i-H
o
Q
M-l
o
to
1
CQ
£j
o
P*
EH
d
M
O
to
^_l
m
cu
>
.p
u
CO
•n
O
il
PH
f^
<£>
m
^
CO
CM
43
H
0
&
-H
>
•H
4J
O
<
CM ^ CM
VD ^O
rH in
CM ^ CM
vO VO
rH in
CM ^ CM
rH Ln
CM ^ CM
t-H in
CM ^ •* CM CO
v£) <£> O CO
rH in CO CO
•fc
rH
CM ^ >* CM CO
<£> VO O CO
rH in CO CO
h.
rH
CT> •* rH CM 00
O O VD CO
CM CO CM CO
»*
rH
CQ
rH I i
O -P -P !3
S-P CO CO O Cg
O O ^ g g -H -H rD
>-lrHOfdcdC043O
!>i u g g -H tr> g
43 CO CO CO T3 fi -H
MH O -H
UOMHCOCOOrHCO
MPitnjDJPStn^
tn
^
C?i
in
^
cr>
in
^
cr>
in
<3*
cn
in
•5}1
CT>
in
^
cr>
in
cr>
un
^i
n^
O
rH
0
tJ H
>~i CO
£a
•H
CO rH
^g
m o
SH-P
P34J
co o
•§«
tn
^
•*
^
^
"^
^
^
f3
-H
<d
M
TJ
S-i
CO
t3
13
CO
rH
rd
43
tn
CM
rH
CM
rH
CM
rH
CM
rH
CM
H
CM
rH
CM
CO *D
CO
53
0
-H
•P
U
CO
W rH
rH rH
rH O
CO U
tyi CO
•H rd
O T3
-P a
•H S
el o
0 !H
s o
CM en in
iQ CO rH
CM «D
h.
rH
CM CT> in
\Q CO rH
CM <£>
rH
CM cn in
U3 CO rH
CM VO
rH
CM cn in
VD CO rH
CM U3
rH
CM cn in
& CO rH
CM <£>
W
rH
CM cn in
v£> CO rH
CM i£>
^
rH
CM cn in
ID CO rH
CM <£>
""
i— 1
CM cn
lO CO
CM
fl
0
-H
-P E3
rd O
N42 -H
•H P rH tQ
rH (H-H W
•H Ol O CO
43 W ^H
o
CM
H
0
CM
rH
O
CM
rH
O
CM
rH
O
CM
rH
O
lO
T3
£3 a
rd o
-H
S3-P
O rd
-P fl 0 ft+J 0>
to rd 4-1 P
to
CO 5H ft
O rd-H 4->
rd CO in to
'W rH 4J 3
in 0 tn P
3
cn
g co
rd >
rH CO
U H
CO
PS
<p
CM
^
ik
CO
^
CM
^1
CO
•*
CM
^
CO
•^
CM
^1
CO
*JD
vD
O
^
in
vO
0
o
•*
in
o
cn
to
*•
^
o
^
•*
*-^N
W
1
-P
-H
rH
rH
*~^
<
0
EH
s^
• fH
4->
C
O
U
I
I
I
I
1
1
I
I
I
I
252
1
I
1
I
I
I
I
I
image:
CO
EH >i
tn rd
§ \
rH
Q43
(J "^
O o
tn o
o
oc-^
o**
f«i
S Pi
rH O
EH to
Q tn
rfj hH
tn M
EH>
tn M
O EH
U CJ
O
55 EH
S
M rt!
o 5
M S
•
^1
CO
*
£3
EH
^^
CO
M
rd
rH
i-H
o
Q
M-l
o
to
1
CQ
£j
o
P*
EH
d
M
O
to
^_l
m
cu
>
.p
u
CO
•n
O
il
PH
f^
<£>
m
^
CO
CM
43
H
0
&
-H
>
•H
4J
O
<
CM ^ CM
VD ^O
rH in
CM ^ CM
vO VO
rH in
CM ^ CM
rH Ln
CM ^ CM
t-H in
CM ^ •* CM CO
v£) <£> O CO
rH in CO CO
•fc
rH
CM ^ >* CM CO
<£> VO O CO
rH in CO CO
h.
rH
CT> •* rH CM 00
O O VD CO
CM CO CM CO
»*
rH
CQ
rH I i
O -P -P !3
S-P CO CO O Cg
O O ^ g g -H -H rD
>-lrHOfdcdC043O
!>i u g g -H tr> g
43 CO CO CO T3 fi -H
MH O -H
UOMHCOCOOrHCO
MPitnjDJPStn^
tn
^
C?i
in
^
cr>
in
^
cr>
in
<3*
cn
in
•5}1
CT>
in
^
cr>
in
cr>
un
^i
n^
O
rH
0
tJ H
>~i CO
£a
•H
CO rH
^g
m o
SH-P
P34J
co o
•§«
tn
^
•*
^
^
"^
^
^
f3
-H
<d
M
TJ
S-i
CO
t3
13
CO
rH
rd
43
tn
CM
rH
CM
rH
CM
rH
CM
rH
CM
H
CM
rH
CM
CO *D
CO
53
0
-H
•P
U
CO
W rH
rH rH
rH O
CO U
tyi CO
•H rd
O T3
-P a
•H S
el o
0 !H
s o
CM en in
iQ CO rH
CM «D
h.
rH
CM CT> in
\Q CO rH
CM <£>
rH
CM cn in
U3 CO rH
CM VO
rH
CM cn in
VD CO rH
CM U3
rH
CM cn in
& CO rH
CM <£>
W
rH
CM cn in
v£> CO rH
CM i£>
^
rH
CM cn in
ID CO rH
CM <£>
""
i— 1
CM cn
lO CO
CM
fl
0
-H
-P E3
rd O
N42 -H
•H P rH tQ
rH (H-H W
•H Ol O CO
43 W ^H
o
CM
H
0
CM
rH
O
CM
rH
O
CM
rH
O
CM
rH
O
lO
T3
£3 a
rd o
-H
S3-P
O rd
-P fl 0 ft+J 0>
to rd 4-1 P
to
CO 5H ft
O rd-H 4->
rd CO in to
'W rH 4J 3
in 0 tn P
3
cn
g co
rd >
rH CO
U H
CO
PS
<p
CM
^
ik
CO
^
CM
^1
CO
•*
CM
^
CO
•^
CM
^1
CO
*JD
vD
O
^
in
vO
0
o
•*
in
o
cn
to
*•
^
o
^
•*
*-^N
W
1
-P
-H
rH
rH
*~^
<
0
EH
s^
• fH
4->
C
O
U
I
I
I
I
1
1
I
I
I
I
252
1
I
1
I
I
I
I
I
image:
 — .
0)
rt
•H
•P
ti
O
U
•*
ro
_^
<*
w
ffl
fH,
EH
}_,
rd
(1)
0
0)
n
O
A4
Lf
I~
'v
r-
c*"
Cs
£
en
00
Activity
csj ^
VO vO
rH in
CSJ TJH
vO vO
rH in
CSJ ^
VQ VO
rH in
CSJ ^
VQ VO
rH in
CSJ <3<
rH in
CSJ <3<
VQ VO
rH IT)
CN rp
vO vO
rH LD
CSJ <^h
VO VO
rH in
a
lurface hydrology
Runoff col lectio
Surface cover
Upper embankment
Lower embankment
Ul
Runon diversion
CSJ
CSJ
CSJ
CSJ
CN
CSJ
CSJ
Csj
w
J-)
Stilling basins
Water impoundmen
^f ^
en
in
<3* ^
C"i
m
^^1 ^J
O^
in
<tf<3
CTi
in
•* ^J
in
^j' ^4
C^
in
^^
cr*
in
^ ^
en
in
K>1
tn
ubsurface hydrolo<
Bottom liner
Shale underdrain
CO
h
H CS]
rH
H Cs]
rH
1 CSJ
rH
1 CSJ
rH
C-- csj
rH rH
CSJ
rH
CN
rH
fl
O
•H
-P
U
0)
Monitoring wells
Groundwater colli
csj <y> m
VO 00 rH
CSJ VO
>.
rH
CSJ CTi in
VO 00 rH
CSJ kO
rH
CSJ CT> in
VD 00 rH
CSJ VO
rH
csj <y in
VQ 00 rH
CSJ to
rH
csj cy> in
VD 00 rH
CN VO
rH
csj <y> m
VO 00 rH
CSJ VO
rH
CN cn in
VD 00 rH
CN VO
rH
CSJ CT* U")
VD 00 rH
CN VO
rH
£j
O
urface stabilizat:
Clear and grub
Strip topsoil
Dust suppression
Reclamation and
CO
o
CN
rH
O
CN
rH
O
CN
rH
O
CN
rH
0
CN
rH
O
CN
rH
0
CN
rH
O
CN
rH
revegetation
CN
rH
..
CO
<^
CN
CO
<*
CN
CO
<*
CN
CO
•*
CN
CO
rH
•*
CO
•*
CN
CO
*3*
CN
CO
•H
rH
rH
fd
I
EH
r~f
-H
-P
P!
O
O
"*" '
253
image:
— .
0)
rt
•H
•P
ti
O
U
•*
ro
_^
<*
w
ffl
fH,
EH
}_,
rd
(1)
0
0)
n
O
A4
Lf
I~
'v
r-
c*"
Cs
£
en
00
Activity
csj ^
VO vO
rH in
CSJ TJH
vO vO
rH in
CSJ ^
VQ VO
rH in
CSJ ^
VQ VO
rH in
CSJ <3<
rH in
CSJ <3<
VQ VO
rH IT)
CN rp
vO vO
rH LD
CSJ <^h
VO VO
rH in
a
lurface hydrology
Runoff col lectio
Surface cover
Upper embankment
Lower embankment
Ul
Runon diversion
CSJ
CSJ
CSJ
CSJ
CN
CSJ
CSJ
Csj
w
J-)
Stilling basins
Water impoundmen
^f ^
en
in
<3* ^
C"i
m
^^1 ^J
O^
in
<tf<3
CTi
in
•* ^J
in
^j' ^4
C^
in
^^
cr*
in
^ ^
en
in
K>1
tn
ubsurface hydrolo<
Bottom liner
Shale underdrain
CO
h
H CS]
rH
H Cs]
rH
1 CSJ
rH
1 CSJ
rH
C-- csj
rH rH
CSJ
rH
CN
rH
fl
O
•H
-P
U
0)
Monitoring wells
Groundwater colli
csj <y> m
VO 00 rH
CSJ VO
>.
rH
CSJ CTi in
VO 00 rH
CSJ kO
rH
CSJ CT> in
VD 00 rH
CSJ VO
rH
csj <y in
VQ 00 rH
CSJ to
rH
csj cy> in
VD 00 rH
CN VO
rH
csj <y> m
VO 00 rH
CSJ VO
rH
CN cn in
VD 00 rH
CN VO
rH
CSJ CT* U")
VD 00 rH
CN VO
rH
£j
O
urface stabilizat:
Clear and grub
Strip topsoil
Dust suppression
Reclamation and
CO
o
CN
rH
O
CN
rH
O
CN
rH
O
CN
rH
0
CN
rH
O
CN
rH
0
CN
rH
O
CN
rH
revegetation
CN
rH
..
CO
<^
CN
CO
<*
CN
CO
<*
CN
CO
•*
CN
CO
rH
•*
CO
•*
CN
CO
*3*
CN
CO
•H
rH
rH
fd
I
EH
r~f
-H
-P
P!
O
O
"*" '
253
image:
 1
1
1
.->
CD
•H
d
o
o
1
en
w
3
H
rd
I)
4->
O
(1)
'i-i
O
M
PM
H
CM
O
CM
01
H
00
rH
[>•»
H
VD
rH
£
•H
U
rfj
CM ^ O >£)
{Q \& CM ^f
H in H 00
CM ^ in O rH
{Q VO rH CM ^O
rH m "-O rH "^
rH in in rH \O rH CM
h. K,
rH m
CM^ ^ ^ CM (7> U~> O O
rH m in CM <£> rH "tf4
*. »-
rH cn
UDlO CTi vOOOrHCMrH
rH in in CM >£> rH ^
rH Cn
CM^ CM ^^ CMCKtnOCM
rH in in CM <£> rH ^
rH cn
C
0
-H
-P C
W >( U O
fi -P CT> <D -H
O -P -P C! 0 CCQrH -P fl
J>I-H C d G ui I) i — i -H i — 1 1 — i <d o 'o -">
tjl-P OOJOCg O rdrHO tSJ,Q -HflflW
OOngg-H-H'D M MOJO -HpJrHMfdO g
rHODrBiSWWCn n3M'O& rHM-HW -H (U
*T3 O O pQ ,O fc> Oi -H "^ d -P fd TlJ O< firH P
J>t0 gg-HOig curHd-Hfd -Pdq O.-P cu rH
i~| CD d) CD rO d "fH U ^ ^H !5 W fd -P Jj TO O1 rH
mu -H rdgOTi wg<Dfd
OO'HCDCDOrHd) M-PrH-H3 Dfd-H-PrHO)
(d d M f>[ J5 d "H -P & -P fddO fd(DMCfiU^H »-4
MP^coiDi-Jp^co!^ ,Q CQ co S O ^HCJWQPi EH
2 |3 3 0
co co co EH
1
1
1
1
1
i 1
•H
•M
u B
^ fl
"t3 • H
O cn ^
M 00
^rH H
til ^^9
0 * •
m
no
fd o m
0 i n
pscn H
00 •
•p 1
tfl 00
-HO •
IHO B
0) 1
-P PM •
•CO* M ^B
en •
O -H
00
cy> rH CD Bg
rH U if
t 1 (t ••
_j 2 Ca IB
T3 TO J3 ^^
•H CD 0
1
1
1
254 jj
image:
1
1
1
.->
CD
•H
d
o
o
1
en
w
3
H
rd
I)
4->
O
(1)
'i-i
O
M
PM
H
CM
O
CM
01
H
00
rH
[>•»
H
VD
rH
£
•H
U
rfj
CM ^ O >£)
{Q \& CM ^f
H in H 00
CM ^ in O rH
{Q VO rH CM ^O
rH m "-O rH "^
rH in in rH \O rH CM
h. K,
rH m
CM^ ^ ^ CM (7> U~> O O
rH m in CM <£> rH "tf4
*. »-
rH cn
UDlO CTi vOOOrHCMrH
rH in in CM >£> rH ^
rH Cn
CM^ CM ^^ CMCKtnOCM
rH in in CM <£> rH ^
rH cn
C
0
-H
-P C
W >( U O
fi -P CT> <D -H
O -P -P C! 0 CCQrH -P fl
J>I-H C d G ui I) i — i -H i — 1 1 — i <d o 'o -">
tjl-P OOJOCg O rdrHO tSJ,Q -HflflW
OOngg-H-H'D M MOJO -HpJrHMfdO g
rHODrBiSWWCn n3M'O& rHM-HW -H (U
*T3 O O pQ ,O fc> Oi -H "^ d -P fd TlJ O< firH P
J>t0 gg-HOig curHd-Hfd -Pdq O.-P cu rH
i~| CD d) CD rO d "fH U ^ ^H !5 W fd -P Jj TO O1 rH
mu -H rdgOTi wg<Dfd
OO'HCDCDOrHd) M-PrH-H3 Dfd-H-PrHO)
(d d M f>[ J5 d "H -P & -P fddO fd(DMCfiU^H »-4
MP^coiDi-Jp^co!^ ,Q CQ co S O ^HCJWQPi EH
2 |3 3 0
co co co EH
1
1
1
1
1
i 1
•H
•M
u B
^ fl
"t3 • H
O cn ^
M 00
^rH H
til ^^9
0 * •
m
no
fd o m
0 i n
pscn H
00 •
•p 1
tfl 00
-HO •
IHO B
0) 1
-P PM •
•CO* M ^B
en •
O -H
00
cy> rH CD Bg
rH U if
t 1 (t ••
_j 2 Ca IB
T3 TO J3 ^^
•H CD 0
1
1
1
254 jj
image:
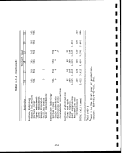 REFERENCES
Agapito, J. Pillar Design in Competent Bedded Formations. Thesis
1485, Graduate School, Colorado School of Mines, 1972.
Storage of
Allen, R. R., and Parry, V. F. U.S. Bureau of Mines.
Low Rank Coals, Report of Investigation No. 5034, 1954
Ash, H. 0. Guidebook to the Energy Resources of the Piceance
Creek Basin, Colorado. Federal Oil Shale Leasing and Administra-
tion, U.S. Department of the Interior, Denver, Colorado, 1974.
!
Bates, E. R. U.S. Environmental Protection Agency,.Cincinnati,
Ohio 45268. Based on Multiple Sources. January 1985.!
Bates, T. F., and E. 0. Strohl. Minerology, Petrography, and
Radioactivity of Representative Samples of Chattanooga Shale.
Bulletin of the Geological Society of America, Voll 68, 1957.
Battelle, Pacific Northwest Laboratory. PNL-3830, Vol. 1, Main
Report. Western Oil Shale Development: A Technology'Assessment.
November 1981. Prepared for the U.S. Department of Energy under
contract DE-AC06-76RLO-1830. :
Baughman, G. L. Synthetic Fuels Data Handbook. Ca'meron Engi-
neer's Inc. (A Division of The Pace Company Consultants and
Engineers, Inc.) Second Edition, 1978. |
Bouchta, Rabah, Said Berrada, Chang Yul Cha, and U-Sun Park.
Development of T3 - Process in Morocco. 6th IIASA Resources
Conference on World Oil Shale Resources and Their Potential
Development, Golden, Colorado, June 14-19, 1981.
Bradley, W. H. Origin and Microfossils of the Oil Shale of the
Green River Formation of Colorado and Utah, USGS Professional
Paper, 168, 1931. j
!
Brown, A., et al. Water Management in Oil Shale Mining. Colder
Assoc., Inc. U.S. Bureau of Mines, Contract No. J0265019, Sept-
ember 1977. ;
Bureau of Land Management. U.S. Department of the Interior, Grand
Junction, Colorado 81501. Final Environmental Impact} Statement,
Clear Creek Shale Oil Project, 30 September 1983. i
255
image:
REFERENCES
Agapito, J. Pillar Design in Competent Bedded Formations. Thesis
1485, Graduate School, Colorado School of Mines, 1972.
Storage of
Allen, R. R., and Parry, V. F. U.S. Bureau of Mines.
Low Rank Coals, Report of Investigation No. 5034, 1954
Ash, H. 0. Guidebook to the Energy Resources of the Piceance
Creek Basin, Colorado. Federal Oil Shale Leasing and Administra-
tion, U.S. Department of the Interior, Denver, Colorado, 1974.
!
Bates, E. R. U.S. Environmental Protection Agency,.Cincinnati,
Ohio 45268. Based on Multiple Sources. January 1985.!
Bates, T. F., and E. 0. Strohl. Minerology, Petrography, and
Radioactivity of Representative Samples of Chattanooga Shale.
Bulletin of the Geological Society of America, Voll 68, 1957.
Battelle, Pacific Northwest Laboratory. PNL-3830, Vol. 1, Main
Report. Western Oil Shale Development: A Technology'Assessment.
November 1981. Prepared for the U.S. Department of Energy under
contract DE-AC06-76RLO-1830. :
Baughman, G. L. Synthetic Fuels Data Handbook. Ca'meron Engi-
neer's Inc. (A Division of The Pace Company Consultants and
Engineers, Inc.) Second Edition, 1978. |
Bouchta, Rabah, Said Berrada, Chang Yul Cha, and U-Sun Park.
Development of T3 - Process in Morocco. 6th IIASA Resources
Conference on World Oil Shale Resources and Their Potential
Development, Golden, Colorado, June 14-19, 1981.
Bradley, W. H. Origin and Microfossils of the Oil Shale of the
Green River Formation of Colorado and Utah, USGS Professional
Paper, 168, 1931. j
!
Brown, A., et al. Water Management in Oil Shale Mining. Colder
Assoc., Inc. U.S. Bureau of Mines, Contract No. J0265019, Sept-
ember 1977. ;
Bureau of Land Management. U.S. Department of the Interior, Grand
Junction, Colorado 81501. Final Environmental Impact} Statement,
Clear Creek Shale Oil Project, 30 September 1983. i
255
image:
 I
Bureau of Land Management. U.S. Department of the Interior, Utah "
State Office, Salt Lake City, Utah 84111. Final Environmental
Impact Statement on the Uintah Basin Synfuels Development. I
February 1983. B
Cashion, W. B. Geology and Fuel Resources of the Green River •
Formation, Southeastern Uinta Basin, Utah and Colorado. USGS g
Professional Paper 548, 1967.
Cashion, W. B., and J. R. Donnell. Revision of Nomenclature of I
the Upper Part of the Green River Formation, Piceance Creek Basin, •
Colorado, and Eastern Basins, Utah, 1974.
Chevron Research Company, Richmond, California 94802. Chevron Hi
Research Company Temporary Shale Oil Semi-Works Development
Facility Solid Waste Disposal Permit Application. Prepared by «
Morrison-Knudsen Company, Inc., Boise, Idaho 83729. Submitted to B
Utah Bureau of Solid Waste Management, May 1981.
Conant, L. C., and V. E. Swanson. Chattanooga Shale and Related H
Rocks of Central Tennessee and Nearby Areas. U.S. Geological w
Survey Professional Paper 357, 1961.
Culbertson, W. C. Geology and Mineral Resources of the Green River |
Formation, Wyoming. Presented at the United Nations Symposium on
the Development and Utilizaiton of Oil Shale Resources, Tallinn, n
U.S.S.R., 1968. Hi
Culbertson, W. C. Trona in the Wilkens Peak Member of the Green
River Formation, SW, Wyoming. USGS Professional Paper 550B. B
Culbertson, W. C., and J. K. Pitman. Oil Shale, U.S. Mineral
Resources. Professional Paper No. 820, U.S. Geological Survey, m
Denver, Colorado, 1973. |j
Davis, E. C., and W. J. Boegly, Jr. A Review of the literature —
on leachates from coal storage piles. Oak Ridge National Labora- B
tory Report No. ORNL/TM-6186, January 1978. •
Denver Research Institute, University of Denver, Denver, Colorado •
80208. Systems Applications Inc., San Rafael, California 94903. (
Kaman Sciences Corporation, Kaman Tempo, Santa Barbara, California
93102. Draft Report: Overview of the Environmental Problems of m
Oil Shale Development. Prepared under Contract 68-03-2795. •
Project Officer: R. C. Thurnau, U.S. Environmental Protection
Agency, Cincinnati, Ohio 45268.
Denver Research Institute, University of Denver, Denver, Colorado B
80208. Draft Report DRI No. 5269. Characterization of Contami-
nants in Oil Shale Residuals and the Potential for Their Management •
to Meet Environmental Quality Standards. Second and Third Annual B
Report, NSF (RANN) Grant No. ENV75-00175-A02. J. J. Schmidt-
Collerus, Principal Investigator. April 1980. «.
256
I
image:
I
Bureau of Land Management. U.S. Department of the Interior, Utah "
State Office, Salt Lake City, Utah 84111. Final Environmental
Impact Statement on the Uintah Basin Synfuels Development. I
February 1983. B
Cashion, W. B. Geology and Fuel Resources of the Green River •
Formation, Southeastern Uinta Basin, Utah and Colorado. USGS g
Professional Paper 548, 1967.
Cashion, W. B., and J. R. Donnell. Revision of Nomenclature of I
the Upper Part of the Green River Formation, Piceance Creek Basin, •
Colorado, and Eastern Basins, Utah, 1974.
Chevron Research Company, Richmond, California 94802. Chevron Hi
Research Company Temporary Shale Oil Semi-Works Development
Facility Solid Waste Disposal Permit Application. Prepared by «
Morrison-Knudsen Company, Inc., Boise, Idaho 83729. Submitted to B
Utah Bureau of Solid Waste Management, May 1981.
Conant, L. C., and V. E. Swanson. Chattanooga Shale and Related H
Rocks of Central Tennessee and Nearby Areas. U.S. Geological w
Survey Professional Paper 357, 1961.
Culbertson, W. C. Geology and Mineral Resources of the Green River |
Formation, Wyoming. Presented at the United Nations Symposium on
the Development and Utilizaiton of Oil Shale Resources, Tallinn, n
U.S.S.R., 1968. Hi
Culbertson, W. C. Trona in the Wilkens Peak Member of the Green
River Formation, SW, Wyoming. USGS Professional Paper 550B. B
Culbertson, W. C., and J. K. Pitman. Oil Shale, U.S. Mineral
Resources. Professional Paper No. 820, U.S. Geological Survey, m
Denver, Colorado, 1973. |j
Davis, E. C., and W. J. Boegly, Jr. A Review of the literature —
on leachates from coal storage piles. Oak Ridge National Labora- B
tory Report No. ORNL/TM-6186, January 1978. •
Denver Research Institute, University of Denver, Denver, Colorado •
80208. Systems Applications Inc., San Rafael, California 94903. (
Kaman Sciences Corporation, Kaman Tempo, Santa Barbara, California
93102. Draft Report: Overview of the Environmental Problems of m
Oil Shale Development. Prepared under Contract 68-03-2795. •
Project Officer: R. C. Thurnau, U.S. Environmental Protection
Agency, Cincinnati, Ohio 45268.
Denver Research Institute, University of Denver, Denver, Colorado B
80208. Draft Report DRI No. 5269. Characterization of Contami-
nants in Oil Shale Residuals and the Potential for Their Management •
to Meet Environmental Quality Standards. Second and Third Annual B
Report, NSF (RANN) Grant No. ENV75-00175-A02. J. J. Schmidt-
Collerus, Principal Investigator. April 1980. «.
256
I
image:
 Denver Research Institute, University of Denver, Denver, Colorado
80208. Trace Elements Associated with Oil Shale and Its Processing.
Prepared for The Environmental Protection Agency, Industrial Envi-
ronmental Research Laboratory, under contract 68-02-1881, May 1977.
Denver Research Institute, University of Denver, Denver, Colorado
80208. An Engineering Analysis Report on the Parahp Oil Shale
Process, C. H. Prien. Prepared for Industrial Environmental
Research Laboratory, USEPA, Cincinnati, Ohio 45268; under EPA
contract No. 68-02-1881; Project Officer T. J. Powers ill.
24 June 1977. ;
Dinneen, G. V., and others. Constitution of Green River Oil Shale.
Presented at the U.N. Symposium on the Development and'Utilization
of Oil Shale Resources, Tallinn, U.S.S.R., 1968. ;
Dinneen, G. V. Oil Shale and the Energy Crisis. American Society
of Mechanical Engineers, 1972 Winter Meeting, New York> N.Y., 1972.
i
DOE/EV-0078, May 1980. Environmental Research on ia Modified
In Situ Oil Shale Process: A Progress Report from the Oil Shale
Task Force. U.S. Department of Energy, Washington) DC 20545.
i
DOE/EV-86, June 1980. Paraho Environmental Data. Part I: Process
Characterization; Part II: Air Quality; Part III Water Quality.
Prepared by R. N. Heistand, R. A. Atwood and K. L. ;Richardson.
Prepared for U.S. Department of Energy, Washington; DC 20858.
DOE/FE/60177-1590 (DE84012285), April 1984. Postburn Character-
ization of a Geokinetics In Situ Oil Shale Retort. G. M. Mason,
R. D. Giaugue and D. B. McWhorter. Work performed under Inter-
agency Agreement AD-89-F-0-026-0 and Cooperative! Agreement
DE-FC21-83FE60177 for U.S. Department of Energy by Western Research
Institute, Laramie, Wyoming. :
i
Donnell, J. R. Tertiary Geology and Oil Shale Resources of the
Piceance Creek Basin, NW Colorado. USGS Bulletin 10£2-L, 1961.
i
Donnell, J. R. Mercury in Oil Shale From the Mahogany Zone of the
Green River Formation. USGS, Journal of Research, Vol. 5, No. 2,
March-April 1977. i
Dravo Corporation. Materials Handling Techniques for Backfilling
Proposed Oil Shale Mines. 1975.
i
Duncan, D. C. and V. E. Swanson. Organic Rich Shales of the U.S.
and World Land Areas. U.S. Circular 523, U.S. Geological Survey,
Denver, Colorado, 1965. :
i
Engineering-Science, Inc., Denver, Colorado 80212. Draft Summary
Report: Hazard Assessment of Pollutant Emissions from Shale Oil
Production Facilities. Prepared for USEPA Region VIII,1 June 1983.
257
image:
Denver Research Institute, University of Denver, Denver, Colorado
80208. Trace Elements Associated with Oil Shale and Its Processing.
Prepared for The Environmental Protection Agency, Industrial Envi-
ronmental Research Laboratory, under contract 68-02-1881, May 1977.
Denver Research Institute, University of Denver, Denver, Colorado
80208. An Engineering Analysis Report on the Parahp Oil Shale
Process, C. H. Prien. Prepared for Industrial Environmental
Research Laboratory, USEPA, Cincinnati, Ohio 45268; under EPA
contract No. 68-02-1881; Project Officer T. J. Powers ill.
24 June 1977. ;
Dinneen, G. V., and others. Constitution of Green River Oil Shale.
Presented at the U.N. Symposium on the Development and'Utilization
of Oil Shale Resources, Tallinn, U.S.S.R., 1968. ;
Dinneen, G. V. Oil Shale and the Energy Crisis. American Society
of Mechanical Engineers, 1972 Winter Meeting, New York> N.Y., 1972.
i
DOE/EV-0078, May 1980. Environmental Research on ia Modified
In Situ Oil Shale Process: A Progress Report from the Oil Shale
Task Force. U.S. Department of Energy, Washington) DC 20545.
i
DOE/EV-86, June 1980. Paraho Environmental Data. Part I: Process
Characterization; Part II: Air Quality; Part III Water Quality.
Prepared by R. N. Heistand, R. A. Atwood and K. L. ;Richardson.
Prepared for U.S. Department of Energy, Washington; DC 20858.
DOE/FE/60177-1590 (DE84012285), April 1984. Postburn Character-
ization of a Geokinetics In Situ Oil Shale Retort. G. M. Mason,
R. D. Giaugue and D. B. McWhorter. Work performed under Inter-
agency Agreement AD-89-F-0-026-0 and Cooperative! Agreement
DE-FC21-83FE60177 for U.S. Department of Energy by Western Research
Institute, Laramie, Wyoming. :
i
Donnell, J. R. Tertiary Geology and Oil Shale Resources of the
Piceance Creek Basin, NW Colorado. USGS Bulletin 10£2-L, 1961.
i
Donnell, J. R. Mercury in Oil Shale From the Mahogany Zone of the
Green River Formation. USGS, Journal of Research, Vol. 5, No. 2,
March-April 1977. i
Dravo Corporation. Materials Handling Techniques for Backfilling
Proposed Oil Shale Mines. 1975.
i
Duncan, D. C. and V. E. Swanson. Organic Rich Shales of the U.S.
and World Land Areas. U.S. Circular 523, U.S. Geological Survey,
Denver, Colorado, 1965. :
i
Engineering-Science, Inc., Denver, Colorado 80212. Draft Summary
Report: Hazard Assessment of Pollutant Emissions from Shale Oil
Production Facilities. Prepared for USEPA Region VIII,1 June 1983.
257
image:
 I
EPA-600/7-79-075, March 1979. Technological Overview Reports for B
Eight Shale Oil Recovery Processes. C. C. Shin, J. E. Cotter,
C. H. Prien and T. D. Nevens, U.S. Environmental Protection m
Agency, Cincinnati, Ohio 45268. ™
EPA 600/7-80-181, 1980. Reconnaissance Study of Leachate Quality «
From Raw-Mined Oil Shale-Laboratory Columns. D. B. McWhorter, H
Colorado State University. U.S. Environmental Protection Agency,
Cincinnati, Ohio 45268. «
EPA-600/2-80-205a, 1980. Environmental Perspective on the Emerging ™
Oil Shale Industry. EPA Oil Shale Research Group. E. R. Bates and
T. L. Thoem, U.S. Environmental Protection Agency, Cincinnati, Ohio •
45268. V
EPA-600/8-83-003, April 1983. Pollution Control Technical Manual: «
TOSCO II Oil Shale Retorting with Underground Mining. Denver •
Research Institute. U.S. Environmental Protection Agency,
Cincinnati, Ohio 45268. _
EPA-600/8-83-004, April 1983. Pollution Control Technical Manual: •
Modified In Situ Oil Shale Retorting. Denver Research Institute.
U.S. Environmental Protection Agency, Cincinnati, Ohio 45268. m
EPA-600/8-83-005, April 1983. Pollution Control Technical Manual:
Lurgi Oil Shale Retorting with Open Pit Mining. Denver Research »
Institute. U.S. Environmental Protection Agency, Cincinnati, Ohio •
45268. m
EPA-600/2-84-153, 1984. Auto-oxidation Potential of Raw and Retor- •
ted Oil Shale. A. D. Green, Research Triangle Institute. U.S. •
Environmental Protection Agency, Cincinnati, Ohio 45268.
EPA-600/D-84-036, March 1984. Environmental Research Brief, Oil £
Shale Potential Environmental Impacts and Control Technology.
E. R. Bates, W. W. Liberick, J. Burckle, U.S. Environmental Pro- _.
tection Agency, Cincinnati, Ohio 45268. I
EPA-600/D-84-228, 1984. Leaching Characteristics and Hydraulic
Properties of Retorted Oil Shales. D. B. McWhorter, Colorado fii
State University. U.S. Environmental Protection Agency, Cinci- 0
nnati, Ohio 45268.
EPA 600/D-84-143, August 1984. Environmental Research Brief. ||
Quality and Quantity of Leachate from Raw Mined Colorado Oil Shale.
D. B. McWhorter, Colorado State University. U.S. Environmental
Protection Agency, Cincinnati, Ohio 45268. n
Fahey, J. J. Saline Minerals of the Green River Formation. USGS
Professional Paper 405, 1962. •
258
1
I
image:
I
EPA-600/7-79-075, March 1979. Technological Overview Reports for B
Eight Shale Oil Recovery Processes. C. C. Shin, J. E. Cotter,
C. H. Prien and T. D. Nevens, U.S. Environmental Protection m
Agency, Cincinnati, Ohio 45268. ™
EPA 600/7-80-181, 1980. Reconnaissance Study of Leachate Quality «
From Raw-Mined Oil Shale-Laboratory Columns. D. B. McWhorter, H
Colorado State University. U.S. Environmental Protection Agency,
Cincinnati, Ohio 45268. «
EPA-600/2-80-205a, 1980. Environmental Perspective on the Emerging ™
Oil Shale Industry. EPA Oil Shale Research Group. E. R. Bates and
T. L. Thoem, U.S. Environmental Protection Agency, Cincinnati, Ohio •
45268. V
EPA-600/8-83-003, April 1983. Pollution Control Technical Manual: «
TOSCO II Oil Shale Retorting with Underground Mining. Denver •
Research Institute. U.S. Environmental Protection Agency,
Cincinnati, Ohio 45268. _
EPA-600/8-83-004, April 1983. Pollution Control Technical Manual: •
Modified In Situ Oil Shale Retorting. Denver Research Institute.
U.S. Environmental Protection Agency, Cincinnati, Ohio 45268. m
EPA-600/8-83-005, April 1983. Pollution Control Technical Manual:
Lurgi Oil Shale Retorting with Open Pit Mining. Denver Research »
Institute. U.S. Environmental Protection Agency, Cincinnati, Ohio •
45268. m
EPA-600/2-84-153, 1984. Auto-oxidation Potential of Raw and Retor- •
ted Oil Shale. A. D. Green, Research Triangle Institute. U.S. •
Environmental Protection Agency, Cincinnati, Ohio 45268.
EPA-600/D-84-036, March 1984. Environmental Research Brief, Oil £
Shale Potential Environmental Impacts and Control Technology.
E. R. Bates, W. W. Liberick, J. Burckle, U.S. Environmental Pro- _.
tection Agency, Cincinnati, Ohio 45268. I
EPA-600/D-84-228, 1984. Leaching Characteristics and Hydraulic
Properties of Retorted Oil Shales. D. B. McWhorter, Colorado fii
State University. U.S. Environmental Protection Agency, Cinci- 0
nnati, Ohio 45268.
EPA 600/D-84-143, August 1984. Environmental Research Brief. ||
Quality and Quantity of Leachate from Raw Mined Colorado Oil Shale.
D. B. McWhorter, Colorado State University. U.S. Environmental
Protection Agency, Cincinnati, Ohio 45268. n
Fahey, J. J. Saline Minerals of the Green River Formation. USGS
Professional Paper 405, 1962. •
258
1
I
image:
 Faulkner, B. P., M. H. Weinecke and R. F. Cnare. Results of the
Processing of a Western Oil on the Allis-Chalmers Roller Grate
Retort System. Sixteenth Oil Shale Symposium, April 13-15, 1983;
Proceedings published by Colorado School of Mines Press, (Editor:
J. H. Gary), August 1983.
Forbes, F. and F. W, Kinsey. The Dravo Traveling Grate Process
for Oil Shale Retorting. Proceedings, 1981 Eastern Oil Shale
Symposium, November 15-17, 1981, Lexington, KY. Proceedings pub-
lished by Institute for Mining & Mineral Research, Lexington, KY
40512.
i
Fox, J. P. Leaching of Oil Shale Solid Wastes: A Critical Review.
July 1983. Prepared for the Center for Environmental Sciences,
University of Colorado at Denver, Denver, CO 80202. Work supported
by U.S. Department of Energy under Contract NumbersiDE-AC02-79-
EV10298 and DE-AC03-76SF00098. ,
Guney, M., and D. J. Hodges. Adiabatic Studies of'Spontaneous
Heating of Coal, Part I. Coll. Guard., V. 217, No. 2, 1969,
pp. 105-109. :
I
Heistand, R. N., 8185 E. Geddes Ave., Englewood, CO 80112. Private
Communication, September 1984. i
Kite, R. J., and J. W. Dyni. Potential Resources of Dawsoriite
and Nahcolite in the Piceance Creek Basin, NW Colorado. Quarterly
of the Colorado School of Mines, Vol. 62, No. 3, 1967,'pp. 591-604.
Herron, J. T., W. A. Berg and H. P. Harbert III. Vegetation and
Lysimeter Studies on Decarbonized Oil Shale. Colorado State
University Experiment Station, Fort Collins, Colorado 80523,
Technical Bulletin 136, January 1980.
Holtz, W. G. Woodward-Clyde Consultants. Disposal :of Retorted
Oil Shale from the Paraho Oil Shale Project. USBM Contract
J0255004. December 1976. ;
Jackson, L. P. and K. F. Jackson. The Co-disposal of Retorted
Shale and Process Waters: Effect on Shale Leachate Composition.
Fifteenth Oil Shale Symposium, April 28-30, 1982, Golden, Colorado.
Proceedings (J. H. Gary, Editor) published by Colorado School of
Mines Press, August 1982. i
Kim, A. G. Laboratory studies on spontaneous heating; of coal: A
summary of Information in the Literature. U.S. Dept. of the
Interior, Bureau of Mines, IC8756, 1977. ;
Lowry, H. H. Chemistry of Coal Utilization, Vol. 1, John Wiley &
Sons, 1954. .i
259
image:
Faulkner, B. P., M. H. Weinecke and R. F. Cnare. Results of the
Processing of a Western Oil on the Allis-Chalmers Roller Grate
Retort System. Sixteenth Oil Shale Symposium, April 13-15, 1983;
Proceedings published by Colorado School of Mines Press, (Editor:
J. H. Gary), August 1983.
Forbes, F. and F. W, Kinsey. The Dravo Traveling Grate Process
for Oil Shale Retorting. Proceedings, 1981 Eastern Oil Shale
Symposium, November 15-17, 1981, Lexington, KY. Proceedings pub-
lished by Institute for Mining & Mineral Research, Lexington, KY
40512.
i
Fox, J. P. Leaching of Oil Shale Solid Wastes: A Critical Review.
July 1983. Prepared for the Center for Environmental Sciences,
University of Colorado at Denver, Denver, CO 80202. Work supported
by U.S. Department of Energy under Contract NumbersiDE-AC02-79-
EV10298 and DE-AC03-76SF00098. ,
Guney, M., and D. J. Hodges. Adiabatic Studies of'Spontaneous
Heating of Coal, Part I. Coll. Guard., V. 217, No. 2, 1969,
pp. 105-109. :
I
Heistand, R. N., 8185 E. Geddes Ave., Englewood, CO 80112. Private
Communication, September 1984. i
Kite, R. J., and J. W. Dyni. Potential Resources of Dawsoriite
and Nahcolite in the Piceance Creek Basin, NW Colorado. Quarterly
of the Colorado School of Mines, Vol. 62, No. 3, 1967,'pp. 591-604.
Herron, J. T., W. A. Berg and H. P. Harbert III. Vegetation and
Lysimeter Studies on Decarbonized Oil Shale. Colorado State
University Experiment Station, Fort Collins, Colorado 80523,
Technical Bulletin 136, January 1980.
Holtz, W. G. Woodward-Clyde Consultants. Disposal :of Retorted
Oil Shale from the Paraho Oil Shale Project. USBM Contract
J0255004. December 1976. ;
Jackson, L. P. and K. F. Jackson. The Co-disposal of Retorted
Shale and Process Waters: Effect on Shale Leachate Composition.
Fifteenth Oil Shale Symposium, April 28-30, 1982, Golden, Colorado.
Proceedings (J. H. Gary, Editor) published by Colorado School of
Mines Press, August 1982. i
Kim, A. G. Laboratory studies on spontaneous heating; of coal: A
summary of Information in the Literature. U.S. Dept. of the
Interior, Bureau of Mines, IC8756, 1977. ;
Lowry, H. H. Chemistry of Coal Utilization, Vol. 1, John Wiley &
Sons, 1954. .i
259
image:
 I
Margheim, G. A. Water Pollution from Spent Oil Shale. Ph. D. •
Dissertation, Colorado State University, Fort Collins, CO, May
1975. B,
Matzick, A., and others. Development of the USBM Gas Combustion
Oil Shale Retorting Process. USBM Bulletin 635, 1966. m
Monsanto Company, 1515 Nicholas Road, Dayton, Ohio 45418. Duane
Day, Personal Communication, February 1984.
Monsanto Company, 1515 Nicholas Road, Dayton, Ohio 45418. A. K. •
Agarwal, August 1984. Based on TRW, March 1977.
Murray, D. K., and J. D. Haun. Introduction to the Geology of the p
Piceance Creek Basin and Vicinity, Northwestern Colorado. Rocky
Mountain Association of Geologists, Guidebook, 1974. «
Paraho Development Corporation, June 1982. Paraho-Ute Project ""
Technical Report. Requested by the Bureau of Land Management EIS
Services, Denver, CO. - B
Poulson, R. E., and others. Minor Elements in Oil Shale and Oil
Shale Products. Presented at the NBS/EPA Workshop on Standard m
Reference Materials for Oil Shale Environmental Concerns, I
Gaithersburg, Maryland, November 1975.
Roehler, H. W. Depositional Environments of Rocks in the Piceance 8
Creek Basin, Colorado, Rocky Mountain Association of Geologists. *•
Guidebook to the Energy Resources of the Piceance Creek Basin,
Colorado, 1974. •
Roehler, H. W. Mineral Resources in the Washakie Basin, Wyoming
and Sand Wash Basin, Colorado. Wyoming Geological Association •
Guidebook, Greater Green River Basin Symposium, 1973. I
Schemling, W. A. et al. Spontaneous Combustion Liability of Sub-
bituminous Coals: Development of a Simplified Test Method for •
Field Lab/Mine Application. Analytic Chemistry of Liquid Fuel ™
Sources, P. C. Uden et al., eds, ACS 1978.
Schuman, G. E., W. A. Berg and J. F. Power. Management of Mine |
Wastes in the Western United States, Land Applications of Waste
Materials. Published in 1976 by Soil Conservation Society of m
America, Ankeny, Iowa. •
Sellers, J. B. Rock Mechanics Research in Oil Shale Mining.
100th National Meeting of AIME, New York, N.Y., 1971. f
Smith, J. W. Specific Gravity - Oil Yield Relationships of Two
Colorado Oil Shale Cores, Industrial and Engineering Chemistry,
Vol. 48, No. 3, 1956, pp. 441-44.
260
I
I
I
image:
I
Margheim, G. A. Water Pollution from Spent Oil Shale. Ph. D. •
Dissertation, Colorado State University, Fort Collins, CO, May
1975. B,
Matzick, A., and others. Development of the USBM Gas Combustion
Oil Shale Retorting Process. USBM Bulletin 635, 1966. m
Monsanto Company, 1515 Nicholas Road, Dayton, Ohio 45418. Duane
Day, Personal Communication, February 1984.
Monsanto Company, 1515 Nicholas Road, Dayton, Ohio 45418. A. K. •
Agarwal, August 1984. Based on TRW, March 1977.
Murray, D. K., and J. D. Haun. Introduction to the Geology of the p
Piceance Creek Basin and Vicinity, Northwestern Colorado. Rocky
Mountain Association of Geologists, Guidebook, 1974. «
Paraho Development Corporation, June 1982. Paraho-Ute Project ""
Technical Report. Requested by the Bureau of Land Management EIS
Services, Denver, CO. - B
Poulson, R. E., and others. Minor Elements in Oil Shale and Oil
Shale Products. Presented at the NBS/EPA Workshop on Standard m
Reference Materials for Oil Shale Environmental Concerns, I
Gaithersburg, Maryland, November 1975.
Roehler, H. W. Depositional Environments of Rocks in the Piceance 8
Creek Basin, Colorado, Rocky Mountain Association of Geologists. *•
Guidebook to the Energy Resources of the Piceance Creek Basin,
Colorado, 1974. •
Roehler, H. W. Mineral Resources in the Washakie Basin, Wyoming
and Sand Wash Basin, Colorado. Wyoming Geological Association •
Guidebook, Greater Green River Basin Symposium, 1973. I
Schemling, W. A. et al. Spontaneous Combustion Liability of Sub-
bituminous Coals: Development of a Simplified Test Method for •
Field Lab/Mine Application. Analytic Chemistry of Liquid Fuel ™
Sources, P. C. Uden et al., eds, ACS 1978.
Schuman, G. E., W. A. Berg and J. F. Power. Management of Mine |
Wastes in the Western United States, Land Applications of Waste
Materials. Published in 1976 by Soil Conservation Society of m
America, Ankeny, Iowa. •
Sellers, J. B. Rock Mechanics Research in Oil Shale Mining.
100th National Meeting of AIME, New York, N.Y., 1971. f
Smith, J. W. Specific Gravity - Oil Yield Relationships of Two
Colorado Oil Shale Cores, Industrial and Engineering Chemistry,
Vol. 48, No. 3, 1956, pp. 441-44.
260
I
I
I
image:
 Smith, J. w. Ultimate Composition of Organic Material in Green
River Oil Shale. U.S. Bureau of Mines Report of Investigations
Smith, J. W. Stratigraphic Change in Organic Composition Demon-
strated by Oil Specific Gravity-Depth Correlation in1 Green River
Oil Shale. AAPG Bulletin, Vol. 47, No. 5, May 1963. :
Smith, J. W., and N. B. Young. Specific Gravity to Oil Yield
Relationships for Black Shales of Kentucky's New Albany Formula-
tion. USBM Report of Investigations No. 6531, 1964. i
Smith, J. W., and N. B. Young. Organic Composition of Kentucky's
New Albany Shale; Determination and Uses. Elsevier Publishina
Company, Amsterdam, 1967. i
Smith, J. W. Simultaneous DTA-TG-MSA Apparatus for Thermal Study
of Natural Fuels, International Conference on Thermal Analysis
1968. !
i
Smith, J. w. Theoretical Relationship Between Density and Oil
Yield for Oil Shales. USBM Report of Investigations ; 7248, 1969.
Smith, J. W., W. A. Robb, and N. B. Young. High i Temperature
Reactions of Oil Shale Minerals and Their Benefit to Oil Shale
Processing in Place. Presented at the llth Oil Shale Symposium,
Colorado School of Mines, Golden, Colorado, 1978. \
Stanfield, K. E. Properties of Colorado Oil Shale. USBM Report
of Investigations 4825, 1951. :
Stollenwerk, K. G. and D. D. Runnells. Env. Sc. & Technol
November 1981, pp. 1340-1346. ;
Taback, H. J., G. C. Quartucy and R. J. Goldstick. ; KVB, Inc.,
Engineering and Research Division, Irvine, CA 92714. Test of a
Stretford Plant and an Alkaline Scrubber on Gases from an Oil
Shale In Sztu Retort at Geokinetics, Inc., Uintah County, Utah.
KVB-807430-1982. Prepared for USEPA. Industrial Environmental
Research Laboratory, Cincinnati, Ohio 45268. August 1984.
t
Tamm, P. W., C. A. .Bertelsen, G. M. Handel, B. G. Spars and P. H.
Wallman. Chevron Research Company, Richmond, CA. The Chevron
STB Oil Shale Retort. Preprint No. 23-81. 46th Midyear Refining
Meeting, Session on Synthetic Fuels Processing - Part I, May 13,
1981,, Chicago, Illinois. American Petroleum Institute/ Washington,
DC 20037. ,
Tarman, P. B., H. L. Feldkircher, and S. A. Weil. Hydroretorting
Process for Eastern Shale. Presented at the Society of Petroleum
Engineers, Eastern Regional Meeting, October 1977, Paper No. SPE
6628, IGT, Chicago, Illinois, 1977.
261
image:
Smith, J. w. Ultimate Composition of Organic Material in Green
River Oil Shale. U.S. Bureau of Mines Report of Investigations
Smith, J. W. Stratigraphic Change in Organic Composition Demon-
strated by Oil Specific Gravity-Depth Correlation in1 Green River
Oil Shale. AAPG Bulletin, Vol. 47, No. 5, May 1963. :
Smith, J. W., and N. B. Young. Specific Gravity to Oil Yield
Relationships for Black Shales of Kentucky's New Albany Formula-
tion. USBM Report of Investigations No. 6531, 1964. i
Smith, J. W., and N. B. Young. Organic Composition of Kentucky's
New Albany Shale; Determination and Uses. Elsevier Publishina
Company, Amsterdam, 1967. i
Smith, J. W. Simultaneous DTA-TG-MSA Apparatus for Thermal Study
of Natural Fuels, International Conference on Thermal Analysis
1968. !
i
Smith, J. w. Theoretical Relationship Between Density and Oil
Yield for Oil Shales. USBM Report of Investigations ; 7248, 1969.
Smith, J. W., W. A. Robb, and N. B. Young. High i Temperature
Reactions of Oil Shale Minerals and Their Benefit to Oil Shale
Processing in Place. Presented at the llth Oil Shale Symposium,
Colorado School of Mines, Golden, Colorado, 1978. \
Stanfield, K. E. Properties of Colorado Oil Shale. USBM Report
of Investigations 4825, 1951. :
Stollenwerk, K. G. and D. D. Runnells. Env. Sc. & Technol
November 1981, pp. 1340-1346. ;
Taback, H. J., G. C. Quartucy and R. J. Goldstick. ; KVB, Inc.,
Engineering and Research Division, Irvine, CA 92714. Test of a
Stretford Plant and an Alkaline Scrubber on Gases from an Oil
Shale In Sztu Retort at Geokinetics, Inc., Uintah County, Utah.
KVB-807430-1982. Prepared for USEPA. Industrial Environmental
Research Laboratory, Cincinnati, Ohio 45268. August 1984.
t
Tamm, P. W., C. A. .Bertelsen, G. M. Handel, B. G. Spars and P. H.
Wallman. Chevron Research Company, Richmond, CA. The Chevron
STB Oil Shale Retort. Preprint No. 23-81. 46th Midyear Refining
Meeting, Session on Synthetic Fuels Processing - Part I, May 13,
1981,, Chicago, Illinois. American Petroleum Institute/ Washington,
DC 20037. ,
Tarman, P. B., H. L. Feldkircher, and S. A. Weil. Hydroretorting
Process for Eastern Shale. Presented at the Society of Petroleum
Engineers, Eastern Regional Meeting, October 1977, Paper No. SPE
6628, IGT, Chicago, Illinois, 1977.
261
image:
 I
Tisot, P. R. Physical Structure of Green River Oil Shale. USBM •
Report of Investigations 6184, 1963.
Tisot, P. R., and H. W. Sohns. Structural Deformation of Green •
River Oil Shale as it Relates to In. Situ Retorting. USBM Report •
of Investigations 7576, 1971.
TOSCO Development Corporation, Denver, Colorado. Project Descrip- |
tion Technical Report, Sand Wash Shale Oil Project. Uintah County,
Utah. May 1982. .
TRW. Denver Research Institute. An Engineering Analysis Report •
on the Union Retort B Process. Prepared for Industrial Environ-
mental Research Laboratory, U.S.E.P.A., Cincinnati, Ohio 45268, •
under Contract No. 68-02-1881, March 1977. •
TRW. Denver Research Institute. Management of Solid Waste n
Residuals from Oil shale Recovery Processes. Prepared for Indus- |
trial Environmental Research Laboratory, U.S.E.P.A., Cincinnati,
Ohio 45268, under Contract No. 68-02-1881, May 1977.
TRW. Denver Research Institute. Trace Elements Associated with •
Oil Shale and its Processing. Prepared for Industrial Environ-
mental Research Laboratory, U.S.E.P.A., Cincinnati, Ohio 45268, •
under Contract No. 68-02-1881, May 1977. . i
Union Oil Company of California, Energy Mining Division. Environ- „
mental Monitoring Plan Outline. Parachute Creek Shale Oil Program, •
Phase II, January 23, 1984. U.S. Patent 4037657. •
Vanderborgh, N. E. Characterization of Oil Shales by Laser Induced •
Pyrolysis. FACSS, Atlantic City, N.J., Nov. 19, 1984. •
Wildung, R. E., and J. M. Zachara. Geochemistry of Oil Shale m
Solid Waste Disposal. Proceedings of International Symposium, g
August 11-14, 1980. K. K. Peterson, Editor. Sponsored by the Oil
Shale Task Force and U.S. Department of Energy. Colorado School
of Mines Press, Golden, Colorado, 1981. •
1
1
262
image:
I
Tisot, P. R. Physical Structure of Green River Oil Shale. USBM •
Report of Investigations 6184, 1963.
Tisot, P. R., and H. W. Sohns. Structural Deformation of Green •
River Oil Shale as it Relates to In. Situ Retorting. USBM Report •
of Investigations 7576, 1971.
TOSCO Development Corporation, Denver, Colorado. Project Descrip- |
tion Technical Report, Sand Wash Shale Oil Project. Uintah County,
Utah. May 1982. .
TRW. Denver Research Institute. An Engineering Analysis Report •
on the Union Retort B Process. Prepared for Industrial Environ-
mental Research Laboratory, U.S.E.P.A., Cincinnati, Ohio 45268, •
under Contract No. 68-02-1881, March 1977. •
TRW. Denver Research Institute. Management of Solid Waste n
Residuals from Oil shale Recovery Processes. Prepared for Indus- |
trial Environmental Research Laboratory, U.S.E.P.A., Cincinnati,
Ohio 45268, under Contract No. 68-02-1881, May 1977.
TRW. Denver Research Institute. Trace Elements Associated with •
Oil Shale and its Processing. Prepared for Industrial Environ-
mental Research Laboratory, U.S.E.P.A., Cincinnati, Ohio 45268, •
under Contract No. 68-02-1881, May 1977. . i
Union Oil Company of California, Energy Mining Division. Environ- „
mental Monitoring Plan Outline. Parachute Creek Shale Oil Program, •
Phase II, January 23, 1984. U.S. Patent 4037657. •
Vanderborgh, N. E. Characterization of Oil Shales by Laser Induced •
Pyrolysis. FACSS, Atlantic City, N.J., Nov. 19, 1984. •
Wildung, R. E., and J. M. Zachara. Geochemistry of Oil Shale m
Solid Waste Disposal. Proceedings of International Symposium, g
August 11-14, 1980. K. K. Peterson, Editor. Sponsored by the Oil
Shale Task Force and U.S. Department of Energy. Colorado School
of Mines Press, Golden, Colorado, 1981. •
1
1
262
image:
 APPENDIX A .:
AUTO-OXIDATION POTENTIAL OF RAW AND SPENT SHALE AND THE SUGGESTED
DESIGN OF PILES TO AVOID THE AUTO-IGNITION OF SHALES
i
A.I. Auto-oxidation Potential of raw and Spent Shales;
At the present time, considerable effort is being devoted to com-
mercialization of processes to produce liquid fuels from oil shale
deposits in the western United States. The retorting of oil shale
produces large quantities of solid waste. This material, mineral
matter from which kerogen has been thermally removed to a varying
extent, is referred to as retorted or spent oil shale.; This spent
oil shale contains a considerable amount of carbonaceous material.
The amount of spent shale to be disposed of after retorting the
raw shale is dependent upon the retorting technology; and retort
efficiency. For example, a 50,000 tons per day re'tort, using
25 gallons per ton raw shale has been estimated to produce
42,500 tons per day of spent shale for disposal [Brpwn et al.,
September 1977]. Retorted shales from internal combustion gas
retorts have carbon compositions of 2% 'to 3% and are soft and
friable. Retorted shales from indirect heated retdrts (Paraho
indirect mode, TOSCO II, Union B) have a higher carbon content
which may be reduced to less than 1% if the retorted shale is
subsequently combusted. i
Most developers are currently planning on disposing of the the
spent shale, overburden and rejected raw shale fines in nearby
canyons. Disposing of this material in landfills several hundred
feet thick and covering several square miles each is a likely
prospect. The phenomena of auto-oxidation, self-heating, and
spontaneous combustion have long been observed in large masses of
carbonaceous materials such as coal storage piles, coal mining
refuse piles, and dump sites. Where spontaneous combustion has
occurred, extinguishing measures have been difficult or impossible.
Hence the potential of spontaneous combustion in spent oil shale
disposal areas is a matter of serious environmental concern.
Most of the work in the area of auto-oxidation potential has been
done on coals. Several factors have been found to have a signifi-
cant effect on the rate of spontaneous heating of coal>[Kim, 1977]
as described below:
A-l
image:
APPENDIX A .:
AUTO-OXIDATION POTENTIAL OF RAW AND SPENT SHALE AND THE SUGGESTED
DESIGN OF PILES TO AVOID THE AUTO-IGNITION OF SHALES
i
A.I. Auto-oxidation Potential of raw and Spent Shales;
At the present time, considerable effort is being devoted to com-
mercialization of processes to produce liquid fuels from oil shale
deposits in the western United States. The retorting of oil shale
produces large quantities of solid waste. This material, mineral
matter from which kerogen has been thermally removed to a varying
extent, is referred to as retorted or spent oil shale.; This spent
oil shale contains a considerable amount of carbonaceous material.
The amount of spent shale to be disposed of after retorting the
raw shale is dependent upon the retorting technology; and retort
efficiency. For example, a 50,000 tons per day re'tort, using
25 gallons per ton raw shale has been estimated to produce
42,500 tons per day of spent shale for disposal [Brpwn et al.,
September 1977]. Retorted shales from internal combustion gas
retorts have carbon compositions of 2% 'to 3% and are soft and
friable. Retorted shales from indirect heated retdrts (Paraho
indirect mode, TOSCO II, Union B) have a higher carbon content
which may be reduced to less than 1% if the retorted shale is
subsequently combusted. i
Most developers are currently planning on disposing of the the
spent shale, overburden and rejected raw shale fines in nearby
canyons. Disposing of this material in landfills several hundred
feet thick and covering several square miles each is a likely
prospect. The phenomena of auto-oxidation, self-heating, and
spontaneous combustion have long been observed in large masses of
carbonaceous materials such as coal storage piles, coal mining
refuse piles, and dump sites. Where spontaneous combustion has
occurred, extinguishing measures have been difficult or impossible.
Hence the potential of spontaneous combustion in spent oil shale
disposal areas is a matter of serious environmental concern.
Most of the work in the area of auto-oxidation potential has been
done on coals. Several factors have been found to have a signifi-
cant effect on the rate of spontaneous heating of coal>[Kim, 1977]
as described below:
A-l
image:
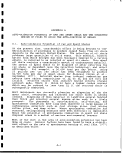 I
Air Flow Rate K
The air flow rate is a complex factor because air both provides
oxygen for oxidation of the coal and dissipates the heat generated •
by oxidation. A very high flow rate provides almost unlimited • •
oxygen, but dissipates heat efficiently. A low flow rate restricts
the amount of oxygen available, but allows heat generated to remain m
in the coal. A critical flow rate would be one that provides g
sufficient oxygen for widespread oxidation but does not dissipate
the heat generated. «
Particle size
Particle size has an inverse relationship to spontaneous heating. B
The smaller the particle size, the greater is the exposed surface m
area and the greater is the tendency toward spontaneous heating.
Rank |
It is generally agreed that spontaneous combustion is a rank-
related phenomenon. As the rank of coal decreases, the hazard of •
spontaneous heating increases. Lignites and subbituminous coals P
are most susceptible to spontaneous heating.
Changes in Moisture Content •
The moisture content of the coal, or more exactly, changes in _
moisture content, affect the tendency of coal to spontaneous ••
heating. Drying, lost of moisture, is an endo thermic process m
and lowers the temperature of the coal; it also exposes more
oxidative sites. Wetting, gain of moisture, is an exothermic •
process, and the heat liberated may be sufficient in itself to •
cause spontaneouts heating. For a given coal at temperatures
below 212 °F, the heat of wetting is greater than the heat of •
oxidation. |
Temperature • «
The rate of coal oxidation is a direct function of temperature; the ™
higher the temperature, the faster the rate at which coal reacts
with oxygen. This is particularly important in areas where heat H
generated by oxidation accumulates, further accelerating the rate H
of oxidation.
Pyrite Content H
The presence of the sulfur minerals pyrite and marcasite may
accelerate spontaneous heating. Under certain conditions, the •
pyrite may swell and cause the coal to disintegrate, exposing •
more oxidative sites. If the pyrite is finely divided and can be
rapidly converted to ferrous sulfate, the coal is more susceptible m
to spontaneous heating. Generally, the pyrite concentration must H
exceed 2 pet. before it has a significant effect.
A-2
1
1
image:
I
Air Flow Rate K
The air flow rate is a complex factor because air both provides
oxygen for oxidation of the coal and dissipates the heat generated •
by oxidation. A very high flow rate provides almost unlimited • •
oxygen, but dissipates heat efficiently. A low flow rate restricts
the amount of oxygen available, but allows heat generated to remain m
in the coal. A critical flow rate would be one that provides g
sufficient oxygen for widespread oxidation but does not dissipate
the heat generated. «
Particle size
Particle size has an inverse relationship to spontaneous heating. B
The smaller the particle size, the greater is the exposed surface m
area and the greater is the tendency toward spontaneous heating.
Rank |
It is generally agreed that spontaneous combustion is a rank-
related phenomenon. As the rank of coal decreases, the hazard of •
spontaneous heating increases. Lignites and subbituminous coals P
are most susceptible to spontaneous heating.
Changes in Moisture Content •
The moisture content of the coal, or more exactly, changes in _
moisture content, affect the tendency of coal to spontaneous ••
heating. Drying, lost of moisture, is an endo thermic process m
and lowers the temperature of the coal; it also exposes more
oxidative sites. Wetting, gain of moisture, is an exothermic •
process, and the heat liberated may be sufficient in itself to •
cause spontaneouts heating. For a given coal at temperatures
below 212 °F, the heat of wetting is greater than the heat of •
oxidation. |
Temperature • «
The rate of coal oxidation is a direct function of temperature; the ™
higher the temperature, the faster the rate at which coal reacts
with oxygen. This is particularly important in areas where heat H
generated by oxidation accumulates, further accelerating the rate H
of oxidation.
Pyrite Content H
The presence of the sulfur minerals pyrite and marcasite may
accelerate spontaneous heating. Under certain conditions, the •
pyrite may swell and cause the coal to disintegrate, exposing •
more oxidative sites. If the pyrite is finely divided and can be
rapidly converted to ferrous sulfate, the coal is more susceptible m
to spontaneous heating. Generally, the pyrite concentration must H
exceed 2 pet. before it has a significant effect.
A-2
1
1
image:
 The various methods used to study spontaneous heating are de-
scribed in detail in the literature (Guney and Hodges, 1969],
most are variations of the four basic methods described in the
following paragraphs [Kim, 1977].
Adiabatic Calorimetry
The coal sample is placed in an insulated container or bath, and
the whole system is heated to a preselected temperature. When air
or oxygen is added, the temperature of the coal rises;,the material
surrounding the coal is heated so that its temperature coincides
with the measured temperature of the coal. Since there is no heat
loss to the surroundings, changes in coal temperature are measured
accurately. The change in the temperature of the coal in a given
time, the time needed to reach a preselected temperature, or the
amount of heat generated per unit of time is used to Evaluate the
spontaneous heating potential of the coal. ;
Isothermal Calorimetry !
In this method, a coal sample is placed in a large b'ath held at
a constant temperature. Heat generated in the coal, sample, by
oxidation or wetting, is measured by thermocouples and dissipated
in the relatively large heat sink. The measured rate of heat
generation is correlated with the combustibility of the coal.
Oxygen Sorption
In the oxygen-sorption method, a coal sample is placed in a con-
tainer and air or oxygen is added. In a closed system, gaseous
reaction products are periodically removed, and the amount of air
or O2 that must be added to maintain the system at constant pres-
sure is used to estimate the amount of oxygen absorbed. In a flow
system, the flow rate and analysis of the effluent gas j are used, to
estimate the amount of oxygen adsorbed by the coal. The tempera-
ture increase per unit of oxygen consumed indicates the coal's
potential for spontaneous heating. '
Temperature Differential :
The coal sample is placed in a bath and heated at a constant rate;
the temperature difference between the coal and the bath is
measured. Initially, the temperature of the coal lags behind the
bath temperature. When the coal begins to self-heat, the tempera-
ture of the coal will coincide with, then exceed, the I temperature
of the bath. Usually, some variant of a temperature differential-
time relationship indicates the combustibility of the coal.
i
Most experimental studies use one of the four basic methods
described, but other factors vary for each experiment. The coal
samples vary, particularly in origin, amount, preparation, and
particle size. The atmostphere is usually air or O2 ^although N2
A-3
image:
The various methods used to study spontaneous heating are de-
scribed in detail in the literature (Guney and Hodges, 1969],
most are variations of the four basic methods described in the
following paragraphs [Kim, 1977].
Adiabatic Calorimetry
The coal sample is placed in an insulated container or bath, and
the whole system is heated to a preselected temperature. When air
or oxygen is added, the temperature of the coal rises;,the material
surrounding the coal is heated so that its temperature coincides
with the measured temperature of the coal. Since there is no heat
loss to the surroundings, changes in coal temperature are measured
accurately. The change in the temperature of the coal in a given
time, the time needed to reach a preselected temperature, or the
amount of heat generated per unit of time is used to Evaluate the
spontaneous heating potential of the coal. ;
Isothermal Calorimetry !
In this method, a coal sample is placed in a large b'ath held at
a constant temperature. Heat generated in the coal, sample, by
oxidation or wetting, is measured by thermocouples and dissipated
in the relatively large heat sink. The measured rate of heat
generation is correlated with the combustibility of the coal.
Oxygen Sorption
In the oxygen-sorption method, a coal sample is placed in a con-
tainer and air or oxygen is added. In a closed system, gaseous
reaction products are periodically removed, and the amount of air
or O2 that must be added to maintain the system at constant pres-
sure is used to estimate the amount of oxygen absorbed. In a flow
system, the flow rate and analysis of the effluent gas j are used, to
estimate the amount of oxygen adsorbed by the coal. The tempera-
ture increase per unit of oxygen consumed indicates the coal's
potential for spontaneous heating. '
Temperature Differential :
The coal sample is placed in a bath and heated at a constant rate;
the temperature difference between the coal and the bath is
measured. Initially, the temperature of the coal lags behind the
bath temperature. When the coal begins to self-heat, the tempera-
ture of the coal will coincide with, then exceed, the I temperature
of the bath. Usually, some variant of a temperature differential-
time relationship indicates the combustibility of the coal.
i
Most experimental studies use one of the four basic methods
described, but other factors vary for each experiment. The coal
samples vary, particularly in origin, amount, preparation, and
particle size. The atmostphere is usually air or O2 ^although N2
A-3
image:
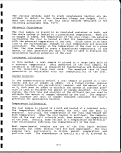 I
or other inert gas may be used for baseline evaluation or to bring •
the coal to the starting temperature. The oxidizing medium used
may be moist or dry, flowing or static. The initial temperature,
final temperature, and heating rate also vary. In some case, the ja
effluent gas is analyzed for CO, CO2 , O2 , CH4 , and other hydrocar- •
bons to provide a more of its relatively simple adaption to the
detection of spontaneous heating. •
A readily determined, universally applicable index of combusti-
bility would be the preferred method of evaluating liability to ».
spontaneous heating. Although several indices of combustibility m
are proposed in the literature for coals, none is in general use. *
The most common indices are described in the following paragraphs
[Kim, 1977]. •
Heating Rate
The temperature increase under controlled conditions, measured in ||
degrees Centigrade per hour per gram (°C/hr/g). Another variant
involves the measurement of the quantity of heat released, _.
measured in calories per hour per gram (cal/hr/g). The greater •
the heating rate, the greater is the tendency to spontaneous •
heating. Two variations of this method are:
Relative Heating Rate The heating rate relative to the I
heating rate of some standard sample.
amic Heating Rate Rate at which the temperature of I
coal increases with respect to its surroundings -
within a given temperature range.
Crossing-Point Temperature •
The temperature at which the temperature of the coal and a heated •
bath coincide, also called relative ignition temperature. ||
Ignition Temperature «
I
The temperature at which the coal ignites. The ignition tempera- m
ture at which the coal ignites. The ignition temperature is ,
determined by observation; that is, the temperature at which an fl
observer sees the coal fire. It cannot be exactly defined and, H
therefore, can only be used to determine relative spontaneity of
the coals tested. n
The ratio of CO formation to oxygen adsorption, also called the •
"CO index." The increase in the concentration of CO and the •»
decrease in the concentration of oxygen are related to the
temperature of the coal. Monitoring air for CO and oxygen is A
the basis for a method of detecting spontaneous heating. p
A-4
1
I
image:
I
or other inert gas may be used for baseline evaluation or to bring •
the coal to the starting temperature. The oxidizing medium used
may be moist or dry, flowing or static. The initial temperature,
final temperature, and heating rate also vary. In some case, the ja
effluent gas is analyzed for CO, CO2 , O2 , CH4 , and other hydrocar- •
bons to provide a more of its relatively simple adaption to the
detection of spontaneous heating. •
A readily determined, universally applicable index of combusti-
bility would be the preferred method of evaluating liability to ».
spontaneous heating. Although several indices of combustibility m
are proposed in the literature for coals, none is in general use. *
The most common indices are described in the following paragraphs
[Kim, 1977]. •
Heating Rate
The temperature increase under controlled conditions, measured in ||
degrees Centigrade per hour per gram (°C/hr/g). Another variant
involves the measurement of the quantity of heat released, _.
measured in calories per hour per gram (cal/hr/g). The greater •
the heating rate, the greater is the tendency to spontaneous •
heating. Two variations of this method are:
Relative Heating Rate The heating rate relative to the I
heating rate of some standard sample.
amic Heating Rate Rate at which the temperature of I
coal increases with respect to its surroundings -
within a given temperature range.
Crossing-Point Temperature •
The temperature at which the temperature of the coal and a heated •
bath coincide, also called relative ignition temperature. ||
Ignition Temperature «
I
The temperature at which the coal ignites. The ignition tempera- m
ture at which the coal ignites. The ignition temperature is ,
determined by observation; that is, the temperature at which an fl
observer sees the coal fire. It cannot be exactly defined and, H
therefore, can only be used to determine relative spontaneity of
the coals tested. n
The ratio of CO formation to oxygen adsorption, also called the •
"CO index." The increase in the concentration of CO and the •»
decrease in the concentration of oxygen are related to the
temperature of the coal. Monitoring air for CO and oxygen is A
the basis for a method of detecting spontaneous heating. p
A-4
1
I
image:
 Combinations of the preceding indices also are used in an attempt
to achieve greater accuracy. All of the indices are determined by
a laboratory procedure and require standard conditions to obtain
reproducible results. In some studies, the index of;interest is
compared to some internal standard; oxygen content of the coal,
for instance, without mathematical correlation. In other studies,
a simple ranking system is used to evaluate the coal^s combusti-
bility. . Indices determined in the laboratory have not been
compared to the actual incidence of spontaneous heating. Owing
to the lack of an objective criterion and the diversity of experi-
mental conditions under which the indices were developed, comparing
various indices would be inaccurate and possibly misleading. No
particular index has been shown to be significantly more accurate,
and none is in general use. At present, the CO index; is probably
receiving the most interest in the United States. This is not
because of demonstrated superiority as an index of combustibility,
but because of its relatively simple adaptation to the detection
of spontaneous heating. In many instances, evaluation of the
hazards from spontaneous heating is based on previous experience
with a given coal. >
Recently Green of Research Triangle Institute (RTIJ) conducted
experimental work on measuring auto-oxidation potential of raw
and retorted oil shale for the U.S. EPA [EPA-600/2-84-153, 1984].
This study was conducted to assess the potential spontaneous com-
bustion hazard of solid waste streams produced in the processing
of oil shale. In additon, the utility and precision of various
test methods to assess this hazard were assessed. This_work_is
the most comprehensive work done to measure the autoignition
potential of raw and spent shales and is summarized below:
A.1.1. RTI Study On Auto-oxidation Potential of Raw and
Retorted Oil Shale
Factors which influence the tendency of a storage pile to self-
heat and eventually ignite can be grouped into two main categories.
The first category includes those properties which are peculiar to
the solid itself: reactivity toward oxygen, and heat release as a
function of temperature. The second group of factors are those
relating to the pile and its construction: overall dimensions,
particle size, degree of compaction, homogeneity, ambient tempera-
ture, temperature of placed materials, precipitation, «wind speed,
etc. It is quickly seen that pile characteristics are going to
be more difficult to measure and most likely subject to more
variation than the properties of the solid itself. i
In this study, an investigation of laboratory methods of deter-
mining spontaneous combustion tendencies was conducted. These
methods were then applied to raw and retorted oil shale samples
to determine the relative hazards presented by these materials.
A-5
image:
Combinations of the preceding indices also are used in an attempt
to achieve greater accuracy. All of the indices are determined by
a laboratory procedure and require standard conditions to obtain
reproducible results. In some studies, the index of;interest is
compared to some internal standard; oxygen content of the coal,
for instance, without mathematical correlation. In other studies,
a simple ranking system is used to evaluate the coal^s combusti-
bility. . Indices determined in the laboratory have not been
compared to the actual incidence of spontaneous heating. Owing
to the lack of an objective criterion and the diversity of experi-
mental conditions under which the indices were developed, comparing
various indices would be inaccurate and possibly misleading. No
particular index has been shown to be significantly more accurate,
and none is in general use. At present, the CO index; is probably
receiving the most interest in the United States. This is not
because of demonstrated superiority as an index of combustibility,
but because of its relatively simple adaptation to the detection
of spontaneous heating. In many instances, evaluation of the
hazards from spontaneous heating is based on previous experience
with a given coal. >
Recently Green of Research Triangle Institute (RTIJ) conducted
experimental work on measuring auto-oxidation potential of raw
and retorted oil shale for the U.S. EPA [EPA-600/2-84-153, 1984].
This study was conducted to assess the potential spontaneous com-
bustion hazard of solid waste streams produced in the processing
of oil shale. In additon, the utility and precision of various
test methods to assess this hazard were assessed. This_work_is
the most comprehensive work done to measure the autoignition
potential of raw and spent shales and is summarized below:
A.1.1. RTI Study On Auto-oxidation Potential of Raw and
Retorted Oil Shale
Factors which influence the tendency of a storage pile to self-
heat and eventually ignite can be grouped into two main categories.
The first category includes those properties which are peculiar to
the solid itself: reactivity toward oxygen, and heat release as a
function of temperature. The second group of factors are those
relating to the pile and its construction: overall dimensions,
particle size, degree of compaction, homogeneity, ambient tempera-
ture, temperature of placed materials, precipitation, «wind speed,
etc. It is quickly seen that pile characteristics are going to
be more difficult to measure and most likely subject to more
variation than the properties of the solid itself. i
In this study, an investigation of laboratory methods of deter-
mining spontaneous combustion tendencies was conducted. These
methods were then applied to raw and retorted oil shale samples
to determine the relative hazards presented by these materials.
A-5
image:
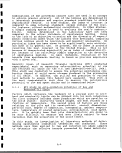 I
In addition, several coal samples were tested by the same methods •
so that the hazards of the oil shale materials could be related to ™
the better known phenomenon of self heating in coal storage piles.
Retorted shale samples from the Lurgi, TOSCO II, Paraho direct- ffl
mode, Hytort and Union B processes were tested. A raw shale from
Federal lease tract C-a in Colorado, two raw shale samples from «
Federal lease tract Ua/Ub in Utah, Wyoming subbituminous coal, •
Western Kentucky #9 bituminous coal and Pocahontas #3 (Virginia)
bituminous coal were also tested. Sulfur and organic carbon
contents and heating values of these materials are given in ja
Table A-l. Heat capacities of these materials, as determined *
by differential scanning calorimetry are given in Table A-2.
RTI tested shale samples for auto-oxidation potential by various §|
methods such as: nonadiabatic oxygen absorption test, adiabatic
oxygen absorption test, differential scanning calorimetry test, «,
isothermal pressure differential scanning calorimetry test, •
peroxide test and thermal graviometric analysis testing. The ™
best method found involved a differential scanning calorimeter
test and a nonadiabatic oxygen absorption test. In the former •
case, endothermic activity was monitored; in the latter, changes m
in gas composition (outlet vs inlet) were monitored.
A.1.1.1 Differential Scanning Calorimetry I
Differential scanning calorimetry (DSC) involves the measurement _.
of the heat evolved or absorbed by a sample at a given temperature •
relative to a known reference material at the same temperature. ™
When the temperature is increased or decreased, heat effects arise
from differences in specific heats, phase changes and chemical flj
reactions. Low temperature oxidation is an exothermic reaction. |{
When spontaneous heating occurs, the heat produced by this
reaction (and other exothermic reactions including the heat of m
wetting) is greater than the heat which is rejected to the •
surroundings and the material which is oxidizing increase in
temperature. As the temperature of the material increases,
the rate of oxidation increases and, in some cases, a rapid H
temperature increase then occurs. . H
DSC data, obtained while the temperature of the sample and tt
reference are increased at a slow constant rate, indicate the j|J
difference in heat flow between sample and reference as a function
of temperature. When the reference is an empty sample pan of equal «
mass and specific heat to the pan in which the sample is held, the •
net heat effect is that produced by the sample. When the tempera- .
ture of the apparatus is restricted to eliminate the possibility
of phase changes in the sample, endothermic effects are associated H
with the heat capacity of the sample, and with some materials, •
such effects as drying, desorption of gases, and devolatilization.
Exothermic effects in excess of the sample heat capacity are asso-
ciated with exothermic chemical reactions.
I
A-6
I
image:
I
In addition, several coal samples were tested by the same methods •
so that the hazards of the oil shale materials could be related to ™
the better known phenomenon of self heating in coal storage piles.
Retorted shale samples from the Lurgi, TOSCO II, Paraho direct- ffl
mode, Hytort and Union B processes were tested. A raw shale from
Federal lease tract C-a in Colorado, two raw shale samples from «
Federal lease tract Ua/Ub in Utah, Wyoming subbituminous coal, •
Western Kentucky #9 bituminous coal and Pocahontas #3 (Virginia)
bituminous coal were also tested. Sulfur and organic carbon
contents and heating values of these materials are given in ja
Table A-l. Heat capacities of these materials, as determined *
by differential scanning calorimetry are given in Table A-2.
RTI tested shale samples for auto-oxidation potential by various §|
methods such as: nonadiabatic oxygen absorption test, adiabatic
oxygen absorption test, differential scanning calorimetry test, «,
isothermal pressure differential scanning calorimetry test, •
peroxide test and thermal graviometric analysis testing. The ™
best method found involved a differential scanning calorimeter
test and a nonadiabatic oxygen absorption test. In the former •
case, endothermic activity was monitored; in the latter, changes m
in gas composition (outlet vs inlet) were monitored.
A.1.1.1 Differential Scanning Calorimetry I
Differential scanning calorimetry (DSC) involves the measurement _.
of the heat evolved or absorbed by a sample at a given temperature •
relative to a known reference material at the same temperature. ™
When the temperature is increased or decreased, heat effects arise
from differences in specific heats, phase changes and chemical flj
reactions. Low temperature oxidation is an exothermic reaction. |{
When spontaneous heating occurs, the heat produced by this
reaction (and other exothermic reactions including the heat of m
wetting) is greater than the heat which is rejected to the •
surroundings and the material which is oxidizing increase in
temperature. As the temperature of the material increases,
the rate of oxidation increases and, in some cases, a rapid H
temperature increase then occurs. . H
DSC data, obtained while the temperature of the sample and tt
reference are increased at a slow constant rate, indicate the j|J
difference in heat flow between sample and reference as a function
of temperature. When the reference is an empty sample pan of equal «
mass and specific heat to the pan in which the sample is held, the •
net heat effect is that produced by the sample. When the tempera- .
ture of the apparatus is restricted to eliminate the possibility
of phase changes in the sample, endothermic effects are associated H
with the heat capacity of the sample, and with some materials, •
such effects as drying, desorption of gases, and devolatilization.
Exothermic effects in excess of the sample heat capacity are asso-
ciated with exothermic chemical reactions.
I
A-6
I
image:
 TABLE A-l. DESCRIPTION OF SAMPLES TESTED BY RTI
Materal (-325 mesh)
Total sulfur
wt. %
dry basis
Organic
carbon %
dry basis
Higher
heating
value
Btu/lb
dry basis
Western Kentucky #9 Bituminous Coal
Pocahontas #3 Bituminous Coal
Wyoming Subbituminous Coal
Utah Raw Shale (66 GPT)
Utah Raw Shale (28 GPT)
C-a Raw Shale
TOSCO II Retorted Shale
Hytort Retorted Shale
Paraho Retorted Shale
Union Shale Mixture
Lurgi Retorted Shale
3.73
0.65
0.63
1.85
0.75
0.98
0.58
2.40
0.57
0.68
0.86
61
69
64
28
11
5.2
3.5
3.8
3.1
4.1
0.13
13,050
12,120
11,560
6,240
2,090
878
433
420
188
209
44
Source: EPA-600/2-84-153, 1984
TABLE A-2.
MEAN HEAT CAPACITY OF COAL AND SHALE MATERIALS
BASED ON INITIAL SAMPLE WEIGHT (J/G, -325 MESH)
Materal
25 - 200
Temperature range, °C
25 - 400
25 - 600
C-a Raw Shale
Utah Raw Shale (66 GPT)
Utah Raw Shale (28 GPT)
Hytort Retorted Shale
Pocahontas #3 Bituminous Coal
Western Kentuck #9 Bituminous Coal
Wyoming Subbituminous Coal
Lurgi Retorted Shale
TOSCO II Retorted Shale
Paraho Retorted Shale
Union Shale Mixture
0.76
2.18
1.17
1.08
1.19
0.69
1.28
0.82
0.39
0.73
2.57
0.72
2.13
1.15
1.03
1.28
0.47
0.67
0.87
0.89
0.71
1.75
0.73
2.56
1.23
1.17
1.40
0.44
0.63
0.92
0.86
0.66
1.60
Source: EPA-600/2-84-153, 1984
A-7
image:
TABLE A-l. DESCRIPTION OF SAMPLES TESTED BY RTI
Materal (-325 mesh)
Total sulfur
wt. %
dry basis
Organic
carbon %
dry basis
Higher
heating
value
Btu/lb
dry basis
Western Kentucky #9 Bituminous Coal
Pocahontas #3 Bituminous Coal
Wyoming Subbituminous Coal
Utah Raw Shale (66 GPT)
Utah Raw Shale (28 GPT)
C-a Raw Shale
TOSCO II Retorted Shale
Hytort Retorted Shale
Paraho Retorted Shale
Union Shale Mixture
Lurgi Retorted Shale
3.73
0.65
0.63
1.85
0.75
0.98
0.58
2.40
0.57
0.68
0.86
61
69
64
28
11
5.2
3.5
3.8
3.1
4.1
0.13
13,050
12,120
11,560
6,240
2,090
878
433
420
188
209
44
Source: EPA-600/2-84-153, 1984
TABLE A-2.
MEAN HEAT CAPACITY OF COAL AND SHALE MATERIALS
BASED ON INITIAL SAMPLE WEIGHT (J/G, -325 MESH)
Materal
25 - 200
Temperature range, °C
25 - 400
25 - 600
C-a Raw Shale
Utah Raw Shale (66 GPT)
Utah Raw Shale (28 GPT)
Hytort Retorted Shale
Pocahontas #3 Bituminous Coal
Western Kentuck #9 Bituminous Coal
Wyoming Subbituminous Coal
Lurgi Retorted Shale
TOSCO II Retorted Shale
Paraho Retorted Shale
Union Shale Mixture
0.76
2.18
1.17
1.08
1.19
0.69
1.28
0.82
0.39
0.73
2.57
0.72
2.13
1.15
1.03
1.28
0.47
0.67
0.87
0.89
0.71
1.75
0.73
2.56
1.23
1.17
1.40
0.44
0.63
0.92
0.86
0.66
1.60
Source: EPA-600/2-84-153, 1984
A-7
image:
 I
Samples were tested in a DuPont Instruments Model 951 differential |f
scanning calorimeter equipped with a standard low pressure cell.
The calorimeter was coupled to a DuPont Instruments Model 1090/ _
1092 thermal analyzer which permitted temperature programming and fl
data acquisition/playback using magnetic disk storage. Samples of •*
between 17 and 54 mg were used. Variations in sample mass for the
different materials tested were primrily due to differences in •
bulk density. Samples were loaded into open aluminum pans; the f|
pans were completely filled to the top edge and excess material
was removed so that the sample surface was level. An empty pan of «
comparable mass (and heat capacity) was used as a reference in all ||
tests.
With air flowing through the cell, a preweighed sample in a tared tt
aluminum pan was placed on the sample thermocouple disk and an 9
empty sample pan was placed on the reference thermocouple disk.. .
The test was conducted by programming the heater to increase the f|
temperature of the Constantan disk to which sample and reference ;
thermocouples were attached. A precisely controlled heating ramp ..
of 2°C per minute was followed from slightly above ambient temper- •
atures (25°-30°C). Different samples were heated to different **
final temperatures (380°-550°C) but in all cases the test was
continued to the end of the exotherm. Exothermic reactions were 0
sensed by a slight lead in temperature of the sample thermocouple •
over the reference thermocouple. The instrument was calibrated
to convert this lead into an actual heat effect. n
The most important measurement relating DSC data to spontaneous
heating behavior is the onset temperature of the exothermic
oxidation reaction. When an exotherm is observed while a sample fl
is being heated, this temperature is characterized by extrapola- •
ting the slope of the leading edge of the exothermic peak to the
baseline. It is assumed that the lower this temperature is, the M
greater the tendency of the material to spontaneously heat. This H
provided a means for empirically ranking materials of unknown
self-heating potential by comparison to materials of known heating am
potential. The results of this test are summarized in Tables A-3 •
and A-4. The Wyoming subbituminous and Western Kentucky bitu- m
minous coals exhibited the earliest exothermic onset temperatures
followed by the 66 gallon/ton raw Utah shale. The low volatility •
bituminous Pocahontas #3 coal was less reactive than any of the •
raw western shales which were tested. The carbonaceous retorted
shale samples exhibited considerably higher exothermic onset m
temperatures than the raw shale indicating that they present less |
of a spontaneous heating hazard than the raw shale and much less
than the coal. Decarbonized shale from the Lurgi process was also «
tested but absolutely no exothermic reaction was observed at •
temperatures up to 550°C. The Hytort retorted shale was extremely «
unreactive, exhibiting an exothermic onset temperature higher than
that of any of the retorted shale samples except for the Lurgi •
T<a4-nT-t-e»H cVial (* . - B
retorted shale.
A-8
i
i
image:
I
Samples were tested in a DuPont Instruments Model 951 differential |f
scanning calorimeter equipped with a standard low pressure cell.
The calorimeter was coupled to a DuPont Instruments Model 1090/ _
1092 thermal analyzer which permitted temperature programming and fl
data acquisition/playback using magnetic disk storage. Samples of •*
between 17 and 54 mg were used. Variations in sample mass for the
different materials tested were primrily due to differences in •
bulk density. Samples were loaded into open aluminum pans; the f|
pans were completely filled to the top edge and excess material
was removed so that the sample surface was level. An empty pan of «
comparable mass (and heat capacity) was used as a reference in all ||
tests.
With air flowing through the cell, a preweighed sample in a tared tt
aluminum pan was placed on the sample thermocouple disk and an 9
empty sample pan was placed on the reference thermocouple disk.. .
The test was conducted by programming the heater to increase the f|
temperature of the Constantan disk to which sample and reference ;
thermocouples were attached. A precisely controlled heating ramp ..
of 2°C per minute was followed from slightly above ambient temper- •
atures (25°-30°C). Different samples were heated to different **
final temperatures (380°-550°C) but in all cases the test was
continued to the end of the exotherm. Exothermic reactions were 0
sensed by a slight lead in temperature of the sample thermocouple •
over the reference thermocouple. The instrument was calibrated
to convert this lead into an actual heat effect. n
The most important measurement relating DSC data to spontaneous
heating behavior is the onset temperature of the exothermic
oxidation reaction. When an exotherm is observed while a sample fl
is being heated, this temperature is characterized by extrapola- •
ting the slope of the leading edge of the exothermic peak to the
baseline. It is assumed that the lower this temperature is, the M
greater the tendency of the material to spontaneously heat. This H
provided a means for empirically ranking materials of unknown
self-heating potential by comparison to materials of known heating am
potential. The results of this test are summarized in Tables A-3 •
and A-4. The Wyoming subbituminous and Western Kentucky bitu- m
minous coals exhibited the earliest exothermic onset temperatures
followed by the 66 gallon/ton raw Utah shale. The low volatility •
bituminous Pocahontas #3 coal was less reactive than any of the •
raw western shales which were tested. The carbonaceous retorted
shale samples exhibited considerably higher exothermic onset m
temperatures than the raw shale indicating that they present less |
of a spontaneous heating hazard than the raw shale and much less
than the coal. Decarbonized shale from the Lurgi process was also «
tested but absolutely no exothermic reaction was observed at •
temperatures up to 550°C. The Hytort retorted shale was extremely «
unreactive, exhibiting an exothermic onset temperature higher than
that of any of the retorted shale samples except for the Lurgi •
T<a4-nT-t-e»H cVial (* . - B
retorted shale.
A-8
i
i
image:
 TABLE A-3.
EXOTHERMIC ONSET TEMPERATURE OBSERVED IN1OXIDATION
OF COAL, OIL SHALE AND RETORTED OIL SHALE
(2°c/minute heating ramp, -325 mesh)
Materal
Atmosphere
Temperature
°C
Wyoming Subbituminous Coal
Wyoming Subbituminous Coal
Western Kentucky #9 Bituminous Coal
Western Kentucky #9 Bituminous Coal
Utah Raw Shale (66 GPT)
C-a Raw Shale
C-a Raw Shale
Utah Raw Shale (28 GPT)
Pocahontas #3 Bituminous Coal
TOSCO Retorted Shale
Paraho Retorted Shale
Paraho Retorted Shale
Paraho Retorted Shale
(-48 + 100 mesh)
Paraho Retorted Shale
(-48 + 100 mesh)
TOSCO II Retorted Shale
Union Shale Mixture
Hytort Retorted Shale
Lurgi Retorted Shale
Lurgi Retorted Shale
Humid air
Dry air
Humid air
Dry air
Dry air
Humid air
Dry air
Dry air
Dry air
Humid air
Dry air
Humid air
Humid air
Dry air
Dry air
Dry air
Dry air
Dry air
Humid air
190
190
190
193
211
225
226
227
230
296
300
300
300
302
306
331
357
No exoterm observed up to 550°C.
Source: EPA-600/2-84-153, 1984
A-9
image:
TABLE A-3.
EXOTHERMIC ONSET TEMPERATURE OBSERVED IN1OXIDATION
OF COAL, OIL SHALE AND RETORTED OIL SHALE
(2°c/minute heating ramp, -325 mesh)
Materal
Atmosphere
Temperature
°C
Wyoming Subbituminous Coal
Wyoming Subbituminous Coal
Western Kentucky #9 Bituminous Coal
Western Kentucky #9 Bituminous Coal
Utah Raw Shale (66 GPT)
C-a Raw Shale
C-a Raw Shale
Utah Raw Shale (28 GPT)
Pocahontas #3 Bituminous Coal
TOSCO Retorted Shale
Paraho Retorted Shale
Paraho Retorted Shale
Paraho Retorted Shale
(-48 + 100 mesh)
Paraho Retorted Shale
(-48 + 100 mesh)
TOSCO II Retorted Shale
Union Shale Mixture
Hytort Retorted Shale
Lurgi Retorted Shale
Lurgi Retorted Shale
Humid air
Dry air
Humid air
Dry air
Dry air
Humid air
Dry air
Dry air
Dry air
Humid air
Dry air
Humid air
Humid air
Dry air
Dry air
Dry air
Dry air
Dry air
Humid air
190
190
190
193
211
225
226
227
230
296
300
300
300
302
306
331
357
No exoterm observed up to 550°C.
Source: EPA-600/2-84-153, 1984
A-9
image:
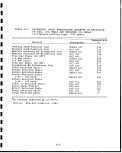 TABLE A-4.
MAGNITUDE OF EXOTHERMIC REACTION OF COAL, OIL SHALE AND
RETORTED OIL SHALE (2°C/minute heating ramp, -325 irresh)
Materal
Bituminous Coal (Pocahontas #3)
Bituminous Coal (W. Kentucky #9)
Bituminous Coal (W. Kentucky #9)
Sub-Bituminous Coal (Wyoming)
Sub-Bituminous Coal (Wyoming)
Utah (66 GPT) Raw Shale
Utah (28 GPT) Raw Shale
Hytort Retorted Shale
Raw Shale (C-a)
Raw Shale (C-a)
TOSCO II Retorted Shale
Union Shale Mixture
TOSCO II Retorted Shale
Paraho Retorted Shale
Paraho Retorted Shale
Paraho Retorted Shale
(-48 +100 mesh)
Paraho Retorted Shale
(-48 +100 mesh)
Lurgi Retorted Shale
Lurgi Retorted Shale
Atmosphere
Dry air
Dry air
Humid air
Humid air
Dry air
Dry air
Dry air
Dry air
Humid air
Dry air
Humid air
Dry air
Dry air
Humid air
Dry air
Humid air
Dry air
Dry air
Humid air
Exo therm
J/g
15,700
13,800
13,800
11,200
10,900
8,320
2,990
1,340
1,050
920
880
860
560
490
480
470
430
0
0
Temperature
range, °C
150-575
90-550
120-550
50-440
50-550
125-420
125-575
175-575
125-550
160-480
125-550
200-575
160-410
175-410
150-550
175-550
175-550
30-550
30-550
Source: EPA-600/2-84-153, 1984
1
1
1
I
I
I
1
1
A-10
1
I
I
1
I
1
I
1
I
image:
TABLE A-4.
MAGNITUDE OF EXOTHERMIC REACTION OF COAL, OIL SHALE AND
RETORTED OIL SHALE (2°C/minute heating ramp, -325 irresh)
Materal
Bituminous Coal (Pocahontas #3)
Bituminous Coal (W. Kentucky #9)
Bituminous Coal (W. Kentucky #9)
Sub-Bituminous Coal (Wyoming)
Sub-Bituminous Coal (Wyoming)
Utah (66 GPT) Raw Shale
Utah (28 GPT) Raw Shale
Hytort Retorted Shale
Raw Shale (C-a)
Raw Shale (C-a)
TOSCO II Retorted Shale
Union Shale Mixture
TOSCO II Retorted Shale
Paraho Retorted Shale
Paraho Retorted Shale
Paraho Retorted Shale
(-48 +100 mesh)
Paraho Retorted Shale
(-48 +100 mesh)
Lurgi Retorted Shale
Lurgi Retorted Shale
Atmosphere
Dry air
Dry air
Humid air
Humid air
Dry air
Dry air
Dry air
Dry air
Humid air
Dry air
Humid air
Dry air
Dry air
Humid air
Dry air
Humid air
Dry air
Dry air
Humid air
Exo therm
J/g
15,700
13,800
13,800
11,200
10,900
8,320
2,990
1,340
1,050
920
880
860
560
490
480
470
430
0
0
Temperature
range, °C
150-575
90-550
120-550
50-440
50-550
125-420
125-575
175-575
125-550
160-480
125-550
200-575
160-410
175-410
150-550
175-550
175-550
30-550
30-550
Source: EPA-600/2-84-153, 1984
1
1
1
I
I
I
1
1
A-10
1
I
I
1
I
1
I
1
I
image:
 A . 1 . 1 . 2 Nonadiabatic Oxygen Absorption Test !
The materials described above were also subjected to a nonadiabatic
oxygen absorption test [Schmeling et al., 1978]. In this test
100 g samples of material were placed in a glass cell, i Humidified
air at 60 cc/min was passed through the cell and the temperature
of the cell and contents were increased at a rate of 25°C/hour.
The exhaust gas from the cell was analyzed chromatographically;
the depletion of oxygen and increased levels of carbon dioxide
were used as an indicator of reactivity. ;
Based on the gas analysis, a spontaneous combustion liability
index (the S index) was calculated. The formula for this index
was devised by Schmeling and is based on the conversion of
oxygen in the inlet gas to CO2 .
where S = the spontaneous combustion index. i
hi =21 - oxygen concentration at 125 °C. ,
h2 =21 - oxygen concentration at 150 °C.
hs = 21 - oxygen concentration at 175 °C. \
x± = carbon dioxide concentration at 150 °C - carbon dioxide
concentration at 125 °C. .
x2 = carbon dioxide concentration at 175°C - carbon dioxide
concentration at 150°C. i
All concentrations are expressed in volume percent. \
The results of this test are summarized in Table A-5. The test
indicated that the Wyoming subbituminous coal was by far the most
reactive material with an S index of 108 in the -48+100 particle
size test and an S index of 165 when tested in the -3,25 particle
size. This is consistent with the generally observed phenomena of
spontaneous heating in low rank coals. The criterion,! adopted by
Schmeling; that materials with S indices greater than |30 (for the
-48+100 mesh size) are dangerous, also puts the Western Kentucky
No. 9 bituminous coal (S = 37.5) in this category. As would be
expected from historical observations of spontaneous combustion,
the bituminous coals are much less dangerous than the: subbitumi-
nous coal . i
The tests indicated, as expected, that the retorted j shales are
less likely to spontaneously combust than any of the coals or raw
shales. The three coals rank in the order expected from past
experience and larger scale testing. The raw shales exhibit
oxygen absorption behavior which ranks with their energy content.
(The richer Utah shale has a higher S index than the leaner Utah
shale and the three western shales follow the same brder in S
index as in higher heating value ) .
A-ll
image:
A . 1 . 1 . 2 Nonadiabatic Oxygen Absorption Test !
The materials described above were also subjected to a nonadiabatic
oxygen absorption test [Schmeling et al., 1978]. In this test
100 g samples of material were placed in a glass cell, i Humidified
air at 60 cc/min was passed through the cell and the temperature
of the cell and contents were increased at a rate of 25°C/hour.
The exhaust gas from the cell was analyzed chromatographically;
the depletion of oxygen and increased levels of carbon dioxide
were used as an indicator of reactivity. ;
Based on the gas analysis, a spontaneous combustion liability
index (the S index) was calculated. The formula for this index
was devised by Schmeling and is based on the conversion of
oxygen in the inlet gas to CO2 .
where S = the spontaneous combustion index. i
hi =21 - oxygen concentration at 125 °C. ,
h2 =21 - oxygen concentration at 150 °C.
hs = 21 - oxygen concentration at 175 °C. \
x± = carbon dioxide concentration at 150 °C - carbon dioxide
concentration at 125 °C. .
x2 = carbon dioxide concentration at 175°C - carbon dioxide
concentration at 150°C. i
All concentrations are expressed in volume percent. \
The results of this test are summarized in Table A-5. The test
indicated that the Wyoming subbituminous coal was by far the most
reactive material with an S index of 108 in the -48+100 particle
size test and an S index of 165 when tested in the -3,25 particle
size. This is consistent with the generally observed phenomena of
spontaneous heating in low rank coals. The criterion,! adopted by
Schmeling; that materials with S indices greater than |30 (for the
-48+100 mesh size) are dangerous, also puts the Western Kentucky
No. 9 bituminous coal (S = 37.5) in this category. As would be
expected from historical observations of spontaneous combustion,
the bituminous coals are much less dangerous than the: subbitumi-
nous coal . i
The tests indicated, as expected, that the retorted j shales are
less likely to spontaneously combust than any of the coals or raw
shales. The three coals rank in the order expected from past
experience and larger scale testing. The raw shales exhibit
oxygen absorption behavior which ranks with their energy content.
(The richer Utah shale has a higher S index than the leaner Utah
shale and the three western shales follow the same brder in S
index as in higher heating value ) .
A-ll
image:
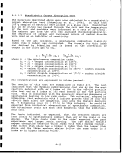 I
TABLE A-5.
SPONTANEOUS COMBUSTION INDEX AND CALCULATION PARAMETERS
OF MATERIALS SUBJECTED TO NONADIABATIC TEST (TESTED DRY)
Material
(-325 mesh unless stated)
Wyoming Subbituminous Coal
Wyoming Subbituminous Coal
(-48 + 100 mesh)
Raw Utah Shale (66 GPT)
W. Kentucky #9 Bituminous Coal
Raw Utah Shale (28 GPT)
Pocahontas #3 Bituminous Coal
W. Kentucky #9 Bituminous Coal
(-48 + 100 mesh)
Raw Shale, C-a
(-48 + 100 mesh)
Raw Shale, C-a
Union Shale Mixture
Hytort Retorted Shale
TOSCO II Retorted Shale
(-48 + 100 mesh)
TOSCO II Retorted Shale
Paraho Retorted Shale
Paraho Retorted Shale
(-48 + 100 mesh)
Lurgi Retorted Shale
Lurgi Retorted Shale
(-200 + 325 mesh)
S
165
108
86
60
44
42
37.5
6.89
5.59
4.6
3.8
3.60
1.38
0.27
0.21
0.00
0.00
hi
9.44
3.55
7.41
2.97
1.55
3.43
4.85
0.45
1.12
0.41
0.90
1.10
0.57
0.10
0.68
0.38
0.32
h2
17.42
17.60
19.7
12.59
8.49
11.2
12.34
2.60
2.50
3.00
3.14
1.44
1.28
0.47
0.84
-0.04
0.14
hs
20.97
20.88
20.8
20.87
18.2
21.0
20.35
6.55
6.09
6.37
5.26
2.79
2.02
0.78
1.04
0.00
0.15
Xi
4.48
2.80
3.56
1.16
1.10
1.03
1.13
0.23
0.17
0.61
0.43
0.22
0.08
0.01
0.02
0.00
0.00
X2
5.48
4.10
1.86
3.05
2.88
2.13
1.70
1.43
1.23
0.76
0.68
1.57
0.79
0.42
0.21
0.00
0.01
Source: EPA-600/2-84-153, 1984
KEY
S = the spontaneous combustion index.
hj = 21 - oxygen concentration at 125°C.
h2 = 21 - oxygen concentration at 150°C.
ha = 21 - oxygen concentration at 175°C.
KI = carbon dioxide concentration 150°C -
carbon dioxide concentration at 125°C.
X2 = carbon dioxide concentration at 175°C -
carbon dioxide concentration at 150°C.
A-12
1
I
1
I
1
I
t
1
I
1
I
I
I
1
1
1
I
image:
I
TABLE A-5.
SPONTANEOUS COMBUSTION INDEX AND CALCULATION PARAMETERS
OF MATERIALS SUBJECTED TO NONADIABATIC TEST (TESTED DRY)
Material
(-325 mesh unless stated)
Wyoming Subbituminous Coal
Wyoming Subbituminous Coal
(-48 + 100 mesh)
Raw Utah Shale (66 GPT)
W. Kentucky #9 Bituminous Coal
Raw Utah Shale (28 GPT)
Pocahontas #3 Bituminous Coal
W. Kentucky #9 Bituminous Coal
(-48 + 100 mesh)
Raw Shale, C-a
(-48 + 100 mesh)
Raw Shale, C-a
Union Shale Mixture
Hytort Retorted Shale
TOSCO II Retorted Shale
(-48 + 100 mesh)
TOSCO II Retorted Shale
Paraho Retorted Shale
Paraho Retorted Shale
(-48 + 100 mesh)
Lurgi Retorted Shale
Lurgi Retorted Shale
(-200 + 325 mesh)
S
165
108
86
60
44
42
37.5
6.89
5.59
4.6
3.8
3.60
1.38
0.27
0.21
0.00
0.00
hi
9.44
3.55
7.41
2.97
1.55
3.43
4.85
0.45
1.12
0.41
0.90
1.10
0.57
0.10
0.68
0.38
0.32
h2
17.42
17.60
19.7
12.59
8.49
11.2
12.34
2.60
2.50
3.00
3.14
1.44
1.28
0.47
0.84
-0.04
0.14
hs
20.97
20.88
20.8
20.87
18.2
21.0
20.35
6.55
6.09
6.37
5.26
2.79
2.02
0.78
1.04
0.00
0.15
Xi
4.48
2.80
3.56
1.16
1.10
1.03
1.13
0.23
0.17
0.61
0.43
0.22
0.08
0.01
0.02
0.00
0.00
X2
5.48
4.10
1.86
3.05
2.88
2.13
1.70
1.43
1.23
0.76
0.68
1.57
0.79
0.42
0.21
0.00
0.01
Source: EPA-600/2-84-153, 1984
KEY
S = the spontaneous combustion index.
hj = 21 - oxygen concentration at 125°C.
h2 = 21 - oxygen concentration at 150°C.
ha = 21 - oxygen concentration at 175°C.
KI = carbon dioxide concentration 150°C -
carbon dioxide concentration at 125°C.
X2 = carbon dioxide concentration at 175°C -
carbon dioxide concentration at 150°C.
A-12
1
I
1
I
1
I
t
1
I
1
I
I
I
1
1
1
I
image:
 ™ - raw ^ales rank as high as the subbituminous
fH* V1!?1161-,*6* ?PT) Utah shale ranks intermediate between it
and the high volatility Western Kentucky #9 bituminous coal and
SSi- Sr J2? GILT) Utah Shale ranks intermediate Between the
Western Kentucky #9 coal and the low volatility Pdcahontas #3
Bituminous coal. On the basis of this test, the rSw sales present
a hazard of spontaneous combustion on the order of bituminous
coals, and the greater the energy content of the shale > the great-
t * v, i tendency for spontaneous combustion. All of the retor-
ted shales tested rank well below the bituminous coals: in spontan-
eous combustion risk based on Schmeling's index.
A. 1.1. 3 Conclusions From RTI Stud
be, noted that the results reported are based on a very
number of samples of raw and retorted shale. : Substantial
variations in composition of raw shales occur with geographic and
nnSaSaP51C locatlon' ^he retorted shale samples!9 came from
pilot plant operations which may not be completely representitive
of commercial operation. Hence it. is strongly recommended that
a£ ^L//1^16/ °f .waste materials proposed for field disposal
be tested to determine their actual spontaneous combustion hazard.
Retorted shales investigated in the study are unlikely to present
a spontaneous combustion hazard if properly handled. These
include retorted shales from the Paraho direct, TOSCO 'II Hytort
an?njf^,g* Pf°CeS|es |nd a mixture of retorted shale, raw shale
nSSJn'-H £ sulfur from the Union B process. These materials
£??V®r to be ?ar Jre?:s .reactive than Pocahontas #3 loW-volatility
bituminous coal which is generally regarded at the low1 end of the
spectrum of coals susceptible to spontaneous heating.! This con-
was bas^d on . the basis of both the exothermic onset
ure' ,, ^ determined by differential scanning calorimetry,
nonadiabatic oxygen absorption test, and supported by TGA
androniHOS%d£ta* Tte Lurgi retorted shale is nSS-bombustible
and could not burn even if an attempt was made to ignite it.
The _raw western shales, while not as liable to ignite as the
Wyoming Smith-Roland subbituminous coal (which i s : generally
placed at the higher end of the spectrum of coals susceptible "to
spontaneous heating) present a potential hazard. Thd richer of
SL^n h4 halJr samPles (f.6 GP.T) is particularly reactive, falling
between the Wyoming subbituminous and the Western Kentucky hiah
volatility bituminous coal (of intermedial reactivity with regard
to coal) in the nonadiabatic oxygen absorption test, jln the DSC
rest, it falls below the Western Kentucky coal but above the
S a L^S iy unreactive Pocahontas #3 coal. In the TGA weight loss
test (based on mass remaining after heating to 300°C) a greater
weight loss is observed with this sample than with the Western
Kentucky bituminous coal. !
A-13
image:
™ - raw ^ales rank as high as the subbituminous
fH* V1!?1161-,*6* ?PT) Utah shale ranks intermediate between it
and the high volatility Western Kentucky #9 bituminous coal and
SSi- Sr J2? GILT) Utah Shale ranks intermediate Between the
Western Kentucky #9 coal and the low volatility Pdcahontas #3
Bituminous coal. On the basis of this test, the rSw sales present
a hazard of spontaneous combustion on the order of bituminous
coals, and the greater the energy content of the shale > the great-
t * v, i tendency for spontaneous combustion. All of the retor-
ted shales tested rank well below the bituminous coals: in spontan-
eous combustion risk based on Schmeling's index.
A. 1.1. 3 Conclusions From RTI Stud
be, noted that the results reported are based on a very
number of samples of raw and retorted shale. : Substantial
variations in composition of raw shales occur with geographic and
nnSaSaP51C locatlon' ^he retorted shale samples!9 came from
pilot plant operations which may not be completely representitive
of commercial operation. Hence it. is strongly recommended that
a£ ^L//1^16/ °f .waste materials proposed for field disposal
be tested to determine their actual spontaneous combustion hazard.
Retorted shales investigated in the study are unlikely to present
a spontaneous combustion hazard if properly handled. These
include retorted shales from the Paraho direct, TOSCO 'II Hytort
an?njf^,g* Pf°CeS|es |nd a mixture of retorted shale, raw shale
nSSJn'-H £ sulfur from the Union B process. These materials
£??V®r to be ?ar Jre?:s .reactive than Pocahontas #3 loW-volatility
bituminous coal which is generally regarded at the low1 end of the
spectrum of coals susceptible to spontaneous heating.! This con-
was bas^d on . the basis of both the exothermic onset
ure' ,, ^ determined by differential scanning calorimetry,
nonadiabatic oxygen absorption test, and supported by TGA
androniHOS%d£ta* Tte Lurgi retorted shale is nSS-bombustible
and could not burn even if an attempt was made to ignite it.
The _raw western shales, while not as liable to ignite as the
Wyoming Smith-Roland subbituminous coal (which i s : generally
placed at the higher end of the spectrum of coals susceptible "to
spontaneous heating) present a potential hazard. Thd richer of
SL^n h4 halJr samPles (f.6 GP.T) is particularly reactive, falling
between the Wyoming subbituminous and the Western Kentucky hiah
volatility bituminous coal (of intermedial reactivity with regard
to coal) in the nonadiabatic oxygen absorption test, jln the DSC
rest, it falls below the Western Kentucky coal but above the
S a L^S iy unreactive Pocahontas #3 coal. In the TGA weight loss
test (based on mass remaining after heating to 300°C) a greater
weight loss is observed with this sample than with the Western
Kentucky bituminous coal. !
A-13
image:
 I
I
The leaner Utah shale (28 GPT) is intermediate in tendency to auto- w
ignite between the Western Kentucky coal and the Pocahontas #3
coal in both the nonadiabatic oxygen absorption test and the DSC •
test (ranked by exothermic onset temperature). This material ffi
falls below the coal samples in the TGA weight loss tests. By
Schmeling's criteria (S index > 30), this is also a potential «
hazard. The C-a shale has about the same exothermic onset W
temperature as the leaner Utah shale (i.e., intermediate between w
the Western Kentucky and Pocahontas bituminous coals, but ranks
considerably lower than the Pocahontas coal in the nonadiabatic if
oxygen absorption test with an S index of about 6). This is 9
probably the least reactive of the three western raw shales tested
but should still be regarded as posing potential problems. m
The results of the study suggest that carbonaceous retorted oil
shale poses less hazard of spontaneous combustion than bituminous _
coal and it is logical that the more severe the retorting process fl
and the more complete the removal of the organic matter, the less "
reactive the resulting waste product will be. This does not imply
that the risk of spontaneous combustion can be ignored but rather |f
that the risk should be low if proper disposal practices are 0
followed. Good practice would likely include cooling before
disposal, compaction in lifts, and excluding air flow into the •»
pile. , H
Decarbonized shales, such as the Lurgi decarbonized retroted shale,
are essentially inert since substantially all of the energy content H
has been removed. Such shales should present no hazard of spon- •»
taneous combustion.
On the basis of DSC testing, codisposal of byproduct elemental H
sulfur with retorted oil shale will not increase the hazard of
spontaneous combustion of the mixture. The mixing of raw shale «
fines with retorted oil shale for disposal should be approached j|
very cautiously and preferably be avoided. The addition of as
little as 5 percent raw shale fines, appears to lower the
exothermic onset temperature of the mixture to approximately If
that of the fines themselves. Although the energy available in 9
the mixture is much less than that of the raw shale fines, the
potential for spontaneous combustion may be significantly •
increased as compared to the retorted shale alone and may in fact |
be as great as that of the raw shale fines alone. For example the
addition of as little as 5 percent raw shale fines (Utah 28 GPT) —
lowered the exothermic onset temperature of Paraho retorted shale •
to that of the raw shale fines alone. However it must be •
emphasized that the data on this point are somewhat conflicting.
The Union B shale mixture which contained 5.47 weight percent raw V
shale fines behaved in a manner similar to other carbonaceous H
retorted oil shales which did not include a mixture of raw shale
fines. Hence it is recommened that anyone proposing disposal of »
retorted and raw shale mixtures should evaluate their particular j|
mixture to define its properties. It is considered likely that
A-14
1
I
image:
I
I
The leaner Utah shale (28 GPT) is intermediate in tendency to auto- w
ignite between the Western Kentucky coal and the Pocahontas #3
coal in both the nonadiabatic oxygen absorption test and the DSC •
test (ranked by exothermic onset temperature). This material ffi
falls below the coal samples in the TGA weight loss tests. By
Schmeling's criteria (S index > 30), this is also a potential «
hazard. The C-a shale has about the same exothermic onset W
temperature as the leaner Utah shale (i.e., intermediate between w
the Western Kentucky and Pocahontas bituminous coals, but ranks
considerably lower than the Pocahontas coal in the nonadiabatic if
oxygen absorption test with an S index of about 6). This is 9
probably the least reactive of the three western raw shales tested
but should still be regarded as posing potential problems. m
The results of the study suggest that carbonaceous retorted oil
shale poses less hazard of spontaneous combustion than bituminous _
coal and it is logical that the more severe the retorting process fl
and the more complete the removal of the organic matter, the less "
reactive the resulting waste product will be. This does not imply
that the risk of spontaneous combustion can be ignored but rather |f
that the risk should be low if proper disposal practices are 0
followed. Good practice would likely include cooling before
disposal, compaction in lifts, and excluding air flow into the •»
pile. , H
Decarbonized shales, such as the Lurgi decarbonized retroted shale,
are essentially inert since substantially all of the energy content H
has been removed. Such shales should present no hazard of spon- •»
taneous combustion.
On the basis of DSC testing, codisposal of byproduct elemental H
sulfur with retorted oil shale will not increase the hazard of
spontaneous combustion of the mixture. The mixing of raw shale «
fines with retorted oil shale for disposal should be approached j|
very cautiously and preferably be avoided. The addition of as
little as 5 percent raw shale fines, appears to lower the
exothermic onset temperature of the mixture to approximately If
that of the fines themselves. Although the energy available in 9
the mixture is much less than that of the raw shale fines, the
potential for spontaneous combustion may be significantly •
increased as compared to the retorted shale alone and may in fact |
be as great as that of the raw shale fines alone. For example the
addition of as little as 5 percent raw shale fines (Utah 28 GPT) —
lowered the exothermic onset temperature of Paraho retorted shale •
to that of the raw shale fines alone. However it must be •
emphasized that the data on this point are somewhat conflicting.
The Union B shale mixture which contained 5.47 weight percent raw V
shale fines behaved in a manner similar to other carbonaceous H
retorted oil shales which did not include a mixture of raw shale
fines. Hence it is recommened that anyone proposing disposal of »
retorted and raw shale mixtures should evaluate their particular j|
mixture to define its properties. It is considered likely that
A-14
1
I
image:
 for each specific retorted raw shale mixture there is a unique
value of raw to retorted shale ratio which if exceeded will cause
the mixture to assume the properties of the raw shale.
The raw western shales present a potential hazard, but if stored
and disposed of under conditions suitable for long term storage of
reactive coals, then they sjiould pose no greater risk than such
coals. Ideally, however, raw shales should be processed for ener-
gy recovery to the greatest extent possible. Material produced
during crushing operations that is too small for retorting would
be preferably subject to combustion for productionj of process
heat, or if feasible, agglomerated with a binder to aj size where
it could be retorted for maximum energy recovery. i
Of the test methods used in the RTI study, the differential scan-
ning calorimetry test and the nonadiabatic oxygen absorption test
appear to be the most meaningful. These tests were reproducible
and, when the tests were applied to coal samples, the results
conformed to generally observed rankings of spontaneous combustion
potential. Of the other tests considered, the peroxide test was
technically unsound; pressure differential scanning icalorimetry
and adiabatic oxygen absorption tests did not produce useful,
reproducible results in the course of this particular study.
These methods may, however, after further development be made
useful. The thermogravimetric analysis weight loss |test, while
potentially useful in characterizing samples was found unsuitable
as results for coal samples -did not conform to generally accepted
spontaneous combustion rankings and the retorted shale samples
produced an insufficient reponse to evaluate. ,
i
A summary of results obtained in the differential scanning
calorimetry and nonadiabatic oxygen absorption testing is given
in Table A-6. As no reference standards are available for the
test parameters which were determined, the accuracy of ithese tests
cannot be determined. However, the ranking of the materials can
be used as an indicator of relative spontaneous combustion hazard.
In summary, the carbonaceous retorted oil shale samples appear to
present less hazard of spontaneous combustion than bituminous
coal. None of the raw shales were found to present ' as great a
hazard as Wyoming subbituminous coal. However, the tyo raw Utah
shale samples tested were found to present hazards exceeding those
of - less reactive bituminous coals. These materials represent a
potential hazard, but if stored and disposed of under conditions
suitable for long-term storage of reactive coals, !should not
spontaneously combust. The co-disposal of raw and retorted shale
should be approached cautiously and preferably be ; avoided if
possible as the presence of raw shale increases the energy contents
of the mixture and in some cases decreased the temperature at which
exothermic activity was observed. Co-disposal of byproduct sulfur
with retorted shale appears to cause no increase in risk of spon-
taneous combustion (but may lead to leaching problems).;
A-15
image:
for each specific retorted raw shale mixture there is a unique
value of raw to retorted shale ratio which if exceeded will cause
the mixture to assume the properties of the raw shale.
The raw western shales present a potential hazard, but if stored
and disposed of under conditions suitable for long term storage of
reactive coals, then they sjiould pose no greater risk than such
coals. Ideally, however, raw shales should be processed for ener-
gy recovery to the greatest extent possible. Material produced
during crushing operations that is too small for retorting would
be preferably subject to combustion for productionj of process
heat, or if feasible, agglomerated with a binder to aj size where
it could be retorted for maximum energy recovery. i
Of the test methods used in the RTI study, the differential scan-
ning calorimetry test and the nonadiabatic oxygen absorption test
appear to be the most meaningful. These tests were reproducible
and, when the tests were applied to coal samples, the results
conformed to generally observed rankings of spontaneous combustion
potential. Of the other tests considered, the peroxide test was
technically unsound; pressure differential scanning icalorimetry
and adiabatic oxygen absorption tests did not produce useful,
reproducible results in the course of this particular study.
These methods may, however, after further development be made
useful. The thermogravimetric analysis weight loss |test, while
potentially useful in characterizing samples was found unsuitable
as results for coal samples -did not conform to generally accepted
spontaneous combustion rankings and the retorted shale samples
produced an insufficient reponse to evaluate. ,
i
A summary of results obtained in the differential scanning
calorimetry and nonadiabatic oxygen absorption testing is given
in Table A-6. As no reference standards are available for the
test parameters which were determined, the accuracy of ithese tests
cannot be determined. However, the ranking of the materials can
be used as an indicator of relative spontaneous combustion hazard.
In summary, the carbonaceous retorted oil shale samples appear to
present less hazard of spontaneous combustion than bituminous
coal. None of the raw shales were found to present ' as great a
hazard as Wyoming subbituminous coal. However, the tyo raw Utah
shale samples tested were found to present hazards exceeding those
of - less reactive bituminous coals. These materials represent a
potential hazard, but if stored and disposed of under conditions
suitable for long-term storage of reactive coals, !should not
spontaneously combust. The co-disposal of raw and retorted shale
should be approached cautiously and preferably be ; avoided if
possible as the presence of raw shale increases the energy contents
of the mixture and in some cases decreased the temperature at which
exothermic activity was observed. Co-disposal of byproduct sulfur
with retorted shale appears to cause no increase in risk of spon-
taneous combustion (but may lead to leaching problems).;
A-15
image:
 TABLE A-6. SUMMARY OF RESULTS FROM DIFFERENTIAL
SCANNING CALORIMETRY AND NONADIABATIC
OXYGEN ABSORPTION TESTING
Materal
Wyoming Subbituminous Coal
Western Kentucky #9 Bituminous Coal
Utah Raw Shale (66 GPT)
C-a Raw Shale
Utah Raw Shale (28 GPT)
Pocahontas #3 Bituminous Coal
Paraho Retorted Shale
TOSCO II Retorted Shale
Union Shale Mixture
Hytort Retorted Shale
Lurgi Retorted Shale
Onset,
°C
190
193
211
226
227
230
300
306
321
357
DSCa
Exo therm,
J/g
10,900
13,800
8,320
920
2,990
15,700
480
560
860
1,340
'V-O
Nonadiabatic test
S index
165
60
86
5.6
44
42
0.27
1.4
4.6
3.8
0.00
I
I
I
I
I
I
I
1
I
I
Tested in dry air, particle size: -325 mesh.
b H
No extherm observed to 550°C. •
Source: EPA-600/2-84-153, 1984
A-16
1
I
1
I
I
I
I
I
image:
TABLE A-6. SUMMARY OF RESULTS FROM DIFFERENTIAL
SCANNING CALORIMETRY AND NONADIABATIC
OXYGEN ABSORPTION TESTING
Materal
Wyoming Subbituminous Coal
Western Kentucky #9 Bituminous Coal
Utah Raw Shale (66 GPT)
C-a Raw Shale
Utah Raw Shale (28 GPT)
Pocahontas #3 Bituminous Coal
Paraho Retorted Shale
TOSCO II Retorted Shale
Union Shale Mixture
Hytort Retorted Shale
Lurgi Retorted Shale
Onset,
°C
190
193
211
226
227
230
300
306
321
357
DSCa
Exo therm,
J/g
10,900
13,800
8,320
920
2,990
15,700
480
560
860
1,340
'V-O
Nonadiabatic test
S index
165
60
86
5.6
44
42
0.27
1.4
4.6
3.8
0.00
I
I
I
I
I
I
I
1
I
I
Tested in dry air, particle size: -325 mesh.
b H
No extherm observed to 550°C. •
Source: EPA-600/2-84-153, 1984
A-16
1
I
1
I
I
I
I
I
image:
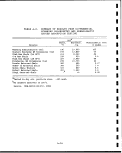 A,2 Raw and Spent Shale Storage Design To Avoid Auto-Ignition
As described earlier, the carbonaceous retorted oil shale samples
appear to present less hazard of spontaneous combustion than
bituminous coal. None of the raw shales were found to present as
great a hazard as Wyoming subbituminous coal. These materials
represent a potential hazard, but if stored, and disposed of under
conditions suitable for long-term storage of reactive coals,
should not spontaneously combust. The co-disposal i of raw and
retorted shale should be approached cautiously and preferably be
avoided if possible.
There has been no work in the area of practices of storage of raw
and spent shales. The work has been done in the airea of coal
storage practices based on experience from the coal storage piles
auto-ignition behavior. As raw and spent shale present less
hazard of auto-ignition than coal, the use of coal storage designs
should prevent auto-ignition phenomena in raw and spent shales.
A.2.1 Coal Storage Pile Design to Avoid Auto-ignition.Phenomena
Since spontaneous combustion is a serious hazard in \stockpiling
low-rank coals, it would be well to outline the mechanism of such
combustion. Given a low-rank coal and a high-rank; coal, the
greater moisture content and reactivity of the lowejr-rank coal
make it the more susceptible to spontaneous combustion and there-
fore more difficult to stockpile safely. Low-rank coals have a
greater tendency than high rank coals to slack and absorb oxygen.
Although loss of moisture is ultimately beneficial iin that it
actually results in an increase in heating value, the absorption
of oxygen is detrimental. The slight weight increase; represents
a loss in B.t.u. per pound, and the reaction is accompanied by a
heat release, which can cause an increased rate of oxygen absorp-
tion,. This oxygen absorption is further aggravated by :the smaller
particle size and associated large increase in total surface area
resulting from the slacking. Unless checked, the! exothermic
reaction may eventually result in actual combustion. :
f
In a surface storage pile the rate of oxygen absorption can be
retarded only be restricting the movement of air into! and out of
the pile. These air movements are caused by: ;
1. Convection currents within the pile - the "chimney effect"
of drawing fresh air in at the sides and expelling pile
gases at the top. i
2. Barometric pressure changes. j
|
3. Changes in ambient air temperature. ;
4. Differential wind pressures on various portions of the pile
surface. \
A-17
image:
A,2 Raw and Spent Shale Storage Design To Avoid Auto-Ignition
As described earlier, the carbonaceous retorted oil shale samples
appear to present less hazard of spontaneous combustion than
bituminous coal. None of the raw shales were found to present as
great a hazard as Wyoming subbituminous coal. These materials
represent a potential hazard, but if stored, and disposed of under
conditions suitable for long-term storage of reactive coals,
should not spontaneously combust. The co-disposal i of raw and
retorted shale should be approached cautiously and preferably be
avoided if possible.
There has been no work in the area of practices of storage of raw
and spent shales. The work has been done in the airea of coal
storage practices based on experience from the coal storage piles
auto-ignition behavior. As raw and spent shale present less
hazard of auto-ignition than coal, the use of coal storage designs
should prevent auto-ignition phenomena in raw and spent shales.
A.2.1 Coal Storage Pile Design to Avoid Auto-ignition.Phenomena
Since spontaneous combustion is a serious hazard in \stockpiling
low-rank coals, it would be well to outline the mechanism of such
combustion. Given a low-rank coal and a high-rank; coal, the
greater moisture content and reactivity of the lowejr-rank coal
make it the more susceptible to spontaneous combustion and there-
fore more difficult to stockpile safely. Low-rank coals have a
greater tendency than high rank coals to slack and absorb oxygen.
Although loss of moisture is ultimately beneficial iin that it
actually results in an increase in heating value, the absorption
of oxygen is detrimental. The slight weight increase; represents
a loss in B.t.u. per pound, and the reaction is accompanied by a
heat release, which can cause an increased rate of oxygen absorp-
tion,. This oxygen absorption is further aggravated by :the smaller
particle size and associated large increase in total surface area
resulting from the slacking. Unless checked, the! exothermic
reaction may eventually result in actual combustion. :
f
In a surface storage pile the rate of oxygen absorption can be
retarded only be restricting the movement of air into! and out of
the pile. These air movements are caused by: ;
1. Convection currents within the pile - the "chimney effect"
of drawing fresh air in at the sides and expelling pile
gases at the top. i
2. Barometric pressure changes. j
|
3. Changes in ambient air temperature. ;
4. Differential wind pressures on various portions of the pile
surface. \
A-17
image:
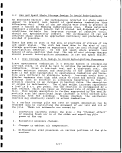 Convection currents may always be considered to exist in any pile.
Their rate of movement, however, will vary greatly depending on
the degree of compaction of the coal and the presence or absence
of air channels within the coal mass. Convection currents may be
minimized by avoiding segregation and by thorough compaction,
which is most effective when applied to thin increments as the
pile is formed. The effects of compaction are shown in Table A-7
[Allen and Parry, 1954].
TABLE A-7.
EFFECT OF COMPACTION IN REDUCING THE VOLUME
OF AIR ENTERING OR LEAVING A COAL MASS IN
RESPONSE TO BAROMETRIC PRESSURE CHANGE
Bulk
density,
Ib/ft*
40
45
50
55
60
65
70
75
80
Total volume,
coal and air,
cu ft
5,000,000
4,445,000
4,400,000
3,636,000
3,333,000
3,078,000
2,860,000
2,666,000
2,500,000
Volume of
coal.
cu ft
2,500,000
2,500,000
2,500,000
2,500,000
2,500,000
2,500,000
2,500,000
2,500,000
2,500,000
Volume of
air,
cu ft
2,500,000
1,945,000
1,500,000
1,136,000
833,000
578,000
360,000
166,000
0
Volume of air
entering coal
mass, cu ft
125,000
96,700
74,800
55,660
41,650
28,900
18,000
8,280
0
Heat released
by complete
combustion
of coal with
entering air.
Btu
12,500,000
9,670,000
7,480,000
5,566,000
4,165,000
2,890,000
1,800,000
828,000
0
aAssuming 100,000 tons of coal in storage and 5 percent increase in barometric
pressure.
Source: Allen and Parry, 1954
Although barametric pressure changes cannot be controlled, the
resultant movement of air into and out of the pile can be
minimized by thoroughly compacting the coal mass, thus reducing
the volume of air within the pile.
Ambient air temperature changes cannot be controlled but the
resultant air movement into and out of the pile, although slight,
can be minimized by reducing the air volume of the pile.
Air currents set up in the pile by differential wind pressures are
best suppressed by avoiding segregation, adequate compaction, and
smoothing the pile surface.
1
I
1
A-18
I
1
I
I
I
1
1
1
I
I
I
I
I
i
1
image:
Convection currents may always be considered to exist in any pile.
Their rate of movement, however, will vary greatly depending on
the degree of compaction of the coal and the presence or absence
of air channels within the coal mass. Convection currents may be
minimized by avoiding segregation and by thorough compaction,
which is most effective when applied to thin increments as the
pile is formed. The effects of compaction are shown in Table A-7
[Allen and Parry, 1954].
TABLE A-7.
EFFECT OF COMPACTION IN REDUCING THE VOLUME
OF AIR ENTERING OR LEAVING A COAL MASS IN
RESPONSE TO BAROMETRIC PRESSURE CHANGE
Bulk
density,
Ib/ft*
40
45
50
55
60
65
70
75
80
Total volume,
coal and air,
cu ft
5,000,000
4,445,000
4,400,000
3,636,000
3,333,000
3,078,000
2,860,000
2,666,000
2,500,000
Volume of
coal.
cu ft
2,500,000
2,500,000
2,500,000
2,500,000
2,500,000
2,500,000
2,500,000
2,500,000
2,500,000
Volume of
air,
cu ft
2,500,000
1,945,000
1,500,000
1,136,000
833,000
578,000
360,000
166,000
0
Volume of air
entering coal
mass, cu ft
125,000
96,700
74,800
55,660
41,650
28,900
18,000
8,280
0
Heat released
by complete
combustion
of coal with
entering air.
Btu
12,500,000
9,670,000
7,480,000
5,566,000
4,165,000
2,890,000
1,800,000
828,000
0
aAssuming 100,000 tons of coal in storage and 5 percent increase in barometric
pressure.
Source: Allen and Parry, 1954
Although barametric pressure changes cannot be controlled, the
resultant movement of air into and out of the pile can be
minimized by thoroughly compacting the coal mass, thus reducing
the volume of air within the pile.
Ambient air temperature changes cannot be controlled but the
resultant air movement into and out of the pile, although slight,
can be minimized by reducing the air volume of the pile.
Air currents set up in the pile by differential wind pressures are
best suppressed by avoiding segregation, adequate compaction, and
smoothing the pile surface.
1
I
1
A-18
I
1
I
I
I
1
1
1
I
I
I
I
I
i
1
image:
 When the movement of air into and out of a pile is restricted as
outlined above, the absorption of oxygen from the airi within the
pile renders the pile gases inert thus effectively checking the
dangerous cycle of oxygen absorption, heat release and increased
rate of oxygen absorption. i
In reviewing the various methods of restricting air movements
within the pile it is evident that compaction and avoidance
of segregation are the most important factors in combating every
cause of air circulation. Both must be accomplished! to achieve
trouble-free storage. Omission of either one or the lather could
result in eventual heating and combustion, since the ;success of
the storage effort will be no better than the poorest piling
technique employed. j
Numerous methods of sealing storage piles of low-rank, coals have
been attempted [Allen and Parry 1954]. Since the mos£ desirable
seal is one which permits the gradual infiltration of air over the
entire pile surface, asphalt seals are considered to be undesirable
because they effectively seal most of the pile surface but leave
some _small openings, which act as orifices for relatively high
velocity air movements into and out of the pile. Packed earth
seals are subject to the same criticism, plus the problems of
maintenance of of the seal and recovery of clean coal. Ash and
cinder coverings are considered to be ineffective ;and merely
contaminate the coal. The cheapest and most effective seal
appears to be the well slacked coal on the surface of the pile.
This seal, which represents no contamination problem, will absorb
oxygen from the entering air so that air reaching the interior
of the pile will be virtually inert. ;
There are some other considerations which can be taken into
account when designing a coal pile storage [Lowry, 19541] and these
are summarized below: ;
1. Storage area should be level, firm, well drained, and free
of fences, piers, etc. '
2. Build up the piles in increments not exceeding 1 to 2 ft. in
depth. ,
3. Thoroughly compact each increment before placing ! additional
coal on the pile. This compaction should be applied to the
entire pile top, sides and edges. I
4. Maintain the side slope at 14° or less to prevent segregation
and to facilitate the compaction. Though one study [Davis
and Boegly, January 1978] has recently suggested a\ side slope
up to 30° or less.
A-19
image:
When the movement of air into and out of a pile is restricted as
outlined above, the absorption of oxygen from the airi within the
pile renders the pile gases inert thus effectively checking the
dangerous cycle of oxygen absorption, heat release and increased
rate of oxygen absorption. i
In reviewing the various methods of restricting air movements
within the pile it is evident that compaction and avoidance
of segregation are the most important factors in combating every
cause of air circulation. Both must be accomplished! to achieve
trouble-free storage. Omission of either one or the lather could
result in eventual heating and combustion, since the ;success of
the storage effort will be no better than the poorest piling
technique employed. j
Numerous methods of sealing storage piles of low-rank, coals have
been attempted [Allen and Parry 1954]. Since the mos£ desirable
seal is one which permits the gradual infiltration of air over the
entire pile surface, asphalt seals are considered to be undesirable
because they effectively seal most of the pile surface but leave
some _small openings, which act as orifices for relatively high
velocity air movements into and out of the pile. Packed earth
seals are subject to the same criticism, plus the problems of
maintenance of of the seal and recovery of clean coal. Ash and
cinder coverings are considered to be ineffective ;and merely
contaminate the coal. The cheapest and most effective seal
appears to be the well slacked coal on the surface of the pile.
This seal, which represents no contamination problem, will absorb
oxygen from the entering air so that air reaching the interior
of the pile will be virtually inert. ;
There are some other considerations which can be taken into
account when designing a coal pile storage [Lowry, 19541] and these
are summarized below: ;
1. Storage area should be level, firm, well drained, and free
of fences, piers, etc. '
2. Build up the piles in increments not exceeding 1 to 2 ft. in
depth. ,
3. Thoroughly compact each increment before placing ! additional
coal on the pile. This compaction should be applied to the
entire pile top, sides and edges. I
4. Maintain the side slope at 14° or less to prevent segregation
and to facilitate the compaction. Though one study [Davis
and Boegly, January 1978] has recently suggested a\ side slope
up to 30° or less.
A-19
image:
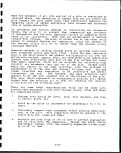 I
I
5. Decreased height of storage piles results in decreased U
probability of spontaneous combustion since (a) the effective
resistance to heat flow is lower which results in the faster B
heat of oxidation dissipation with less rise in temperature H
(b) lower piles tend to decrease the amount of segregation of
sizes when coal is piled carelessly and (c) it is easier to «
remove "hot spots" when they occur. W
6. Segregation of sizes should be avoided since many fires occur
near the boundaries of zones of coarse coal that apparently B
act as chimneys for conducting air into the pile. H
7. Preferably coal 'should not be piled in hot weather since many
fires apparently are due to this cause.
8. A shipment of coal that is wet should not be piled with other _
coal. H
9. Coals from different sources should not be stored in a common
pile. I
10. Care should be taken to keep out extranenous material which
may cause fires. •
11. After storage the temperature of a pile should be determined
regularly by means of thermometers in previously installed
pipes. The extremely local nature of "hot spots" makes it •
necessary to test at points on 10 to 20 feet centers. If •
temperatures of 140 to 150 °F are found, the temperature of
the coal near these points should be taken on 5 foot centers. H
Although these techniques deal with the storage of low rank highly
reactive coals, it is obvious that any stockpiling technique re- _
suiting in trouble-free storage of these fuels would be even safer B
for storing less reactive raw and spent shales.
1
I
I
I
A-20
1
image:
I
I
5. Decreased height of storage piles results in decreased U
probability of spontaneous combustion since (a) the effective
resistance to heat flow is lower which results in the faster B
heat of oxidation dissipation with less rise in temperature H
(b) lower piles tend to decrease the amount of segregation of
sizes when coal is piled carelessly and (c) it is easier to «
remove "hot spots" when they occur. W
6. Segregation of sizes should be avoided since many fires occur
near the boundaries of zones of coarse coal that apparently B
act as chimneys for conducting air into the pile. H
7. Preferably coal 'should not be piled in hot weather since many
fires apparently are due to this cause.
8. A shipment of coal that is wet should not be piled with other _
coal. H
9. Coals from different sources should not be stored in a common
pile. I
10. Care should be taken to keep out extranenous material which
may cause fires. •
11. After storage the temperature of a pile should be determined
regularly by means of thermometers in previously installed
pipes. The extremely local nature of "hot spots" makes it •
necessary to test at points on 10 to 20 feet centers. If •
temperatures of 140 to 150 °F are found, the temperature of
the coal near these points should be taken on 5 foot centers. H
Although these techniques deal with the storage of low rank highly
reactive coals, it is obvious that any stockpiling technique re- _
suiting in trouble-free storage of these fuels would be even safer B
for storing less reactive raw and spent shales.
1
I
I
I
A-20
1
image:
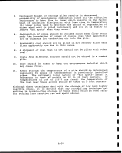 APPENDIX B
USE OF SPENT OIL SHALE AS A LINER MATERIAL AT
SPENT SHALE DISPOSAL SITES
Prepared by:
William J. Culbertson, Jr.
Charles H. Habenicht
Denver Research Institute
Chemical and Materials Sciences Division
University of Denver
Denver, Colorado 80208
For:
Monsanto Company
Dayton Laboratory
1515 Nicholas Road
Dayton, Ohio 45407
Contract No. EPA 68-01-6487
B-i
image:
APPENDIX B
USE OF SPENT OIL SHALE AS A LINER MATERIAL AT
SPENT SHALE DISPOSAL SITES
Prepared by:
William J. Culbertson, Jr.
Charles H. Habenicht
Denver Research Institute
Chemical and Materials Sciences Division
University of Denver
Denver, Colorado 80208
For:
Monsanto Company
Dayton Laboratory
1515 Nicholas Road
Dayton, Ohio 45407
Contract No. EPA 68-01-6487
B-i
image:
 CONTENTS
I
I
I. INTRODUCTION AND SCOPE 1 I
A. Object 1 •
B. Approach 2
C. Experimental Plan and Independent Variables
Used 3
I
II. DISCUSSION OF RESULTS 7 „
A. Permeability 7 •
B. Peak Angle of Internal Friction 0 Related «•
to Self Healing and Its Trade OffpWith
Permeability 17 B
C. Residual Shear Strength and Critical •
Void Ratio Related to Slope Stability 19
D. Brittleness Index Related to Cementation and p
Permeability 19 B
E. Relation of Peak Friction Angle Op and
Brittleness Index BI with Initial Torsional
Stiffness and Shear Modulus G -20 il
F. Relation of Peak Friction Angle with Twist •
at Peak Strength 24
G. Relation of Peak Friction Angle and •
Squashiness Index with Cured Void Ratio 24 H
H. Hydrate Species Determined by EGA 28
I. Secondary Compression Index C «
Related to Cementation and Mellowing 31 •
J. Indirect Tensile Strength (Brazilian) Test ... 33 H
K. Compression Index 36
III. CONCLUSIONS AND RECOMMENDATIONS 41 B
IV. REFERENCES 43
I
1
I
B-ii
I
I
I
i
image:
CONTENTS
I
I
I. INTRODUCTION AND SCOPE 1 I
A. Object 1 •
B. Approach 2
C. Experimental Plan and Independent Variables
Used 3
I
II. DISCUSSION OF RESULTS 7 „
A. Permeability 7 •
B. Peak Angle of Internal Friction 0 Related «•
to Self Healing and Its Trade OffpWith
Permeability 17 B
C. Residual Shear Strength and Critical •
Void Ratio Related to Slope Stability 19
D. Brittleness Index Related to Cementation and p
Permeability 19 B
E. Relation of Peak Friction Angle Op and
Brittleness Index BI with Initial Torsional
Stiffness and Shear Modulus G -20 il
F. Relation of Peak Friction Angle with Twist •
at Peak Strength 24
G. Relation of Peak Friction Angle and •
Squashiness Index with Cured Void Ratio 24 H
H. Hydrate Species Determined by EGA 28
I. Secondary Compression Index C «
Related to Cementation and Mellowing 31 •
J. Indirect Tensile Strength (Brazilian) Test ... 33 H
K. Compression Index 36
III. CONCLUSIONS AND RECOMMENDATIONS 41 B
IV. REFERENCES 43
I
1
I
B-ii
I
I
I
i
image:
 I
I
LIST OF TABLES
Table B- ! Page
Void Ratios e and Compression Indices C : ... 37
c >
• II Experimental Design - TOSCO II. Lurgi, and Mixtures
of Mellowed TOSCO and Mellowed Lurgi with Burned and
Unburned TOSCO and Unmellowed Lurgi Spent Shale. . .
• II 1. Pneumatic Arm Oedometer Results from Fresh Specimens:
Void Ratios e and Compression Indice
I
I
I
I
I
I
I
I
I
I
I
I
I
I B-iii
I
image:
I
I
LIST OF TABLES
Table B- ! Page
Void Ratios e and Compression Indices C : ... 37
c >
• II Experimental Design - TOSCO II. Lurgi, and Mixtures
of Mellowed TOSCO and Mellowed Lurgi with Burned and
Unburned TOSCO and Unmellowed Lurgi Spent Shale. . .
• II 1. Pneumatic Arm Oedometer Results from Fresh Specimens:
Void Ratios e and Compression Indice
I
I
I
I
I
I
I
I
I
I
I
I
I
I B-iii
I
image:
 Figures
II 1.
II 2.
II 3.
II 4.
II 5.
II 6.
II 7.
II 8.
II 9.
II 10.
II 11.
II 12.
II 13.
II 14.
II 15.
II 16.
II 17.
II 18.
II 19.
LIST OF FIGURES
B-
Permeability of Mixtures of Burned TOSCO and Unburned
TOSCO Spent Shale after Approximately Four Weeks
Curing in Spring Oedometers
Permeability of 100% TOSCO II Spent Shale (TOSCO 100) . .
Permeability of 90% TOSCO II - 10% Burned TOSCO
Spent Shale (TOSCO 90)
Permeability of 80% TOSCO II - 20% Burned TOSCO
Spent Shale (TOSCO 80)
Permeability of 70% TOSCO II - 30% Burned TOSCO
Spent Shale (TOSCO 70). ..
Permeability of Lurgi Spent Shale
Permeability of Mellowed Lurgi (M14) mixed into Lurgi and
Mellowed Burned TOSCO (M-15) Mixed into TOSCO II and into
Burned TOSCO Spent Shale
Mineral Grain Density vs Time for TOSCO 100 Spent Shale .
Mineral Grain Density vs time for TOSCO 90 Spent Shale. .
Mineral Grain Density vs Time for TOSCO 80 Spent Shale. .
Mineral Grain Density vs Time for TOSCO 70 Spent Shale. .
Mineral Grain Density vs time for Lurgi Spent Shale . . .
Permeability of Spent Shales Correlated with Void Ratio .
Permeability Of TOSCO Spent Shale Mixtures Correlated
with Peak Friction Angle
Permeability of Lurgi Spent Shale Correlated with
Peak Friction Angle
Brittleness Index Correlated with Peak Friction Angle . .
Permeability Compared with Brittleness Index
Peak Friction Angle Compared with Initial Shear
Modulus G
Brittleness Index Compared with Initial Shear
B-iv
Page
8
. 9
9
9
10
10
11
. 12
. 12
. 13
. 13
. 14
. 16
18
18
. 21
22
23
25
1
1
1
1
I
n
1
1
1
1
1
1
1
1
1
image:
Figures
II 1.
II 2.
II 3.
II 4.
II 5.
II 6.
II 7.
II 8.
II 9.
II 10.
II 11.
II 12.
II 13.
II 14.
II 15.
II 16.
II 17.
II 18.
II 19.
LIST OF FIGURES
B-
Permeability of Mixtures of Burned TOSCO and Unburned
TOSCO Spent Shale after Approximately Four Weeks
Curing in Spring Oedometers
Permeability of 100% TOSCO II Spent Shale (TOSCO 100) . .
Permeability of 90% TOSCO II - 10% Burned TOSCO
Spent Shale (TOSCO 90)
Permeability of 80% TOSCO II - 20% Burned TOSCO
Spent Shale (TOSCO 80)
Permeability of 70% TOSCO II - 30% Burned TOSCO
Spent Shale (TOSCO 70). ..
Permeability of Lurgi Spent Shale
Permeability of Mellowed Lurgi (M14) mixed into Lurgi and
Mellowed Burned TOSCO (M-15) Mixed into TOSCO II and into
Burned TOSCO Spent Shale
Mineral Grain Density vs Time for TOSCO 100 Spent Shale .
Mineral Grain Density vs time for TOSCO 90 Spent Shale. .
Mineral Grain Density vs Time for TOSCO 80 Spent Shale. .
Mineral Grain Density vs Time for TOSCO 70 Spent Shale. .
Mineral Grain Density vs time for Lurgi Spent Shale . . .
Permeability of Spent Shales Correlated with Void Ratio .
Permeability Of TOSCO Spent Shale Mixtures Correlated
with Peak Friction Angle
Permeability of Lurgi Spent Shale Correlated with
Peak Friction Angle
Brittleness Index Correlated with Peak Friction Angle . .
Permeability Compared with Brittleness Index
Peak Friction Angle Compared with Initial Shear
Modulus G
Brittleness Index Compared with Initial Shear
B-iv
Page
8
. 9
9
9
10
10
11
. 12
. 12
. 13
. 13
. 14
. 16
18
18
. 21
22
23
25
1
1
1
1
I
n
1
1
1
1
1
1
1
1
1
image:
 II 20. Extent of Twist at Peak Strength Correlated with Peak
Friction Angle. ....... ; . !. . . . 20
II 21. Peak Friction Angle of TOSCO 100 vs Void Ratio. ...... 27
II 22. Peak Friction Angle of TOSCO 90 vs Void Ratio ...:.... 27
II 23. Peak Friction Angle of TOSCO 80 vs Void Ratio ....... 27
II 24. Peak Friction Angle of TOSCO 70 vs Void Ratio ...;.... 27
II 25. EGA Hydrate Water Peak of Tobermorite and Ettringitel
vs Time for TOSCO 100, 90, and 70 Specimens ........ 29
i
II 26. Peak Friction Angle vs Time for TOSCO 100, 90, and 70
Specimens . ... 29
i
II 27. Initial Torsional Stiffness vs 115 to 135°C EGA \
Peak Height ;. ... 30
II 28. Twist at Peak Strength vs 115 to 135°C EGA Peak Height. . . 30
II 29. Final C at 45° Peak Friction Angle for Oedometer I
Specimens of Various Spent Shale Mixtures .... 32
II 30. Final C vs Peak Friction Angle for TOSCO 100 Specimens . . 32
II 31. Final C vs Peak Friction Angle for TOSCO 90 Specimens. . . 32
II 32. Final C vs Peak Friction Angle for TOSCO 80 Specimens. . . 32
II 33. Final C vs Peak Friction Angle for TOSCO 70 Specimens. . . 32
i
II 34. Final C vs Peak Friction Angle for Lurgi Specimens .... 32
II 35. Torsion Test Twist at Peak Strength vs Brazil \
Tensile Strength i ... 34
II 36. Brazil Tensile Strain At Failure vs Torsion Test Twist
at Peak Strength ; ... 34
II 37. Brazil Tensile Strength vs Initial Water Content. ..... 35
II 38. Compression Index of Fresh Specimens for Loading Increment
155 to 310 PSI '.....'... 35
B-v
image:
II 20. Extent of Twist at Peak Strength Correlated with Peak
Friction Angle. ....... ; . !. . . . 20
II 21. Peak Friction Angle of TOSCO 100 vs Void Ratio. ...... 27
II 22. Peak Friction Angle of TOSCO 90 vs Void Ratio ...:.... 27
II 23. Peak Friction Angle of TOSCO 80 vs Void Ratio ....... 27
II 24. Peak Friction Angle of TOSCO 70 vs Void Ratio ...;.... 27
II 25. EGA Hydrate Water Peak of Tobermorite and Ettringitel
vs Time for TOSCO 100, 90, and 70 Specimens ........ 29
i
II 26. Peak Friction Angle vs Time for TOSCO 100, 90, and 70
Specimens . ... 29
i
II 27. Initial Torsional Stiffness vs 115 to 135°C EGA \
Peak Height ;. ... 30
II 28. Twist at Peak Strength vs 115 to 135°C EGA Peak Height. . . 30
II 29. Final C at 45° Peak Friction Angle for Oedometer I
Specimens of Various Spent Shale Mixtures .... 32
II 30. Final C vs Peak Friction Angle for TOSCO 100 Specimens . . 32
II 31. Final C vs Peak Friction Angle for TOSCO 90 Specimens. . . 32
II 32. Final C vs Peak Friction Angle for TOSCO 80 Specimens. . . 32
II 33. Final C vs Peak Friction Angle for TOSCO 70 Specimens. . . 32
i
II 34. Final C vs Peak Friction Angle for Lurgi Specimens .... 32
II 35. Torsion Test Twist at Peak Strength vs Brazil \
Tensile Strength i ... 34
II 36. Brazil Tensile Strain At Failure vs Torsion Test Twist
at Peak Strength ; ... 34
II 37. Brazil Tensile Strength vs Initial Water Content. ..... 35
II 38. Compression Index of Fresh Specimens for Loading Increment
155 to 310 PSI '.....'... 35
B-v
image:
 SYMBOLS AND ABBREVIATIONS
The following symbols have been used in this Appendix.
TA
TOS100
TOSCO 100
100% TOSCO II
TOS90
TOSCO 90
TOS 80
TOSCO 80
TOS 70
TOSCO 70
MEL
A
51
24%
PS I
Gm
cc
Lb
EGA
e
C<x
Fluidized bed burned TOSCO II spent shale from TOSCO
Rocky Flats site (from drum number TA). Unburned
scalped retorted spent shale from a pilot size TOSCO
II retort at the TOSCO Rock Flats site.
A mixture of 90% unburned TOSCO II spent shale with
10% of burned spent shale from a pilot size
fluidized bed burner fed TOSCO II spent shale at the
TOSCO Rocky Flats site.
A mixture of 80% unburned TOSCO II spent shale with
20% of the burned spent shale.
A mixture of 70% unburned TOSCO II spent shale with
30% of the burned spent shale.
Autoclave mellowed material.
Triangle data points on graphs are usually for standard
proctor specimens.
Square data points on graphs are usually for modified
proctor specimens.
Number by data point on graph signifies oedometer
loading number of specimen tested.
Percentage figure by data point on graph signifies
percent water dry basis added to spent shale mix before
loading oedometer.
Pounds per square inch
Grams mass
Cubic centimeters
Pounds
Evolved gas analysis
Void ratio
Secondary compression index =de
I
I
I
I
I
I
I
I
I
d log t
= slope of void ratio vs logarathim of time plot of
secondary compression.
I
I
I
I
I
I
B-vi
I
I
image:
SYMBOLS AND ABBREVIATIONS
The following symbols have been used in this Appendix.
TA
TOS100
TOSCO 100
100% TOSCO II
TOS90
TOSCO 90
TOS 80
TOSCO 80
TOS 70
TOSCO 70
MEL
A
51
24%
PS I
Gm
cc
Lb
EGA
e
C<x
Fluidized bed burned TOSCO II spent shale from TOSCO
Rocky Flats site (from drum number TA). Unburned
scalped retorted spent shale from a pilot size TOSCO
II retort at the TOSCO Rock Flats site.
A mixture of 90% unburned TOSCO II spent shale with
10% of burned spent shale from a pilot size
fluidized bed burner fed TOSCO II spent shale at the
TOSCO Rocky Flats site.
A mixture of 80% unburned TOSCO II spent shale with
20% of the burned spent shale.
A mixture of 70% unburned TOSCO II spent shale with
30% of the burned spent shale.
Autoclave mellowed material.
Triangle data points on graphs are usually for standard
proctor specimens.
Square data points on graphs are usually for modified
proctor specimens.
Number by data point on graph signifies oedometer
loading number of specimen tested.
Percentage figure by data point on graph signifies
percent water dry basis added to spent shale mix before
loading oedometer.
Pounds per square inch
Grams mass
Cubic centimeters
Pounds
Evolved gas analysis
Void ratio
Secondary compression index =de
I
I
I
I
I
I
I
I
I
d log t
= slope of void ratio vs logarathim of time plot of
secondary compression.
I
I
I
I
I
I
B-vi
I
I
image:
 o Normal stress = stress normal to shear plane1
oy Vertical stress. \
ay ' Effective vertical stress = vertical stress less any
pore water pressure. Important to the mechanics of the
soil skeleton. I
T Shear stress !
- -.- i
TP Peak or failure shear stress.
T :
R . Residual shear stress i
tip, dp' Angle of internal friction (or friction angle)
at peak shear strength - particularly useful for
noncohesive or silty soil. 0p = arctan T/a. '
0n> fin' Same as above but for residual strength. >
BI Brittleness index = TP - TR
Tp !
PL Plastic limit, % water dry basis :
l
LL Liquid limit, % water dry basis ;
PI Plasticity index = LL - PL i
CSH I One type of tobermorite, CaO Si02 nH^O using
cement chemists terminology ',
B-vii
image:
o Normal stress = stress normal to shear plane1
oy Vertical stress. \
ay ' Effective vertical stress = vertical stress less any
pore water pressure. Important to the mechanics of the
soil skeleton. I
T Shear stress !
- -.- i
TP Peak or failure shear stress.
T :
R . Residual shear stress i
tip, dp' Angle of internal friction (or friction angle)
at peak shear strength - particularly useful for
noncohesive or silty soil. 0p = arctan T/a. '
0n> fin' Same as above but for residual strength. >
BI Brittleness index = TP - TR
Tp !
PL Plastic limit, % water dry basis :
l
LL Liquid limit, % water dry basis ;
PI Plasticity index = LL - PL i
CSH I One type of tobermorite, CaO Si02 nH^O using
cement chemists terminology ',
B-vii
image:
 I
Acknowledgments
The following people have contributed particularly to this work:
Russell Nye, Senior Research Technician
Michael Shaffron for Consolidation Data Reduction •
Lindsay Patten, Student Chemist •
Penny Hudson, Mineralogist
Dr. Paul Predecki, X-ray Diffraction •
Ed Bates, EPA Cincinnati •
I
I
I
I
I
I
I
I
I
I
I
I
I
I
I
B-viii
image:
I
Acknowledgments
The following people have contributed particularly to this work:
Russell Nye, Senior Research Technician
Michael Shaffron for Consolidation Data Reduction •
Lindsay Patten, Student Chemist •
Penny Hudson, Mineralogist
Dr. Paul Predecki, X-ray Diffraction •
Ed Bates, EPA Cincinnati •
I
I
I
I
I
I
I
I
I
I
I
I
I
I
I
B-viii
image:
 I. INTRODUCTION AND SCOPE
I
A. Object !
This Appendix presents a summary of work conducted under Contract
68-01-6487 and Cooperative Agreement CR809233. A more complete report
including detailed descriptions of materials used, testing procedures, and
results will be published upon completion of Cooperative Agreement CR809233.
This work was undertaken to survey the possibility of use of spent oil shale
itself in constructing a deeply buried liner below embankments of spent oil
shale. Some possible modification of these spent oil shales were to be
tried including the admixing of autoclave mellowed burned spent oil shale
with the hope of reducing the cementation tendencies of otherwise rather
fine grained material, sometimes of low emplaced permeability, ahd^of
reducing the permeability due to hydrothermal generation of clay like
species. In general a material was sought which had much of the;frictional
characteristics and volume stability of silt but the impermeability of clay
without a tendency for eventual cementation on the one hand or Teachability
and partial soil skeleton loss on the other. :
One of the important needs of a spent oil shale based "clay" liner is
low permeability. Perhaps the next most important is self healing ability
if it risks being cracked through subsidence below or geologic faulting. A
disadvantage of high strength soil such as can be achieved by cementation,
dehydration or compaction is that, "once ruptured, the structure; does not
readily, if at all, reform. Weak bonds possess a certain capacity for self
healing. . ." (Ingles 1968). A third requirement is volume stabjility or
resistance to swelling and shrinking. \
The present study has mostly been concerned with 100% standard and 100%
modified proctor compacted specimens of spent oil shale althoughj static
compaction of some TOSCO II and Lurgi material to some 280 psi was done
during torsion shear strength apparatus "shake down." The specimens have
often seemed too brittle for good self healing due to high compaction and/or
cementation. Their volume stability to consolidation under 280 >psi pressure
has been good, however. j
Any detrimental effect of drying on the spent oil shale liner materials
is presently speculation. There seems to be little shrinkage, in general,
but the effect on permeability and self healing capability when re-wetted is
unknown. The self healing capability while still dry is perhaps nil! for
some of the more cemented materials but lesser cemented materials sucn_as
TOSCO II material may show some ability to flow into tension cra'cks while
dry under say 300 psi overburden vertical pressure. !
Fortunately the underground environment of the liner will probably be
moist on the country rock side of the liner and can be made moist on the
spent shale embankment side. :
An important possible hazard to be considered is that of increased
pore water pressure in loosely compacted somewhat saturated liner due to
shearing, chemical defloculation due to permeate composition, or earthquake
B-l
image:
I. INTRODUCTION AND SCOPE
I
A. Object !
This Appendix presents a summary of work conducted under Contract
68-01-6487 and Cooperative Agreement CR809233. A more complete report
including detailed descriptions of materials used, testing procedures, and
results will be published upon completion of Cooperative Agreement CR809233.
This work was undertaken to survey the possibility of use of spent oil shale
itself in constructing a deeply buried liner below embankments of spent oil
shale. Some possible modification of these spent oil shales were to be
tried including the admixing of autoclave mellowed burned spent oil shale
with the hope of reducing the cementation tendencies of otherwise rather
fine grained material, sometimes of low emplaced permeability, ahd^of
reducing the permeability due to hydrothermal generation of clay like
species. In general a material was sought which had much of the;frictional
characteristics and volume stability of silt but the impermeability of clay
without a tendency for eventual cementation on the one hand or Teachability
and partial soil skeleton loss on the other. :
One of the important needs of a spent oil shale based "clay" liner is
low permeability. Perhaps the next most important is self healing ability
if it risks being cracked through subsidence below or geologic faulting. A
disadvantage of high strength soil such as can be achieved by cementation,
dehydration or compaction is that, "once ruptured, the structure; does not
readily, if at all, reform. Weak bonds possess a certain capacity for self
healing. . ." (Ingles 1968). A third requirement is volume stabjility or
resistance to swelling and shrinking. \
The present study has mostly been concerned with 100% standard and 100%
modified proctor compacted specimens of spent oil shale althoughj static
compaction of some TOSCO II and Lurgi material to some 280 psi was done
during torsion shear strength apparatus "shake down." The specimens have
often seemed too brittle for good self healing due to high compaction and/or
cementation. Their volume stability to consolidation under 280 >psi pressure
has been good, however. j
Any detrimental effect of drying on the spent oil shale liner materials
is presently speculation. There seems to be little shrinkage, in general,
but the effect on permeability and self healing capability when re-wetted is
unknown. The self healing capability while still dry is perhaps nil! for
some of the more cemented materials but lesser cemented materials sucn_as
TOSCO II material may show some ability to flow into tension cra'cks while
dry under say 300 psi overburden vertical pressure. !
Fortunately the underground environment of the liner will probably be
moist on the country rock side of the liner and can be made moist on the
spent shale embankment side. :
An important possible hazard to be considered is that of increased
pore water pressure in loosely compacted somewhat saturated liner due to
shearing, chemical defloculation due to permeate composition, or earthquake
B-l
image:
 I
liquification. In a too impermeable liner, an increase in pore water pres- m
sure may not dissipate rapidly enough so that shear strength would drop due gj
to reduced friction between soil skeleton particles as the effective normal
stress is lowered. The liner might then become more like a grease than a
liner allowing a spent shale embankment to slide. •
Some specimens of the present study have been proctor hammer compacted
so well that they apparently begin on the dense side of the critical volume Bj
line so they generally dilate at the beginning of shear. This should reduce g
pore pressure rather than increase it as shear occurs. Standard proctor
TOSCO II spent shale cured for a short time shows no peak in the _
stress/strain curve and must begin above the critical volume line and •
although probably self healing to some degree might, in spite of its silty •
nature and high permeability, develop pore pressure during rapid shearing or
other disturbance. These considerations have not been directly addressed in H
this study. Mainly plasticity and self healing problems in the face of H
cementation have been addressed.
Compressibility coefficients at various normal pressures in conven- ||
tional oedometers have been determined on compacted specimens of zero age in
looking for any collapse of the soil skeleton at higher pressures than even
the 280 psi vertical pressure of the torsion tests. Of course the vigorous H
compaction used in preparing the specimens has reduced any tendency for •
collapse and pore pressure increase but study of wetting or saturating is
also needed. Wetting has been tried for spring oedometer specimens after •
various aging times before determination of torsion shear strength and ^ Q
accompanied by specimen volume measurement before and after wetting during
permeability testing. n
B. Approach
The routine testing approach has centered around study of rather highly •
consolidated specimens of various mixtures of spent oil shale at two H
moisture contents, one at optimum water content for maximum dry density, the
other at a somewhat wetter than optimum water content. Often wetter than n
optimum material is used for small dam cores and around abutments for ||
increased flexibility and lower brittleness and sometimes lower permeability
also results. A vertical consolidation pressure of around 280 psi was
produced by spring loaded oedometers. •
To simulate a liner placement technique sometimes proposed, the speci-
mens were compacted in spring oedometer sheaths to 100% of standard proctor •
or 100% of modified proctor. These compactions allowed a small further g
consolidation in the oedometers. The oedometer consolidation is a sort of
model of burial under an embankment of moderate height and allows a standard __
and somewhat realistic environment for subsequent aging/curing/and or H
cementation processes in the specimen. There is some unreality in immediate •
application of the full 280 psi consolidation pressure just after compaction
however, as some time is needed for construction of full embankment height. •
After permeability testing a specimen, it was transferred from the
spring oedometer to a rubber membrane in a triaxial chamber for torsion «
B-2
I
I
image:
I
liquification. In a too impermeable liner, an increase in pore water pres- m
sure may not dissipate rapidly enough so that shear strength would drop due gj
to reduced friction between soil skeleton particles as the effective normal
stress is lowered. The liner might then become more like a grease than a
liner allowing a spent shale embankment to slide. •
Some specimens of the present study have been proctor hammer compacted
so well that they apparently begin on the dense side of the critical volume Bj
line so they generally dilate at the beginning of shear. This should reduce g
pore pressure rather than increase it as shear occurs. Standard proctor
TOSCO II spent shale cured for a short time shows no peak in the _
stress/strain curve and must begin above the critical volume line and •
although probably self healing to some degree might, in spite of its silty •
nature and high permeability, develop pore pressure during rapid shearing or
other disturbance. These considerations have not been directly addressed in H
this study. Mainly plasticity and self healing problems in the face of H
cementation have been addressed.
Compressibility coefficients at various normal pressures in conven- ||
tional oedometers have been determined on compacted specimens of zero age in
looking for any collapse of the soil skeleton at higher pressures than even
the 280 psi vertical pressure of the torsion tests. Of course the vigorous H
compaction used in preparing the specimens has reduced any tendency for •
collapse and pore pressure increase but study of wetting or saturating is
also needed. Wetting has been tried for spring oedometer specimens after •
various aging times before determination of torsion shear strength and ^ Q
accompanied by specimen volume measurement before and after wetting during
permeability testing. n
B. Approach
The routine testing approach has centered around study of rather highly •
consolidated specimens of various mixtures of spent oil shale at two H
moisture contents, one at optimum water content for maximum dry density, the
other at a somewhat wetter than optimum water content. Often wetter than n
optimum material is used for small dam cores and around abutments for ||
increased flexibility and lower brittleness and sometimes lower permeability
also results. A vertical consolidation pressure of around 280 psi was
produced by spring loaded oedometers. •
To simulate a liner placement technique sometimes proposed, the speci-
mens were compacted in spring oedometer sheaths to 100% of standard proctor •
or 100% of modified proctor. These compactions allowed a small further g
consolidation in the oedometers. The oedometer consolidation is a sort of
model of burial under an embankment of moderate height and allows a standard __
and somewhat realistic environment for subsequent aging/curing/and or H
cementation processes in the specimen. There is some unreality in immediate •
application of the full 280 psi consolidation pressure just after compaction
however, as some time is needed for construction of full embankment height. •
After permeability testing a specimen, it was transferred from the
spring oedometer to a rubber membrane in a triaxial chamber for torsion «
B-2
I
I
image:
 testing under a confining water pressure generally corresponding to an
assumed K of 0.5 to 0.7. A K of 0.7 is higher than corresponds to a
two dimensionally normally consolidated silty,material but may tie about
right for certain specimens. In this way the tendency for swelling in
diameter of a specimen as it in effect is extruded from the oedometer sheath
to the rubber membrane in the triaxial chamber is mitigated. Such swelling
might break cementation of cemented specimens. Without the confining
pressure even some stiff somewhat cemented specimens were crushed when only
moderate vertical pressures were applied prior to torquing. !
It is desirable to perform shear strength tests on undisturbed
specimens. Specimens may be disturbed by swelling which softens them, by
over-consolidation which during extrusion hardens them or by breaking
cementation which softens them or fractures them prematurely. After
obtaining the torsion stress/strain curve, the specimens were removed from
the triaxial container and their enclosing gum rubber membranes!cut away so
previously transferred longitudinal acrylic paint stripes on the specimens
could be examined and the specimen photographed. i
Some physical and chemical properties of the specimens were next
determined on dried fragments left from the torsion test. These include EGA
analysis for hydrate water of species formed during curing. Some of these
species are of a cementing or potentially Teachable nature. X-ray
diffraction scans for confirmation or identification of these species were
also made. [
The Atterberg limits of beginning materials and blends of spent shale
materials are a parameter important in soil mechanics correlations. These
were obtained for some raw material spent shale and mellowed spent shale.
Atterberg limits on cemented specimens were not made. ;
Considerable time was needed to learn how to best operate the specially
built triaxial torsion machine. Some specimens from preliminary series were
tested under various confining water pressures and with different variations
of specimen extrusion methods before the combination of conditions used for
most of the specimens prepared for the following experimental plan was
standardized. At the beginning it was believed that cured specimens con-
taining much of the burned TOSCO spent shale would be too cemented to be
handled by the triaxial torsion apparatus and this material wasilimited to
30% in mixtures with less cementing TOSCO II material. This fear was
validated as tests preceded. Some of the 30% mixtures were strong enough to
cause slipping of the piston rod in the torque transmitting collet gripping
it. Usually this could be remedied by further tightening of the collet.
Also sometimes a little bending over of the brass vanes in the pore stones
gripping a well cemented specimen occurred during twisting.
It was also feared that there might be poor contact and gripping of the
top of the specimen by the piston pore stone when standard proctor and
particularly when modified proctor compaction was used, especially since a
3/32 inch cross section rubber o-ring was being used at the periphery of the
piston pore stone between the specimen and stone. Preliminary experiments
using a pneumatic loaded oedometer with proctored material seemed to
B-3
image:
testing under a confining water pressure generally corresponding to an
assumed K of 0.5 to 0.7. A K of 0.7 is higher than corresponds to a
two dimensionally normally consolidated silty,material but may tie about
right for certain specimens. In this way the tendency for swelling in
diameter of a specimen as it in effect is extruded from the oedometer sheath
to the rubber membrane in the triaxial chamber is mitigated. Such swelling
might break cementation of cemented specimens. Without the confining
pressure even some stiff somewhat cemented specimens were crushed when only
moderate vertical pressures were applied prior to torquing. !
It is desirable to perform shear strength tests on undisturbed
specimens. Specimens may be disturbed by swelling which softens them, by
over-consolidation which during extrusion hardens them or by breaking
cementation which softens them or fractures them prematurely. After
obtaining the torsion stress/strain curve, the specimens were removed from
the triaxial container and their enclosing gum rubber membranes!cut away so
previously transferred longitudinal acrylic paint stripes on the specimens
could be examined and the specimen photographed. i
Some physical and chemical properties of the specimens were next
determined on dried fragments left from the torsion test. These include EGA
analysis for hydrate water of species formed during curing. Some of these
species are of a cementing or potentially Teachable nature. X-ray
diffraction scans for confirmation or identification of these species were
also made. [
The Atterberg limits of beginning materials and blends of spent shale
materials are a parameter important in soil mechanics correlations. These
were obtained for some raw material spent shale and mellowed spent shale.
Atterberg limits on cemented specimens were not made. ;
Considerable time was needed to learn how to best operate the specially
built triaxial torsion machine. Some specimens from preliminary series were
tested under various confining water pressures and with different variations
of specimen extrusion methods before the combination of conditions used for
most of the specimens prepared for the following experimental plan was
standardized. At the beginning it was believed that cured specimens con-
taining much of the burned TOSCO spent shale would be too cemented to be
handled by the triaxial torsion apparatus and this material wasilimited to
30% in mixtures with less cementing TOSCO II material. This fear was
validated as tests preceded. Some of the 30% mixtures were strong enough to
cause slipping of the piston rod in the torque transmitting collet gripping
it. Usually this could be remedied by further tightening of the collet.
Also sometimes a little bending over of the brass vanes in the pore stones
gripping a well cemented specimen occurred during twisting.
It was also feared that there might be poor contact and gripping of the
top of the specimen by the piston pore stone when standard proctor and
particularly when modified proctor compaction was used, especially since a
3/32 inch cross section rubber o-ring was being used at the periphery of the
piston pore stone between the specimen and stone. Preliminary experiments
using a pneumatic loaded oedometer with proctored material seemed to
B-3
image:
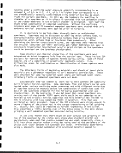 1
partially support this fear and many of the main series of specimens were «,
loaded in the spring oedometers using the o-rings but with some loose |
material sprinkled on top of the compacted specimen within the o-ring before
insertion of the piston and application of spring pressure. Previous static
compactions with the spring alone without proctor compaction had shown •
attainment of rather high density although not as high as by some standard •
proctorings and all modified proctorings For this reason so"J Jope was
held that the thin loose layer would bond well enough to the piston pore |
stone-vane structure. When torsion tests^were made, however, it was found f
that slippage often occurred between specimen top and the piston pore stone
without involvement of the interior of the specimen to much extent. More-
over disassembly of the specimen and porestones after torsion testing |
revealed that the material at the top of the specimen was much softer than
that at the bottom and should not be expected to be as strong.
Immediately a new procedure of torsion testing was devised wherein the |
vertical pressure on the specimen was brought up to that originally existing
during consolidation in the spring oedometer with the hope that this could .
dig the vanes into the top of the specimen and secure a f.0od/nnp0"Shpngrd1P-ina I
This was somewhat successful. The vertical pressure on the specimen during
torsion tlsti^n^ should probably be kept at that during consolidation anyway
for ess likelyhood of disturbance of the specimen. With fixed upper and |
lower specimenporestones about 1/2 of the vertical pressure is lost during •
extrusion of the specimen in the triaxial confining chamber and should be
replaced before torsion. As this fraction was apparently unaffected by |
elimination of the loose layer and piston porestone o-nngs in * ™"«J I
specimen loading procedure some other reasons for the loss have been sought.
Loss of vertical pressure on the soil skeleton Curing unsheathing is |
oresentlv believed to be due to (1) some back lash in the pedestal pins and
£a?1nfshea?n holes and (2) some specimen overconsolidation caused by excess
piston pressure on the specimen generated by friction drag bet«een the |
teflon coated sheath and the specimen. As the results of the effect are •
apparently of little consequence at the present rough stage of development
ofPPtheenmetyhodf and useful correlations and comparisons between specimens were .
being made a further change in methodology was not instituted. One change |J
might be to grease the inside of the oedometer sheath contacted by the
specimen but this would make temporary adherence of the acrylic paint marker
stripes difficult. H
C. Experimental Plan and Independent Variables Used
Table B-I 1 summarizes the experimental plan. Each box under columns I
test These Brazil test specimens are denoted by "B" in the boxes
columns Cl and C2.
The boxes under the C3 columns which have entries represent specimens
prepared by standard pr0ctor compaction and tests by pneumatic arm oedometer
B-4
I
I
image:
1
partially support this fear and many of the main series of specimens were «,
loaded in the spring oedometers using the o-rings but with some loose |
material sprinkled on top of the compacted specimen within the o-ring before
insertion of the piston and application of spring pressure. Previous static
compactions with the spring alone without proctor compaction had shown •
attainment of rather high density although not as high as by some standard •
proctorings and all modified proctorings For this reason so"J Jope was
held that the thin loose layer would bond well enough to the piston pore |
stone-vane structure. When torsion tests^were made, however, it was found f
that slippage often occurred between specimen top and the piston pore stone
without involvement of the interior of the specimen to much extent. More-
over disassembly of the specimen and porestones after torsion testing |
revealed that the material at the top of the specimen was much softer than
that at the bottom and should not be expected to be as strong.
Immediately a new procedure of torsion testing was devised wherein the |
vertical pressure on the specimen was brought up to that originally existing
during consolidation in the spring oedometer with the hope that this could .
dig the vanes into the top of the specimen and secure a f.0od/nnp0"Shpngrd1P-ina I
This was somewhat successful. The vertical pressure on the specimen during
torsion tlsti^n^ should probably be kept at that during consolidation anyway
for ess likelyhood of disturbance of the specimen. With fixed upper and |
lower specimenporestones about 1/2 of the vertical pressure is lost during •
extrusion of the specimen in the triaxial confining chamber and should be
replaced before torsion. As this fraction was apparently unaffected by |
elimination of the loose layer and piston porestone o-nngs in * ™"«J I
specimen loading procedure some other reasons for the loss have been sought.
Loss of vertical pressure on the soil skeleton Curing unsheathing is |
oresentlv believed to be due to (1) some back lash in the pedestal pins and
£a?1nfshea?n holes and (2) some specimen overconsolidation caused by excess
piston pressure on the specimen generated by friction drag bet«een the |
teflon coated sheath and the specimen. As the results of the effect are •
apparently of little consequence at the present rough stage of development
ofPPtheenmetyhodf and useful correlations and comparisons between specimens were .
being made a further change in methodology was not instituted. One change |J
might be to grease the inside of the oedometer sheath contacted by the
specimen but this would make temporary adherence of the acrylic paint marker
stripes difficult. H
C. Experimental Plan and Independent Variables Used
Table B-I 1 summarizes the experimental plan. Each box under columns I
test These Brazil test specimens are denoted by "B" in the boxes
columns Cl and C2.
The boxes under the C3 columns which have entries represent specimens
prepared by standard pr0ctor compaction and tests by pneumatic arm oedometer
B-4
I
I
image:
 TABLE B-I 1. Experimental Design - TOSCO II, Lurgi, and
Mixtures of mellowed TOSCO and Mellowed Lurgi With
Burned and Unburned TOSCO And Unmellowed Lurgi
Spent Shale
Material
Unburned TOSCO
10% Burned TOS
90% Unburned
TOSCO II
20% Burned Tos
80% Unburned
TOSCO II
30% Burned TOS
70% Unburned
TOSCO 11
II
:o,
Spring Oedometer and Triaxial Torsion Tests
Later
Satd.?
Yes*
No
Yes*
No
Ampl e +
Moisture
:o
Yes+
No
Ampl e +
Moisture
CO
Yes*
NO
Ample +
Moisture
Ample Moisture
75% Mellowed Burned
TOSCO, 25% Burned
50% Mellowed B
TOSCO, 50% TOS
_Am pie Moisture
• Lurgi
urned
CO II
Yes+
Yes+
Yes+
No
Ampl e +
Moisture
75% Mellowed Lurgi
25% Unmellowed
Ample Moisture
50% Mellowed Lurgi
50% Unmellowed
Yes+
Yes+
Cl = Modified Proc.
Tl
22%
54 B
22%
55**
23
56 B
23%
57**
28%
53 B
24%
75 B
24%
67
29%
66 B
25%
76 B
25%
77
34%
74
55%
92 B
40%
93 B
22%
51 B
22%
50
27%
52 B
25%
82 B
25%
84 B
T2
22%
34 B
22%
35
23%
39 B
23%
49
28%
62 B
24%
60 B
24%
63
29%
61 B
25%
58 B
25%
68
34%
59
55%
8& B
40%
87 B
22%
72 B
22%
73
27%
69 B
25%
83 B
25%
85 B
T3
22%
46 B
22%
47
23%
48 B i
36 B
25%
40 B
22%
43 B
22%
44
27%
45 B
C2 = Standard Proc.
Tl
25%
71 B
25%
91
27%
70 B
27%
90
24%
80 B
24%
81
28%
89 B
28%
88
30%
78 B
30%
79
T2
25%
32 B
25%
33
27%
31 B
27%
30
24%
37 B
24%
38
28%
41 B
28%
42
'
30%
64 B
30%
65
!
Pneumatic Arm Oedometer
C, = Standard Proc.
except with * which
is Modified Proc.
*
22% 25% 20% 30%
H20
!
1
* *
23% 28% • 22% 27% 33%
I
* *
24% 29% ' 24% 29% 34%
1
* *
25% 34% ! 28% 33% 39%
* '
55% !
40% 45 i
* * i
22% 27% ; 30% 35% 40%
i
* '.
25% 25 ! 30 35
* " ;
25% 25 ; 30 35
* Modified Proctor !
+ Permeability determined also !
**Permeability determined out of order resulting in "yes" instead of "No" later saturation. ,-
B-5
image:
TABLE B-I 1. Experimental Design - TOSCO II, Lurgi, and
Mixtures of mellowed TOSCO and Mellowed Lurgi With
Burned and Unburned TOSCO And Unmellowed Lurgi
Spent Shale
Material
Unburned TOSCO
10% Burned TOS
90% Unburned
TOSCO II
20% Burned Tos
80% Unburned
TOSCO II
30% Burned TOS
70% Unburned
TOSCO 11
II
:o,
Spring Oedometer and Triaxial Torsion Tests
Later
Satd.?
Yes*
No
Yes*
No
Ampl e +
Moisture
:o
Yes+
No
Ampl e +
Moisture
CO
Yes*
NO
Ample +
Moisture
Ample Moisture
75% Mellowed Burned
TOSCO, 25% Burned
50% Mellowed B
TOSCO, 50% TOS
_Am pie Moisture
• Lurgi
urned
CO II
Yes+
Yes+
Yes+
No
Ampl e +
Moisture
75% Mellowed Lurgi
25% Unmellowed
Ample Moisture
50% Mellowed Lurgi
50% Unmellowed
Yes+
Yes+
Cl = Modified Proc.
Tl
22%
54 B
22%
55**
23
56 B
23%
57**
28%
53 B
24%
75 B
24%
67
29%
66 B
25%
76 B
25%
77
34%
74
55%
92 B
40%
93 B
22%
51 B
22%
50
27%
52 B
25%
82 B
25%
84 B
T2
22%
34 B
22%
35
23%
39 B
23%
49
28%
62 B
24%
60 B
24%
63
29%
61 B
25%
58 B
25%
68
34%
59
55%
8& B
40%
87 B
22%
72 B
22%
73
27%
69 B
25%
83 B
25%
85 B
T3
22%
46 B
22%
47
23%
48 B i
36 B
25%
40 B
22%
43 B
22%
44
27%
45 B
C2 = Standard Proc.
Tl
25%
71 B
25%
91
27%
70 B
27%
90
24%
80 B
24%
81
28%
89 B
28%
88
30%
78 B
30%
79
T2
25%
32 B
25%
33
27%
31 B
27%
30
24%
37 B
24%
38
28%
41 B
28%
42
'
30%
64 B
30%
65
!
Pneumatic Arm Oedometer
C, = Standard Proc.
except with * which
is Modified Proc.
*
22% 25% 20% 30%
H20
!
1
* *
23% 28% • 22% 27% 33%
I
* *
24% 29% ' 24% 29% 34%
1
* *
25% 34% ! 28% 33% 39%
* '
55% !
40% 45 i
* * i
22% 27% ; 30% 35% 40%
i
* '.
25% 25 ! 30 35
* " ;
25% 25 ; 30 35
* Modified Proctor !
+ Permeability determined also !
**Permeability determined out of order resulting in "yes" instead of "No" later saturation. ,-
B-5
image:
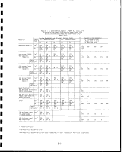 at five consolidation pressures up to 310 psi. The water contents chosen
were those for optimum moisture for maximum dry density for standard and
modified proctor and several water contents including some wetter than •
optimum for standard proctor, four or five water contents total, for each of •
the nine spent shale raw material types or mixtures tests by the other
methods . The loading number for the spring oedometer experiments is given BJ
in the lower left corner of each applicable box in Table B-I 1. This number |
is followed by B if Brazil tests specimens were to also be prepared. The
water to be added, percent dry basis, in preparing the specimens is entered -.
in the upper area of each box. •
Cl represents modified proctor compaction, C2 standard proctor com-
paction. Tl, T2, and T3 represent curing times of nominally 2, 4, and 8 •
weeks respectively. "Yes" represents that later "saturation" was to be •
carried out by means of permeability measurement operations, "No" represents
that the spring oedometer specimen was to be torsion tested without m
saturation after consolidation and before torsion testing. |j
I
I
1
I
I
I
I
I
I
I
I
I
I
image:
at five consolidation pressures up to 310 psi. The water contents chosen
were those for optimum moisture for maximum dry density for standard and
modified proctor and several water contents including some wetter than •
optimum for standard proctor, four or five water contents total, for each of •
the nine spent shale raw material types or mixtures tests by the other
methods . The loading number for the spring oedometer experiments is given BJ
in the lower left corner of each applicable box in Table B-I 1. This number |
is followed by B if Brazil tests specimens were to also be prepared. The
water to be added, percent dry basis, in preparing the specimens is entered -.
in the upper area of each box. •
Cl represents modified proctor compaction, C2 standard proctor com-
paction. Tl, T2, and T3 represent curing times of nominally 2, 4, and 8 •
weeks respectively. "Yes" represents that later "saturation" was to be •
carried out by means of permeability measurement operations, "No" represents
that the spring oedometer specimen was to be torsion tested without m
saturation after consolidation and before torsion testing. |j
I
I
1
I
I
I
I
I
I
I
I
I
I
image:
 II. DISCUSSION OF RESULTS
A. Permeability
Permeability coefficients were more reproducible and self consistent
than expected. Perhaps the high consolidation pressure (280 psi) contrib-
uted to minimum channeling along the wall of the oedometer sheath as well
as to minimizing flow between peds of soil fabric which may produce vari-
able permeabilities at lower vertical pressures. Also bimodaV permeation
channel development may be minimized by the compaction at optimum water
content often used in producing these specimens. '
During mixing of material wetter than optimum, granulation occurred in
which pellets of material formed which seemed to be wetter on Itheir surface
than inside. This seeming tendency toward synergesis probably!disappears as
mineral hydrates form during curing but during compaction and initial
consolidation the wet surface of the granules may allow smearing of their
surfaces with development of parallel alignment of any clay-like mineral
platelets present during compaction by proctor hammer. This may account for
some of the observed lower permeability at wetter than optimum'moisture
content compared to a dryer moisture content.
Reduced permeability for compacted specimens of most spent shales at
wetter than optimum moisture content was observed. Figure B-IJ 1 shows this
effect for both standard and modified proctored specimens madej from mixtures
of burned TOSCO and unburned TOSCO II spent shale. However, the effect i-s
weak or nil for 100% unburned TOSCO II material, at four weeks, curing time.
Of course some other factor may be influential with these cementing mate-
rials such as increased hydrate formation at higher water contents.
Figures B-II 2, 3, 4, 5, 6, and 7 show a general but not universal mild
downward trend of permeability at increasing curing times, especially beyond
30 days with the exception of the more cementaceous 70% TOSCO 'II with 30%
burned TOSCO blend and the Lurgi spent shale which showed increased per-
meabilities beyond 30 days even though the latter had shown a decrease up to
30 days. The lower permeability at wetter than optimum water content is
evident again with the Lurgi material in Figure B-II 6 when the 22% water
added is compared with the 27% water added curves within the modified
proctor constraint (square data points).
It is difficult to make sense of the sketchy permeability; vs curing
time curves of Figures B-II 2, 3, 4, 5 and 6. This is perhaps caused by the
irregular course of mineral hydrate formation and disappearance as curing
time increases. Reduction of the mineral grain density (determined by the
Beckman air pycnometer) of pulverized 48 C oven dried material from the
torsion test is assumed to be an indication of the extent of h,ydrate water
incorporated in cementaceous and/or bulk producing species in ;the specimen.
Figures B-II 8, 9, 10, 11, and 12 plot the remarkable course qf the extent
of hydrate water present in the specimens after torsion testirig as indicated
by mineral grain density. If a lower mineral grain density indicates more
mineral hydrate water there is an appreciable maximum in mineral hydrate
B-7
image:
II. DISCUSSION OF RESULTS
A. Permeability
Permeability coefficients were more reproducible and self consistent
than expected. Perhaps the high consolidation pressure (280 psi) contrib-
uted to minimum channeling along the wall of the oedometer sheath as well
as to minimizing flow between peds of soil fabric which may produce vari-
able permeabilities at lower vertical pressures. Also bimodaV permeation
channel development may be minimized by the compaction at optimum water
content often used in producing these specimens. '
During mixing of material wetter than optimum, granulation occurred in
which pellets of material formed which seemed to be wetter on Itheir surface
than inside. This seeming tendency toward synergesis probably!disappears as
mineral hydrates form during curing but during compaction and initial
consolidation the wet surface of the granules may allow smearing of their
surfaces with development of parallel alignment of any clay-like mineral
platelets present during compaction by proctor hammer. This may account for
some of the observed lower permeability at wetter than optimum'moisture
content compared to a dryer moisture content.
Reduced permeability for compacted specimens of most spent shales at
wetter than optimum moisture content was observed. Figure B-IJ 1 shows this
effect for both standard and modified proctored specimens madej from mixtures
of burned TOSCO and unburned TOSCO II spent shale. However, the effect i-s
weak or nil for 100% unburned TOSCO II material, at four weeks, curing time.
Of course some other factor may be influential with these cementing mate-
rials such as increased hydrate formation at higher water contents.
Figures B-II 2, 3, 4, 5, 6, and 7 show a general but not universal mild
downward trend of permeability at increasing curing times, especially beyond
30 days with the exception of the more cementaceous 70% TOSCO 'II with 30%
burned TOSCO blend and the Lurgi spent shale which showed increased per-
meabilities beyond 30 days even though the latter had shown a decrease up to
30 days. The lower permeability at wetter than optimum water content is
evident again with the Lurgi material in Figure B-II 6 when the 22% water
added is compared with the 27% water added curves within the modified
proctor constraint (square data points).
It is difficult to make sense of the sketchy permeability; vs curing
time curves of Figures B-II 2, 3, 4, 5 and 6. This is perhaps caused by the
irregular course of mineral hydrate formation and disappearance as curing
time increases. Reduction of the mineral grain density (determined by the
Beckman air pycnometer) of pulverized 48 C oven dried material from the
torsion test is assumed to be an indication of the extent of h,ydrate water
incorporated in cementaceous and/or bulk producing species in ;the specimen.
Figures B-II 8, 9, 10, 11, and 12 plot the remarkable course qf the extent
of hydrate water present in the specimens after torsion testirig as indicated
by mineral grain density. If a lower mineral grain density indicates more
mineral hydrate water there is an appreciable maximum in mineral hydrate
B-7
image:
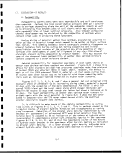 % NOTATIONS ARE WATER
INITIALLY ADDED TO MIX
OPEN SYMBOLS - OPTIMUM MOISTURE
SOLID SYMBOLS - WET OF OPTIMUM
10
-9
100 9O 8O
PERCENT TOSCOII WITH BURNED TOSCO
Figure B-II 1. Permeability of Mixtures of Burned TOSCO And Unburned
TOSCO Spent Shale After Approximately Four Weeks Curing
in Spring Oedometers.
B-8
1
1
I
I
I
I
I
I
I
1
1
1
I
I
1
image:
% NOTATIONS ARE WATER
INITIALLY ADDED TO MIX
OPEN SYMBOLS - OPTIMUM MOISTURE
SOLID SYMBOLS - WET OF OPTIMUM
10
-9
100 9O 8O
PERCENT TOSCOII WITH BURNED TOSCO
Figure B-II 1. Permeability of Mixtures of Burned TOSCO And Unburned
TOSCO Spent Shale After Approximately Four Weeks Curing
in Spring Oedometers.
B-8
1
1
I
I
I
I
I
I
I
1
1
1
I
I
1
image:
 10
-5
10
-6 _
Figure B-II 2. Permeability of 100% TOSCO II Spent Shale (TOSCO 100)
10
- 5
10
- 6
J_
Figure B-II 3.
Permeability of 90% TOSCO II
Shale (TOSCO 90)
- 10% Burned TOSCO Spent
lO
o
m
< 10
UJ
X
<r
LU
CL
10
-7
-8
29%
TRIANGLES STANDARD PROCTOR
SQUARES MODIFED PROCTOR
SOLID SYMBOLS WET OF OPTIMUM
I
_L
I
Figure B-II 4.
10 20 30 4O 50 60 ; 7O
CURING TIME,DAYS !
Permeability of 80% TOSCO II - 20% Burned TOS:CO Spent
Shale (TOSCO 80) |
B-9 !
80
image:
10
-5
10
-6 _
Figure B-II 2. Permeability of 100% TOSCO II Spent Shale (TOSCO 100)
10
- 5
10
- 6
J_
Figure B-II 3.
Permeability of 90% TOSCO II
Shale (TOSCO 90)
- 10% Burned TOSCO Spent
lO
o
m
< 10
UJ
X
<r
LU
CL
10
-7
-8
29%
TRIANGLES STANDARD PROCTOR
SQUARES MODIFED PROCTOR
SOLID SYMBOLS WET OF OPTIMUM
I
_L
I
Figure B-II 4.
10 20 30 4O 50 60 ; 7O
CURING TIME,DAYS !
Permeability of 80% TOSCO II - 20% Burned TOS:CO Spent
Shale (TOSCO 80) |
B-9 !
80
image:
 I
1
io-7
io-8
to-9
1 1 i 1 1 i i
TOS 70
584I
vvfj 25%
28%
— —
34%
74
^"""---•^5976 25% TRIANGLES STAND. PROC.
• D SQUARES MODIFIED PROC.
! I I 1 1 1 1
I
1
I
1
•n
i
1
Figure B-II 5. Permeability of 70% TOSCO II - 30% Burned TOSCO Spent Shale
(TOSCO 70) •
1
io-5
o
LD
V)
\
O
"
H ID'6
_J
CO
<i
LU
2
CC
LJ
Q.
ID"7
1 , 1 1 i i |
| t 1 1 1 • '
|-| LURGI
22% A"s>1\>^ 72 ^ ~~ ^43
78\ ^ " 22%
30%\ 22%
52 N,
^^^\ 3 0 % ^-^"27%
^^J 27% ^^^-"^
SOLID SYMBOLS WET OF OPTIMUM
i 1 I 1 i I 1
1
1
1
mm
1
0 IO 20 30 4O 50 ' 60 70 80 "*
CURING TIME, DAYS m
Figure B-II 6. Permeability of Lurgi Spent Shale
I
B
i
B-10 : M
image:
I
1
io-7
io-8
to-9
1 1 i 1 1 i i
TOS 70
584I
vvfj 25%
28%
— —
34%
74
^"""---•^5976 25% TRIANGLES STAND. PROC.
• D SQUARES MODIFIED PROC.
! I I 1 1 1 1
I
1
I
1
•n
i
1
Figure B-II 5. Permeability of 70% TOSCO II - 30% Burned TOSCO Spent Shale
(TOSCO 70) •
1
io-5
o
LD
V)
\
O
"
H ID'6
_J
CO
<i
LU
2
CC
LJ
Q.
ID"7
1 , 1 1 i i |
| t 1 1 1 • '
|-| LURGI
22% A"s>1\>^ 72 ^ ~~ ^43
78\ ^ " 22%
30%\ 22%
52 N,
^^^\ 3 0 % ^-^"27%
^^J 27% ^^^-"^
SOLID SYMBOLS WET OF OPTIMUM
i 1 I 1 i I 1
1
1
1
mm
1
0 IO 20 30 4O 50 ' 60 70 80 "*
CURING TIME, DAYS m
Figure B-II 6. Permeability of Lurgi Spent Shale
I
B
i
B-10 : M
image:
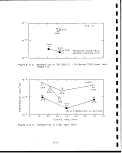 ,-4
ID
" 5
o
UJ
to
io
-6
o
m
UJ
o.
io
-8
o
-9
25%LURGI
MELLOWED
55%
SQUARES-MODIFIED PROCTOR
0 10 20 30 40 50
CURING TIME, DAYS
60
70
80
F:igure B-II 7. Permeability of Mellowed Lurgi (M14) Mixed into Lurgi and
Mellowed Burned TOSCO (M-15) Mixed into TOSCO II and into
Burned TOSCO Spent Shale ',
B-ll
image:
,-4
ID
" 5
o
UJ
to
io
-6
o
m
UJ
o.
io
-8
o
-9
25%LURGI
MELLOWED
55%
SQUARES-MODIFIED PROCTOR
0 10 20 30 40 50
CURING TIME, DAYS
60
70
80
F:igure B-II 7. Permeability of Mellowed Lurgi (M14) Mixed into Lurgi and
Mellowed Burned TOSCO (M-15) Mixed into TOSCO II and into
Burned TOSCO Spent Shale ',
B-ll
image:
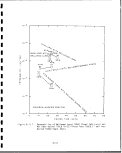 2.74 ,
2.72Q- UNM01STENED
,0%
2.7 O
2.68
2.66
2.64
TOSCO 100
32
A 2 5%
22%
47
D
D
46
22% ~
35
Q22%
33 34
A D
25% 22%
JL
_L
Figure B-II 8. Mineral Grain Density vs Time for TOSCO
100 Spent Shale
2.76
>r- 1
O UNMOISTENED
0%
2.74
2.60
IO
20
60
70
8O
30 40 50
CURING TIME, DAYS
Figure B-II 9. Mineral Grain Density vs Time for TOSCO 90
Spent Shale
B-12
1
1
1
1
I
I
I
I
I
I
1
1
I
1
I
I
image:
2.74 ,
2.72Q- UNM01STENED
,0%
2.7 O
2.68
2.66
2.64
TOSCO 100
32
A 2 5%
22%
47
D
D
46
22% ~
35
Q22%
33 34
A D
25% 22%
JL
_L
Figure B-II 8. Mineral Grain Density vs Time for TOSCO
100 Spent Shale
2.76
>r- 1
O UNMOISTENED
0%
2.74
2.60
IO
20
60
70
8O
30 40 50
CURING TIME, DAYS
Figure B-II 9. Mineral Grain Density vs Time for TOSCO 90
Spent Shale
B-12
1
1
1
1
I
I
I
I
I
I
1
1
I
1
I
I
image:
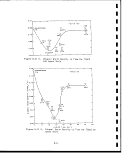 2.78
2:76 -
2.74 -
Fig. B-II 10. Mineral Grain Density vs Time"for
TOSCO 80 Spent Shale
10 20 30 40 50 60 • 70 80
2.6
Figure B-il 11. Mineral Grain Density vs Time for TOSCO 70
Spent Shale
B-13
image:
2.78
2:76 -
2.74 -
Fig. B-II 10. Mineral Grain Density vs Time"for
TOSCO 80 Spent Shale
10 20 30 40 50 60 • 70 80
2.6
Figure B-il 11. Mineral Grain Density vs Time for TOSCO 70
Spent Shale
B-13
image:
 2.64
o
UNMOISTENED
O% 50
D 52
22%D
2.58
1O 20 30 40 50
CURING TIME, DAYS
60
70
80
Figure B-II 12. Mineral Grain Density vs Time for Lurgi Spent Shale
B-14
I
I
I
I
1
I
1
1
I
I
1
1
I
1
1
I
image:
2.64
o
UNMOISTENED
O% 50
D 52
22%D
2.58
1O 20 30 40 50
CURING TIME, DAYS
60
70
80
Figure B-II 12. Mineral Grain Density vs Time for Lurgi Spent Shale
B-14
I
I
I
I
1
I
1
1
I
I
1
1
I
1
1
I
image:
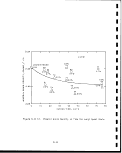 water at around 20-30 days as curing progresses with time for all unmellowed
TOSCO spent shale materials studied including unburned TOSCO II spent shale.
The Lurgi spent shale, however, showed not only less reduction in
mineral grain density after curing compared to the grain densityiof the
uncured_dry raw material but no clear cut minimum and some scatter of the
data points. Apparently a different cementation mechanism is involved with
the Lurgi material than with the TOSCO materials or else the Lurgi pilot
plant pre-hydrated the material to considerable extent during post pyrolysis
operations. ;
The interpretation of the minimum in the mineral grain density plots of
the TOSCO spent shales (Figures B-II 8, 9, 10, and 11) as due to imineral
hydrate maxima is substantiated by Figure B-II 5, introduced late'r, which
shows maxima in a low temperature evolved gas analysis water peak (at
approximately 150 C) at curing times corresponding to the minima In
mineral grain density. This peak appears to be due to a tobermorite-like
species, CSH I (CaO S^ nHgO) and ettringite. |
Figure B-II 13, shows the permeabilities found for autoclave mellowed
Lurgi (autoclave run M 14) mixtures with Lurgi, an autoclaved burned TOSCO
(M15) mixture with unburned TOSCO II and an autoclaved burned TOSto (M15)
mixture with burned TOSCO spent shale plotted vs void ratio e for certain of
the spring oedometer specimens. These were all modified proctor ispecimens
and the water added and curing times are noted by the data points plotted.
The low permeability of the 75% autoclave mellowed burned TOSCO sjpent shale
mixed with 25% of burned TOSCO spent shale is to be particularly noted in
view of its low cementation to the time curing was stopped. Before con-
cluding that the mixtures containing burned TOSCO spent shale giviing the
lowest permeability are most desirable in a liner the brittleness! of the
liner must be considered and also its ability to self heal after fracture or
during tension movement. •
/
The permeabilities were determined just before torsion testing, the
void ratios were based on mineral grain densities determined on 4J8 C oven
dried material after torsion testing and bulk dry density of the specimens
just after loading in the spring oedometers. The bulk dry density was
calculated based on water added to the wet mixture loaded into thfe
oedometer. i
Figure B-II 13 shows that in general the greater the fractio'n of burned
TOSCO spent shale that is blended into the unburned TOSCO II spen|t shale the
less the permeability at a given void ratio. Lower void ratios give lower
permeabilities also, however, as is the well known trend for ordijnary soils.
Fairly clearly the hydrate forming cementation reactions of burned TOSCO
containing spent shale reduce permeability beyond that to be expebted by
simple reduction of void ratio determined using mineral grain density. This
may be due to deposition of fine precipitate or gel within the spient shale
particles interstitial spaces or it may be due to deposition at spent shale
particle contacts that grows to invade the interstitial spaces. Growth of
cementaceous hydrates within a given porous spent shale particle should not
influence permeability of the specimen much. \
B-15
image:
water at around 20-30 days as curing progresses with time for all unmellowed
TOSCO spent shale materials studied including unburned TOSCO II spent shale.
The Lurgi spent shale, however, showed not only less reduction in
mineral grain density after curing compared to the grain densityiof the
uncured_dry raw material but no clear cut minimum and some scatter of the
data points. Apparently a different cementation mechanism is involved with
the Lurgi material than with the TOSCO materials or else the Lurgi pilot
plant pre-hydrated the material to considerable extent during post pyrolysis
operations. ;
The interpretation of the minimum in the mineral grain density plots of
the TOSCO spent shales (Figures B-II 8, 9, 10, and 11) as due to imineral
hydrate maxima is substantiated by Figure B-II 5, introduced late'r, which
shows maxima in a low temperature evolved gas analysis water peak (at
approximately 150 C) at curing times corresponding to the minima In
mineral grain density. This peak appears to be due to a tobermorite-like
species, CSH I (CaO S^ nHgO) and ettringite. |
Figure B-II 13, shows the permeabilities found for autoclave mellowed
Lurgi (autoclave run M 14) mixtures with Lurgi, an autoclaved burned TOSCO
(M15) mixture with unburned TOSCO II and an autoclaved burned TOSto (M15)
mixture with burned TOSCO spent shale plotted vs void ratio e for certain of
the spring oedometer specimens. These were all modified proctor ispecimens
and the water added and curing times are noted by the data points plotted.
The low permeability of the 75% autoclave mellowed burned TOSCO sjpent shale
mixed with 25% of burned TOSCO spent shale is to be particularly noted in
view of its low cementation to the time curing was stopped. Before con-
cluding that the mixtures containing burned TOSCO spent shale giviing the
lowest permeability are most desirable in a liner the brittleness! of the
liner must be considered and also its ability to self heal after fracture or
during tension movement. •
/
The permeabilities were determined just before torsion testing, the
void ratios were based on mineral grain densities determined on 4J8 C oven
dried material after torsion testing and bulk dry density of the specimens
just after loading in the spring oedometers. The bulk dry density was
calculated based on water added to the wet mixture loaded into thfe
oedometer. i
Figure B-II 13 shows that in general the greater the fractio'n of burned
TOSCO spent shale that is blended into the unburned TOSCO II spen|t shale the
less the permeability at a given void ratio. Lower void ratios give lower
permeabilities also, however, as is the well known trend for ordijnary soils.
Fairly clearly the hydrate forming cementation reactions of burned TOSCO
containing spent shale reduce permeability beyond that to be expebted by
simple reduction of void ratio determined using mineral grain density. This
may be due to deposition of fine precipitate or gel within the spient shale
particles interstitial spaces or it may be due to deposition at spent shale
particle contacts that grows to invade the interstitial spaces. Growth of
cementaceous hydrates within a given porous spent shale particle should not
influence permeability of the specimen much. \
B-15
image:
 -o
+•>
ro
-P
•r—
•5.
-a
QJ
0)
s_
S-
o
CJ
co
cu
r——
to
-c:
CO
O)
CL
oo
'O
O)
Q.
O)
S-
cn
•r—
u_
B-16
1
I
I
I
1
I
1
I
I
I
I
1
I
I
I
i
I
I
I
image:
-o
+•>
ro
-P
•r—
•5.
-a
QJ
0)
s_
S-
o
CJ
co
cu
r——
to
-c:
CO
O)
CL
oo
'O
O)
Q.
O)
S-
cn
•r—
u_
B-16
1
I
I
I
1
I
1
I
I
I
I
1
I
I
I
i
I
I
I
image:
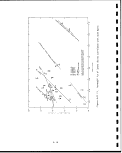 ft
B. Peak Angle of Internal Friction P Related to Self Healing and
Its Trade off with Permeability
Figure B-II 14 shows a dilemma in trying to compound a liner material
made from any mixture made from burned TOSCO and unburned TOSCO Ijl spent oil
shale. Both low permeabilities and low peak friction angles are desirable
but they seem to be nearly mutually exclusive. A low friction an;gle allows
easier or more extensive rapidly self healing. A high peak friction angle
is shown by the more cemented specimens.
The peak angle of internal friction plotted in Figure B-II 14 is more
easily reduced from the torsion data than a normalized peak shear! strength.
Also Op may be directly used in one model of the rapid self healing
process. ;
For a silty material (as many of the specimens here studied are) the
torsion shear strength measurements give shear strengths proportibnal to the
normal pressure on the failure plane (which is practically the same as the
vertical pressure on the specimen). This is because the specimens are small
enough so relief of pore pressure of a silty material is rapid and also
because cementation in these specimens is nil. For such specimens in such a
test that is not too quickly performed the peak shear strength and residual
shear strength data obtained at known vertical pressure can be reduced to
0p and Q'p. respectively.
Many of the peak friction angles of the more cemented specimens
measured are not as high as they should be because the looser, less
compacted, specimen material near the top pore stone tends to fail before
the more representative center of the specimen. Thus the dilemma in trying
to attain low cementation as well as low permeability is probably more
serious than even indicated by Figure B-II 14. Also probably few; if any of
the peak friction angles determined by the present torsion apparatus are as
high as they should be for the more cemented specimens due to eccentricity
of the rotating piston and top pore stone and vanes due to any noh trueness
or bowing of the piston rods which can cause development of much side thrust
without registering of much torque. This would be an insignificant factor,
however, with a soft specimen which can deflect to accommodate a little side
thrust with no rupture. ]
The curve of Figure B-II 15, permeability vs peak friction apgle, for
the Lurgi spent shale seems to run counter to the curve of Figure! B-II 14
for TOSCO spent shales. There appears to be a difference in the materials
causing for the Lurgi a reduced permeability with reduced angle biit for
TOSCO materials an increased permeability with reduced angle. For TOSCO
spent shale of Figure B-II 14 less cementaceous species seem to be the cause
of low friction angles but for Lurgi spent shale of Figure B-II 15 greater
water content may be operative, at least at the short curing times involved.
With the fast setting TOSCO mixtures perhaps the water contents role in
softening a material is overshadowed by rapid cementation. With (longer
curing times perhaps the slow setting Lurgi material would more resemble the
TOSCO mixtures in its permeability vs friction angle plot.
3-17
image:
ft
B. Peak Angle of Internal Friction P Related to Self Healing and
Its Trade off with Permeability
Figure B-II 14 shows a dilemma in trying to compound a liner material
made from any mixture made from burned TOSCO and unburned TOSCO Ijl spent oil
shale. Both low permeabilities and low peak friction angles are desirable
but they seem to be nearly mutually exclusive. A low friction an;gle allows
easier or more extensive rapidly self healing. A high peak friction angle
is shown by the more cemented specimens.
The peak angle of internal friction plotted in Figure B-II 14 is more
easily reduced from the torsion data than a normalized peak shear! strength.
Also Op may be directly used in one model of the rapid self healing
process. ;
For a silty material (as many of the specimens here studied are) the
torsion shear strength measurements give shear strengths proportibnal to the
normal pressure on the failure plane (which is practically the same as the
vertical pressure on the specimen). This is because the specimens are small
enough so relief of pore pressure of a silty material is rapid and also
because cementation in these specimens is nil. For such specimens in such a
test that is not too quickly performed the peak shear strength and residual
shear strength data obtained at known vertical pressure can be reduced to
0p and Q'p. respectively.
Many of the peak friction angles of the more cemented specimens
measured are not as high as they should be because the looser, less
compacted, specimen material near the top pore stone tends to fail before
the more representative center of the specimen. Thus the dilemma in trying
to attain low cementation as well as low permeability is probably more
serious than even indicated by Figure B-II 14. Also probably few; if any of
the peak friction angles determined by the present torsion apparatus are as
high as they should be for the more cemented specimens due to eccentricity
of the rotating piston and top pore stone and vanes due to any noh trueness
or bowing of the piston rods which can cause development of much side thrust
without registering of much torque. This would be an insignificant factor,
however, with a soft specimen which can deflect to accommodate a little side
thrust with no rupture. ]
The curve of Figure B-II 15, permeability vs peak friction apgle, for
the Lurgi spent shale seems to run counter to the curve of Figure! B-II 14
for TOSCO spent shales. There appears to be a difference in the materials
causing for the Lurgi a reduced permeability with reduced angle biit for
TOSCO materials an increased permeability with reduced angle. For TOSCO
spent shale of Figure B-II 14 less cementaceous species seem to be the cause
of low friction angles but for Lurgi spent shale of Figure B-II 15 greater
water content may be operative, at least at the short curing times involved.
With the fast setting TOSCO mixtures perhaps the water contents role in
softening a material is overshadowed by rapid cementation. With (longer
curing times perhaps the slow setting Lurgi material would more resemble the
TOSCO mixtures in its permeability vs friction angle plot.
3-17
image:
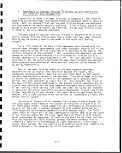 0
a:
m
i
O
03S/wo 'Ainiavswysd
/
m
m
o
m
IO
CO
UJ
UJ
OL
UJ
Q
m
>o
O)
rcf
c.
01
o.
CO
CD
i- •
13 O)
cn
f- c
o *C
>> c
r -P
•i- O
(C S-
<D U_
ai ro
a. a)
D_
i—i -a
i at
co -t->
to
O) i—
S- 01
3 S-
CD S-
•<- o
-P C
c o
CU -r-
CO O
o si
CJ) U_
CO
O -^
J— f^
O)
4— Q-
•i- -O
J3 O)
rtJ -!-»
O) rtS
S- 'til
O) S_
D- S-
O
O
«3" CO
r-1 O)
S-
CQ -i-
s:
a>
S- O) O>
O^ TCJ ^^
•r- ^= C
U_ 00 «=C
B- 18
1
I
I
I
1
e
i
i
i
i
i
i
i
i
i
i
i
i
i
image:
0
a:
m
i
O
03S/wo 'Ainiavswysd
/
m
m
o
m
IO
CO
UJ
UJ
OL
UJ
Q
m
>o
O)
rcf
c.
01
o.
CO
CD
i- •
13 O)
cn
f- c
o *C
>> c
r -P
•i- O
(C S-
<D U_
ai ro
a. a)
D_
i—i -a
i at
co -t->
to
O) i—
S- 01
3 S-
CD S-
•<- o
-P C
c o
CU -r-
CO O
o si
CJ) U_
CO
O -^
J— f^
O)
4— Q-
•i- -O
J3 O)
rtJ -!-»
O) rtS
S- 'til
O) S_
D- S-
O
O
«3" CO
r-1 O)
S-
CQ -i-
s:
a>
S- O) O>
O^ TCJ ^^
•r- ^= C
U_ 00 «=C
B- 18
1
I
I
I
1
e
i
i
i
i
i
i
i
i
i
i
i
i
i
image:
 C. Residual Shear Strength and Critical Void Ratio Related j
to Slope Stability
- - - - I
Data obtained as 0p and 0R can be used in a soil mechanics model
where drainage of pore pressure is rapid. Drainage of pore pressure in the
field is relatively rapid, even for a thick liner layer, if rate^of shear is
relatively slow. However if pore pressure drainage is not rapid la more
complicated and hazardous case must be considered. '
Before the liner shears and therefore before the soil skeleton in the
shear zone might be compressed (if its void ratio is above the "critical
void ratio" for the material) the peak shear strength may be used to esti-
mate the maximum angle of inclination of a liner below a spent shale pile
before the pile will slide through shear failure in the liner parallel to
the weak liner. But if the liner does begin to shear at some place due to
the peak strength being locally exceeded and if the liner material does
contract during shear (the "critical void ratio" of the shearing ;liner being
lower than the emplaced liner void ratio) and if pore water pressure can
build up in the plane or zone of failure trouble is probable. Pore pressure
will reduce the effective vertical pressure a.1 and reduce the effective
peak shear strength T ' of the section of liner beginning to shear. The
reduced strength of the initially shearing section and the strain occurring
shifts the stress toward the remaining intact section of liner and its
strength may also be exceeded. Thus a "progressive failure" occurs which
results in a slide. ;
The most conservative design strengthwise (and possibly the linost
expensive) is (1) to design using the weak strength developed after shearing
occurs with no drainage where the effective normal stressaHs reduced and T'
is also reduced (since? =a" cos 0) or (2) to design with the low'residual
shear strength T which is developed as the thrust of the failure shear
plane increases vand any cementation or particle to particle interlocking is
broken and any clayish mineral species platelets are aligned parallel to the
plane thus producing a more slippery shear plane), whichever is lowest. It
was beyond the scope of this present work to test the true residual shear
strength of the many materials and conditions of emplacement ring shear
apparatus. I
The change in void ratio from emplaced void ratio to the critical void
ratio at failure has not been measured in the torsion apparatus used in this
study. Probably it is best measured (for plastic specimens) in a
conventional "triaxial" soil testing apparatus in which the volume of the
specimen can be measured throughout a test. Attempts to make this
measurement on cemented specimens will probably be futile, however. It
should be done on good candidate (non cementing) liner materials. The
change in void ratio at critical conditions (where shearing, particularly
simple shearing, has caused the specimen to reach a steady state) helps
determine the pore pressure during failure and its degree of influence on
the shear strength during failure. i
i
D. Brittleness Index Related to Cementation and Permeability
B-19
image:
C. Residual Shear Strength and Critical Void Ratio Related j
to Slope Stability
- - - - I
Data obtained as 0p and 0R can be used in a soil mechanics model
where drainage of pore pressure is rapid. Drainage of pore pressure in the
field is relatively rapid, even for a thick liner layer, if rate^of shear is
relatively slow. However if pore pressure drainage is not rapid la more
complicated and hazardous case must be considered. '
Before the liner shears and therefore before the soil skeleton in the
shear zone might be compressed (if its void ratio is above the "critical
void ratio" for the material) the peak shear strength may be used to esti-
mate the maximum angle of inclination of a liner below a spent shale pile
before the pile will slide through shear failure in the liner parallel to
the weak liner. But if the liner does begin to shear at some place due to
the peak strength being locally exceeded and if the liner material does
contract during shear (the "critical void ratio" of the shearing ;liner being
lower than the emplaced liner void ratio) and if pore water pressure can
build up in the plane or zone of failure trouble is probable. Pore pressure
will reduce the effective vertical pressure a.1 and reduce the effective
peak shear strength T ' of the section of liner beginning to shear. The
reduced strength of the initially shearing section and the strain occurring
shifts the stress toward the remaining intact section of liner and its
strength may also be exceeded. Thus a "progressive failure" occurs which
results in a slide. ;
The most conservative design strengthwise (and possibly the linost
expensive) is (1) to design using the weak strength developed after shearing
occurs with no drainage where the effective normal stressaHs reduced and T'
is also reduced (since? =a" cos 0) or (2) to design with the low'residual
shear strength T which is developed as the thrust of the failure shear
plane increases vand any cementation or particle to particle interlocking is
broken and any clayish mineral species platelets are aligned parallel to the
plane thus producing a more slippery shear plane), whichever is lowest. It
was beyond the scope of this present work to test the true residual shear
strength of the many materials and conditions of emplacement ring shear
apparatus. I
The change in void ratio from emplaced void ratio to the critical void
ratio at failure has not been measured in the torsion apparatus used in this
study. Probably it is best measured (for plastic specimens) in a
conventional "triaxial" soil testing apparatus in which the volume of the
specimen can be measured throughout a test. Attempts to make this
measurement on cemented specimens will probably be futile, however. It
should be done on good candidate (non cementing) liner materials. The
change in void ratio at critical conditions (where shearing, particularly
simple shearing, has caused the specimen to reach a steady state) helps
determine the pore pressure during failure and its degree of influence on
the shear strength during failure. i
i
D. Brittleness Index Related to Cementation and Permeability
B-19
image:
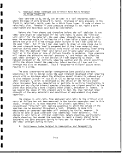 E
In calculating the brittleness index two shear strength values T and
TR must be not only be normalized to the same vertical pressure but good, n
0p and 0R data is needed as a working number is derived from the §|
difference between two large numbers. This decreases the chances for a good
brittleness index, BI, result compared to those for a good 0p. This is «.
believed to be one reason correlations using 0p show less scatter than •
those using the brittleness index. On the other hand this is not a **'
substitute for BI which is retained in spite of its imprecision for certain
illuminating correlations. flj
Figure B-II 16 is a comparison of BI and 0p for Lurgi, TOSCO, and the
mixtures involving mellowed material. «
Figure B-II 17 is a plot of permeability vs brittleness index of
specimens made from TOSCO 70, TOSCO 80, TOSCO 90, TOSCO 100 mixtures con-
taining mellowed materials, and Lurgi spent shale raw materials. Difficulty JB
in selecting materials giving both low permeability and low brittleness 9
index from materials giving curves on the right of the plot is evident.
Some materials of the curve on the left of the plot are, on this basis, ft
perhaps acceptable for a liner, however. These materials give a negative §|
brittleness index calculated from the quick torsion shear strengths
0p and 0R. «
The cause of a negative brittleness index seems to lie in low perme- ™
ability along with neglegible cementation. Low permeability of a specimen
in the torsion test is believed to prevent rapid drainage at the beginning ft
of torsion with development of appreciable positive pore pressure as speci- H
men distortion and contraction occurs which reduces the effective vertical
stress ° . As twist precedes the excess pore pressure drains and m
° increases causing T to rise. The result is an increasing torque vs •
tYme plot on the x-y recorder of the torsion test machine. v
For screening candidate liner materials the ability of the torsion test •
to indicate low permeability, non-cemented, simple shearing materials seems H
useful. Whether the added ability of the torsion tester to transfer con-
solidating curing specimens from oedometer to torsion tester without much 0|
sample disturbance is essential is perhaps debatable. It seems, however, p
that every opportunity should be given the specimen to demonstrate any small
extent of cementation it has achieved during aging. Disturbance would tend ™
to break the cementation before testing thus reducing the peak of the •
torsion stress strain curve.
E. Relation of Peak Friction Angle 0p and Brittleness Index ffl
BI with Initial Torsional Stiffness and Shear Modulus 6~ H
Figure B-II 18 is a correlation of peak friction angle 0p with simple m
shear modulus G obtained from the initial torsional stiffness, derived from ||
volts/degree twist on the stress strain plot. There seems to be a higher
curve for brittle material and a lower curve for soft material. ^
I
In comparing these G's with others the increase of G with confining •
stress (some 280 psi au usually existed here) must be remembered. Some of
1
v
B-20
1
I
image:
E
In calculating the brittleness index two shear strength values T and
TR must be not only be normalized to the same vertical pressure but good, n
0p and 0R data is needed as a working number is derived from the §|
difference between two large numbers. This decreases the chances for a good
brittleness index, BI, result compared to those for a good 0p. This is «.
believed to be one reason correlations using 0p show less scatter than •
those using the brittleness index. On the other hand this is not a **'
substitute for BI which is retained in spite of its imprecision for certain
illuminating correlations. flj
Figure B-II 16 is a comparison of BI and 0p for Lurgi, TOSCO, and the
mixtures involving mellowed material. «
Figure B-II 17 is a plot of permeability vs brittleness index of
specimens made from TOSCO 70, TOSCO 80, TOSCO 90, TOSCO 100 mixtures con-
taining mellowed materials, and Lurgi spent shale raw materials. Difficulty JB
in selecting materials giving both low permeability and low brittleness 9
index from materials giving curves on the right of the plot is evident.
Some materials of the curve on the left of the plot are, on this basis, ft
perhaps acceptable for a liner, however. These materials give a negative §|
brittleness index calculated from the quick torsion shear strengths
0p and 0R. «
The cause of a negative brittleness index seems to lie in low perme- ™
ability along with neglegible cementation. Low permeability of a specimen
in the torsion test is believed to prevent rapid drainage at the beginning ft
of torsion with development of appreciable positive pore pressure as speci- H
men distortion and contraction occurs which reduces the effective vertical
stress ° . As twist precedes the excess pore pressure drains and m
° increases causing T to rise. The result is an increasing torque vs •
tYme plot on the x-y recorder of the torsion test machine. v
For screening candidate liner materials the ability of the torsion test •
to indicate low permeability, non-cemented, simple shearing materials seems H
useful. Whether the added ability of the torsion tester to transfer con-
solidating curing specimens from oedometer to torsion tester without much 0|
sample disturbance is essential is perhaps debatable. It seems, however, p
that every opportunity should be given the specimen to demonstrate any small
extent of cementation it has achieved during aging. Disturbance would tend ™
to break the cementation before testing thus reducing the peak of the •
torsion stress strain curve.
E. Relation of Peak Friction Angle 0p and Brittleness Index ffl
BI with Initial Torsional Stiffness and Shear Modulus 6~ H
Figure B-II 18 is a correlation of peak friction angle 0p with simple m
shear modulus G obtained from the initial torsional stiffness, derived from ||
volts/degree twist on the stress strain plot. There seems to be a higher
curve for brittle material and a lower curve for soft material. ^
I
In comparing these G's with others the increase of G with confining •
stress (some 280 psi au usually existed here) must be remembered. Some of
1
v
B-20
1
I
image:
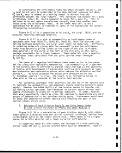 0.3
x
CO
V)
UJ
z
UJ
_1
H
H-
tr
CD
0.2
0.
-0. I
-0.2
35
85
78^9 79
74
D
86
O MIXES WITH MELLOWED MATERIALS,
MODIFIED PROCTOR '
A TOSCOS & LURGI, STD. PROCTOR
D " " " MOD. PROCTOR
40 45 5O
PEAK INTERNAL FRI CTI ON .ANGLE , 0 .DEGREES
55
Figure B-II 16. Brittleness Index Correlated with Peak Friction Angle.
B-21
image:
0.3
x
CO
V)
UJ
z
UJ
_1
H
H-
tr
CD
0.2
0.
-0. I
-0.2
35
85
78^9 79
74
D
86
O MIXES WITH MELLOWED MATERIALS,
MODIFIED PROCTOR '
A TOSCOS & LURGI, STD. PROCTOR
D " " " MOD. PROCTOR
40 45 5O
PEAK INTERNAL FRI CTI ON .ANGLE , 0 .DEGREES
55
Figure B-II 16. Brittleness Index Correlated with Peak Friction Angle.
B-21
image:
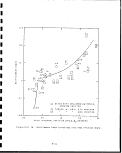 io-4t-
-0.1
o o.i
BRITTLENESS INDEX
0.2
Figure B-II 17. Permeability Compared with Brittleness Index
B-22
1
1
1
I
I
I
I
1
I
•I
I
I
1
I
1
I
I
I
I
image:
io-4t-
-0.1
o o.i
BRITTLENESS INDEX
0.2
Figure B-II 17. Permeability Compared with Brittleness Index
B-22
1
1
1
I
I
I
I
1
I
•I
I
I
1
I
1
I
I
I
I
image:
 -ooo
_ <y> co r-
o o o o
o o o o
CO CO W CO
O o O O
g
<
a •
<l «
CD
Q;
CO
H
o
a:
u.
LJ
x
j-
H- H t- I- -I $:
o
OD. PROCTOR
SQUARES
O
O
•sf
O
O
ro
O
O
<M
HJL9N3H1S
O
o
O
o
O
o"
in
O
O
O
g co
o_ ^
O CD
ro
CO
Z3
_l
ID
Q
O
2
o a:
o <
O ui
o" x
oj co
o
o
o
B-23
to
to
-a
o
03
cu
00
co
+J
c
CD
i.
ra
Q.
O
a>
S-
u_
ea
cu
CO
I
CO
cu
3
CD
image:
-ooo
_ <y> co r-
o o o o
o o o o
CO CO W CO
O o O O
g
<
a •
<l «
CD
Q;
CO
H
o
a:
u.
LJ
x
j-
H- H t- I- -I $:
o
OD. PROCTOR
SQUARES
O
O
•sf
O
O
ro
O
O
<M
HJL9N3H1S
O
o
O
o
O
o"
in
O
O
O
g co
o_ ^
O CD
ro
CO
Z3
_l
ID
Q
O
2
o a:
o <
O ui
o" x
oj co
o
o
o
B-23
to
to
-a
o
03
cu
00
co
+J
c
CD
i.
ra
Q.
O
a>
S-
u_
ea
cu
CO
I
CO
cu
3
CD
image:
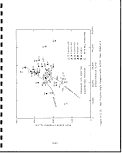 1
the points plotted in Figure B-II 18 no doubt correspond to specimens with g.
soft tops which too easily sheared and cause displacement of the points •
downward. Soft tops are caused by poor emplacement of the top pore stone •
and vanes into the proctor compacted specimen during loading of the spring
oedometer. H
An apparent higher values of these slow shear moduli for more cemented
specimens, suggests that perhaps rapid shear moduli from resonant dynamic «
tests might be used to nondestructively periodically assay a given curing p
specimen for cementation. The very small sample needed for an EGA assay
suggest this might be periodically done on the specimen also without much
altering its integrity for the dynamic test. Perhaps the specimen should be A
kept under high vertical or high confining pressure to simulate burial even w
during dynamic G testing. Perhaps it can be shown that proctor compaction
is adequate to simulate this and such pressures are unnecessary. With H
proctor compaction the persistant problem of weak specimen tops would occur. p
Probably static compaction at the high vertical pressures of interest would
simulate a real liner adequately. H
Figure B-II 19 plotting BI vs shear modulus G also suggests a dis- ™
tinction between brittle and soft material. Here also some points are no
doubt too low. |l
F. Relation of Peak Friction Angle with Twist at Peak Strength
Figure B-II 20 shows the peak friction angles of the TOSCO 100, 90, 80 g
and 70 series and the Lurgi material as a function of twist produced during
torsion testing at peak strength. There seems to be a trend for greater
twist (or strain) before failure for the less compacted standard proctored •
material than for the more compacted modified proctored material, especially P
for material giving lower peak friction angles. Greater strain before
failure is advantageous in a liner. This does not necessarily correlate ||
positively with tensile strength, however, which has little relation to ff
strain before failure. Tensile strength is more related to shear strength
where a rule of thumb says that it is about 1/20 of the shear strength of a «
cohesive clay soil. H
Also plotted in Figure B-II 20 are points for loadings 86 and 92 for a
75% mellowed burned TOSCO'- 25% burned TOSCO mix and the point for loading M
87 which is of a 50% mellowed burned TOSCO - 50% unburned TOSCO II mix. A H
large extent of strain before peak strength at low peak friction angles is
possible with these mixtures involving mellowed material. In fact this sort A
of material with low (in these cases negative) brittleness index tends to ||
exhibit simple shear or zone shear and larger twists than those plotted may
be more appropriate for this plot since for these materials peak strength
does not necessarily imply failure. I
G. Relation of Peak Friction Angle and Squashiness With
Cured Void Ratio A
Figures B-II 21, 22, 23 and 24 show a regularity in peak angle of
internal friction plotted vs void ratio for cured TOSCO spent shales, TOSCO _
I
B-24
i
a
image:
1
the points plotted in Figure B-II 18 no doubt correspond to specimens with g.
soft tops which too easily sheared and cause displacement of the points •
downward. Soft tops are caused by poor emplacement of the top pore stone •
and vanes into the proctor compacted specimen during loading of the spring
oedometer. H
An apparent higher values of these slow shear moduli for more cemented
specimens, suggests that perhaps rapid shear moduli from resonant dynamic «
tests might be used to nondestructively periodically assay a given curing p
specimen for cementation. The very small sample needed for an EGA assay
suggest this might be periodically done on the specimen also without much
altering its integrity for the dynamic test. Perhaps the specimen should be A
kept under high vertical or high confining pressure to simulate burial even w
during dynamic G testing. Perhaps it can be shown that proctor compaction
is adequate to simulate this and such pressures are unnecessary. With H
proctor compaction the persistant problem of weak specimen tops would occur. p
Probably static compaction at the high vertical pressures of interest would
simulate a real liner adequately. H
Figure B-II 19 plotting BI vs shear modulus G also suggests a dis- ™
tinction between brittle and soft material. Here also some points are no
doubt too low. |l
F. Relation of Peak Friction Angle with Twist at Peak Strength
Figure B-II 20 shows the peak friction angles of the TOSCO 100, 90, 80 g
and 70 series and the Lurgi material as a function of twist produced during
torsion testing at peak strength. There seems to be a trend for greater
twist (or strain) before failure for the less compacted standard proctored •
material than for the more compacted modified proctored material, especially P
for material giving lower peak friction angles. Greater strain before
failure is advantageous in a liner. This does not necessarily correlate ||
positively with tensile strength, however, which has little relation to ff
strain before failure. Tensile strength is more related to shear strength
where a rule of thumb says that it is about 1/20 of the shear strength of a «
cohesive clay soil. H
Also plotted in Figure B-II 20 are points for loadings 86 and 92 for a
75% mellowed burned TOSCO'- 25% burned TOSCO mix and the point for loading M
87 which is of a 50% mellowed burned TOSCO - 50% unburned TOSCO II mix. A H
large extent of strain before peak strength at low peak friction angles is
possible with these mixtures involving mellowed material. In fact this sort A
of material with low (in these cases negative) brittleness index tends to ||
exhibit simple shear or zone shear and larger twists than those plotted may
be more appropriate for this plot since for these materials peak strength
does not necessarily imply failure. I
G. Relation of Peak Friction Angle and Squashiness With
Cured Void Ratio A
Figures B-II 21, 22, 23 and 24 show a regularity in peak angle of
internal friction plotted vs void ratio for cured TOSCO spent shales, TOSCO _
I
B-24
i
a
image:
 0.20
0.15
x O. 10
o
en
LU
z
UJ
_J
t-
H-
cc
O.05
-0.05
QA TOSCO 100
g) A TOSCO 90
•US A TOSCO 80
.• A TOSCO 7O
LURGI
SQUARES = MODIFIED PROC.
TRIANGLES=STANDARD PROC./ ^3
O
O
Co
O
/^
O
^
<l
^/
<*>
^
O
^-
o
D
A on
O
A
I
0,000 20,000 30,000
TANGENT SHEAR MODULUS G, PSI
Figure B-II 19. Brittleness Index Compared with Initial Shear
Modulus G !
B-25 !
image:
0.20
0.15
x O. 10
o
en
LU
z
UJ
_J
t-
H-
cc
O.05
-0.05
QA TOSCO 100
g) A TOSCO 90
•US A TOSCO 80
.• A TOSCO 7O
LURGI
SQUARES = MODIFIED PROC.
TRIANGLES=STANDARD PROC./ ^3
O
O
Co
O
/^
O
^
<l
^/
<*>
^
O
^-
o
D
A on
O
A
I
0,000 20,000 30,000
TANGENT SHEAR MODULUS G, PSI
Figure B-II 19. Brittleness Index Compared with Initial Shear
Modulus G !
B-25 !
image:
 60
to
55
°°
cc
CO
UJ
o
UJ
45
o 40
ui 35
a.
30
WITH MELLOWED
TIP
SYMBOLS SAME AS FOR FIG, B-V1 18
P DENOTES PERMEATED SPECIMEN
I I
"10 20 30
TWIST AT PEAK STRENGTH,'DEGREES
40
Figure B-II 20. Extent of Twist at Peak Strength Correlated with Peak
Friction Angle
B-26
1
I
1
1
I
I
8
1
f
I
I
1
I
I
1
B
I
I
I
image:
60
to
55
°°
cc
CO
UJ
o
UJ
45
o 40
ui 35
a.
30
WITH MELLOWED
TIP
SYMBOLS SAME AS FOR FIG, B-V1 18
P DENOTES PERMEATED SPECIMEN
I I
"10 20 30
TWIST AT PEAK STRENGTH,'DEGREES
40
Figure B-II 20. Extent of Twist at Peak Strength Correlated with Peak
Friction Angle
B-26
1
I
1
1
I
I
8
1
f
I
I
1
I
I
1
B
I
I
I
image:
 S50
UJ
a
<£>
UJ
o
45
H-
O
5 40
a.
O32
TOSCO 100
Figure B-II 21. Peak Friction Angle
of TOSCO 100 vs Void Ratio
Figure B-II 22.. Peak Friction
Angle of TOSCO 90 vs Void Ratio
O.6
0.7 0.8 0.9
CURED VOID RATIO
O58
76
t- o
0.6
0.7 0.8 0.9
CURED VOID RATIO
1.0
Figure B-II 23. Peak Friction Angle
of TOSCO 80 vs Void Ratio
Figure B-II 24. ,Peak Friction
Angle of TOSCO 70 vs Void Ratio
B-27
image:
S50
UJ
a
<£>
UJ
o
45
H-
O
5 40
a.
O32
TOSCO 100
Figure B-II 21. Peak Friction Angle
of TOSCO 100 vs Void Ratio
Figure B-II 22.. Peak Friction
Angle of TOSCO 90 vs Void Ratio
O.6
0.7 0.8 0.9
CURED VOID RATIO
O58
76
t- o
0.6
0.7 0.8 0.9
CURED VOID RATIO
1.0
Figure B-II 23. Peak Friction Angle
of TOSCO 80 vs Void Ratio
Figure B-II 24. ,Peak Friction
Angle of TOSCO 70 vs Void Ratio
B-27
image:
 -o
115 to 135 C peak as for ettringite itself. There is a sudden appearence
-o
B-28
1
100, 90, 80, and 70, as the fraction of cementaceous burned spent shale tt
increases. Greater void ratios (determined after curing) are associated if
with lower peak internal friction angles for the TOSCO spent shales. This
suggests that a liner made from spent shale should be as little compacted as «•
possible so a lower friction angle and resulting greater squashiness is had EH
which allows better self healing of the rapid type,'other factors such as *
not too much shrinkage at a shear zone being acceptable. The squashiness is
inversely proportional to the shear strength which for a silty draining |8
material is ° tan 0p. m
H. Hydrate Species Determined by EGA m
I
In the early stages of curing of the series of mixtures TOSCO 100, 90,
80 and 70 rise and fall of an EGA water peak at 115 to 135 C was found.
Since both tobernite and ettringite may manefest themselves in this peak •
some ambiquity exists without x-ray diffraction or other means of distin- *»
quishing between them. Figure B-II 25 is a plot of this peak curing time
for crumbs of spring oedometer specimens after torsion testing. Timing of ft
this peak is similar to that in development of strength of 0D in Figure if
B-II 26. p
Another EGA water peak at around 225°C becomes prominent with TOSCO •
70 material. This is believed to be where the "carbonate ettringite" *
(ettringite with sulfate replaced by carbonate) manefests itself as an
additional part of its EGA curve. The main part, however, still is at the
I
of the 225 C peak at a sharp threshold with a burned spent shale content
below 70%. This suggests that the pH of the water remaining in the mix «
and/or the carbonate ion concentration level left after some of the H
alkalinity and carbonate has attacked the unburned TOSCO II spent shale
component of the mixture may determine whether ordinary sulfate ettringite _
or carbonate ettringite is formed. The identification of this peak is il
substantiated by its reduction in side experiment curings where some gypsum »
as a source of sulfate is added, its accentuation when Na2C03 is added,
and its elimination when Bad, or Ba(NO-)0 as a sulfate scavenger is fl
added. 232 ||
Figure B-II 27 is a plot of the initial shear modulus G vs the 115 to n
135 C EGA peak height for several of the spent shale mixes after curing. •
Although there is some rise in stiffness at the highest quantities of
tobermorite and ettringite found, the effect is not very strong and moreover
for low peak heights which are in the low cementation region of most H
interest the effect is nil. Thus study of cementation of this sort by '•
dynamic G testing does not seem straight forward. It must be recalled that
ettringite is not very cementaceous compared to tobermorite and we have not
yet analyzed the 115-135 C EGA peak for these.
I
Figure B-II 28 shows strong inverse correlation of twist at peak ^
strength vs the 115 to 135 C EGA peak height. Several high data points.,, •
are probably the result of slippage between specimen and upper pore stone. *"
Any cementation produced by these hydrates seems to operate against
e
a
i
image:
-o
115 to 135 C peak as for ettringite itself. There is a sudden appearence
-o
B-28
1
100, 90, 80, and 70, as the fraction of cementaceous burned spent shale tt
increases. Greater void ratios (determined after curing) are associated if
with lower peak internal friction angles for the TOSCO spent shales. This
suggests that a liner made from spent shale should be as little compacted as «•
possible so a lower friction angle and resulting greater squashiness is had EH
which allows better self healing of the rapid type,'other factors such as *
not too much shrinkage at a shear zone being acceptable. The squashiness is
inversely proportional to the shear strength which for a silty draining |8
material is ° tan 0p. m
H. Hydrate Species Determined by EGA m
I
In the early stages of curing of the series of mixtures TOSCO 100, 90,
80 and 70 rise and fall of an EGA water peak at 115 to 135 C was found.
Since both tobernite and ettringite may manefest themselves in this peak •
some ambiquity exists without x-ray diffraction or other means of distin- *»
quishing between them. Figure B-II 25 is a plot of this peak curing time
for crumbs of spring oedometer specimens after torsion testing. Timing of ft
this peak is similar to that in development of strength of 0D in Figure if
B-II 26. p
Another EGA water peak at around 225°C becomes prominent with TOSCO •
70 material. This is believed to be where the "carbonate ettringite" *
(ettringite with sulfate replaced by carbonate) manefests itself as an
additional part of its EGA curve. The main part, however, still is at the
I
of the 225 C peak at a sharp threshold with a burned spent shale content
below 70%. This suggests that the pH of the water remaining in the mix «
and/or the carbonate ion concentration level left after some of the H
alkalinity and carbonate has attacked the unburned TOSCO II spent shale
component of the mixture may determine whether ordinary sulfate ettringite _
or carbonate ettringite is formed. The identification of this peak is il
substantiated by its reduction in side experiment curings where some gypsum »
as a source of sulfate is added, its accentuation when Na2C03 is added,
and its elimination when Bad, or Ba(NO-)0 as a sulfate scavenger is fl
added. 232 ||
Figure B-II 27 is a plot of the initial shear modulus G vs the 115 to n
135 C EGA peak height for several of the spent shale mixes after curing. •
Although there is some rise in stiffness at the highest quantities of
tobermorite and ettringite found, the effect is not very strong and moreover
for low peak heights which are in the low cementation region of most H
interest the effect is nil. Thus study of cementation of this sort by '•
dynamic G testing does not seem straight forward. It must be recalled that
ettringite is not very cementaceous compared to tobermorite and we have not
yet analyzed the 115-135 C EGA peak for these.
I
Figure B-II 28 shows strong inverse correlation of twist at peak ^
strength vs the 115 to 135 C EGA peak height. Several high data points.,, •
are probably the result of slippage between specimen and upper pore stone. *"
Any cementation produced by these hydrates seems to operate against
e
a
i
image:
 o
uj
2 4
0-
o 3
o
in
to
in z
91 TOSCO 100
D
33Q
I
10 2O 30 4O 50
CURING TIME, DAYS
60
7O
80
Figure B-II 25.
EGA Hydrate Water Peak of Tobermorite and
Ettringite vs Time for TOSCO 100, 90.J and
70 Specimens |
30
10
20
3O 40 5O
CURING TIME, DAYS
60
70
Figure B-II 26.
Peak Friction Angle vs Time for TOSCO; 100, 90
and 70 Specimens '
B-29
image:
o
uj
2 4
0-
o 3
o
in
to
in z
91 TOSCO 100
D
33Q
I
10 2O 30 4O 50
CURING TIME, DAYS
60
7O
80
Figure B-II 25.
EGA Hydrate Water Peak of Tobermorite and
Ettringite vs Time for TOSCO 100, 90.J and
70 Specimens |
30
10
20
3O 40 5O
CURING TIME, DAYS
60
70
Figure B-II 26.
Peak Friction Angle vs Time for TOSCO; 100, 90
and 70 Specimens '
B-29
image:
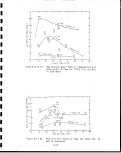 35
30
10
'o
X
MODUL
25
UJ
X
. CO
t-
z
UI
to
2
<
15
10
234
II5-I35°C EGA PEAK HEIGHT
D TOSCO 100
O TOSCO 90
A TOSCO 70
V LURGI
O MEL.TOS 75%.TA25%|
1
I
I
I
I
I
Figure B-II 27. Initial Torsional Stiffness vs 115 to 135°C
EGA Peak
30
CO
UJ
o: 25
o
UJ
o
x
I 20
UJ
o:
i-
co
2 15
a.
i-
co
10
53
49
SPECIMEN TOP
TO TOP VANES
SLIP •>
SYMBOLS AS FOR FIG. B-VI 27
234
II5-I35°-C EGA PEAK HEIGHT
I
I
I
i
I
Figure B-II 28. Twist at Peak Strength vs 115 to 135°C EGA
Peak Height
B-30
f
1
f
I
I
1
image:
35
30
10
'o
X
MODUL
25
UJ
X
. CO
t-
z
UI
to
2
<
15
10
234
II5-I35°C EGA PEAK HEIGHT
D TOSCO 100
O TOSCO 90
A TOSCO 70
V LURGI
O MEL.TOS 75%.TA25%|
1
I
I
I
I
I
Figure B-II 27. Initial Torsional Stiffness vs 115 to 135°C
EGA Peak
30
CO
UJ
o: 25
o
UJ
o
x
I 20
UJ
o:
i-
co
2 15
a.
i-
co
10
53
49
SPECIMEN TOP
TO TOP VANES
SLIP •>
SYMBOLS AS FOR FIG. B-VI 27
234
II5-I35°-C EGA PEAK HEIGHT
I
I
I
i
I
Figure B-II 28. Twist at Peak Strength vs 115 to 135°C EGA
Peak Height
B-30
f
1
f
I
I
1
image:
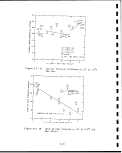 extensive deformation, the action of interest in self healing, rather than
against small deformation involved in initial stiffness. ;
The peak strength friction angle is quite dependent on the extent of
formation of cementaceous hydrates under conditions of the torsion test.
Peak strength also correlates fairly well with the void ratio within types
of spent shale mixtures such as TOSCO 100, 90, 80, 70 or Lurgi. A better
correlation with strength than either of the above should be obtained by
plotting the family of void ratio vs peak shear strength curves with the
amount of tobermorite water present as a parameter (ignoring any ettringite
and hydromagnesite cementing action). The tobermorite might be determined
assuming all gttringite is the kind with also a peak at 225°C as well as
at 120 to 135 C (carbonate ettringite or hydroxy ettringite but not
sulfate ettringite). The early peak at 120 to 135°C or so (depending on
its height) results from both tobermorite and ettringite largely super-
imposed. The tobermorite peak area alone might be obtained by subtracting
out a calculated carbonate ettringite area for the 115 to 135 C part of
its water evolution calculated from a ratio of the 225°C part of its water
evolution. j
I. Secondary Compression Index Ca related to !
Cementation and Mellowing" :;
Figure B-II 29 summarizes Ca, the secondary compression index of the
spring oedometer specimens just before the specimens removal from:its LVDT
height measurement system prior to permeability determination (if-made) and .
torsion testing. In general some specimens showed a uniform height vs log
time plot while others showed a fairly sharp downbend in this plot at around
of 1 to 5 days as though some kind of friction of cementation were broken
loose then in response to a particular environmental change. The>nature of
these possible clock reactions has not been considered here but should be at
some time for whatever type of material might be considered a further
possible candidate liner. I
i
Figure B-II 29 shows that at a burned TOSCO spent shale content of
about 10% in TOSCO II spent shale shale a minimum Ca occurred for^specimens
showing a given peak friction angle. Figure B-II 29 is a cross plot of the
data shown in Figures B-II 30, 31, 32, 33, 34 and 35 for the last!Ca from
the LVDT measurements and the peak friction angle later determined by the
torsion tester. The scatter of the data in these latter figures is believed
to often be due to premature slippage of the specimen at its weaker top
rather than failing in a more representative portion in the middle; of the
specimen. The "best" curves have been drawn through reasonable hi'gher 0P
values of presumed better failed specimens. :
It should be commented that none of the Ca values seen to datie seem too
high for use of a liner for a period of 10,000 years. There is sqme pos-
sibility, however, that the same secondary compression vs log time1 curves
may turn downward even further were specimens studied for longer periods.
The secondary compression index Ca, that can be calcualted fr|om
Townsend and Peterson (1979) data for their unscalped TOSCO II spent shale
for modified and standard proctor material at 10 minutes consolidation
B-31
image:
extensive deformation, the action of interest in self healing, rather than
against small deformation involved in initial stiffness. ;
The peak strength friction angle is quite dependent on the extent of
formation of cementaceous hydrates under conditions of the torsion test.
Peak strength also correlates fairly well with the void ratio within types
of spent shale mixtures such as TOSCO 100, 90, 80, 70 or Lurgi. A better
correlation with strength than either of the above should be obtained by
plotting the family of void ratio vs peak shear strength curves with the
amount of tobermorite water present as a parameter (ignoring any ettringite
and hydromagnesite cementing action). The tobermorite might be determined
assuming all gttringite is the kind with also a peak at 225°C as well as
at 120 to 135 C (carbonate ettringite or hydroxy ettringite but not
sulfate ettringite). The early peak at 120 to 135°C or so (depending on
its height) results from both tobermorite and ettringite largely super-
imposed. The tobermorite peak area alone might be obtained by subtracting
out a calculated carbonate ettringite area for the 115 to 135 C part of
its water evolution calculated from a ratio of the 225°C part of its water
evolution. j
I. Secondary Compression Index Ca related to !
Cementation and Mellowing" :;
Figure B-II 29 summarizes Ca, the secondary compression index of the
spring oedometer specimens just before the specimens removal from:its LVDT
height measurement system prior to permeability determination (if-made) and .
torsion testing. In general some specimens showed a uniform height vs log
time plot while others showed a fairly sharp downbend in this plot at around
of 1 to 5 days as though some kind of friction of cementation were broken
loose then in response to a particular environmental change. The>nature of
these possible clock reactions has not been considered here but should be at
some time for whatever type of material might be considered a further
possible candidate liner. I
i
Figure B-II 29 shows that at a burned TOSCO spent shale content of
about 10% in TOSCO II spent shale shale a minimum Ca occurred for^specimens
showing a given peak friction angle. Figure B-II 29 is a cross plot of the
data shown in Figures B-II 30, 31, 32, 33, 34 and 35 for the last!Ca from
the LVDT measurements and the peak friction angle later determined by the
torsion tester. The scatter of the data in these latter figures is believed
to often be due to premature slippage of the specimen at its weaker top
rather than failing in a more representative portion in the middle; of the
specimen. The "best" curves have been drawn through reasonable hi'gher 0P
values of presumed better failed specimens. :
It should be commented that none of the Ca values seen to datie seem too
high for use of a liner for a period of 10,000 years. There is sqme pos-
sibility, however, that the same secondary compression vs log time1 curves
may turn downward even further were specimens studied for longer periods.
The secondary compression index Ca, that can be calcualted fr|om
Townsend and Peterson (1979) data for their unscalped TOSCO II spent shale
for modified and standard proctor material at 10 minutes consolidation
B-31
image:
 1
0.002
is
< O.OOI
z
iZ
0
I i i i 1
Coj AT 45° $p
Q
D —
o ^
o . 9
0.002 | | |
1
TOSCO 80 .
A 1 — I ••
0.001 — A^ n ~ H
P"
r-CL P^D
LURGI TOS. IOO TOS.90 TOS.8O TOS.70 O1 ' ' — :J-J ' ' Vt
35 4O 45 5O 55 •
Fig. B-II 29. Final Ca at 45° Peak B-II 32. Final Ca vs Peak Friction
Friction Angle for Oedometer Specimens Angle for TOSCO 80 Specimens fj
of Various Spent Shale ™
O.OO5
O.O04
fc
0
< 0.003
z
**"
O.002
O.OOI
1 | 1
TOSCO 100 _
•
^_
^ A
_ D -
A
_ —
AD
D
— ~
A
0.005
O.O04
0.003
O.O02
O.OOI
0
1 1 1
TOSCO 70
_ —
SQUARES = MOD. PROCT.
TRI ANGLES = STAND. PROCT.
_ —
- -
D
Q
P , D ,AX ^
1
1
JBV
»'"
1
1
0 •
B-II 30. Final Ca vs Peak Friction B-II 33. Final Ca vs Peak Friction
Angle for TOSCO 100 Specimens Angle for TOSCO 70 Specimens •
0.00
TOSCO 9O
- D ~ 0.003
d?
^ O.0002 — — 0.002
= D ' '
_ A — 0.001
1 1 I
11 1
LURGI
-
D
D
_
_ B°
1 1 D l D
I
1
1
35 40 45 50 55 35 40 45 50 55 !•
PEAK FRICTION ANGLE $,, DEGREES PEAK FRICTION ANGLE /p .DEGREES ||
r
B-II 31. Final Ca vs Peak Friction B-II 34. Final Ca vs Peak Friction H
Angle for TOSCO 90 Specimens Angle for Lurgi Specimens
B-32 |
image:
1
0.002
is
< O.OOI
z
iZ
0
I i i i 1
Coj AT 45° $p
Q
D —
o ^
o . 9
0.002 | | |
1
TOSCO 80 .
A 1 — I ••
0.001 — A^ n ~ H
P"
r-CL P^D
LURGI TOS. IOO TOS.90 TOS.8O TOS.70 O1 ' ' — :J-J ' ' Vt
35 4O 45 5O 55 •
Fig. B-II 29. Final Ca at 45° Peak B-II 32. Final Ca vs Peak Friction
Friction Angle for Oedometer Specimens Angle for TOSCO 80 Specimens fj
of Various Spent Shale ™
O.OO5
O.O04
fc
0
< 0.003
z
**"
O.002
O.OOI
1 | 1
TOSCO 100 _
•
^_
^ A
_ D -
A
_ —
AD
D
— ~
A
0.005
O.O04
0.003
O.O02
O.OOI
0
1 1 1
TOSCO 70
_ —
SQUARES = MOD. PROCT.
TRI ANGLES = STAND. PROCT.
_ —
- -
D
Q
P , D ,AX ^
1
1
JBV
»'"
1
1
0 •
B-II 30. Final Ca vs Peak Friction B-II 33. Final Ca vs Peak Friction
Angle for TOSCO 100 Specimens Angle for TOSCO 70 Specimens •
0.00
TOSCO 9O
- D ~ 0.003
d?
^ O.0002 — — 0.002
= D ' '
_ A — 0.001
1 1 I
11 1
LURGI
-
D
D
_
_ B°
1 1 D l D
I
1
1
35 40 45 50 55 35 40 45 50 55 !•
PEAK FRICTION ANGLE $,, DEGREES PEAK FRICTION ANGLE /p .DEGREES ||
r
B-II 31. Final Ca vs Peak Friction B-II 34. Final Ca vs Peak Friction H
Angle for TOSCO 90 Specimens Angle for Lurgi Specimens
B-32 |
image:
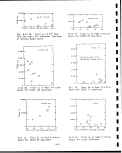 and interpolated to a CT of 280 psi are about two or three times the
values we have found (Figure B-II 30). These higher Ca values would be
explained if much of the larger chunks of spent shale in their unscalped
sample soften when water soaked so the bridging between them is weakened at
their point to point contacts. The & values reported by these authors for
standard and modified proctor are roughly comparable with 0p measured with
our torsion apparatus although a number of variables are important to the
exact values which are found. j
3. Indirect Tensile Strength (Brazilian) Tests ;
;
In Figure B-II 35 Brazil indirect tensile strengths of specimens
compacted and cured with no confining pressure are compared with the twist
at peak strength from the torsion test of counterpart specimens cured in the
spring oedometers at around 280 psi vertical pressure and tested near that
pressure. |
There is a trend in Figure B-II 35 for more cementaceous TOSCO 80
material to give greater tensile strength than less cementaceous TOSCO 90
material and for it to give greater tensile strength than the TOSCO 100
material. Lurgi spent shale gives relatively high tensile strengths while
mixtures including mellowed material as noted give low to medium tensile
strengths. The negative slope of the trend lines drawn for the different
materials suggests that the kind of tensile strength measured by the
Brazilian tests is a brittle cementaceous type strength associated with
rapid attainment of peak cementaceous shear strength as strain progresses.
This slope is opposite to that expected for a correlation of the shear test
twist and tensile strength for a cohesive plastic material. ;
For the silty and sometimes cemented materials of most of the specimens
studied here high tensile strength primarily indicates cementation. A more
clayish material might show both high twist before peak shear strength and
relatively high tensile strength. Tensile strength, as weak as it is, in a
material at the overburden depths involved for the liner being considered
does not seem to be an important consideration in the face of the |hi'gh
vertical stress involved at depth which greatly increases shear strength.
Figure B-II 36 is a plot of the tensile strain at failure with the
Brazil tests vs the twist at peak strength for the torsion tests, i It is
concluded that only a little cementation reduces the tensile strain at
failure considerably. The largest torsion twists (strains) of cenjented
specimens and less cemented specimens at peak torsion shear strength seen
are about the same but the Brazil test tensile strains at tensile 'failure
are much greater for less cementaceous material. '
Figure B-II 37 shows some classical shaped tensile strength ys water
content curves for specimens made from mixtures involving mellowed^
materials. Even for the 75% mellowed TOSCO - 25% burned TOSCO specimens
which are undergoing some cementation, a peak tensile strength vs Water
content is observed. The points corresponding to specimen water additions
used in the main series of oedometer - torsion tests are indicated by the
oedometer loading number of this main series. According to data for these
B-33
image:
and interpolated to a CT of 280 psi are about two or three times the
values we have found (Figure B-II 30). These higher Ca values would be
explained if much of the larger chunks of spent shale in their unscalped
sample soften when water soaked so the bridging between them is weakened at
their point to point contacts. The & values reported by these authors for
standard and modified proctor are roughly comparable with 0p measured with
our torsion apparatus although a number of variables are important to the
exact values which are found. j
3. Indirect Tensile Strength (Brazilian) Tests ;
;
In Figure B-II 35 Brazil indirect tensile strengths of specimens
compacted and cured with no confining pressure are compared with the twist
at peak strength from the torsion test of counterpart specimens cured in the
spring oedometers at around 280 psi vertical pressure and tested near that
pressure. |
There is a trend in Figure B-II 35 for more cementaceous TOSCO 80
material to give greater tensile strength than less cementaceous TOSCO 90
material and for it to give greater tensile strength than the TOSCO 100
material. Lurgi spent shale gives relatively high tensile strengths while
mixtures including mellowed material as noted give low to medium tensile
strengths. The negative slope of the trend lines drawn for the different
materials suggests that the kind of tensile strength measured by the
Brazilian tests is a brittle cementaceous type strength associated with
rapid attainment of peak cementaceous shear strength as strain progresses.
This slope is opposite to that expected for a correlation of the shear test
twist and tensile strength for a cohesive plastic material. ;
For the silty and sometimes cemented materials of most of the specimens
studied here high tensile strength primarily indicates cementation. A more
clayish material might show both high twist before peak shear strength and
relatively high tensile strength. Tensile strength, as weak as it is, in a
material at the overburden depths involved for the liner being considered
does not seem to be an important consideration in the face of the |hi'gh
vertical stress involved at depth which greatly increases shear strength.
Figure B-II 36 is a plot of the tensile strain at failure with the
Brazil tests vs the twist at peak strength for the torsion tests, i It is
concluded that only a little cementation reduces the tensile strain at
failure considerably. The largest torsion twists (strains) of cenjented
specimens and less cemented specimens at peak torsion shear strength seen
are about the same but the Brazil test tensile strains at tensile 'failure
are much greater for less cementaceous material. '
Figure B-II 37 shows some classical shaped tensile strength ys water
content curves for specimens made from mixtures involving mellowed^
materials. Even for the 75% mellowed TOSCO - 25% burned TOSCO specimens
which are undergoing some cementation, a peak tensile strength vs Water
content is observed. The points corresponding to specimen water additions
used in the main series of oedometer - torsion tests are indicated by the
oedometer loading number of this main series. According to data for these
B-33
image:
 i i r
o
-i r
T-
o
CO
UJ
UJ
<r
ID
UJ
cc
<
I-
10
co
UJ
z
o
CO
a:
o
I-
iv NIVUJ.S
S33a93Q'H13N3MiS »V3d IV 1SIM1 1S31 NOISH01
in
0)
O> S- CD
r— o c
•r- \— cu
to s-
c: in -i->
cu > c/o
cu -^
i— S_ ns
•r- 3 eu
Mi — D-
(O •!-
S- 03 4->
CQ U- rO
CO
O)
S-
Z!
2 > +->
•M •*-> CU
CO O1 S-
01 C 4->
1— CU OO
S-
C 4-> CU
O l>0 r—
•r" *P~
in -i£ in
1- ts c:
o cu cu
|_ Q. |_
LT>
CO
I
CO
cu
s_
3
B-34
1
I
I
I
I
I
i
i
i
i
i
i
i
i
i
i
i
i
i
image:
i i r
o
-i r
T-
o
CO
UJ
UJ
<r
ID
UJ
cc
<
I-
10
co
UJ
z
o
CO
a:
o
I-
iv NIVUJ.S
S33a93Q'H13N3MiS »V3d IV 1SIM1 1S31 NOISH01
in
0)
O> S- CD
r— o c
•r- \— cu
to s-
c: in -i->
cu > c/o
cu -^
i— S_ ns
•r- 3 eu
Mi — D-
(O •!-
S- 03 4->
CQ U- rO
CO
O)
S-
Z!
2 > +->
•M •*-> CU
CO O1 S-
01 C 4->
1— CU OO
S-
C 4-> CU
O l>0 r—
•r" *P~
in -i£ in
1- ts c:
o cu cu
|_ Q. |_
LT>
CO
I
CO
cu
s_
3
B-34
1
I
I
I
I
I
i
i
i
i
i
i
i
i
i
i
i
i
i
image:
 Sd OI2-9SI IV °0
4->
C
CD
dl
to O
O) C
i- i—i
Li-
en
X to
<U O
-a —i
c: t—i
H-1 S_ OO
o o-
sz H-
o o
•I- tO r-H
CO E CO
CO <U
<u E o
i- ••- +J
o. o
E O> LD
o Q.Ln
O to t—1
co
CO
I
03
OJ
i.
I
o
H-
o
o
£T
Q.
Q
LU
Q
O
<
i-
<
o o
ISd 'HJL9N3H1S 31ISN31
B-35
UJ
H-
LU
cc
u.
ro
O
OJ
re
•r—
-I-J
en
c:
oo
•— 4-)
••-. c
to Q)
C +->
CU C
•r- S-
M OJ
S- ro
DQ 3
i
CO
CU
S-
image:
Sd OI2-9SI IV °0
4->
C
CD
dl
to O
O) C
i- i—i
Li-
en
X to
<U O
-a —i
c: t—i
H-1 S_ OO
o o-
sz H-
o o
•I- tO r-H
CO E CO
CO <U
<u E o
i- ••- +J
o. o
E O> LD
o Q.Ln
O to t—1
co
CO
I
03
OJ
i.
I
o
H-
o
o
£T
Q.
Q
LU
Q
O
<
i-
<
o o
ISd 'HJL9N3H1S 31ISN31
B-35
UJ
H-
LU
cc
u.
ro
O
OJ
re
•r—
-I-J
en
c:
oo
•— 4-)
••-. c
to Q)
C +->
CU C
•r- S-
M OJ
S- ro
DQ 3
i
CO
CU
S-
image:
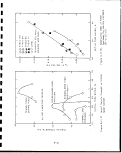 1
little aged specimens optimum tensile strength was not usually attained.
But as observed above, the properties of the liner is shear at higher H
vertical pressure which will far over-shadow the weak tensile strengths. »
K. Compressibility Coefficients Oj
Pneumatic arm oedometer tests were made on standard proctored or
modified proctored specimens one inch high and 2% inch diameter. Table B-I • at
1 lists the types of mixes studied by arm oedometer. Table B-II lisa ft
summary of some results and some calculations. In the first column t •
signified TOSCO, m modified proctor, s standard proctor, etc.
Primary consolidation was finished after 80 minutes for the one inch p
thick double pore stone specimens used. For this time the total compression
of the specimen from the data collecting computer print out for each loading «
increment was read and entered in a computer spread sheet program, Table «
B-II 1 column D, as steady state Schaevitz units. After converting these to "
mm compression and correcting for arm oedometer apparatus deflection at the
particular load (column C) the net compression was calculated (column F) for H
that loading increment. Load increments producing vertical pressures on the •
specimens of 19.4, 38.8, 77.5, 155.0, and 310 psi were used. From the
initial water added, mineral grain density of the initial dry mixture before
wetting, specimen loaded?weight,' cell volume of 80.44 cm and specimen top
surface area of 31.67 cm the dry densities and void ratio for each
loading were calculated and for each change in load the delta void ratio and
compression index C were calculated (columns K and L). •
From the data calculated in Table B-II 1 a variety of correlations may
be made. Void ratio e plotted against consolidation stress (load) gives m
curves typical of silt. Figure B-II 38 shows the compression index for the p
last loading increment (155 to 310 psi) for each specimen, plotted against
the initial water added to the specimen in mixing it. There is much «.
similarity in the position of the curves for the various types of spent ||
shale.
1
1
I
1
B-36
1
I
I
image:
1
little aged specimens optimum tensile strength was not usually attained.
But as observed above, the properties of the liner is shear at higher H
vertical pressure which will far over-shadow the weak tensile strengths. »
K. Compressibility Coefficients Oj
Pneumatic arm oedometer tests were made on standard proctored or
modified proctored specimens one inch high and 2% inch diameter. Table B-I • at
1 lists the types of mixes studied by arm oedometer. Table B-II lisa ft
summary of some results and some calculations. In the first column t •
signified TOSCO, m modified proctor, s standard proctor, etc.
Primary consolidation was finished after 80 minutes for the one inch p
thick double pore stone specimens used. For this time the total compression
of the specimen from the data collecting computer print out for each loading «
increment was read and entered in a computer spread sheet program, Table «
B-II 1 column D, as steady state Schaevitz units. After converting these to "
mm compression and correcting for arm oedometer apparatus deflection at the
particular load (column C) the net compression was calculated (column F) for H
that loading increment. Load increments producing vertical pressures on the •
specimens of 19.4, 38.8, 77.5, 155.0, and 310 psi were used. From the
initial water added, mineral grain density of the initial dry mixture before
wetting, specimen loaded?weight,' cell volume of 80.44 cm and specimen top
surface area of 31.67 cm the dry densities and void ratio for each
loading were calculated and for each change in load the delta void ratio and
compression index C were calculated (columns K and L). •
From the data calculated in Table B-II 1 a variety of correlations may
be made. Void ratio e plotted against consolidation stress (load) gives m
curves typical of silt. Figure B-II 38 shows the compression index for the p
last loading increment (155 to 310 psi) for each specimen, plotted against
the initial water added to the specimen in mixing it. There is much «.
similarity in the position of the curves for the various types of spent ||
shale.
1
1
I
1
B-36
1
I
I
image:
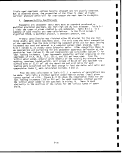 I
I
I
I
I
I
I
I
I
I
I
i
I
I
1
I
I
I
I
in
cz
QJ
E
O
CO
CL
oo
cu o
i- o
E QJ
O U
i ^
cz
•M
'l3 O
V) *i—
QJ in
c£ in
QJ
5- i-
•*-> E
CU O
E 0
O
"O "O
QJ C.
CD (O
E cu
JE w
o
(_> -r-
*r— -(-»
-r-> (0
03 ct:
E
Z3 T3
QJ ••—
C O
0. >
1
CO
LtJ
— 1
|
CO
OJ
s_ x
CL <U
E -o o
° »5 °
to o
o
o <3 QJ
>. OS
>1
4-»
tn u
c
QJ
E *^ -<->
.^ QJ .c
O ^ C7»
CL O co E
U CZ >r- U
QJ tr_ yj (J
c to c •*-*
^E o a cn
>
cn E
O "O QJ
OJ O S_ i —
. — I_ Cc ni
H- t_ E •*-*
CU O O O
CD CJ <C_3 t—
Nl
>^ .!,— (/)
"O QJ > •+->
fO +J QJ T~
CU rO ra C
4-> 4-» .n: ZD
N
f^ *r—
•i— <l) CO
cue
S-
tu c
.U *J ,4J
HJ 0 0
E O> <U
0 r- i.
•0 M- s_
cu oj o e
(O »
•r- t. '13
.(-> QJ QJ
•»- •*-> "O
cr to "o
o
OJ rcJ
t— CL C
^ 0 T-
cn o f^. CM
in co co »— '
0 0 r-H CO
CD CD O CD
r-l CO *3- r-4 **
co r-* CM ^- cn
in CD CD CD CD
CD CD CD CD CD
UD in CM co cn
in in m <^- co
CD CD O O O
in in r- o UD
*a- in in UD u^
in in in in >^>
CO CO CO CO CO
CO CO CO CO CO
CM CM CM CM CM
*.o co co cn tn
CD CM in O CM
r-H Cn <tf- r-4 CO
CD r-- ID CM t^*
cn co co co r--
CO CO CO CO g
cn cn en cn cn
CO CD CD in tO
CD co m UD r-»
O O O O CD
CM CM CM CM CM
cn
CD
CO
CO CO CM CM
CD CO CM CM
1 CO CM «d" P^.
O CD CD O
UD 1—4 p"«. r^» r*^
cn cn co CM »-<
CD CD CD *-< CM
r-* CD CD CD CD
cn o i— i co r-»
CM CM i-H O% r-s.
cn en cn co co
O CD CD CD O
UD UD f-^ CO CD
UD UD" UD UD" UD"
•cr ^r «a- *^- «d-
cn en CT> cn o~*
CO CO CO CO CO
CM CM CM CM CM
o o «^- i — r r —
<3" UD P^« ^J" CM
co r^« CD cn »— i
r*» o *<3' ^* o
co co r-^ UD in
CM CM CM CM CM
en cn cr» cn cn
co CD CD in in
CD co in UD r-^
CD CD CD O CD
in in in in in
CM CM CM CM CM
CD
+J
CM cn cn co
ft co o en
i CM CM in cn
o o o o
r-H ^)- r^» CO CD
UD UD co in CD
CD CD CD t— * CO
CM o CD O o
CO iO CO CM CM
CO | — . UD in CM
O o CD CD o
CO p^ CM CO CO
to in UD r-*. cn
CO CO CO CO CO
cn cn cn cn cn
co co co co ro
cn cn cn cn cn
CO CO CO CO CO
CM CM CM CM CM
CO UD CM Cn u-,
O co cn r— ^j-
VD U3 CO CM i^-
CD in cn cn CD
cn co r^» UD m
*d- ^3- •& *f «&
cn cn cn cn cn
co o CD in ir>
CD co in UD ^
O CD O O CD
CO CO CO CO CO
CM CM CM CM CM
to
O
cn ^ in cn
i oo co m CM
in «a- co *=?
CD CD CD *-*
r~i CM UD r-. CD
r-N. UD «^- in co
CD •— c i— t CM «=*•
. CD CD CD CD
"^rs. co r^ <*•
Q r^ UD co cn
. O CD o cn
i£ UD UD CO CO
S in UD co t-H
. CO CO CO «3-
-^ ^T ^T ^ ^
^ *3- ^3- ^3- ^a-
^^ cn cn cn cn
^" CO CO CO CO
C^ CM CM CM CM
CD uD CM CO CO
•— ' O co cn i— i
r-H
cn CD CM cn *r
CD CD CD CO P-*
co r^ UD ^r r-i
CO CO CO CO CO
CO CO CO CO CO
co CD o tn in
CD ro m UD r-»
CD CD O CD CD
c*^ co co co co
CD
-*->
cn cn VD "^
in r-» cn ^"
1 CD O o £{
CD CD CD C5
en p^. co cn '=r
r^ ,-* CM CM £±
r-l 0 CD CD 0
r-< 0 0 0 °
y^ ^j. CM cn CM
P*» P-*. f^- UD SS
CO CO CO CO ro
o o o o °
P— CO CD CM CO
cn cn o o 5£
co co •=*• «=p ^
CO CO CO CO £[J
CM CM CM CM CM
UD UD UD UD UD
CO CM CM CM CM
CO CM ^3- CO CO
O CO UD O O
O O O r-H CSJ
r^ ^r co r-H UD
r-H Cn UD "d- CO
cn co co co f"-
un in in m ^n
CM CM CM CM CM
cn cn cn cn cn
co o CD in tn
CD CO LO UD P-*
CD CD O O CD
CM CM CM CM CM
CM CM CM CM CM
E
cr*
ZJ
B-37
image:
I
I
I
I
I
I
I
I
I
I
I
i
I
I
1
I
I
I
I
in
cz
QJ
E
O
CO
CL
oo
cu o
i- o
E QJ
O U
i ^
cz
•M
'l3 O
V) *i—
QJ in
c£ in
QJ
5- i-
•*-> E
CU O
E 0
O
"O "O
QJ C.
CD (O
E cu
JE w
o
(_> -r-
*r— -(-»
-r-> (0
03 ct:
E
Z3 T3
QJ ••—
C O
0. >
1
CO
LtJ
— 1
|
CO
OJ
s_ x
CL <U
E -o o
° »5 °
to o
o
o <3 QJ
>. OS
>1
4-»
tn u
c
QJ
E *^ -<->
.^ QJ .c
O ^ C7»
CL O co E
U CZ >r- U
QJ tr_ yj (J
c to c •*-*
^E o a cn
>
cn E
O "O QJ
OJ O S_ i —
. — I_ Cc ni
H- t_ E •*-*
CU O O O
CD CJ <C_3 t—
Nl
>^ .!,— (/)
"O QJ > •+->
fO +J QJ T~
CU rO ra C
4-> 4-» .n: ZD
N
f^ *r—
•i— <l) CO
cue
S-
tu c
.U *J ,4J
HJ 0 0
E O> <U
0 r- i.
•0 M- s_
cu oj o e
(O »
•r- t. '13
.(-> QJ QJ
•»- •*-> "O
cr to "o
o
OJ rcJ
t— CL C
^ 0 T-
cn o f^. CM
in co co »— '
0 0 r-H CO
CD CD O CD
r-l CO *3- r-4 **
co r-* CM ^- cn
in CD CD CD CD
CD CD CD CD CD
UD in CM co cn
in in m <^- co
CD CD O O O
in in r- o UD
*a- in in UD u^
in in in in >^>
CO CO CO CO CO
CO CO CO CO CO
CM CM CM CM CM
*.o co co cn tn
CD CM in O CM
r-H Cn <tf- r-4 CO
CD r-- ID CM t^*
cn co co co r--
CO CO CO CO g
cn cn en cn cn
CO CD CD in tO
CD co m UD r-»
O O O O CD
CM CM CM CM CM
cn
CD
CO
CO CO CM CM
CD CO CM CM
1 CO CM «d" P^.
O CD CD O
UD 1—4 p"«. r^» r*^
cn cn co CM »-<
CD CD CD *-< CM
r-* CD CD CD CD
cn o i— i co r-»
CM CM i-H O% r-s.
cn en cn co co
O CD CD CD O
UD UD f-^ CO CD
UD UD" UD UD" UD"
•cr ^r «a- *^- «d-
cn en CT> cn o~*
CO CO CO CO CO
CM CM CM CM CM
o o «^- i — r r —
<3" UD P^« ^J" CM
co r^« CD cn »— i
r*» o *<3' ^* o
co co r-^ UD in
CM CM CM CM CM
en cn cr» cn cn
co CD CD in in
CD co in UD r-^
CD CD CD O CD
in in in in in
CM CM CM CM CM
CD
+J
CM cn cn co
ft co o en
i CM CM in cn
o o o o
r-H ^)- r^» CO CD
UD UD co in CD
CD CD CD t— * CO
CM o CD O o
CO iO CO CM CM
CO | — . UD in CM
O o CD CD o
CO p^ CM CO CO
to in UD r-*. cn
CO CO CO CO CO
cn cn cn cn cn
co co co co ro
cn cn cn cn cn
CO CO CO CO CO
CM CM CM CM CM
CO UD CM Cn u-,
O co cn r— ^j-
VD U3 CO CM i^-
CD in cn cn CD
cn co r^» UD m
*d- ^3- •& *f «&
cn cn cn cn cn
co o CD in ir>
CD co in UD ^
O CD O O CD
CO CO CO CO CO
CM CM CM CM CM
to
O
cn ^ in cn
i oo co m CM
in «a- co *=?
CD CD CD *-*
r~i CM UD r-. CD
r-N. UD «^- in co
CD •— c i— t CM «=*•
. CD CD CD CD
"^rs. co r^ <*•
Q r^ UD co cn
. O CD o cn
i£ UD UD CO CO
S in UD co t-H
. CO CO CO «3-
-^ ^T ^T ^ ^
^ *3- ^3- ^3- ^a-
^^ cn cn cn cn
^" CO CO CO CO
C^ CM CM CM CM
CD uD CM CO CO
•— ' O co cn i— i
r-H
cn CD CM cn *r
CD CD CD CO P-*
co r^ UD ^r r-i
CO CO CO CO CO
CO CO CO CO CO
co CD o tn in
CD ro m UD r-»
CD CD O CD CD
c*^ co co co co
CD
-*->
cn cn VD "^
in r-» cn ^"
1 CD O o £{
CD CD CD C5
en p^. co cn '=r
r^ ,-* CM CM £±
r-l 0 CD CD 0
r-< 0 0 0 °
y^ ^j. CM cn CM
P*» P-*. f^- UD SS
CO CO CO CO ro
o o o o °
P— CO CD CM CO
cn cn o o 5£
co co •=*• «=p ^
CO CO CO CO £[J
CM CM CM CM CM
UD UD UD UD UD
CO CM CM CM CM
CO CM ^3- CO CO
O CO UD O O
O O O r-H CSJ
r^ ^r co r-H UD
r-H Cn UD "d- CO
cn co co co f"-
un in in m ^n
CM CM CM CM CM
cn cn cn cn cn
co o CD in tn
CD CO LO UD P-*
CD CD O O CD
CM CM CM CM CM
CM CM CM CM CM
E
cr*
ZJ
B-37
image:
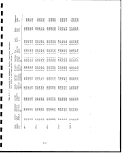 o
1
*
fr-4
CQ
<U
Vt
2*
CX CJ
§•0 o
c o
ra o
£I2£
0 >. i.
•*- .u
.0 ra a
I'll
C
a>
U T3 C7»
CJ 10 -r-
f\- o 6J P
f— >l
«- e-j- o
ai *^ in ij
•£•00 §,
O XI CJ
<U <•> l-r-
,Z t. a. „
u. i. g 4->
N
4-1
OJ rtj rtt c
M
r— tfm
ill
<. •
a e
CJ O O
g M e»
o>— u
•a <•- u
w <u o g
<a •
4-> CJ QJ
c a -a
u
.— S. e
i/i * * -f-*
o m £2 •-«
in co co ^
I ro CM ro r-.
0 0 °. 0
^* tn *o ^ CM
CO O CO •-' CO
•0- r-l O « CM
0 O 0 0 0
1
o cn i-« J'1 vo
^H cn co r** tn
en co co co co
0 <=» 0 0 o
CM O <g ^ ^
t^ co eo "» t_<
co ro " " «»
CM CM CM CM ^j
co co <•» £2 «*>
^r *3- xr ^^ ^3-
CM CM CM CM pj
CM CM CM CM pj
IO «J «D *° IO
CM CM CM CM f^j
o o T r~. m
m co «~< ^o r^.
o CM co ^r i^
^r 10 o r-i m
co r-. i^- *o «•
to ro co co ro
CO CO CO CO CO
CO CO CO CO CO
0 0 0 0 0
o o es o o
IA
en
s_
SoSg
o o o o
co in t— * co co
•cr ty VO CO ^"
*— * CD CD CD •"" *
00 *""" I± CO CO
^" CO CO CM CD
CO CO CO CO CO
CD CD CD CD CD
ro 10 «*•( co CD
CJ CM co ro m
^r *a- -sr ^r ^r
in 10 in in ui
CM CM CM CM CM
CM CM CM CM CM
CM CM CM CM CM
CD CM »5 r^. 7^
CM co '-D co cn
CD CD «-* CM *=*•
CM CD CO CD CO
in ,— i in cn co
cn cn co r-. ^°
ssisc!
co o CD m u"1
CD ro "^ vo r**
CD o CD o CD
i^ r^ r^ t^ r^
e
cn
t-
^H CM CO ^
CM CM CO "3
i *j- cn co *""*
CD O r-| CM
co r^» ^* co CM
«~* cvj f*1^ *—< m
CM ^-i CM *f WD
in o CD CD CD
O r*. cn t^. CM
CO r—t CO «^* CO
CO CO CM CM •-<
^H^r-l^ -H
cn LO cn ,— < co
vo r*^ co ,_ i *3"
»-< r-H »-l CM CM
CO CO CO CO CO
CM CM CM CM CM
CM CM CM CM CM
^* CM ^" cn cn
to cn cn ^r in
i— i
cr> cn co co co
£2 ° ^t f~l £J
CO CO *" "^" CD
CD CD CD CD CD
CM CM CM CM CM
cn cn cn cn cn
co CD CD tn in
o co "» vo r*-
CD O CD CD CD
CD CD CD CD CD
E
CD
in
CD
in
cn tn co ,-<
I . ji CO *^ ^~
,-f T-4 CM «;r
O CD O o
CD VO VO r-H CM
CD CO W> CO CO
O CD CD CD r-t
t~t CD CD CD O
CO O "=1" '•O CO
^4 ^H o cn co
co CO co r- r^
CD O CD CD CD
CM C** ^*" IO
Ch O CD *— • CM
«a- in LO in Ln
S:^:^^^:
CM CM CM CM CM
CM CM CM CM CM
co co vo cn m
r— i UD <T U"^ *^T
CD CD i-H CM ^f
f-^ f—i CM CO CD
cvj cn *^* f^1* co
cn co co r- vo
CD CD CD CD CD
cn cn cn cn cn
co O O "^ tn
CD co in <J3 r-*
CD CD O CD CD
CM CM CM CM CM
§
r— t
co cn r*>. cn
i vo ^ cn co
0 °. 0 rH
T*- vo 10 ^j. r^»
in co CM cn 0*^
'-'r-H CM ^j CO
CM 0 ° 0 CD
CO o '^ CO CO
CO ^ CM CO
cn cn ^ cn co
CD o ° CD CD
0 CO SJ 0 0
^o r^ ^ *-H ^"
CO CO CO CO f1^
CM CM CO CM CM
CM CM CvJ CM CM
co «s- CD co r-
CD co w> cn <=r
f— «
«=r in CM co r-<
co in CD CD in
r-^ vo m co CD
CM CM CM CM CM
CM CM CM CM CM
CO CO CO CO CO
CO O CD m in
O co u"> vo r^
O O CD CD CD
in in LO in in
o
CD
I— 1
1
I
I
I
I
a
B-38
I
I
i
i
i
I
i
i
i
i
i
image:
o
1
*
fr-4
CQ
<U
Vt
2*
CX CJ
§•0 o
c o
ra o
£I2£
0 >. i.
•*- .u
.0 ra a
I'll
C
a>
U T3 C7»
CJ 10 -r-
f\- o 6J P
f— >l
«- e-j- o
ai *^ in ij
•£•00 §,
O XI CJ
<U <•> l-r-
,Z t. a. „
u. i. g 4->
N
4-1
OJ rtj rtt c
M
r— tfm
ill
<. •
a e
CJ O O
g M e»
o>— u
•a <•- u
w <u o g
<a •
4-> CJ QJ
c a -a
u
.— S. e
i/i * * -f-*
o m £2 •-«
in co co ^
I ro CM ro r-.
0 0 °. 0
^* tn *o ^ CM
CO O CO •-' CO
•0- r-l O « CM
0 O 0 0 0
1
o cn i-« J'1 vo
^H cn co r** tn
en co co co co
0 <=» 0 0 o
CM O <g ^ ^
t^ co eo "» t_<
co ro " " «»
CM CM CM CM ^j
co co <•» £2 «*>
^r *3- xr ^^ ^3-
CM CM CM CM pj
CM CM CM CM pj
IO «J «D *° IO
CM CM CM CM f^j
o o T r~. m
m co «~< ^o r^.
o CM co ^r i^
^r 10 o r-i m
co r-. i^- *o «•
to ro co co ro
CO CO CO CO CO
CO CO CO CO CO
0 0 0 0 0
o o es o o
IA
en
s_
SoSg
o o o o
co in t— * co co
•cr ty VO CO ^"
*— * CD CD CD •"" *
00 *""" I± CO CO
^" CO CO CM CD
CO CO CO CO CO
CD CD CD CD CD
ro 10 «*•( co CD
CJ CM co ro m
^r *a- -sr ^r ^r
in 10 in in ui
CM CM CM CM CM
CM CM CM CM CM
CM CM CM CM CM
CD CM »5 r^. 7^
CM co '-D co cn
CD CD «-* CM *=*•
CM CD CO CD CO
in ,— i in cn co
cn cn co r-. ^°
ssisc!
co o CD m u"1
CD ro "^ vo r**
CD o CD o CD
i^ r^ r^ t^ r^
e
cn
t-
^H CM CO ^
CM CM CO "3
i *j- cn co *""*
CD O r-| CM
co r^» ^* co CM
«~* cvj f*1^ *—< m
CM ^-i CM *f WD
in o CD CD CD
O r*. cn t^. CM
CO r—t CO «^* CO
CO CO CM CM •-<
^H^r-l^ -H
cn LO cn ,— < co
vo r*^ co ,_ i *3"
»-< r-H »-l CM CM
CO CO CO CO CO
CM CM CM CM CM
CM CM CM CM CM
^* CM ^" cn cn
to cn cn ^r in
i— i
cr> cn co co co
£2 ° ^t f~l £J
CO CO *" "^" CD
CD CD CD CD CD
CM CM CM CM CM
cn cn cn cn cn
co CD CD tn in
o co "» vo r*-
CD O CD CD CD
CD CD CD CD CD
E
CD
in
CD
in
cn tn co ,-<
I . ji CO *^ ^~
,-f T-4 CM «;r
O CD O o
CD VO VO r-H CM
CD CO W> CO CO
O CD CD CD r-t
t~t CD CD CD O
CO O "=1" '•O CO
^4 ^H o cn co
co CO co r- r^
CD O CD CD CD
CM C** ^*" IO
Ch O CD *— • CM
«a- in LO in Ln
S:^:^^^:
CM CM CM CM CM
CM CM CM CM CM
co co vo cn m
r— i UD <T U"^ *^T
CD CD i-H CM ^f
f-^ f—i CM CO CD
cvj cn *^* f^1* co
cn co co r- vo
CD CD CD CD CD
cn cn cn cn cn
co O O "^ tn
CD co in <J3 r-*
CD CD O CD CD
CM CM CM CM CM
§
r— t
co cn r*>. cn
i vo ^ cn co
0 °. 0 rH
T*- vo 10 ^j. r^»
in co CM cn 0*^
'-'r-H CM ^j CO
CM 0 ° 0 CD
CO o '^ CO CO
CO ^ CM CO
cn cn ^ cn co
CD o ° CD CD
0 CO SJ 0 0
^o r^ ^ *-H ^"
CO CO CO CO f1^
CM CM CO CM CM
CM CM CvJ CM CM
co «s- CD co r-
CD co w> cn <=r
f— «
«=r in CM co r-<
co in CD CD in
r-^ vo m co CD
CM CM CM CM CM
CM CM CM CM CM
CO CO CO CO CO
CO O CD m in
O co u"> vo r^
O O CD CD CD
in in LO in in
o
CD
I— 1
1
I
I
I
I
a
B-38
I
I
i
i
i
I
i
i
i
i
i
image:
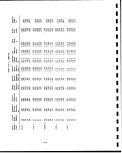 I
1
I
I
I
I
i
i
i
i
i
i
i
i
i
i
i
i
i
o
t-
o
o
.
1
CO
OJ
J3
1—
c/l
VI
<u
J- x
0-0)
E -o o
o c: o
<-> .-.
•S-o.2
o >. s-
-o °
O ro <U
> c£
>>
•r- O
in O
-"•» c; -^
c
E XJ -M
'•- QJ JZ
0- 0 'o> E
•— >>
(O 4-1
i- C •!- <J
0) .,- I/) U
= ra C -•-
'•? fe s fe
t/1 fc
£"3 i£r-
« — !_ O. "13
**- I- E *J
0) o 0 0
NJ
>» ."If V)
"O a) >••<->
QJ a3 03 JP
NI
4->
fl3 >
tr~ cj tn
+J 03 4-J
"c~5"c
i- .
oj c:
OJ o U
E <u <u
o , — t-
"O M— l_
<U <u o E
4-> QJ QJ
•^ W-» -0
I
i — o- c:
^ £ 0
CO CJ 4J
oj to r-i 1=3-
r^ CT* oj in
I »— I OJ <3" tO
O CD O O
O CD CD O O
CO CO O% P^. P^«
C\J r- 4 CD CTt P^.
CO CO CO P^. P-.
cn co I-H »-H co
o r-t oj co «=r
in in in in in
OJ OJ OJ OJ OJ
55555
CO CO CO CO CO
in in in in in
OJ OJ OJ OJ OJ
co CD ^r co r^-»
OJ CD OJ CD r--
CD r-t OJ O- ^O
p- CD co •-< en
to oj *=r in CD
co co P-* »JD in
CO CO CO CO CO
CO CO CO CO CO
co o o in in
^D co in 10 p*^
O CD CD CD CD
CO CO CO CO CO
CO OJ OJ OJ OJ
E
CD
en
4->
f^- oj en oj
*— i CD in o
i •-* co tn O
CD o o •-<
to i^> f— t co oj
1
to oo -c3- p-^ r^
CD CD o en en
,_, i— * ,_« CD CD
co CD to co en
LD (>D to r — o"1
co f> co ro <*">
^t^r.^r-
CO CO CO CO °O
CO f^ CO CO f^>
co f*^ co co ro
in tn tn to in
OO^C^CM^
<r co CM co «— '
r-< LO r~- oo <o
o o ,-. co r-
cTi u3 01 10 rsj
rt VO ^-, 0 •-!
01 co 03 r-» ">
o ^ o CD c>
CTI cr> 01 01 en
co o o in ir>
o <^> in vo r-^
o o o ca o
CM CM <\J CM CM
W
C3
01
4->
n o ,-1 ro
o o o o
Ss|gS
CO CO OJ ,_( CD
en cn cn en cn
00000
r-n ^j- cn vo to
OJ OJ OJ CO <3-
OJ OJ OJ OJ OJ
^^^^^
CO CO °^ CO CO
in in t^> in in
OJ OJ OJ oj OJ
CD *3- ** cn cn
^- cn P— cn to
CD CD »-* OJ -si-
tO CO CO CO CO
OJ CO f*^ *£) P^>
p-^ to ^> m *a-
CD O CD CD CD
in in "-o tn in
co CD CD m in
o co tn us rv
O O O CD O
CO CO CO CO CO
OJ OJ OJ OJ OJ
a
CD
cn
-M
co £* cn co
P-. ro co oj
1 T-4 OJ ^- CO
O O o O
SsSSs
i
to ^_i co CD in
t£> in ^ co CD
O o CD CD CD
^f CO f*> T-H CO
ir> in ^ p- co
CO CO f*^> CO CO
O CD CD CD CD
Ln tn ^n in in
co co ro co co
CO CO CO CO CO
CMOJOJCMOJ
CD to «d- r-- co
co cn co ^- u->
CD CD ' — ' CO \&
S *£ £ £?^
co co f*- to in
co co °o co co
CO CO CO CO CO
CO CD CD in in
CD ro W"J i^ f^.
CD O CD O O
^- ^j- *3~ «cj- ^f
OJ OJ OJ oj OJ
to
CD
CO
+->
CO OJ r- 1 OJ
i o t— i oj in
O O O CD
tn r-* co «=r cn
P^. r-* CO IO in
to CD CD CD T-H
O O O CD CD
CO OJ CO OJ tO
CD o cn p-»
CD o cn cn cn
p^ co CD in to
CO CO CO CO CO
CD O CD CD O
r-t «— I r— I t— I r— I
CO CO CO CO CO
O O O CD O
OJ OJ OJ OJ OJ
OJ OJ OJ OJ OJ
•cf co to p*^ cn
r-< oj i — in in
CD O O »-H CO
CO O tO CO OJ
CO OJ CO CO CO
co co r-* P^ to
ty\ cn CT> o% 01
CO CO CO CO OO
oo o o m in
o co in 10 P-*
O O CD O O
O 0 CD CD CD
OJ OJ OJ OJ OJ
t/1
CD
CD
«-H
+J
B-39
image:
I
1
I
I
I
I
i
i
i
i
i
i
i
i
i
i
i
i
i
o
t-
o
o
.
1
CO
OJ
J3
1—
c/l
VI
<u
J- x
0-0)
E -o o
o c: o
<-> .-.
•S-o.2
o >. s-
-o °
O ro <U
> c£
>>
•r- O
in O
-"•» c; -^
c
E XJ -M
'•- QJ JZ
0- 0 'o> E
•— >>
(O 4-1
i- C •!- <J
0) .,- I/) U
= ra C -•-
'•? fe s fe
t/1 fc
£"3 i£r-
« — !_ O. "13
**- I- E *J
0) o 0 0
NJ
>» ."If V)
"O a) >••<->
QJ a3 03 JP
NI
4->
fl3 >
tr~ cj tn
+J 03 4-J
"c~5"c
i- .
oj c:
OJ o U
E <u <u
o , — t-
"O M— l_
<U <u o E
4-> QJ QJ
•^ W-» -0
I
i — o- c:
^ £ 0
CO CJ 4J
oj to r-i 1=3-
r^ CT* oj in
I »— I OJ <3" tO
O CD O O
O CD CD O O
CO CO O% P^. P^«
C\J r- 4 CD CTt P^.
CO CO CO P^. P-.
cn co I-H »-H co
o r-t oj co «=r
in in in in in
OJ OJ OJ OJ OJ
55555
CO CO CO CO CO
in in in in in
OJ OJ OJ OJ OJ
co CD ^r co r^-»
OJ CD OJ CD r--
CD r-t OJ O- ^O
p- CD co •-< en
to oj *=r in CD
co co P-* »JD in
CO CO CO CO CO
CO CO CO CO CO
co o o in in
^D co in 10 p*^
O CD CD CD CD
CO CO CO CO CO
CO OJ OJ OJ OJ
E
CD
en
4->
f^- oj en oj
*— i CD in o
i •-* co tn O
CD o o •-<
to i^> f— t co oj
1
to oo -c3- p-^ r^
CD CD o en en
,_, i— * ,_« CD CD
co CD to co en
LD (>D to r — o"1
co f> co ro <*">
^t^r.^r-
CO CO CO CO °O
CO f^ CO CO f^>
co f*^ co co ro
in tn tn to in
OO^C^CM^
<r co CM co «— '
r-< LO r~- oo <o
o o ,-. co r-
cTi u3 01 10 rsj
rt VO ^-, 0 •-!
01 co 03 r-» ">
o ^ o CD c>
CTI cr> 01 01 en
co o o in ir>
o <^> in vo r-^
o o o ca o
CM CM <\J CM CM
W
C3
01
4->
n o ,-1 ro
o o o o
Ss|gS
CO CO OJ ,_( CD
en cn cn en cn
00000
r-n ^j- cn vo to
OJ OJ OJ CO <3-
OJ OJ OJ OJ OJ
^^^^^
CO CO °^ CO CO
in in t^> in in
OJ OJ OJ oj OJ
CD *3- ** cn cn
^- cn P— cn to
CD CD »-* OJ -si-
tO CO CO CO CO
OJ CO f*^ *£) P^>
p-^ to ^> m *a-
CD O CD CD CD
in in "-o tn in
co CD CD m in
o co tn us rv
O O O CD O
CO CO CO CO CO
OJ OJ OJ OJ OJ
a
CD
cn
-M
co £* cn co
P-. ro co oj
1 T-4 OJ ^- CO
O O o O
SsSSs
i
to ^_i co CD in
t£> in ^ co CD
O o CD CD CD
^f CO f*> T-H CO
ir> in ^ p- co
CO CO f*^> CO CO
O CD CD CD CD
Ln tn ^n in in
co co ro co co
CO CO CO CO CO
CMOJOJCMOJ
CD to «d- r-- co
co cn co ^- u->
CD CD ' — ' CO \&
S *£ £ £?^
co co f*- to in
co co °o co co
CO CO CO CO CO
CO CD CD in in
CD ro W"J i^ f^.
CD O CD O O
^- ^j- *3~ «cj- ^f
OJ OJ OJ oj OJ
to
CD
CO
+->
CO OJ r- 1 OJ
i o t— i oj in
O O O CD
tn r-* co «=r cn
P^. r-* CO IO in
to CD CD CD T-H
O O O CD CD
CO OJ CO OJ tO
CD o cn p-»
CD o cn cn cn
p^ co CD in to
CO CO CO CO CO
CD O CD CD O
r-t «— I r— I t— I r— I
CO CO CO CO CO
O O O CD O
OJ OJ OJ OJ OJ
OJ OJ OJ OJ OJ
•cf co to p*^ cn
r-< oj i — in in
CD O O »-H CO
CO O tO CO OJ
CO OJ CO CO CO
co co r-* P^ to
ty\ cn CT> o% 01
CO CO CO CO OO
oo o o m in
o co in 10 P-*
O O CD O O
O 0 CD CD CD
OJ OJ OJ OJ OJ
t/1
CD
CD
«-H
+J
B-39
image:
 I
.
§•§
ra «
e
en
CO
Qt
o. o .
to -J
.= £
s: to '
OJ O ,"? O
O O <-> I—
•o <
CD
in en
Bg
0 0
CO
CM
O
<0
O
O
<O CM
r-~ in
ro co
0 o
i-H CM
O o
CJ1
o
«a- cn
-3- CO
r~ o
0 0
10
in
O
1 —
I-H
O
in ro
cr> 10
f~~ r— 1
O i-H
cn cn
ro «3-
CM ro
o o
I-H cn
1 CO r;
o o
co cn 10
r-H cn «-<
t-H O CvJ
C\J o O
,-H ^J
co 2
CD ~|
Sg
s§
in
. 2
C3
2%
-s
^3- ^3-
ro ro
I-H *r
ro C3
*± I-H
cn ro
O r-H
O O
0
IT)
10
o
ID
cn
1—4
O
CM ID ^O rO
CM CM LO S?
i CM ro ^ £±
° ° °. .
^f id cn ro ro
r-H 0 0 •-> p^
CM O O O <— '
I
1
co o <=f CM r—
CO oo r- VD co
en en en en en
i—I CM in i—I IO
«-* CM co ^o CM
CD CD Cn Cn Cn
co CM o I-*- CM
•-H ,-H t—I O CD
o «=r «=r O r
cor- in in
CO CO CO CO
o o o o o
r*+ en ^r CM ,—i
co co en o CM
co co co <=3~ *=r
r-H t-H CD CD O
tn «—« CO O
CO Cn O CM
co co *a- «*• «
CO
,- co cn CM
f-H CM co tn en
co co co ro co
"^ UD CM CTl f—I
CM CM co co in
CM CM CM CM CM
o o o o o
^H en en co
l CM CM 2 "2
'
» O CD CD CD
> co co co ro
O O O O
CM CM CM CM CM
CM CM CM* CM CM
CO CO CO CO CO
CM CM CM CM CM
^
CO CO CO CO
CM CM CM CM C
CM CM CM CM CM
CM CM CM CM CM
Uj VO VO V^ VO
O CO
"
^
VD CD CO
- CM CO CO
" VO tD O
^T 1^. CM
to CM f-^. i
*$• O CO I
* CM 10 CO *
CM CM CM CM CM
co t^ co ro in
22 CO en in co
O O rH CO in
CM CM CM CM CM
csj CM «3-
m *z- r*
O »-( CM
i
1
I
I
»
en vo ^H
in co en I-H t
t-H ^3- CM r-» ^
co r^ io -ea-
«> f-H in O en
co tn co o r-»
co co r^» r- in
r^. r-H in in r-j
CM r-> en en co
en co r— ^ m
I
CM CM CM CM CM
CO CO CO CO CO
in tn in in in
co co co co co
CO CO CO CO CO
en en en en en
CO CO CO CO CO
en en en en en
o o CD CD CD
en en en en en
So CD m to
co in *5 r^.
CD o CD o o
co o CD in in
o co in ^o r^
O O CD CD O
co o o u-) tn
CD CO Ln \o £;
O O O o CD
co o o in in
o co in vo r—
O o CD O CD
co o o ""> in
o co in UD r^
o o o o o
CM CM CM CM CM
CM CM CM CM CM
CO CO CO CO CO
CO CO CO CO CO
CO
-p
B-40
I
I
i
1
I
I
image:
I
.
§•§
ra «
e
en
CO
Qt
o. o .
to -J
.= £
s: to '
OJ O ,"? O
O O <-> I—
•o <
CD
in en
Bg
0 0
CO
CM
O
<0
O
O
<O CM
r-~ in
ro co
0 o
i-H CM
O o
CJ1
o
«a- cn
-3- CO
r~ o
0 0
10
in
O
1 —
I-H
O
in ro
cr> 10
f~~ r— 1
O i-H
cn cn
ro «3-
CM ro
o o
I-H cn
1 CO r;
o o
co cn 10
r-H cn «-<
t-H O CvJ
C\J o O
,-H ^J
co 2
CD ~|
Sg
s§
in
. 2
C3
2%
-s
^3- ^3-
ro ro
I-H *r
ro C3
*± I-H
cn ro
O r-H
O O
0
IT)
10
o
ID
cn
1—4
O
CM ID ^O rO
CM CM LO S?
i CM ro ^ £±
° ° °. .
^f id cn ro ro
r-H 0 0 •-> p^
CM O O O <— '
I
1
co o <=f CM r—
CO oo r- VD co
en en en en en
i—I CM in i—I IO
«-* CM co ^o CM
CD CD Cn Cn Cn
co CM o I-*- CM
•-H ,-H t—I O CD
o «=r «=r O r
cor- in in
CO CO CO CO
o o o o o
r*+ en ^r CM ,—i
co co en o CM
co co co <=3~ *=r
r-H t-H CD CD O
tn «—« CO O
CO Cn O CM
co co *a- «*• «
CO
,- co cn CM
f-H CM co tn en
co co co ro co
"^ UD CM CTl f—I
CM CM co co in
CM CM CM CM CM
o o o o o
^H en en co
l CM CM 2 "2
'
» O CD CD CD
> co co co ro
O O O O
CM CM CM CM CM
CM CM CM* CM CM
CO CO CO CO CO
CM CM CM CM CM
^
CO CO CO CO
CM CM CM CM C
CM CM CM CM CM
CM CM CM CM CM
Uj VO VO V^ VO
O CO
"
^
VD CD CO
- CM CO CO
" VO tD O
^T 1^. CM
to CM f-^. i
*$• O CO I
* CM 10 CO *
CM CM CM CM CM
co t^ co ro in
22 CO en in co
O O rH CO in
CM CM CM CM CM
csj CM «3-
m *z- r*
O »-( CM
i
1
I
I
»
en vo ^H
in co en I-H t
t-H ^3- CM r-» ^
co r^ io -ea-
«> f-H in O en
co tn co o r-»
co co r^» r- in
r^. r-H in in r-j
CM r-> en en co
en co r— ^ m
I
CM CM CM CM CM
CO CO CO CO CO
in tn in in in
co co co co co
CO CO CO CO CO
en en en en en
CO CO CO CO CO
en en en en en
o o CD CD CD
en en en en en
So CD m to
co in *5 r^.
CD o CD o o
co o CD in in
o co in ^o r^
O O CD CD O
co o o u-) tn
CD CO Ln \o £;
O O O o CD
co o o in in
o co in vo r—
O o CD O CD
co o o ""> in
o co in UD r^
o o o o o
CM CM CM CM CM
CM CM CM CM CM
CO CO CO CO CO
CO CO CO CO CO
CO
-p
B-40
I
I
i
1
I
I
image:
 III. CONCLUSIONS AND RECOMMENDATIONS . .
1. A softer less brittle material after placement seems desirable for
most of the specimens tested. Apparently the angularity and harshness of
silt and sand sized particles in most mixes is the cause of a relatively
high angle of internal friction for the peak shear strengths and residual
shear strengths found after yielding. Such high strengths do not :seem
necessary nor desirable and should be traded off for lower angles of
friction through less compaction, some heap mellowing time which will allow
more particle surface roughening and floculation and looser compaction while
retaining some measure of swelling and shrinkage stability, and/or addition
or generation of some quantity of clayish material. The latter can
apparently be made from certain spent oil shales by autoclave mellbwing but
it may be more economical to add clay from other sources. Trial of further
autoclave mellowed or other mellowed materials seems desirable. j
2. Trial of addition of clay or other similar fines to reduc'e
permeability in the case of the TOSCO II spent shale or the average Lurgi
spent shale is desirable. This could be an added component or could be
generated from autoclaving an especially active burned spent shale such as
the burned TOSCO material. |
3. Ring shear tests should be made to get 0R at large displacements
for several examples of candidate liner material. ;
4. The cementing characteristics of burned spent shale seem to be a
detriment to self healing as any shear movement needed for closure; of a
vertical tension crack by "caving in" of liner material would produce shear
plane separated fragments. The planes may be possible water channels.
Moreover the depth into the liner away from the tension crack for la source
of fill material will be less for high shear strength liner material.
Extrusion of a non brittle plastic liner material, into a tension'crack, on
the other hand, should not produce such distinct planes. Autoclave
mellowing inhibi-ts cementation of materials. i '
5. The high friction angles observed in most of the liner specimens
tested are useful in that there will be less tendency for a pile of spent
oil shale founded on a liner to slip down a valley. Silty sandy materials
producing high friction angles are generally rather permeable and luncemented
specimens of the materials here tested are no exception. To reduc'e perme-
ability clay sized material can be mixed in or a non strength producing fine
precipitate or colloid within the interstitial spaces of the siltjgrains
might conceivably be internally generated. In this way a synthetic boulder
clay having both low permeability yet a reasonably high friction amgle might
be produced. :
r
6. Quick clay inadvertently made in any of the above ways should be
avoided. Even a material that has only a little above critical vo;id volume
should be suspect until proven unlikely to soften or liquify whenisubjected
to slip or earthquake produced shear. Even though a liner material! in
unsaturated condition may not soften or liquify the same material ;when
.B-41
image:
III. CONCLUSIONS AND RECOMMENDATIONS . .
1. A softer less brittle material after placement seems desirable for
most of the specimens tested. Apparently the angularity and harshness of
silt and sand sized particles in most mixes is the cause of a relatively
high angle of internal friction for the peak shear strengths and residual
shear strengths found after yielding. Such high strengths do not :seem
necessary nor desirable and should be traded off for lower angles of
friction through less compaction, some heap mellowing time which will allow
more particle surface roughening and floculation and looser compaction while
retaining some measure of swelling and shrinkage stability, and/or addition
or generation of some quantity of clayish material. The latter can
apparently be made from certain spent oil shales by autoclave mellbwing but
it may be more economical to add clay from other sources. Trial of further
autoclave mellowed or other mellowed materials seems desirable. j
2. Trial of addition of clay or other similar fines to reduc'e
permeability in the case of the TOSCO II spent shale or the average Lurgi
spent shale is desirable. This could be an added component or could be
generated from autoclaving an especially active burned spent shale such as
the burned TOSCO material. |
3. Ring shear tests should be made to get 0R at large displacements
for several examples of candidate liner material. ;
4. The cementing characteristics of burned spent shale seem to be a
detriment to self healing as any shear movement needed for closure; of a
vertical tension crack by "caving in" of liner material would produce shear
plane separated fragments. The planes may be possible water channels.
Moreover the depth into the liner away from the tension crack for la source
of fill material will be less for high shear strength liner material.
Extrusion of a non brittle plastic liner material, into a tension'crack, on
the other hand, should not produce such distinct planes. Autoclave
mellowing inhibi-ts cementation of materials. i '
5. The high friction angles observed in most of the liner specimens
tested are useful in that there will be less tendency for a pile of spent
oil shale founded on a liner to slip down a valley. Silty sandy materials
producing high friction angles are generally rather permeable and luncemented
specimens of the materials here tested are no exception. To reduc'e perme-
ability clay sized material can be mixed in or a non strength producing fine
precipitate or colloid within the interstitial spaces of the siltjgrains
might conceivably be internally generated. In this way a synthetic boulder
clay having both low permeability yet a reasonably high friction amgle might
be produced. :
r
6. Quick clay inadvertently made in any of the above ways should be
avoided. Even a material that has only a little above critical vo;id volume
should be suspect until proven unlikely to soften or liquify whenisubjected
to slip or earthquake produced shear. Even though a liner material! in
unsaturated condition may not soften or liquify the same material ;when
.B-41
image:
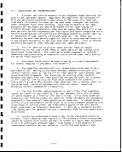 1
saturated may soften under shear strains. This must be predictable and a*
eventually probably must be studied for any candidate liner material. |j|
7. The "final" secondary compression rates or Ca for none of the _.
materials, when measurements ceased just before torsion testing, was ex- »
cessive. Rates below 2% settlement at 10,000 years by extrapolation were &
about as large as observed. Much lower rates were more typical. However
since the settlement vs log time curves plotted were often concave downward j|j
specimens should be followed for longer periods and chemistry of the fl
apparent softening with age ascertained.
8. The effect of additives on spent shale should be further studied in ffl
a more methodical experimental design. Gradations of mixes between silty m
spent shale and clayish material should be tested for the following:
1. Permeability m
2. Shear strength by a quick method relative to the permeability m
so any softening due to reduction of soil skeleton volume
during shear is observable. ffl
3. Shear strength of both saturated and unsaturated material ||
should be studied..
Well mixed or pugged materials should be used or fines should be generated
internally. n
9. Possible methods for in situ fines generation include the
following: II
a. Mix two slow precipitating liquid intereactants in with the p
spent shale.
b. Mix in one liquid reactant which reacts with the spent shale «g
itself. •
c. Mix in a solid reactant which reacts with the spent shale. ^
The spent shale base for the mixture should not be burned spent shale ffl
to avoid the cementation already demonstrated but one such as TOSCO II t§
material. Perhaps mildly autoclave mellowed burned spent shale would not
cement even though much ettringite may be initially formed. m
10. Periodic non destructive resonant measurement of shear modulus G
may be valuable for following development of any cementation in a given ^
specimen as curing or aging precedes. EGA and to a lessor degree x-ray II
diffraction may also be done on the same specimen without affecting G since '*•
such small samples are required.
11. Experiments with physical models of liner materials should be made H
in which a tension crack is induced in brittle containment strata and the
ability of liner material to suppress water flow as the crack opens is «
measured. It is desirable to be able to perform meaningful experiments of •
this sort without the need for continuous high vertical pressures during
aging of the liner. Strong forces at the time of, say, flexing or
stretching a model to generate a tension crack would, of course be necessary M
however. Proof is desirable that proctor or other compacted liner material P
in such a model approximates a real liner aged with considerable overburden
pressure. ffl
1
I
B-42 . m
I
image:
1
saturated may soften under shear strains. This must be predictable and a*
eventually probably must be studied for any candidate liner material. |j|
7. The "final" secondary compression rates or Ca for none of the _.
materials, when measurements ceased just before torsion testing, was ex- »
cessive. Rates below 2% settlement at 10,000 years by extrapolation were &
about as large as observed. Much lower rates were more typical. However
since the settlement vs log time curves plotted were often concave downward j|j
specimens should be followed for longer periods and chemistry of the fl
apparent softening with age ascertained.
8. The effect of additives on spent shale should be further studied in ffl
a more methodical experimental design. Gradations of mixes between silty m
spent shale and clayish material should be tested for the following:
1. Permeability m
2. Shear strength by a quick method relative to the permeability m
so any softening due to reduction of soil skeleton volume
during shear is observable. ffl
3. Shear strength of both saturated and unsaturated material ||
should be studied..
Well mixed or pugged materials should be used or fines should be generated
internally. n
9. Possible methods for in situ fines generation include the
following: II
a. Mix two slow precipitating liquid intereactants in with the p
spent shale.
b. Mix in one liquid reactant which reacts with the spent shale «g
itself. •
c. Mix in a solid reactant which reacts with the spent shale. ^
The spent shale base for the mixture should not be burned spent shale ffl
to avoid the cementation already demonstrated but one such as TOSCO II t§
material. Perhaps mildly autoclave mellowed burned spent shale would not
cement even though much ettringite may be initially formed. m
10. Periodic non destructive resonant measurement of shear modulus G
may be valuable for following development of any cementation in a given ^
specimen as curing or aging precedes. EGA and to a lessor degree x-ray II
diffraction may also be done on the same specimen without affecting G since '*•
such small samples are required.
11. Experiments with physical models of liner materials should be made H
in which a tension crack is induced in brittle containment strata and the
ability of liner material to suppress water flow as the crack opens is «
measured. It is desirable to be able to perform meaningful experiments of •
this sort without the need for continuous high vertical pressures during
aging of the liner. Strong forces at the time of, say, flexing or
stretching a model to generate a tension crack would, of course be necessary M
however. Proof is desirable that proctor or other compacted liner material P
in such a model approximates a real liner aged with considerable overburden
pressure. ffl
1
I
B-42 . m
I
image:
 IV. REFERENCES :
i
Ingles, O.6., "Soil Chemistry Relevant to the Engineering Behavior of Soils"
in I.K. Lee, Editor, Soil Mechanics Selected Topics, American Elslevier
Publishing Co., Inc., New York 1968. i
Townsend, F.C. and R.W. Peterson, Geotechm'cal Properties of Oil Shale
Retorted by the Paraho and TOSCO Processes, Tech. Rept. 61-79-22,^
Geotechm'cal Laboratory, U.S. Army Engineer Waterways Experiment Station.
Vicksburg Miss. For U.S. Dept. of Interior, Bur. of Mines, Spokape Mining
Research Center, Spokane Wash. Under Contract No. H0262064. !
B-43
image:
IV. REFERENCES :
i
Ingles, O.6., "Soil Chemistry Relevant to the Engineering Behavior of Soils"
in I.K. Lee, Editor, Soil Mechanics Selected Topics, American Elslevier
Publishing Co., Inc., New York 1968. i
Townsend, F.C. and R.W. Peterson, Geotechm'cal Properties of Oil Shale
Retorted by the Paraho and TOSCO Processes, Tech. Rept. 61-79-22,^
Geotechm'cal Laboratory, U.S. Army Engineer Waterways Experiment Station.
Vicksburg Miss. For U.S. Dept. of Interior, Bur. of Mines, Spokape Mining
Research Center, Spokane Wash. Under Contract No. H0262064. !
B-43
image:
 1
I
f
I
I
f
I
1
f
I
i
I
I
I
I
1
I
1
image:
1
I
f
I
I
f
I
1
f
I
i
I
I
I
I
1
I
1
image: