<pubnumber>520178001B</pubnumber>
<title>Protected Action Evaluation: Part II - the Effectiveness of Sheltering as a Protective Action Against Nuclear Accidents Involving Gaseous Releases</title>
<pages>71</pages>
<pubyear>1978</pubyear>
<provider>NEPIS</provider>
<access>online</access>
<origin>hardcopy</origin>
<author></author>
<publisher></publisher>
<subject></subject>
<abstract></abstract>
<operator>LM</operator>
<scandate>20101124</scandate>
<type>single page tiff</type>
<keyword></keyword>
United States Washington EPA 520/1-78-001B
Environmental Protection DC 20460
Agency
Radiation
&EPA Protective Action Evaluation
Part II
The Effectiveness of
Sheltering as a
Protective Action Against
Nuclear Accide its Involving
Ga eous Releases
image:
 LEGAL NOTICE
This report was prepared as an account of work sponsored by
the Environmental Protection Agency of the United States Govern-
ment under Contract No. 68-01-3223. Neither the United States
nor the United States Environmental Protection Agency makes any
warranty, express or implied, or assumes any legal liability or
responsibility for the accuracy, completeness or usefulness of
any information, apparatus, product or process disclosed, or
represents that its use would not infringe privately owned
rights.
image:
LEGAL NOTICE
This report was prepared as an account of work sponsored by
the Environmental Protection Agency of the United States Govern-
ment under Contract No. 68-01-3223. Neither the United States
nor the United States Environmental Protection Agency makes any
warranty, express or implied, or assumes any legal liability or
responsibility for the accuracy, completeness or usefulness of
any information, apparatus, product or process disclosed, or
represents that its use would not infringe privately owned
rights.
image:
 PROTECTIVE ACTION EVALUATION
PART II
THE EFFECTIVENESS OF SHELTERING AS A
PROTECTIVE ACTION AGAINST NUCLEAR
ACCIDENTS INVOLVING GASEOUS RELEASES
APRIL 1978
George H. Anno
Michael A. Dore
Prepared for
U.S. Environmental Protection Agency
Office of Radiation Programs
Washington, D.C. 20460
image:
PROTECTIVE ACTION EVALUATION
PART II
THE EFFECTIVENESS OF SHELTERING AS A
PROTECTIVE ACTION AGAINST NUCLEAR
ACCIDENTS INVOLVING GASEOUS RELEASES
APRIL 1978
George H. Anno
Michael A. Dore
Prepared for
U.S. Environmental Protection Agency
Office of Radiation Programs
Washington, D.C. 20460
image:
 ill
FOREWORD
The Office of Radiation Programs carries out a national
program designed to evaluate the exposure of man to ionizing
and nonionizing radiation, and to promote the development of
controls necessary to protect the public health and safety
and assure environmental quality.
Office of Radiation Programs technical reports allow
comprehensive and rapid publishing of the results of intra-
mural and contract projects. The reports are distributed to
groups who have known interests in this type of information
such as the Nuclear Regulatory Commission, the Department of
Energy, and State radiation control agencies. These reports
are also provided to the National Technical Information Service
in order that they may be readily available to the scientific
community and to the public.
Comments on this report, as well as any new information,
would be welcomed; they may be sent to the Director, Environ-
mental Analysis Division (AW-461), Office of Radiation Programs,
U.S. Environmental Protection Agency, Washington, D.C. 20460.
W. D. Rowe, Ph.D.
Deputy Assistant Administrator
for Radiation Programs
image:
ill
FOREWORD
The Office of Radiation Programs carries out a national
program designed to evaluate the exposure of man to ionizing
and nonionizing radiation, and to promote the development of
controls necessary to protect the public health and safety
and assure environmental quality.
Office of Radiation Programs technical reports allow
comprehensive and rapid publishing of the results of intra-
mural and contract projects. The reports are distributed to
groups who have known interests in this type of information
such as the Nuclear Regulatory Commission, the Department of
Energy, and State radiation control agencies. These reports
are also provided to the National Technical Information Service
in order that they may be readily available to the scientific
community and to the public.
Comments on this report, as well as any new information,
would be welcomed; they may be sent to the Director, Environ-
mental Analysis Division (AW-461), Office of Radiation Programs,
U.S. Environmental Protection Agency, Washington, D.C. 20460.
W. D. Rowe, Ph.D.
Deputy Assistant Administrator
for Radiation Programs
image:
 IV
PREFACE
The material contained in this report was sponsored by the
U.S. Environmental Protection Agency under the technical guidance
of Mr. J. Logsdon of the Office of Radiation Programs, Environ-
mental Analysis Division. Based on a study to assess the
application and utility of sheltering and evacuation as specific
protective measures in the event of accidental releases of gaseous
radioactive material from nuclear power plants, this report is
the first of two that deal specifically with the effectiveness of
public shelter structures.
The second report evaluates both sheltering and evacuation
protection measures from the standpoint of providing technical
guidance in formulating emergency planning procedures.
The purpose of this contract report is to provide a technical
basis for EPA to develop guidance with regard to actions to protect
the public from accidental airborne releases of radioactive material
from nuclear power facilities. The information in this report should
not be construed as guidance from EPA to State and local officials
in development of their radiological emergency response plans. Such
guidance will be published in the "Manual of Protective Action Guides
and Protective Actions for Nuclear Incidents," currently under de-
velopment by the EPA Office of Radiation Programs. The Environmental
Protection Agency is making this report available as a source of
technical information.
image:
IV
PREFACE
The material contained in this report was sponsored by the
U.S. Environmental Protection Agency under the technical guidance
of Mr. J. Logsdon of the Office of Radiation Programs, Environ-
mental Analysis Division. Based on a study to assess the
application and utility of sheltering and evacuation as specific
protective measures in the event of accidental releases of gaseous
radioactive material from nuclear power plants, this report is
the first of two that deal specifically with the effectiveness of
public shelter structures.
The second report evaluates both sheltering and evacuation
protection measures from the standpoint of providing technical
guidance in formulating emergency planning procedures.
The purpose of this contract report is to provide a technical
basis for EPA to develop guidance with regard to actions to protect
the public from accidental airborne releases of radioactive material
from nuclear power facilities. The information in this report should
not be construed as guidance from EPA to State and local officials
in development of their radiological emergency response plans. Such
guidance will be published in the "Manual of Protective Action Guides
and Protective Actions for Nuclear Incidents," currently under de-
velopment by the EPA Office of Radiation Programs. The Environmental
Protection Agency is making this report available as a source of
technical information.
image:
 TABLE OF CONTENTS
PREFACE iii
I. INTRODUCTION 1
II. ANALYSIS 3
RADIONUCLIDE SOURCE 3
TIME-FRAME MODEL 5
EVACUATION VEHICLE 10
DOSE REDUCTION FACTOR 13
DOSE COMPONENTS—NO EVACUATION 15
DOSE COMPONENTS—EVACUATION 17
III. RESULTS 21
DOSE REDUCTION FACTORS—SHELTERING AND EVACUATION . . 21
EVACUATE OR SHELTER? 35
IV. CONCLUSIONS AND RECOMMENDATIONS 51
APPENDIX A: LIST OF TERMS 57
APPENDIX B: DOSE REDUCTION FACTOR F-FUNCTIONS 59
REFERENCES 63
image:
TABLE OF CONTENTS
PREFACE iii
I. INTRODUCTION 1
II. ANALYSIS 3
RADIONUCLIDE SOURCE 3
TIME-FRAME MODEL 5
EVACUATION VEHICLE 10
DOSE REDUCTION FACTOR 13
DOSE COMPONENTS—NO EVACUATION 15
DOSE COMPONENTS—EVACUATION 17
III. RESULTS 21
DOSE REDUCTION FACTORS—SHELTERING AND EVACUATION . . 21
EVACUATE OR SHELTER? 35
IV. CONCLUSIONS AND RECOMMENDATIONS 51
APPENDIX A: LIST OF TERMS 57
APPENDIX B: DOSE REDUCTION FACTOR F-FUNCTIONS 59
REFERENCES 63
image:
 vi
LIST OF FIGURES
Fig. 1 — Evacuation Time-Frame ................. 7
2 — Air Exchange and Infiltration Rates in Closed Passenger
Compartment When Air Conditioning is Set at a Maximum 12
3 — Evacuation and Sheltering WB DRF Versus T Case A
(T -1.5,1 -1,1 =0.5) .......... 7 ...... 23
K a e
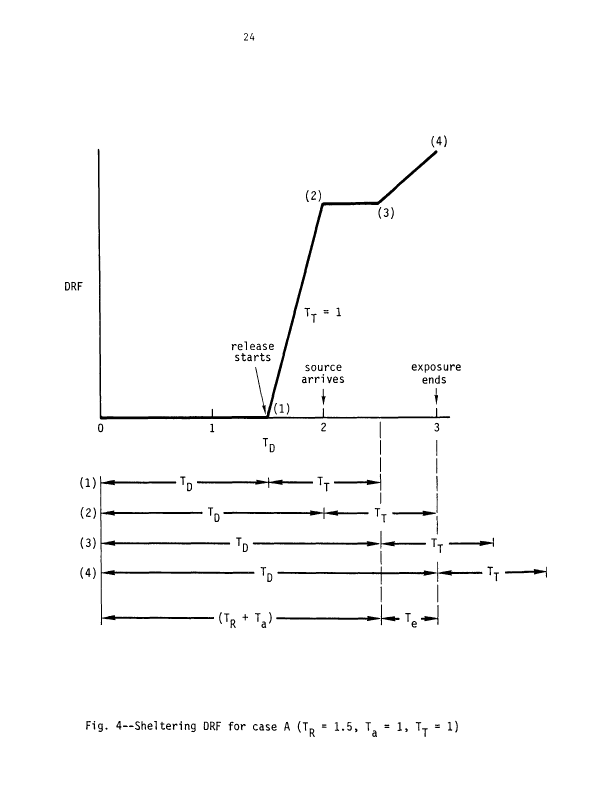
4— Sheltering DRF for Case A (1-1.5,1 =1,T =1) ..... 24
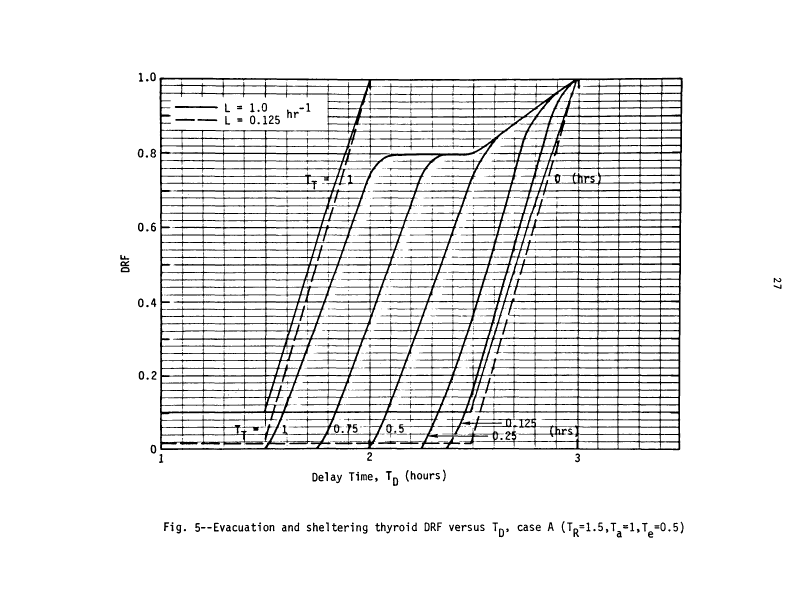
5 — Evacuation and Sheltering Thyroid DRF Versus T , Case A
(1-1.5,1 -1,1 =0.5) .................
K. 36
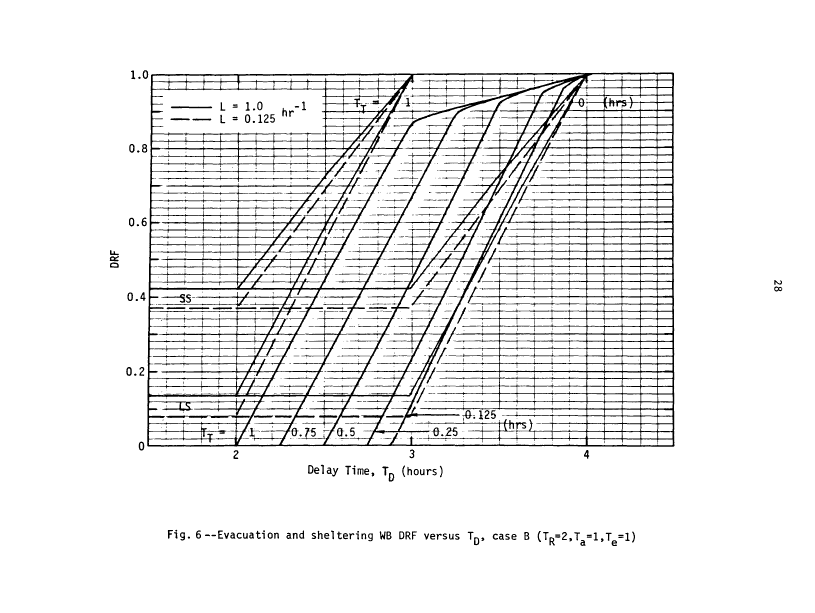
6 — Evacuation and Sheltering WB DRF Versus T , Case B
28
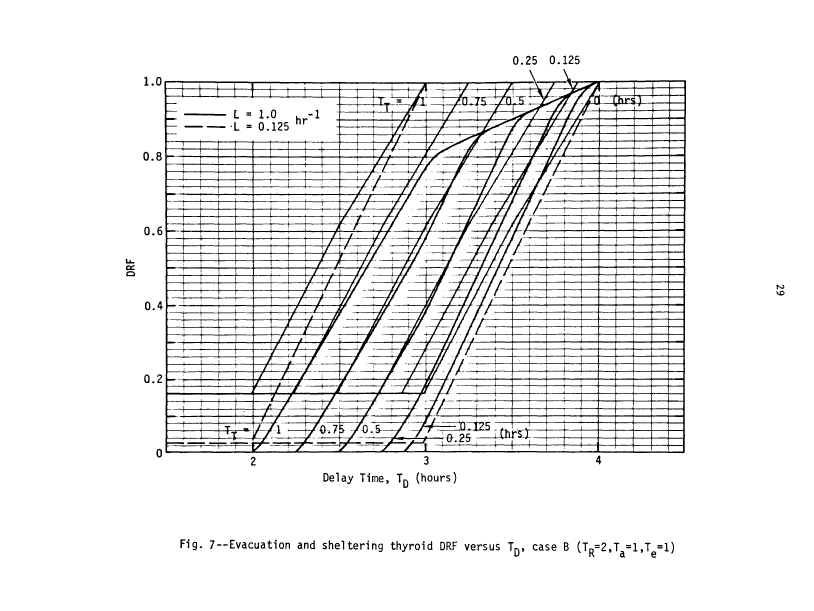
7 — Evacuation and Sheltering Thyroid DRF Versus 1 ,
Case B (lR=2,la=l,le=l) ................ 29
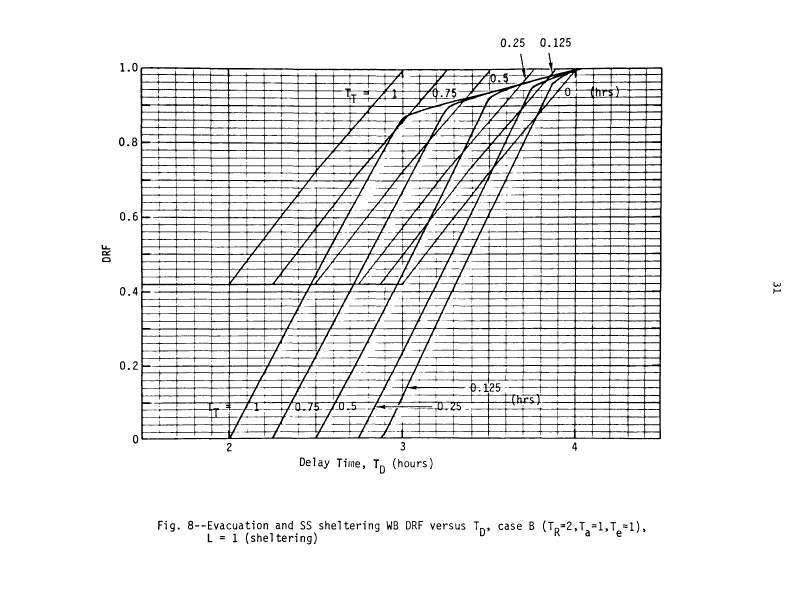
8 — Evacuation and SS Sheltering WB DRF Versus T , Case B
(1-2,1-1,1-1), L = 1 (Sheltering) .......... 31
J\ a C
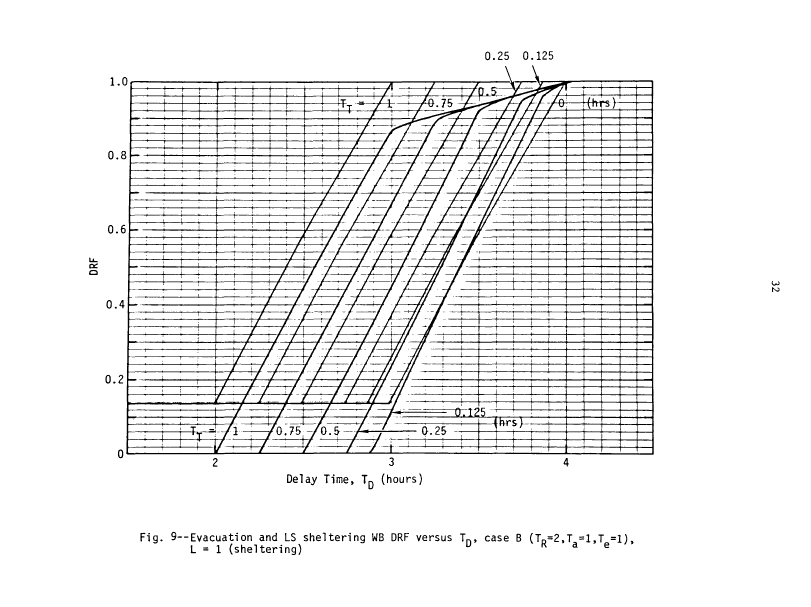
9 — Evacuation and LS Sheltering WB DRF Versus 1 , Case B
(T -2,1 -1,1 =1), L = 1 (Sheltering) . . . . ...... 32
K. 3. G
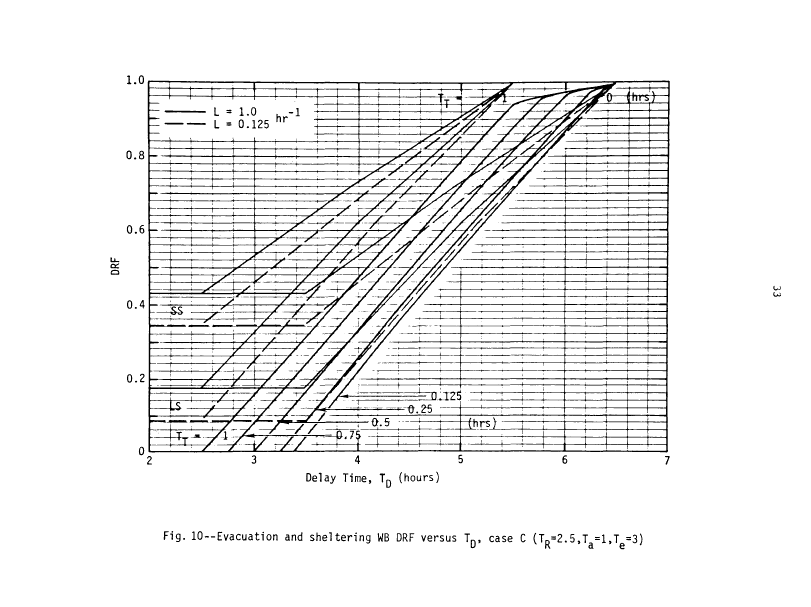
10 — Evacuation and Sheltering WB DRF Versus T_, Case C
(ln-2.5,l -1,1 =3) .................. 33
K 3. G
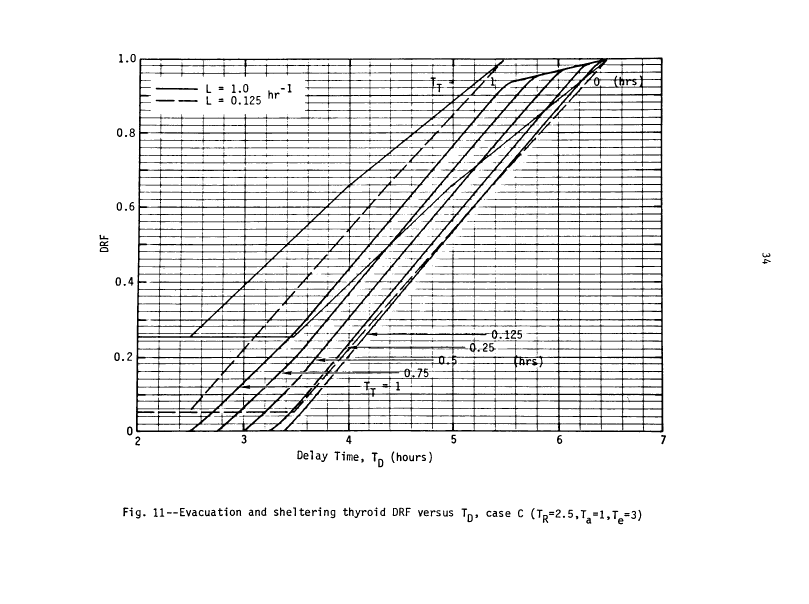
11 — Evacuation and Sheltering Thyroid DRF Versus 1 ,
Case C (1-2.5,1 -1,1 =3) . .' ........ T .... 34
K. Si Q.
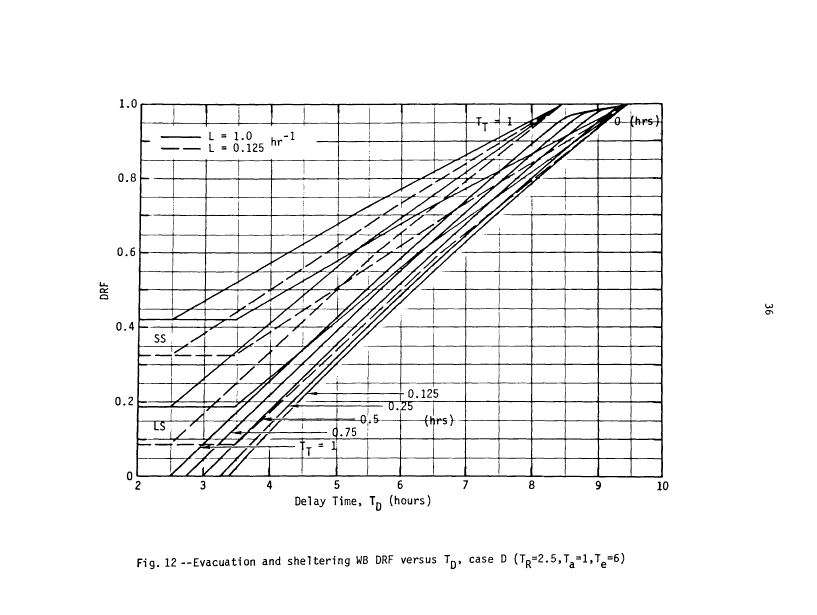
12 — Evacuation and Sheltering WB DRF Versus T , Case D
(lR-2.5,la-l,le-6) ........... .....!. 36
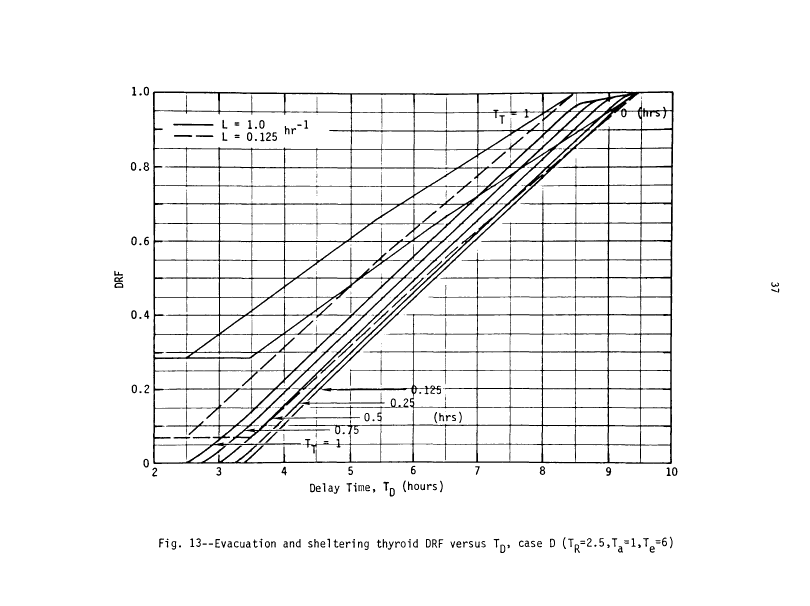
13 — Evacuation and Sheltering Thyroid DRF Versus 1 ,
Case D (I =2.5,1 -1,1 =6) .......... T .... 37
K. 3. Q.
14a&b — Evacuate or Shelter? ................ 39
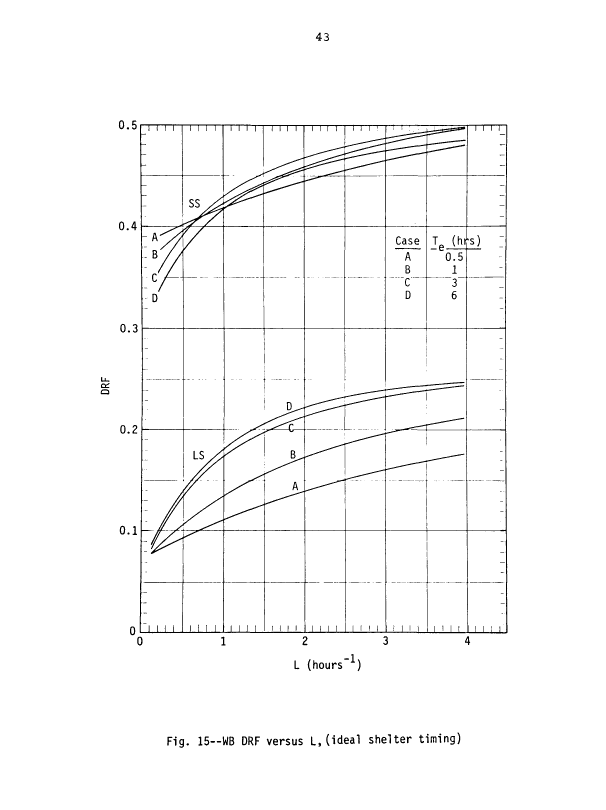
15— WB DRF Versus L, (Ideal Shelter Timing) ........ 42
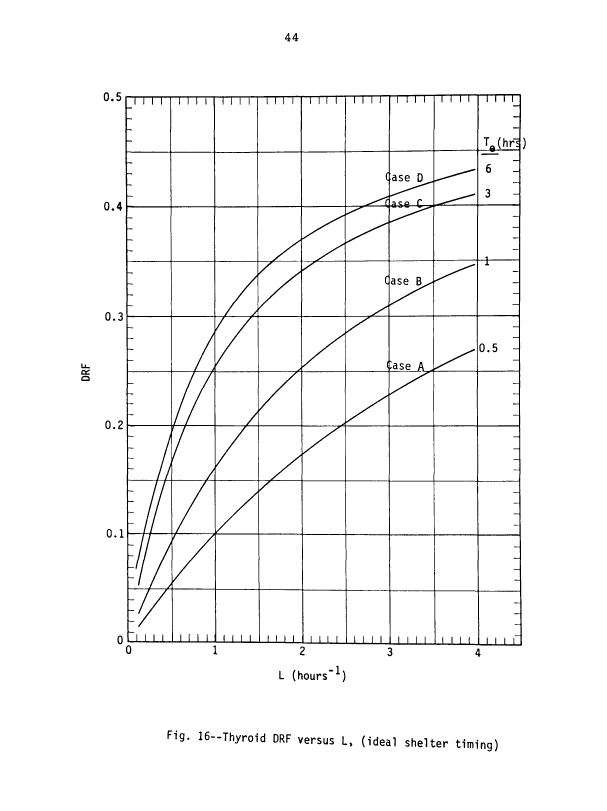
16— Thyroid DRF Versus L, (Ideal Shelter liming) ..... 43
17 — M Versus Cloud Exposure Time ............. 44
image:
vi
LIST OF FIGURES
Fig. 1 — Evacuation Time-Frame ................. 7
2 — Air Exchange and Infiltration Rates in Closed Passenger
Compartment When Air Conditioning is Set at a Maximum 12
3 — Evacuation and Sheltering WB DRF Versus T Case A
(T -1.5,1 -1,1 =0.5) .......... 7 ...... 23
K a e
4— Sheltering DRF for Case A (1-1.5,1 =1,T =1) ..... 24
5 — Evacuation and Sheltering Thyroid DRF Versus T , Case A
(1-1.5,1 -1,1 =0.5) .................
K. 36
6 — Evacuation and Sheltering WB DRF Versus T , Case B
28
7 — Evacuation and Sheltering Thyroid DRF Versus 1 ,
Case B (lR=2,la=l,le=l) ................ 29
8 — Evacuation and SS Sheltering WB DRF Versus T , Case B
(1-2,1-1,1-1), L = 1 (Sheltering) .......... 31
J\ a C
9 — Evacuation and LS Sheltering WB DRF Versus 1 , Case B
(T -2,1 -1,1 =1), L = 1 (Sheltering) . . . . ...... 32
K. 3. G
10 — Evacuation and Sheltering WB DRF Versus T_, Case C
(ln-2.5,l -1,1 =3) .................. 33
K 3. G
11 — Evacuation and Sheltering Thyroid DRF Versus 1 ,
Case C (1-2.5,1 -1,1 =3) . .' ........ T .... 34
K. Si Q.
12 — Evacuation and Sheltering WB DRF Versus T , Case D
(lR-2.5,la-l,le-6) ........... .....!. 36
13 — Evacuation and Sheltering Thyroid DRF Versus 1 ,
Case D (I =2.5,1 -1,1 =6) .......... T .... 37
K. 3. Q.
14a&b — Evacuate or Shelter? ................ 39
15— WB DRF Versus L, (Ideal Shelter Timing) ........ 42
16— Thyroid DRF Versus L, (Ideal Shelter liming) ..... 43
17 — M Versus Cloud Exposure Time ............. 44
image:
 vii
LIST OF TABLES
Table
1 Radionuclide Source Data 4
2 Evacuation Dose Components 18
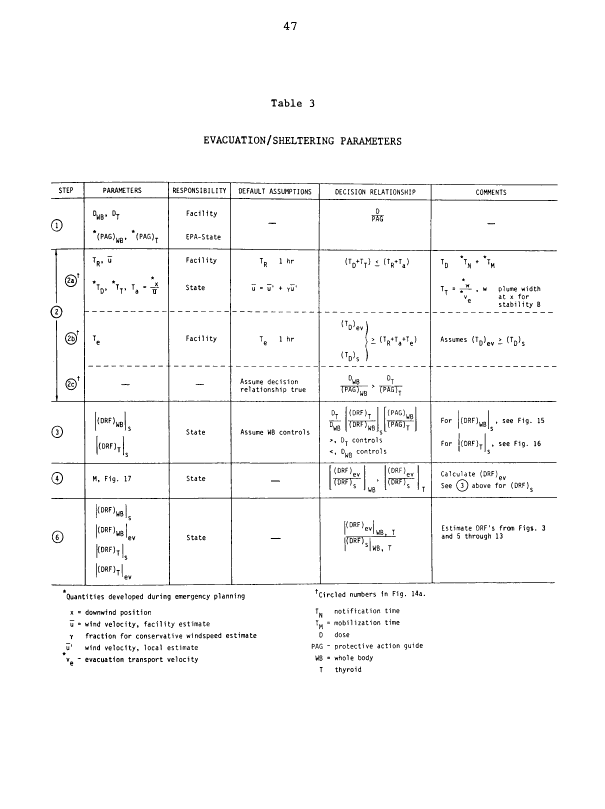
3 Evacuation/Sheltering Parameters 46
image:
vii
LIST OF TABLES
Table
1 Radionuclide Source Data 4
2 Evacuation Dose Components 18
3 Evacuation/Sheltering Parameters 46
image:
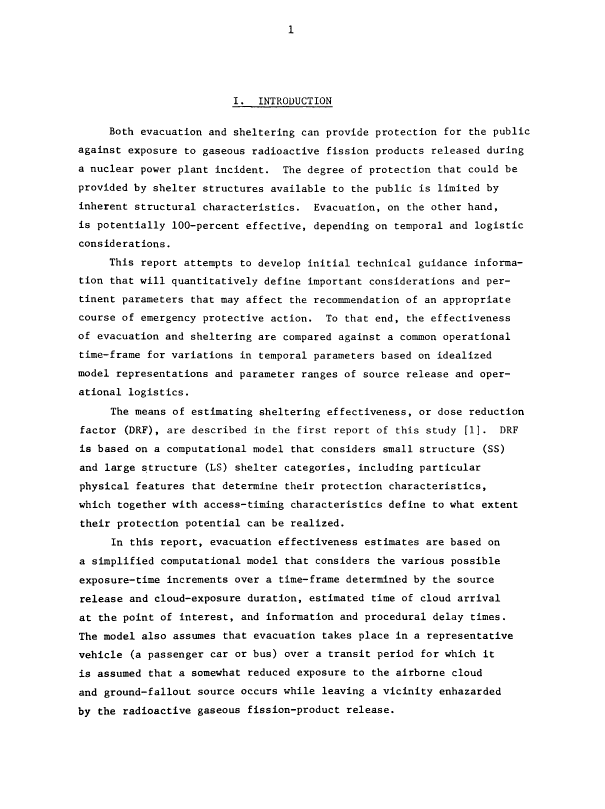
 I. INTRODUCTION
Both evacuation and sheltering can provide protection for the public
against exposure to gaseous radioactive fission products released during
a nuclear power plant incident. The degree of protection that could be
provided by shelter structures available to the public is limited by
inherent structural characteristics. Evacuation, on the other hand,
is potentially 100-percent effective, depending on temporal and logistic
considerations.
This report attempts to develop initial technical guidance informa-
tion that will quantitatively define important considerations and per-
tinent parameters that may affect the recommendation of an appropriate
course of emergency protective action. To that end, the effectiveness
of evacuation and sheltering are compared against a common operational
time-frame for variations in temporal parameters based on idealized
model representations and parameter ranges of source release and oper-
ational logistics.
The means of estimating sheltering effectiveness, or dose reduction
factor (DRF), are described in the first report of this study [I]. DRF
is based on a computational model that considers small structure (SS)
and large structure (LS) shelter categories, including particular
physical features that determine their protection characteristics,
which together with access-timing characteristics define to what extent
their protection potential can be realized.
In this report, evacuation effectiveness estimates are based on
a simplified computational model that considers the various possible
exposure-time increments over a time-frame determined by the source
release and cloud-exposure duration, estimated time of cloud arrival
at the point of interest, and information and procedural delay times.
The model also assumes that evacuation takes place in a representative
vehicle (a passenger car or bus) over a transit period for which it
is assumed that a somewhat reduced exposure to the airborne cloud
and ground-fallout source occurs while leaving a vicinity enhazarded
by the radioactive gaseous fission-product release.
image:
I. INTRODUCTION
Both evacuation and sheltering can provide protection for the public
against exposure to gaseous radioactive fission products released during
a nuclear power plant incident. The degree of protection that could be
provided by shelter structures available to the public is limited by
inherent structural characteristics. Evacuation, on the other hand,
is potentially 100-percent effective, depending on temporal and logistic
considerations.
This report attempts to develop initial technical guidance informa-
tion that will quantitatively define important considerations and per-
tinent parameters that may affect the recommendation of an appropriate
course of emergency protective action. To that end, the effectiveness
of evacuation and sheltering are compared against a common operational
time-frame for variations in temporal parameters based on idealized
model representations and parameter ranges of source release and oper-
ational logistics.
The means of estimating sheltering effectiveness, or dose reduction
factor (DRF), are described in the first report of this study [I]. DRF
is based on a computational model that considers small structure (SS)
and large structure (LS) shelter categories, including particular
physical features that determine their protection characteristics,
which together with access-timing characteristics define to what extent
their protection potential can be realized.
In this report, evacuation effectiveness estimates are based on
a simplified computational model that considers the various possible
exposure-time increments over a time-frame determined by the source
release and cloud-exposure duration, estimated time of cloud arrival
at the point of interest, and information and procedural delay times.
The model also assumes that evacuation takes place in a representative
vehicle (a passenger car or bus) over a transit period for which it
is assumed that a somewhat reduced exposure to the airborne cloud
and ground-fallout source occurs while leaving a vicinity enhazarded
by the radioactive gaseous fission-product release.
image:
 Evacuation and sheltering evaluations are based on comparing calcu-
lated model estimates of their respective DRF values to make recommendations
for the course of emergency protective actions. Both whole body (WB)
and thyroid doses may occur during a gaseous fission-product release,
but not necessarily equal protection for WB and thyroid exposure would
be provided for either evacuation or sheltering, and a protective-
action recommendation must be based on which type of exposure is the
most important insofar as expected dose reduction is concerned.
This report describes a procedure that provides guidance in using
evacuation and sheltering effectiveness information that includes
identifying which exposure (WB or thyroid) is the most important for
the development of emergency-action plans that would form the basis
of a decision to take appropriate action at the time of the accident.
Also discussed are the advantages of combination emergency protection
actions of sheltering and evacuation, particularly for the sequence
of initial sheltering followed by evacuation.
Appendix A (pp. 57-58) lists the special terms use-d in this
report.
image:
Evacuation and sheltering evaluations are based on comparing calcu-
lated model estimates of their respective DRF values to make recommendations
for the course of emergency protective actions. Both whole body (WB)
and thyroid doses may occur during a gaseous fission-product release,
but not necessarily equal protection for WB and thyroid exposure would
be provided for either evacuation or sheltering, and a protective-
action recommendation must be based on which type of exposure is the
most important insofar as expected dose reduction is concerned.
This report describes a procedure that provides guidance in using
evacuation and sheltering effectiveness information that includes
identifying which exposure (WB or thyroid) is the most important for
the development of emergency-action plans that would form the basis
of a decision to take appropriate action at the time of the accident.
Also discussed are the advantages of combination emergency protection
actions of sheltering and evacuation, particularly for the sequence
of initial sheltering followed by evacuation.
Appendix A (pp. 57-58) lists the special terms use-d in this
report.
image:
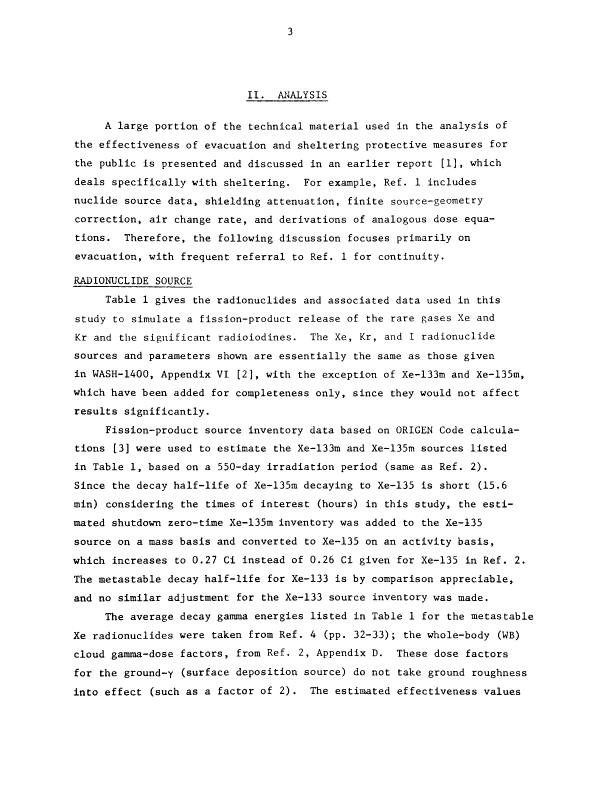
 II. ANALYSIS
A large portion of the technical material used in the analysis of
the effectiveness of evacuation and sheltering protective measures for
the public is presented and discussed in an earlier report [1], which
deals specifically with sheltering. For example, Ref. 1 includes
nuclide source data, shielding attenuation, finite source-geometry
correction, air change rate, and derivations of analogous dose equa-
tions. Therefore, the following discussion focuses primarily on
evacuation, with frequent referral to Ref. 1 for continuity.
RADIONUCLIDE SOURCE
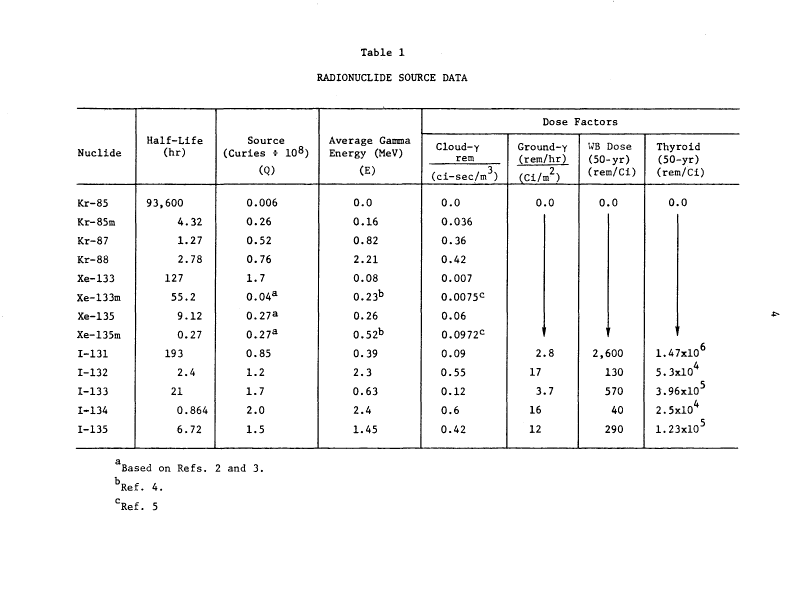
Table 1 gives the radionuclides and associated data used in this
study to simulate a fission-product release of the rare gases Xe and
Kr and the significant radioiodines. The Xe, Kr, and I radionuclide
sources and parameters shown are essentially the same as those given
in WASH-1400, Appendix VI [2], with the exception of Xe-133m and Xe-135m,
which have been added for completeness only, since they would not affect
results significantly.
Fission-product source inventory data based on ORIGEN Code calcula-
tions [3] were used to estimate the Xe-133m and Xe-135m sources listed
in Table 1, based on a 550-day irradiation period (same as Ref. 2).
Since the decay half-life of Xe-135m decaying to Xe-135 is short (15.6
min) considering the times of interest (hours) in this study, the esti-
mated shutdown zero-time Xe-135m inventory was added to the Xe-135
source on a mass basis and converted to Xe-135 on an activity basis,
which increases to 0.27 Ci instead of 0.26 Ci given for Xe-135 in Ref. 2.
The metastable decay half-life for Xe-133 is by comparison appreciable,
and no similar adjustment for the Xe-133 source inventory was made.
The average decay gamma energies listed in Table 1 for the metastable
Xe radionuclides were taken from Ref. 4 (pp. 32-33); the whole-body (WB)
cloud gamma-dose factors, from Ref. 2, Appendix D. These dose factors
for the ground-y (surface deposition source) do not take ground roughness
into effect (such as a factor of 2). The estimated effectiveness values
image:
II. ANALYSIS
A large portion of the technical material used in the analysis of
the effectiveness of evacuation and sheltering protective measures for
the public is presented and discussed in an earlier report [1], which
deals specifically with sheltering. For example, Ref. 1 includes
nuclide source data, shielding attenuation, finite source-geometry
correction, air change rate, and derivations of analogous dose equa-
tions. Therefore, the following discussion focuses primarily on
evacuation, with frequent referral to Ref. 1 for continuity.
RADIONUCLIDE SOURCE
Table 1 gives the radionuclides and associated data used in this
study to simulate a fission-product release of the rare gases Xe and
Kr and the significant radioiodines. The Xe, Kr, and I radionuclide
sources and parameters shown are essentially the same as those given
in WASH-1400, Appendix VI [2], with the exception of Xe-133m and Xe-135m,
which have been added for completeness only, since they would not affect
results significantly.
Fission-product source inventory data based on ORIGEN Code calcula-
tions [3] were used to estimate the Xe-133m and Xe-135m sources listed
in Table 1, based on a 550-day irradiation period (same as Ref. 2).
Since the decay half-life of Xe-135m decaying to Xe-135 is short (15.6
min) considering the times of interest (hours) in this study, the esti-
mated shutdown zero-time Xe-135m inventory was added to the Xe-135
source on a mass basis and converted to Xe-135 on an activity basis,
which increases to 0.27 Ci instead of 0.26 Ci given for Xe-135 in Ref. 2.
The metastable decay half-life for Xe-133 is by comparison appreciable,
and no similar adjustment for the Xe-133 source inventory was made.
The average decay gamma energies listed in Table 1 for the metastable
Xe radionuclides were taken from Ref. 4 (pp. 32-33); the whole-body (WB)
cloud gamma-dose factors, from Ref. 2, Appendix D. These dose factors
for the ground-y (surface deposition source) do not take ground roughness
into effect (such as a factor of 2). The estimated effectiveness values
image:
 Table 1
RADIONUCLIDE SOURCE DATA
Nuclide
Kr-85
Kr-85m
Kr-87
Kr-88
Xe-133
Xe-133m
Xe-135
Xe-135m
1-131
1-132
1-133
1-134
1-135
Half-Life
(hr)
93,600
4.32
1.27
2.78
127
55.2
9.12
0.27
193
2.4
21
0.864
6.72
Source
(Curies * 108)
(Q)
0.006
0.26
0.52
0.76
1.7
0.04a
0.27a
0.27a
0.85
1.2
1.7
2.0
1.5
Average Gamma
Energy (MeV)
(E)
0.0
0.16
0.82
2.21
0.08
0.23b
0.26
0.52b
0.39
2.3
0.63
2.4
1.45
Dose Factors
Cloud-y
rem
(ci-sec/m )
0.0
0.036
0.36
0.42
0.007
0.0075°
0.06
0.0972C
0.09
0.55
0.12
0.6
0.42
Ground-y
(rem/hr)
(Ci/m2)
0.0
!
2.8
17
3.7
16
12
WB Dose
(50-yr)
(rem/Ci)
0.0
\
2,600
130
570
40
290
Thyroid
(50-yr)
(rem/Ci)
0.0
1
1.47xl06
5.3xl04
3.96xl05
2.5xl04
1.23xl05
Based on Refs. 2 and 3.
5Ref. 4.
:Ref. 5
image:
Table 1
RADIONUCLIDE SOURCE DATA
Nuclide
Kr-85
Kr-85m
Kr-87
Kr-88
Xe-133
Xe-133m
Xe-135
Xe-135m
1-131
1-132
1-133
1-134
1-135
Half-Life
(hr)
93,600
4.32
1.27
2.78
127
55.2
9.12
0.27
193
2.4
21
0.864
6.72
Source
(Curies * 108)
(Q)
0.006
0.26
0.52
0.76
1.7
0.04a
0.27a
0.27a
0.85
1.2
1.7
2.0
1.5
Average Gamma
Energy (MeV)
(E)
0.0
0.16
0.82
2.21
0.08
0.23b
0.26
0.52b
0.39
2.3
0.63
2.4
1.45
Dose Factors
Cloud-y
rem
(ci-sec/m )
0.0
0.036
0.36
0.42
0.007
0.0075°
0.06
0.0972C
0.09
0.55
0.12
0.6
0.42
Ground-y
(rem/hr)
(Ci/m2)
0.0
!
2.8
17
3.7
16
12
WB Dose
(50-yr)
(rem/Ci)
0.0
\
2,600
130
570
40
290
Thyroid
(50-yr)
(rem/Ci)
0.0
1
1.47xl06
5.3xl04
3.96xl05
2.5xl04
1.23xl05
Based on Refs. 2 and 3.
5Ref. 4.
:Ref. 5
image:
 in terms of a dose reduction factor (DRF) would not be affected signifi-
cantly whether or not the ground roughness adjustment were included, as the
effect would be the same both inside and outside the shelter structure.
An estimate of the average gamma decay energy was made for the
source nuclides to serve as a guide in 1) estimating gamma-ray attenua-
tion factors for shelter structures and vehicles; and in 2) making
estimated adjustments for finite source geometries for interior shelter
and vehicle cloud-source volume, since the dose factors for cloud-y
apply to infinite source geometries. The average gamma decay energy
was estimated to be M..2 MeV, based on the following simple weighting
relationship:
<E> - - J J 3 £ 3 ,
where Q. and E. are the radionuclide source activities and gamma energies,
•J J
respectively, listed in Table 1, and y (E.) is the gamma-ray linear
energy absorption coefficient as a function of energy for air given in
Ref. 6. The estimate of the average gamma ray energy was based on a
summation over all the radionuclides shown in Table 1, with the exception
of Xe-135m—again because of its short half-life for the times of interest
in this study. The gaseous radionuclide data in Table 1 are used to
estimate evacuation and sheltering effectiveness in dose reduction by
summing each nuclide contribution (assuming single radionuclide decay)
to obtain the unprotected and protected dose. Design basis assumptions
(DBA) are made for the source release—100 percent of the noble gases
and 25 percent of the iodines available for release.
TIME-FRAME MODEL
The effectiveness of sheltering and evacuation as measures for pro-
tection from airborne radioactive material accidentally released from a
nuclear power plant is primarily dependent upon the time required for
individuals either to gain entry into a protective structure or to move
image:
in terms of a dose reduction factor (DRF) would not be affected signifi-
cantly whether or not the ground roughness adjustment were included, as the
effect would be the same both inside and outside the shelter structure.
An estimate of the average gamma decay energy was made for the
source nuclides to serve as a guide in 1) estimating gamma-ray attenua-
tion factors for shelter structures and vehicles; and in 2) making
estimated adjustments for finite source geometries for interior shelter
and vehicle cloud-source volume, since the dose factors for cloud-y
apply to infinite source geometries. The average gamma decay energy
was estimated to be M..2 MeV, based on the following simple weighting
relationship:
<E> - - J J 3 £ 3 ,
where Q. and E. are the radionuclide source activities and gamma energies,
•J J
respectively, listed in Table 1, and y (E.) is the gamma-ray linear
energy absorption coefficient as a function of energy for air given in
Ref. 6. The estimate of the average gamma ray energy was based on a
summation over all the radionuclides shown in Table 1, with the exception
of Xe-135m—again because of its short half-life for the times of interest
in this study. The gaseous radionuclide data in Table 1 are used to
estimate evacuation and sheltering effectiveness in dose reduction by
summing each nuclide contribution (assuming single radionuclide decay)
to obtain the unprotected and protected dose. Design basis assumptions
(DBA) are made for the source release—100 percent of the noble gases
and 25 percent of the iodines available for release.
TIME-FRAME MODEL
The effectiveness of sheltering and evacuation as measures for pro-
tection from airborne radioactive material accidentally released from a
nuclear power plant is primarily dependent upon the time required for
individuals either to gain entry into a protective structure or to move
image:
 away from the vicinity of the radioactive airborne and ground fallout
material. Reference 1 discusses details of timing considerations for
sheltering primarily, whereas this report emphasizes evacuation.
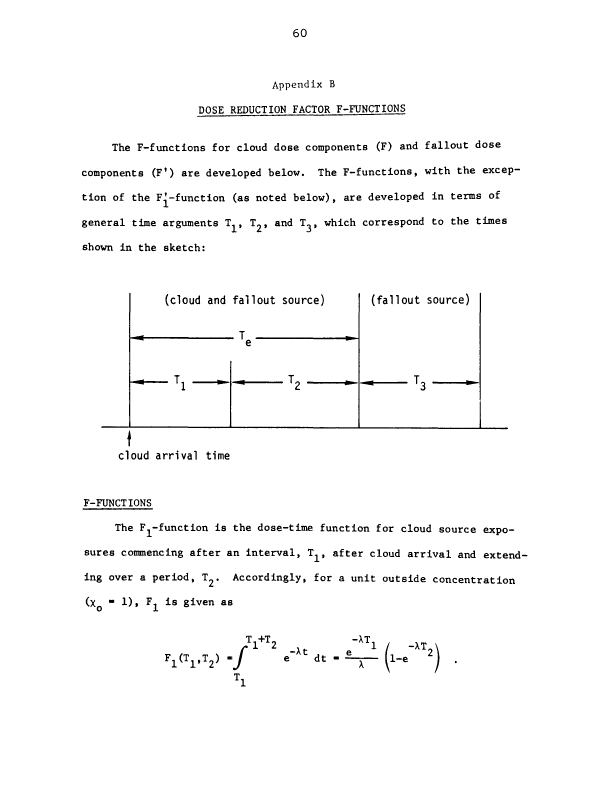
Figure 1 gives the time-frame considerations of the dose computa-
tional model. The source release time, T_ (time duration from initiating
K
event to commencement of source release at the facility), plus the cloud
arrival time, T (time for source to travel from facility to downwind
3
reference position, x = uT ), determine the expected delay time when
3
radiation exposure commences measured from the initiating reactor
accident event. T is the cloud-passage time duration of the reference
e
point, a distance x = uT downwind from the facility. That is, measured
3.
from initiation of a possible incident, (T +T ) is the estimated time-
K. 3.
of-arrival of the lead portion of a radioactive cloud. T , measured
K
from incident initiation, may vary from about 1.5 to 9 hr for the more
severe accident categories [2]. Values of Tn from 1.5 to 3 hr were
K
considered to be of more interest for sheltering, whereas longer times
might be more applicable to evacuation considering the possibly greater
time requirements to effect evacuation than sheltering.
Based on siting data given for 76 nuclear power plants [7], the
average low-population zone (LPZ) distance is 3.4 mi. Assuming the
cloud arrival time T = x/u, T would range from 20 min to 1.5 hr for
3 3
wind speeds ranging from 11 to 2 mph, respectively. The time required
for evacuation from incident initiation is shown in Fig. 1 as (T +T ),
where T is the delay-time duration from the initiating event to the
evacuation order, and T is the actual time increment spent in evacua-
ting (while being exposed to the airborne radioactive material). Delay-
time estimates (TQ) have been discussed by the EPA [8] with regard to
evacuation that may also be somewhat applicable to sheltering, since
the time components of T are similar or may in fact be one and the
same in terms of a local decision process. In Fig. 1, T represents
the total delay time from initiation of an event to onset of physical
movement. For evacuation, the EPA estimates this delay time as being
from 0.9 to 4.5 hr [8]. Also, for evacuation, the EPA estimate for !„
image:
away from the vicinity of the radioactive airborne and ground fallout
material. Reference 1 discusses details of timing considerations for
sheltering primarily, whereas this report emphasizes evacuation.
Figure 1 gives the time-frame considerations of the dose computa-
tional model. The source release time, T_ (time duration from initiating
K
event to commencement of source release at the facility), plus the cloud
arrival time, T (time for source to travel from facility to downwind
3
reference position, x = uT ), determine the expected delay time when
3
radiation exposure commences measured from the initiating reactor
accident event. T is the cloud-passage time duration of the reference
e
point, a distance x = uT downwind from the facility. That is, measured
3.
from initiation of a possible incident, (T +T ) is the estimated time-
K. 3.
of-arrival of the lead portion of a radioactive cloud. T , measured
K
from incident initiation, may vary from about 1.5 to 9 hr for the more
severe accident categories [2]. Values of Tn from 1.5 to 3 hr were
K
considered to be of more interest for sheltering, whereas longer times
might be more applicable to evacuation considering the possibly greater
time requirements to effect evacuation than sheltering.
Based on siting data given for 76 nuclear power plants [7], the
average low-population zone (LPZ) distance is 3.4 mi. Assuming the
cloud arrival time T = x/u, T would range from 20 min to 1.5 hr for
3 3
wind speeds ranging from 11 to 2 mph, respectively. The time required
for evacuation from incident initiation is shown in Fig. 1 as (T +T ),
where T is the delay-time duration from the initiating event to the
evacuation order, and T is the actual time increment spent in evacua-
ting (while being exposed to the airborne radioactive material). Delay-
time estimates (TQ) have been discussed by the EPA [8] with regard to
evacuation that may also be somewhat applicable to sheltering, since
the time components of T are similar or may in fact be one and the
same in terms of a local decision process. In Fig. 1, T represents
the total delay time from initiation of an event to onset of physical
movement. For evacuation, the EPA estimates this delay time as being
from 0.9 to 4.5 hr [8]. Also, for evacuation, the EPA estimate for !„
image:
 Taco
1
9
a
b
3
.ff
i
• (T * T ) r
* UK >a; . «-
« (T ••• T 5 •. I
- UD ",; »|
• n j
" l'u
« T
« u J
_ T
• D
« T
* D • -•
^_ T
^ U
1
Time
• T •
" 'e r
. T ) ,._.
V *
TT
T fc
TD
. . T, .1
,i , . |
(T + T 1
^ U I1
T
i
T' T1
'D 'T
m- -» T
* ^ 1
TD
T •"
U
TT
1 _1
* 1
TT
TB
M- 1 -« T •.
*- I * ' I • ••
Initiating event
Cloud arrival
End cloud passage
Tn * source release time
T = cloud arrival time
d
T « cloud passage time
TD = delay time from initiating event
to evacuation alert
T., = actual time spent evacuating while
being exposed to radiation sources
Fig. 1--Evacuation time-frame
image:
Taco
1
9
a
b
3
.ff
i
• (T * T ) r
* UK >a; . «-
« (T ••• T 5 •. I
- UD ",; »|
• n j
" l'u
« T
« u J
_ T
• D
« T
* D • -•
^_ T
^ U
1
Time
• T •
" 'e r
. T ) ,._.
V *
TT
T fc
TD
. . T, .1
,i , . |
(T + T 1
^ U I1
T
i
T' T1
'D 'T
m- -» T
* ^ 1
TD
T •"
U
TT
1 _1
* 1
TT
TB
M- 1 -« T •.
*- I * ' I • ••
Initiating event
Cloud arrival
End cloud passage
Tn * source release time
T = cloud arrival time
d
T « cloud passage time
TD = delay time from initiating event
to evacuation alert
T., = actual time spent evacuating while
being exposed to radiation sources
Fig. 1--Evacuation time-frame
image:
 is from 0.2 to 1.5 hr, which may be excessive for sheltering. (Reason-
able sheltering times may be anywhere from a few minutes to half an
hour,;)
The cloud passage time, T , would depend on source release duration
(T ) and wind persistence time (direction and speed). T may range
s s
from 0.5 to 4 hr for accidental release events [2], i.e., periods of
time where shelter may be effective. For cloud passage periods of more
than about 6 hr, shelter would be less attractive and evacuation may
offer a greater protective advantage. Estimates of wind persistence
time should be based on particular site meteorology. In terms of pro-
tective action by the public (i.e., taking shelter or evacuating), the
wind-persistence time estimates made at the time of and during post-
incident phases of an accident are among the most important parameters
affecting the effectiveness of protective action. Ideally, of course,
the best situation is to base protective action recommendations on
real-time wind-trajectory data. Normally, however, local wind fore-
cast information would be available from local weather service sources.
Short of that, useful information on persistence for making protective
action decisions would be an estimate of the mean or expected wind-
direction persistence time—given a particular time of the day and
that a particular direction has been maintained up to that point. This
latter type of predictive ability would have to be formulated from a
detailed statistical analysis of site meteorological data of record
requiring frequent observations (perhaps every 15 min) over an adequate
period of time. A means of computing source-cloud trajectory based on
real-time analysis of site and regional meteorological data is described
as a feature of the ARAC program currently being developed at the
Lawrence Livermore Laboratory [9]. This kind of capability would
obviously be very useful in planning emergency public actions such as
sheltering and evacuation.
For this study, exposure time, T , is equal to the shorter of either
release duration, T , or the wind persistence time. The three time cases
S
in Fig. 1 compare assumed values of (T +T ) with (T_+T ) and (TD+T +T ),
U I K a. K 3. 6
and the subcases are in turn determined by the values of T and T .
image:
is from 0.2 to 1.5 hr, which may be excessive for sheltering. (Reason-
able sheltering times may be anywhere from a few minutes to half an
hour,;)
The cloud passage time, T , would depend on source release duration
(T ) and wind persistence time (direction and speed). T may range
s s
from 0.5 to 4 hr for accidental release events [2], i.e., periods of
time where shelter may be effective. For cloud passage periods of more
than about 6 hr, shelter would be less attractive and evacuation may
offer a greater protective advantage. Estimates of wind persistence
time should be based on particular site meteorology. In terms of pro-
tective action by the public (i.e., taking shelter or evacuating), the
wind-persistence time estimates made at the time of and during post-
incident phases of an accident are among the most important parameters
affecting the effectiveness of protective action. Ideally, of course,
the best situation is to base protective action recommendations on
real-time wind-trajectory data. Normally, however, local wind fore-
cast information would be available from local weather service sources.
Short of that, useful information on persistence for making protective
action decisions would be an estimate of the mean or expected wind-
direction persistence time—given a particular time of the day and
that a particular direction has been maintained up to that point. This
latter type of predictive ability would have to be formulated from a
detailed statistical analysis of site meteorological data of record
requiring frequent observations (perhaps every 15 min) over an adequate
period of time. A means of computing source-cloud trajectory based on
real-time analysis of site and regional meteorological data is described
as a feature of the ARAC program currently being developed at the
Lawrence Livermore Laboratory [9]. This kind of capability would
obviously be very useful in planning emergency public actions such as
sheltering and evacuation.
For this study, exposure time, T , is equal to the shorter of either
release duration, T , or the wind persistence time. The three time cases
S
in Fig. 1 compare assumed values of (T +T ) with (T_+T ) and (TD+T +T ),
U I K a. K 3. 6
and the subcases are in turn determined by the values of T and T .
image:
 Case 1, for example, corresponds to DRF = 0, in which evacuation is
accomplished prior to cloud arrival and all exposure is avoided—i.e.,
(Tp+T ) _<_ (T +T ). On the other hand, case 3c corresponds to a situa-
tion in which evacuation does not physically commence until after cloud
passage, and the overall dose reduction would be limited—since only
some relatively small degree of protection would be offered against
only ground fallout deposition, assuming individuals leave the contaminated
area within a reasonable amount of time (i.e., within an hour or so).
Case 2 corresponds to the situation in which evacuation is not
completed until some time after cloud arrival, which divides into sub-
cases a and b, where actual physical movement commences before and after
cloud arrival, respectively. In subcase 2b, an individual is assumed
to be exposed to radioactive material without protection during the
period T'; and protected within the confines of an evacuation vehicle
over the periods T' and T for subcases 2a and 2b, respectively.
Subcases 3a and 3b are essentially time extensions of subcases 2a
and 2b, respectively, in which again, T and T vary for (T +TT) >_
(T_+T +T ). Similarly, the T (and T -primes) correspond to unpro-
£x 3. 6 U JJ
tected exposure, and TT (and T -primes) correspond to protected exposures
within the confines of an evacuation vehicle.
In terms of the time-frame model, the evacuation effectiveness is
defined as the ratio of the dose received under combined unprotected and
protected conditions to that received under wholly unprotected conditions
over the interval of cloud passage and evacuation. The time-frame model
is thus formulated to include the effects of the time parameters on
evacuation effectiveness. The effectiveness estimates in this study
are mainly concerned with times commencing at cloud arrival, (Tp+T ),
Iv u
in which simple radioactive decay by each source isotope is considered
over (T +T ). Note also that the time-frame model assumes an abrupt
R a
boundary at both the leading and trailing edges of the radioactive
cloud material. In reality, of course, this is not true, as it is well
known that turbulent diffusion in the atmosphere gives rise, on the
average, to continuously changing airborne source boundaries—whose
dimensional scales, however, are such that the above model would be a
reasonable approximation, considering the source release intervals of
interest (excluding an instantaneous puff).
image:
Case 1, for example, corresponds to DRF = 0, in which evacuation is
accomplished prior to cloud arrival and all exposure is avoided—i.e.,
(Tp+T ) _<_ (T +T ). On the other hand, case 3c corresponds to a situa-
tion in which evacuation does not physically commence until after cloud
passage, and the overall dose reduction would be limited—since only
some relatively small degree of protection would be offered against
only ground fallout deposition, assuming individuals leave the contaminated
area within a reasonable amount of time (i.e., within an hour or so).
Case 2 corresponds to the situation in which evacuation is not
completed until some time after cloud arrival, which divides into sub-
cases a and b, where actual physical movement commences before and after
cloud arrival, respectively. In subcase 2b, an individual is assumed
to be exposed to radioactive material without protection during the
period T'; and protected within the confines of an evacuation vehicle
over the periods T' and T for subcases 2a and 2b, respectively.
Subcases 3a and 3b are essentially time extensions of subcases 2a
and 2b, respectively, in which again, T and T vary for (T +TT) >_
(T_+T +T ). Similarly, the T (and T -primes) correspond to unpro-
£x 3. 6 U JJ
tected exposure, and TT (and T -primes) correspond to protected exposures
within the confines of an evacuation vehicle.
In terms of the time-frame model, the evacuation effectiveness is
defined as the ratio of the dose received under combined unprotected and
protected conditions to that received under wholly unprotected conditions
over the interval of cloud passage and evacuation. The time-frame model
is thus formulated to include the effects of the time parameters on
evacuation effectiveness. The effectiveness estimates in this study
are mainly concerned with times commencing at cloud arrival, (Tp+T ),
Iv u
in which simple radioactive decay by each source isotope is considered
over (T +T ). Note also that the time-frame model assumes an abrupt
R a
boundary at both the leading and trailing edges of the radioactive
cloud material. In reality, of course, this is not true, as it is well
known that turbulent diffusion in the atmosphere gives rise, on the
average, to continuously changing airborne source boundaries—whose
dimensional scales, however, are such that the above model would be a
reasonable approximation, considering the source release intervals of
interest (excluding an instantaneous puff).
image:
 10
EVACUATION VEHICLE
Effectiveness estimates of evacuation (i.e., DRF) in this study
assume that evacuation takes place inside a vehicle transporting in-
dividuals away from the vicinity of airborne and ground-fallout radio-
active material. Of course, individual evacuation may take place by
any means—e.g., by bicycle or even on foot, which may be very effective
if completed prior to cloud arrival. Obviously, however, vehicular
evacuation is much more effective, if carried out according to plan,
because of transit-time advantage and some degree of protection pro-
vided by the vehicle where radioactive sources are present. The
following discussion of the calculation model considers vehicular
protection.
A variety of vehicle types could be used for transporting
individuals in emergency situations. Although varying degrees of
protection could be realized, the relative variations would not
approach those inherent in building structures. For convenience of
analysis, the numerical calculations of this study assume a representa-
tive vehicle (passenger car or bus).
During vehicular evacuation, WB dose would result from vehicle
penetration of gamma radiation from the airborne radioactive cloud and
the ground fallout during cloud passage (and from only ground fallout
after cloud passage) and from the inhalation exposure of airborne
radioactive material that would infiltrate the moving vehicle during
transit. Any dose from interior vehicle surface contamination (e.g.,
fallout) is assumed negligible and therefore neglected for the pur-
poses of WB-dose calculation. The inhalation exposure of radioiodine
inside the vehicle is, of course, assumed for purposes of thyroid-dose
calculation.
Since the DRF for evacuation is also based on unprotected doses as
well as dose estimates incurred in the vehicle during evacuation, WB
exposure from cloud, fallout, and inhalation exposures is taken into
account for unprotected individuals as well as the inhalation of
radioiodine for the unprotected thyroid dose.
image:
10
EVACUATION VEHICLE
Effectiveness estimates of evacuation (i.e., DRF) in this study
assume that evacuation takes place inside a vehicle transporting in-
dividuals away from the vicinity of airborne and ground-fallout radio-
active material. Of course, individual evacuation may take place by
any means—e.g., by bicycle or even on foot, which may be very effective
if completed prior to cloud arrival. Obviously, however, vehicular
evacuation is much more effective, if carried out according to plan,
because of transit-time advantage and some degree of protection pro-
vided by the vehicle where radioactive sources are present. The
following discussion of the calculation model considers vehicular
protection.
A variety of vehicle types could be used for transporting
individuals in emergency situations. Although varying degrees of
protection could be realized, the relative variations would not
approach those inherent in building structures. For convenience of
analysis, the numerical calculations of this study assume a representa-
tive vehicle (passenger car or bus).
During vehicular evacuation, WB dose would result from vehicle
penetration of gamma radiation from the airborne radioactive cloud and
the ground fallout during cloud passage (and from only ground fallout
after cloud passage) and from the inhalation exposure of airborne
radioactive material that would infiltrate the moving vehicle during
transit. Any dose from interior vehicle surface contamination (e.g.,
fallout) is assumed negligible and therefore neglected for the pur-
poses of WB-dose calculation. The inhalation exposure of radioiodine
inside the vehicle is, of course, assumed for purposes of thyroid-dose
calculation.
Since the DRF for evacuation is also based on unprotected doses as
well as dose estimates incurred in the vehicle during evacuation, WB
exposure from cloud, fallout, and inhalation exposures is taken into
account for unprotected individuals as well as the inhalation of
radioiodine for the unprotected thyroid dose.
image:
 11
Assuming an evacuation vehicle, Burson and Profio [10] estimate
that steel and glass used in automobiles and small trucks average
2
roughly 2 gm/cm of shielding thickness for gamma radiation from an
airborne cloud source. From Fig. 3 of Ref. 1, this thickness corres-
ponds to an attenuation of only about 0.95 (the value assumed in this
analysis). For heavier vehicles (e.g., large commercial buses), the
gamma attenuation may be 0.8 to 0.9—still not appreciable. Also
assuming an effective vehicle enclosure radius of about one meter gives
a source-geometry correction factor for WB gamma exposure of about 0.003
(Fig. 5, Ref. 1) for the contaminated airborne material in the vehicle.
Gamma ray attenuation in automobiles and small trucks is 0.5 for
contaminated 50-ft-wide roads (Table 4, Ref. 1). Values estimated by
Burson, based on experimental measurements [11], were from 0.5 to 0.67.
An average value of 0.6 is assumed in this analysis.
Air change rates for automobiles under various conditions of
operation have been determined by Peterson and Sabersky [12]. Their
results (Fig. 2) are from measurements made of pollutants (0 , CO, NO,
and NO ) inside a stock Chevrolet automobile with an air-conditioning
X
unit. The exchange rate is relatively high. In fact, the passenger
compartment is not intended to be airtight; and even in the maximum
air-conditioning mode, a small fan draws outside air into the compart-
ment. Without this ventilation, the rates can probably be reduced by
a factor of 5 without difficulty. The single point marked by an arrow
in Fig. 2 was taken when, with the windows closed, the vehicle's air
conditioning was turned off but the engine left running. Under these
conditions, a fan still draws in outside air. At higher speeds and with
the same settings, f/v (air change rate) would be expected to approach
the values obtained with the air-conditioning unit in operation. This
expectation is based on the assumption that general leakage rather than
the fan is the dominant factor determining f/v at these speeds. A
value of 0.5 min~ (30 hr ) was chosen for this analysis, which corre-
sponds to r^35 mph when general leakage is the dominant factor for f/v.
Penetration of gaseous fission products into the evacuation vehicle was
assumed to be 100 percent for the rare gases and 80 percent for radioiodines,
image:
11
Assuming an evacuation vehicle, Burson and Profio [10] estimate
that steel and glass used in automobiles and small trucks average
2
roughly 2 gm/cm of shielding thickness for gamma radiation from an
airborne cloud source. From Fig. 3 of Ref. 1, this thickness corres-
ponds to an attenuation of only about 0.95 (the value assumed in this
analysis). For heavier vehicles (e.g., large commercial buses), the
gamma attenuation may be 0.8 to 0.9—still not appreciable. Also
assuming an effective vehicle enclosure radius of about one meter gives
a source-geometry correction factor for WB gamma exposure of about 0.003
(Fig. 5, Ref. 1) for the contaminated airborne material in the vehicle.
Gamma ray attenuation in automobiles and small trucks is 0.5 for
contaminated 50-ft-wide roads (Table 4, Ref. 1). Values estimated by
Burson, based on experimental measurements [11], were from 0.5 to 0.67.
An average value of 0.6 is assumed in this analysis.
Air change rates for automobiles under various conditions of
operation have been determined by Peterson and Sabersky [12]. Their
results (Fig. 2) are from measurements made of pollutants (0 , CO, NO,
and NO ) inside a stock Chevrolet automobile with an air-conditioning
X
unit. The exchange rate is relatively high. In fact, the passenger
compartment is not intended to be airtight; and even in the maximum
air-conditioning mode, a small fan draws outside air into the compart-
ment. Without this ventilation, the rates can probably be reduced by
a factor of 5 without difficulty. The single point marked by an arrow
in Fig. 2 was taken when, with the windows closed, the vehicle's air
conditioning was turned off but the engine left running. Under these
conditions, a fan still draws in outside air. At higher speeds and with
the same settings, f/v (air change rate) would be expected to approach
the values obtained with the air-conditioning unit in operation. This
expectation is based on the assumption that general leakage rather than
the fan is the dominant factor determining f/v at these speeds. A
value of 0.5 min~ (30 hr ) was chosen for this analysis, which corre-
sponds to r^35 mph when general leakage is the dominant factor for f/v.
Penetration of gaseous fission products into the evacuation vehicle was
assumed to be 100 percent for the rare gases and 80 percent for radioiodines,
image:
 60r l.O
50
0.8
40
e so
^ 0.6
C
•r~
E
no A
/C motor
rur fling,
20
10
0.4^
0.2
10
20
30 40 50
Vehicle speed (mph)
60
70
80
90
Fig. 2--Air exchange and infiltration rates in closed passenger compartment
when air conditioning is set at a maximum
image:
60r l.O
50
0.8
40
e so
^ 0.6
C
•r~
E
no A
/C motor
rur fling,
20
10
0.4^
0.2
10
20
30 40 50
Vehicle speed (mph)
60
70
80
90
Fig. 2--Air exchange and infiltration rates in closed passenger compartment
when air conditioning is set at a maximum
image:
 13
which corresponds to the upper limit of the estimates of Megaw [13]
based on simple shelter-structure experiments.
DOSE REDUCTION FACTOR
Effectiveness estimates of evacuation are expressed in terms of the
DRF. This value is the ratio of the dosages received during evacuation
to that incurred in the open assuming no evacuation (i.e., a stationary
unprotected receptor). DRF values are estimated for both WB and thyroid
exposures. The DRF for WB gamma dose is given as
(DRF) EC+IC+FD
EC + 1C + FD
o o o
where
EC = external gamma airborne-source dose (evacuation),
EC * external gamma airborne-source dose (no evacuation),
1C = inhalation airborne-source dose (evacuation),
1C = inhalation airborne-source dose (no evacuation),
o
FD • external gamma surface-source dose (evacuation),
FD « external gamma surface-source dose (no evacuation).
The DRF for thyroid dose is given as
TC
(DRF) thyroid =TC
where
TC = thyroid inhalation dose (evacuation) ,
TC « thyroid inhalation dose (no evacuation).
The EC, 1C, FD, and TC dose components (those components received
with evacuation) may include doses incurred during delay times prior to
evacuation — but after cloud arrival — and/or doses received in a vehicle
during evacuation. The EC and FD components received in the vehicle
image:
13
which corresponds to the upper limit of the estimates of Megaw [13]
based on simple shelter-structure experiments.
DOSE REDUCTION FACTOR
Effectiveness estimates of evacuation are expressed in terms of the
DRF. This value is the ratio of the dosages received during evacuation
to that incurred in the open assuming no evacuation (i.e., a stationary
unprotected receptor). DRF values are estimated for both WB and thyroid
exposures. The DRF for WB gamma dose is given as
(DRF) EC+IC+FD
EC + 1C + FD
o o o
where
EC = external gamma airborne-source dose (evacuation),
EC * external gamma airborne-source dose (no evacuation),
1C = inhalation airborne-source dose (evacuation),
1C = inhalation airborne-source dose (no evacuation),
o
FD • external gamma surface-source dose (evacuation),
FD « external gamma surface-source dose (no evacuation).
The DRF for thyroid dose is given as
TC
(DRF) thyroid =TC
where
TC = thyroid inhalation dose (evacuation) ,
TC « thyroid inhalation dose (no evacuation).
The EC, 1C, FD, and TC dose components (those components received
with evacuation) may include doses incurred during delay times prior to
evacuation — but after cloud arrival — and/or doses received in a vehicle
during evacuation. The EC and FD components received in the vehicle
image:
 14
during evacuation would result from penetration of cloud and fallout
gamma radiation, respectively. The inhalation dose (1C and TC) com-
ponents received in the vehicle during evacuation would result from
the inhalation of airborne radioiodine. The ECQ, ICQ, FDQ, and TCQ
dose components are the reference values corresponding to the dosages
incurred over the total time span considered for the EC, 1C, FD, and TC
components above. The dose components are developed by integrating the
time-dependent source for evacuation and sheltering for a unit downwind
dilution factor, as reviewed below.
Doses downwind from an accidental release of airborne gaseous
fission products are dependent on the concentration of the airborne
radioactive material, which can be expressed as follows for continuous
source release conditions:
X(r,t) = (X(r)/Q) Q(t) (Ci/m3) ,
Q O
where x(r)/Q (sec/m ) is the ratio of the concentration x(r) (Ci/m ),
at a distance r from the release to the source release rate Q (Ci/sec);
and Q(t) (Ci/sec) is the time-dependent source-release rate function.
In general, the dose at r is given by the integral of the concentration
over the period of exposure, T :
T
e
D(r) = / 1C x(r,t) dt
rem
where BL is a dose conversion factor. For this study, calculations
were performed assuming x(O/Q unity (i.e., a unit dilution factor),
since it is a common multiplier for all dose components and therefore
does not affect DRF values. Accordingly, the dose component estimates
described here are based on integrations of the time-dependent sources
both inside and outside the evacuation vehicle. The release rate at
the source is assumed to be constant with a correction for simple radio-
active decay over a release period, T :
s
f Q
Q(t) = -- e~At (Ci/sec) ,
image:
14
during evacuation would result from penetration of cloud and fallout
gamma radiation, respectively. The inhalation dose (1C and TC) com-
ponents received in the vehicle during evacuation would result from
the inhalation of airborne radioiodine. The ECQ, ICQ, FDQ, and TCQ
dose components are the reference values corresponding to the dosages
incurred over the total time span considered for the EC, 1C, FD, and TC
components above. The dose components are developed by integrating the
time-dependent source for evacuation and sheltering for a unit downwind
dilution factor, as reviewed below.
Doses downwind from an accidental release of airborne gaseous
fission products are dependent on the concentration of the airborne
radioactive material, which can be expressed as follows for continuous
source release conditions:
X(r,t) = (X(r)/Q) Q(t) (Ci/m3) ,
Q O
where x(r)/Q (sec/m ) is the ratio of the concentration x(r) (Ci/m ),
at a distance r from the release to the source release rate Q (Ci/sec);
and Q(t) (Ci/sec) is the time-dependent source-release rate function.
In general, the dose at r is given by the integral of the concentration
over the period of exposure, T :
T
e
D(r) = / 1C x(r,t) dt
rem
where BL is a dose conversion factor. For this study, calculations
were performed assuming x(O/Q unity (i.e., a unit dilution factor),
since it is a common multiplier for all dose components and therefore
does not affect DRF values. Accordingly, the dose component estimates
described here are based on integrations of the time-dependent sources
both inside and outside the evacuation vehicle. The release rate at
the source is assumed to be constant with a correction for simple radio-
active decay over a release period, T :
s
f Q
Q(t) = -- e~At (Ci/sec) ,
image:
 15
where Q is the Initial radionuclide activity inventory in the reactor
at the time of an accident (Table 1, p. 4), f is the radionuclide
release fraction (DBA assumptions), and X is the radioactive decay
constant. For ease of illustration, the development of the following
dose components does not use subscripts designating each radionuclide
source, and it should be understood that summations over radionuclide
sources are performed in making computations.
The following discussions in this section deal with the relation-
ships used for calculations of the dose components. These calculations
are obtained from differential rate equations and integration over the
time-dependent sources. Derivations of the dose component relationships
are detailed where necessary in Appendix B (p. 59 ff.).
DOSE COMPONENTS—NO EVACUATION
Whole-body cloud and thyroid dose components assuming no shelter
protection are given as
"EC ~|
o
1C
o
_TC _
=
Kl
_K *B_
-X(TR+Ta)
e
T
re -
J Q(t)
0
dt
f Q e
r o
-X(TR+Ta)
T X
s
-XT
rem
where K.. , K_, and K are the dose conversion factors given for WB cloud
gamma, WB inhalation, and thyroid inhalation doses, respectively, and
-4 3
B is the breathing rate assumed to be 3.4 x 10 (m /sec). In the above
formula, the source release duration, T , is assumed to be the down-
S
wind exposure time, -T .
image:
15
where Q is the Initial radionuclide activity inventory in the reactor
at the time of an accident (Table 1, p. 4), f is the radionuclide
release fraction (DBA assumptions), and X is the radioactive decay
constant. For ease of illustration, the development of the following
dose components does not use subscripts designating each radionuclide
source, and it should be understood that summations over radionuclide
sources are performed in making computations.
The following discussions in this section deal with the relation-
ships used for calculations of the dose components. These calculations
are obtained from differential rate equations and integration over the
time-dependent sources. Derivations of the dose component relationships
are detailed where necessary in Appendix B (p. 59 ff.).
DOSE COMPONENTS—NO EVACUATION
Whole-body cloud and thyroid dose components assuming no shelter
protection are given as
"EC ~|
o
1C
o
_TC _
=
Kl
_K *B_
-X(TR+Ta)
e
T
re -
J Q(t)
0
dt
f Q e
r o
-X(TR+Ta)
T X
s
-XT
rem
where K.. , K_, and K are the dose conversion factors given for WB cloud
gamma, WB inhalation, and thyroid inhalation doses, respectively, and
-4 3
B is the breathing rate assumed to be 3.4 x 10 (m /sec). In the above
formula, the source release duration, T , is assumed to be the down-
S
wind exposure time, -T .
image:
 16
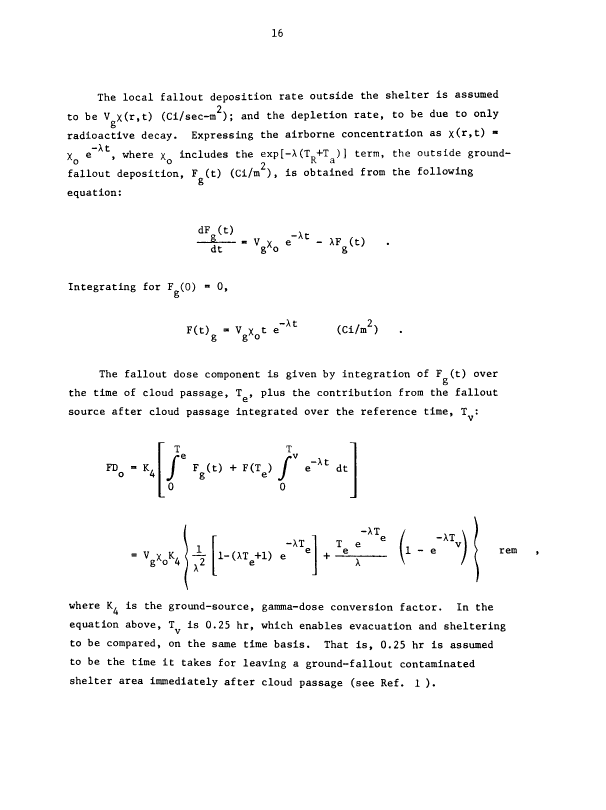
The local fallout deposition rate outside the shelter is assumed
to be V x(r,t) (Ci/sec-m2); and the depletion rate, to be due to only
radioactive decay. Expressing the airborne concentration as x(r»t) »
X e , where x includes the exp[-X(T 4-T )] term, the outside ground-
o o « K a
fallout deposition, F (t) (Ci/m ), is obtained from the following
O
equation:
dt
Integrating for F (0) « 0,
O
F(t) - V X t
O O
(Ci/m2)
The fallout dose component is given by integration of F (t) over
O
the time of cloud passage, T , plus the contribution from the fallout
source after cloud passage integrated over the reference time, T :
FD = K.
o 4
T T
e rv
Fg(t) + F(Te) /
0
-Xt ,
e dt
V X K.
go 4
-XT
1-(XT +1) e
-XT
T e
e
-XT
il - e
rem
where K^ is the ground-source, gamma-dose conversion factor. In the
equation above, TV is 0.25 hr, which enables evacuation and sheltering
to be compared, on the same time basis. That is, 0.25 hr is assumed
to be the time it takes for leaving a ground-fallout contaminated
shelter area immediately after cloud passage (see Ref. 1 ).
image:
16
The local fallout deposition rate outside the shelter is assumed
to be V x(r,t) (Ci/sec-m2); and the depletion rate, to be due to only
radioactive decay. Expressing the airborne concentration as x(r»t) »
X e , where x includes the exp[-X(T 4-T )] term, the outside ground-
o o « K a
fallout deposition, F (t) (Ci/m ), is obtained from the following
O
equation:
dt
Integrating for F (0) « 0,
O
F(t) - V X t
O O
(Ci/m2)
The fallout dose component is given by integration of F (t) over
O
the time of cloud passage, T , plus the contribution from the fallout
source after cloud passage integrated over the reference time, T :
FD = K.
o 4
T T
e rv
Fg(t) + F(Te) /
0
-Xt ,
e dt
V X K.
go 4
-XT
1-(XT +1) e
-XT
T e
e
-XT
il - e
rem
where K^ is the ground-source, gamma-dose conversion factor. In the
equation above, TV is 0.25 hr, which enables evacuation and sheltering
to be compared, on the same time basis. That is, 0.25 hr is assumed
to be the time it takes for leaving a ground-fallout contaminated
shelter area immediately after cloud passage (see Ref. 1 ).
image:
 17
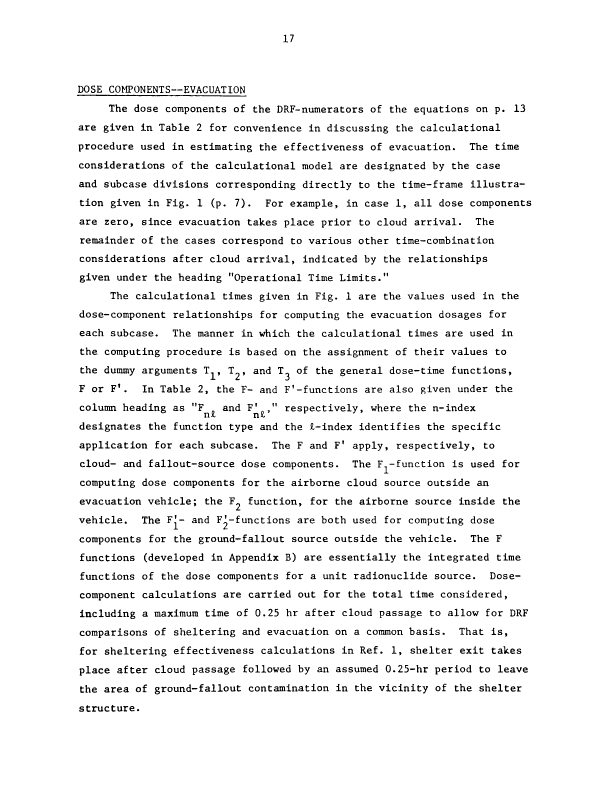
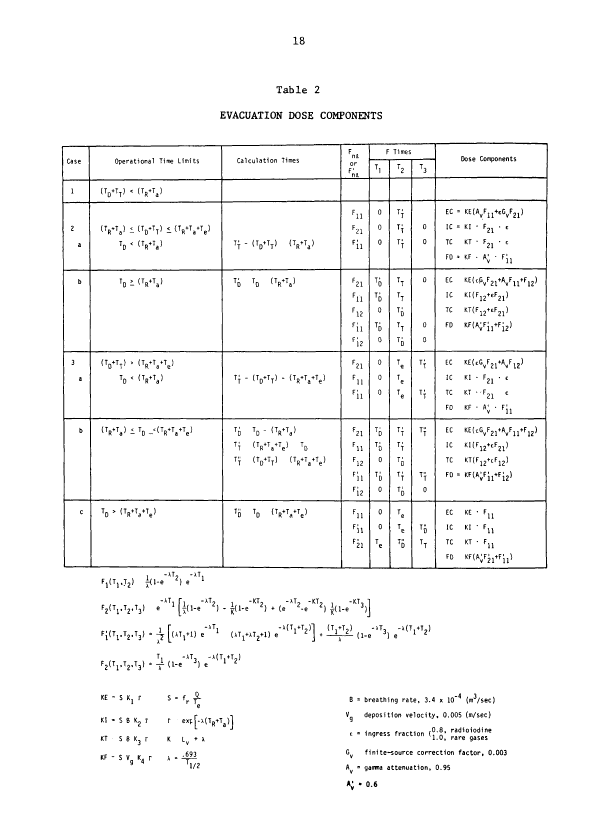
DOSE COMPONENTS—EVACUATION
The dose components of the DRF-numerators of the equations on p. 13
are given in Table 2 for convenience in discussing the calculational
procedure used in estimating the effectiveness of evacuation. The time
considerations of the calculational model are designated by the case
and subcase divisions corresponding directly to the time-frame illustra-
tion given in Fig. 1 (p. 7). For example, in case 1, all dose components
are zero, since evacuation takes place prior to cloud arrival. The
remainder of the cases correspond to various other time-combination
considerations after cloud arrival, indicated by the relationships
given under the heading "Operational Time Limits."
The calculational times given in Fig. 1 are the values used in the
dose-component relationships for computing the evacuation dosages for
each subcase. The manner in which the calculational times are used in
the computing procedure is based on the assignment of their values to
the dummy arguments TI, T , and T_ of the general dose-time functions,
F or F1. In Table 2, the F- and F'-functions are also given under the
column heading as "F and F' " respectively, where the n-index
nx. ii**
designates the function type and the £-index identifies the specific
application for each subcase. The F and F1 apply, respectively, to
cloud- and fallout-source dose components. The FI-function is used for
computing dose components for the airborne cloud source outside an
evacuation vehicle; the F« function, for the airborne source inside the
vehicle. The F'- and F'-functions are both used for computing dose
components for the ground-fallout source outside the vehicle. The F
functions (developed in Appendix B) are essentially the integrated time
functions of the dose components for a unit radionuclide source. Dose-
component calculations are carried out for the total time considered,
including a maximum time of 0.25 hr after cloud passage to allow for DRF
comparisons of sheltering and evacuation on a common basis. That is,
for sheltering effectiveness calculations in Ref. 1, shelter exit takes
place after cloud passage followed by an assumed 0.25-hr period to leave
the area of ground-fallout contamination in the vicinity of the shelter
structure.
image:
17
DOSE COMPONENTS—EVACUATION
The dose components of the DRF-numerators of the equations on p. 13
are given in Table 2 for convenience in discussing the calculational
procedure used in estimating the effectiveness of evacuation. The time
considerations of the calculational model are designated by the case
and subcase divisions corresponding directly to the time-frame illustra-
tion given in Fig. 1 (p. 7). For example, in case 1, all dose components
are zero, since evacuation takes place prior to cloud arrival. The
remainder of the cases correspond to various other time-combination
considerations after cloud arrival, indicated by the relationships
given under the heading "Operational Time Limits."
The calculational times given in Fig. 1 are the values used in the
dose-component relationships for computing the evacuation dosages for
each subcase. The manner in which the calculational times are used in
the computing procedure is based on the assignment of their values to
the dummy arguments TI, T , and T_ of the general dose-time functions,
F or F1. In Table 2, the F- and F'-functions are also given under the
column heading as "F and F' " respectively, where the n-index
nx. ii**
designates the function type and the £-index identifies the specific
application for each subcase. The F and F1 apply, respectively, to
cloud- and fallout-source dose components. The FI-function is used for
computing dose components for the airborne cloud source outside an
evacuation vehicle; the F« function, for the airborne source inside the
vehicle. The F'- and F'-functions are both used for computing dose
components for the ground-fallout source outside the vehicle. The F
functions (developed in Appendix B) are essentially the integrated time
functions of the dose components for a unit radionuclide source. Dose-
component calculations are carried out for the total time considered,
including a maximum time of 0.25 hr after cloud passage to allow for DRF
comparisons of sheltering and evacuation on a common basis. That is,
for sheltering effectiveness calculations in Ref. 1, shelter exit takes
place after cloud passage followed by an assumed 0.25-hr period to leave
the area of ground-fallout contamination in the vicinity of the shelter
structure.
image:
 18
Table 2
EVACUATION DOSE COMPONENTS
Case
1
2
a
b
3
a
b
c
Operational Time Limits
<vv « < w
<YTa> < (TD+TT) « (TR+Ta+Te)
TD < (VTa'
TD i <YV
<VV > <VYV
TD « <YV
(YViWYYV
TD > <YW
Calculation Times
TT - <W (VTa>
TD TD <VTa>
TT - <VTT) - < VVV
Ti TD - <VTa>
TT <YW TD
TT <VTT' <VW
TD TD (TR+T«+Te'
Fni
or
Fn,
Fll
f21
rn
F21
Fll
F12
Fil
Fi2
F21
Fll
Fil
F21
Fll
F!2
Fil
Fi2
Fll
Fil
F21
F Times
Tl
0
0
0
TD
TD
0
TD
0
0
0
0
Ti
Ti
0
Ti
0
0
0
Te
T2
TT
Ti
TT
TT
TT
Ti
TT
Ti
Te
Te
Te
TT
TT
Ti
TT
TD
Te
Te
TU
T3
0
0
0
0
0
TT
TT
TT
TT
0
TB
TT
Dose Components
EC = KE(AvFn+eGvF21)
1C = KI • F21 • e
TC KT • F21 • c
FD =• KF • A; • FJj
EC KE(ePvF21+AvFn+F12)
1C KI(F12+eFa)
TC KT(F12+EF21)
FD KF{A;FJj+FJ2)
EC KE(EGVF21+AVF12)
1C KI • F21 • c
TC KT • 'F21 c
FD KF • A; • FJj
EC KE(eGvF21+AvFu+F12)
1C KI(F12+tF21)
TC KT(F12+EF12)
FD = KF(A;FJj+FJ2)
EC KE • FU
1C KI ' FU
TC KT • Fn
FD KF(A;F21+FJj)
, -AT, -AT.
F.JVT,) !<!-. 2)e 1
FZ(T1.T2,T3) e""11 [}(l-e"XT2) - Ifl-e""1
i r 'ATI
Fj(T,,T,,T,) = -y (XT.+1) e (AT.+AT.
1 1 i 3 AZ L 1 1 <
T. -AT, -»(T.+T.)
F2(T1,T2.T3) = ^ (1-e 3)e > Z
KE - S Kj r S = f A
e
KI * S B K2 r r exp|"-A(TR+T )1
KT - S B K3 r K Lv + *
KF - S Vn K. r A = 4^
9 4 Tl/?
f, -AT, -KT, . -KT, "I
) + (e -e ') i(l-e J)
-»(VT?'l 'Tl+T?) 'ATi -»(T,+T.)
+ l)f* 1 + Mo ^n ^ ^
>**' e j ^ (i-e ) e
B = breathing rate, 3.4 x 10"4 (m3/sec)
V deposition velocity, 0.005 (m/sec)
t « ingress fraction (j Q rareqases6
GV finite-source correction factor, 0.
• 0.6
image:
18
Table 2
EVACUATION DOSE COMPONENTS
Case
1
2
a
b
3
a
b
c
Operational Time Limits
<vv « < w
<YTa> < (TD+TT) « (TR+Ta+Te)
TD < (VTa'
TD i <YV
<VV > <VYV
TD « <YV
(YViWYYV
TD > <YW
Calculation Times
TT - <W (VTa>
TD TD <VTa>
TT - <VTT) - < VVV
Ti TD - <VTa>
TT <YW TD
TT <VTT' <VW
TD TD (TR+T«+Te'
Fni
or
Fn,
Fll
f21
rn
F21
Fll
F12
Fil
Fi2
F21
Fll
Fil
F21
Fll
F!2
Fil
Fi2
Fll
Fil
F21
F Times
Tl
0
0
0
TD
TD
0
TD
0
0
0
0
Ti
Ti
0
Ti
0
0
0
Te
T2
TT
Ti
TT
TT
TT
Ti
TT
Ti
Te
Te
Te
TT
TT
Ti
TT
TD
Te
Te
TU
T3
0
0
0
0
0
TT
TT
TT
TT
0
TB
TT
Dose Components
EC = KE(AvFn+eGvF21)
1C = KI • F21 • e
TC KT • F21 • c
FD =• KF • A; • FJj
EC KE(ePvF21+AvFn+F12)
1C KI(F12+eFa)
TC KT(F12+EF21)
FD KF{A;FJj+FJ2)
EC KE(EGVF21+AVF12)
1C KI • F21 • c
TC KT • 'F21 c
FD KF • A; • FJj
EC KE(eGvF21+AvFu+F12)
1C KI(F12+tF21)
TC KT(F12+EF12)
FD = KF(A;FJj+FJ2)
EC KE • FU
1C KI ' FU
TC KT • Fn
FD KF(A;F21+FJj)
, -AT, -AT.
F.JVT,) !<!-. 2)e 1
FZ(T1.T2,T3) e""11 [}(l-e"XT2) - Ifl-e""1
i r 'ATI
Fj(T,,T,,T,) = -y (XT.+1) e (AT.+AT.
1 1 i 3 AZ L 1 1 <
T. -AT, -»(T.+T.)
F2(T1,T2.T3) = ^ (1-e 3)e > Z
KE - S Kj r S = f A
e
KI * S B K2 r r exp|"-A(TR+T )1
KT - S B K3 r K Lv + *
KF - S Vn K. r A = 4^
9 4 Tl/?
f, -AT, -KT, . -KT, "I
) + (e -e ') i(l-e J)
-»(VT?'l 'Tl+T?) 'ATi -»(T,+T.)
+ l)f* 1 + Mo ^n ^ ^
>**' e j ^ (i-e ) e
B = breathing rate, 3.4 x 10"4 (m3/sec)
V deposition velocity, 0.005 (m/sec)
t « ingress fraction (j Q rareqases6
GV finite-source correction factor, 0.
• 0.6
image:
 19
The dose-component relationships are given in the right-hand column
of Table 2. The applicable F-functions are shown with a double index
to identify the particular form used for each specific subcase, where
the T-, !„, and T argument variables are identified by the column
values. For example, the external cloud-gamma dose component for case
2b is
EC = KE(eGvF21 + A^F.^ + F^) rem
where eG F (hr) is the dose-time function component for the airborne
source in the vehicle for the interval T ; A FI1 is the dose-time function
component for the airborne source outside the vehicle for the interval
T ; and F is the dose-time component for the airborne source outside
the vehicle for the interval of unprotected exposure T'. In the above
relationships, e is the radionuclide ingress fraction for the evacuation
vehicle, A is the cloud-gamma radiation attenuation, and G is the
finite airborne source-geometry correction factor. The constant, KE,
for each radionuclide source is given by
rem/hr
where
* *^
X/Q = 1 (sec/m ),
3
K^ = dose conversion factor (rem-m /sec-Ci),
f. = radionuclide release fraction,
Q = radionuclide source (Ci),
T = cloud exposure time (hr),
A = radionuclide decay constant (hr ),
T_ = source release time (hr),
K.
T = cloud arrival time (hr).
a
image:
19
The dose-component relationships are given in the right-hand column
of Table 2. The applicable F-functions are shown with a double index
to identify the particular form used for each specific subcase, where
the T-, !„, and T argument variables are identified by the column
values. For example, the external cloud-gamma dose component for case
2b is
EC = KE(eGvF21 + A^F.^ + F^) rem
where eG F (hr) is the dose-time function component for the airborne
source in the vehicle for the interval T ; A FI1 is the dose-time function
component for the airborne source outside the vehicle for the interval
T ; and F is the dose-time component for the airborne source outside
the vehicle for the interval of unprotected exposure T'. In the above
relationships, e is the radionuclide ingress fraction for the evacuation
vehicle, A is the cloud-gamma radiation attenuation, and G is the
finite airborne source-geometry correction factor. The constant, KE,
for each radionuclide source is given by
rem/hr
where
* *^
X/Q = 1 (sec/m ),
3
K^ = dose conversion factor (rem-m /sec-Ci),
f. = radionuclide release fraction,
Q = radionuclide source (Ci),
T = cloud exposure time (hr),
A = radionuclide decay constant (hr ),
T_ = source release time (hr),
K.
T = cloud arrival time (hr).
a
image:
 20
The inhalation dose components 1C and TC for the WB and thyroid,
respectively, use the F and F dose-time functions in the same fashion
as indicated for EC above. The fallout dose component, FD, in subcase
2b, includes the F'- and F'-functions for ground-y fallout source
outside the vehicle. The F'—function applies to the time interval,
T', where unprotected exposure is contracted prior to evacuation; the
F' is multiplied by the vehicle attenuation of the gamma radiation,
A', for exposure inside the evacuation vehicle during the transit
interval, T .
Calculation of the dose components for the DRF estimates is per-
formed by time-stepping the TQ and TT values over the time subcases
indicated in Fig. 2.
image:
20
The inhalation dose components 1C and TC for the WB and thyroid,
respectively, use the F and F dose-time functions in the same fashion
as indicated for EC above. The fallout dose component, FD, in subcase
2b, includes the F'- and F'-functions for ground-y fallout source
outside the vehicle. The F'—function applies to the time interval,
T', where unprotected exposure is contracted prior to evacuation; the
F' is multiplied by the vehicle attenuation of the gamma radiation,
A', for exposure inside the evacuation vehicle during the transit
interval, T .
Calculation of the dose components for the DRF estimates is per-
formed by time-stepping the TQ and TT values over the time subcases
indicated in Fig. 2.
image:
 21
III. RESULTS
The results of this study are discussed in two subsections below.
The first subsection presents dose reduction factor (DRF) plots for the
WB and thyroid in terms of a comparison of evacuation and sheltering as
protective action measures against the release of gaseous fission
products. Four basic source release cases are considered:
Case
A
B
C
D
Time Delay to Start
of Source Release
V Hr
1.5
2.0
2.5
2.5
Exposure
Duration
Te, Hr
0.5
1.0
3.0
6.0
Cloud Travel Time
From Facility
Ta, Hr
1
1
1
1
The source release and duration times, T and T , respectively,
K G
for cases A, B, and C above correspond to release categories PWR 1,
PWR 3, and PWR 4 in Ref. 2. Case D is like case C but has a
larger assumed source-release duration time of 6 hr, adequate to
demonstrate the comparative trends in evacuation and sheltering
effectiveness. Also, sufficient data are given to allow extrapola-
tion and cross-plotting.
The* second subsection focuses on a procedure for using the results
in making recommendations for protective actions based on pertinent
input information associated with a release incident. Although use
of the procedure is illustrated by example, note that it would be
difficult—within the scope of this study—to anticipate all possible
situations involving a release incident that may arise in terms of time,
logistics, and other specific factors. The following information,
however, provides guidance and insight for consideration of sheltering
and evacuation.
DOSE REDUCTION FACTORS—SHELTERING AND EVACUATION
Figures 3 and 5 through 13 give DRF values for sheltering and evacua-
tion for the above-mentioned release cases. Sheltering and evacuation
DRF plots are given for both WB and thyroid. The abscissa is the delay
image:
21
III. RESULTS
The results of this study are discussed in two subsections below.
The first subsection presents dose reduction factor (DRF) plots for the
WB and thyroid in terms of a comparison of evacuation and sheltering as
protective action measures against the release of gaseous fission
products. Four basic source release cases are considered:
Case
A
B
C
D
Time Delay to Start
of Source Release
V Hr
1.5
2.0
2.5
2.5
Exposure
Duration
Te, Hr
0.5
1.0
3.0
6.0
Cloud Travel Time
From Facility
Ta, Hr
1
1
1
1
The source release and duration times, T and T , respectively,
K G
for cases A, B, and C above correspond to release categories PWR 1,
PWR 3, and PWR 4 in Ref. 2. Case D is like case C but has a
larger assumed source-release duration time of 6 hr, adequate to
demonstrate the comparative trends in evacuation and sheltering
effectiveness. Also, sufficient data are given to allow extrapola-
tion and cross-plotting.
The* second subsection focuses on a procedure for using the results
in making recommendations for protective actions based on pertinent
input information associated with a release incident. Although use
of the procedure is illustrated by example, note that it would be
difficult—within the scope of this study—to anticipate all possible
situations involving a release incident that may arise in terms of time,
logistics, and other specific factors. The following information,
however, provides guidance and insight for consideration of sheltering
and evacuation.
DOSE REDUCTION FACTORS—SHELTERING AND EVACUATION
Figures 3 and 5 through 13 give DRF values for sheltering and evacua-
tion for the above-mentioned release cases. Sheltering and evacuation
DRF plots are given for both WB and thyroid. The abscissa is the delay
image:
 22
time, T , measured from the incident initiation time, elapsed before
physical transit is in effect. The DRF, applicable to evacuation, is
plotted in terms of the transit-time parameter, TT> which is the time
it takes to evacuate out of and away from the reference location, with
some protection offered by the assumed evacuation vehicle. Based on
the time-frame given in Fig. 1 (p. 4), the analysis model assumes that
unprotected exposure can occur over all or some portions of periods
T and T , after cloud arrival (see cases 2 and 3, Fig. 1).
The DRF applicable to sheltering is also plotted in terms of the
transit-time parameter, T , which is the time it takes to actually gain
shelter entrance. Accordingly, (T +T ) is the total shelter-entrance
delay time that may or may not exceed cloud arrival time. When (T +T )
does not exceed cloud arrival time, maximum shelter benefit is available,
indicated by the horizontal portions of the SS and LS curves in Figs. 3
and 5 through 13. When (T +T ) exceeds the cloud arrival time, the
analysis model assumes that doses are contracted for conditions of
unprotected exposure prior to entering the shelter—indicated by the
rising portions of the SS and LS curves in Figs. 3 and 5 through 13.
Figure 3 gives the case A (source release time, T = 1.5 hr; cloud
K
arrival time, T = 1 hr; and cloud exposure time, T =0.5 hr) for
3. G
evacuation and sheltering. For the evacuation portion of Fig. 3, the
DRF is given in terms of five different transit-time parameter values
of TT, ranging from 0.125 to 1 hr. As shown in Fig. 3, the DRF = 0 for
delay-plus-transit periods (T +T ), which are less than the time elapsed
from event initiation until cloud source arrival (T +T ). For example,
K. 3.
for an assumed evacuation transit time, T = 1 hr> the DRF = 0, for
delay periods, TQ <_ 1.5 hr, as indicated by (1) in Fig. 4. As T in-
creases, evacuation takes place during cloud passage under vehicle pro-
tection conditions and the DRF increases to a plateau as indicated by
(2) in Fig. 4. The DRF for evacuation in Fig. 3 (and Fig. 5) does not
increase for increasing T between 2.0 and 2.5 hr as indicated in
Fig. 4 between (2) and (3), since the assumed evacuation transit-time
interval (TT=! hr) is greater than the cloud-source exposure interval
image:
22
time, T , measured from the incident initiation time, elapsed before
physical transit is in effect. The DRF, applicable to evacuation, is
plotted in terms of the transit-time parameter, TT> which is the time
it takes to evacuate out of and away from the reference location, with
some protection offered by the assumed evacuation vehicle. Based on
the time-frame given in Fig. 1 (p. 4), the analysis model assumes that
unprotected exposure can occur over all or some portions of periods
T and T , after cloud arrival (see cases 2 and 3, Fig. 1).
The DRF applicable to sheltering is also plotted in terms of the
transit-time parameter, T , which is the time it takes to actually gain
shelter entrance. Accordingly, (T +T ) is the total shelter-entrance
delay time that may or may not exceed cloud arrival time. When (T +T )
does not exceed cloud arrival time, maximum shelter benefit is available,
indicated by the horizontal portions of the SS and LS curves in Figs. 3
and 5 through 13. When (T +T ) exceeds the cloud arrival time, the
analysis model assumes that doses are contracted for conditions of
unprotected exposure prior to entering the shelter—indicated by the
rising portions of the SS and LS curves in Figs. 3 and 5 through 13.
Figure 3 gives the case A (source release time, T = 1.5 hr; cloud
K
arrival time, T = 1 hr; and cloud exposure time, T =0.5 hr) for
3. G
evacuation and sheltering. For the evacuation portion of Fig. 3, the
DRF is given in terms of five different transit-time parameter values
of TT, ranging from 0.125 to 1 hr. As shown in Fig. 3, the DRF = 0 for
delay-plus-transit periods (T +T ), which are less than the time elapsed
from event initiation until cloud source arrival (T +T ). For example,
K. 3.
for an assumed evacuation transit time, T = 1 hr> the DRF = 0, for
delay periods, TQ <_ 1.5 hr, as indicated by (1) in Fig. 4. As T in-
creases, evacuation takes place during cloud passage under vehicle pro-
tection conditions and the DRF increases to a plateau as indicated by
(2) in Fig. 4. The DRF for evacuation in Fig. 3 (and Fig. 5) does not
increase for increasing T between 2.0 and 2.5 hr as indicated in
Fig. 4 between (2) and (3), since the assumed evacuation transit-time
interval (TT=! hr) is greater than the cloud-source exposure interval
image:
 a:
a
0.4 ~
0.2 -
NS
U)
Delay Time, TQ (hours)
Fig. 3--Evacuation and sheltering WB DRF versus Tn, case A (TD=1.5,T =1,T =0.5)
u K a e
image:
a:
a
0.4 ~
0.2 -
NS
U)
Delay Time, TQ (hours)
Fig. 3--Evacuation and sheltering WB DRF versus Tn, case A (TD=1.5,T =1,T =0.5)
u K a e
image:
 24
DRF
release
starts
(2)
exposure
ends
T,
-»•
Fig. 4--Sheltering DRF for case A (TD = 1.5, T = 1, TT = 1)
K a I
image:
24
DRF
release
starts
(2)
exposure
ends
T,
-»•
Fig. 4--Sheltering DRF for case A (TD = 1.5, T = 1, TT = 1)
K a I
image:
 25
(T =0.5 hr). Then, as T further increases, the DRF again increases
as indicated in Fig. 4 between (3) and (4) as unprotected exposure is
incurred, since evacuation is not assumed to commence until the cloud
has passed.
The shapes of the other DRF TT-parameter cases can be explained in
the same manner as above for the (T =1) example (see the time-frame
model in Fig. 1). Figure 3 shows that for T < T (i.e., T <_ 0.5), no
plateau exists for the DRF curves—a situation corresponding to that
where the T_, time span never exceeds T . The maximum value assumed for
T is 1.0 hr; however, it would be a simple extrapolation to include
values of T_ > 1. The minimum value assumed for T is 0.125 hr, since
it is assumed that not much evacuation could take place during exposure
to a radioactive cloud source over shorter periods. Note that the
maximum value of TT = 1 is chosen to illustrate extreme situations,
especially for those in which the release duration is shorter than
1.0 hr (e.g., case A). That is, the question can be posed as to how
evacuation transit time can exceed cloud exposure time, T , when it is
assumed that cloud exposure takes place over the transit time, T . That
situation, of course, would not normally be expected. Logistic condi-
tions, however, could conceivably give rise to extended exposure-transit
periods. For example, the only available evacuation route (or portions
of it) may parallel the cloud trajectory, or changing wind direction
and cloud trajectory may give rise to unfavorable cloud exposure condi-
tions, not to mention other possible vehicle transport problems that
could develop (e.g., stalling, traffic jams).
For comparison, Fig. 3 also plots the DRF values for sheltering:
the SS and LS for low (L=0.125) and representative (L=l) ventilation
rates for the same total time-frame conditions. The delay time, T ,
is given by
TD = AT + (TR+Ta) - TT ,
where AT is the amount of time delay spent accessing a shelter after
cloud arrival (in Ref. 1, Fig. 8, AT is given as T. For convenience,
image:
25
(T =0.5 hr). Then, as T further increases, the DRF again increases
as indicated in Fig. 4 between (3) and (4) as unprotected exposure is
incurred, since evacuation is not assumed to commence until the cloud
has passed.
The shapes of the other DRF TT-parameter cases can be explained in
the same manner as above for the (T =1) example (see the time-frame
model in Fig. 1). Figure 3 shows that for T < T (i.e., T <_ 0.5), no
plateau exists for the DRF curves—a situation corresponding to that
where the T_, time span never exceeds T . The maximum value assumed for
T is 1.0 hr; however, it would be a simple extrapolation to include
values of T_ > 1. The minimum value assumed for T is 0.125 hr, since
it is assumed that not much evacuation could take place during exposure
to a radioactive cloud source over shorter periods. Note that the
maximum value of TT = 1 is chosen to illustrate extreme situations,
especially for those in which the release duration is shorter than
1.0 hr (e.g., case A). That is, the question can be posed as to how
evacuation transit time can exceed cloud exposure time, T , when it is
assumed that cloud exposure takes place over the transit time, T . That
situation, of course, would not normally be expected. Logistic condi-
tions, however, could conceivably give rise to extended exposure-transit
periods. For example, the only available evacuation route (or portions
of it) may parallel the cloud trajectory, or changing wind direction
and cloud trajectory may give rise to unfavorable cloud exposure condi-
tions, not to mention other possible vehicle transport problems that
could develop (e.g., stalling, traffic jams).
For comparison, Fig. 3 also plots the DRF values for sheltering:
the SS and LS for low (L=0.125) and representative (L=l) ventilation
rates for the same total time-frame conditions. The delay time, T ,
is given by
TD = AT + (TR+Ta) - TT ,
where AT is the amount of time delay spent accessing a shelter after
cloud arrival (in Ref. 1, Fig. 8, AT is given as T. For convenience,
image:
 26
only T = 1 and T = 0 (ideal shelter timing) are plotted. The hori-
zontal portions of the curves parallel to the abscissa correspond to the
best shelter protection that can be expected for the conditions given
(i.e., M).4 for SS and ^0.1 for LS). The shelter DRF plots for TT •= 0
correspond to the situation in which shelter access is effected prior to
cloud arrival (i.e., ideal shelter timing). For example, in Fig. 3
this access is accomplished for T <_ 2.5. The effectiveness of sheltering
can be compared with that of evacuation in the space bounded by the SS
curves for L = 0.125, T = 0 (right and bottom); and the ordinate
connecting the LS (L=0.125, TT=O) and SS (L=1,TT=1) intercepts. Clearly,
T and T tradeoffs can be made for DRF comparison between evacuation
and sheltering. For example, Fig. 3 shows an almost equivalent pro-
tection advantage for SS sheltering (ideal timing), assuming representa-
tive ventilation conditions, as compared to a 15-min evacuation transit
time—each action for a delay time of 2.5 hr after the onset of an
incident involving a 1.5-hr release time, a 0.5-hr cloud exposure time,
and a 1-hr cloud arrival time. The DRF values given in Fig. 3 as well
as in Figs. 5 through 13 assume a T = 1-hr cloud arrival time. The
3
DRF values for other cloud arrival times would correspond to a linear
time shift of curves along the abscissa given by (T -1+T ). For example,
JJ 3.
if instead of T =1 (as in Figs. 3 and 5 through 13), T =0.5, then,
3 3.
DRF
(TD-0
.5)
T = 0
a
.5
^ DRF
<v
T
a
Figure 5 gives plots for the case-A thyroid DRF. The evacuation
DRF curves are similar in shape to the WB DRF curves in Fig. 3 (see
discussion above). The plateau DRF value in Fig. 5 is somewhat less
than in Fig. 3 because of the external dose components in the WB DRF
values. For sheltering, both low (L=0.125) and representative (L=l)
ventilation rates are given for ideal timing (T =0) and T = 1.
Figures 6 and 7 are the case-B DRF plots for the WB and thyroid,
respectively. Additional ^-parameter curves are given for the DRF to
image:
26
only T = 1 and T = 0 (ideal shelter timing) are plotted. The hori-
zontal portions of the curves parallel to the abscissa correspond to the
best shelter protection that can be expected for the conditions given
(i.e., M).4 for SS and ^0.1 for LS). The shelter DRF plots for TT •= 0
correspond to the situation in which shelter access is effected prior to
cloud arrival (i.e., ideal shelter timing). For example, in Fig. 3
this access is accomplished for T <_ 2.5. The effectiveness of sheltering
can be compared with that of evacuation in the space bounded by the SS
curves for L = 0.125, T = 0 (right and bottom); and the ordinate
connecting the LS (L=0.125, TT=O) and SS (L=1,TT=1) intercepts. Clearly,
T and T tradeoffs can be made for DRF comparison between evacuation
and sheltering. For example, Fig. 3 shows an almost equivalent pro-
tection advantage for SS sheltering (ideal timing), assuming representa-
tive ventilation conditions, as compared to a 15-min evacuation transit
time—each action for a delay time of 2.5 hr after the onset of an
incident involving a 1.5-hr release time, a 0.5-hr cloud exposure time,
and a 1-hr cloud arrival time. The DRF values given in Fig. 3 as well
as in Figs. 5 through 13 assume a T = 1-hr cloud arrival time. The
3
DRF values for other cloud arrival times would correspond to a linear
time shift of curves along the abscissa given by (T -1+T ). For example,
JJ 3.
if instead of T =1 (as in Figs. 3 and 5 through 13), T =0.5, then,
3 3.
DRF
(TD-0
.5)
T = 0
a
.5
^ DRF
<v
T
a
Figure 5 gives plots for the case-A thyroid DRF. The evacuation
DRF curves are similar in shape to the WB DRF curves in Fig. 3 (see
discussion above). The plateau DRF value in Fig. 5 is somewhat less
than in Fig. 3 because of the external dose components in the WB DRF
values. For sheltering, both low (L=0.125) and representative (L=l)
ventilation rates are given for ideal timing (T =0) and T = 1.
Figures 6 and 7 are the case-B DRF plots for the WB and thyroid,
respectively. Additional ^-parameter curves are given for the DRF to
image:
 CC.
O
L = 1.0 h -1
L = 0.125 nr
N>
Delay Time, TD (hours)
Fig. 5--Evacuation and sheltering thyroid DRF versus Tp, case A (TR=1.5,T =1,T =0.5)
image:
CC.
O
L = 1.0 h -1
L = 0.125 nr
N>
Delay Time, TD (hours)
Fig. 5--Evacuation and sheltering thyroid DRF versus Tp, case A (TR=1.5,T =1,T =0.5)
image:
 NJ
oo
Delay Time, Tn (hours)
Fig. 6—Evacuation and sheltering WB DRF versus Tn, case B (TD=2,T =1,T =1)
U K d 6
image:
NJ
oo
Delay Time, Tn (hours)
Fig. 6—Evacuation and sheltering WB DRF versus Tn, case B (TD=2,T =1,T =1)
U K d 6
image:
 0.25 0.125
L - 1.0 h -1
L = 0.125 nr
S3
Delay Time, TD (hours)
Fig. 7—Evacuation and sheltering thyroid DRF versus Tn, case B (TD=2,T =1,T =1)
image:
0.25 0.125
L - 1.0 h -1
L = 0.125 nr
S3
Delay Time, TD (hours)
Fig. 7—Evacuation and sheltering thyroid DRF versus Tn, case B (TD=2,T =1,T =1)
image:
 30
indicate their linear scaling positions along the abscissa. Including
the additional scales makes it possible to perform graphical TD and TT
tradeoff evaluations for evacuation and sheltering. The shapes of the
evacuation curves are somewhat different from those given for case A in
Figs. 3 and 5 in that the plateaus are absent. This difference is due
to the transit-exposure time for evacuation being less than or equal to
the cloud exposure time (T <_ T ). Also, sheltering for the WB dose
is somewhat less favorable in case B as compared with case A, especially
for the SS shelter. For example, for L = 1, ideal sheltering is com-
parable for an evacuation transit time, T = 0.5; whereas in Fig. 3, the
WB-dose protection for sheltering is somewhat comparable to evacuation
for T = 0.25. Moreover, for case B, the evacuation DRF is significantly
lower than the sheltering DRF for the T = 0.25-hr evacuation time.
Figures 8 and 9 contain additional T -parameter curves for shelter-
ing to illustrate the tradeoff possibilities involving delay and transit
time, T and T , for the representative ventilation rate (i.e., L=l).
For example, suppose that the delay time for sheltering were T = 3
and it took T = 0.25 hr to enter a LS shelter after notification
(DRF=0.36, Fig. 9). Suppose also that the evacuation delay time were
T = 3.2 and it took T™ = 0.5 to evacuate out of the contaminated area
after notification (DRF=0.64). Then, from a WB-dose protection stand-
point, sheltering in the LS would be recommended. If SS sheltering
were considered for the same TD and T conditions given above, shelter-
ing might still be recommended but not quite as strongly as for the LS
(DRF=0.57 and 0.64 for sheltering and evacuation, respectively, in Fig. 8).
If thyroid-dose protection were the consideration for the same delay
time, TD, ranging from around 2.8 to 3.2 hr for both sheltering and
evacuation for the same T values given above for sheltering and evacua-
tion, it would almost be a "toss-up" as to what action would be recom-
mended (DRF ranges between 0.22 and 0.58 for both sheltering and
evacuation; see Fig. 7).
Figures 10 and 11 are the case-C DRF values for the WB and thyroid,
respectively. Here, sheltering increasingly becomes less attractive
than for the shorter cloud-exposure cases A and B. For example, for
image:
30
indicate their linear scaling positions along the abscissa. Including
the additional scales makes it possible to perform graphical TD and TT
tradeoff evaluations for evacuation and sheltering. The shapes of the
evacuation curves are somewhat different from those given for case A in
Figs. 3 and 5 in that the plateaus are absent. This difference is due
to the transit-exposure time for evacuation being less than or equal to
the cloud exposure time (T <_ T ). Also, sheltering for the WB dose
is somewhat less favorable in case B as compared with case A, especially
for the SS shelter. For example, for L = 1, ideal sheltering is com-
parable for an evacuation transit time, T = 0.5; whereas in Fig. 3, the
WB-dose protection for sheltering is somewhat comparable to evacuation
for T = 0.25. Moreover, for case B, the evacuation DRF is significantly
lower than the sheltering DRF for the T = 0.25-hr evacuation time.
Figures 8 and 9 contain additional T -parameter curves for shelter-
ing to illustrate the tradeoff possibilities involving delay and transit
time, T and T , for the representative ventilation rate (i.e., L=l).
For example, suppose that the delay time for sheltering were T = 3
and it took T = 0.25 hr to enter a LS shelter after notification
(DRF=0.36, Fig. 9). Suppose also that the evacuation delay time were
T = 3.2 and it took T™ = 0.5 to evacuate out of the contaminated area
after notification (DRF=0.64). Then, from a WB-dose protection stand-
point, sheltering in the LS would be recommended. If SS sheltering
were considered for the same TD and T conditions given above, shelter-
ing might still be recommended but not quite as strongly as for the LS
(DRF=0.57 and 0.64 for sheltering and evacuation, respectively, in Fig. 8).
If thyroid-dose protection were the consideration for the same delay
time, TD, ranging from around 2.8 to 3.2 hr for both sheltering and
evacuation for the same T values given above for sheltering and evacua-
tion, it would almost be a "toss-up" as to what action would be recom-
mended (DRF ranges between 0.22 and 0.58 for both sheltering and
evacuation; see Fig. 7).
Figures 10 and 11 are the case-C DRF values for the WB and thyroid,
respectively. Here, sheltering increasingly becomes less attractive
than for the shorter cloud-exposure cases A and B. For example, for
image:
 0.25 0.125
DC
Q
Delay Time, TQ (hours)
Fig. 8—Evacuation and SS sheltering WB DRF versus Tn, case B (TD=2,T =1,T =1),
L = 1 (sheltering) D R a e
image:
0.25 0.125
DC
Q
Delay Time, TQ (hours)
Fig. 8—Evacuation and SS sheltering WB DRF versus Tn, case B (TD=2,T =1,T =1),
L = 1 (sheltering) D R a e
image:
 0.25 0.125
oc
o
NJ
Delay Time, TD (hours)
Fig. 9--Evacuation and LS sheltering WB DRF versus Tn, case B (TD=2,T =1,T =1),
L = 1 (sheltering) u K a e
image:
0.25 0.125
oc
o
NJ
Delay Time, TD (hours)
Fig. 9--Evacuation and LS sheltering WB DRF versus Tn, case B (TD=2,T =1,T =1),
L = 1 (sheltering) u K a e
image:
 T"~ i ; 7 / /^' s / \ ' A-
IT' _Vt" vC ~^ ~f ' , "fTT11;
J—1_ _» —X-i —/-^ 7 A 7 *=-W « / > —•-
4 5
Delay Time, TQ (hours)
Fig. 10 — Evacuation and sheltering WB DRF versus TD, case C (TR=2.5,T =1,T =3)
image:
T"~ i ; 7 / /^' s / \ ' A-
IT' _Vt" vC ~^ ~f ' , "fTT11;
J—1_ _» —X-i —/-^ 7 A 7 *=-W « / > —•-
4 5
Delay Time, TQ (hours)
Fig. 10 — Evacuation and sheltering WB DRF versus TD, case C (TR=2.5,T =1,T =3)
image:
 4 5
Delay Time, TD (hours)
Fig. ll~Evacuation and sheltering thyroid DRF versus TD, case C (TR=2.5,T =1,T =3)
image:
4 5
Delay Time, TD (hours)
Fig. ll~Evacuation and sheltering thyroid DRF versus TD, case C (TR=2.5,T =1,T =3)
image:
 35
WB-dose protection (Fig. 10), the best sheltering protection (LS, L=0.125)
corresponds to a T = 0.25 evacuation transit time; for a representative
ventilation rate, (L=l) sheltering corresponds to a T = 0.5 evacuation
transit time and evacuation is better than SS sheltering even for T = 1
evacuation time. For thyroid-dose protection, the situation is similar to
that for the WB-dose protection for low ventilation rates, with a trend
toward evacuation for representative ventilation rates (L=l).
Similarly, Figs. 12 and 13 (case D, T =6) show the increasing
trend toward evacuation as the choice protective action. For example,
for the low ventilation rate (L=0.125) in the LS shelter, it would be
preferable to evacuate for delay times up to ^3.5 hr for both WB and
thyroid considerations—providing the evacuation transit time did not
exceed 0.5 hr. For a representative ventilation rate (L=l), it would
be preferable to evacuate, even though a T = 1-hr evacuation transit
time is required for up to a 4.5 to 7 hr delay time (T ) for the WB
and thyroid, respectively.
Figures 3 and 5 through 13 clearly suggest the general trend toward
evacuation as a preferable protective action when compared with sheltering.
Of course, specific situations call for individual evaluation in arriving
at a course of recommended action. The following subsection presents
a procedure for using the DRF plots discussed above.
EVACUATE OR SHELTER?
This report analyzes the effectiveness of both evacuation and
sheltering. (Reference 1 deals more specifically with sheltering
effectiveness.) Up to this point, they have been discussed somewhat
independently without specific regard for the combined use of the deve-
loped data. This subsection focuses on a procedure for providing
guidance in making recommendations for the protection of individuals,
either through evacuation or sheltering, from acute radiation exposure
in the event of an emergency due to a nuclear incident. The overall
time-frame embraces various actions that may be taken to protect the
public for periods of 1 to 10 hr following the onset of an incident.
image:
35
WB-dose protection (Fig. 10), the best sheltering protection (LS, L=0.125)
corresponds to a T = 0.25 evacuation transit time; for a representative
ventilation rate, (L=l) sheltering corresponds to a T = 0.5 evacuation
transit time and evacuation is better than SS sheltering even for T = 1
evacuation time. For thyroid-dose protection, the situation is similar to
that for the WB-dose protection for low ventilation rates, with a trend
toward evacuation for representative ventilation rates (L=l).
Similarly, Figs. 12 and 13 (case D, T =6) show the increasing
trend toward evacuation as the choice protective action. For example,
for the low ventilation rate (L=0.125) in the LS shelter, it would be
preferable to evacuate for delay times up to ^3.5 hr for both WB and
thyroid considerations—providing the evacuation transit time did not
exceed 0.5 hr. For a representative ventilation rate (L=l), it would
be preferable to evacuate, even though a T = 1-hr evacuation transit
time is required for up to a 4.5 to 7 hr delay time (T ) for the WB
and thyroid, respectively.
Figures 3 and 5 through 13 clearly suggest the general trend toward
evacuation as a preferable protective action when compared with sheltering.
Of course, specific situations call for individual evaluation in arriving
at a course of recommended action. The following subsection presents
a procedure for using the DRF plots discussed above.
EVACUATE OR SHELTER?
This report analyzes the effectiveness of both evacuation and
sheltering. (Reference 1 deals more specifically with sheltering
effectiveness.) Up to this point, they have been discussed somewhat
independently without specific regard for the combined use of the deve-
loped data. This subsection focuses on a procedure for providing
guidance in making recommendations for the protection of individuals,
either through evacuation or sheltering, from acute radiation exposure
in the event of an emergency due to a nuclear incident. The overall
time-frame embraces various actions that may be taken to protect the
public for periods of 1 to 10 hr following the onset of an incident.
image:
 tx.
o
4567
Delay Time, TQ (hours)
Fig. 12—Evacuation and sheltering WB DRF versus TD, case D (TR=2.5,Ta=l,Te=6)
image:
tx.
o
4567
Delay Time, TQ (hours)
Fig. 12—Evacuation and sheltering WB DRF versus TD, case D (TR=2.5,Ta=l,Te=6)
image:
 cc
Q
L = 0.125
456
Delay Time, TD (hours)
Fig. 13--Evacuation and sheltering thyroid DRF versus TD, case D (TR=2.5,Ta=l,Te=6)
image:
cc
Q
L = 0.125
456
Delay Time, TD (hours)
Fig. 13--Evacuation and sheltering thyroid DRF versus TD, case D (TR=2.5,Ta=l,Te=6)
image:
 38
Figures 14a and 14b show the overall procedure for assessing and
making recommendations. Though both figures are identical with regard
to decision logic, Fig. 14a is expressed verbally and Fig. 14b more
symbolically. Unfortunately, owing to the many possible values of the
pertinent parameters, it is difficult to reduce such a decision process
to a few blanket statements, although certainly that would be desirable.
Figures 14a and 14b do, however, provide guidance for reducing the
decision process to a usable level, while still preserving a reasonable
amount of essential detail. In using Figs. 14a and 14b, the basic
assumptions made in estimating DRF values (e.g., DBA release fractions,
radioactive ingress fraction) should be kept in mind, especially from
the standpoint of determining whether WB or thyroid dose would be more
important.
The essential elements in Figs. 14a and 14b are keyed by circled
numbers, which are used as reference in the following discussion.
(Figure 14a does not have a (?) , which lists formula approximations
that can be used to make estimates of the DRF for evacuation and
sheltering. The following discussion refers specifically to Fig. 14b,
although it applies to Fig. 14a as well.)
(T) The significance of the projected doses for the WB and thyroid
(D and D , respectively) is determined by dividing by their respec-
tive protective action guides, (PAG) and (PAG) , respectively.
Estimates of the projected dose correspond to a given location and
cloud arrival time, assuming an estimated average wind speed and direc-
tion. If both ratios are less than one, no emergency protective action
is recommended. However, recommendations for longer-term contamination
control technologies may be made. If one or both of the ratios exceed
unity, testing for cloud arrival time can be made in accordance with (2) .
(2) Local authorities can estimate T and T based on the geo-
^*^ D i.
graphical location; and estimates of T , T , T are obtained from the
i\ Q 3.
responsible power plant authorities. Based on this information, an
estimate of cloud arrival time, (T +T ), from the incident onset is made
i\ 3
and compared with the time required for evacuation (T +T ). If evacuation
can be accomplished prior to the estimated cloud arrival time, then it
image:
38
Figures 14a and 14b show the overall procedure for assessing and
making recommendations. Though both figures are identical with regard
to decision logic, Fig. 14a is expressed verbally and Fig. 14b more
symbolically. Unfortunately, owing to the many possible values of the
pertinent parameters, it is difficult to reduce such a decision process
to a few blanket statements, although certainly that would be desirable.
Figures 14a and 14b do, however, provide guidance for reducing the
decision process to a usable level, while still preserving a reasonable
amount of essential detail. In using Figs. 14a and 14b, the basic
assumptions made in estimating DRF values (e.g., DBA release fractions,
radioactive ingress fraction) should be kept in mind, especially from
the standpoint of determining whether WB or thyroid dose would be more
important.
The essential elements in Figs. 14a and 14b are keyed by circled
numbers, which are used as reference in the following discussion.
(Figure 14a does not have a (?) , which lists formula approximations
that can be used to make estimates of the DRF for evacuation and
sheltering. The following discussion refers specifically to Fig. 14b,
although it applies to Fig. 14a as well.)
(T) The significance of the projected doses for the WB and thyroid
(D and D , respectively) is determined by dividing by their respec-
tive protective action guides, (PAG) and (PAG) , respectively.
Estimates of the projected dose correspond to a given location and
cloud arrival time, assuming an estimated average wind speed and direc-
tion. If both ratios are less than one, no emergency protective action
is recommended. However, recommendations for longer-term contamination
control technologies may be made. If one or both of the ratios exceed
unity, testing for cloud arrival time can be made in accordance with (2) .
(2) Local authorities can estimate T and T based on the geo-
^*^ D i.
graphical location; and estimates of T , T , T are obtained from the
i\ Q 3.
responsible power plant authorities. Based on this information, an
estimate of cloud arrival time, (T +T ), from the incident onset is made
i\ 3
and compared with the time required for evacuation (T +T ). If evacuation
can be accomplished prior to the estimated cloud arrival time, then it
image:
 39a
Are
projected doses
greater than
Source release time
Cloud exposure time
complete prior to
cloud arrival?
Protective action time
Does
the time to
start action come
after cloud has
passed?
Which pathway
exceeded the PAG?
Does
shelter or evacuation
provide the greatest
protection?
Which
Is more Important,
whole body
or thyroid?
Does
shelter or evacuation
provide the greatest
protection?
Using
the charts
for more accurate
estimates, would evacuation
or shelter be more
effective?
Using
the charts
for more accurate
estimates, would evacuation
or shelter be more
effective?
Fig. 14a—Evacuate or shelter?
39b
D - Projected dose
PAG - Protective action guide
TR - Release, time
Ta - Cloud arrival time from start of release to arrival of clouo
Tg - Cloud exposure time from Initiation of event to evacuation
TD - Delay time
Ty - Transport time
ORF - Dose reduction factor
WB - Whole body
T - Thyroid
S - Shelter
ev - Evacuation
v - Vehicle
Fig. 14b--Evacuate or shelter?
image:
39a
Are
projected doses
greater than
Source release time
Cloud exposure time
complete prior to
cloud arrival?
Protective action time
Does
the time to
start action come
after cloud has
passed?
Which pathway
exceeded the PAG?
Does
shelter or evacuation
provide the greatest
protection?
Which
Is more Important,
whole body
or thyroid?
Does
shelter or evacuation
provide the greatest
protection?
Using
the charts
for more accurate
estimates, would evacuation
or shelter be more
effective?
Using
the charts
for more accurate
estimates, would evacuation
or shelter be more
effective?
Fig. 14a—Evacuate or shelter?
39b
D - Projected dose
PAG - Protective action guide
TR - Release, time
Ta - Cloud arrival time from start of release to arrival of clouo
Tg - Cloud exposure time from Initiation of event to evacuation
TD - Delay time
Ty - Transport time
ORF - Dose reduction factor
WB - Whole body
T - Thyroid
S - Shelter
ev - Evacuation
v - Vehicle
Fig. 14b--Evacuate or shelter?
image:
 41
is recommended as the best means of protective action, since the DRF
would be zero for evacuation. If, on the other hand, the estimated
delay time, T , for evacuation, (T ) , and sheltering, (T ) , exceeds
the cloud passage, there would not be much that could be done from the
standpoint of either of those particular emergency actions. If the
estimated shelter delay time, (T ) , does not exceed cloud passage
(e.g., individuals may already be in a protective structure, (TD)S = 0)>
then sheltering would be recommended.
The remaining procedure deals with situations in which protective
actions may be initiated after the estimated cloud arrival time. If in
("y the ratio exceeds unity for either the WB or thyroid (projected
dose is greater than the PAG for either WB or thyroid), then (V) applies;
if in (T) the ratio exceeds unity for both the WB and thyroid (projected
doses exceed the PAGs), (3j applies.
(3) The g-test (see Fig. 14b) is made to determine whether the WB or
thyroid dose is more important. That is, in selecting between evacuation
and sheltering as the recommended course of action, if 6 < 1, the WB
is more important; if 6 > 1, the thyroid. For (J •= 1, either the WB
or thyroid could be selected for further evaluation of recommended pro-
tective actions. The DRF in fs) is for ideal sheltering conditions
(T =0 and T =0, Ref. 1). Depending upon the value of B, either (4) for
the WB (left side of Fig. 14b) or the thyroid (right side of Fig. 14b)
applies. Note, however, that this evaluation of g is based on the
DRFs for sheltering as indicated in Fig. 14b, where it is assumed that
sheltering is preferred for reasons of expediency and cost. It is
possible, however, that what may be the most important dose pathway for
sheltering may not necessarily be the most important one for evacuation.
Consequently, recommended evacuation based on, e.g., WB dose may not be
particularly conservative for parallel thyroid dose reduction. The
additional steps, however, that would be required to "tighten up" the
logic in Fig. 14b is not warranted here since 1) the model is imperfect,
2) for most situations the decision will be conservative or adequate
for reduction of the "less important" dose, and 3) much additional
simplification in using Fig. 14b as a decision guideline procedure is
awarded.
image:
41
is recommended as the best means of protective action, since the DRF
would be zero for evacuation. If, on the other hand, the estimated
delay time, T , for evacuation, (T ) , and sheltering, (T ) , exceeds
the cloud passage, there would not be much that could be done from the
standpoint of either of those particular emergency actions. If the
estimated shelter delay time, (T ) , does not exceed cloud passage
(e.g., individuals may already be in a protective structure, (TD)S = 0)>
then sheltering would be recommended.
The remaining procedure deals with situations in which protective
actions may be initiated after the estimated cloud arrival time. If in
("y the ratio exceeds unity for either the WB or thyroid (projected
dose is greater than the PAG for either WB or thyroid), then (V) applies;
if in (T) the ratio exceeds unity for both the WB and thyroid (projected
doses exceed the PAGs), (3j applies.
(3) The g-test (see Fig. 14b) is made to determine whether the WB or
thyroid dose is more important. That is, in selecting between evacuation
and sheltering as the recommended course of action, if 6 < 1, the WB
is more important; if 6 > 1, the thyroid. For (J •= 1, either the WB
or thyroid could be selected for further evaluation of recommended pro-
tective actions. The DRF in fs) is for ideal sheltering conditions
(T =0 and T =0, Ref. 1). Depending upon the value of B, either (4) for
the WB (left side of Fig. 14b) or the thyroid (right side of Fig. 14b)
applies. Note, however, that this evaluation of g is based on the
DRFs for sheltering as indicated in Fig. 14b, where it is assumed that
sheltering is preferred for reasons of expediency and cost. It is
possible, however, that what may be the most important dose pathway for
sheltering may not necessarily be the most important one for evacuation.
Consequently, recommended evacuation based on, e.g., WB dose may not be
particularly conservative for parallel thyroid dose reduction. The
additional steps, however, that would be required to "tighten up" the
logic in Fig. 14b is not warranted here since 1) the model is imperfect,
2) for most situations the decision will be conservative or adequate
for reduction of the "less important" dose, and 3) much additional
simplification in using Fig. 14b as a decision guideline procedure is
awarded.
image:
 42
(T) The purpose of the indicated test is to compare ideal sheltering
conditions with evacuation based on the ratio of the DRF values shown
for either the WE or thyroid. Estimates of the evacuation (DRF)£v can
be made according to the relationships given in ($) depending on the
time parameters shown. Estimates of the WB (DRF) for ideal-shelter
5
timing conditions can be obtained from Fig. 15 or from the WB-dose
shelter curves given in the applicable Figs. 3 and 5 through 13 dis-
cussed above. (WB (DRF) values for ideal shelter timing can also
be obtained from Ref. 1.) Figure 16 gives thryoid (DRF) values for
s
ideal sheltering conditions as a function of the air change rate, L,
for the release cases considered. If the ratio given in Q4) is less
than unity, evacuation is recommended, as it would provide better pro-
tection than the best that could be provided by sheltering. When
6 >_ 1, (5) applies, in which case it may not be clear that evacuation
is the better emergency protective action from the standpoint of
reduced dosage and a further evaluation should be made with the aid of
the graphical data.
(jQ Approximations for the evacuation (DRF) values are given by
the relationships in Fig. lAb. They are essentially linear relationships,
which may be used in (4) (of course, the plots in Figs. 3 and 5 through
13 could also be used), and would certainly overestimate the (DRF) values
for T > (T +T +T ) - T . Figure 17 gives values of M for the linear
U K. 3. G X
relationships given in Fig. 14b, which can be used to approximate the
DRFs for evacuation; these values are slope-adjustment factors that
are functions of the exposure duration, T , determined from the calcula-
ted results for evacuation.
r&) As indicated in Fig. 14b, (6J allows for specific evaluations
of a recommended protective action with the aid of the graphical data
given in Figs. 3 and 5 through 13. Of course, it may be necessary to
expand the graphical data given by interpolation or extrapolation; a
sufficient amount of parametric data is given, however, to allow that.
The basic information required for f&) is T , T , and T , as indi-
^"^ C U I
cated. At that point, either or both T and T may be different for
evacuation and sheltering. For example, T may be somewhat different
for evacuation and sheltering; T may be quite different. In (&) ,
image:
42
(T) The purpose of the indicated test is to compare ideal sheltering
conditions with evacuation based on the ratio of the DRF values shown
for either the WE or thyroid. Estimates of the evacuation (DRF)£v can
be made according to the relationships given in ($) depending on the
time parameters shown. Estimates of the WB (DRF) for ideal-shelter
5
timing conditions can be obtained from Fig. 15 or from the WB-dose
shelter curves given in the applicable Figs. 3 and 5 through 13 dis-
cussed above. (WB (DRF) values for ideal shelter timing can also
be obtained from Ref. 1.) Figure 16 gives thryoid (DRF) values for
s
ideal sheltering conditions as a function of the air change rate, L,
for the release cases considered. If the ratio given in Q4) is less
than unity, evacuation is recommended, as it would provide better pro-
tection than the best that could be provided by sheltering. When
6 >_ 1, (5) applies, in which case it may not be clear that evacuation
is the better emergency protective action from the standpoint of
reduced dosage and a further evaluation should be made with the aid of
the graphical data.
(jQ Approximations for the evacuation (DRF) values are given by
the relationships in Fig. lAb. They are essentially linear relationships,
which may be used in (4) (of course, the plots in Figs. 3 and 5 through
13 could also be used), and would certainly overestimate the (DRF) values
for T > (T +T +T ) - T . Figure 17 gives values of M for the linear
U K. 3. G X
relationships given in Fig. 14b, which can be used to approximate the
DRFs for evacuation; these values are slope-adjustment factors that
are functions of the exposure duration, T , determined from the calcula-
ted results for evacuation.
r&) As indicated in Fig. 14b, (6J allows for specific evaluations
of a recommended protective action with the aid of the graphical data
given in Figs. 3 and 5 through 13. Of course, it may be necessary to
expand the graphical data given by interpolation or extrapolation; a
sufficient amount of parametric data is given, however, to allow that.
The basic information required for f&) is T , T , and T , as indi-
^"^ C U I
cated. At that point, either or both T and T may be different for
evacuation and sheltering. For example, T may be somewhat different
for evacuation and sheltering; T may be quite different. In (&) ,
image:
 43
O.Srrr
a:
o
I I I I III I I I I MM Mil IMI I I II MM I II I
L (hours'1)
Fig. 15--WB DRF versus L,(ideal shelter timing)
image:
43
O.Srrr
a:
o
I I I I III I I I I MM Mil IMI I I II MM I II I
L (hours'1)
Fig. 15--WB DRF versus L,(ideal shelter timing)
image:
 44
0.5
0.4
0.3
CXL
a
0.2
0.1
o ri i i i I i i i i I i i i i I i i
:ase_A
2 3
L (hours'1)
0.5 -
I I I I
Vhri;
Fig. 16-Thyroid DRF versus L, (ideal shelter timing)
image:
44
0.5
0.4
0.3
CXL
a
0.2
0.1
o ri i i i I i i i i I i i i i I i i
:ase_A
2 3
L (hours'1)
0.5 -
I I I I
Vhri;
Fig. 16-Thyroid DRF versus L, (ideal shelter timing)
image:
 1.0
0.9
M 0.8
0.7
0.6
Thyroid
U1
Te (hours)
Fig. 17—M versus cloud exposure time
image:
1.0
0.9
M 0.8
0.7
0.6
Thyroid
U1
Te (hours)
Fig. 17—M versus cloud exposure time
image:
 46
the ratio is determined from the graphical data, and a course of pro-
tective action can be recommended (as indicated in Fig. 14b), depending
on the value of the ratio. When the ratio is unity (or near unity),
other factors may affect the recommended course of action; in Fig. 14b,
the sheltering option is indicated, since it is assumed to be preferred
from the standpoint of cost for equivalent protection.
The remainder of this section focuses on use of Fig. 14b for pro-
tective-action decision planning. Figures 14a and 14b (p. 39) attempt
to outline a procedural means for making protective action decisions
in the event of an accidental release of gaseous airborne radioactive
material from a nuclear power plant. In the event of an emergency,
however, Figs. 14a and 14b might seem difficult to implement at first
glance. Continuing familiarization with these figures, however, should
make them useful guides for emergency decision-making on the state
level. In that setting, modifications or simplifications of the pro-
cedural steps in Figs. 14a and 14b to better fit specific situations
or locations may be necessary for ease of implementation. For example,
the steps in Figs. 14a and 14b could be translated into some graphical
(e.g., monograms) or tabular representation to compose a decision-
making package together with the DRF plots.
Table 3 identifies the various parameters in Figs. 14a and 14b in
terms of 1) the responsibility for their supply, 2) assumptions that
can be made in the event that data are not available during an emergency
situation (default), and 3) the basic decision relationship for each
step in the process. The quantities marked with an asterisk are assumed
available for ready usage and can be developed as part of the emergency
planning programs. The other quantities would be indeterminate until
the actual onset of an initiating event. Use of the decision-guideline
methodology described above is illustrated below with numerical
examples and assumptions from a hypothetical event.
Examples
Assume the following initial estimates obtained from a nuclear-
power plant incident in which a gaseous fission-product release is
predicted and the population area lies x = 5 mi downwind:
image:
46
the ratio is determined from the graphical data, and a course of pro-
tective action can be recommended (as indicated in Fig. 14b), depending
on the value of the ratio. When the ratio is unity (or near unity),
other factors may affect the recommended course of action; in Fig. 14b,
the sheltering option is indicated, since it is assumed to be preferred
from the standpoint of cost for equivalent protection.
The remainder of this section focuses on use of Fig. 14b for pro-
tective-action decision planning. Figures 14a and 14b (p. 39) attempt
to outline a procedural means for making protective action decisions
in the event of an accidental release of gaseous airborne radioactive
material from a nuclear power plant. In the event of an emergency,
however, Figs. 14a and 14b might seem difficult to implement at first
glance. Continuing familiarization with these figures, however, should
make them useful guides for emergency decision-making on the state
level. In that setting, modifications or simplifications of the pro-
cedural steps in Figs. 14a and 14b to better fit specific situations
or locations may be necessary for ease of implementation. For example,
the steps in Figs. 14a and 14b could be translated into some graphical
(e.g., monograms) or tabular representation to compose a decision-
making package together with the DRF plots.
Table 3 identifies the various parameters in Figs. 14a and 14b in
terms of 1) the responsibility for their supply, 2) assumptions that
can be made in the event that data are not available during an emergency
situation (default), and 3) the basic decision relationship for each
step in the process. The quantities marked with an asterisk are assumed
available for ready usage and can be developed as part of the emergency
planning programs. The other quantities would be indeterminate until
the actual onset of an initiating event. Use of the decision-guideline
methodology described above is illustrated below with numerical
examples and assumptions from a hypothetical event.
Examples
Assume the following initial estimates obtained from a nuclear-
power plant incident in which a gaseous fission-product release is
predicted and the population area lies x = 5 mi downwind:
image:
 47
Table 3
EVACUATION/SHELTERING PARAMETERS
STEP
i)
©f
$
©f
3)
4)
L/
D
*
T
*
T
M
PARAMETERS
WB- DT
(PAG)WB, *(PAG)T
R- "
*
* 11
T T T = —
V TT' Ta ¥
e
—
/npp^
(DKh)WB s
(DRF)T
, F1g. 17
(DRF)WB s
(DRF)WB
ev
(DRF)T
(DRF)T
ev
RESPONSIBILITY
Facility
EPA-State
Facility
State
Facility
—
State
State
State
DEFAULT ASSUMPTIONS
—
TR Ihr
U = U1 + YU1
Te 1 hr
Assume decision
relationship true
Assume WB controls
—
DECISION RELATIONSHIP
D
PA5~
<W i <W
<Vev
i ( WV
<Vs
DWB DT
(PAG)WB " (PAG)T
DT (DRF)T (PAG)WB
DWB (DRF)WB [lPAG>T j
>, 0, controls
<, DWB controls
f(DRF)ev (DRF)ey
(DRF) ' (DRF)
L S WB S T
(DRF)ev
WB, T
(DRF)
S WB, T
COMMENTS
—
TD *TN + *TM
*
T,. = f^- , w plume width
v at x for
stability 8
Assumes (Tn)ey > (TO)S
Fnr f HRF^ ?PP Fin 1 ^
For (DRF)T , see Fig. 16
Calculate (DRF)ev
See (T) above for (DRF)s
Estimate DRF's from Figs. 3
Quantities developed during emergency planning
x = downwind position
^J = wind velocity, facility estimate
Y fraction for conservative windspeed estimate
u' wind velocity, local estimate
*
v - evacuation transport velocity
^Circled numbers in Fig. 14a.
TN notification time
Tu = mobilization time
M
D dose
PAG - protective action guide
WB = whole body
T thyroid
image:
47
Table 3
EVACUATION/SHELTERING PARAMETERS
STEP
i)
©f
$
©f
3)
4)
L/
D
*
T
*
T
M
PARAMETERS
WB- DT
(PAG)WB, *(PAG)T
R- "
*
* 11
T T T = —
V TT' Ta ¥
e
—
/npp^
(DKh)WB s
(DRF)T
, F1g. 17
(DRF)WB s
(DRF)WB
ev
(DRF)T
(DRF)T
ev
RESPONSIBILITY
Facility
EPA-State
Facility
State
Facility
—
State
State
State
DEFAULT ASSUMPTIONS
—
TR Ihr
U = U1 + YU1
Te 1 hr
Assume decision
relationship true
Assume WB controls
—
DECISION RELATIONSHIP
D
PA5~
<W i <W
<Vev
i ( WV
<Vs
DWB DT
(PAG)WB " (PAG)T
DT (DRF)T (PAG)WB
DWB (DRF)WB [lPAG>T j
>, 0, controls
<, DWB controls
f(DRF)ev (DRF)ey
(DRF) ' (DRF)
L S WB S T
(DRF)ev
WB, T
(DRF)
S WB, T
COMMENTS
—
TD *TN + *TM
*
T,. = f^- , w plume width
v at x for
stability 8
Assumes (Tn)ey > (TO)S
Fnr f HRF^ ?PP Fin 1 ^
For (DRF)T , see Fig. 16
Calculate (DRF)ev
See (T) above for (DRF)s
Estimate DRF's from Figs. 3
Quantities developed during emergency planning
x = downwind position
^J = wind velocity, facility estimate
Y fraction for conservative windspeed estimate
u' wind velocity, local estimate
*
v - evacuation transport velocity
^Circled numbers in Fig. 14a.
TN notification time
Tu = mobilization time
M
D dose
PAG - protective action guide
WB = whole body
T thyroid
image:
 48
Release time, T_ = 2 hr;
R
Windspeed, u = 5 mph;
Cloud exposure time, T = 1 hr;
Cloud arrival time, T = 1 hr;
3.
Projected WB dose, D = 10 rem;
Projected thyroid dose, D = 100 rem.
Assume also that the following protective action guides apply:
= 5 rem;
(PAG)T = 25 rem.
Then in (l) , both ratios for the WB and thyroid are greater than unity
(i.e., 2 and 4, respectively) and therefore f2j applies.
Next, assume that an estimate of the evacuation delay time made by
local authorities is T = 3 hr; that the atmospheric stability falls under
class-D conditions; and that the cloud has a half-width, W = 1.5 a , i.e.,
1.5 x 450 = 650 m at 5 mi (^8050 m) downwind. Then, if evacuation
could be effected laterally away from the cloud centerline axis (assuming,
x to be on the cloud centerline) , at an assumed average speed of 2 mph
(determined by the local authorities), an estimate of the transport
time for evacuation would be
T _ 650 (m) _
T 1610(m/mi) x 2(mi/hr)
In the above example, it is assumed that T = 0.25 hr; and that from
the reported windspeed above, the estimated cloud travel time from the
facility to the population area is T = x/u = 1 hr.
3,
For the above values, (TR+Ta) = 3 hr, (TD+TT) = 3.25 hr, and
(T +T +T ) = 4 hr; therefore, neither of the initial two time conditions
iv. 3. 6
are satisfied and neither the sheltering nor the evacuation ("do nothing")
option is recommended at this point. If, for example, the estimated
delay time for evacuation were (TD) = 4.5 hr and that for sheltering
were less than 4 hr, then sheltering would be recommended (for T =0).
image:
48
Release time, T_ = 2 hr;
R
Windspeed, u = 5 mph;
Cloud exposure time, T = 1 hr;
Cloud arrival time, T = 1 hr;
3.
Projected WB dose, D = 10 rem;
Projected thyroid dose, D = 100 rem.
Assume also that the following protective action guides apply:
= 5 rem;
(PAG)T = 25 rem.
Then in (l) , both ratios for the WB and thyroid are greater than unity
(i.e., 2 and 4, respectively) and therefore f2j applies.
Next, assume that an estimate of the evacuation delay time made by
local authorities is T = 3 hr; that the atmospheric stability falls under
class-D conditions; and that the cloud has a half-width, W = 1.5 a , i.e.,
1.5 x 450 = 650 m at 5 mi (^8050 m) downwind. Then, if evacuation
could be effected laterally away from the cloud centerline axis (assuming,
x to be on the cloud centerline) , at an assumed average speed of 2 mph
(determined by the local authorities), an estimate of the transport
time for evacuation would be
T _ 650 (m) _
T 1610(m/mi) x 2(mi/hr)
In the above example, it is assumed that T = 0.25 hr; and that from
the reported windspeed above, the estimated cloud travel time from the
facility to the population area is T = x/u = 1 hr.
3,
For the above values, (TR+Ta) = 3 hr, (TD+TT) = 3.25 hr, and
(T +T +T ) = 4 hr; therefore, neither of the initial two time conditions
iv. 3. 6
are satisfied and neither the sheltering nor the evacuation ("do nothing")
option is recommended at this point. If, for example, the estimated
delay time for evacuation were (TD) = 4.5 hr and that for sheltering
were less than 4 hr, then sheltering would be recommended (for T =0).
image:
 49
The next step is the B-test to decide which type of dose would be
more important. With the assumed values, g is given as
(DRF}
(DRF)
WB
The (DRF) values for ideal sheltering can be obtained as follows
from Figs. 6 and 7 (pp. 28-29) for the WB and thyroid, respectively
(DRF values for sheltering can also be obtained from Figs. 15 and 16,
pp. 42-43):
DRF
T
0.125
1.0
WB
SS
0.37
0.42
LS
0.078
0.133
0.025
0.16
Evaluating the relationship above, the corresponding 3-values can also
be tabularized:
Ll
0.125
1.0
SS
0.13
0.76
LS
0.62
2.4
The values for 3 above indicate that the thyroid exposure would be
more important for the LS shelter with a representative air change
rate of L = 1 hr~ ; the WB exposures would be more important for the
other sheltering conditions as indicated.
First, it is assumed in this example that the WB exposure is more
important and (4) applies. Again, from Fig. 6, the average DRF values
for the SS and LS are
image:
49
The next step is the B-test to decide which type of dose would be
more important. With the assumed values, g is given as
(DRF}
(DRF)
WB
The (DRF) values for ideal sheltering can be obtained as follows
from Figs. 6 and 7 (pp. 28-29) for the WB and thyroid, respectively
(DRF values for sheltering can also be obtained from Figs. 15 and 16,
pp. 42-43):
DRF
T
0.125
1.0
WB
SS
0.37
0.42
LS
0.078
0.133
0.025
0.16
Evaluating the relationship above, the corresponding 3-values can also
be tabularized:
Ll
0.125
1.0
SS
0.13
0.76
LS
0.62
2.4
The values for 3 above indicate that the thyroid exposure would be
more important for the LS shelter with a representative air change
rate of L = 1 hr~ ; the WB exposures would be more important for the
other sheltering conditions as indicated.
First, it is assumed in this example that the WB exposure is more
important and (4) applies. Again, from Fig. 6, the average DRF values
for the SS and LS are
image:
 50
ss
LS
DRF
0.37 )
0.42 )
0.078j
0.133)
* 0.4
= 0.1
Estimates of the evacuation (DRF) given by the second relationship in
ev
(since T =T +T ) are made and compared with the values given above.
1J K. a
That is,
(DRF)
TD - (VV
ev
= 3 - (2+1) + 0.25 x 0.87 = 0.22
Then, for the SS, the ratio given in (4) is 0.22/0.4 < 1; therefore,
evacuation would be recommended instead of sheltering. Since 0.22/0.1 > 1
for LS sheltering, additional graphical evaluation as indicated by {6j
applies only for low air-change rate conditions, since (as indicated
above) the thyroid exposure would be more important for L = 1 hr
Referring to Fig. 6 (p. 28), and assuming that TD » 3 hr for both
evacuation and sheltering in the LS, TT = 0.25 hr for evacuation, and
individuals are already in the LS (T^O), evacuation would not be
recommended, since the ratio in (&) is 0.22/0.073 > 1.
As indicated above, the thyroid could be more important for the LS
with a representative air change rate, L = 1 hr . Assuming the LS
conditions, the DRF = 0.16 for sheltering (Fig. 16, p. 43). Again,
estimates of the evacuation (DRF)ev indicated in Q) by the second
relationship (since TD=(TR+Ta)) can be made and comPared with the
sheltering value; i.e,,
(DRF)
ev
3 - (2+1) + 0.25 x 0.75 = 0.19
image:
50
ss
LS
DRF
0.37 )
0.42 )
0.078j
0.133)
* 0.4
= 0.1
Estimates of the evacuation (DRF) given by the second relationship in
ev
(since T =T +T ) are made and compared with the values given above.
1J K. a
That is,
(DRF)
TD - (VV
ev
= 3 - (2+1) + 0.25 x 0.87 = 0.22
Then, for the SS, the ratio given in (4) is 0.22/0.4 < 1; therefore,
evacuation would be recommended instead of sheltering. Since 0.22/0.1 > 1
for LS sheltering, additional graphical evaluation as indicated by {6j
applies only for low air-change rate conditions, since (as indicated
above) the thyroid exposure would be more important for L = 1 hr
Referring to Fig. 6 (p. 28), and assuming that TD » 3 hr for both
evacuation and sheltering in the LS, TT = 0.25 hr for evacuation, and
individuals are already in the LS (T^O), evacuation would not be
recommended, since the ratio in (&) is 0.22/0.073 > 1.
As indicated above, the thyroid could be more important for the LS
with a representative air change rate, L = 1 hr . Assuming the LS
conditions, the DRF = 0.16 for sheltering (Fig. 16, p. 43). Again,
estimates of the evacuation (DRF)ev indicated in Q) by the second
relationship (since TD=(TR+Ta)) can be made and comPared with the
sheltering value; i.e,,
(DRF)
ev
3 - (2+1) + 0.25 x 0.75 = 0.19
image:
 51
Since 0.19/0.16 > 1, additional graphical evaluation indicated in (6j
applies for the LS for representative air-chanp,e rate conditions (L=l).
If, for example, it were determined that LS sheltering access were to re-
quire T = 0.25 hr with the T = 3-hr delay time, then, referring to Fig. 7
(p. 29), evacuation would be recommended, since the ratio in f6) would
be 0.19/0.38 < 1. On the other hand, if instead of T = 0.25 hr
required for evacuation, it were estimated that T = 0.5 hr would be
required, sheltering may be recommended, since the ratio in (6) would
be close to unity and nothing would be gained from evacuation from the
standpoint of dose reduction. The same conclusions would, for example,
be reached for evacuation-time parameters, T = 0.25 hr and T = 3.2 hr.
Note that use of the procedure described in Fig. 14b (p. 39) is
subject to some inaccuracy owing to plotting computed values as well
as limitations of the model and the assumptions regarding numerical
input parameters. The issue of accuracy is, of course, more important
in making protective action recommendations when the margin of benefit
is close one way or the other.
image:
51
Since 0.19/0.16 > 1, additional graphical evaluation indicated in (6j
applies for the LS for representative air-chanp,e rate conditions (L=l).
If, for example, it were determined that LS sheltering access were to re-
quire T = 0.25 hr with the T = 3-hr delay time, then, referring to Fig. 7
(p. 29), evacuation would be recommended, since the ratio in f6) would
be 0.19/0.38 < 1. On the other hand, if instead of T = 0.25 hr
required for evacuation, it were estimated that T = 0.5 hr would be
required, sheltering may be recommended, since the ratio in (6) would
be close to unity and nothing would be gained from evacuation from the
standpoint of dose reduction. The same conclusions would, for example,
be reached for evacuation-time parameters, T = 0.25 hr and T = 3.2 hr.
Note that use of the procedure described in Fig. 14b (p. 39) is
subject to some inaccuracy owing to plotting computed values as well
as limitations of the model and the assumptions regarding numerical
input parameters. The issue of accuracy is, of course, more important
in making protective action recommendations when the margin of benefit
is close one way or the other.
image:
 52
IV. CONCLUSIONS AND RECOMMENDATIONS
Evaluation of evacuation and sheltering effectiveness as emergency
protective actions against a gaseous fission-product release is in this
study based on calculational models that are necessarily idealized and
assume the availability of the pertinent parameters and data for estima-
ting benefits derived from protective actions. Use of the results,
therefore, implies a certain amount of emergency preparation and planning
irrespective of the idealized model assumptions. Accordingly, the results
provide guidance by indicating how the pertinent fundamental parameters
affect the benefits expected from evacuation and sheltering protective
actions, and thus define their importance in the formulation of emergency
planning. Note, however, that it will be difficult to deal with all
parameters and unknowns for purposes of making timely decisions during
the course of an emergency. For any potential incident, therefore,
particular attention must be given beforehand to the identification,
organization, and quantization of as many values as possible of an
emergency plan.
Evacuation and sheltering are two emergency actions that can be
implemented that would provide varying margins of protection depending
on release characteristics, operational time constraints, and physical
protection characteristics. Both actions should be considered when pro-
jected doses (for either WB, thyroid, or both) exceed a target protective
action guide (PAG) level.
If evacuation can be effected prior to the predicted time of cloud
arrival, it should in general be the preferred protective action, since
exposure would then be avoided. Such a recommendation should not, how-
ever, be made without regard for the magnitude of the projected dose.
For example, if the projected doses are large and can be avoided by
evacuation, evacuation would be the preferred—if not, in some instances,
the mandatory—course of action. If, on the other hand, the projected
doses are small (but still exceed the PAG levels), sheltering may
suffice, even though evacuation would be 100-percent effective as far
as dose reduction is concerned.
image:
52
IV. CONCLUSIONS AND RECOMMENDATIONS
Evaluation of evacuation and sheltering effectiveness as emergency
protective actions against a gaseous fission-product release is in this
study based on calculational models that are necessarily idealized and
assume the availability of the pertinent parameters and data for estima-
ting benefits derived from protective actions. Use of the results,
therefore, implies a certain amount of emergency preparation and planning
irrespective of the idealized model assumptions. Accordingly, the results
provide guidance by indicating how the pertinent fundamental parameters
affect the benefits expected from evacuation and sheltering protective
actions, and thus define their importance in the formulation of emergency
planning. Note, however, that it will be difficult to deal with all
parameters and unknowns for purposes of making timely decisions during
the course of an emergency. For any potential incident, therefore,
particular attention must be given beforehand to the identification,
organization, and quantization of as many values as possible of an
emergency plan.
Evacuation and sheltering are two emergency actions that can be
implemented that would provide varying margins of protection depending
on release characteristics, operational time constraints, and physical
protection characteristics. Both actions should be considered when pro-
jected doses (for either WB, thyroid, or both) exceed a target protective
action guide (PAG) level.
If evacuation can be effected prior to the predicted time of cloud
arrival, it should in general be the preferred protective action, since
exposure would then be avoided. Such a recommendation should not, how-
ever, be made without regard for the magnitude of the projected dose.
For example, if the projected doses are large and can be avoided by
evacuation, evacuation would be the preferred—if not, in some instances,
the mandatory—course of action. If, on the other hand, the projected
doses are small (but still exceed the PAG levels), sheltering may
suffice, even though evacuation would be 100-percent effective as far
as dose reduction is concerned.
image:
 53
If evacuation or sheltering cannot be effected until after the cloud
has passed, individuals in the open would have contracted most of their
dose (assuming they do not linger in the open ground-contaminated area
more than a few hours after cloud passage) and any additional actions
would be dictated by the urgency of avoiding additional exposure from
ground fallout or ingestion; e.g., control measures that may very well
include subsequent evacuation. However, the actual delay time, Tn, may
be less for sheltering than for evacuation, in which case sheltering
could provide some degree of protection depending on the access time
required during exposure to an airborne cloud and fallout source. As
defined in this study, the delay time for evacuation, T , is consistent
with that defined by EPA, which includes the mobilization time estimated
to be from 0.2 to 2 hr for evacuation [8]. For sheltering, the mobiliza-
tion time and, hence, the corresponding delay time could be significantly
less, resulting in a smaller time delay for shelter access. Summarizing,
emergency planning guidance when evacuating can either be 100-percent
effective (accomplished prior to cloud arrival) or virtually ineffective
(could not be effected until after cloud passage):
1. If the projected dose exceeds the PAG by more than a few-fold,
and
a. timely evacuation is feasible, then evacuation is
recommended; or
b. timely evacuation is not feasible (i.e., the time avail-
able before cloud arrival is short compared with the
required mobilization, warning, and transit time for
evacuation), then sheltering is recommended.
2. If the projected dose does not exceed the PAG by more than a
few-fold, then sheltering will probably be adequate and econ-
omically preferable.
Insofar as sheltering doses limit the degree of protection that can
be offered by structures normally available to the public, but still can
offer significant protection advantages, a condition—dictated by the
time and logistic considerations—exists for which it is necessary to
examine both evacuation and sheltering tradeoff options. For this con-
dition, no all-encompassing statements of rule can be made if the optimum
image:
53
If evacuation or sheltering cannot be effected until after the cloud
has passed, individuals in the open would have contracted most of their
dose (assuming they do not linger in the open ground-contaminated area
more than a few hours after cloud passage) and any additional actions
would be dictated by the urgency of avoiding additional exposure from
ground fallout or ingestion; e.g., control measures that may very well
include subsequent evacuation. However, the actual delay time, Tn, may
be less for sheltering than for evacuation, in which case sheltering
could provide some degree of protection depending on the access time
required during exposure to an airborne cloud and fallout source. As
defined in this study, the delay time for evacuation, T , is consistent
with that defined by EPA, which includes the mobilization time estimated
to be from 0.2 to 2 hr for evacuation [8]. For sheltering, the mobiliza-
tion time and, hence, the corresponding delay time could be significantly
less, resulting in a smaller time delay for shelter access. Summarizing,
emergency planning guidance when evacuating can either be 100-percent
effective (accomplished prior to cloud arrival) or virtually ineffective
(could not be effected until after cloud passage):
1. If the projected dose exceeds the PAG by more than a few-fold,
and
a. timely evacuation is feasible, then evacuation is
recommended; or
b. timely evacuation is not feasible (i.e., the time avail-
able before cloud arrival is short compared with the
required mobilization, warning, and transit time for
evacuation), then sheltering is recommended.
2. If the projected dose does not exceed the PAG by more than a
few-fold, then sheltering will probably be adequate and econ-
omically preferable.
Insofar as sheltering doses limit the degree of protection that can
be offered by structures normally available to the public, but still can
offer significant protection advantages, a condition—dictated by the
time and logistic considerations—exists for which it is necessary to
examine both evacuation and sheltering tradeoff options. For this con-
dition, no all-encompassing statements of rule can be made if the optimum
image:
 54
protective action is to be recommended, even for the idealized model
results developed in this study. This situation is where protective
action either may not actually get under way or be completed prior to
the predicted arrival time of the airborne cloud. The principal con-
siderations in making tradeoff evaluations for recommending the appro-
priate protective action are WB and thyroid projected doses and PAG
values; source release, duration, and cloud arrival times; estimated
delay and implementation times for protective actions; and the nature
of available sheltering structures and modes of evacuation.
For gaseous fission-product releases, both the WB and thyroid pro-
jected doses must be considered because one will be more important in
the selection of the appropriate protective action depending on dose-
to-PAG-level ratios and on modes of available sheltering. For example,
in instances of substantial iodine release, where the thyroid dose is
controlling, the efficiency of sheltering becomes largely dependent on
ventilation control, particularly for increasing exposure durations;
as a corollary, if the projected external WB dose is not relatively
important, sheltering may be the most effective means of reducing doses.
Sheltering becomes less attractive compared with evacuation for
increasing durations of airborne exposure for WB and thyroid dose con-
siderations—particularly. SS sheltering. For example, for exposure
durations of around 3 hr or more, evacuation would be largely recom-
mended in lieu of SS sheltering. LS sheltering, however, may still be
somewhat competitive with evacuation as an emergency protective action
for cloud exposure periods between 3 and 6 hr. Even at 6 hr, however,
the LS shelter with a low ventilation rate may be only marginally
competitive for certain situations of predicted long evacuation transit
times away from the radioactive source region.
When analyzing sheltering and evacuation protective actions, the
significance of air change rate in shelters is greater for thyroid than
for WB doses, increases with cloud exposure duration, and is greater
for LS shelters than SS shelters. Accordingly, substantial advantages
for sheltering can be effected by deliberately controlling air change
rates primarily for LS or for reducing projected inhalation doses.
image:
54
protective action is to be recommended, even for the idealized model
results developed in this study. This situation is where protective
action either may not actually get under way or be completed prior to
the predicted arrival time of the airborne cloud. The principal con-
siderations in making tradeoff evaluations for recommending the appro-
priate protective action are WB and thyroid projected doses and PAG
values; source release, duration, and cloud arrival times; estimated
delay and implementation times for protective actions; and the nature
of available sheltering structures and modes of evacuation.
For gaseous fission-product releases, both the WB and thyroid pro-
jected doses must be considered because one will be more important in
the selection of the appropriate protective action depending on dose-
to-PAG-level ratios and on modes of available sheltering. For example,
in instances of substantial iodine release, where the thyroid dose is
controlling, the efficiency of sheltering becomes largely dependent on
ventilation control, particularly for increasing exposure durations;
as a corollary, if the projected external WB dose is not relatively
important, sheltering may be the most effective means of reducing doses.
Sheltering becomes less attractive compared with evacuation for
increasing durations of airborne exposure for WB and thyroid dose con-
siderations—particularly. SS sheltering. For example, for exposure
durations of around 3 hr or more, evacuation would be largely recom-
mended in lieu of SS sheltering. LS sheltering, however, may still be
somewhat competitive with evacuation as an emergency protective action
for cloud exposure periods between 3 and 6 hr. Even at 6 hr, however,
the LS shelter with a low ventilation rate may be only marginally
competitive for certain situations of predicted long evacuation transit
times away from the radioactive source region.
When analyzing sheltering and evacuation protective actions, the
significance of air change rate in shelters is greater for thyroid than
for WB doses, increases with cloud exposure duration, and is greater
for LS shelters than SS shelters. Accordingly, substantial advantages
for sheltering can be effected by deliberately controlling air change
rates primarily for LS or for reducing projected inhalation doses.
image:
 55
Expedient filtration can be employed to improve the effectiveness
of the shelter structure in reducing WB dose by stuffing cracks and
openings with cloth or paper materials, which would reduce radioactive
material ingress and/or the natural ventilation rate. Similarly,
another means of respiratory protection is to cover the nose and mouth
area with such common items as towels, handkerchiefs, or toilet paper:
e.g., a crumpled handkerchief (or one with eight or more folded layers),
a towel of three or more folded layers, or toilet paper of three or
more folded layers can reduce inhaled radioactive material (particulate
iodine in this study) by a factor of about 10 [14]. The reduction of
the WB dose in a SS, however, is not appreciable—about 2.5 percent for
low ventilation rates and about 15 percent for representative ventila-
tion rates. The reduction in WB dose in a LS would be more appreciable-
about 13 percent for low ventilation rates and about 70 percent for
representative ventilation rates. For thyroid dose, however, the use
of such expedient-filtration means could reduce doses by a factor of
about 10 [14].
Conditions exist under which the optimal course of protective
action consists of some split between sheltering and evacuation. For
example, situations are examined in Ref. 1 for a combination of
sheltering followed by evacuation as a protective action for the case
where 1) the cloud is projected to arrive too soon to permit effective
evacuation and 2) there are longer-than-expected periods of exposure.
Conditions of shelter-exit time and subsequent evacuation-transit time
can be identified for given exposure periods where sheltering followed
by evacuation is advantageous as compared with sheltering alone.
Another evacuation/sheltering protective action combination may
be effective for cases where it is desirable to evacuate people in a
high-dose area, but shelter those in areas where the sheltering DRF
will reduce the dose to within the PAG, and thus reduce the possibility
of overloading the evacuation routes (see sketch below):
image:
55
Expedient filtration can be employed to improve the effectiveness
of the shelter structure in reducing WB dose by stuffing cracks and
openings with cloth or paper materials, which would reduce radioactive
material ingress and/or the natural ventilation rate. Similarly,
another means of respiratory protection is to cover the nose and mouth
area with such common items as towels, handkerchiefs, or toilet paper:
e.g., a crumpled handkerchief (or one with eight or more folded layers),
a towel of three or more folded layers, or toilet paper of three or
more folded layers can reduce inhaled radioactive material (particulate
iodine in this study) by a factor of about 10 [14]. The reduction of
the WB dose in a SS, however, is not appreciable—about 2.5 percent for
low ventilation rates and about 15 percent for representative ventila-
tion rates. The reduction in WB dose in a LS would be more appreciable-
about 13 percent for low ventilation rates and about 70 percent for
representative ventilation rates. For thyroid dose, however, the use
of such expedient-filtration means could reduce doses by a factor of
about 10 [14].
Conditions exist under which the optimal course of protective
action consists of some split between sheltering and evacuation. For
example, situations are examined in Ref. 1 for a combination of
sheltering followed by evacuation as a protective action for the case
where 1) the cloud is projected to arrive too soon to permit effective
evacuation and 2) there are longer-than-expected periods of exposure.
Conditions of shelter-exit time and subsequent evacuation-transit time
can be identified for given exposure periods where sheltering followed
by evacuation is advantageous as compared with sheltering alone.
Another evacuation/sheltering protective action combination may
be effective for cases where it is desirable to evacuate people in a
high-dose area, but shelter those in areas where the sheltering DRF
will reduce the dose to within the PAG, and thus reduce the possibility
of overloading the evacuation routes (see sketch below):
image:
 56
source
Note, however, that for the above consideration the high-dose area would
normally be closest to the origin of release for ground-release assumptions.
Accordingly, time constraints could limit the number of individuals who
could be evacuated effectively.
Finally, there will be cases where LS sheltering gives adequate
protection and is cheaper and quicker than evacuation, but where it is
desirable to evacuate individuals for whom only SS shelter is available.
This sort of shelter-availability split may be appropriate because timely
evacuation may be more difficult in areas where LS are more prevalent
than SS.
In summary, for emergency planning purposes, evacuation potentially
provides the greatest margin of protection and should be the primary
means of protective emergency action in the event of a gaseous fission-
product release. On the other hand, sheltering may be the recommended
protective action for two reasons: 1) because it is probably less expen-
sive and less disruptive of normal activity than evacuation, sheltering
may be appropriate under conditions of marginal danger; 2) it may be more
expedient than evacuation. Since the majority of people are already inside
some sort of shelter most of the time, mobilization time would be shorter,
and the information that must be transmitted to them may be simpler than
a set of evacuation instructions. Sheltering, therefore, may be appro-
priate if the time before cloud arrival is short, even though subsequent
evacuation may be desirable.
Additional work is needed to develop complete guideline information
for evacuation and sheltering recommendation procedures. For sheltering
both experimental and analytical areas are identified that would lead
to the more accurate assessment of protection provided by available
image:
56
source
Note, however, that for the above consideration the high-dose area would
normally be closest to the origin of release for ground-release assumptions.
Accordingly, time constraints could limit the number of individuals who
could be evacuated effectively.
Finally, there will be cases where LS sheltering gives adequate
protection and is cheaper and quicker than evacuation, but where it is
desirable to evacuate individuals for whom only SS shelter is available.
This sort of shelter-availability split may be appropriate because timely
evacuation may be more difficult in areas where LS are more prevalent
than SS.
In summary, for emergency planning purposes, evacuation potentially
provides the greatest margin of protection and should be the primary
means of protective emergency action in the event of a gaseous fission-
product release. On the other hand, sheltering may be the recommended
protective action for two reasons: 1) because it is probably less expen-
sive and less disruptive of normal activity than evacuation, sheltering
may be appropriate under conditions of marginal danger; 2) it may be more
expedient than evacuation. Since the majority of people are already inside
some sort of shelter most of the time, mobilization time would be shorter,
and the information that must be transmitted to them may be simpler than
a set of evacuation instructions. Sheltering, therefore, may be appro-
priate if the time before cloud arrival is short, even though subsequent
evacuation may be desirable.
Additional work is needed to develop complete guideline information
for evacuation and sheltering recommendation procedures. For sheltering
both experimental and analytical areas are identified that would lead
to the more accurate assessment of protection provided by available
image:
 57
structures [1]. For evacuation, there is a need for 1) model improve-
ment to simulate more accurately the protection expected, and 2) obtain-
ing and using more realistic data.
Model improvement could be made for the radioactive source com-
ponents by including parent-daughter decay along with specific attenua-
tion and consideration of finite source geometries for each radionuclide.
The means of simulating evacuation during periods of exposure to radio-
active sources should be expanded to deal more accurately with finite
source geometries and evacuation routes and modes. Additional attention
should also be given to expanding the evacuation model to address source
releases that include radioactive particulate material. For useful
planning, a guideline procedure for selecting the appropriate emergency
protective action must be able to accommodate realistic data so as to
focus on critical logistic areas. Accordingly, it would be useful to
obtain some specific information—e.g., estimated evacuation delay and
transport times, cloud arrival time, and projected doses (from current
computer predictions)—to apply to the guideline selection procedure
and also to point out where additional model improvement ought to be
made.
image:
57
structures [1]. For evacuation, there is a need for 1) model improve-
ment to simulate more accurately the protection expected, and 2) obtain-
ing and using more realistic data.
Model improvement could be made for the radioactive source com-
ponents by including parent-daughter decay along with specific attenua-
tion and consideration of finite source geometries for each radionuclide.
The means of simulating evacuation during periods of exposure to radio-
active sources should be expanded to deal more accurately with finite
source geometries and evacuation routes and modes. Additional attention
should also be given to expanding the evacuation model to address source
releases that include radioactive particulate material. For useful
planning, a guideline procedure for selecting the appropriate emergency
protective action must be able to accommodate realistic data so as to
focus on critical logistic areas. Accordingly, it would be useful to
obtain some specific information—e.g., estimated evacuation delay and
transport times, cloud arrival time, and projected doses (from current
computer predictions)—to apply to the guideline selection procedure
and also to point out where additional model improvement ought to be
made.
image:
 58
Appendix A
LIST OF TERMS
SS = small structure
LS = large structure
TD = time from incident to start of release from containment
K
T = time required for cloud to travel to point of consideration
3.
T = cloud passage time (equal to or less than the duration
of release)
T = delay time from initiating event to beginning of protective
action
T = time spent in evacuating from contaminated area
T = time from beginning to end of source release (T equals T
unless a wind shift shortens T )
e
F = outside ground fallout deposition
O
K = WB-dose conversion factor for external cloud gamma exposure
K = WB-dose conversion factor for exposure
K,. = thyroid-dose conversion factor for inhalation exposure
K, = WB-dose conversion factor for external ground-fallout gamma
exposure
T = time required to leave a shelter area after cloud passage to
avoid dose from fallout
F = cloud-source dose component
F' = fallout-source dose component
F = dose component for airborne cloud outside vehicle
F = dose component for airborne source inside vehicle
F' and F' = dose components for ground fallout source outside the
vehicle
image:
58
Appendix A
LIST OF TERMS
SS = small structure
LS = large structure
TD = time from incident to start of release from containment
K
T = time required for cloud to travel to point of consideration
3.
T = cloud passage time (equal to or less than the duration
of release)
T = delay time from initiating event to beginning of protective
action
T = time spent in evacuating from contaminated area
T = time from beginning to end of source release (T equals T
unless a wind shift shortens T )
e
F = outside ground fallout deposition
O
K = WB-dose conversion factor for external cloud gamma exposure
K = WB-dose conversion factor for exposure
K,. = thyroid-dose conversion factor for inhalation exposure
K, = WB-dose conversion factor for external ground-fallout gamma
exposure
T = time required to leave a shelter area after cloud passage to
avoid dose from fallout
F = cloud-source dose component
F' = fallout-source dose component
F = dose component for airborne cloud outside vehicle
F = dose component for airborne source inside vehicle
F' and F' = dose components for ground fallout source outside the
vehicle
image:
 59
T., T , and T = dummy time variables for the F-functions
e = ingress fraction
B = breathing rate
G = finite cloud-gamma source-correction factor for vehicle enclosure
A = gamma attenuation factor
L = ventilation rate
image:
59
T., T , and T = dummy time variables for the F-functions
e = ingress fraction
B = breathing rate
G = finite cloud-gamma source-correction factor for vehicle enclosure
A = gamma attenuation factor
L = ventilation rate
image:
 60
Appendix B
DOSE REDUCTION FACTOR F-FUNCTIONS
The F-functlons for cloud dose components (F) and fallout dose
components (Ff) are developed below. The F-functions, with the excep-
tion of the Fj-function (as noted below), are developed in terms of
general time arguments T.,, T_, and T_, which correspond to the times
shown in the sketch:
(cloud and fallout source)
(fallout source)
cloud arrival time
F-FUNCTIONS
The F ..-function is the dose-time function for cloud source expo-
sures commencing after an interval, T^ after cloud arrival and extend-
ing over a period, TZ. Accordingly, for a unit outside concentration
is given as
(X0 - 1),
T.+T,
"/
-Xt , e
e dt - —
image:
60
Appendix B
DOSE REDUCTION FACTOR F-FUNCTIONS
The F-functlons for cloud dose components (F) and fallout dose
components (Ff) are developed below. The F-functions, with the excep-
tion of the Fj-function (as noted below), are developed in terms of
general time arguments T.,, T_, and T_, which correspond to the times
shown in the sketch:
(cloud and fallout source)
(fallout source)
cloud arrival time
F-FUNCTIONS
The F ..-function is the dose-time function for cloud source expo-
sures commencing after an interval, T^ after cloud arrival and extend-
ing over a period, TZ. Accordingly, for a unit outside concentration
is given as
(X0 - 1),
T.+T,
"/
-Xt , e
e dt - —
image:
 61
The F.-function for cloud exposure is based on the concentration
of airborne radioactive material inside the evacuation vehicle. The
rate of change of the concentration in the vehicle for a unit outside
concentration (x " 1) is
Kt
Choosing e as the integrating factor and rewriting as the total differ-
ential,
^|eKtC(t)] - L
where K = L + X. Integrating the above, for C(0) = 0,
eKtC(t) - (eLt-l) ,
which yields the concentration in the vehicle given as
C(t) -
Assuming the vehicle starts to move after a period TI after cloud arriv
al and terminating after a period T_ after cloud passage, the dose-time
function, F?, is given as
T 1
- XT /• 2 f '•
F(T1,T2,T3) - e ! J C(t) dt + C(T2) J
-Kt ..
e dt
-XT,
_VT \ / —IT —VT
2 2-<
image:
61
The F.-function for cloud exposure is based on the concentration
of airborne radioactive material inside the evacuation vehicle. The
rate of change of the concentration in the vehicle for a unit outside
concentration (x " 1) is
Kt
Choosing e as the integrating factor and rewriting as the total differ-
ential,
^|eKtC(t)] - L
where K = L + X. Integrating the above, for C(0) = 0,
eKtC(t) - (eLt-l) ,
which yields the concentration in the vehicle given as
C(t) -
Assuming the vehicle starts to move after a period TI after cloud arriv
al and terminating after a period T_ after cloud passage, the dose-time
function, F?, is given as
T 1
- XT /• 2 f '•
F(T1,T2,T3) - e ! J C(t) dt + C(T2) J
-Kt ..
e dt
-XT,
_VT \ / —IT —VT
2 2-<
image:
 62
F'-FUNCTIONS
The Fj-function is the dose-time function for fallout source expo-
sures in an evacuation vehicle. The rate of change of the ground fallout
deposition for a unit outside concentration and deposition velocity
(XQVg - 1) is
dF (t)
Choosing e as the integrating factor and rewriting as the total differ-
ential.
Then, integrating for F (0) = 0,
o
• Fg(t) . t
and
F (t) - t e'U .
O
Assuming the vehicle starts to move after a period T.. after cloud ar-
rival and terminating after a period T» after cloud passage, the dose
time function, F|, is given as
image:
62
F'-FUNCTIONS
The Fj-function is the dose-time function for fallout source expo-
sures in an evacuation vehicle. The rate of change of the ground fallout
deposition for a unit outside concentration and deposition velocity
(XQVg - 1) is
dF (t)
Choosing e as the integrating factor and rewriting as the total differ-
ential.
Then, integrating for F (0) = 0,
o
• Fg(t) . t
and
F (t) - t e'U .
O
Assuming the vehicle starts to move after a period T.. after cloud ar-
rival and terminating after a period T» after cloud passage, the dose
time function, F|, is given as
image:
 63
1^* *• rt
f- _
I F (t) dt + F (TT+T.) / e "" dt
Jr 8 g 1 2 '
1
1 T -XT1 -j
~T PT1+1) e (^TjL+XTj) e
A L.
(T.+T) / -XT,\ -X(T +T
-e 3 e L
)1
J
F' is the dose-time function applicable to fallout source exposures
in the evacuation vehicle for periods that commence and end after cloud
passage. The time-argument arrangement given in the sketch above (p. 59)
does not apply specifically to the formulation of F^ here. Accordingly,
the F'-function is given as
-XT2 r2 -\t
Fj(TrT2,T3) - FgO^) e J e dt
-XT -XT / -XT
e 1 • e 2I [l-e
Tl
image:
63
1^* *• rt
f- _
I F (t) dt + F (TT+T.) / e "" dt
Jr 8 g 1 2 '
1
1 T -XT1 -j
~T PT1+1) e (^TjL+XTj) e
A L.
(T.+T) / -XT,\ -X(T +T
-e 3 e L
)1
J
F' is the dose-time function applicable to fallout source exposures
in the evacuation vehicle for periods that commence and end after cloud
passage. The time-argument arrangement given in the sketch above (p. 59)
does not apply specifically to the formulation of F^ here. Accordingly,
the F'-function is given as
-XT2 r2 -\t
Fj(TrT2,T3) - FgO^) e J e dt
-XT -XT / -XT
e 1 • e 2I [l-e
Tl
image:
 64
REFERENCES
1. Anno, G.H., and M.A. Dore, The Effectiveness of Sheltering as a
Protective Action Against Nuclear Accidents Involving Gaseous
Releases, EPA Report 520/1-78-001A, U.S. Environmental Protection
Agency, April 1978.
2. Reactor Safety Study, Appendix VI: Calculation of Reactor Accident
Consequences, WASH-1400 (Draft), U.S. Atomic Energy Commission,
August 1974.
3. Bell, M. J., ORIGEN—The ORNL Isotope Generation and Depletion
Code, ONRL-4628, May 1973.
4. Nucleonics, Data Sheets Nos. 1-30, March 1955-February 1959.
5. The Potential Radiological Implications of Nuclear Facilities in
the Upper Mississippi River Basin in the Year 2000, WASH-1209,
U.S. Atomic Energy Commission, January 1973.
6. Radiological Health Handbook, PB-1211784R, U.S. Department of
Health, Education and Welfare, Public Health Service, September
1960 (Rev. Ed.).
7. Ramsey, W., and P. R. Reed, Land Use and Nuclear Power Plants:
Case Studies of Siting Problems, WASH-1319 (no date).
8. Manual of Protective Action Guides and Protective Actions for
Nuclear Incidents, U.S. Environmental Protection Agency, Office
of Radiation Programs, Environmental Analysis Division,
September 1975.
9. Dickerson, M. H., and R. C. Orphan, Atmospheric Release Advisory
Capability (ABAC): Development and Plans for Implementation,
UCRL-51839, June 1975.
10. Burson, Z. G., and A. E. Profio, Structure Shielding from Cloud
and Fallout Gamma-Ray Sources for Assessing the Consequences
of Reactor Accidents (Draft), E.G.&G., Las Vegas, Nevada,
March 1975.
11. Burson, Z. G., Health Physics, 26, January 1974, pp. 41-44.
12. Petersen, G. A., and R. H. Sabersky, J. of the Air Poll. Contr.
Assoc., 25, October 1975, pp. 1028-1032.
13. Megaw, W. J., Intl. J. Air Wat. Poll., 6, 1962, pp. 121-128.
14. Guyton, H. G., et al., A,M.A. Arch. Indus, Health, 20, August
1959, pp. 91-95.
image:
64
REFERENCES
1. Anno, G.H., and M.A. Dore, The Effectiveness of Sheltering as a
Protective Action Against Nuclear Accidents Involving Gaseous
Releases, EPA Report 520/1-78-001A, U.S. Environmental Protection
Agency, April 1978.
2. Reactor Safety Study, Appendix VI: Calculation of Reactor Accident
Consequences, WASH-1400 (Draft), U.S. Atomic Energy Commission,
August 1974.
3. Bell, M. J., ORIGEN—The ORNL Isotope Generation and Depletion
Code, ONRL-4628, May 1973.
4. Nucleonics, Data Sheets Nos. 1-30, March 1955-February 1959.
5. The Potential Radiological Implications of Nuclear Facilities in
the Upper Mississippi River Basin in the Year 2000, WASH-1209,
U.S. Atomic Energy Commission, January 1973.
6. Radiological Health Handbook, PB-1211784R, U.S. Department of
Health, Education and Welfare, Public Health Service, September
1960 (Rev. Ed.).
7. Ramsey, W., and P. R. Reed, Land Use and Nuclear Power Plants:
Case Studies of Siting Problems, WASH-1319 (no date).
8. Manual of Protective Action Guides and Protective Actions for
Nuclear Incidents, U.S. Environmental Protection Agency, Office
of Radiation Programs, Environmental Analysis Division,
September 1975.
9. Dickerson, M. H., and R. C. Orphan, Atmospheric Release Advisory
Capability (ABAC): Development and Plans for Implementation,
UCRL-51839, June 1975.
10. Burson, Z. G., and A. E. Profio, Structure Shielding from Cloud
and Fallout Gamma-Ray Sources for Assessing the Consequences
of Reactor Accidents (Draft), E.G.&G., Las Vegas, Nevada,
March 1975.
11. Burson, Z. G., Health Physics, 26, January 1974, pp. 41-44.
12. Petersen, G. A., and R. H. Sabersky, J. of the Air Poll. Contr.
Assoc., 25, October 1975, pp. 1028-1032.
13. Megaw, W. J., Intl. J. Air Wat. Poll., 6, 1962, pp. 121-128.
14. Guyton, H. G., et al., A,M.A. Arch. Indus, Health, 20, August
1959, pp. 91-95.
image: